Article

Analysis and Mitigation of Subsynchronous Resonance in a Korean Power Network with the First TCSC Installation

1
Department of Electrical Engineering, Changwon National University, Changwon 51140, Korea
2
Korea Electric Power Research Institute, Seoul 34056, Korea
*
Author to whom correspondence should be addressed.
Energies 2019, 12(15), 2847; https://doi.org/10.3390/en12152847
Submission received: 19 June 2019 / Revised: 18 July 2019 / Accepted: 22 July 2019 / Published: 24 July 2019
(This article belongs to the Special Issue HVDC/FACTS for Grid Services in Electric Power Systems)

Abstract

:
This paper presents a detailed analysis results of the effect of a thyristor-controlled series capacitor (TCSC) on subsynchronous resonance (SSR), which was first applied to a Korean power system. First, the TCSC parameters were calculated, the structure of TCSC with synchronous voltage reversal (SVR) controller was presented, and the torsional characteristics of Hanul nuclear power generator rotor were studied to investigate the natural frequency and mode shape. The test signal method was used to determine the electrical damping in the frequency range of SSR operation through an electromagnetic transient analysis program in various system configurations. The SSR phenomenon was analyzed by comparing the electrical and mechanical damping of a conventional fixed series capacitor (FSC), and the case of a TCSC installed, and the effectiveness of the TCSC without any risk of SSR was demonstrated. As a result, when installing FSC, SSR occurred under sensitive operating conditions, but SSR was prevented in the case of TCSC compensation with SVR. The results obtained in this study can be effectively applied to the installation of TCSC in real power systems.

1. Introduction

Nowadays, electric power transmission lines are under the stress of reaching the thermal limit due to the increase of the transmission power. A flexible alternating current transmission system (FACTS) is well known as an effective solution to improve the power transfer capability. One of the FACTS devices, the thyristor controlled series capacitor (TCSC) not only improves power transfer capability but also helps mitigate the subsynchronous resonance (SSR) problem [1]. In 1971, the first SSR accident occurred at the Mohave generator in Arizona, where the generator shaft caused a large vibration and led to shaft fatigue [2]. Since that problem, the mitigation of the SSR effect into power system become an important issue.
A number of studies have been conducted so far on SSR mitigation using TCSC [3,4,5,6,7], the authors in Ref. [8] introduced that TCSC is attractive to SSR mitigation. However, the benefits of TCSC for SSR mitigation depend heavily on TCSC control methods and power system configurations, and may also affect the SSR mitigation characteristics when the grid has significant changes. The influence of control methodology on SSR was also introduced in [9]. The first IEEE benchmark model had three control methods, consisting of constant impedance, constant current and constant power control. This indicates that a TCSC device under constant impedance control can stimulate SSR vibrations. The paper also proposed a solution called synchronous voltage reversal (SVR) control. However, under the SVR control, the TCSC impedance characteristic has a transition frequency band of electrical frequency, and it turns into a negative damping band in the mechanical frequency range and poses a risk of the SSR problem [10,11]. In Ref. [12], the authors analyzed the SSR induced by TCSC through a real-time digital simulator (RTDS) in a China power system, and showed that the TCSC system accessed without SSR damping could have the SSR problem. The Korea Electric Power Corporation (KEPCO) plans to install TCSC for the first time in a Korean power system by taking advantage of TCSC [13,14]. However, installing TCSC on an actual power system could threaten system stability, including SSR issues. Also, many nuclear and thermal power plants were installed in the Korean grid near the TCSC facility, so detailed analysis of the SSR is needed before installing the TCSC in the actual grid.
In this paper, the SSR behaviors of the real power network with the TCSC compensations were analyzed and compared with a fixed series capacitor (FSC) under various system configurations. As the first step of the study, the configuration of a 345 kV power network with the TCSCs was presented in a PSCAD/EMTDC (power systems computer aided design/electromagnetic transients in DC) simulation model which was simplified based on the power system presented in PSS/E (power system simulator for engineering). All the 345 kV transmission lines were represented by the ‘pi’ equivalent model. The system with a radial connection as seen from a generator to a compensated line has been identified as the most vulnerable due to the SSR [15,16]. The units #3 and #4 of the Hanul nuclear power plant were located at the Hanul station, which can be radial with the compensated transmission line. Therefore, the units #3 and #4 of Hanul nuclear power plant were selected for this study, they were presented by a detailed generator model while all other generators were represented by a voltage source. A TCSC model with the SVR control method was implemented to vary the TCSC capacitance proportional to the compensated line from 50% to 70%, which was required by the KEPCO. The modal analysis method was applied to investigate the torsional characteristics of the rotor of the units #3 and #4. Mechanical damping constants corresponding to each natural frequency were also calculated. For the SSR study, frequency scanning methods were applied. A comparison of different frequency scanning methods, including the simplified analytical, two-axis analytical, and test signal methods was performed in [2]. In this study, the test signal method was selected, which was implemented in the PSCAD/EMTDC program as a time-domain digital simulation. The PSCAD/EMTDC simulation can build a detailed generator and complex load model for a real power network, which is very important for the accuracy level of results. The test signal method was used to inject a multi-sine signal with various frequencies in a range of the SSR behavior into the generator speed, the response of electrical torque delivered from the generator was recorded, the fast Fourier transform (FFT) analysis was used to calculate the electrical damping corresponding to the subsynchronous frequency of the SSR behavior. Finally, the contingencies under different operational conditions in the 345 kV power network, including normal and sensitive conditions were defined to analyze the SSR behavior. Under severe conditions such as the loss of some transmission lines, it appears almost radial when looking at ShinYoungju-Hanul transmission line from the units #3 and #4. These conditions are unlikely to occur; however, they were defined to highlight any potential issues of the SSR in the real power network. The conventional FSC compensation was also implemented equal to the compensation levels of the TCSC to compare the SSR mitigation efficiency. In each simulation case, the responses of electrical damping at each natural oscillation frequency were used to calculate the net damping of mechanical and electrical damping.
As a result, under normal operation, both FSC and TCSC compensation did not pose a risk to SSR. However, in sensitive cases, the electrical damping clearly showed the SSR in the system with the FSC compensation. In the case of the TCSC with the SVR control at the same compensation level, there was no SSR in the power network. These results are necessary for the first TCSC installation in Korean power system.

2. Configuration of a 345 kV Transmission System Equipped with TCSCs

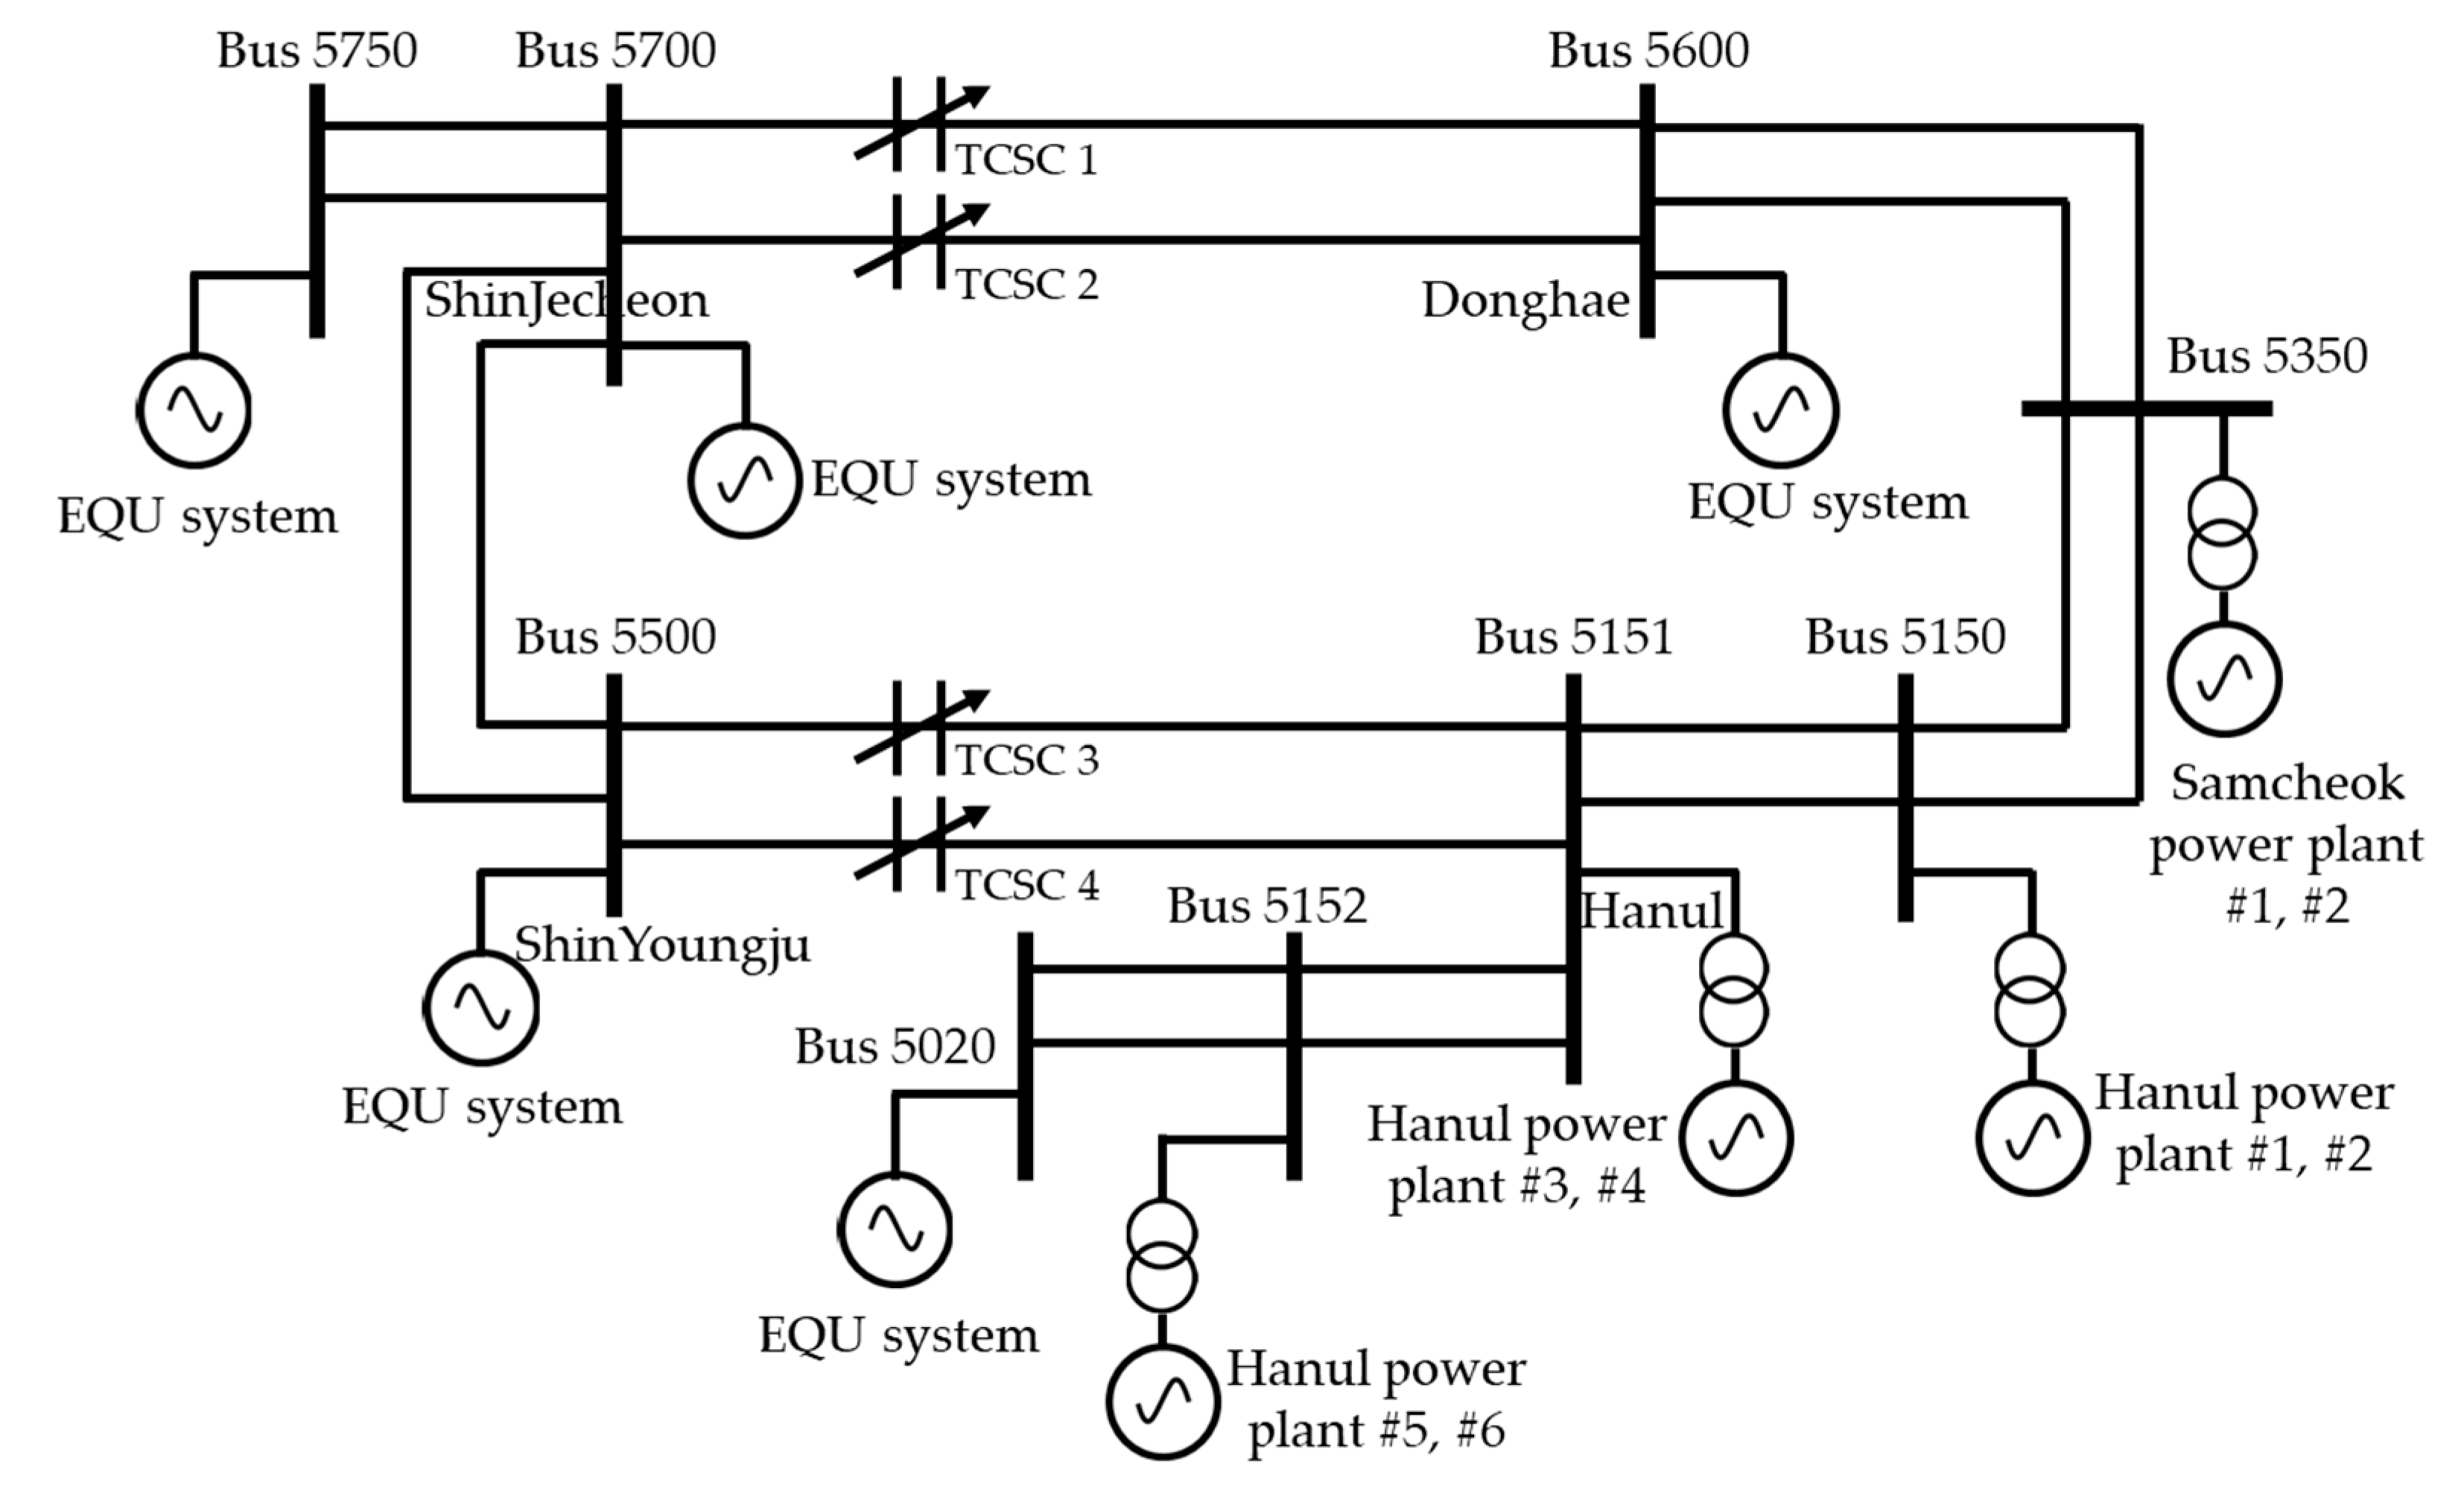
2.1. Study Model of the 345 kV Transmission System

The single line diagram of the 345 kV power network with the TCSCs compensation is shown in Figure 1, and the transmission line data are described in Table A1. The power system model provided by KEPCO was simplified and converted from the PSS/E network model to the PSCAD/EMTDC model. The Hanul nuclear power plant and Samcheok coal-fired power plant are important to supply the power for Seoul’s load demand [17]. If TCSCs are installed in two 345 kV transmission lines, including ShinJecheon-Donghae and ShinYoungju-Hanul, it is expected that the power flow will increase and the system stability will be improved as well.

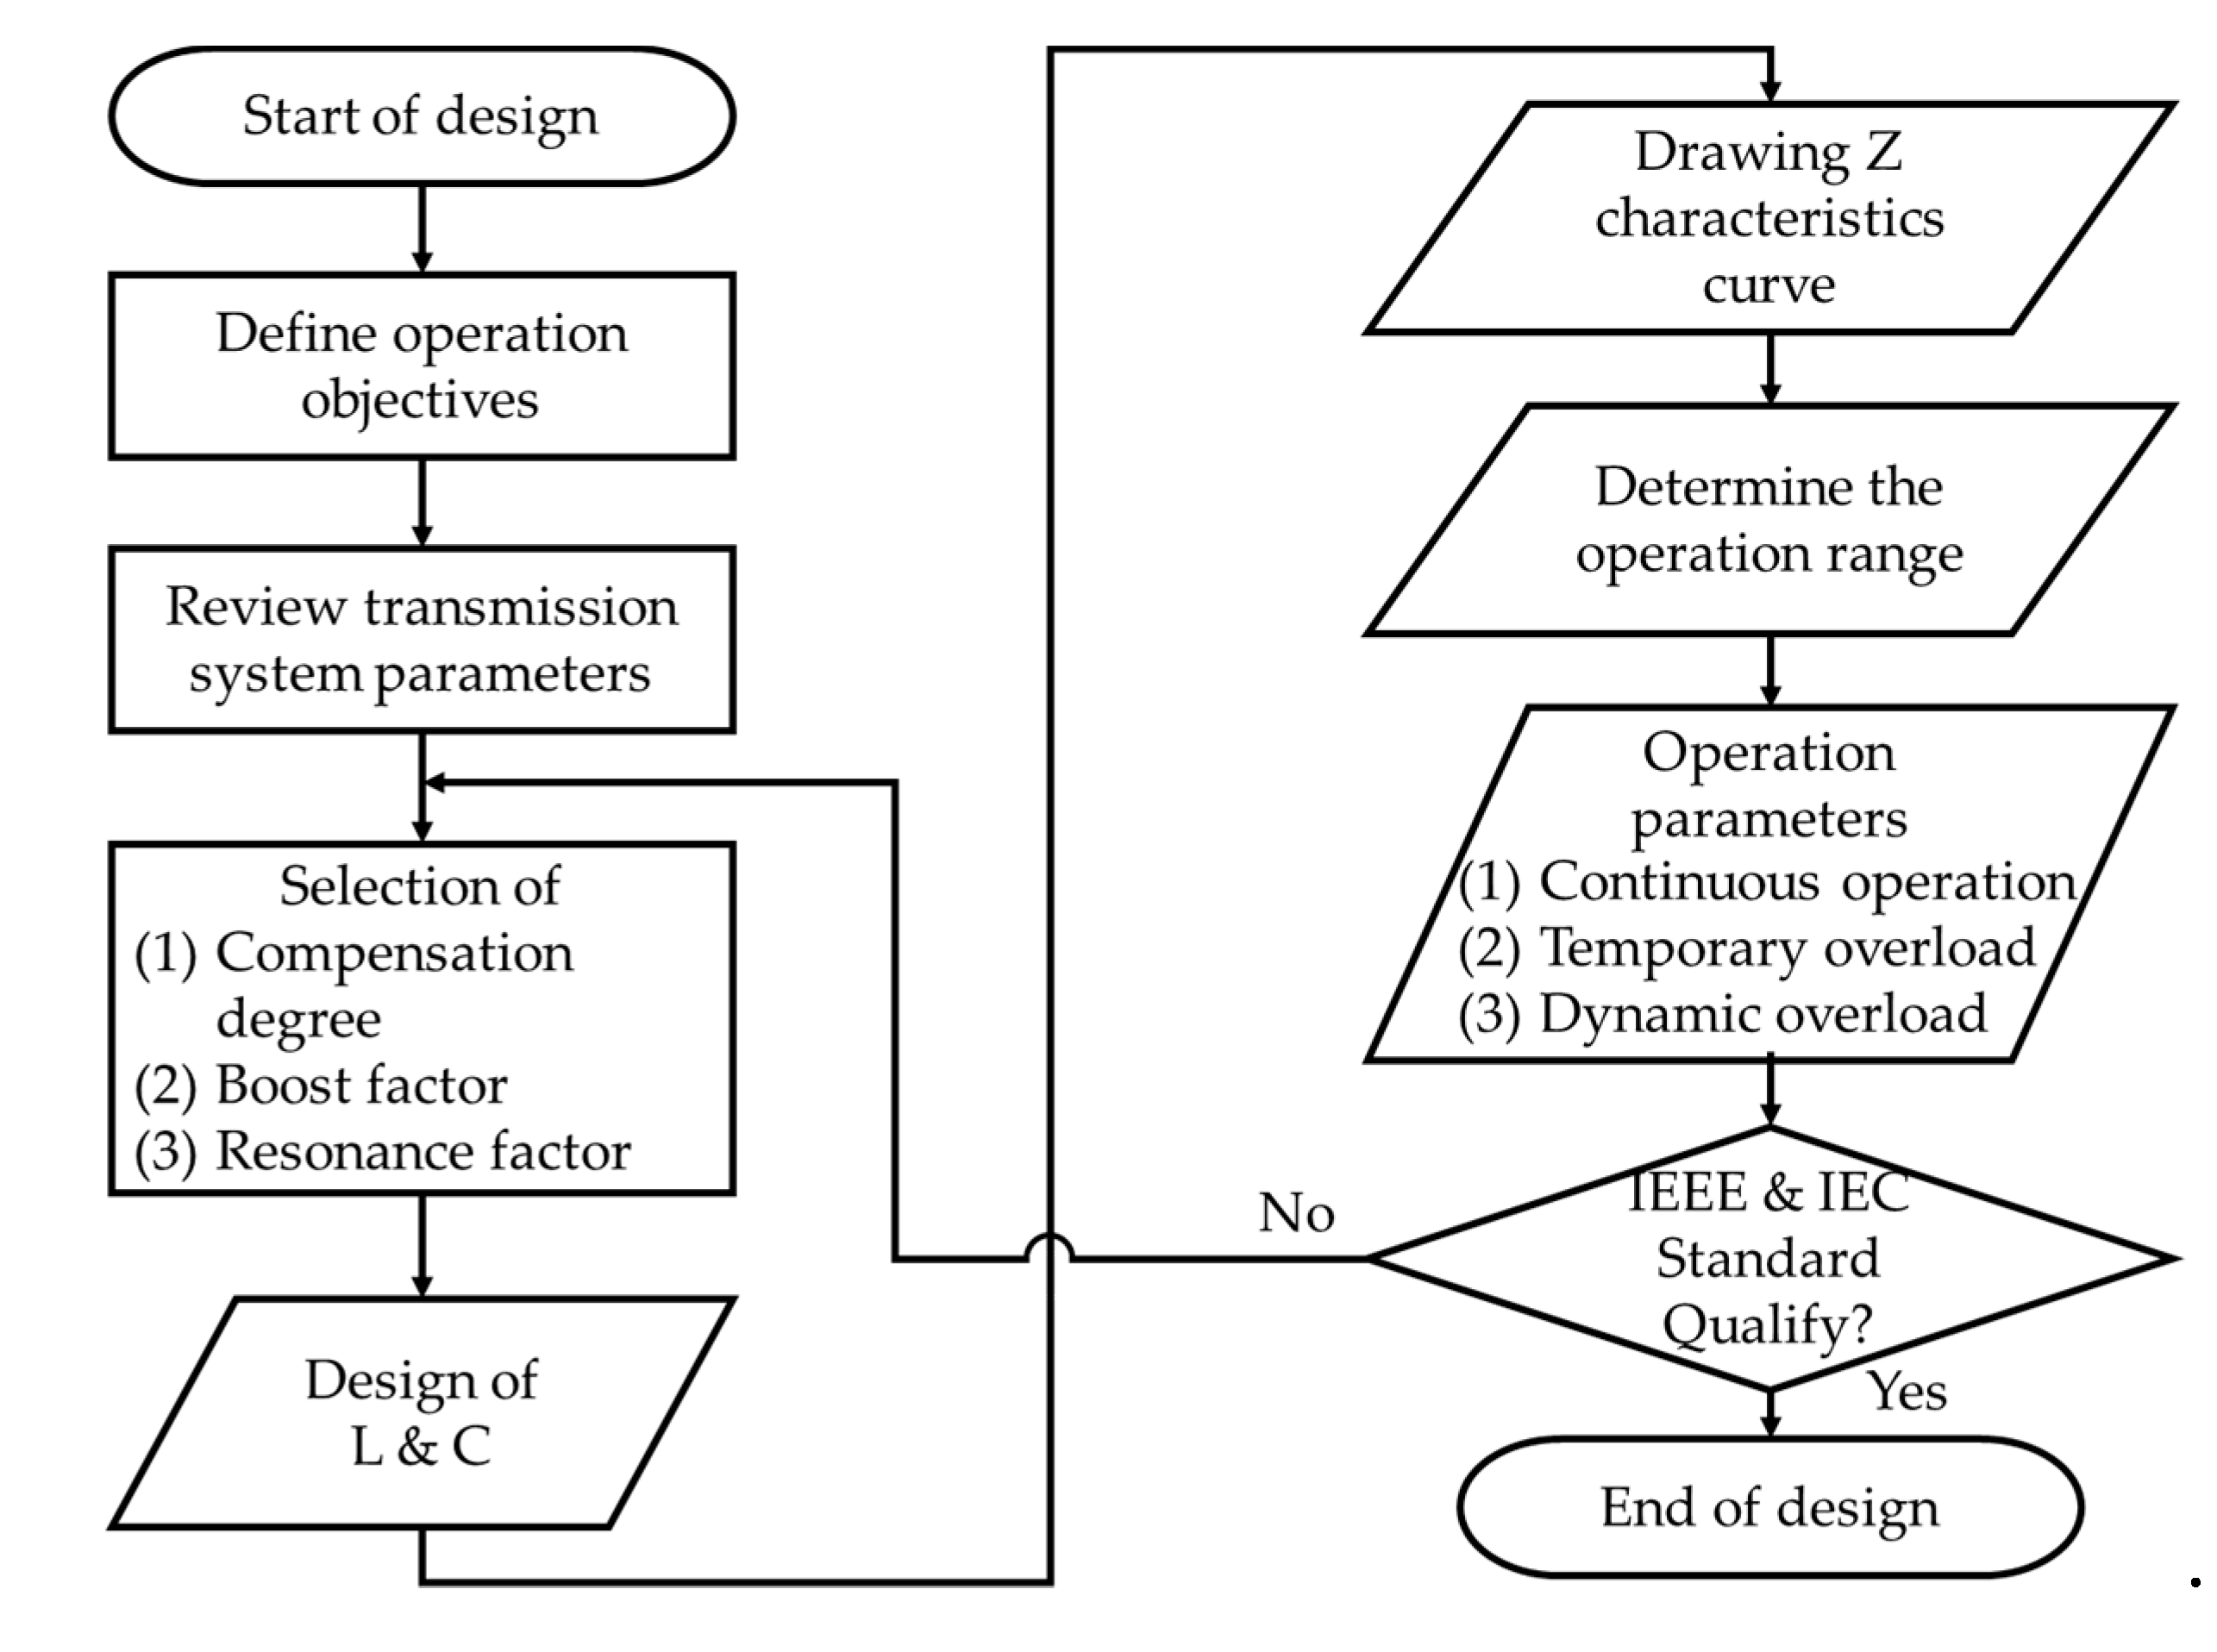
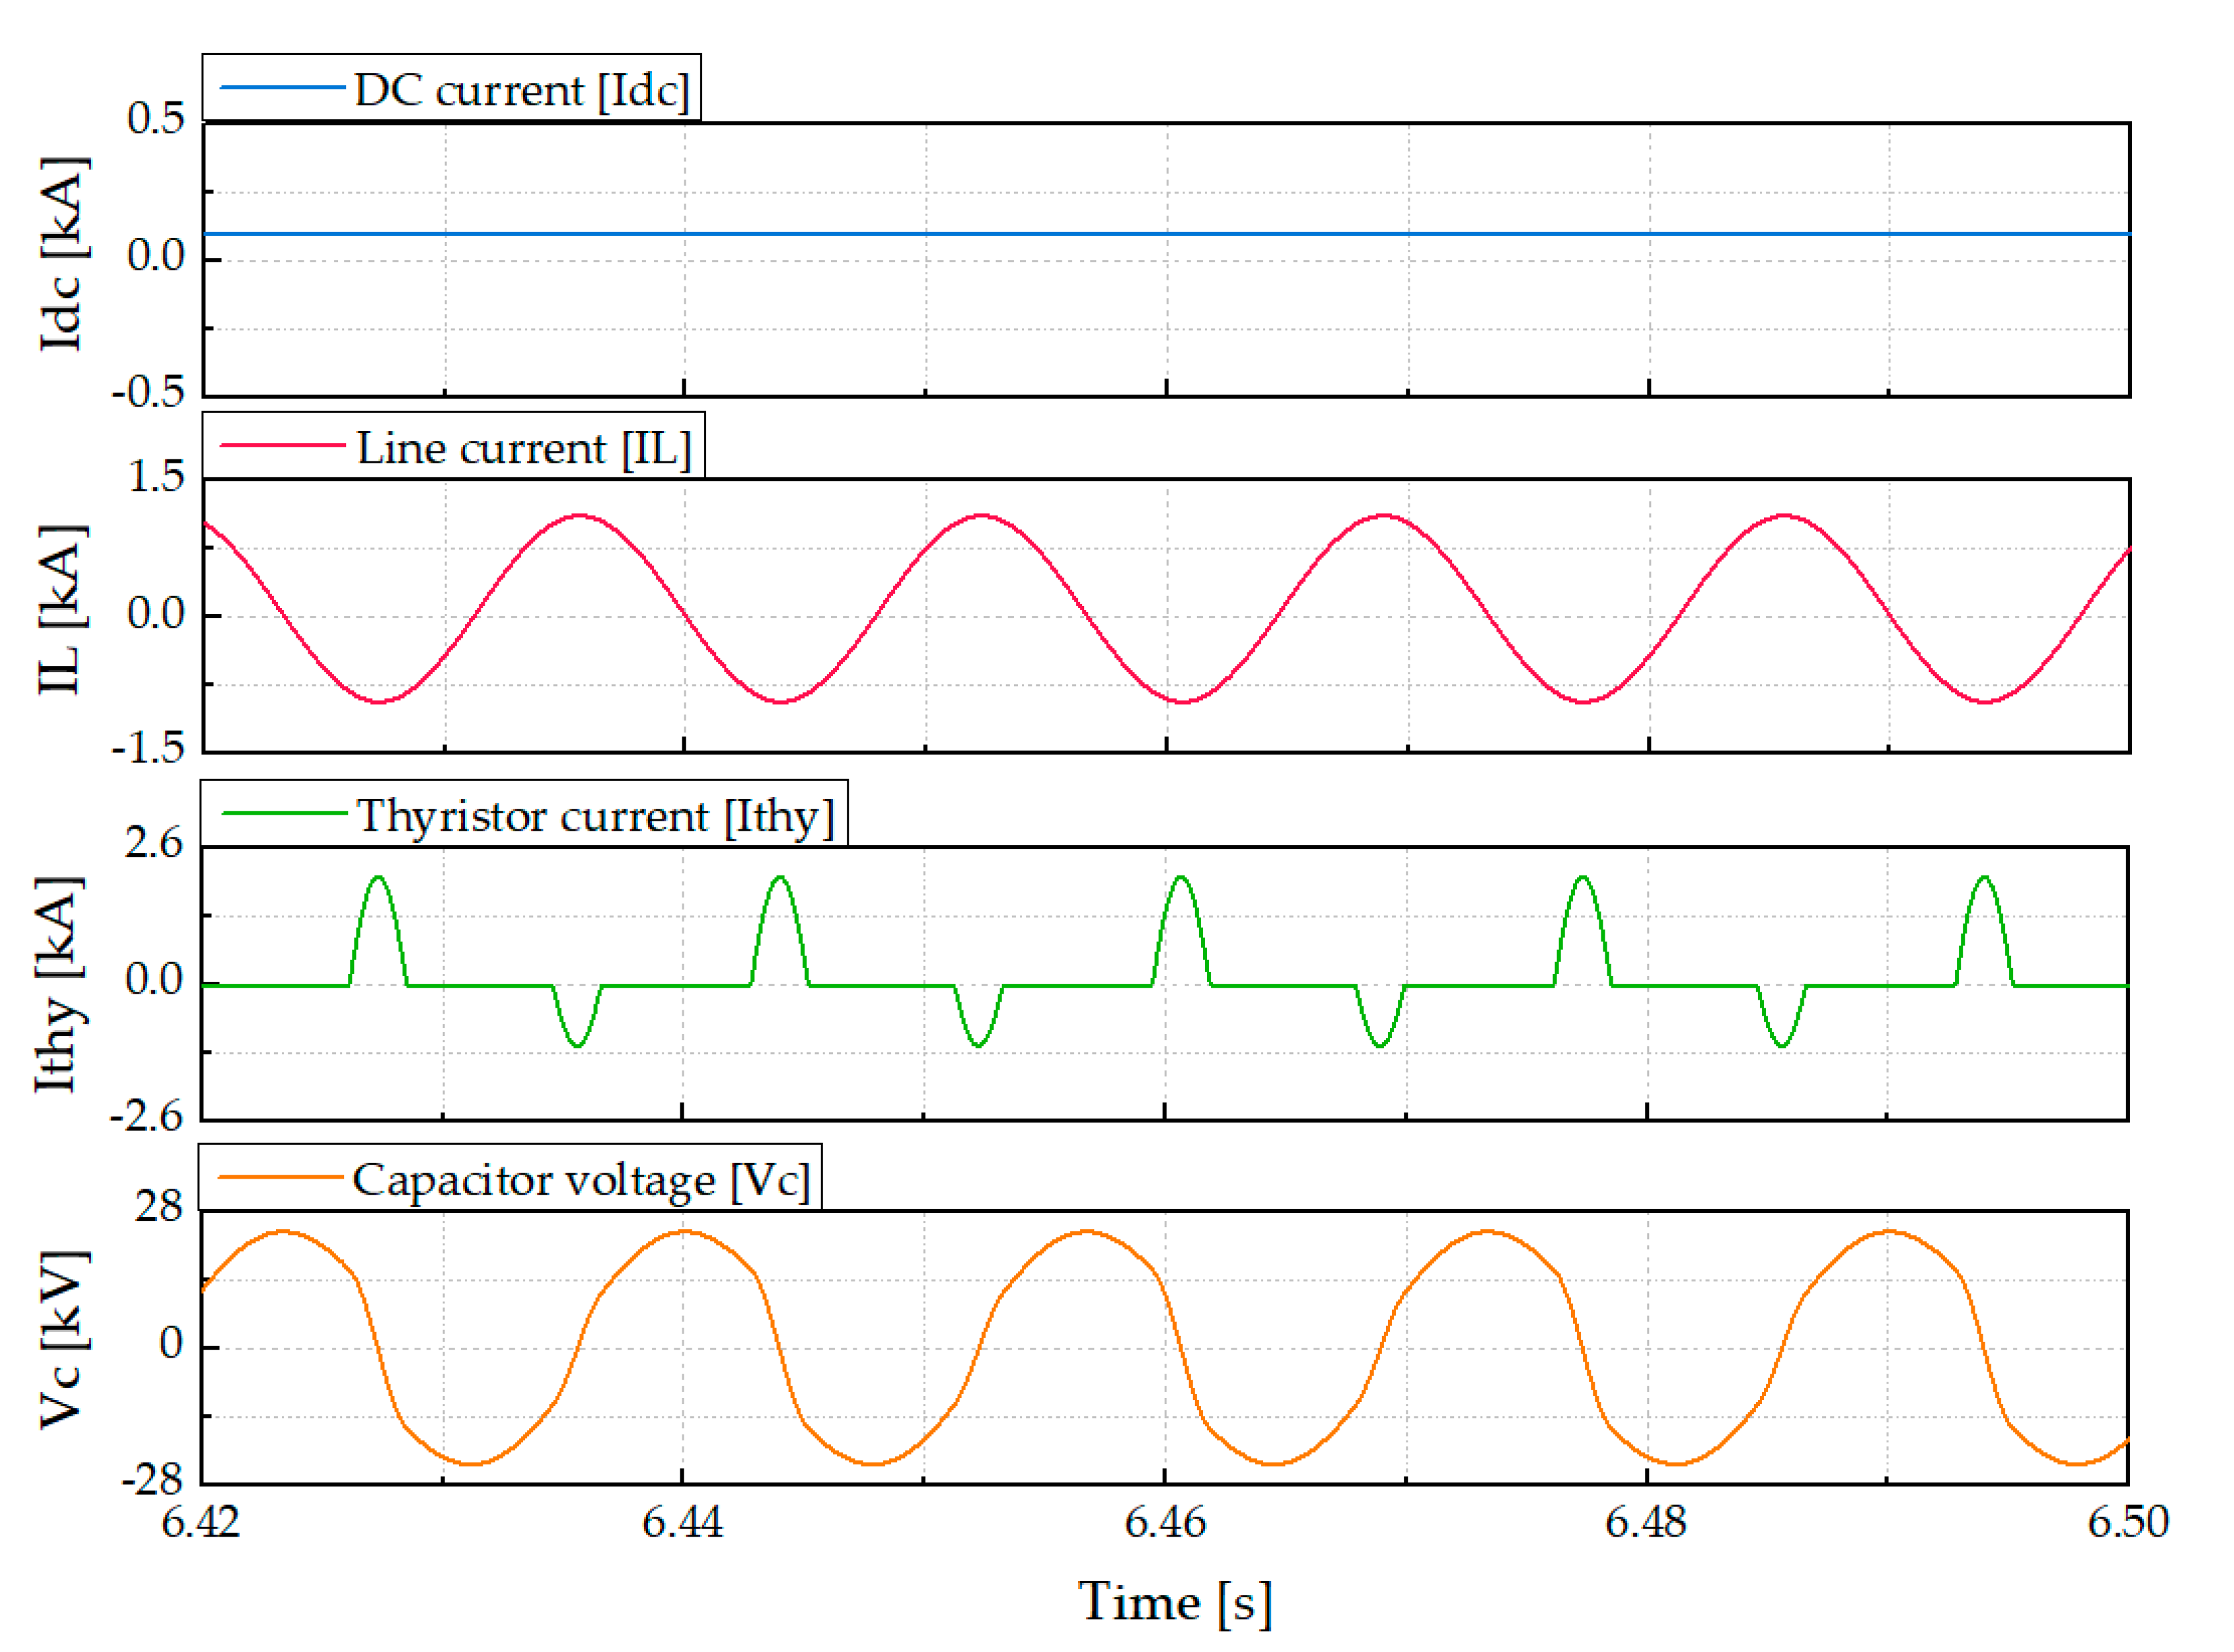
2.2. Detailed Design of the TCSCs

The TCSC module has a capacitor bank and a parallel branch, which consists of an inductor connected to back to back thyristors. The TCSC impedance can be changed according to the conduction angle of the thyristors when the two thyristors are triggered. Figure 2 describes the design process of a TCSC.
The design objectives of the TCSCs were determined of 50% compensation level for normal operation and 70% compensation level for the first swing operation. The terminologies related to the TCSC design are shown in below equations [18,19]:
k ( % ) = X T C S C X L i n e × 100
k b = X T C S C X C
λ = X C X L
where XL and XC are the inductor reactance and the capacitor reactance of TCSC. XLine is the reactance of the compensated transmission line. The compensation level (k) of TCSC was defined in the project objectives. Another parameter related to the design is the boost factor (kb) that was selected as 1.05 for the two TCSCs, and the resonance factors (λ) were selected as 2.6 and 2.68 for ShinYoungju-Hanul and ShinJecheon-Donghae, respectively. The results of the TCSCs parameters for two transmission lines can be seen in Table 1.
As recommended for the SSR mitigation method [20,21], the SVR control method was selected as a controller for the TCSCs in the 345-kV power network. The concept of the SVR control is shown in Figure 3. A phasor measurement was used to measure line current and capacitor voltage. Based on these measurement values, the appearance impedance of the TCSC was calculated at the fundamental frequency. This apparent impedance was then divided to the physical impedance of the series capacitor to get the measured boost level, kbmeas. The boost reference was compared to the measured boost value.
The boost controller uses the PI control, which is based on the error between the reference and measured boost factor for sending angular displacement φC to the SVR trigger pulse generation, and the outputs are the firing time for forward and reverse thyristors. The strategy of the SVR trigger pulse generation block is to control the instant when the capacitor voltage becomes zero. The detailed description of the block is given in the following equations [21]:
u C Z = u C M + X 0 i L M λ ω N ( t Z t M )
u C Z = X 0 i L M [ λ β tan ( λ β ) ]
t F = t Z β ω N
where:
  • X 0 = L C , λ = X 0 ω N L , and ω N = 2 π f ,
  • tZ: the desired time when the capacitor voltage becomes zero,
  • tM: the sampling time when the capacitor voltage uCM and line current iLM are measured,
  • tF: the thyristor firing time,
  • uCZ: the capacitor voltage at the desired time tZ,
  • uCM: the capacitor voltage at the sampling time tM,
  • iLM: the line current at the sampling time tM,
  • β: the conduction angle of the thyristor.
The SVR control modules were implemented in the PSCAD/EMTDC program by the Fortran codes. The reaction of the SVR control in case of a DC current and a sub-frequency current injected into the line current was shown in Figure 4 and Figure 5. The first case is illustrated in Figure 4, the TCSC operates in a steady state when a DC current is injected into the line current. As shown in the second graph from the top of Figure 4, there is an offset of line current caused by a DC injected current.
The SVR operates depending on the set of Equations (4)–(6) for calculating the different firing time for two thyristors which can be seen in the third graph of Figure 4. Thus, the TCSC voltage was kept stable with a DC current added to the line current.
A sine wave with a frequency of 10 Hz was also injected into the line current, as shown in the upper graph of Figure 5. The second graph from the top shows the total of the line current and the sub-frequency current. The thyristor currents and the TCSC voltage were shown in the third and bottom graph of Figure 5, respectively. The SVR control depends on the values of the line current and capacitor voltage for calculating the next firing time of a thyristor. Therefore, in the third graph of Figure 5, the conduction angles are different for two thyristors. So, there is a similar result in the case of a DC current injected, the TCSC voltage was also kept constant with the disturbance (sub-frequency current) in the system. That means with the SVR control, a disturbance of a DC or a sub-frequency current cannot affect to the TCSC operation, which is the advantage of the SVR controller.

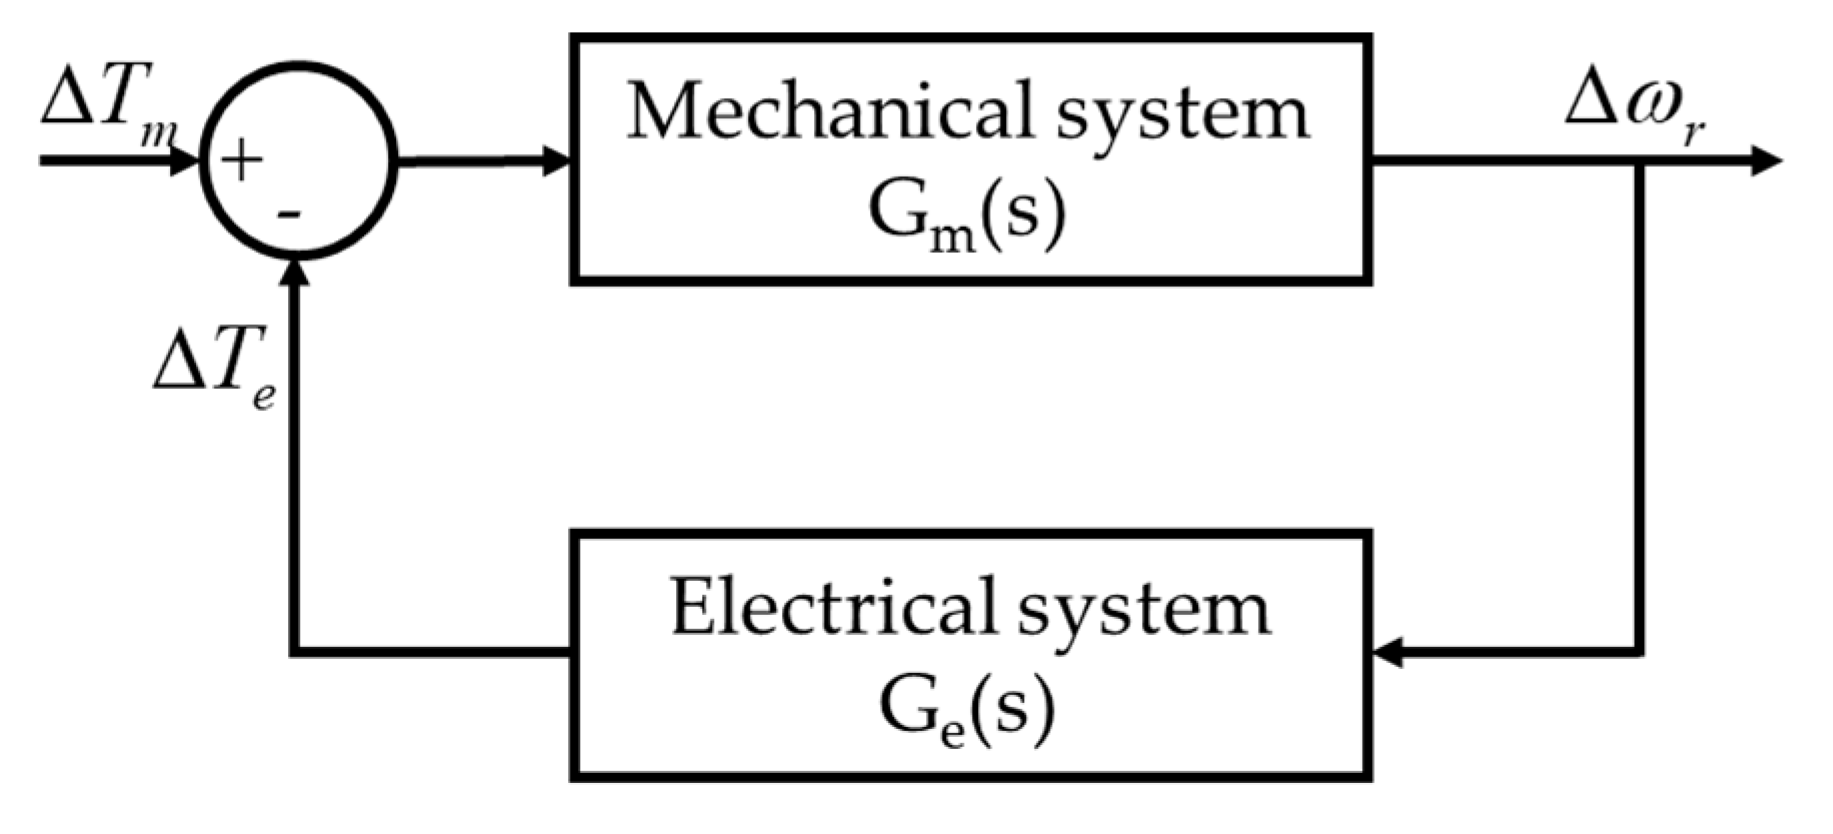
3. Analysis Method of Subsynchronous Resonance

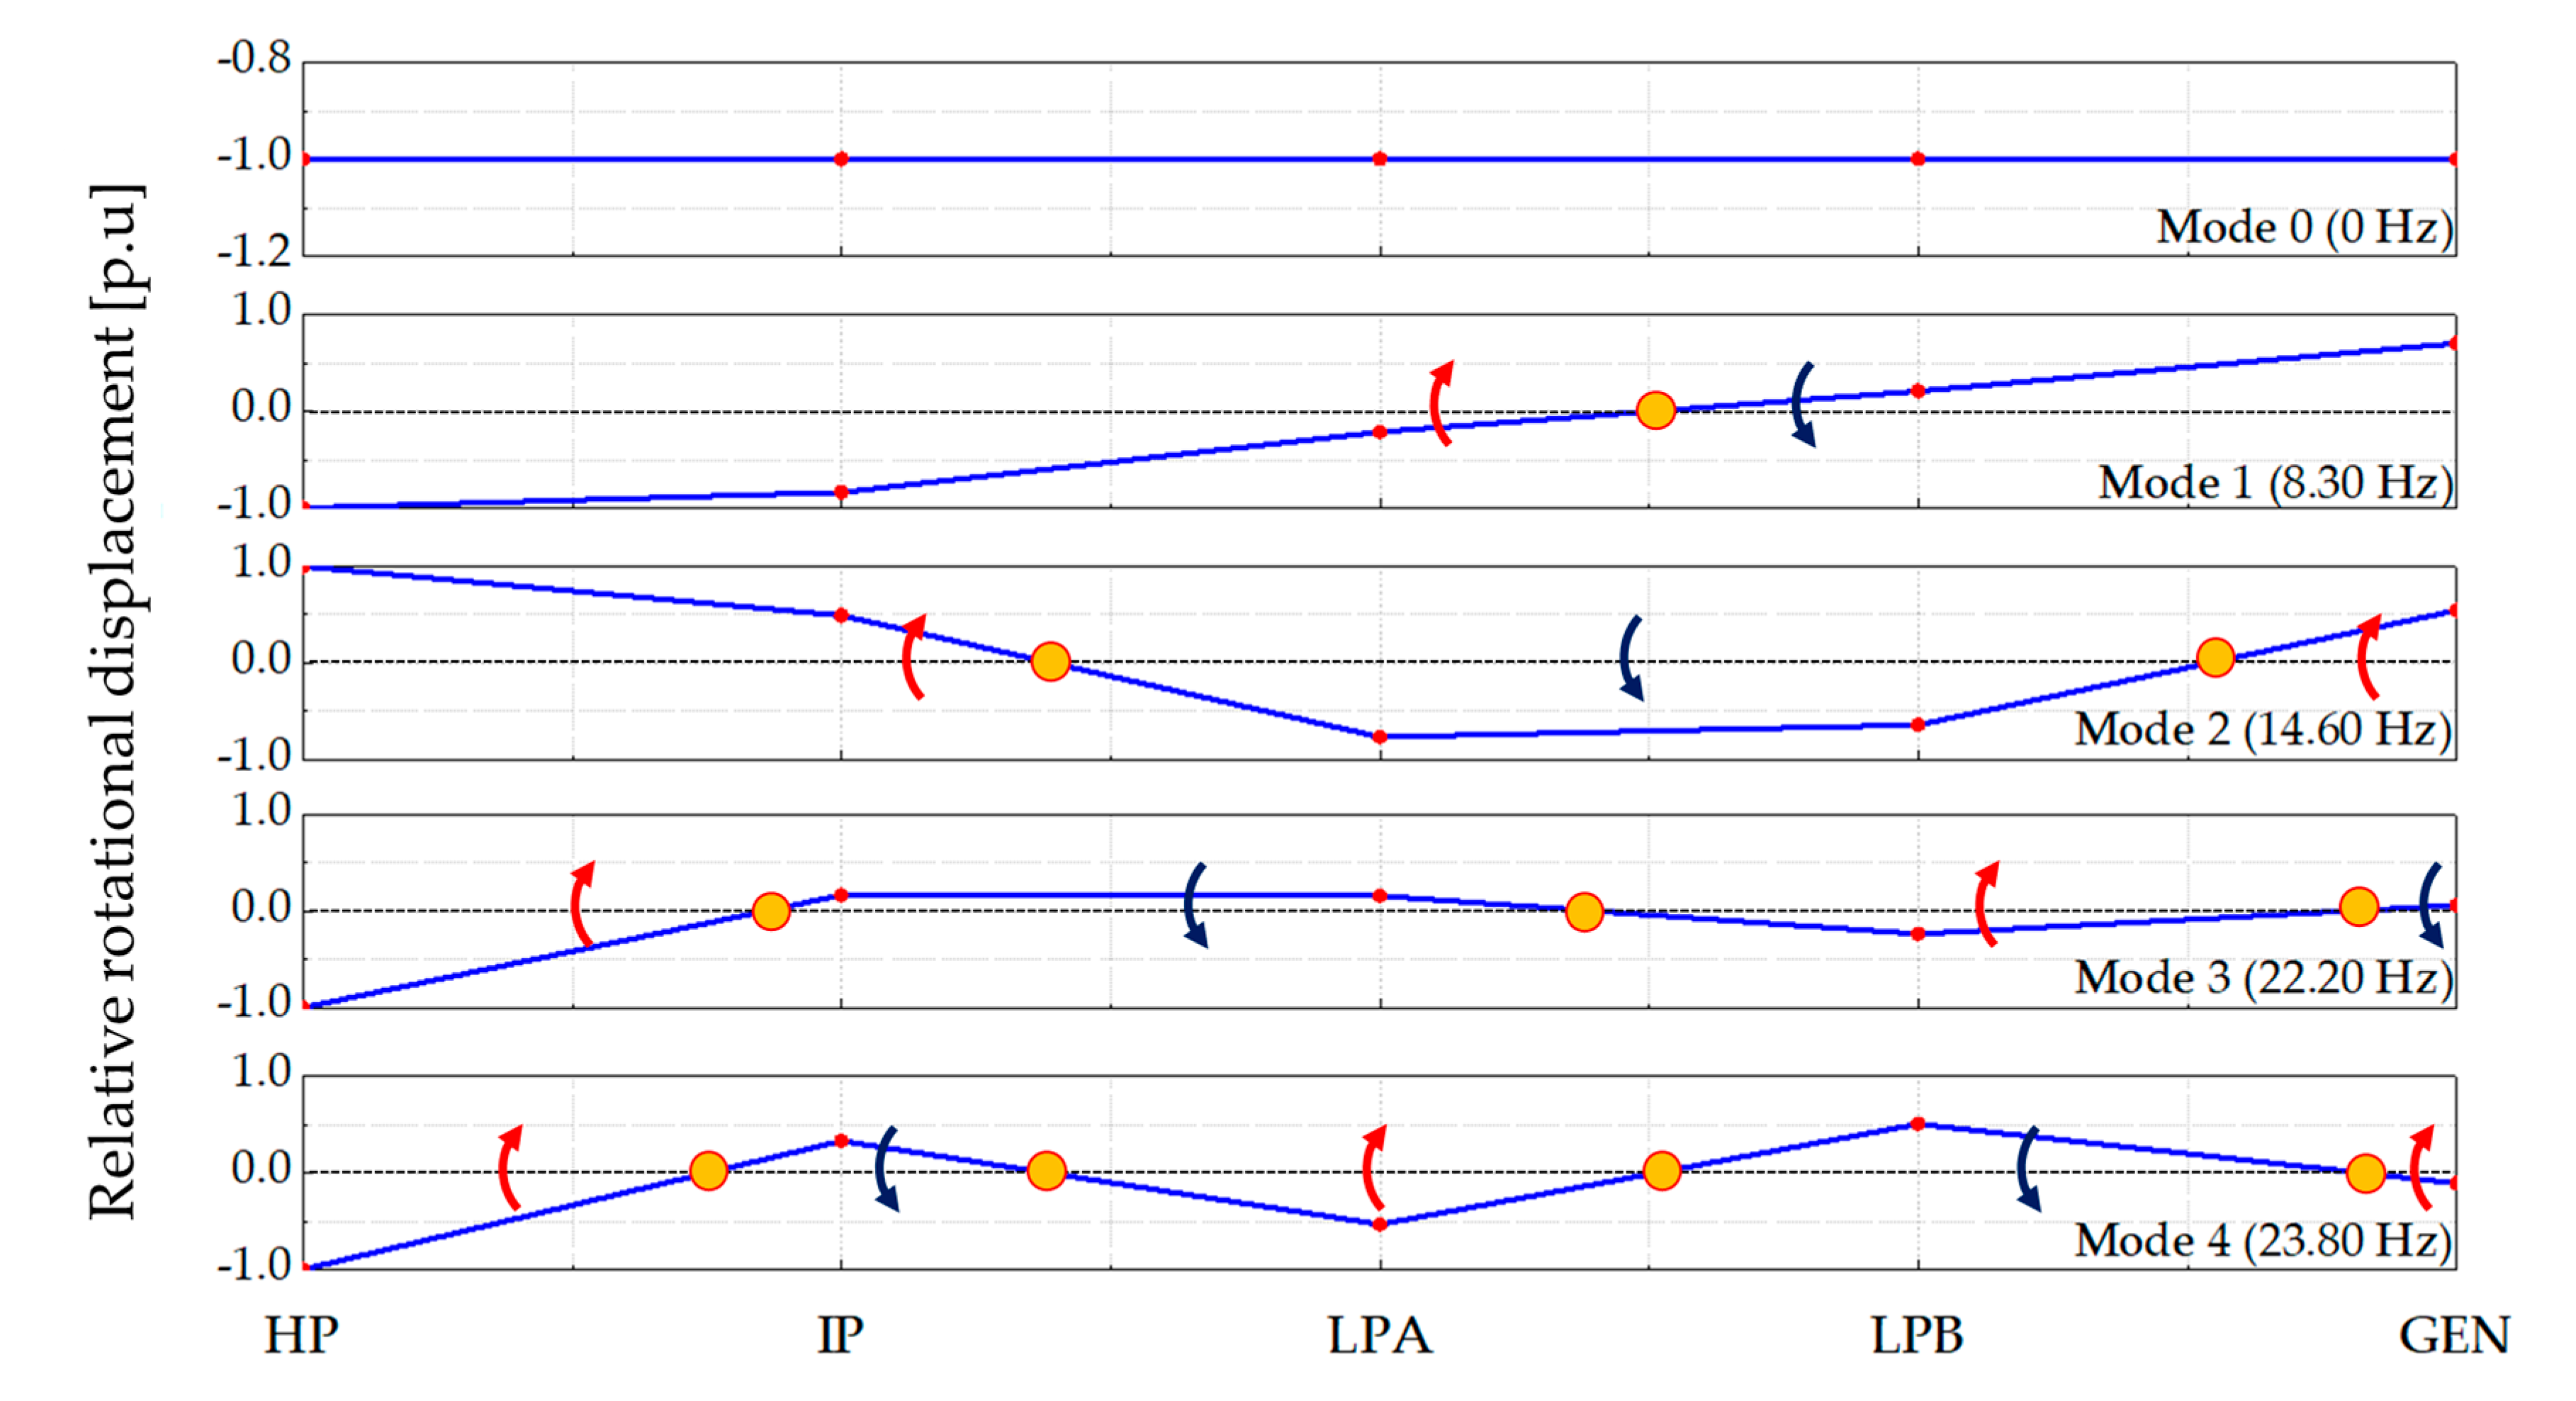
3.1. Torsional Natural Frequency and Mode Shapes Analysis

The simplified 345 kV transmission system was used to present the Hanul nuclear power plant and the Samcheok coal-fired power plant. It has been mentioned that, when a generator is a radial connection with series compensation such as the FSC and TCSC, the generator is the worst case to the excitation of the SSR at one or more shaft modes. Thus, in this study, the units #3 and #4 of the Hanul power plant were considered as detail generator model while the voltage sources represented the other generators. This is a 1219.6 MVA synchronous generator with a rated RMS line to line voltage of 22 kV, the generator was presented by a synchronous machine component. It included two damper windings in the q axis, the multi-mass interface was enabled, and the completed generator input data are presented in Table A2. The multi-mass system shown in Figure 6 configures the shafts of the generator units #3 and #4 of Hanul nuclear power plant. A multi-masses system including a high-pressure (HP), an intermediate pressure (IP) turbine, two low-pressure (LP-A, LP-B) and generator (GEN) turbines together combined a five-mass spring system with detailed data given in Table 2.
The relationship between the electrical torque and mechanical torque of a synchronous generator can be expressed by the motion equation:
J d ω m d t = T = T m T e
For a detailed study of a multi-mass model of a steam turbine generator, a set of equations of individual masses are illustrated in the following equation [22]:
For generator:
J 1 d ω 1 d t = T e + k 12 ( δ 2 δ 1 ) D 1 ω 1
For LP-B section:
J 2 d ω 2 d t = T 2 + k 23 ( δ 3 δ 2 ) k 12 ( δ 2 δ 1 ) D 2 ω 2
For LP-A section:
J 3 d ω 3 d t = T 3 + k 34 ( δ 4 δ 3 ) k 23 ( δ 3 δ 2 ) D 3 ω 3
For IP section:
J 4 d ω 4 d t = T 4 + k 45 ( δ 5 δ 4 ) k 34 ( δ 4 δ 3 ) D 4 ω 4
For HP section:
J 5 d ω 5 d t = T 5 k 45 ( δ 5 δ 4 ) D 5 ω 5
where, Ji is the moment of inertia, ωi is the angular velocity, δi is the rotor angle, Ti is the mechanical torque, and Di is the damping torque coefficient with i from 1 to 5 indicates the individual sections of GEN, LP-B, LP-A, IP, and HP, respectively. kij is the stiffness between two connected shaft sections. The damping torques between masses are assumed to be negligible in this study.
An eigenvalue analysis was performed for the generator units #3 and #4 based on the shaft system equations given above. The eigenvalues and shaft model parameters such as natural frequency (fm), modal inertial (Hm), and mechanical damping (Dm) are given in Table 3, and the rotor natural frequencies with mode shaft of the turbine generator are shown in Figure 7. The relative rotational displacements are shown for one normal operation mode (mode 0) and four oscillation modes which are presented with natural frequencies at 8.3 Hz, 14.6 Hz, 22.2 Hz, and 23.8 Hz, respectively. For the first SSR mode, the mass IP has a strong interaction with the mass LP−A, and the mass LP−B has a strong interaction with the GEN in the second SSR mode. The third SSR mode has three interaction points, and the strongest point lies between the mass LP−B and GEN. Similarly, the fourth SSR mode has four interaction points with the strong interaction between the mass HP and IP.

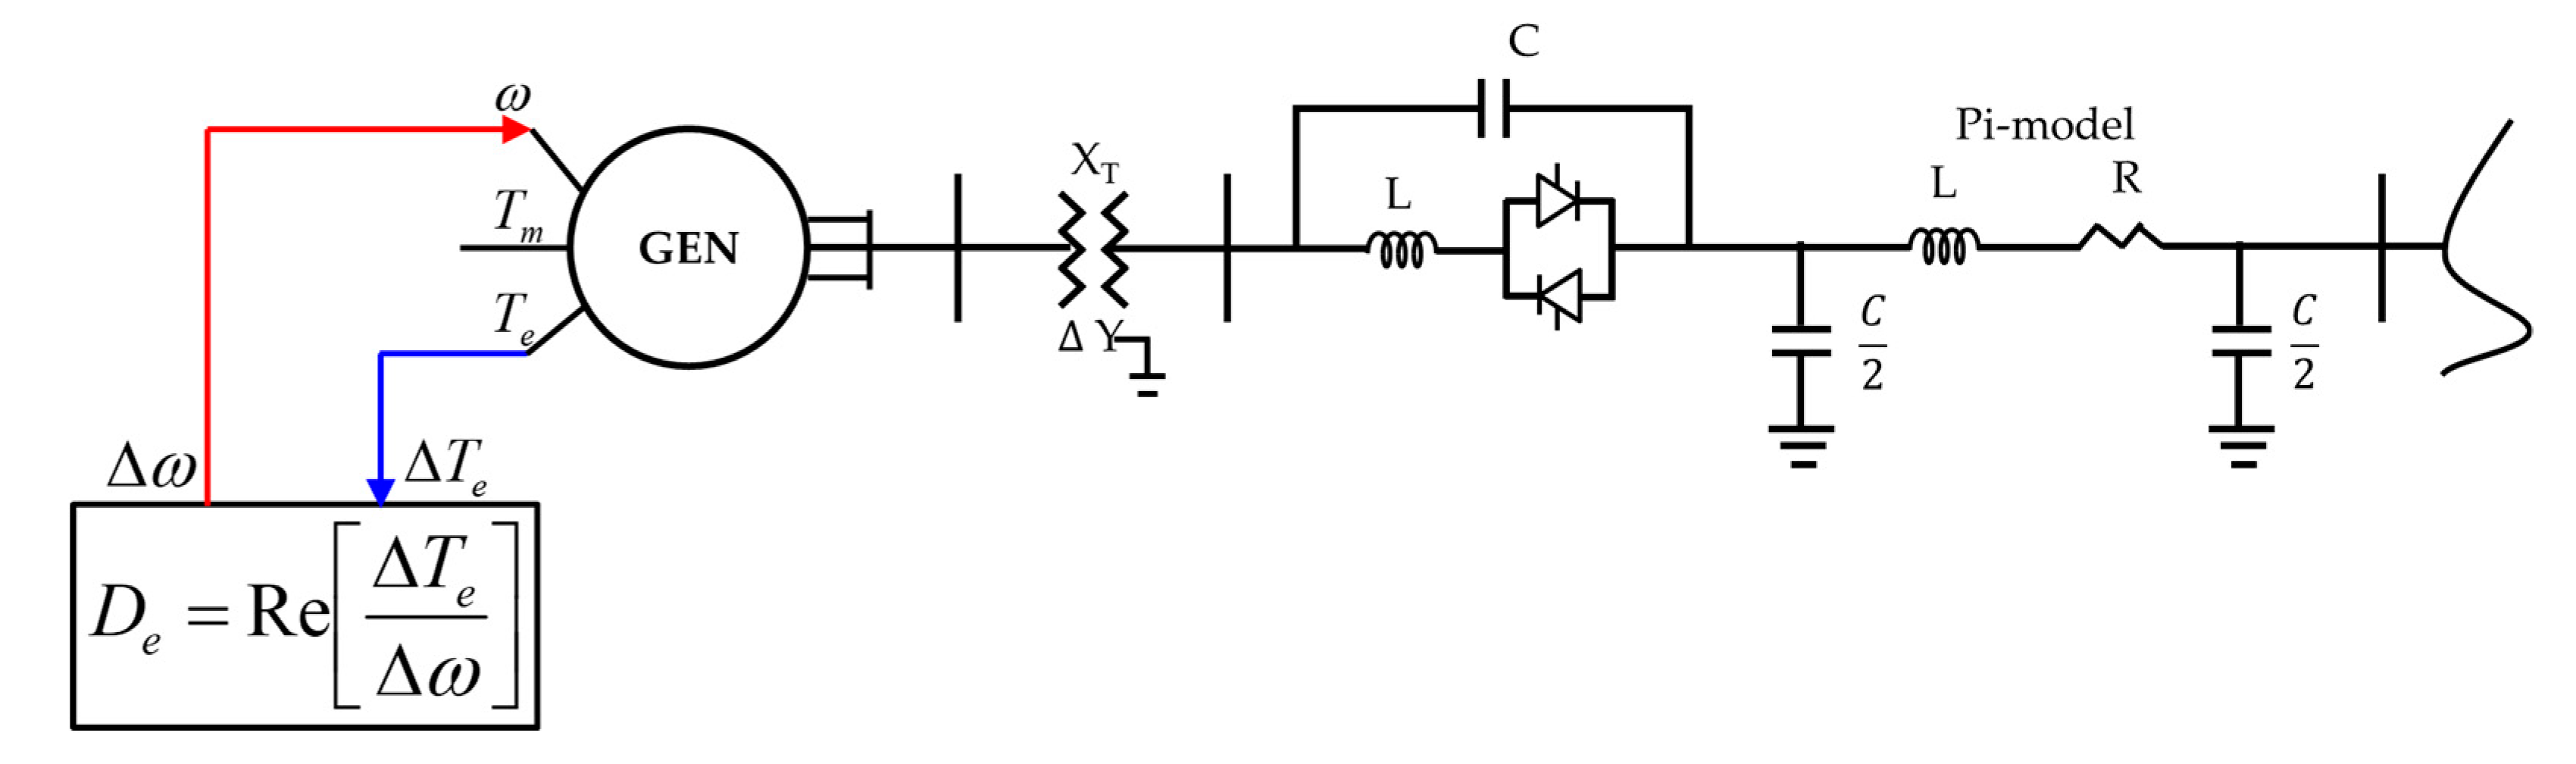
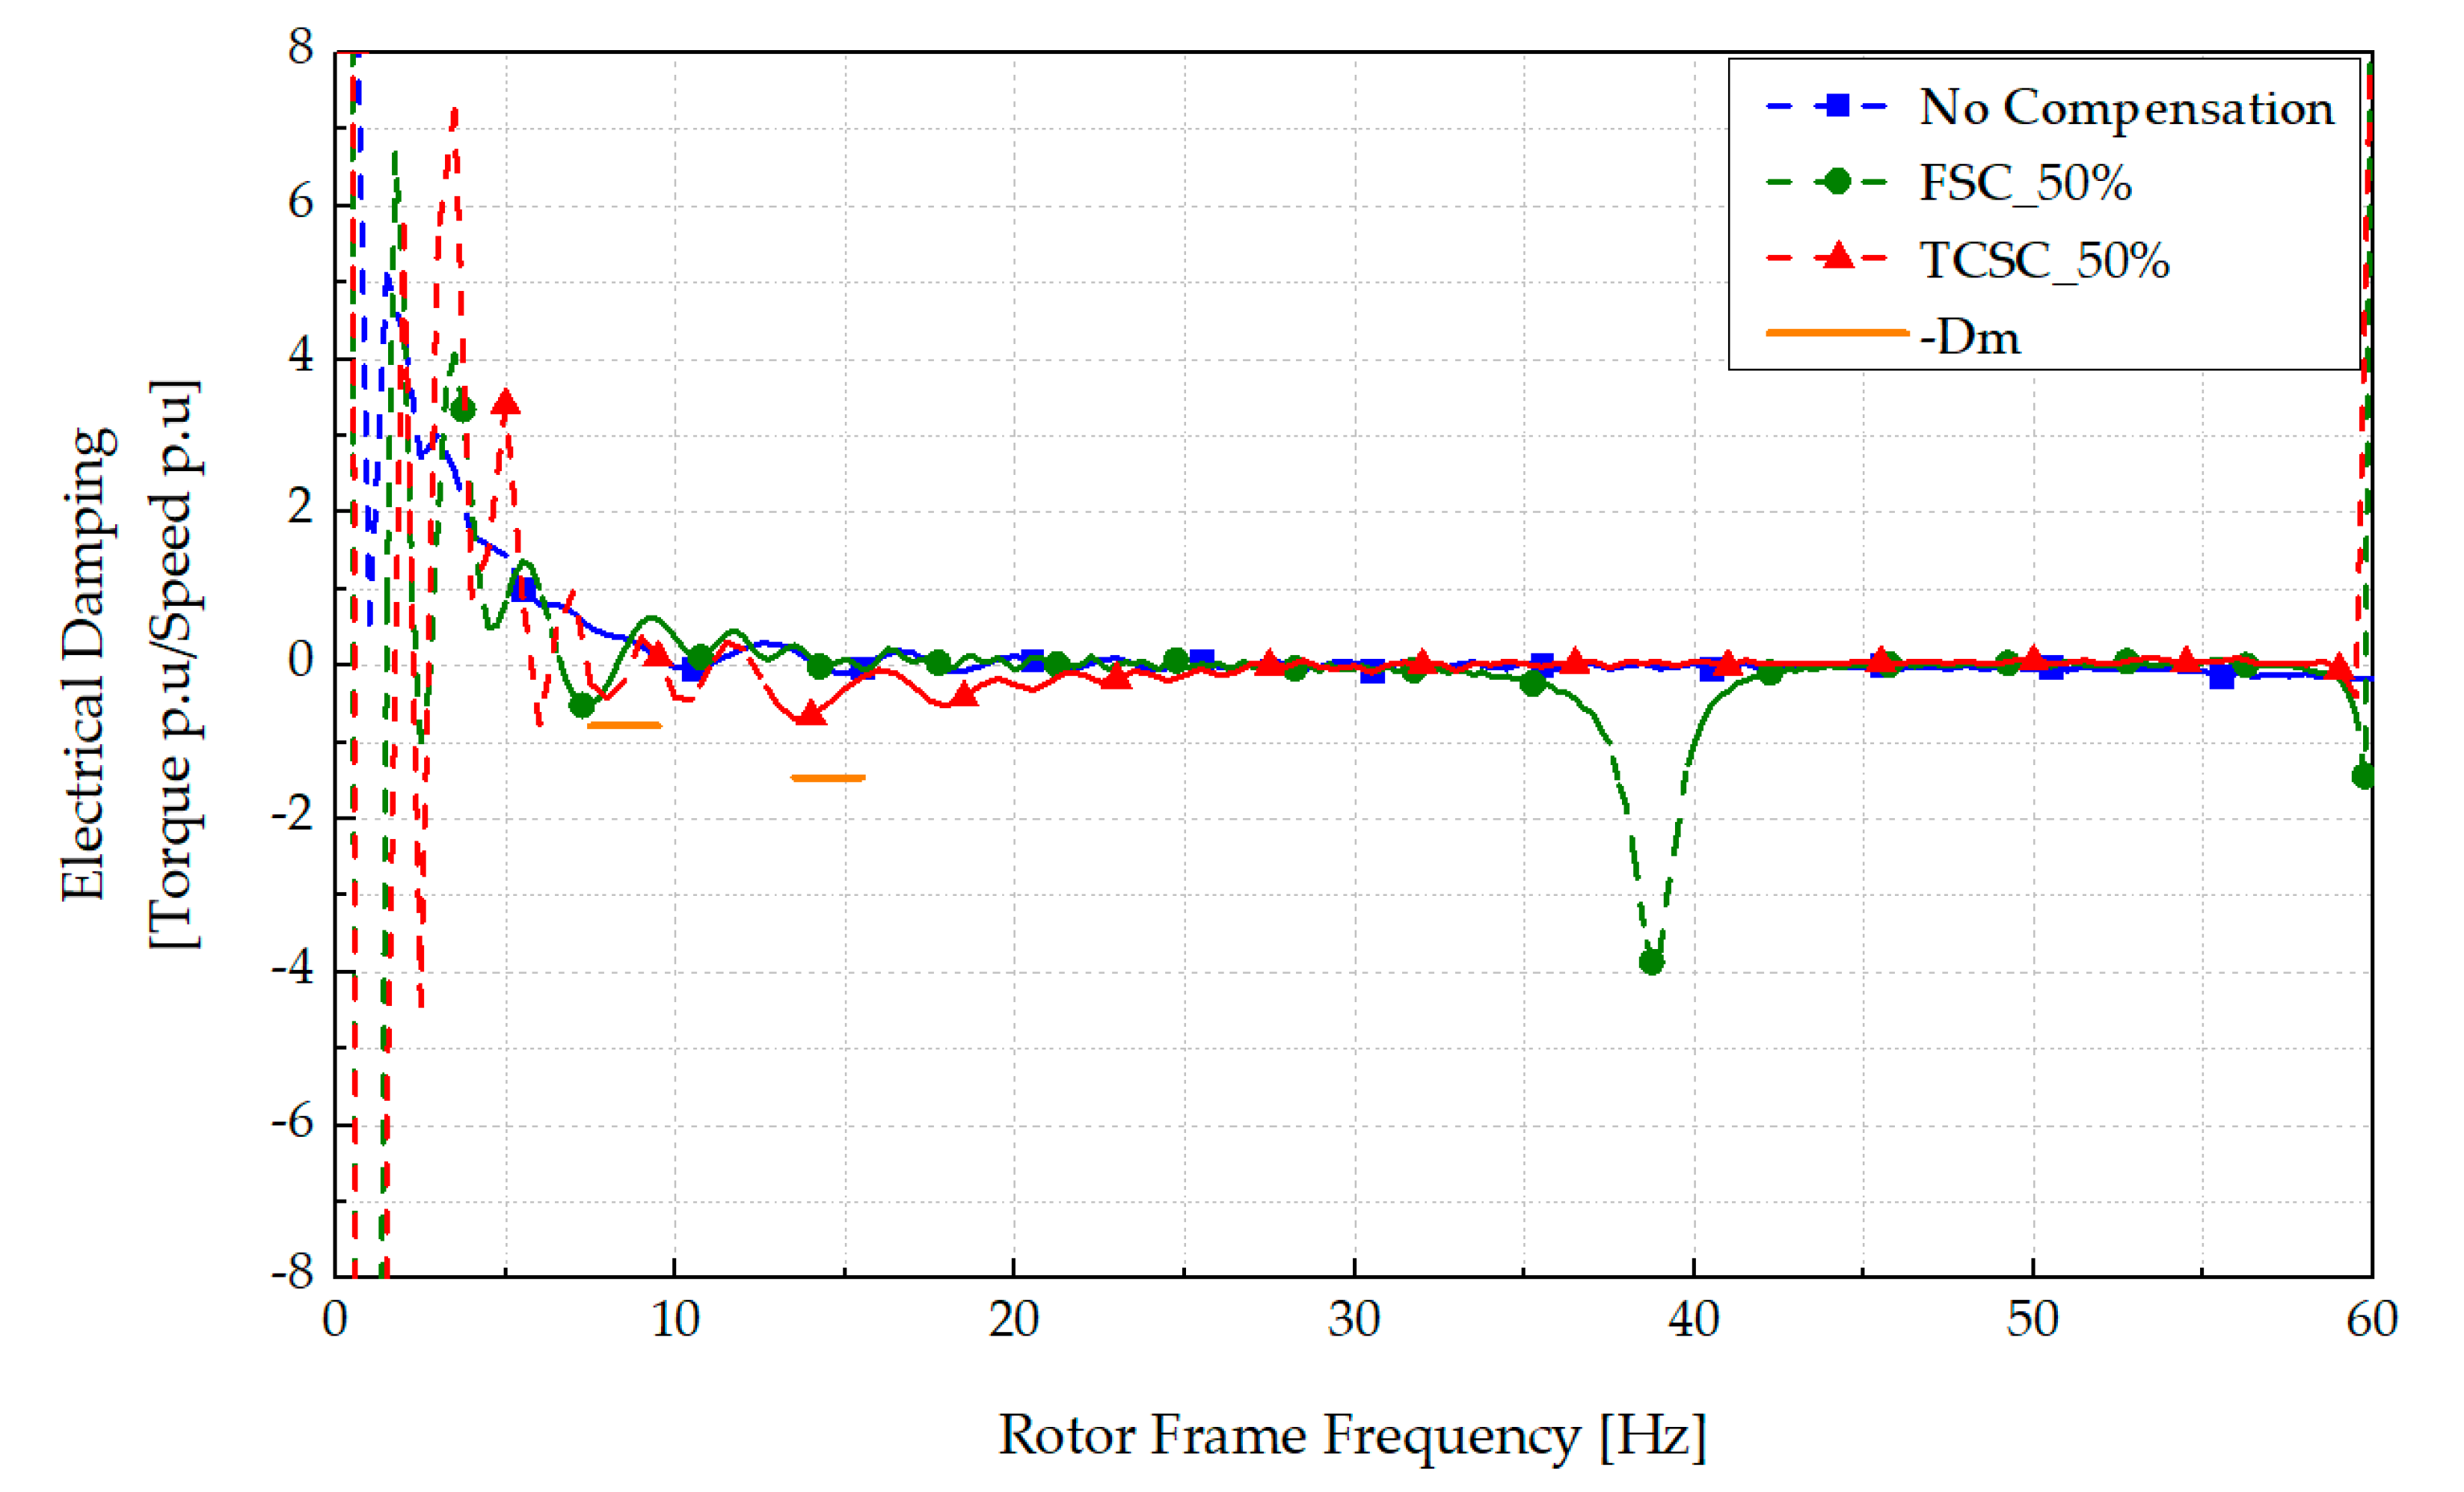
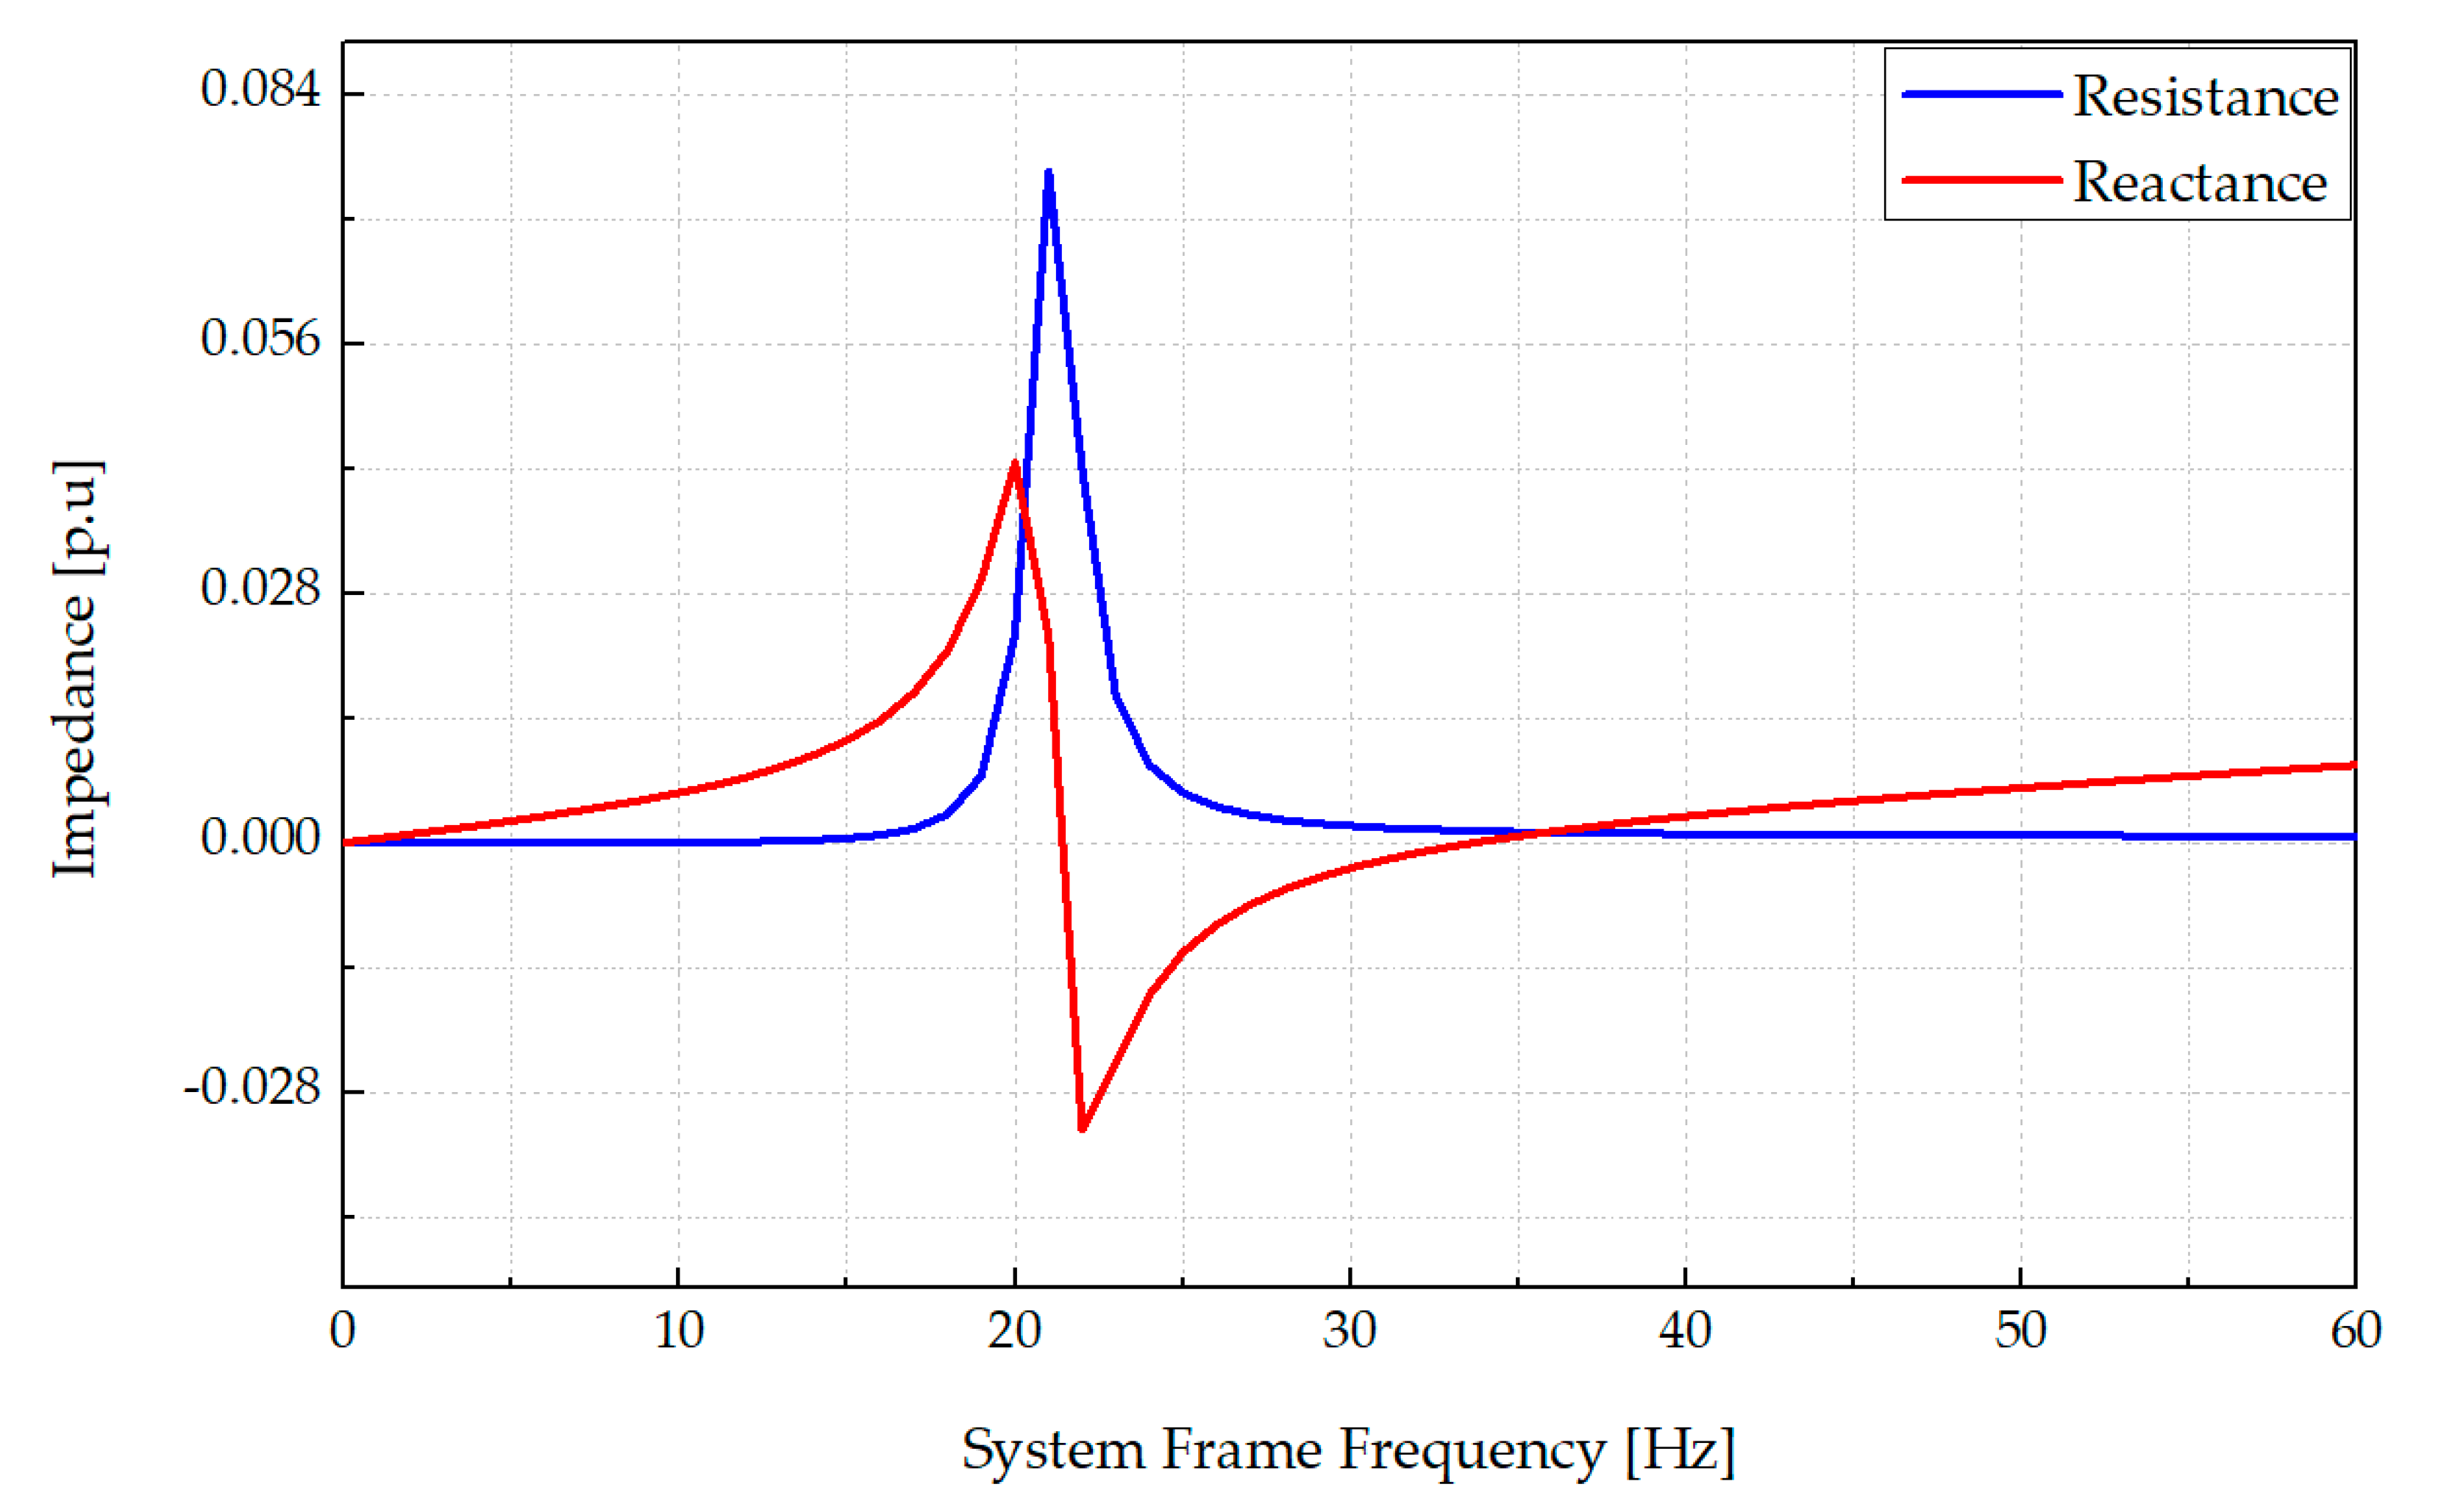
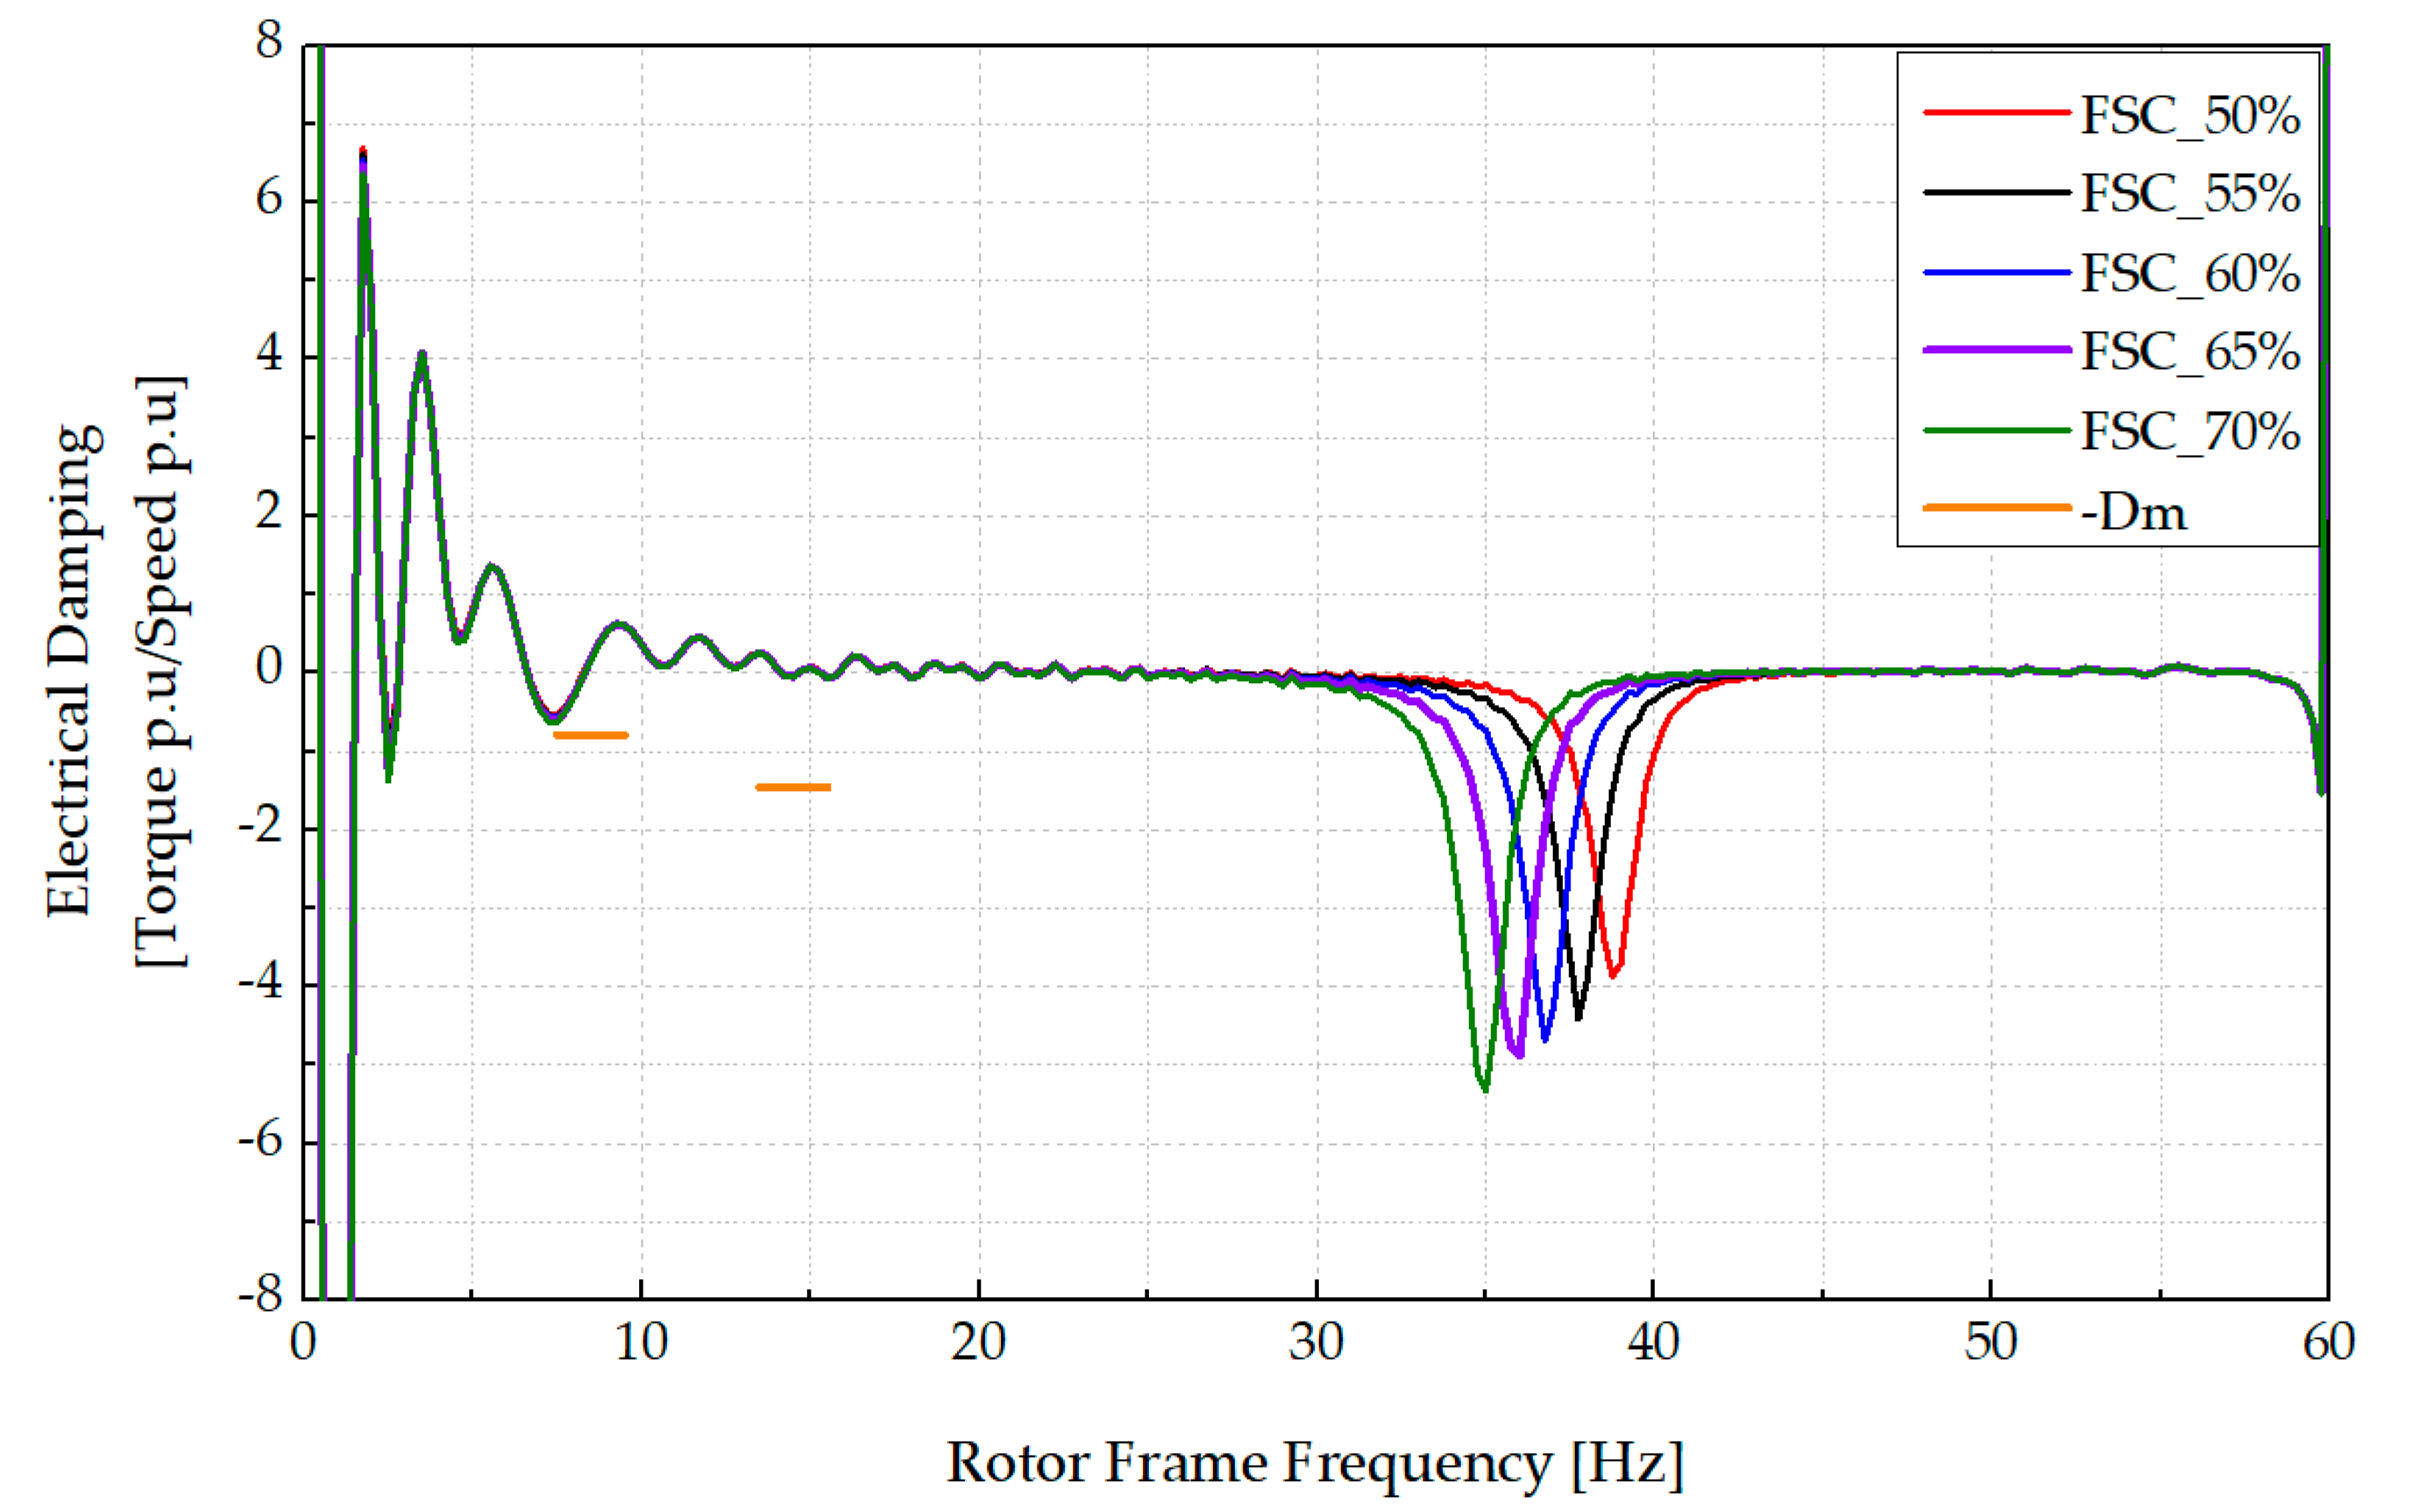
3.2. Frequency Scanning Method for SSR Analysis

The SSR behavior can occur when the electrical power grid is compensated by a series capacitor. The resonance between electrical synchronous machines shaft and electrical grid can happen at subsynchronous frequencies, which are lower than the fundamental frequency (60 Hz for the study power network). Frequency scanning is a method of getting the frequency response of a system. These techniques determine the total impedance of the system viewed from the studying generator as a function of frequency. From that, the scanned impedance and the mechanical parameters of the turbine generator are used for calculating electrical damping of the system [2]. Another type of frequency scanning is the test signal method, which was used in this paper. As it is a method based on time domain simulation, it conforms to the detailed model of a real system application for getting the electrical damping of the system. There is no risk of the SSR if the total net damping of the system is positive [23,24], which means that the system satisfies the equation:
D ( ω ) = D e ( ω ) + D m ( ω ) > 0
where, Dm(ω) and De(ω) are the damping of the mechanical and electrical system, respectively.
The relationship between the mechanical and electrical systems can be described by the closed−loop diagram shown in Figure 8, with ΔTe is the electrical torque deviation in per unit and Δωr is generator rotor speed deviation in per unit.
The electrical dynamic as a function of frequency can be expressed as the following equation:
G e ( j ω ) = D e ( ω ) + j K e ( ω )
where, Ke(ω) is the electrical coefficient.
The transfer function between the electrical torque and the generator rotor speed is Ge(s). Thus, the damping torque coefficient (electrical damping) is defined as follows:
D e ( ω ) = [ Δ T e ( j ω ) Δ ω r ( j ω ) ]
In this method, a multi−sine signal is injected into the synchronous generator rotor as the speed deviation, and the obtained output is an electrical torque. Thus, the transfer function represents the electrical damping as the function of frequency as given in Equation (15). The injected multi−signals are described as the following Equations (16)–(18):
Δ ω r = A ω n = n 0 N sin [ 2 π ( f s u b _ min + n f s u b _ g a p ) t + δ n ]
δ n = ( n n 0 ) ( n n 0 + 1 ) ( N n 0 + 1 ) π
N = f s u b _ max f s u b _ min f s u b _ g a p + 1
where, the spectrum injected frequencies range [fsub_min, fsub_max] must cover all the range of subsynchronous frequency from 5 Hz to 55 Hz, and the fsub_gap is the increment of each injected frequencies. The amplitude Aω could be chosen to be very small. With the selected Aω, the Schroeder multi−sine can be applied to choose δn as the function of n in (17) for reducing overall amplitude [25].
Figure 9 shows a simple circuit of a synchronous generator connected with a TCSC through the ‘pi’ model of a transmission line. A multi−sine signal is injected into the speed input of the generator, the measurement as the output of the electrical torque is for carrying out the electrical torque corresponding to the injected signal. This multi−sine signal was implemented in the time−domain simulation in PSCAD/EMTDC, which is an interesting tool for frequency screening studies where FACTs devices are located.

4. Simulation and the Results

In this section, we analyzed and described the effects of the series compensation for the SSR behavior in case of using the FSC and TCSC. The FSC compensation was used to confirm the advantages of the TCSC compensation with the SVR control method. As the requirements from KEPCO, the compensation levels are 50% and 70% for the normal and dynamic operations, respectively. The signal injection method was used to obtain the electrical damping De, these values are compared to the mechanical damping Dm values presented in Table 3. Thus, we can indicate the risks of the SSR in the system as the equation (13).
As discussed in Section 3.1, the selected generators are the Hanul nuclear units #3 and #4. The simulation scenarios are shown in Table 4.
Each case was studied with no compensation, the FSC compensation, and TCSC compensation, and all results are shown in Figure 10, Figure 11, Figure 12, Figure 13 and Figure 14. In the figures, the mechanical damping constants of the nuclear generator units #3 and #4 with the torsional frequencies of modes 1 and mode 2 are given. The oscillation modes 3 and 4 have large values of the mechanical damping as 18.52 p.u and 17.22 p.u, respectively, so they were neglected in the figures. These values are negative of the mechanical damping in range of [fm − 1 Hz, fm + 1 Hz] with each torsional frequency. The risk of the SSR can be easily seen from the graphs, the SSR occur if any part of the electrical (De) line extends below the mechanical (Dm) line.

4.1. Normal Operation of the 345 kV Power Network

The simulation results of normal operation for the 345 kV power network are shown in Figure 10a. The figure shows the normal operation of the system in cases of no compensation and compensated by the FSC or TCSC. In that case, the FSC and TCSC were set as 50% of the compensation level. In Figure 10a, it can be seen that the electrical damping in the study power network with the FSC or TCSC compensations is similar to the no compensation case, and the total of the electrical and mechanical damping are positive for all cases. These results confirmed that in the normal operation condition, the system was stable with TCSC installation.

4.2. Sensitive Cases of the 345 kV Power Network

In this section, two sensitive simulation cases (case 2 and case 3) were performed to quantify the effects of the FSC and TCSC on the SSR behavior. The case 2 disconnected one line between two buses 5151–5152, and the case 3 disconnected all transmission lines between buses 5151−5152 and 5151−5150. The case 3 (worst case) is unlikely to occur, but it was defined to analyze any potential issues. In this case, the system becomes radial as seen from the Hanul nuclear power plant #3 and #4 to the compensated transmission line. If the TCSC operation destabilized the torsional mode of the Hanul nuclear power plant, it would be more likely to occur under this worst case.
Figure 10b shows the first sensitive case of the 345 kV power network. As a result, one transmission line between two buses 5151−5152 was disconnected but it did not affect the electrical damping. All the results were also similar to the base case in Figure 10a, there was not any risk of the SSR when one line between two buses 5151−5152 was disconnected. There is a different electrical damping characteristic of FSC compensation at 60 Hz due to a result of the electrical torque increased rapidly in case of disconnecting one transmission line. As compared in Figure 10, the plots of electrical damping in normal operation and the outage of one line nearby the Hanul nuclear power plant are the same with no compensation on the line. That means the series compensation cannot affect the SSR problem in the power network even one−line outage condition.
In the second sensitive simulation case, all transmission lines between buses 5151−5152 and 5151−5150 were disconnected. This is a radial system, as seen from the considered generator to the compensation line. As shown in Figure 11, in case of without any compensation, the electrical damping is positive. But in the case of 50% FSC compensation level, there is a negative point of the electrical damping at 39 Hz. In this case, the impedance Z() of the electrical system is shown in Figure 12. The system reactance is zero at an electrical resonance frequency of 21 Hz, which corresponds to 39 Hz at the rotor frame frequency.
The red line in the Figure 11 describes the TCSC compensation level of 50%. It can be seen that at 39 Hz, the electrical damping is also around zero which is the same as without compensation, this shows the advantage of the SVR control method. In the frequency range [5 Hz, 20 Hz] of the TCSC compensation, the electrical damping curve has negative points, but this is also higher than the mechanical damping, that means no risk of the SSR with the TCSC compensation. The simulation results of the system with different FSC compensation levels are shown in Figure 13. When the compensation levels were increased from 50% to 70% with the increment of 5%, the electrical damping was deeper more than normal operation at 50% compensation level. The difference with the FSC compensation, the electrical damping in case of the TCSC compensation, as shown in Figure 14 has not been affected by the compensation levels. As the concept of the SVR control, the TCSC appearance impedance changes to the transient zone and become inductive impedance in the range from 40 Hz to 60 Hz of electrical frequency. So, it can be seen in Figure 11, the electrical damping was negative from 6 Hz to 25 Hz of mechanical frequency, but all of them are higher than mechanical damping curve, i.e., there is no risk of the SSR with the TCSC compensation. Two sensitive simulation results confirmed that the system was stable with TCSC compensation. The detailed data of net damping of all different TCSC compensation levels in different cases were listed in Table 5.

5. Conclusions

This study analyzed the SSR problem in the case of installing TCSC in a Korean power system. In order to verify the effect of the TCSC introduced in a 345 kV transmission network for the first time in Korea, the analysis results of the SSR behavior are presented in the case of FSC and TCSC compensations. The detailed design of the TCSC was carried out with the calculated capacitor values of 198.94 μF and 186.93 μF for ShinYoungju-Hanul and ShinJecheon-Donghae, respectively. The inductor was chosen to be equal to 5.23 mH for the two transmission lines. We implemented the TCSC with SVR controller and confirmed the performance of the controller by injecting DC and sub frequency current. The Hanul nuclear power plant #3 and #4 were selected as target generators. The torsional frequency and mode shaft were also analyzed to show the interaction when the oscillation mode was excited.
Based on the time domain simulation software PSCAD/EMTDC, the test signal injection, one of the frequency scanning methods, has been applied to perform the electrical damping of the system within the sub−frequency range from 5 Hz to 55 Hz. Simulation of the basic case and two sensitive cases of the power network were performed with different types of compensation and the compensation level from 50% to 70%. There was no risk of SSR in normal case and the first sensitive operation. However, when the Hanul nuclear power plant was radially connected to the compensated transmission line, an SSR occurred at around 35 Hz to 39 Hz of the rotor frame frequency with the FSC compensation. Nonetheless, the TCSC with the SVR control method avoided the risk point. The results obtained in this study can be effectively applied to the TCSC installations in real power networks in the future.

Author Contributions

Conceptualization and investigation M.-Q.T. and M.-C.D.; visualization, S.-J.L.; software, J.-I.L.; writing—original draft preparation and editing, M.-Q.T.; supervision, M.P.; funding acquisition, C.H.L. and J.Y.

Funding

This work was funded by Korea Electric Power Corporation.

Conflicts of Interest

The authors declare no conflict of interest.

Appendix A

Table A1. Data of transmission line for the modified Korean power network.
From BusTo BusLength [km]R [p.u]X [p.u]B [p.u]
5750570067.850.000950.017280.42727
5700560097.500.001440.025040.60843
5700550076.700.001130.019440.48060
5500515191.500.001350.023480.57333
515151501.160.000040.020680.01701
5150535018.080.000270.014160.11328
535056006.600.000890.000790.37672
Table A1 shows the per unit quantities converted based on the rating of 345 kV and 100 MVA.
Table A2. Generator impedance and time constant of Hanul nuclear unit #3 and #4.
DescriptionSymbolValueUnit
Unsaturated d-axis synchronous reactanceXd1.998[p.u]
Unsaturated d-axis transient reactanceX’d0.49[p.u]
Unsaturated d-axis transient timeT’d09.5[s]
Unsaturated d-axis sub−transient reactanceX’’d0.47[p.u]
Unsaturated d-axis sub−transient timeT’’d00.032[s]
Unsaturated q-axis synchronous reactanceXq1.61[p.u]
Unsaturated q-axis transient reactanceX’q0.617[p.u]
Unsaturated q-axis transient timeT’q00.78[s]
Unsaturated q-axis sub−transient reactanceX’’q0.47[p.u]
Unsaturated q-axis sub−transient timeT’’q00.047[s]

References

  1. Joshi, S.R.; Kulkarni, A.M. Analysis of SSR Performance of TCSC Control Schemes Using a Modular High Bandwidth Discrete-Time Dynamic Model. IEEE Trans. Power Syst. 2009, 24, 840–848. [Google Scholar] [CrossRef] [Green Version]
  2. Johansson, N.; Angquist, L.; Nee, H. A Comparison of Different Frequency Scanning Methods for Study of Subsynchronous Resonance. IEEE Trans. Power Syst. 2011, 26, 356–363. [Google Scholar] [CrossRef]
  3. Han, Y.; Shi, W. Frequency response of the thyristor controlled series capacitor. In Proceedings of the International Conference on Power System Technology, Kunming, China, 13–17 October 2002; Volume 1893, pp. 1895–1897. [Google Scholar]
  4. Fan, Z.; Zheng, X. SSR damping study on a generator connected to TCSC. In Proceedings of the IEEE PES Power Systems Conference and Exposition, New York, NY, USA, 10–13 October 2004; Volume 672, pp. 673–678. [Google Scholar]
  5. Mohammadpour, H.A.; Santi, E. Sub-synchronous resonance analysis in DFIG-based wind farms: Mitigation methods—TCSC, GCSC, and DFIG controllers—Part II. In Proceedings of the 2014 IEEE Energy Conversion Congress and Exposition (ECCE), Pittsburgh, PA, USA, 14–18 September 2014; pp. 1550–1557. [Google Scholar]
  6. Kakimoto, N.; Phongphanphanee, A. Calculation of damping torque of power systems compensated with TCSC. Electr. Eng. Japan 2003, 143, 39–49. [Google Scholar] [CrossRef]
  7. Lei, X.; Buchholz, B.; Povh, D. Analysing subsynchronous resonance phenomena in the time- and frequency domain. Eur. Trans. Electr. Power 2007, 10, 203–211. [Google Scholar] [CrossRef]
  8. Baker, D.H.; Boukarim, G.E.; Aquila, R.D.; Piwko, R.J. Subsynchronous resonance studies and mitigation methods for series capacitor applications. In Proceedings of the 2005 IEEE Power Engineering Society Inaugural Conference and Exposition in Africa, Durban, South Africa, 11–15 July 2005; pp. 386–392. [Google Scholar]
  9. Pilotto, L.A.S.; Bianco, A.; Long, W.F.; Edris, A. Impact of TCSC control methodologies on subsynchronous oscillations. IEEE Trans. Power Deliv. 2003, 18, 243–252. [Google Scholar] [CrossRef]
  10. Grunbaum, R.; Halvarsson, P.; Jones, P. Series compensation for increased power transmission capacity. In Proceedings of the 5th IET International Conference on Power Electronics, Machines and Drives, Brighton, UK, 19–21 April 2010; pp. 1–6. [Google Scholar]
  11. Ängquist, L.; Ingestrom, G.; Jonsson, A.K. Dynamical Performance of TCSC Schemes. CIGRE- 2006 14:302; ABB Power System. Available online: https://library.e.abb.com/public/11125766c267c954c1257d55004d7034/14_302e.pdf (accessed on 22 July 2019).
  12. Zhang, X.; Song, Y.; Wang, D.; Zheng, Z.; Li, G. Simulation of SSR evoked by TCSC for UHVAC transmission system from Yimin to fengtun on RTDS. In Proceedings of the International Conference on Sustainable Power Generation and Supply (SUPERGEN 2012), Hangzhou, China, 8–9 September 2012; pp. 1–7. [Google Scholar]
  13. Meikandasivam, S.; Nema, R.K.; Jain, S.K. Performance of installed TCSC projects. In Proceedings of the India International Conference on Power Electronics 2010 (IICPE2010), New Delhi, India, 28–30 January 2011; pp. 1–8. [Google Scholar]
  14. Tran, M.Q.; Lee, S.J.; Lee, J.I.; Park, M.; Yu, I.K.; Yoon, J.; Sim, H. Design and performance analysis of a TCSC for real grid application. In Proceedings of the KIEE Annual Conference 2018, Pyeongchang, Korea, 11–13 July 2018; pp. 178–179. [Google Scholar]
  15. Zhu, W.; Spee, R.; Mohler, R.R.; Alexander, G.C.; Mittelstadt, W.A.; Maratukulam, D. An EMTP study of SSR mitigation using the thyristor controlled series capacitor. IEEE Trans. Power Deliv. 1995, 10, 1479–1485. [Google Scholar] [CrossRef]
  16. Liu, Q.; Zhou, C.; Angquist, L.; Rudin, S. Using TCSC scheme for SSR mitigation in a radial transfer corridor. In Proceedings of the 2006 International Conference on Power System Technology, Chongqing, China, 22–26 October 2006; pp. 1–6. [Google Scholar]
  17. KEPCO. Technical Specification for Shin-Youngju and Shin-Jecheon; TCSC Project; KEPCO: Naju-si, Korea, 2017; Available online: http://www.alio.go.kr/informationBidView.do?seq=2335741 (accessed on 23 July 2019).
  18. Meikandasivam, S.; Nema, R.K.; Jain, S.K. Selection of TCSC parameters: Capacitor and inductor. In Proceedings of the India International Conference on Power Electronics 2010 (IICPE2010), New Delhi, India, 28–30 January 2011; pp. 1–5. [Google Scholar]
  19. Dinh, M.; Park, S.; Kim, S.; Park, M.; Yu, I. Suggestion of a novel PHILS method for operation analysis of a thyristror controlled series capacitor. In Proceedings of the 2015 IEEE 11th International Conference on Power Electronics and Drive Systems, Sydney, NSW, Australia, 9–12 June 2015; pp. 715–720. [Google Scholar]
  20. Qianjin, L.; Changchun, Z.; Angquist, L.; Rehtanz, C. A novel active damping control of TCSC for SSR suppression in a radial corridor. In Proceedings of the 2008 Third International Conference on Electric Utility Deregulation and Restructuring and Power Technologies, Nanjing, China, 6–9 April 2008; pp. 136–142. [Google Scholar]
  21. Ängquist, L. Synchronous Voltage Reversal Control of Thyristor Controlled Series Capacitor. Ph.D. Thesis, KTH Royal Institute of Technology, Department of Electrical Engineering, Stockholm, Sweden, 2002. [Google Scholar]
  22. Kundur, P. Power System Stability and Control; McGraw-Hill: New York, NY, USA, 1994. [Google Scholar]
  23. Harnefors, L. Proof and Application of the Positive-Net-Damping Stability Criterion. IEEE Trans. Power Syst. 2011, 26, 481–482. [Google Scholar] [CrossRef]
  24. Prabhu, N.; Padiyar, K.R. Investigation of Subsynchronous Resonance With VSC-Based HVDC Transmission Systems. IEEE Trans. Power Deliv. 2009, 24, 433–440. [Google Scholar] [CrossRef]
  25. Das, M.K.; Kulkarni, A.M.; Darji, P.B. Comparison of DQ and Dynamic Phasor based frequency scanning analysis of grid-connected Power Electronic Systems. In Proceedings of the 2016 Power Systems Computation Conference (PSCC), Genoa, Italy, 20–24 June 2016; pp. 1–7. [Google Scholar]
Figure 1. Simplified 345 kV transmission system with thyristor-controlled series capacitors (TCSCs) compensation.
Energies 12 02847 g001
Figure 2. The TCSC design flow chart.
Energies 12 02847 g002
Figure 3. The synchronous voltage reversal (SVR) control strategy.
Energies 12 02847 g003
Figure 4. The TCSC-SVR operation with a DC current injection.
Energies 12 02847 g004
Figure 5. The TCSC-SVR operation with a sub-frequency sine wave current injection.
Energies 12 02847 g005
Figure 6. Structure of units #3 and #4 multi-mass shaft system model. HP: high-pressure; IP: intermediate pressure; LP-A, LP-B: low-pressure; GEN: generator.
Energies 12 02847 g006
Figure 7. Rotor natural frequencies and mode shapes of the units #3 and #4.
Energies 12 02847 g007
Figure 8. Relationship between the electrical and mechanical system.
Energies 12 02847 g008
Figure 9. A model for subsynchronous resonance (SSR) analysis using a multi−sine signal injection.
Energies 12 02847 g009
Figure 10. Comparison of De for different types of compensation of no compensation, fixed series capacitor (FSC), and TCSC compensation: (a) The compensation of De for case 1; (b) The compensation of De for case 2.
Energies 12 02847 g010
Figure 11. Comparison of De for a different type of compensations in case 3.
Energies 12 02847 g011
Figure 12. Frequency spectrum of the impedance of network in case of 50% FSC.
Energies 12 02847 g012
Figure 13. Comparison of De for different FSC compensation levels in case 3.
Energies 12 02847 g013
Figure 14. Comparison of De for different TCSC compensation levels in case 3.
Energies 12 02847 g014
Table 1. The TCSCs parameters for ShinYoungju-Hanul and ShinJecheon-Donghae transmission lines.
ItemsShinYoungju-HanulShinJecheon-Donghae
Inductor [mH]5.235.23
Capacitor [μF]198.94186.93
Table 2. The mechanical data of Hanul nuclear generator units #3 an #4 for shaft model calculation.
MassInertial
[kg.m2]
ShaftStiffness
[106 N.m/rad]
113,0401–2218.51
280,8602–3356.20
381,7003–4638.32
482,9804–5447.23
5114,800--
Table 3. The shaft model parameters of Hanul nuclear generator units #3, #4 for the SSR analysis.
ModeEigenvaluesfm [Hz]Hm [s]Dm [p.u]
0−0.0919 ± j5.2 × 10−705.441.09
1−0.0412 ± j52.40398.33.930.79
2−0.0443 ± j92.006214.67.291.46
3−0.0213 ± j139.59622.292.618.52
4−0.0419 ± j149.38723.886.117.22
Table 4. The simulation scenarios for the subsynchronous resonance analysis.
Simulation ScenariosBus 5151–Bus 5152Bus 5151–Bus 5150
CasesLine 1Line 2Line 1Line 2
1 (normal operation)ConnectedConnectedConnectedConnected
2 (disconnected one line)ConnectedDisconnectedConnectedConnected
3 (worst case)DisconnectedDisconnectedDisconnectedDisconnected
Table 5. Net damping of different TCSC compensation levels in different cases.
CaseModeCompensation Level [%]
5055606570
111.255281.257981.257981.258451.25769
21.483281.486751.486761.48791.48668
318.597218.593418.5934418.590618.5919
417.250017.252517.2525117.253917.2531
211.249811.25651.25651.254051.25193
21.478071.481311.481311.480161.47926
318.590918.591418.591418.591418.5912
417.244817.245217.245217.245517.2453
310.578170.509290.460840.671780.62506
20.963320.904980.865611.199981.01243
318.404218.381418.367418.492818.4364
417.112417.100117.079717.235117.1368

