Optimal Investment Strategies for Solar Energy Based Systems


Abstract
:
1. Introduction
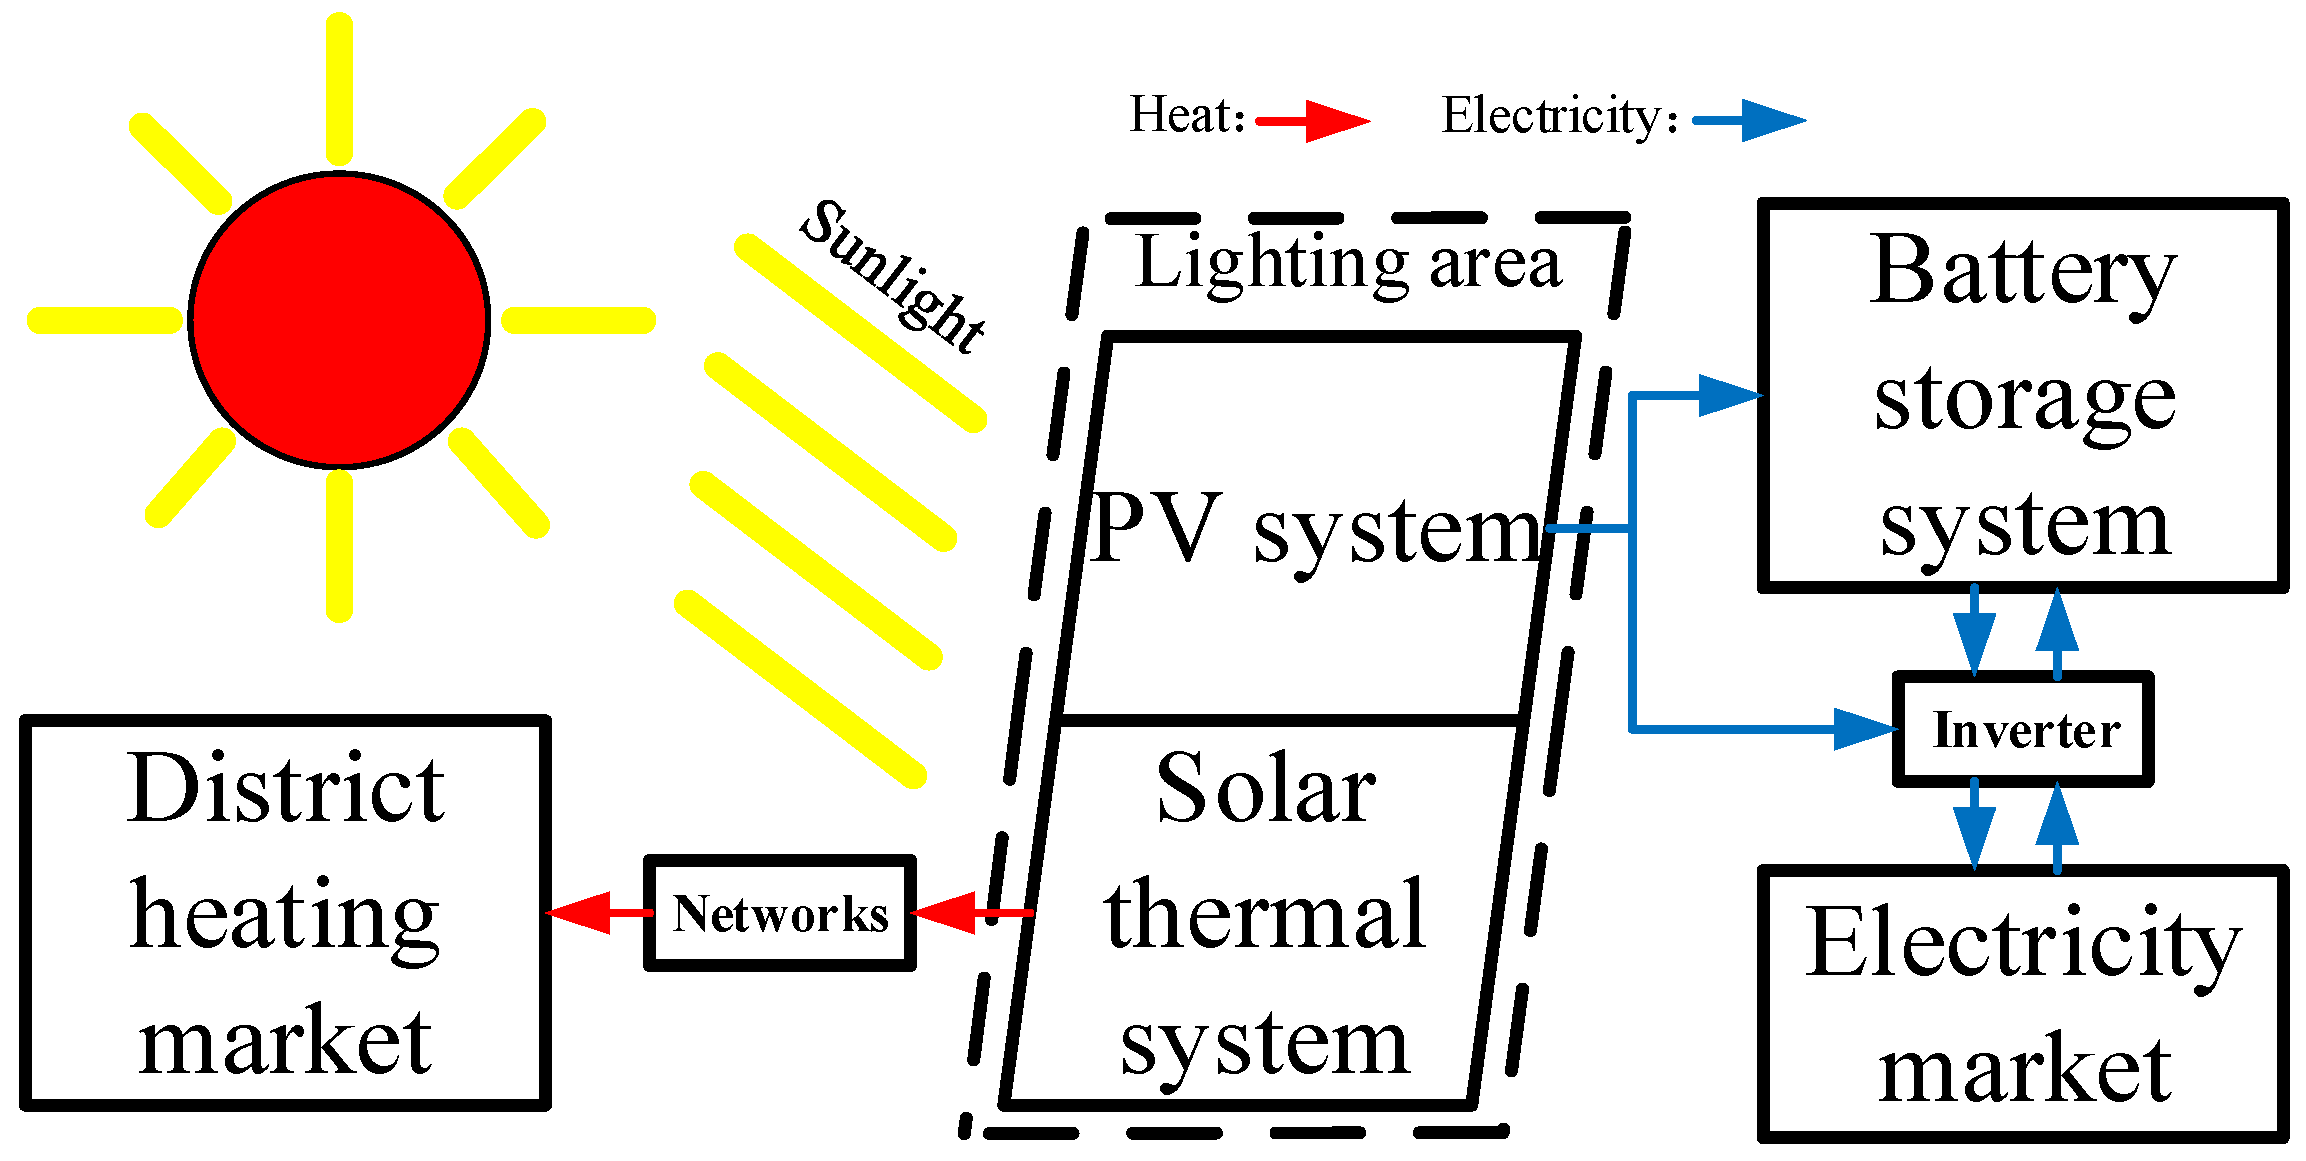
2. System Models
2.1. Photovoltaic System Model
2.2. Battery System Model
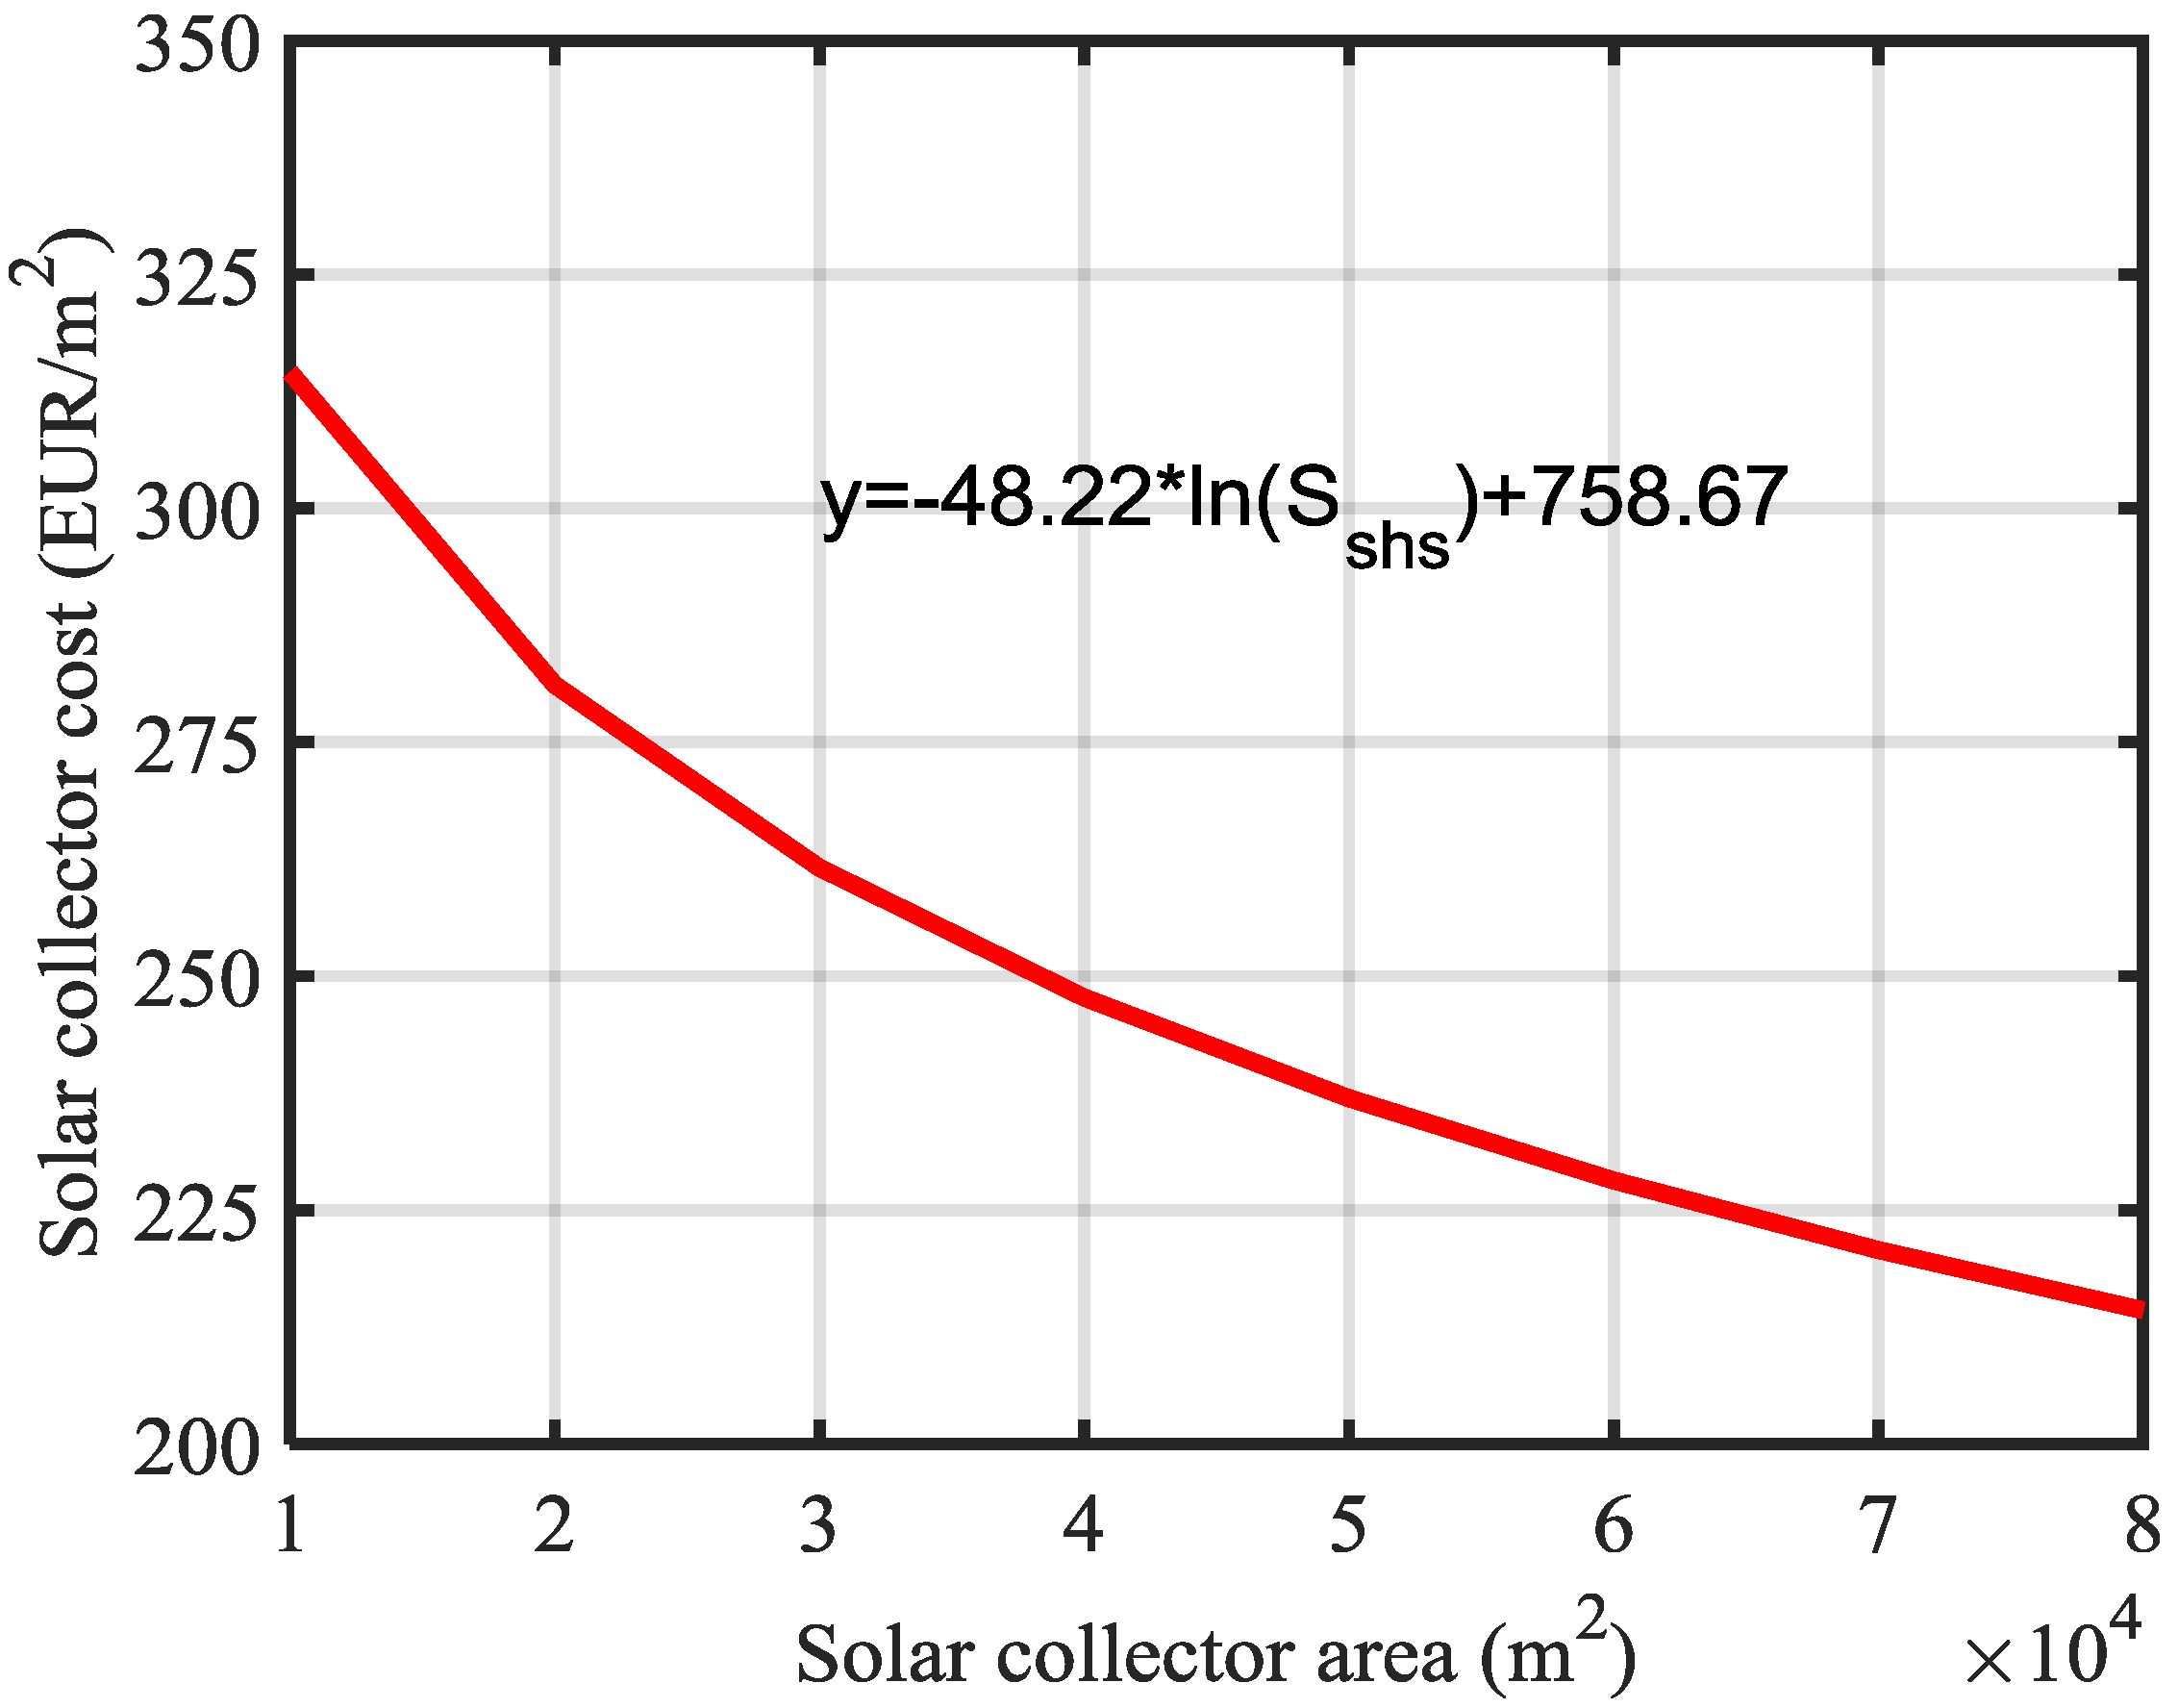
2.3. Solar Heating System Model
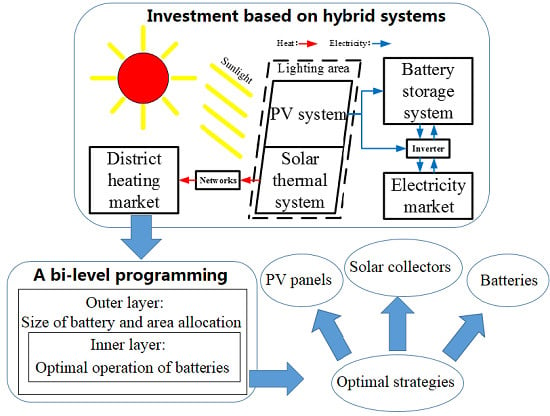
3. Optimization Methods
3.1. Optimization Methodology
3.1.1. Sequential Quadratic Programming (SQP) Method
3.1.2. Particle Swarm Optimization (PSO)
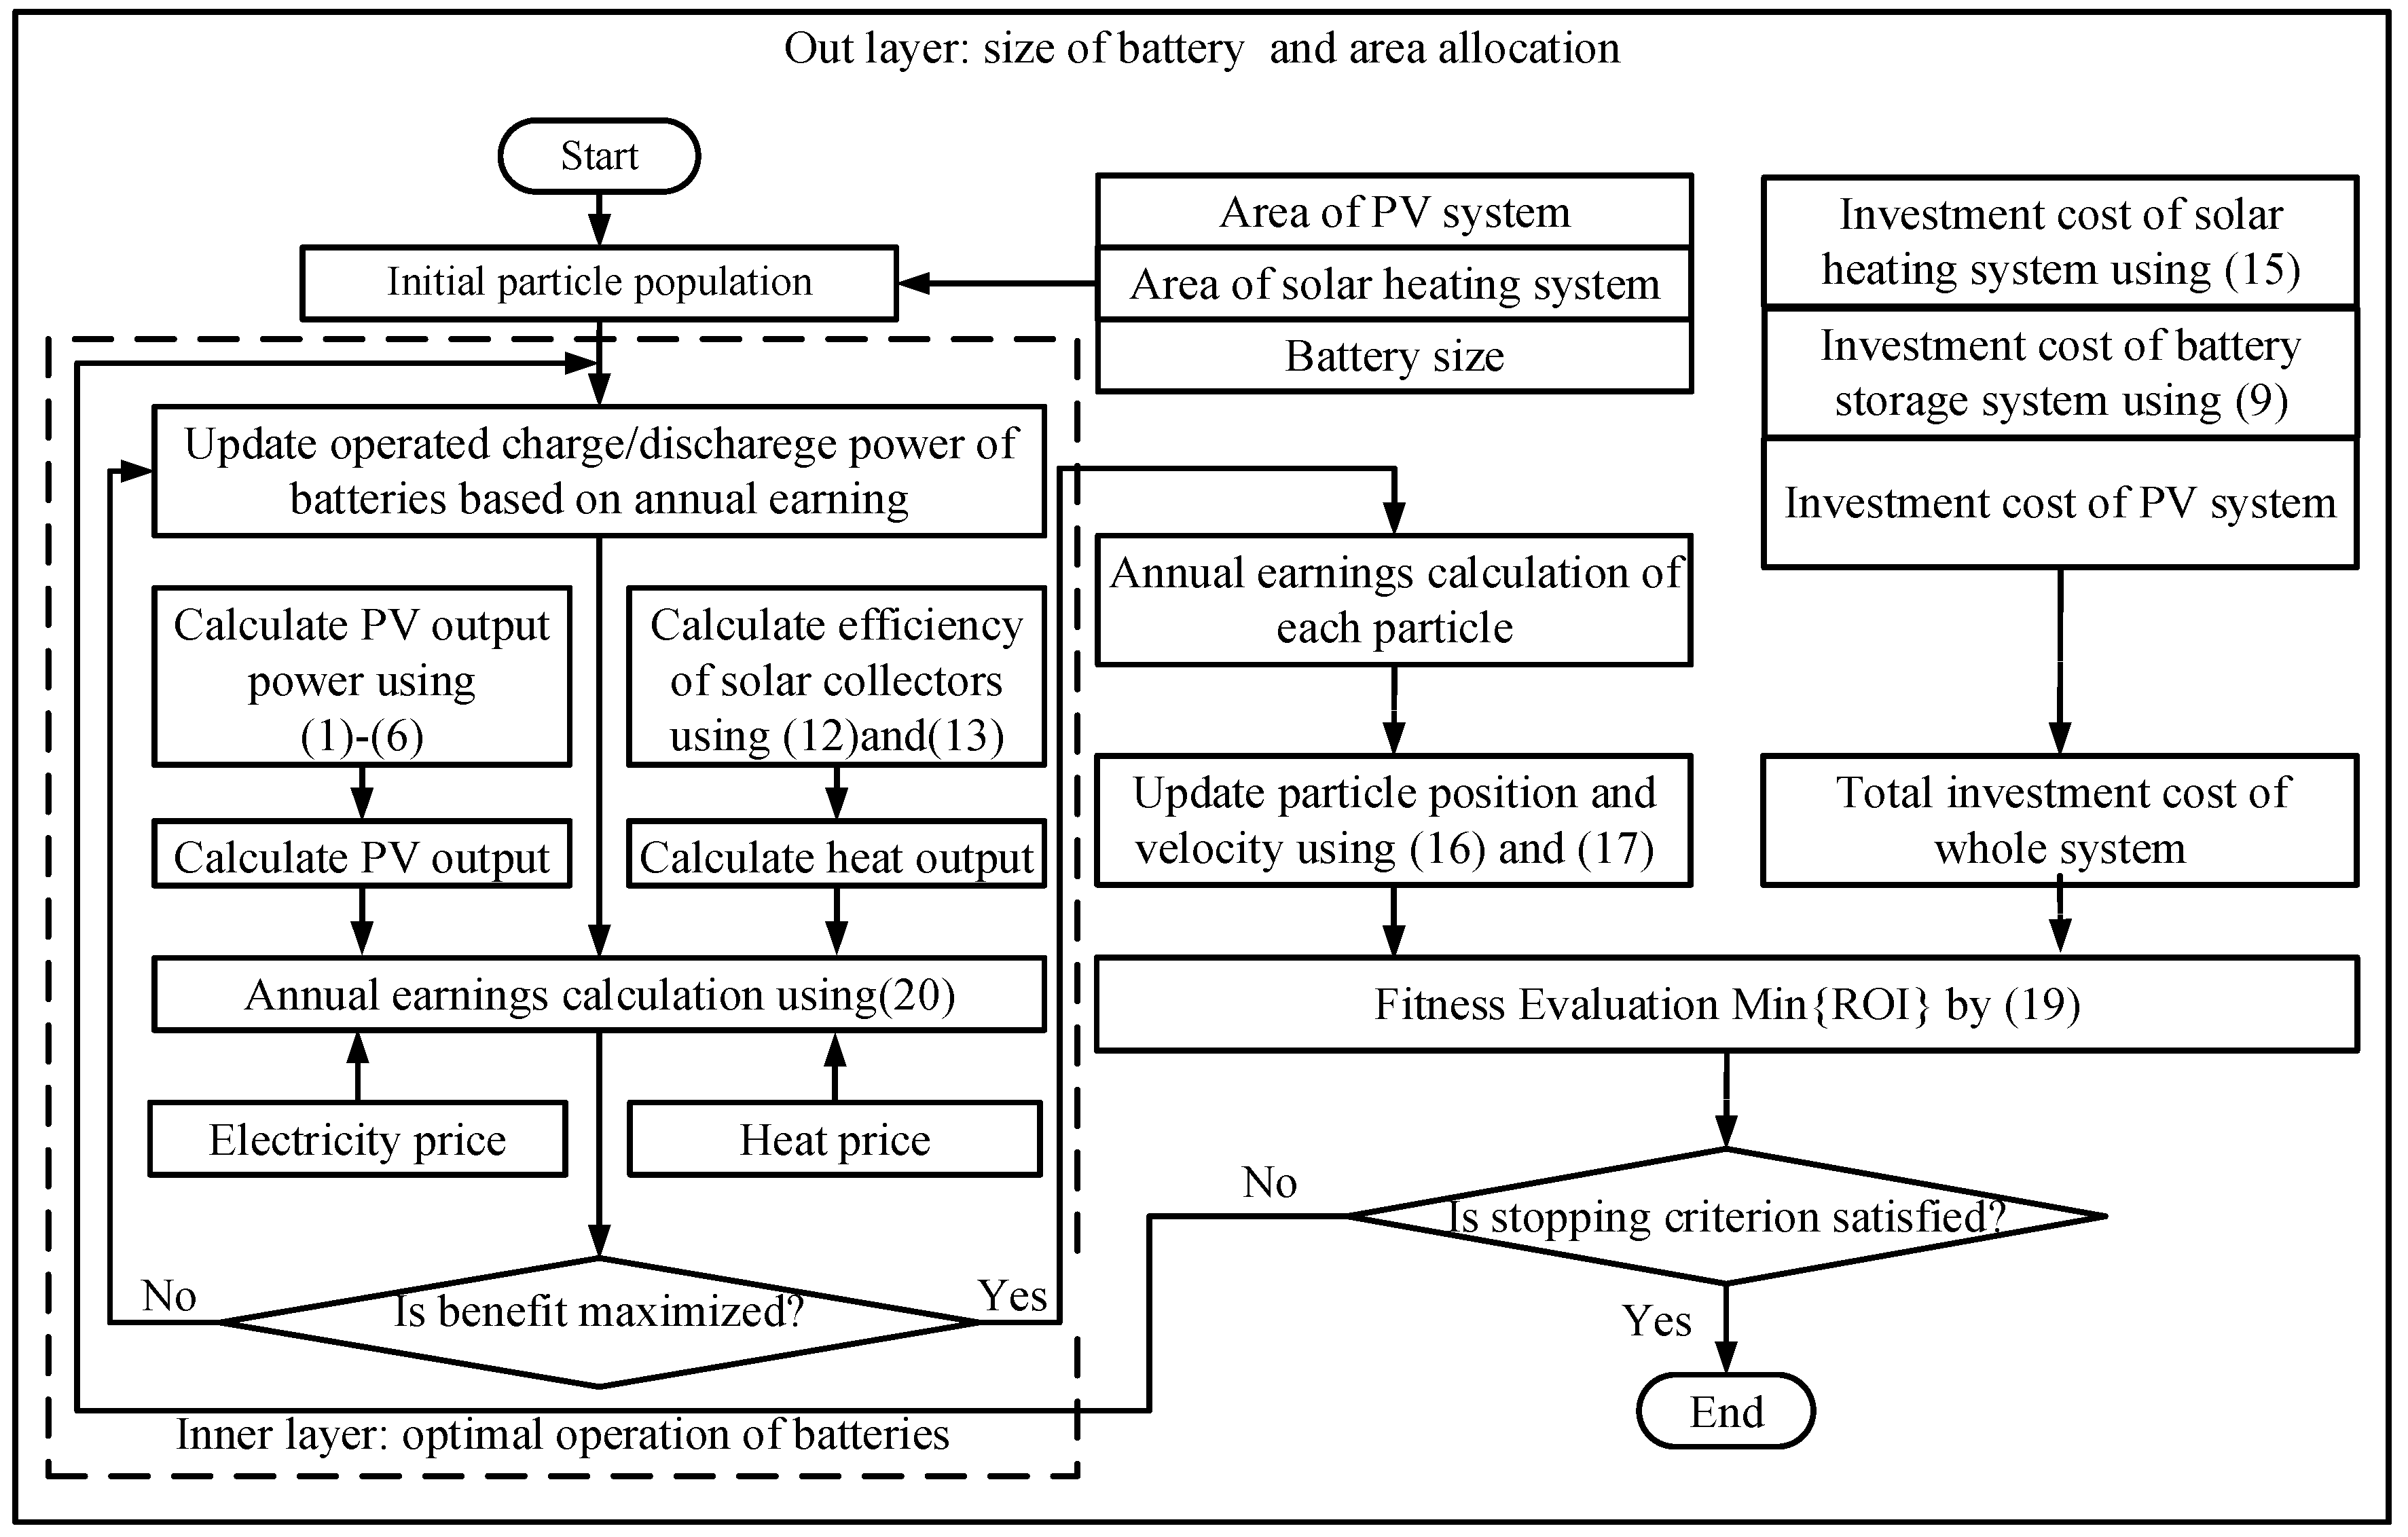
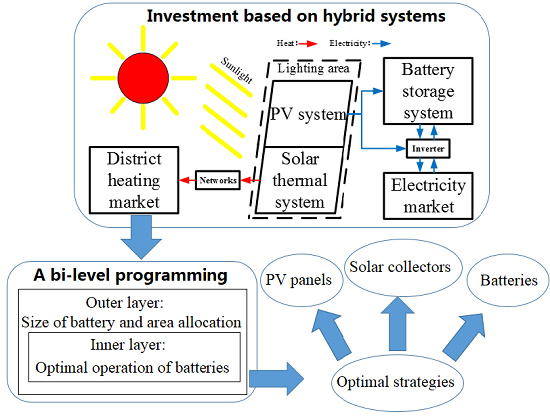
3.2. Optimization Approach
3.2.1. Outer Layer Optimization
3.2.2. Inner Layer Optimization
3.3. Assumptions
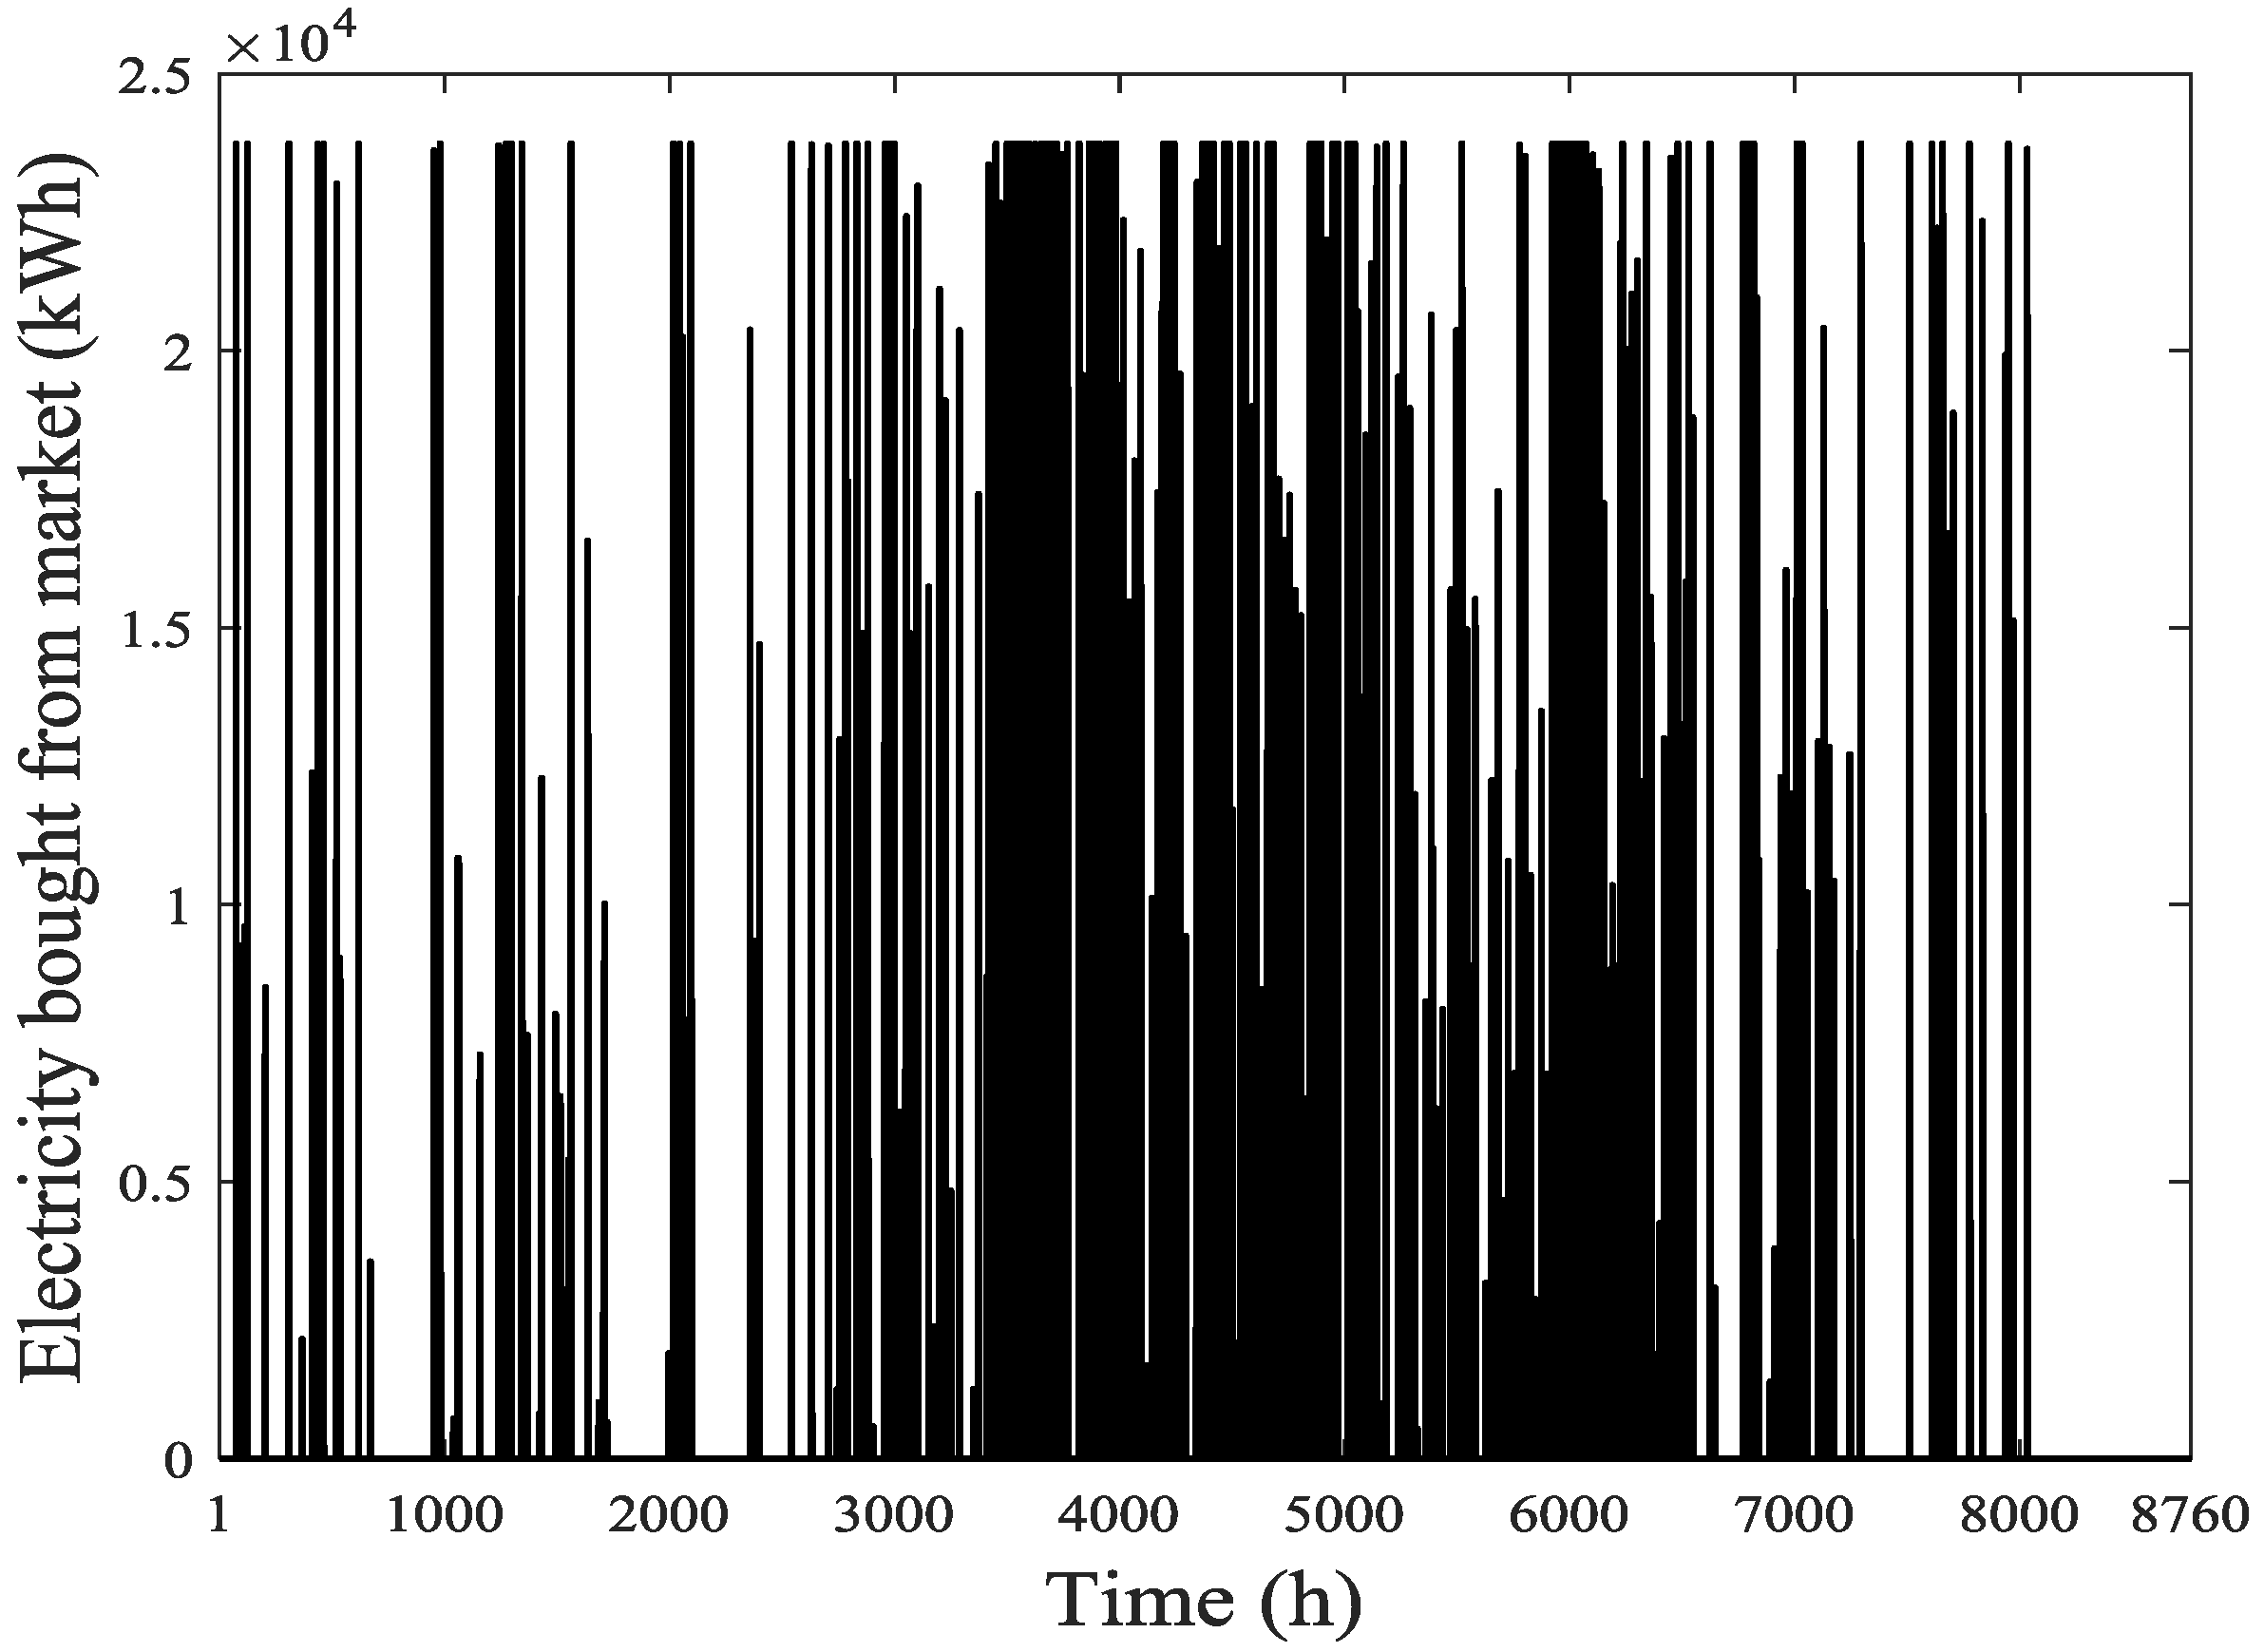
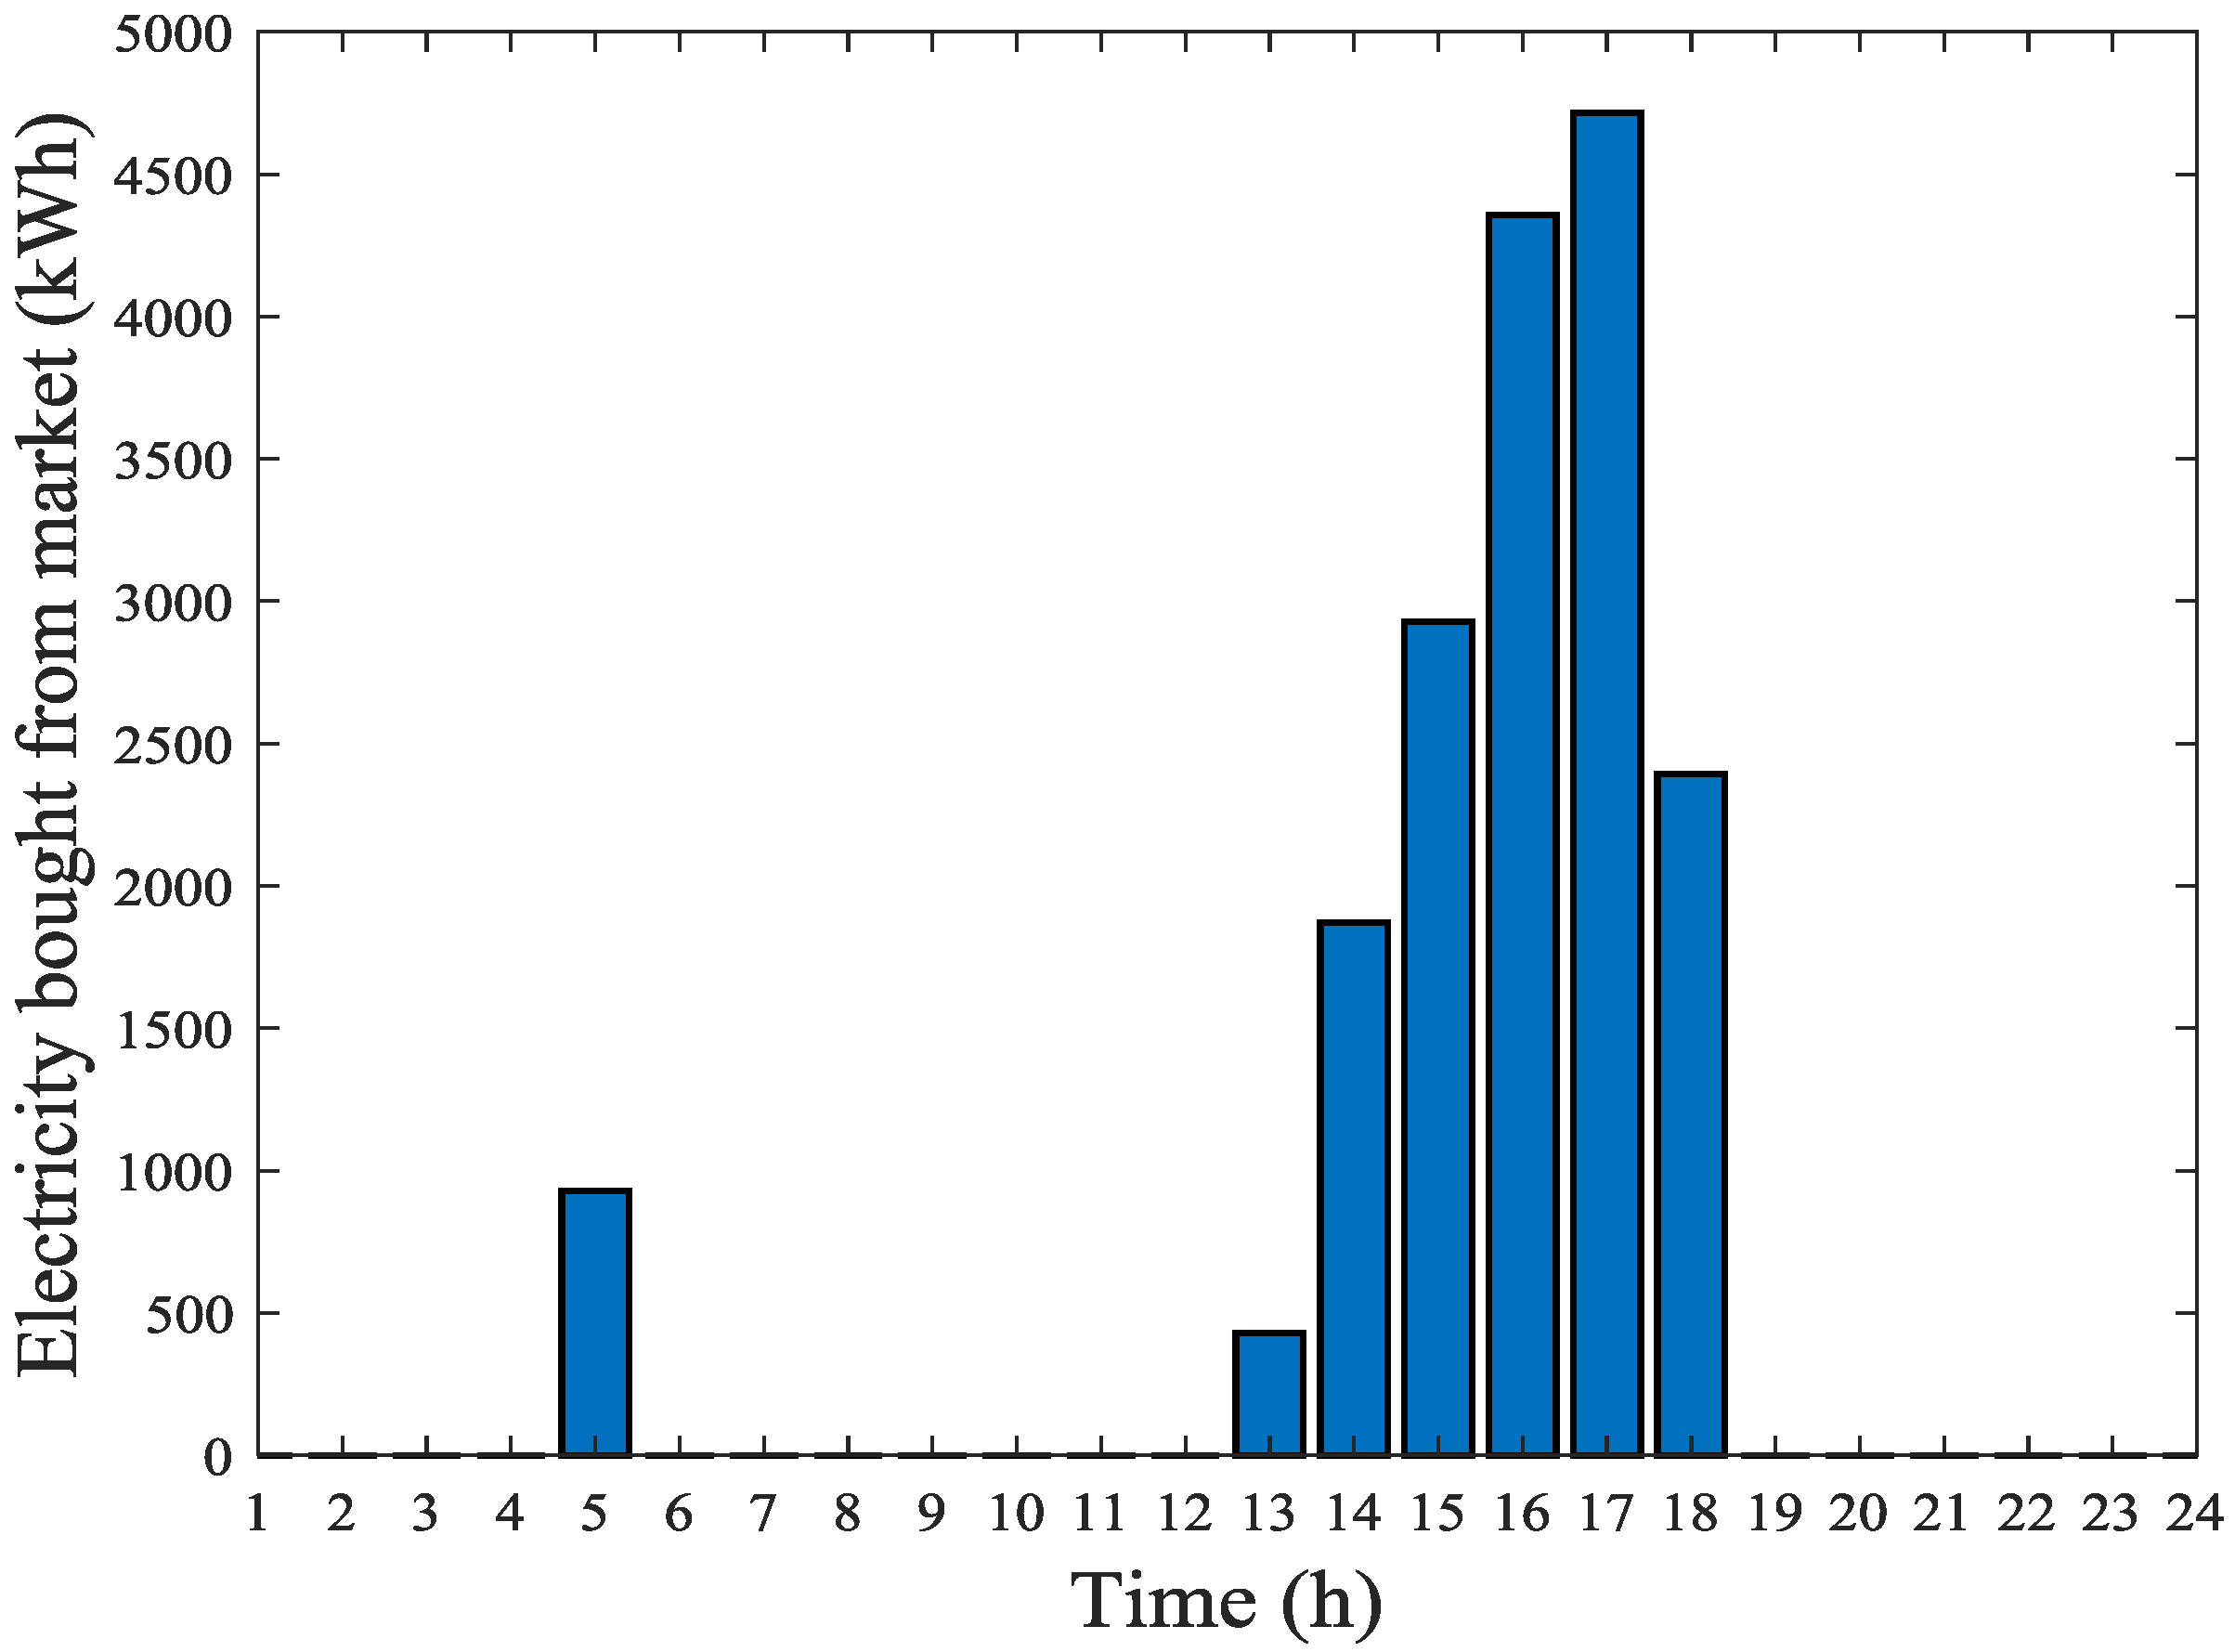
- Buying electricity from the electricity market is considered in the optimization of batteries. The energy in batteries are from the PV system and electricity market. Due to the impact of taxes, the price of buying electricity is assumed to be 1.2 times of price in the electricity market. The price of selling electricity is equal to the price in the electricity market.
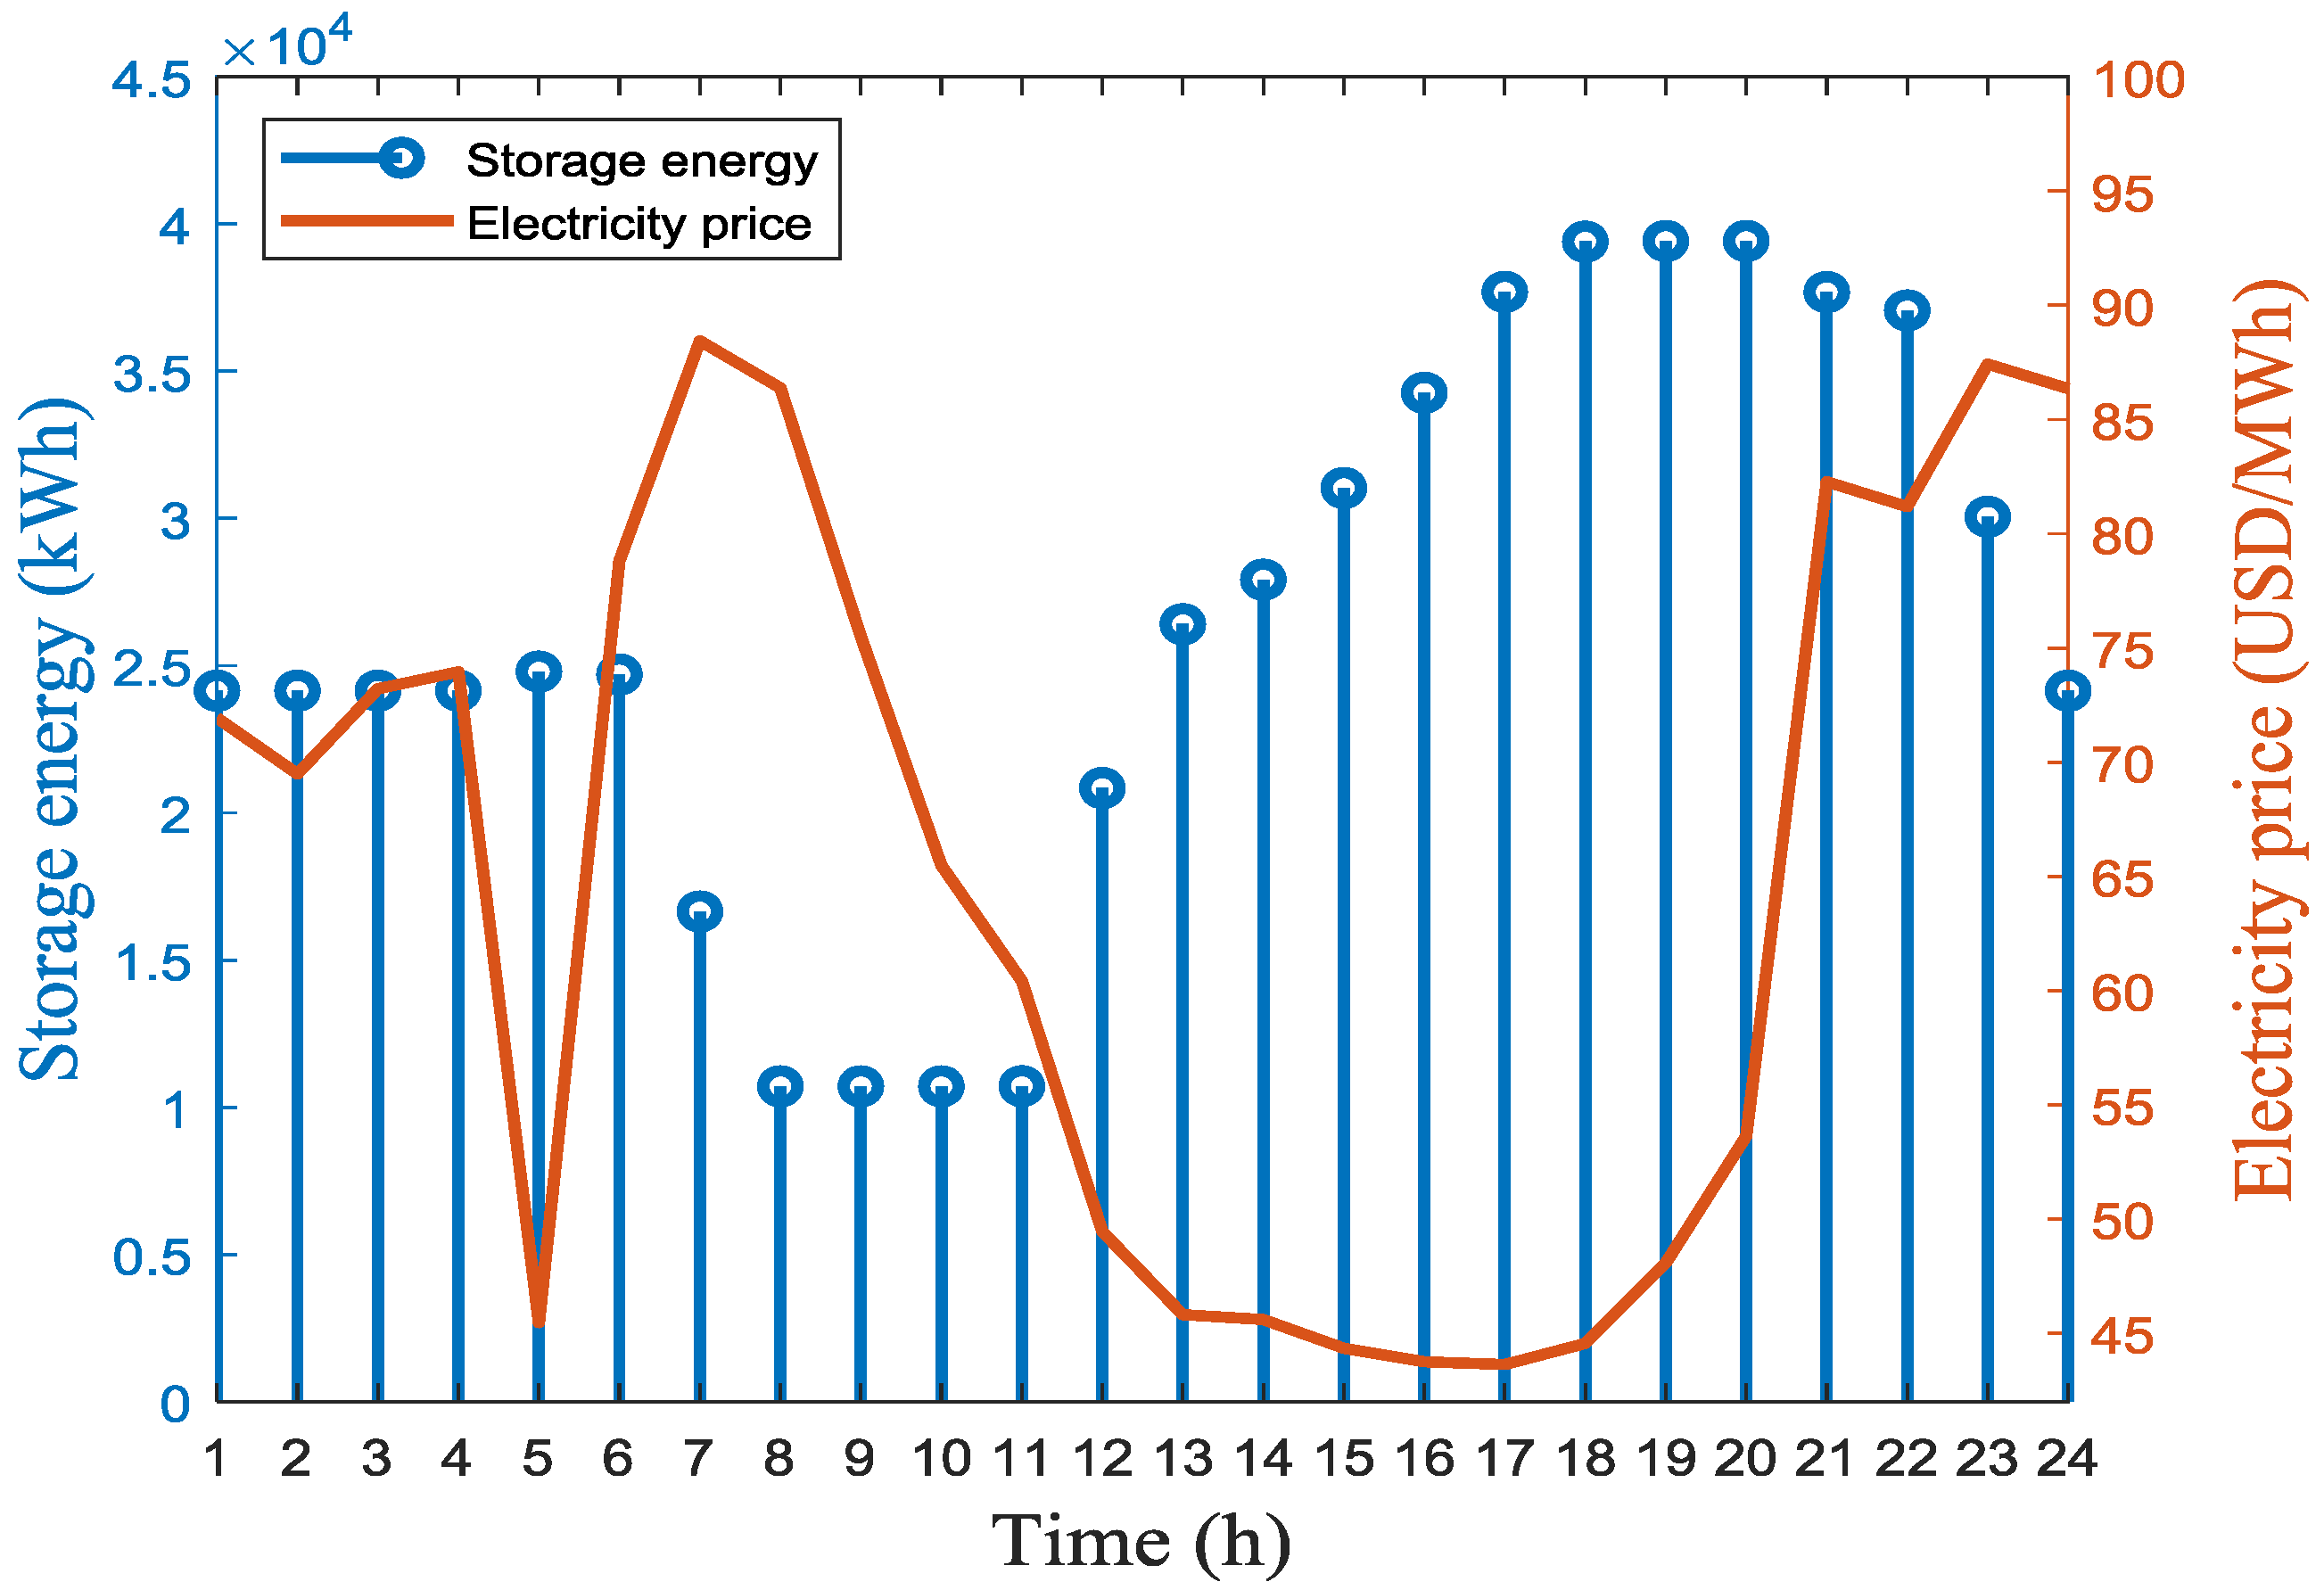
- The charge/discharge power of the BESS is small, and it is assumed that the spot prices are not changed by the operation of the BESS. At the beginning of a day, the state charge of batteries is assumed to be 50%. The storage energy in batteries should be more than 50% at the end of the day.
- The heat produced by solar is supposed to be sold to the heat market. In order to simplify the model, regulated market is chosen as the DH market. Its price is assumed as a constant (10 USD/GJ in this paper). The trade of heat will not change the heat price. Without considering demand and price fluctuation, heat storage is not involved in this paper.
- The construction area is assumed to be 100,000 m2 including solar thermal collectors and PV. The room for batteries is not considered, because they do not occupy the field for receiving light.
4. Case Study
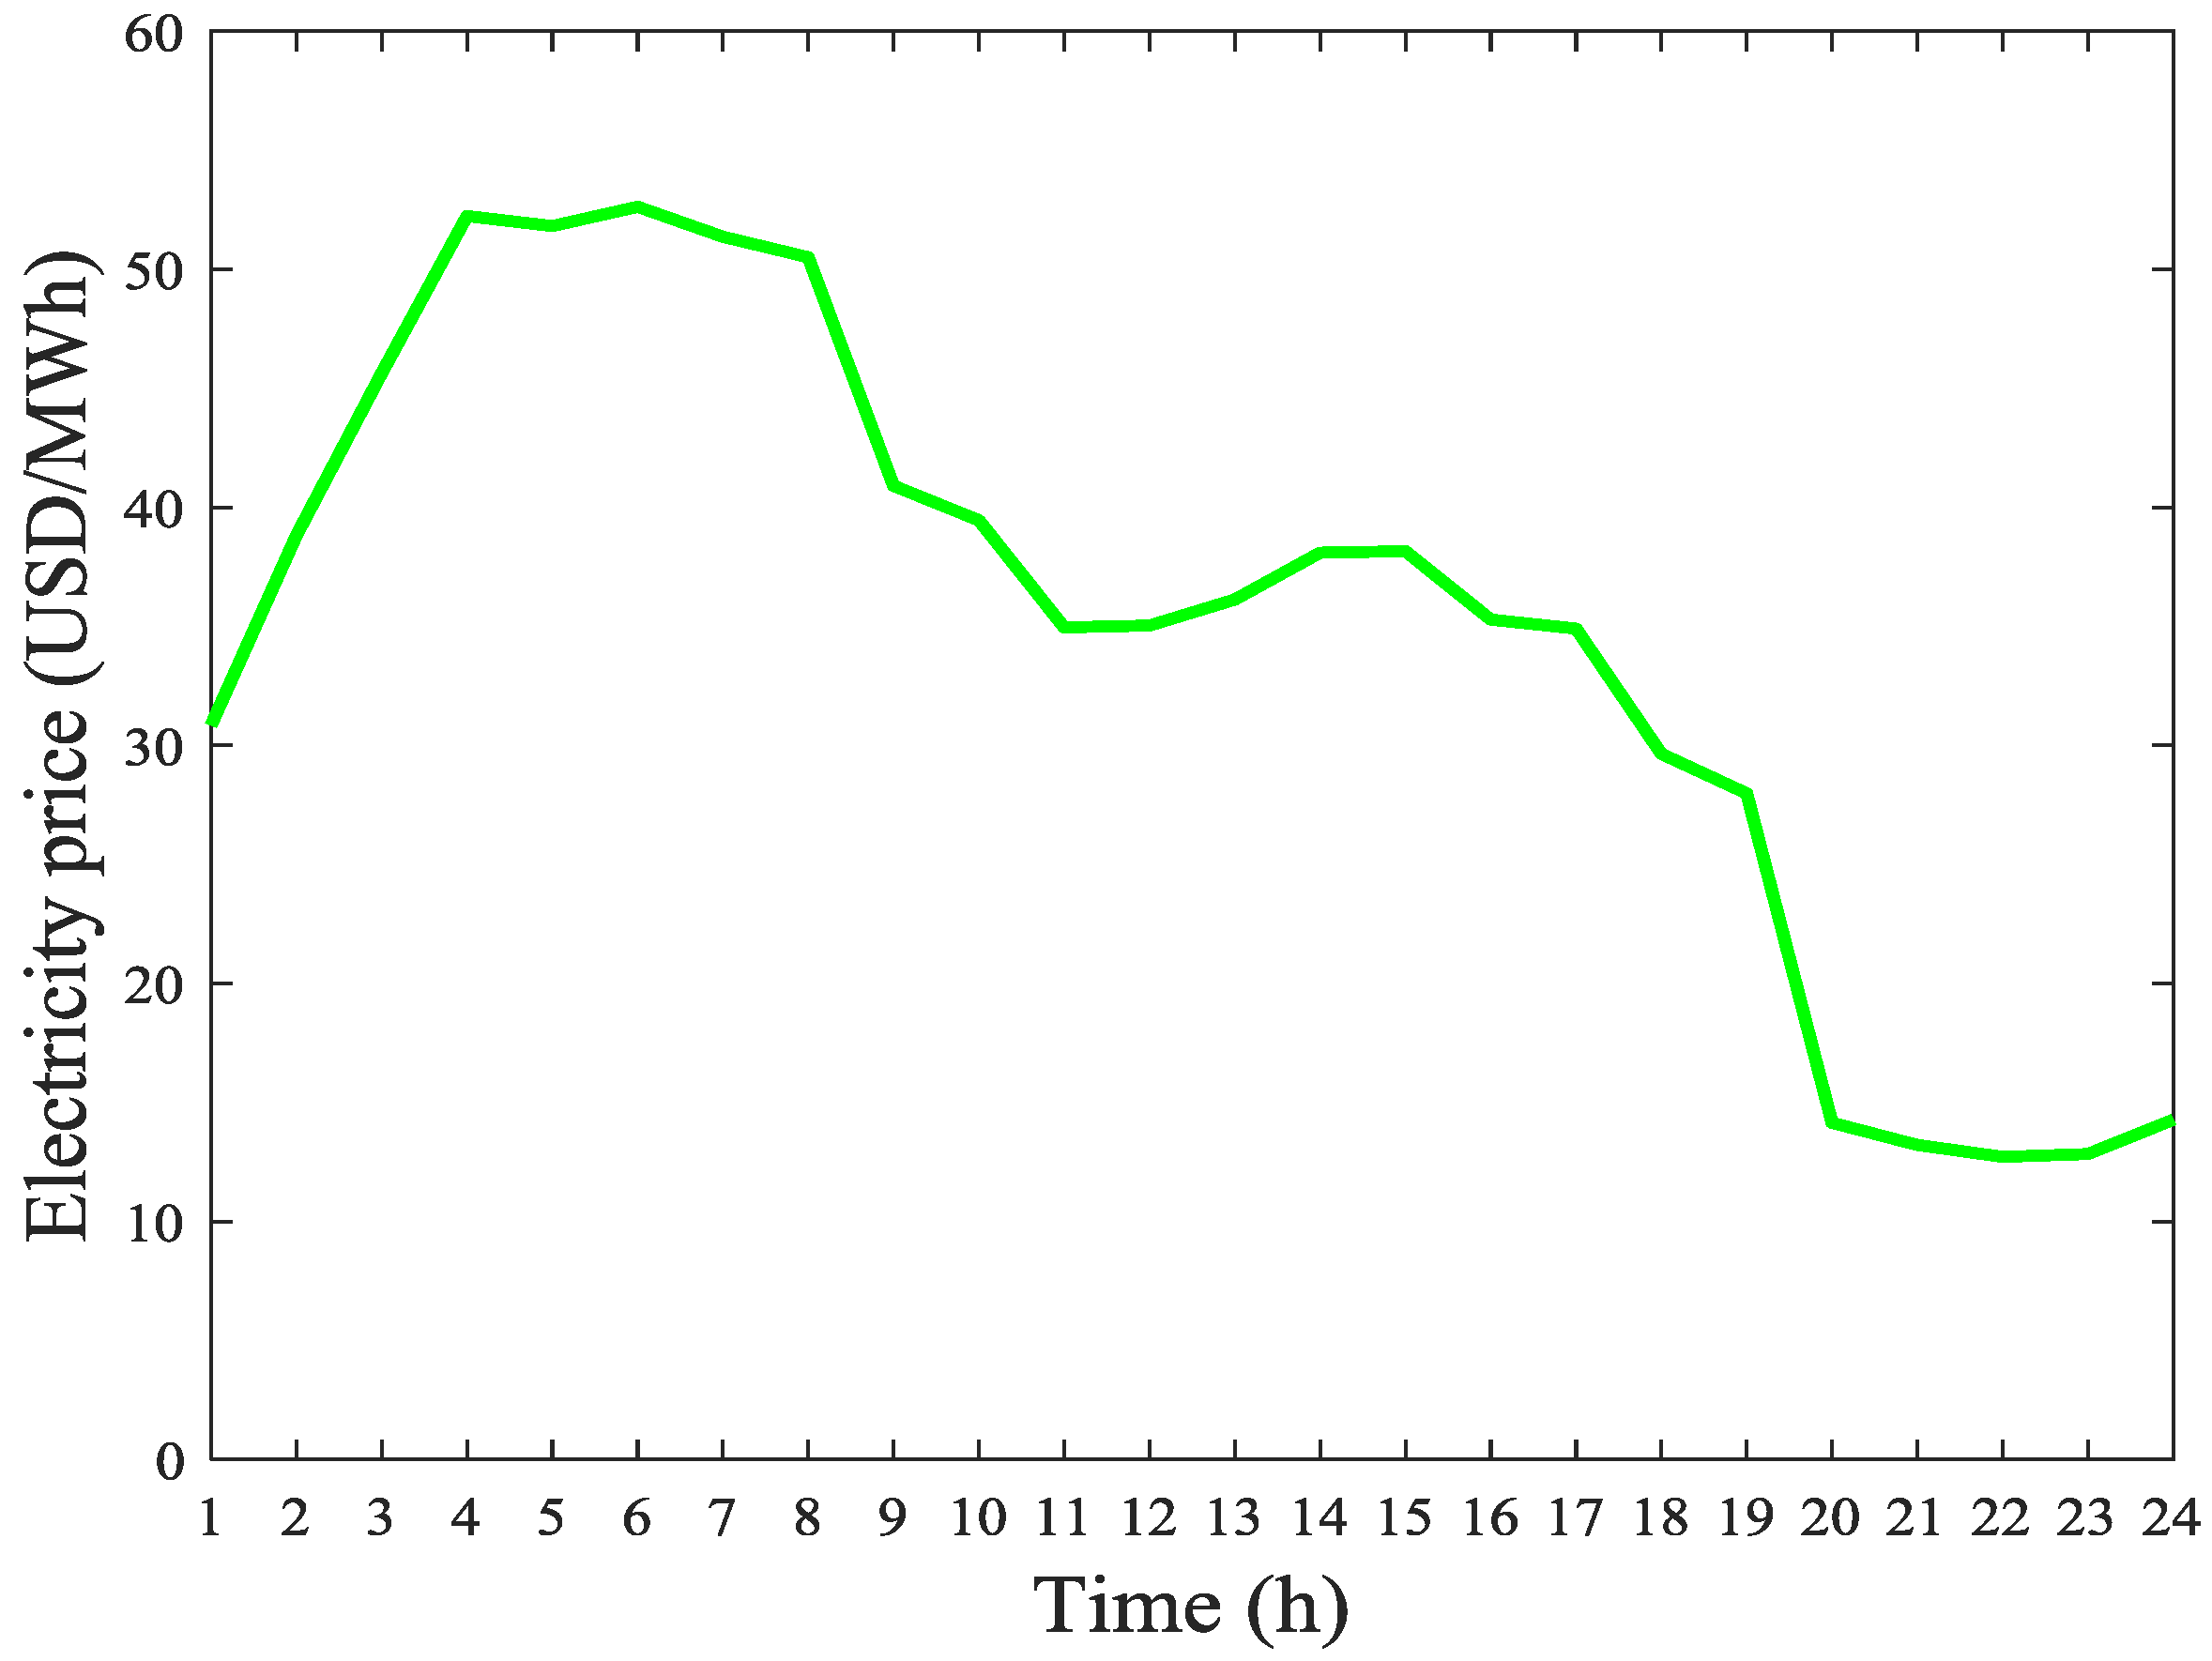
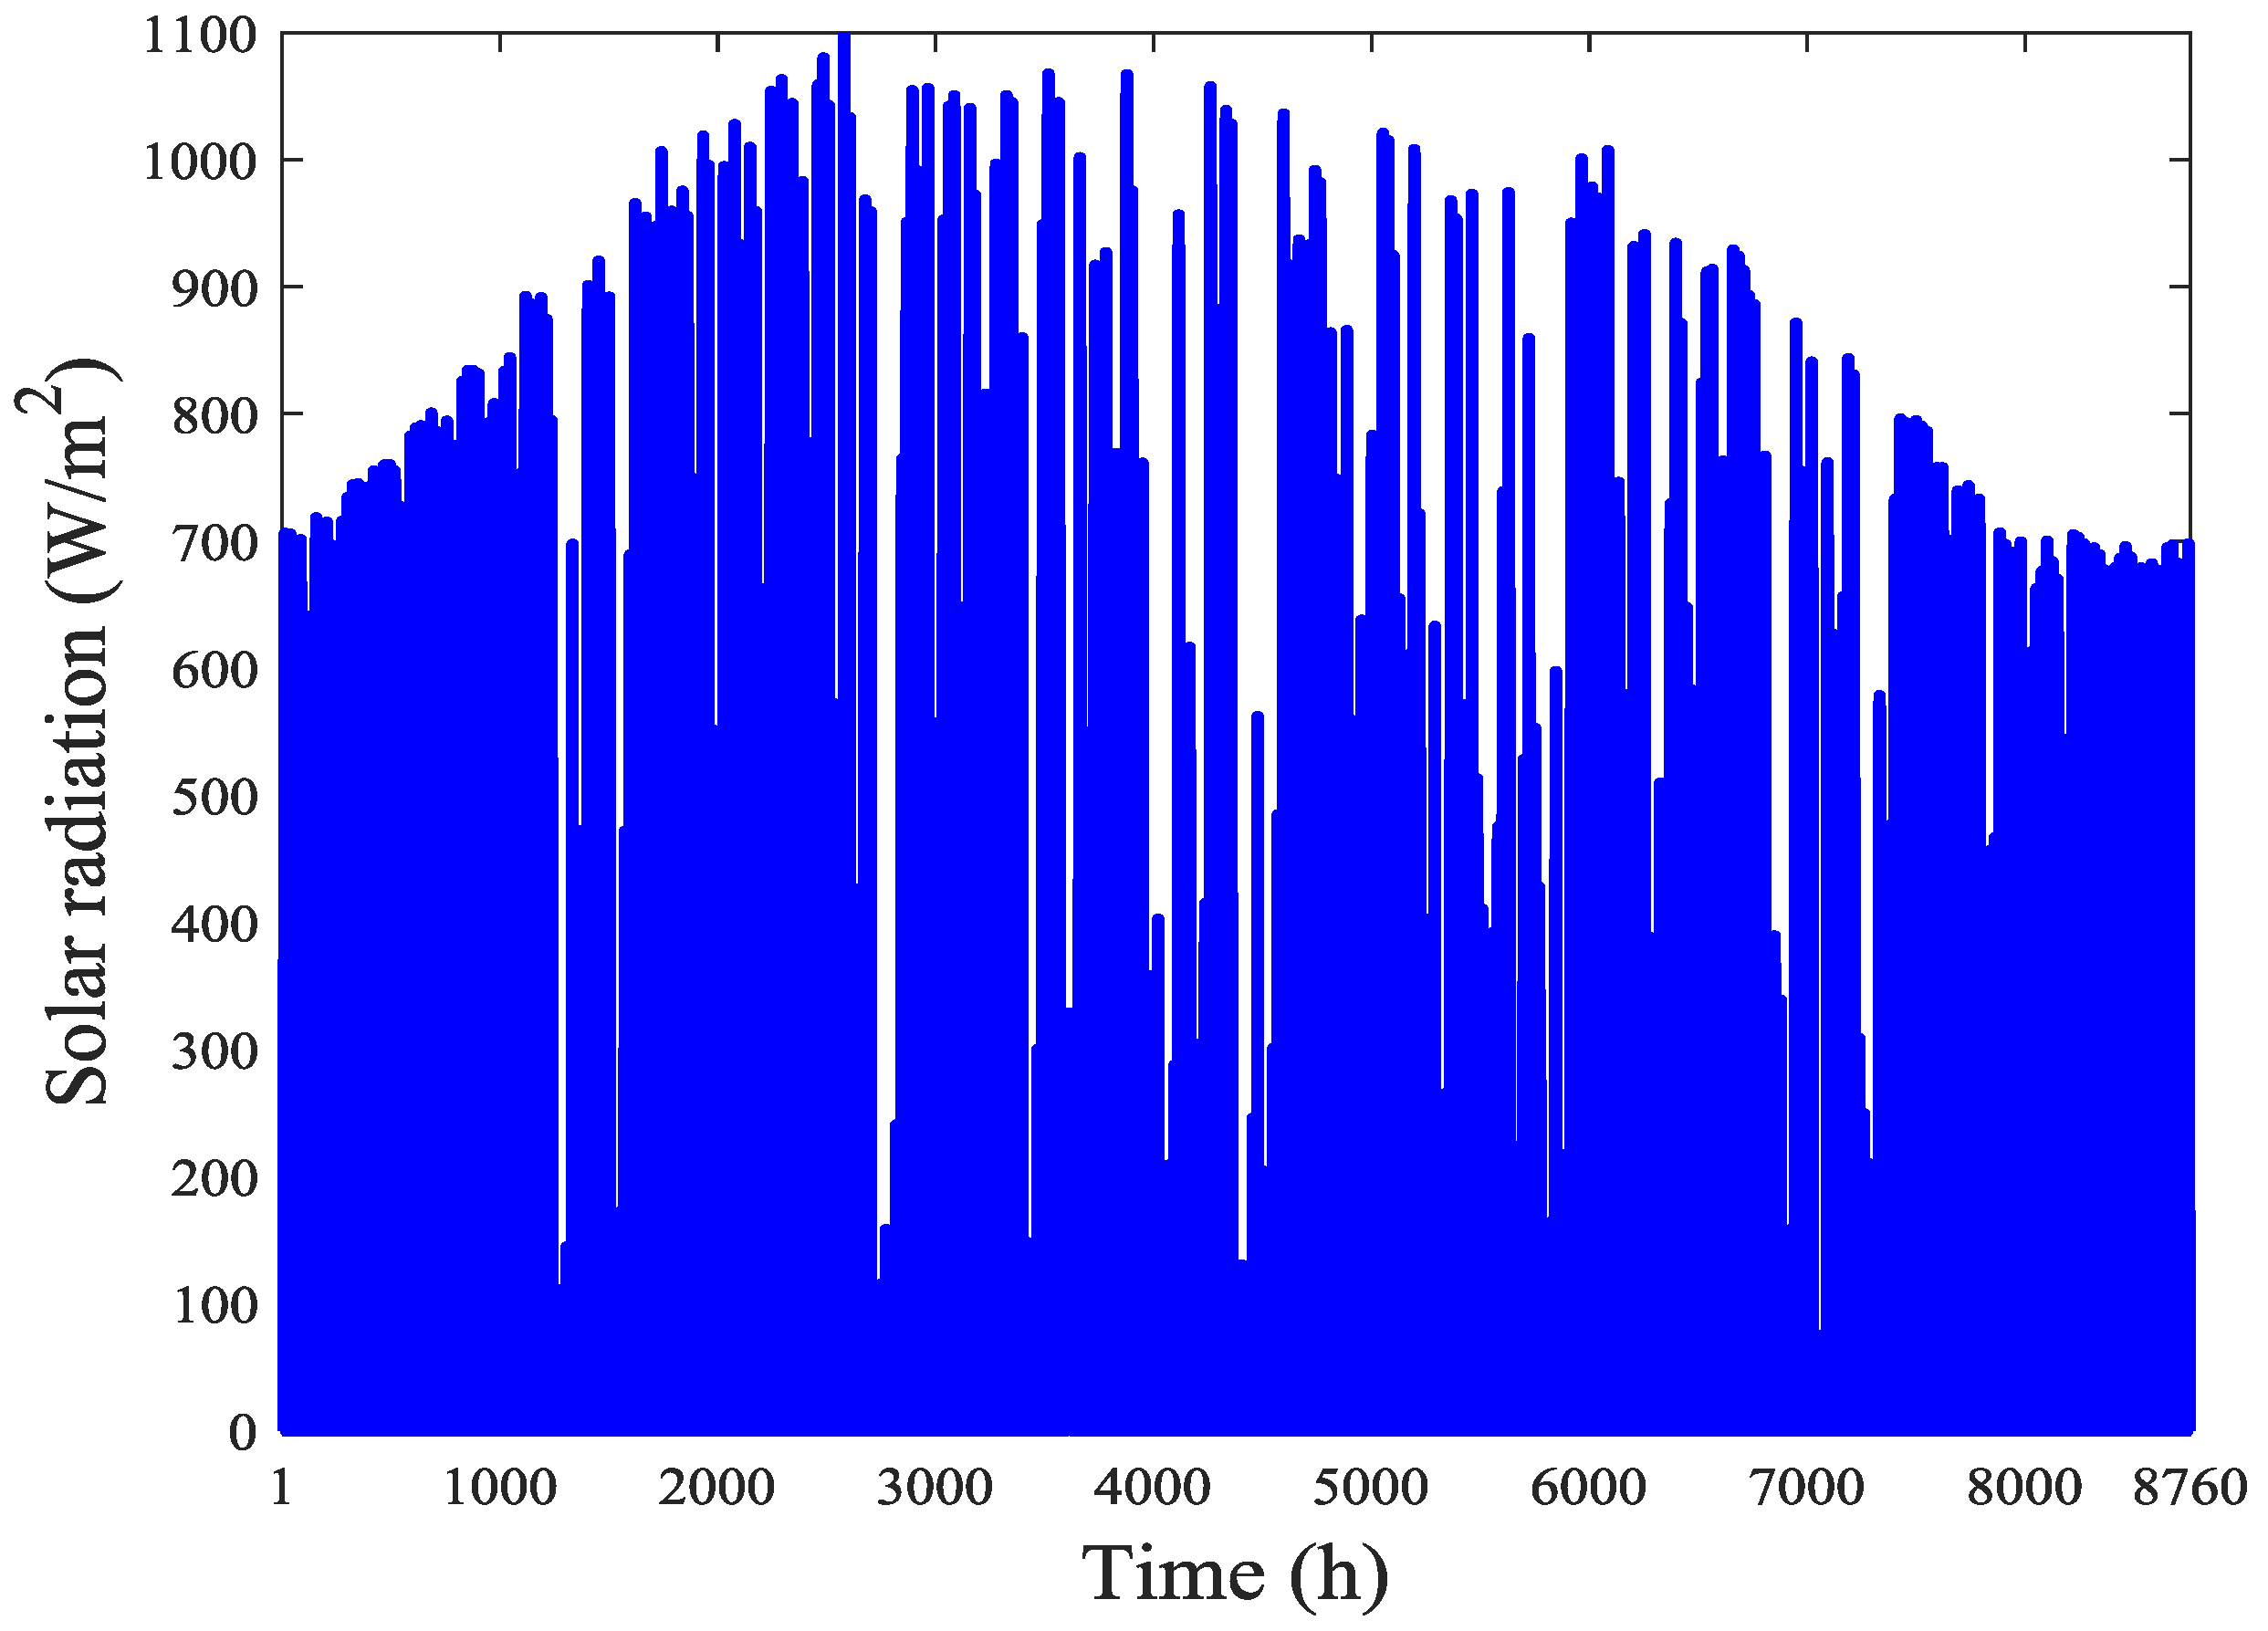
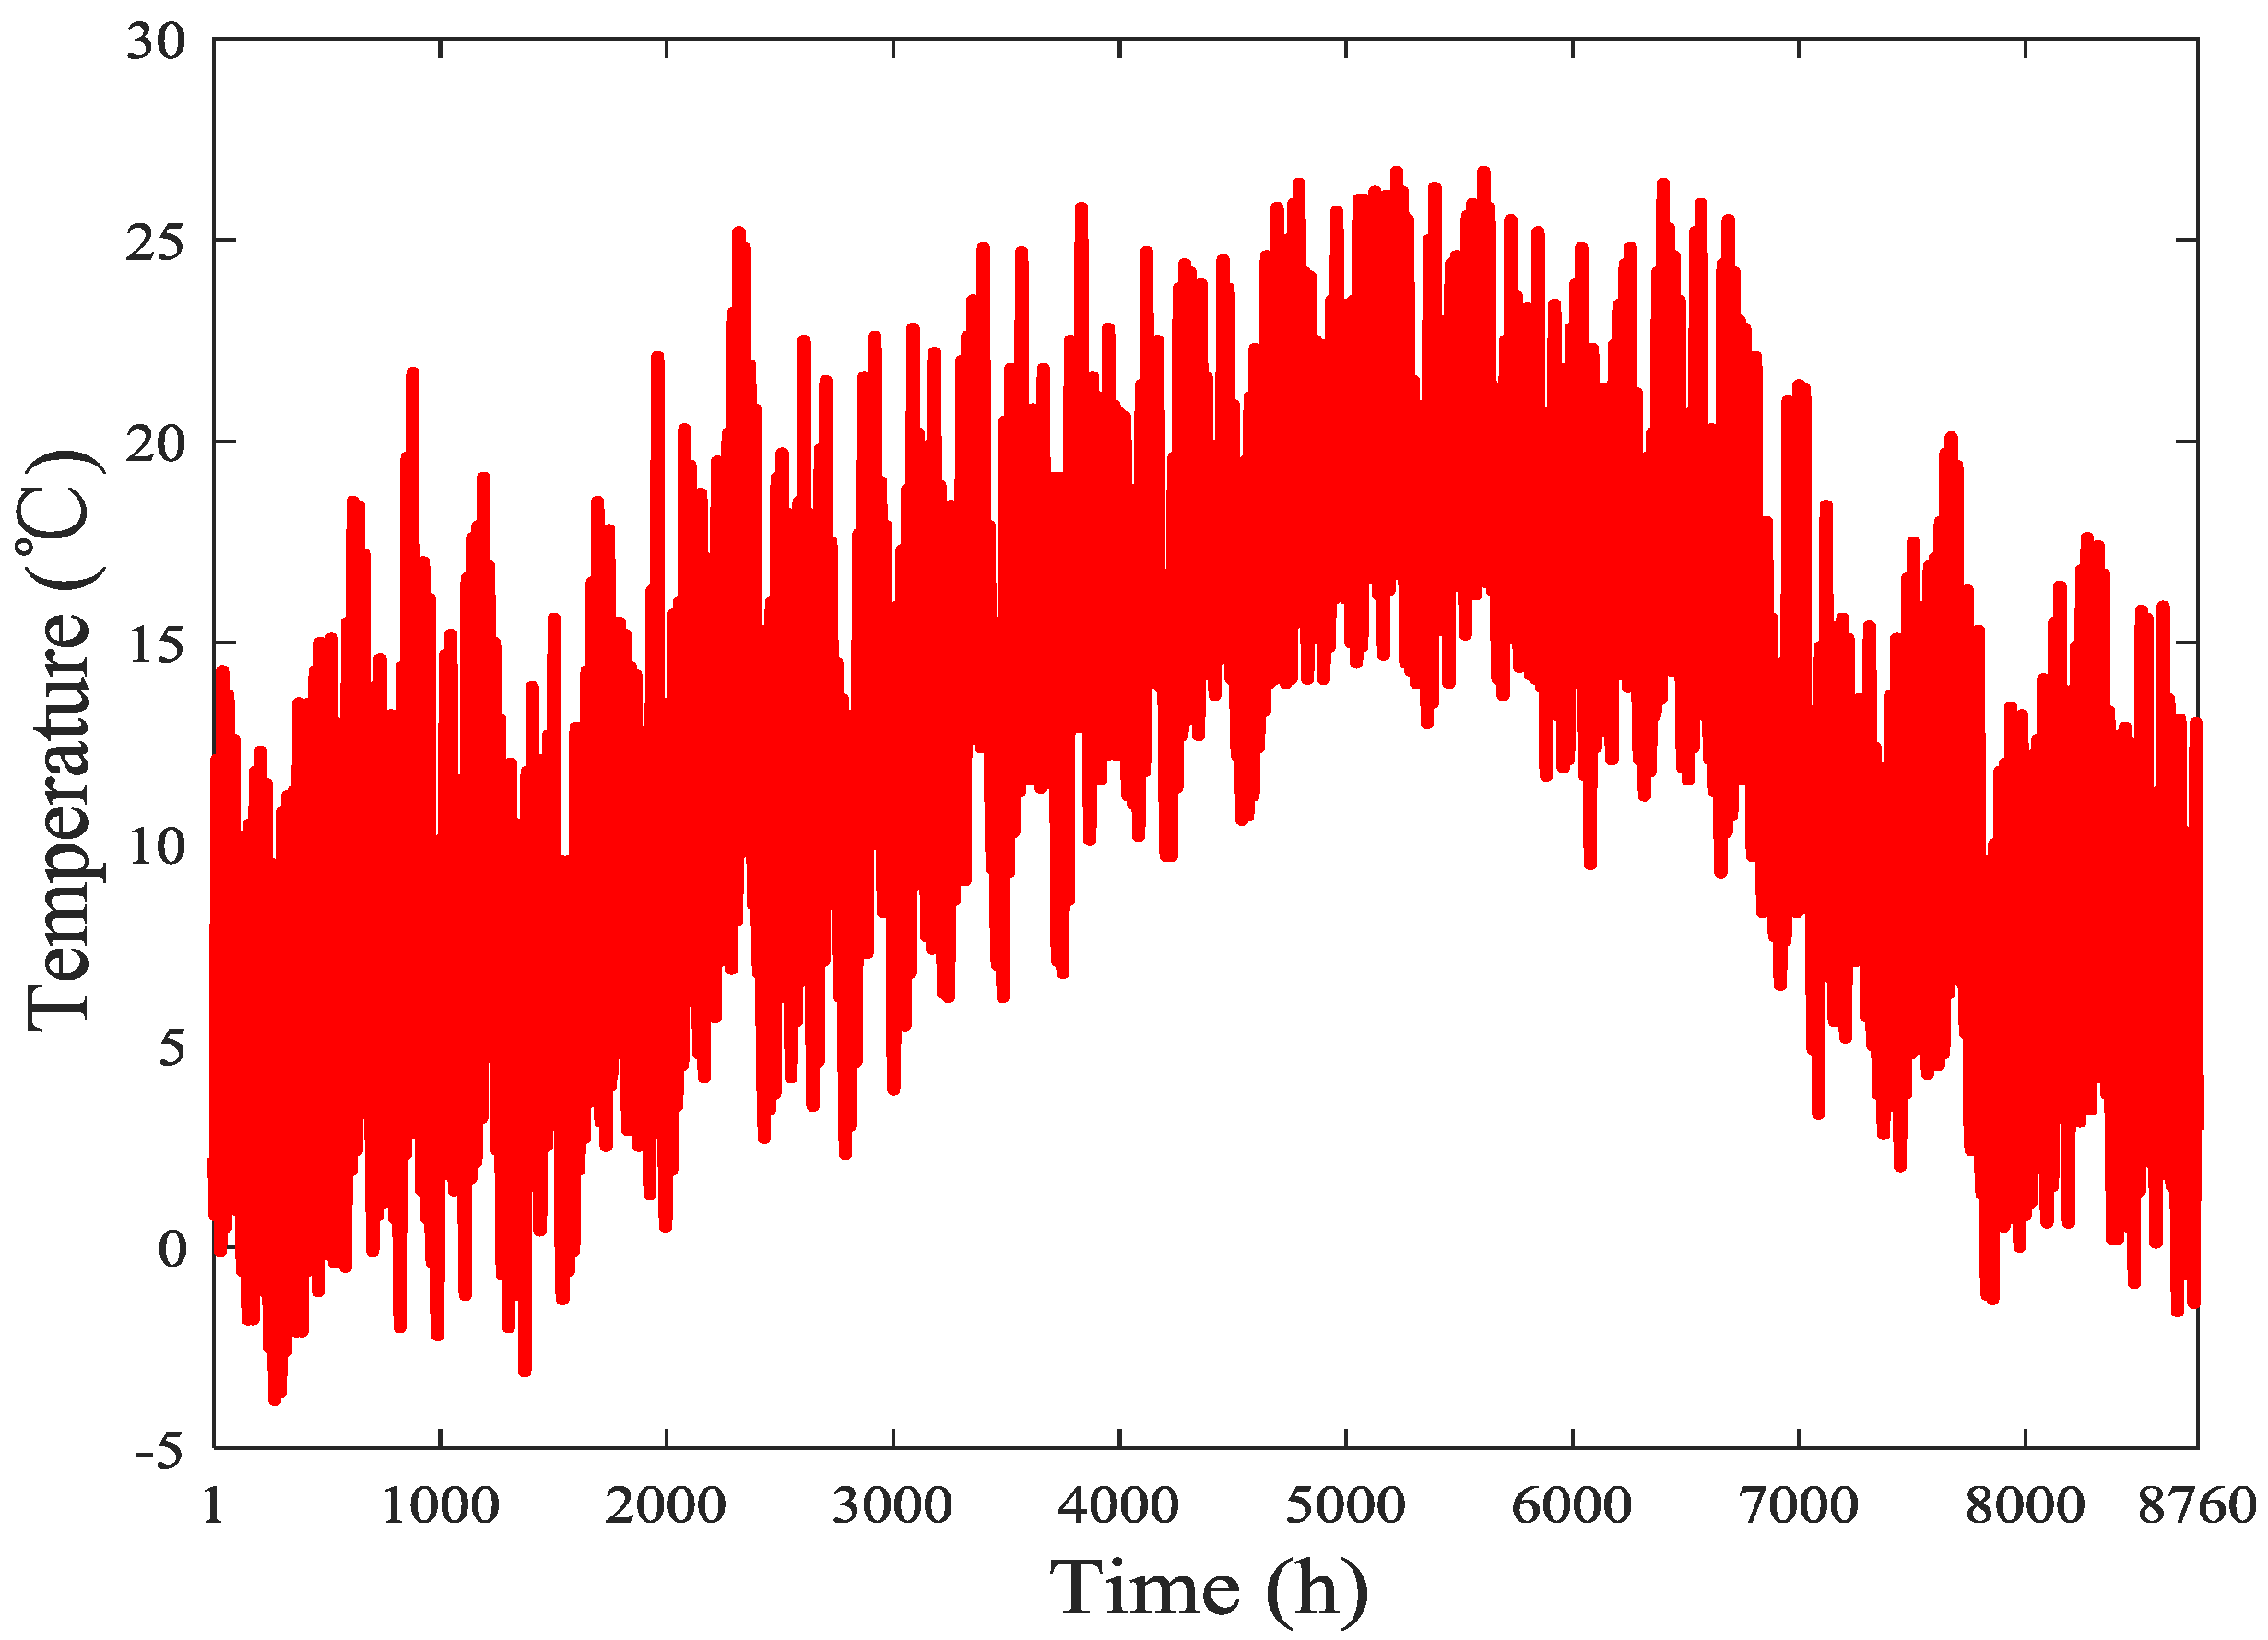
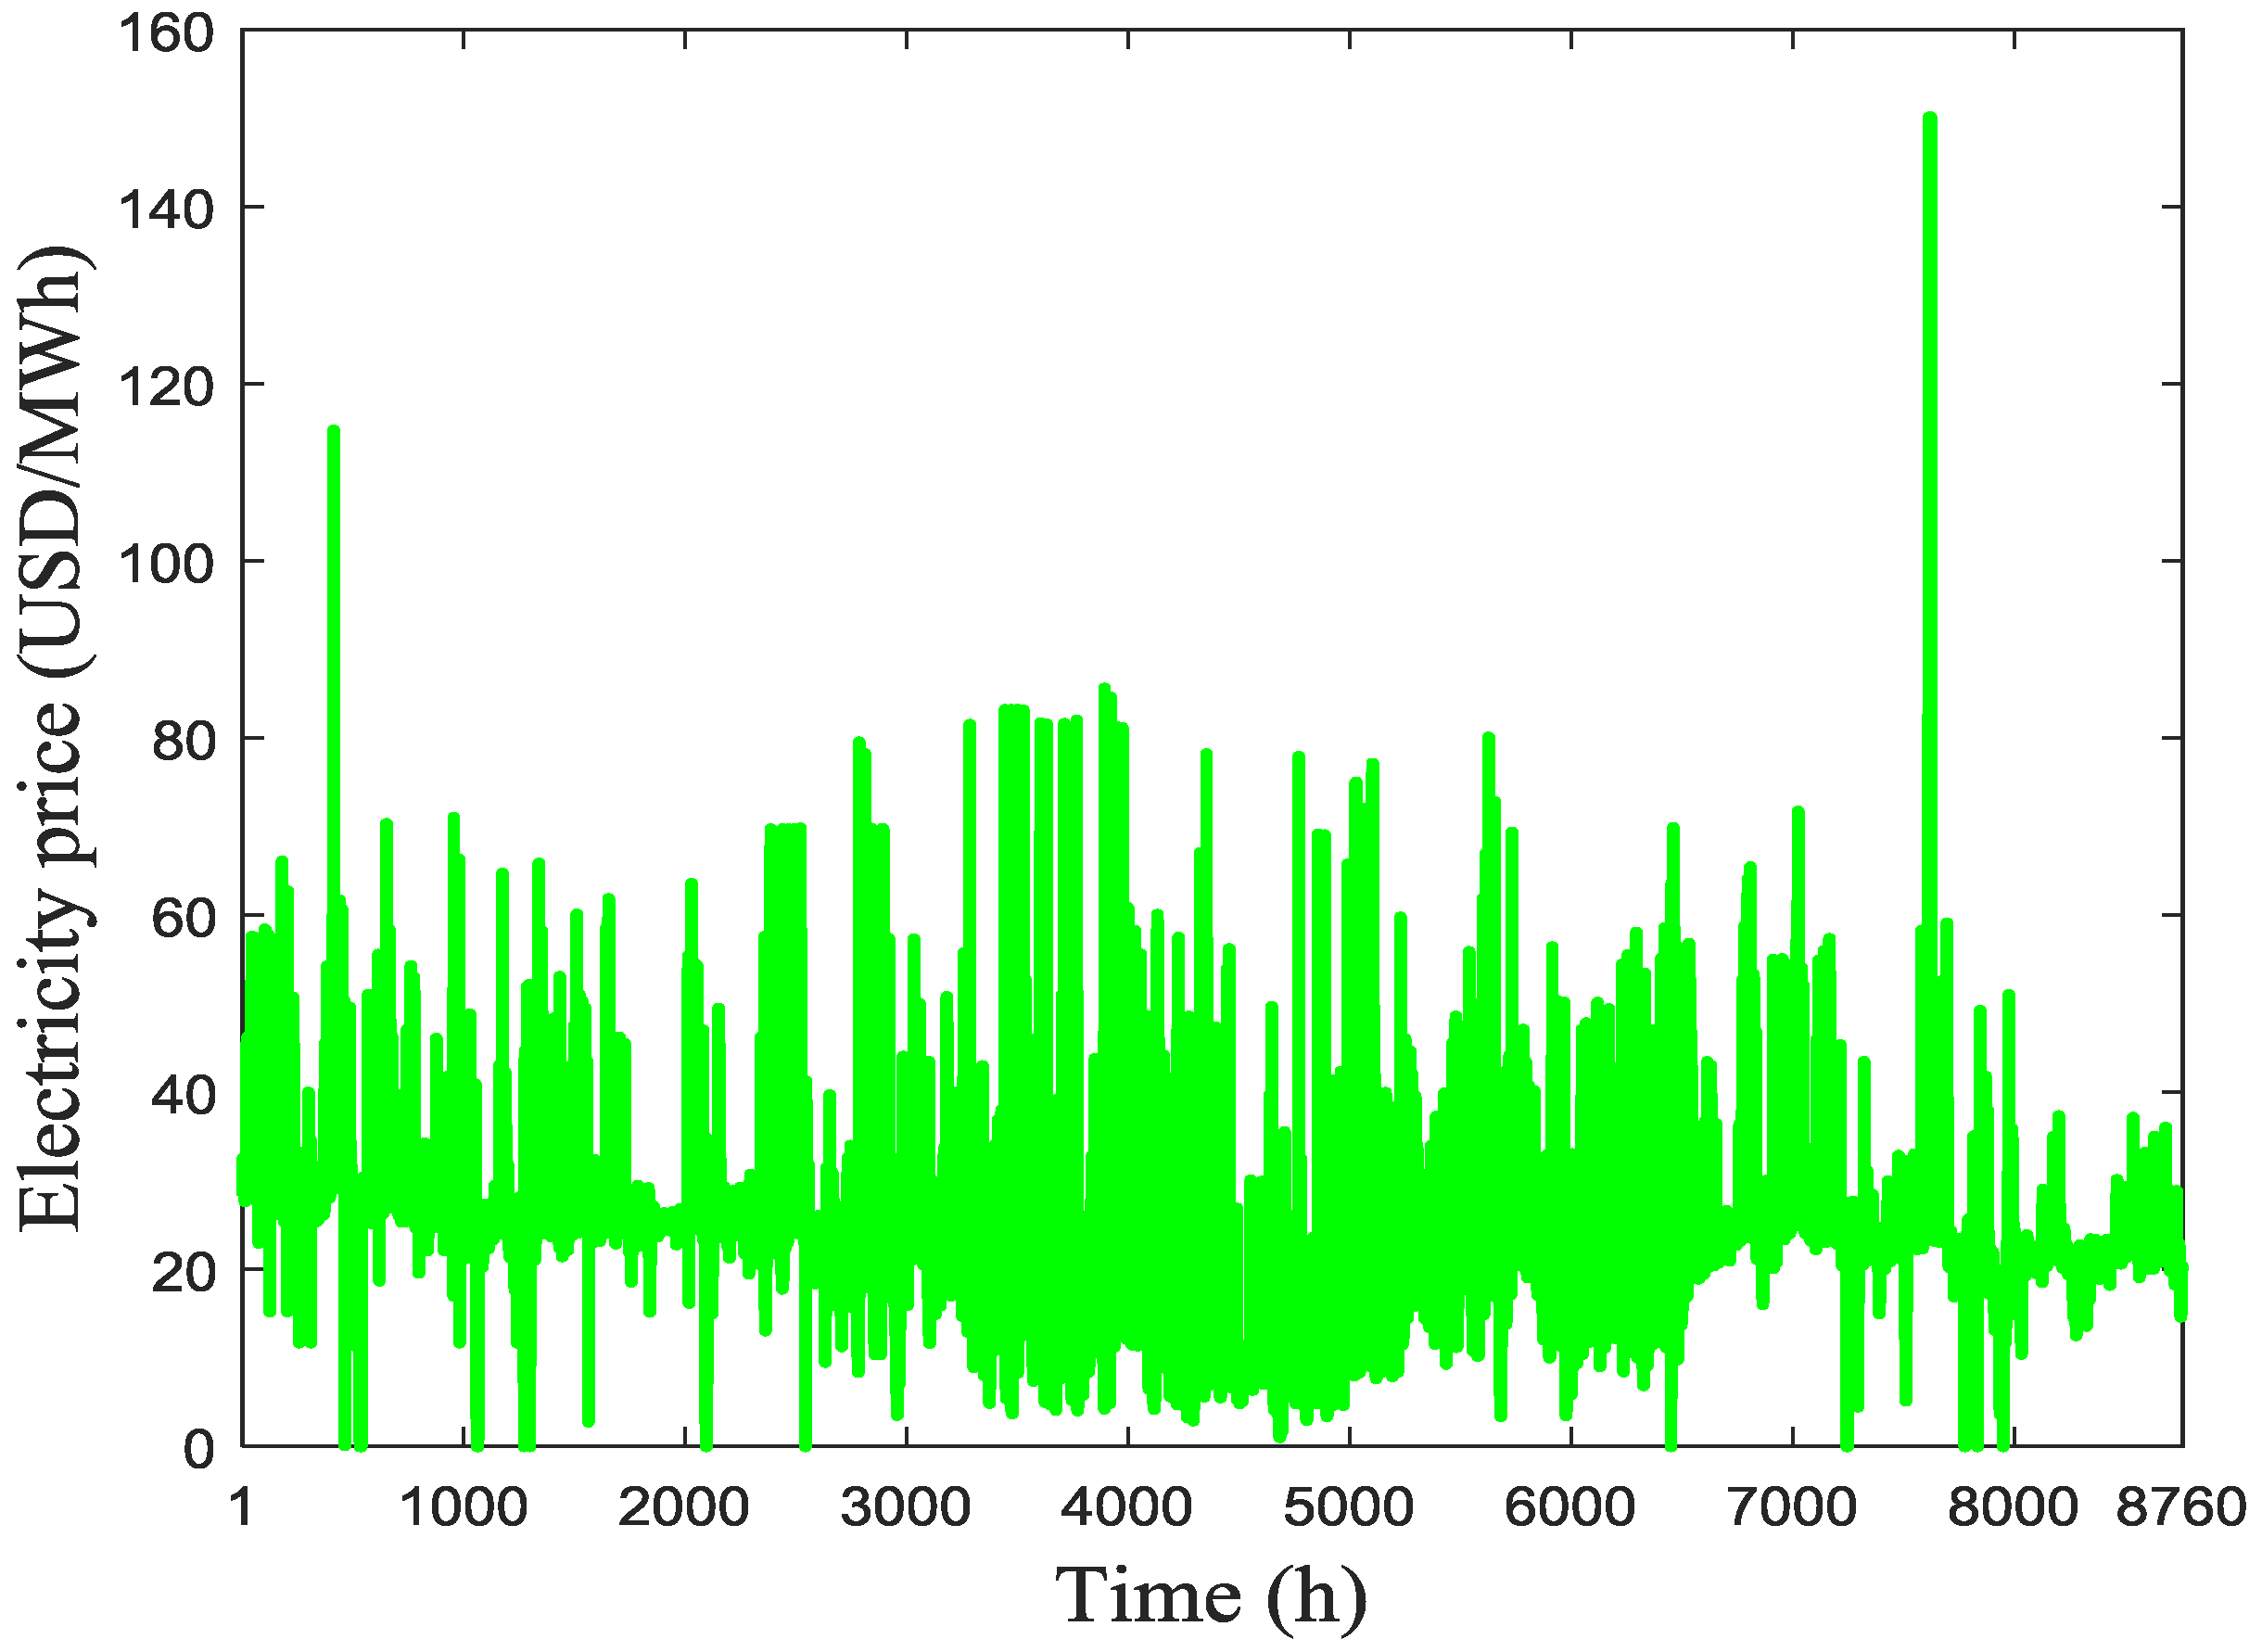
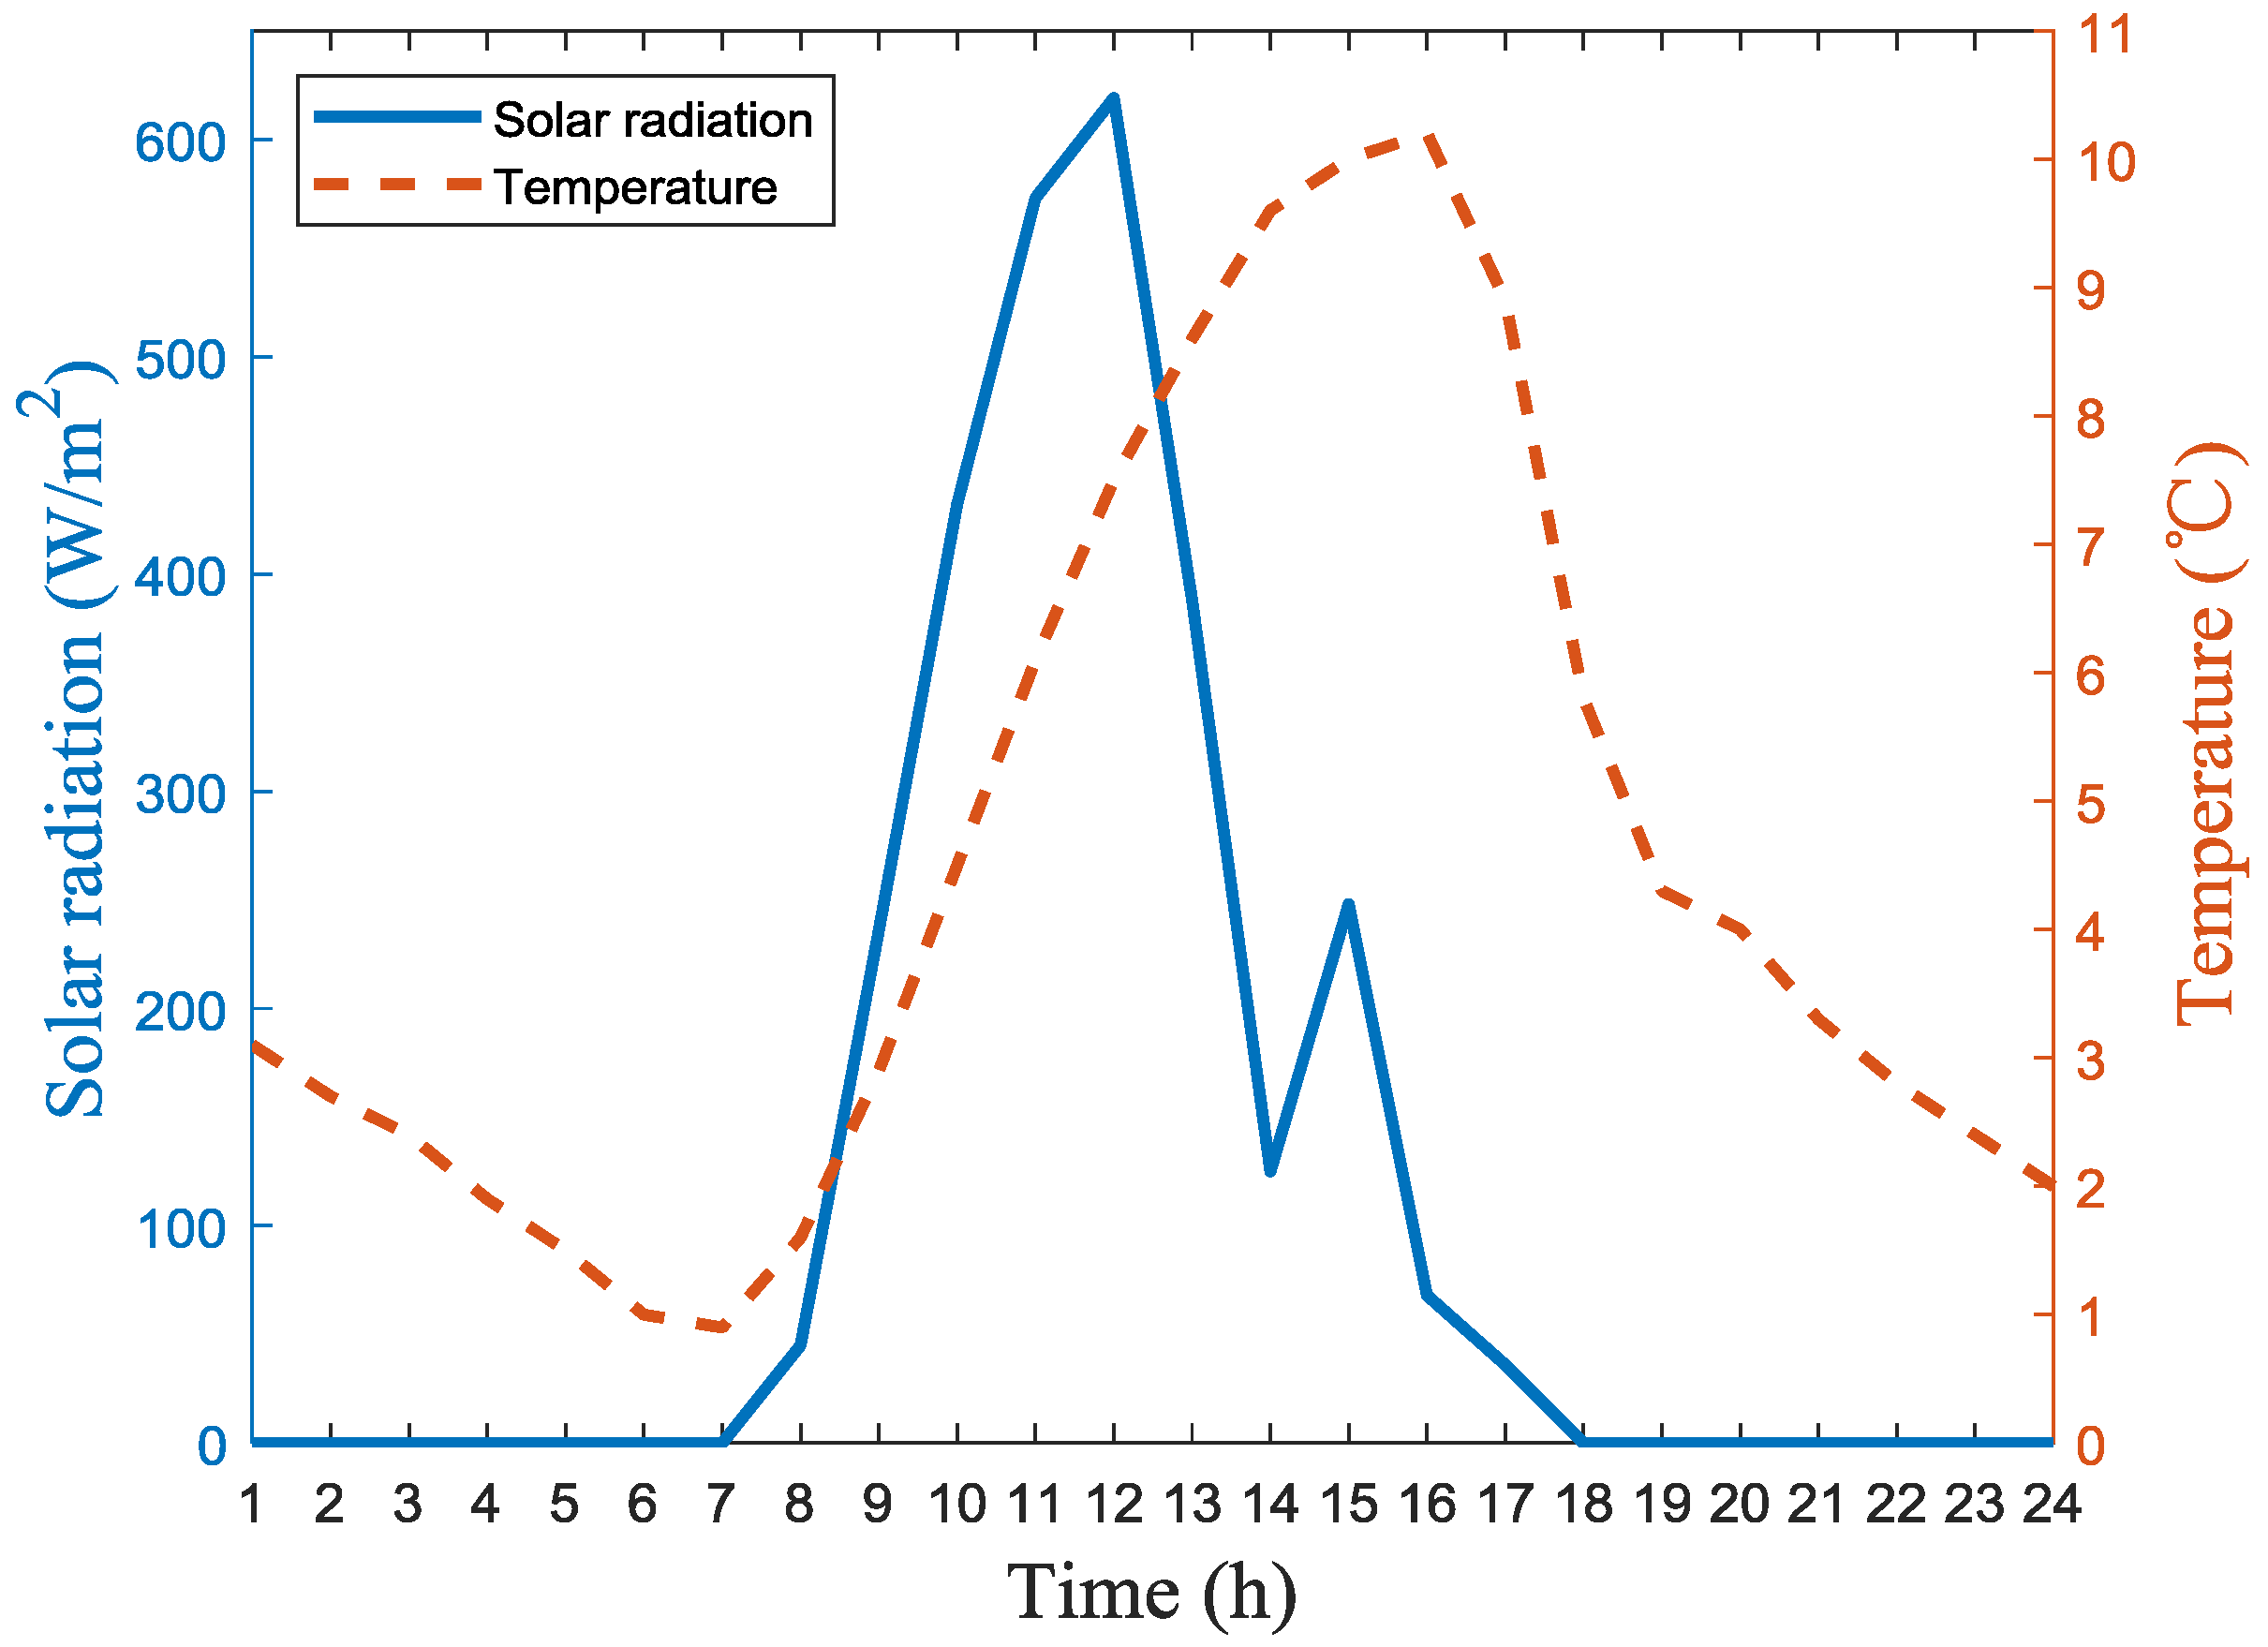
4.1. Reference Solar Radiation, Ambient Temperature, and Electricity Price
4.2. Optimization Results of Investment on the Photovoltaic System and Solar Heating System at Present and Future
- Strategy 1: investing in PV system (Bench mark). Investors sell the electricity supplied by the PV system to the electricity market.
- Strategy 2: investing in solar heating system (Bench mark). Investors sell the heat from the solar heating system to the DH heat market.
- Strategy 3: investing in PV system and BESS. This strategy considers price arbitrage with the aid of PSB to earn more money from the electricity market.
- Strategy 4: investing in PV and solar thermal heating systems based on optimal area allocation. Income of investments may from the heat market and electricity market.
- Strategy 5: investing in PV system with BESS and solar thermal heating system. Income of investments may be from selling heat and power directly and price arbitrage. Due to the high cost of the batteries and because the power will be lost during the charge process of batteries, the size of batteries cannot be too large. It is important to optimize the size of the batteries.
4.2.1. Analysis of Investment Strategies at Present
4.2.2. Analysis of Investment Strategies in 2030
4.2.3. Analysis of Investment Strategies in 2040
4.2.4. Analysis of Investment Strategies in 2050
5. Conclusions and Future Works
Author Contributions
Funding
Acknowledgments
Conflicts of Interest
Nomenclature
| output power of PV system (kW) | |
| rated power of PV (kW) | |
| solar radiation on a tilted surface (W/m2) | |
| tilt angle (°) | |
| reference value of solar radiation (W/m2) | |
| temperature coefficient of the maximum power (°C) | |
| temperature of PV cell (°C) | |
| temperature of PV cell at reference conditions (°C) | |
| beam radiation on a tiled surface (W/m2) | |
| diffuse radiation on a tiled surface (W/m2) | |
| ground-reflected radiation (W/m2) | |
| horizontal direct radiation (W/m2) | |
| incidence angle (°) | |
| zenith angle (°) | |
| horizontal diffuse radiation (W/m2) | |
| coefficient expressing the degree of circumsolar (-) | |
| coefficient expressing the degree of horizon anisotropy (-) | |
| albedo of the ground which is 0.2 in this paper (-) | |
| ambient temperature (°C) | |
| energy stored in the BESS at hour t (kWh) | |
| energy stored in the BESS at hour t + 1 (kWh) | |
| efficiency of the BESS (-) | |
| power output of the BESS at hour t (kW) | |
| power that batteries charged by PV at hour t (kW) | |
| inverter efficiency (-) | |
| power that bought from/sold to electricity market at hour t (kW) | |
| BESS capital cost (USD) | |
| power cost coefficient (USD/kW) | |
| BESS power (kW) | |
| energy cost coefficient (USD/kWh) | |
| energy capacities (kWh) | |
| depth of discharge (-) | |
| efficiency of solar thermal collector (-) | |
| maximal efficiency of thermal collector (-) | |
| , | coefficients of the collector heat losses (W/(m2k)) |
| medium collector temperature (°C) | |
| collector outlet temperature (°C) | |
| collector inlet temperature (°C) | |
| specific net solar gain (kWh/m2) | |
| total investment cost of solar heating system (USD) | |
| area of solar heating system (m2) | |
| installation cost of solar heating system (USD) | |
| cost of other elements in solar heating system (USD) | |
| , | random numbers in the range [0, 1] (-) |
| a cognitive, standing for how much the particle is drawn by its personal best (-) | |
| a social constant, standing for how much the particle is drawn by the swarm’s best point (-) | |
| the inertia weight (-) | |
| area of PV system (m2) | |
| capital cost of PV cells per m2 (USD) | |
| capital replacement cost (USD) | |
| operation and maintenance cost (USD) | |
| r | interest rate which is 0.05 in this paper (-) |
| average annual earnings (USD) | |
| project lifetime (year) | |
| income obtained from electricity market and heat market in year n (USD) | |
| heat energy generated from solar collectors (kJ) | |
| heat price in regulated heat market (USD/GJ) | |
| electricity price at hour t (USD/MW) | |
| PV output power at year n (kW) |
References
- Blaschke, T.; Biberacher, M.; Gadocha, S.; Schardinger, I. Energy landscapes: Meeting energy demands and human aspirations. Biomass Bioenergy 2013, 55, 3–16. [Google Scholar] [CrossRef] [PubMed]
- International Energy Agency (IEA). 2DS-hiRen ScenaROI, Energy Technology Perspectives; IEA: Paris, France, 2012. [Google Scholar]
- Seddegh, S.; Wang, X.; Henderson, A.D.; Xing, Z. Solar domestic hot water systems using latent heat energy storage medium: A review. Renew. Sustain. Energy Rev. 2015, 49, 517–533. [Google Scholar] [CrossRef]
- Mohanty, P.; Muneer, T.; Gago, E.J.; Yash Kotak, Y. Solar Radiation Fundamentals and PV System Components; Springer Int. Publ.: Berlin/Heidelberg, Germany, 2015. [Google Scholar]
- IEA. Snapshot of Global Photovoltaic Markets; Report IEA PVPS T1-33; IEA: Paris, France, 2018. [Google Scholar]
- Hu, W. Operation of Modern Distribution Power Systems in Competitive Electricity Markets. Ph.D. Thesis, Aalborg University, Aalborg, Denmark, September 2012. [Google Scholar]
- Akhil, A.A.; Huff, G.; Currier, A.B.; Kaun, B.C.; Rastler, D.M.; Chen, S.B.; Cotter, A.L.; Bradshaw, D.T.; Gauntlett, W.D. DOE/EPRI 2013 Electricity Storage Handbook in Collaboration with NRECA; SAND2013-5131; Sandia National Laboratories: Albuquerque, NM, USA; Livermore, CA, USA, 2013. [Google Scholar]
- Office of Electricity Delivery & Energy Reliability. DOE Global Energy Storage Database. Available online: http://www.energystorageexchange.org (accessed on 12 May 2019).
- Maly, D.K.; Kwan, K.S. Optimal battery energy storage system (BESS) charge scheduling with dynamic programming. IEE Proc. Sci. Meas. Technol. 1995, 142, 454–458. [Google Scholar] [CrossRef]
- Rupanagunta, P.; Baughman, M.L.; Jones, J.W. Scheduling of cool storage using non-linear programming techniques. IEEE Trans. Power Syst. 1995, 10, 1279–1285. [Google Scholar] [CrossRef]
- Lai, C.S.; McCulloch, M.D. Levelized cost of electricity for solar photovoltaic and electrical energy storage. Appl. Energy 2017, 190, 191–203. [Google Scholar] [CrossRef]
- Renewable Energy 2010: Key Facts and Figures for Decision Makers. Global Status Report. Available online: http://www.ren21.net/gsrS (accessed on 3 March 2019).
- Islam, M.R.; Sumathy, K.; Khan, S.U. Solar water heating systems and their market trends. Renew. Sustain. Energy Rev. 2013, 17, 1–25. [Google Scholar] [CrossRef]
- Winterscheid, C.; Dalenbck, J.O.; Holler, S. Integration of solar thermal systems in existing district heating systems. Energy 2017, 137, 579–585. [Google Scholar] [CrossRef]
- Li, H.; Sun, Q.; Zhang, Q.; Wallin, F. A review of the pricing mechanisms for district heating systems. Renew. Sustain. Energy Rev. 2015, 42, 56–65. [Google Scholar] [CrossRef]
- ERO. Pricing in district heating. Prishtina, Kosovo: Energy Regulatory Office (ERO) at Kosovo. 2009. Available online: http://www.naruc.org/international/Documents/Pricing in District Heating_ERO_GroupA.pdf (accessed on 17 April 2019).
- Daud, A.; Ismail, M. Design of isolated hybrid systems minimizing costs and pollutant emissions. Renew. Energy 2012, 44, 215–224. [Google Scholar] [CrossRef]
- Gökmen, N.; Hu, W.; Hou, P.; Chen, Z.; Sera, D.; Spataru, S. Investigation of wind speed cooling effect on PV panels in windy locations. Renew. Energy 2016, 90, 283–290. [Google Scholar] [CrossRef]
- Technology Data for Generation of Electricity and District Heating. Available online: https://ens.dk/en/our-services/projections-and-models/technology-data/technology-data-generation-electricity-and (accessed on 12 May 2019).
- Obeidat, F. A comprehensive review of future photovoltaic systems. Sol. Energy 2018, 163, 545–551. [Google Scholar] [CrossRef]
- Chacra, F.A.; Bastard, P.; Fleury, G.; Clavreul, R. Impact of Energy Storage Costs on Economical Performance in a Distribution Substation. IEEE Trans. Power Syst. 2005, 20, 684–691. [Google Scholar] [CrossRef]
- Norris, B.L. EPRI Energy Storage Handbook: Wind Energy Storage Applications; The Electric Power Research Institute (EPRI): Palo Alto, CA, USA, 2003. [Google Scholar]
- European Solar Thermal Industry Federation. Solar Thermal Markets in Europe: Trends and Market Statistics 2014; European Solar Thermal Industry Federation: Brussels, Belgium, 2015. [Google Scholar]
- SDH. Solar District Heating Guidelines. 2012. Available online: http://solardistrict-heating.eu/Portals/0/Factsheets/SDH-WP3-D31-D32_August2012.pdf (accessed on 12 May 2019).
- Liang, X.; Bashir, H.A.; Li, S. Sequential Quadratic Programming Based on IPM for Constrained Nonlinear Programming. In Proceedings of the 2008 Eighth International Conference on Intelligent Systems Design and Applications, Kaohsiung, Taiwan, 26–28 November 2008; pp. 266–271. [Google Scholar]
- Kennedy, J.; Eberhart, R.C. Particle swarm optimization. In Proceedings of the 1995 IEEE International Conference on Neural Networks, Perth, Australia, 27 November–1 December 1995; pp. 1942–1948. [Google Scholar]
- Wang, N.; Li, J.; Hu, W.; Zhang, B.; Huang, Q.; Chen, Z. Optimal reactive power dispatch of a full-scale converter based wind farm considering loss minimization. Renew. Energy 2019, 139, 292–301. [Google Scholar] [CrossRef]
- Alhasan, W.M.; Ibrahim, S.; Hefny, H.A.; Shaheen, S.I. LDWMeanPSO: A new improved particle swarm optimization technique. In Proceedings of the Computer Engineering Conference, IEEE, Cairo, Egypt, 27–28 December 2011; pp. 37–43. [Google Scholar]
- Atieh, A.; Shariff, S.A. Case study on the return on investment (ROI) for using renewable energy to power-up typical house in Saudi Arabia. Sustain. Cities Soc. 2015, 17, 56–60. [Google Scholar] [CrossRef]
- Electricity_Price_Outlook_2018. Available online: https://www.danskenergi.dk/sites/danskenergi.dk/files/media/dokumenter/2018-06/Electricity_Price_Outlook_2018.pdf (accessed on 3 March 2019).
- European Commission. EU Energy, Transport and GHG emissions -Trends to 2050, Reference Scenario 2013. Available online: https://ec.europa.eu/transport/sites/transport/files/media/publications/doc/trends-to-2050-update-2013.pdf (accessed on 3 March 2019).
- EUROPEAN DISTRICT HEATING PRICE SERIES REPORT 2016: 316. Available online: https://energiforskmedia.blob.core.windows.net/media/21926/european-district-heating-price-series-energiforskrapport-2016-316.pdf (accessed on 3 March 2019).
- European Association for Storage of Energy (EASE). Joint EASE/EERA Recommendations for a European Energy Storage Technology Development Roadmap towards 2030; EASE: Brussels, Belgium, 2013. [Google Scholar]
- Drouilhet, S.; Johnson, B.L. A battery life prediction method for hybrid power application. In Proceedings of the 35th AIAA Aerosp Sciences Meeting Exhibit, Reno, NV, USA, 6–9 January 1997. [Google Scholar]


| Case | Now | 2030 | |||||||||
| Strategy number | 1 | 2 | 3 | 4 | 5 | 1 | 2 | 3 | 4 | 5 | |
| Annual income (×105/USD) | 6.03 | 10.06 | 6.03 | 6.03 | 6.03 | 9.15 | 16.21 | 11.60 | 9.15 | 11.60 | |
| ROI | 27.12 | 32.83 | 27.12 | 27.12 | 27.12 | 16.46 | 18.75 | 15.83 | 16.46 | 15.83 | |
| Area of PV (×105/m2) | 1 | - | 1 | 1 | 1 | 1 | - | 1 | 1 | 1 | |
| Area of STS (×105/m2) | - | 1 | - | 0 | 0 | - | 1 | - | 0 | 0 | |
| Batteries size | Power (MW) | - | - | 0 | - | 0 | - | - | 16.92 | - | 16.92 |
| Energy capacities (MWh) | - | - | 0 | - | 0 | - | - | 48.30 | - | 48.30 | |
| Batteries cost | Power cost coefficient (USD/kW) | - | - | 150 | - | 150 | - | - | 90 | - | 90 |
| Energy cost coefficient (USD/kWh) | - | - | 65 | - | 65 | - | - | 39 | - | 39 | |
| Total batteries cost (×105/USD) | - | - | 0 | - | 0 | - | - | 34.07 | - | 34.07 | |
| PV cost (×105/USD) | 163.64 | - | 163.64 | 163.64 | 163.64 | 150.55 | - | 150.55 | 150.55 | 150.55 | |
| Solar heating system cost (×105/USD) | - | 330.44 | - | 0 | 0 | - | 304.00 | - | 0 | 0 | |
| Case | 2040 | 2050 | |||||||||
| Strategy number | 1 | 2 | 3 | 4 | 5 | 1 | 2 | 3 | 4 | 5 | |
| Annual income (×105/USD) | 9.87 | 21.87 | 13.37 | 21.87 | 21.87 | 8.91 | 35.21 | 12.61 | 35.21 | 35.21 | |
| ROI | 14.34 | 13.07 | 13.39 | 13.07 | 13.07 | 15.26 | 7.79 | 13.93 | 7.79 | 7.79 | |
| Area of PV (×105/m2) | 1 | - | 1 | 0 | 0 | 1 | - | 1 | 0 | 0 | |
| Area of STS (×105/m2) | - | 1 | - | 1 | 1 | - | 1 | - | 1 | 1 | |
| Batteries size | Power (MW) | - | - | 20.85 | - | 0 | - | - | 22.60 | - | 0 |
| Energy capacities (MWh) | - | - | 67.25 | - | 0 | - | - | 84.02 | - | 0 | |
| Batteries cost | Power cost coefficient (USD/kW) | - | - | 75 | - | 75 | - | - | 67.5 | - | 67.5 |
| Energy cost coefficient (USD/kWh) | - | - | 32.5 | - | 32.5 | - | - | 29.25 | - | 29.25 | |
| Total batteries cost (×105/USD) | - | - | 37.49 | - | 0 | - | - | 39.83 | - | 0 | |
| PV cost (×105/USD) | 142.55 | - | 142.55 | 0 | 0 | 136.85 | - | 136.85 | 0 | 0 | |
| Solar heating system cost (×105/USD) | - | 285.76 | - | 285.76 | 285.76 | - | 274.33 | - | 274.33 | 274.33 | |
© 2019 by the authors. Licensee MDPI, Basel, Switzerland. This article is an open access article distributed under the terms and conditions of the Creative Commons Attribution (CC BY) license (http://creativecommons.org/licenses/by/4.0/).
Share and Cite
Song, Y.; Hu, W.; Xu, X.; Huang, Q.; Chen, G.; Han, X.; Chen, Z. Optimal Investment Strategies for Solar Energy Based Systems. Energies 2019, 12, 2826. https://doi.org/10.3390/en12142826
Song Y, Hu W, Xu X, Huang Q, Chen G, Han X, Chen Z. Optimal Investment Strategies for Solar Energy Based Systems. Energies. 2019; 12(14):2826. https://doi.org/10.3390/en12142826
Chicago/Turabian StyleSong, Yuchen, Weihao Hu, Xiao Xu, Qi Huang, Gang Chen, Xiaoyan Han, and Zhe Chen. 2019. "Optimal Investment Strategies for Solar Energy Based Systems" Energies 12, no. 14: 2826. https://doi.org/10.3390/en12142826
APA StyleSong, Y., Hu, W., Xu, X., Huang, Q., Chen, G., Han, X., & Chen, Z. (2019). Optimal Investment Strategies for Solar Energy Based Systems. Energies, 12(14), 2826. https://doi.org/10.3390/en12142826