Article

A General Framework for Voltage Sag Performance Analysis of Distribution Networks

by
Amir Safdarian
1,2,*,
Mahmud Fotuhi-Firuzabad
1 and
Matti Lehtonen
2
1
Electrical Engineering Department, Sharif University of Technology, Tehran 11365-11155, Iran
2
Electrical Engineering and Automation Department, Aalto University, 02150 Espoo, Finland
*
Author to whom correspondence should be addressed.
Energies 2019, 12(14), 2824; https://doi.org/10.3390/en12142824
Submission received: 3 July 2019 / Revised: 17 July 2019 / Accepted: 18 July 2019 / Published: 22 July 2019
(This article belongs to the Section F: Electrical Engineering)

Abstract

:
The proliferation of more sensitive loads has obliged distribution companies to pay greater attention to the voltage sag mitigation potential of different design alternatives in network planning studies. In doing so, a company has to have effective tools for estimating the voltage sag performance of its network. In this regard, this paper establishes a three-step framework for evaluating voltage sag performance of a distribution network. The first step, designated as state selection, is to select a network state in which voltage sag is likely. Although voltage sags have various causes, those that originated from faults in distribution networks are considered in this paper. The stochastic nature of fault location, type, resistance, and duration as well as the response of the protection system are taken into account. The second step, called state evaluation, deals with sag characteristics during the fault clearing time and the protection system response. The third step, named index calculation, is to estimate indices reflecting the sag performance of the network. A number of indices are proposed in this paper to reflect both system and load point-oriented issues. In light of the indices, companies may find effective solutions for voltage sag mitigation and customers choose appropriate solutions to provide ride-through support for their critical processes.

1. Introduction

Since years ago, traditional reliability indices such as frequency and duration of sustained interruptions have reflected the quality of service provided by distribution companies to their customers. Today, however, by rapid evolution and proliferation of power electronic devices, the impact of more subtle voltage disturbances such as voltage sags and swells cannot be ignored. Voltage sag is designated as a decrease in voltage magnitude between 10% and 90% of the nominal value for durations shorter than 1 minute [1]. It is worthwhile to note that there might be slightly different definitions for the phenomena in different standards. As an example, there are standards which define voltage sag as a decrease in voltage magnitude between 5% and 90%. The definition can originate substantial dissatisfaction and economic losses due to the malfunction of sag-sensitive equipment such as contactors, computers, programmable logic controllers (PLCs), and adjustable speed drives (ASDs) [2,3]. This emerging service quality concern obliges distribution companies to take into account the impacts on sag mitigation of different alternatives in network design and operation studies. For doing so, a distribution company needs to have effective tools to perform sag performance analysis of its network under different reinforcement alternatives. The tools should be capable to precisely estimate both load point-oriented and system-oriented issues caused by voltage sags. System and load point-oriented indices can help system designers to find cost-effective alternate plans and solutions such as employing fault current limiters (FCL) for voltage sag problems [4]. Load point-oriented indices also guide customers to choose appropriate equipment specifications for critical processes and select solutions such as installing uninterruptable power supply (UPS) to provide ride through support for critical appliances [3,4].
In the past decade, considerable efforts have been devoted to evaluate the voltage sag performance of distribution networks. Considering the fact that service quality is no longer assessed by only sustained interruption indices, [5] defined a few indices addressing frequency occurrence of voltage sags and swells as a function of their magnitudes. However, since measurements recorded across the network are prerequisites for the indices, the monitoring period required to achieve a reasonable accuracy would be too long. In Ref. [6], annual sag frequency and cost were estimated by a simulation-based approach. The study, however, overestimates the costs by ignoring the impact of sag duration on the cost which is less for shorter sags. Annual sag frequency and the associated cost were estimated in Ref. [7] where sag duration was taken into account in cost allocation to voltage sag events. In Ref. [8], the Monte Carlo simulation approach was employed to achieve a voltage sag density table. The table was then used to calculate an index representing the average lost energy during voltage sag events. The index, however, does not reflect the severity of the event since dissatisfaction and economic losses caused by a sag event are due to malfunction and/or trip of equipment, not the amount of energy they absorb during the event. Dissimilar to the reviewed papers which focused on the overall performance of a network, Ref. [9] described an analytical method to obtain a voltage sag density table for a specific load point. Modeling guidelines for representing major distribution network equipment such as lines, transformers, and protective and monitoring devices in voltage sag studies were discussed in Ref. [10]. A few system-oriented indices such as equivalent interruption duration were defined in Ref. [11] to reflect the adverse impact of voltage sags on service quality. A Monte Carlo simulation was performed in Ref. [12] to explore the impact of coordination among protective devices on voltage sag characteristics caused by faults in distribution networks. The voltage sag characteristics obtained in Ref. [12] were used in Ref. [13] to calculate system-oriented frequency and duration indices for sag events. The obtained results revealed the significant role of the protection system in voltage sag mitigation. A voltage sag density table and the number of unacceptable sags at a sensitive load point were estimated in Ref. [14]. The great ability of adequate maintenance of critical lines and feeders and proper coordination of the protection system in sag mitigation were also demonstrated in that paper. The above reviewed works have particular pros and cons. Some of them focused on system-oriented indices while the others paid attention to load point-oriented indices. The works mainly concentrates on studying potential impacts of monitoring and protection systems on voltage sag performance of a system. Moreover, neither of the reviewed articles provided a general framework for sag performance analysis of a distribution network. This is in spite of the growing importance and priority of power quality issues in the recent years. Therefore, there is a need for a general sag performance evaluation framework. To fill this gap, this paper establishes a three-step framework for sag performance assessment of distribution networks. The steps are called state selection, state evaluation, and index calculation, respectively. The state selection step is to select likely system states in which fault type, location, and the associated resistance represent a system state. The state evaluation step is to specify if voltage sag occurred in the network. If there is any, its severity and duration should also be estimated in this step. Once the likely sags and their characteristics are obtained, system and load point-oriented indices are calculated in the third step. A review over the existing indices is provided in this paper. Moreover, a few indices reflecting both system and load point issues caused by voltage sag are defined in this paper. This would be a step towards attaining the most appropriate indices since no consensus has been reached about them and respective standards are still in progress. The indices help companies to find effective sag mitigation measures and customers to provide ride through support for their critical processes. In summary, the major contributions of this article are as follows:
  • the article proposes a general framework to assess the sag performance of distribution networks;
  • in the proposed framework, load point and system-oriented indices are introduced to, beside the existing indices, represent the real status of a network in dealing with issues caused by voltage sag phenomena;
  • the proposed framework considers the stochastic nature of fault type and location; and
  • the proposed framework estimates the duration of voltage sag events via taking into account the behavior of common protection systems.
The remaining parts of the paper are outlined as follows. Section 2 thoroughly describes the proposed framework. Section 3 introduces the network under study and discusses the simulation results. Section 4 outlines concluding remarks.

2. General Framework for Voltage Sag Performance Analysis

This section intends to provide a general sag performance evaluation process. The basic steps of sag performance analysis of a distribution network are shown in Figure 1. As shown in this figure, the process consists of three consecutive steps. The steps are respectively called state selection, state evaluation, and index calculation. The state selection step is to specify the system under study, its operating policy as well as to select the set of likely system states. In the second step, selected system states are to be judged as to whether voltage sag has occurred or not. This step also estimates voltage sag location, severity, and duration for states with voltage sag. The last step calculates relevant sag performance indices based on the state analysis outcomes. In the remainder of this section, the three steps are described in details.

2.1. State Selection

This step is to define the network under study, related operating policies, and its likely states. A distribution network consists of several components such as lines and cables, transformers, fuses, and circuit breakers. Accurate models of the components are needed for a complete representation of the network in the analysis. Detailed descriptions over the modeling guidelines for representing power distribution components in sag performance analysis are accessible in Ref. [10]. A system state, in a sag performance study, is defined by a probable circumstance during which sag voltage is likely to occur. Any circumstance with a large current flowing through the network such as starting a large load, energizing transformers, and short circuit faults can lead to voltage sag. However, without loss of generality, voltage sags caused only by the faults are considered in this paper since they are the most common causes of severe sags in networks [15].
Faults are defined by their type, location, resistance, and duration. These factors are random and uncertain in nature. The uncertainty associated with the factors is captured by probability density functions whose type and parameters are approximated based on the recorded historical data. It is usually assumed that all of the factors are independent and mutually exclusive. According to the literature, uniform and normal probability density functions are appropriate for modeling the uncertainty on fault location and resistance.
The probability density functions are inputs of state selection methods. These methods can be considered to fall into two broad categories namely analytic enumeration and Monte Carlo simulation techniques. The two approaches are briefly described in the following subsections.

2.1.1. Analytic Enumeration

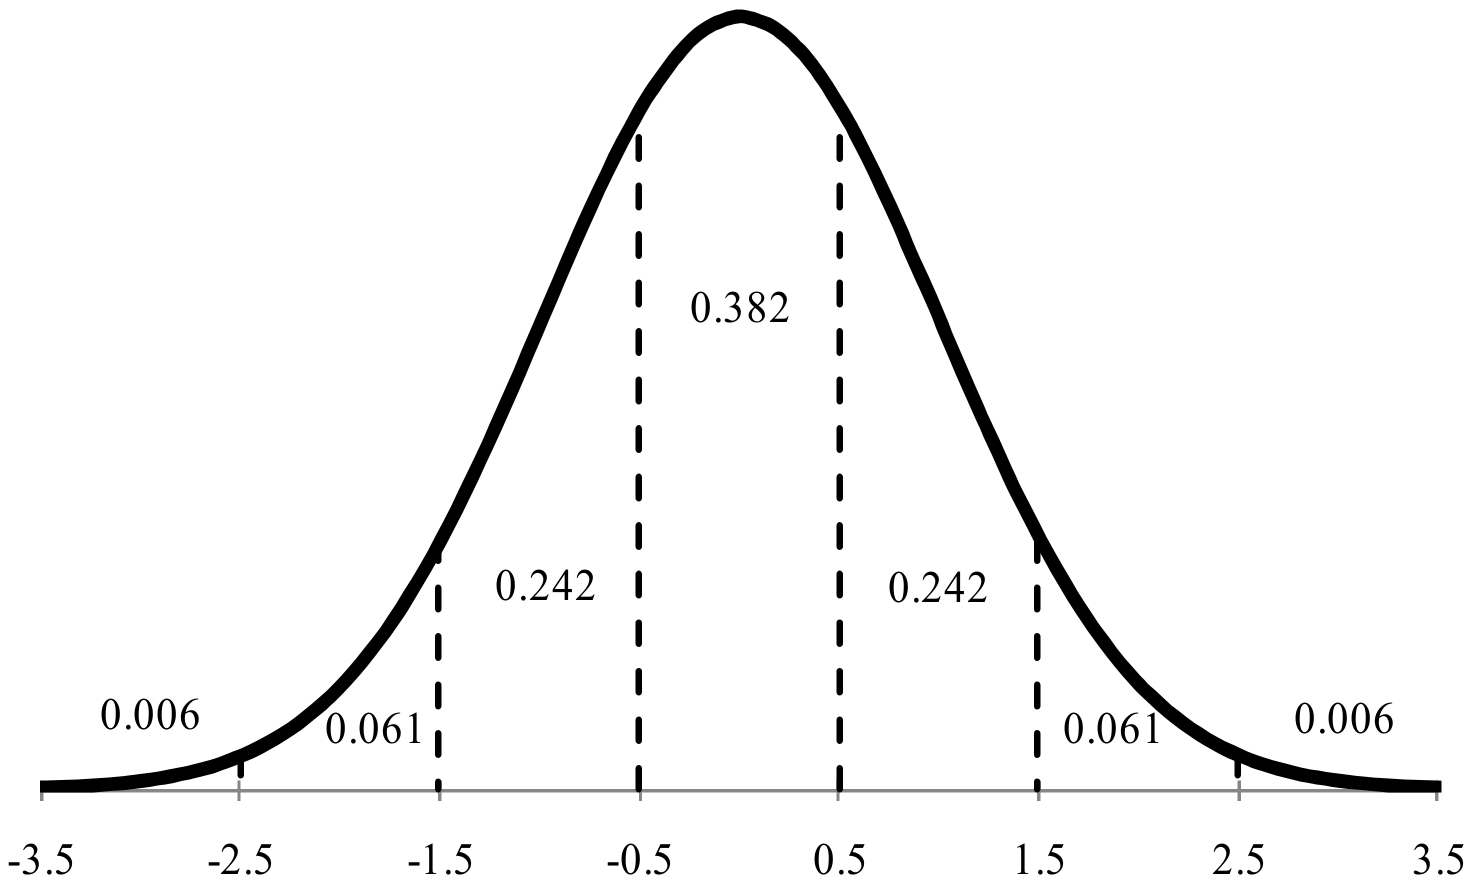
In an analytic enumeration technique, probability density functions associated with uncertain parameters are approximated by their equivalent discrete functions. For example, a normal probability density function can be approximated by a seven-step discrete function as shown in Figure 2. As another example, a uniform density function can be approximated by an arbitrary number of steps with the same probability. Note that the accuracy of the approximation increases as the number of steps is increased. Each step in the discrete density functions represents a likely state for the respective factor. Applying the procedure for all uncertain factors, the set of likely states for individual factors will be achieved. The combination of individual states constitutes system states. Now, a possible approach would be a complete enumeration which is computationally cumbersome in real networks since the number of states increases exponentially with the increase of network size. The computational burden can be alleviated by decreasing the number of selected system states. This can be done by reducing the number of steps or disregarding states with occurrence probability less than a predefined threshold. It is, however, obvious that decreasing the number of system states may lead to some level of inaccuracy in the study results. Therefore, the user has to make an appropriate compromise between computational burden and accuracy based on the required accuracy and available computational power.

2.1.2. Monte Carlo Simulation

In the Monte Carlo simulation approach, a state for an uncertain factor is obtained by drawing a random number with the respective probability density function. Comparing the drawn number and the probability density function, the value of the uncertain factor in the respective state is determined. Applying the same procedure for all uncertain factors and combining the individual states, a system state is achieved. This process can be repeated to constitute an arbitrary number of system states. In this approach, the accuracy of the study results increases as the number of constituted system states is increased. Again, computational complexity can be avoided by generating a limited number of states. This approach provides a more subtle tool to compromise between computational complexity and accuracy than that of the state enumeration technique.

2.2. State Evaluation

In the first step, a set of likely system states is selected by either of the two approaches described in the above section. In this step, each of the selected states is investigated and the voltage magnitude following the corresponding fault is calculated at each load point. The time during which the calculated voltages persist should also be estimated in this step.
The basis of voltage magnitude calculation is Thevenin’s theorem and the information of the positive-, negative-, and zero-sequence impedance matrices. In order to calculate post-fault voltage magnitudes, Thevenin’s equivalent circuit for all of the sequences should be obtained. The obtained equivalent circuits are connected according to the fault type, e.g., sequence circuits are connected in series in single phase earth faults. Having analyzed the circuit, sequence voltage magnitudes and currents are obtained which can then be transformed into individual phase voltage magnitudes and currents. Detailed descriptions on fault analysis studies are accessible in several power system analysis textbooks such as Ref. [16].
The time during which the calculated voltage magnitudes persist depends on either the protection system delay time in response to the fault current or the fault duration itself. Faults can be grouped into two categories namely permanent and temporary. In the case of permanent faults, the voltage magnitudes persist until the operation of the protection system. Therefore, the duration is equal to the delay time of the protection system. However, in temporary faults, fault duration may be less than the operation delay of the protection system. It means voltage magnitudes persist for the duration equal to the minimum of the fault duration and operation delay of the protection system. The operation delay of the protection system is usually represented by inverse curves. Figure 3 shows a few curves for typical over-current relays. As can be seen, the higher the fault current, the quicker the operation of the relay. Operation delay of the protection system can be estimated using the characteristic curves and fault current. The obtained voltage magnitudes at each load point and duration for each of the selected states are recorded for further manipulation in the next step.

2.3. Index Calculation

A set of likely system states is configured in the first step. The states are analyzed and the associated voltage magnitudes and duration of time of the voltage magnitudes which persist are calculated in the second step. The third step discussed in this section uses the obtained results to calculate load point and system-oriented indices to reflect the sag performance of the network. It is worthwhile to point that there are some indices in the literature such as voltage sag energy and the lost energy caused by voltage sag. However, this section however mainly focuses on newly defined indices to avoid any misunderstanding. The indices and their mathematical formulation are described in the following.

2.3.1. Load Point Oriented Indices

Load point-oriented indices reflect the voltage quality of power served to a specific load point. They guide customers to choose the appropriate equipment specifications for their critical processes and find effective solutions to provide ride-through support for critical appliances. They also guide system managers in serving customers at different load points with the same power quality. The most important indices are as follows.
Sag density (SD): This is a two-dimensional figure or table to show the density of events versus magnitude and duration of the voltage sag event. Evidently, SD reflects only voltage sags which happened at the respective load point, no matter where the fault location was.
Sag frequency index (SFI): This index is represented by S F I x y where x and y denote thresholds for time duration and voltage magnitude. S F I x y represents the average number of sag events with a duration longer than x and a magnitude less than y at the respective load point. This index can be simply calculated by counting the number of events that occurred per annum with the respective characteristics.
Sag lost energy index (SLEI): During a sag event, voltage magnitude goes below the nominal voltage. This reduces the amount of energy delivered to loads connected to the respective load point. SLEI represents the expected energy lost per annum due to sag events in the respective load point. This index can be calculated as follows:
S L E I = k K W k ,
W k = 0 if   voltage   sag   k   is   not   severe t × D k if   voltage   sag   k   is   severe ,
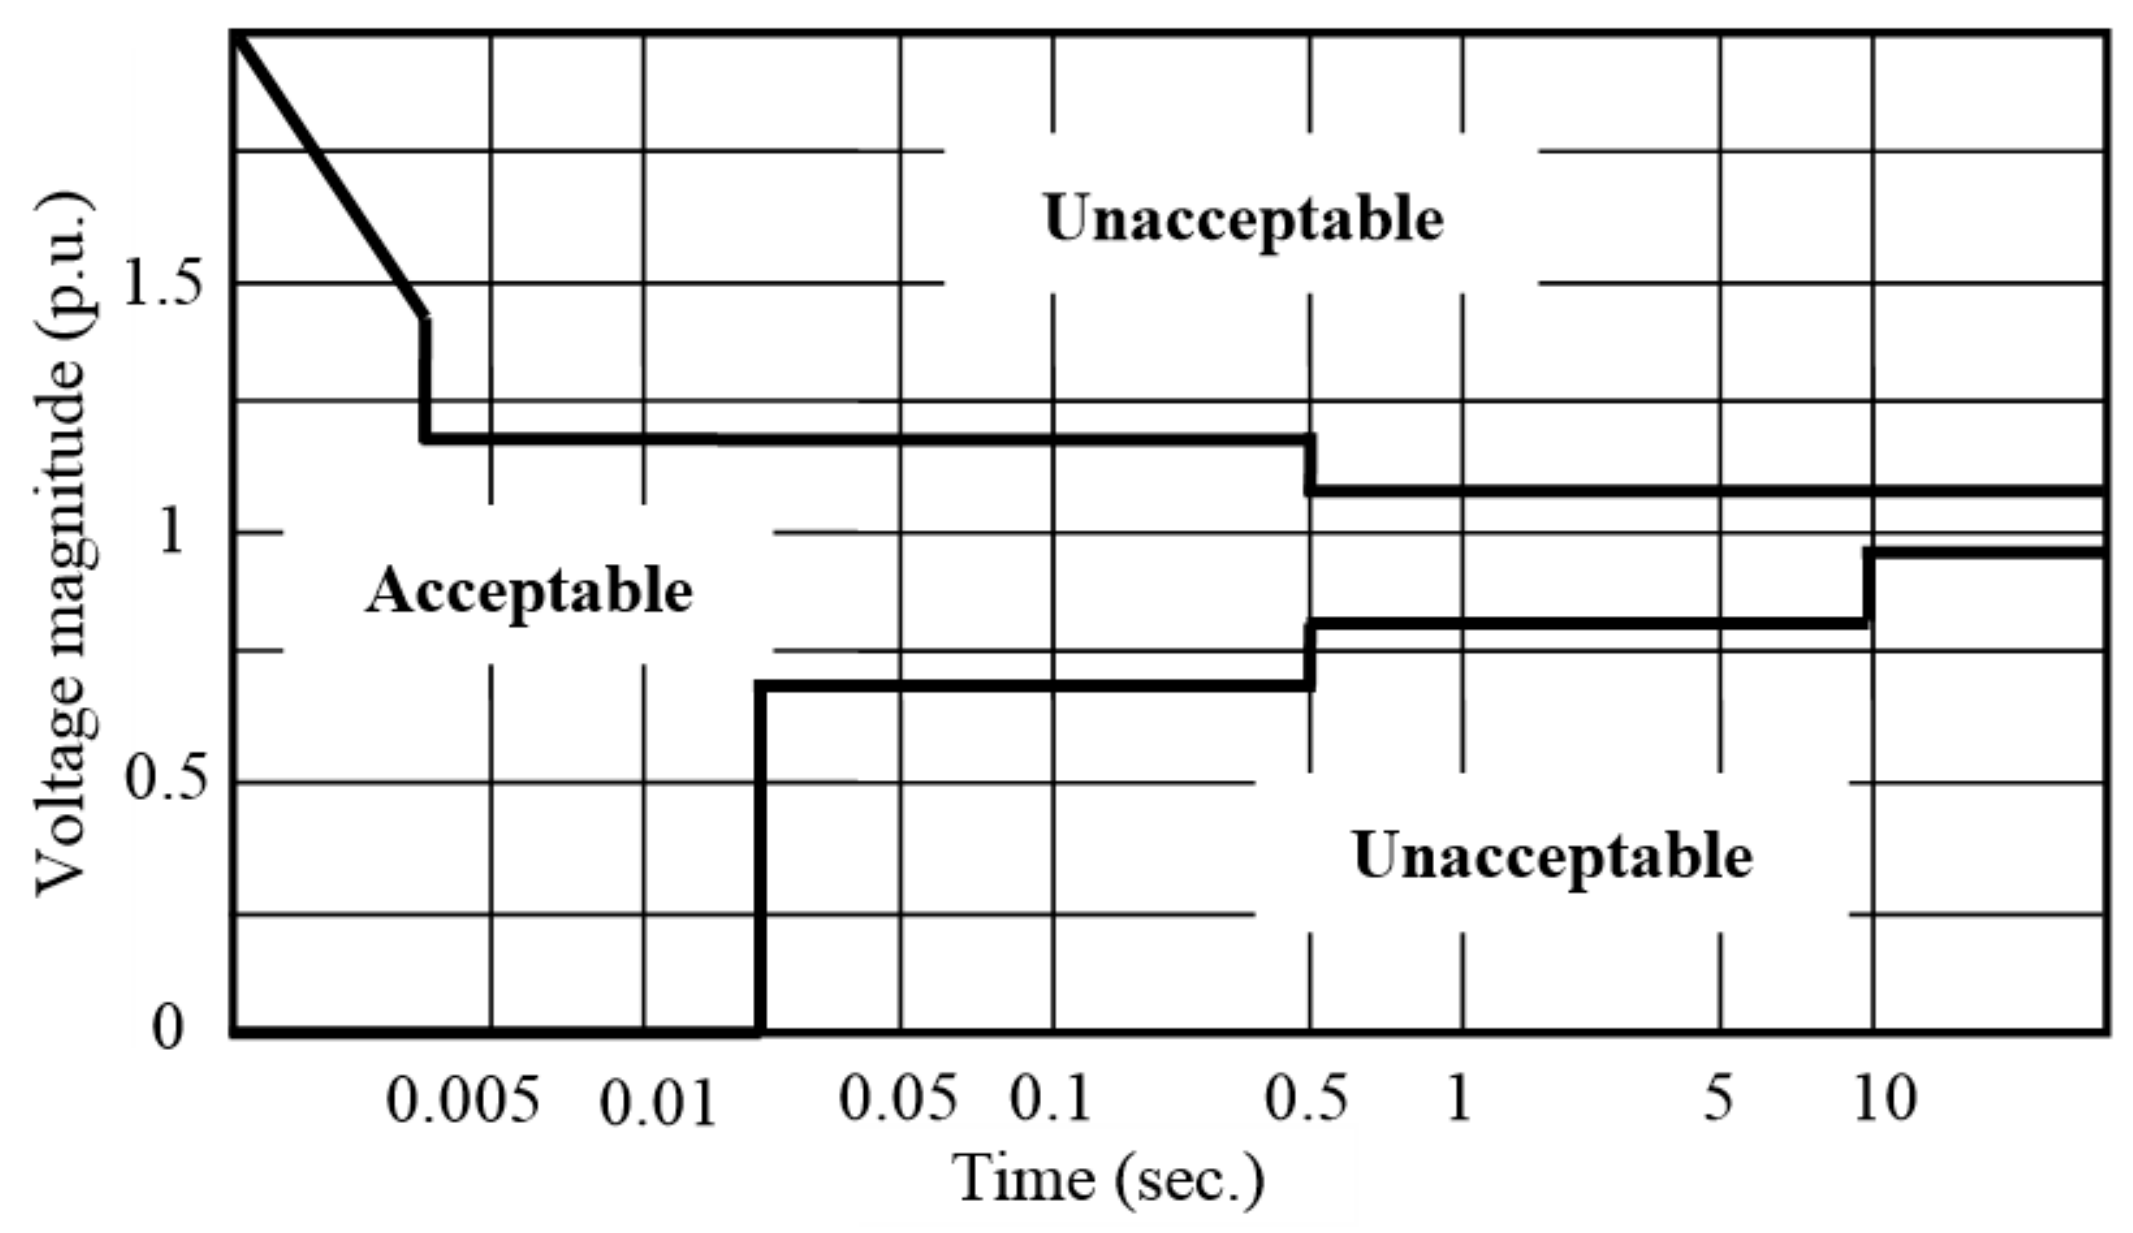
where, W k is the lost energy during the interruption caused by sag event k K . t is the average duration of interruption of activity or function due to severe sag event. It is worthwhile to note that t depends on the process of industry or business. D k is the power interrupted by sag event k K . The point that deserves a great emphasis is that only severe voltage sag events impose activity interruption to customers. In the literature, a few voltage tolerance curves have been proposed to identify severe voltage sag events which cause malfunction in customers’ operations. Among them, Information Technology Industry Council (ITIC) [17], as the most popular one, is shown in Figure 4. According to the figure, voltage sag events whose characteristics are within the curves do not impose any activity interruption to customers. Although using different interruption durations for different activities and functions is more accurate, average values are used due to the lack of detailed information. In this paper, indices focusing on energy lost due to voltage sag events are not calculated because of the lack of estimated interruption durations caused by voltage sag events. Developing a method for estimating the parameter can be a potential research activity for the future.
Sag cost index (SCI): Equipment malfunction caused by voltage sag events imposes costs to customers. SCI represents the expected annual cost imposed by voltage sag events to customers connected to the respective load point. This index is calculated as follows:
S C I = k K C k ,
where, C k is the cost imposed by voltage sag event k K . Similar to activity interruptions due to voltage sag, only severe voltage sag events impose costs to customers. According to Figure 4, voltage sag events whose characteristics are within the curves do not impose any cost to customers. Also, C k is a function of the amount and type of load connected to the respective load point. Although using different cost values for different types of load is more accurate, average values are usually used mainly due to the lack of detailed information. In Ref. [18], average damage cost per kW was estimated for different types of customers in Nordic countries. So, C k can be calculated as follows:
C k = 0 if   voltage   sag   k   is   not   severe c × D k if   voltage   sag   k   is   severe ,
where, c denotes the average cost per kW imposed by a severe voltage sag to customers connected to the load point.
Average sag cost index (ASCI): This index denotes the average cost imposed to customers connected to the respective load point due to a voltage sag event. ASCI can be calculated as follows:
A S C I = S C I / K .

2.3.2. System-Oriented Indices

System-oriented indices reflect the overall performance of a network. They support policy makers, regulators, and system managers in high-level decision making. A few system-oriented indices are defined in the following.
System sag density (SSD): System-oriented SSD, similar to SD, is a two-dimensional table or figure representing the density of voltage sag events versus their magnitude and duration. System-oriented SSD, unlike its load point-oriented version, i.e., SD, is configured considering voltage sag events all over the network. It should be mentioned that, since an event can cause several voltage sags through a network, each event is only represented by the most severe voltage sag in SSD.
System sag frequency index (SSFI): This index is represented by S S F I x y where x and y have definitions just similar to those of S F I x y . S S F I x y , similar to S F I x y , represents the average number of sag events with a duration longer than x and a magnitude less than y . This index is, however, calculated based on voltage sag events all over the network.
System average sag frequency index (SASFI): This index is represented by S A S F I x y where x and y denote thresholds for time duration and voltage magnitude. S A S F I x y is the average number of voltage sag events with a duration longer than x and a magnitude less than y that a customer would experience. S A S F I x y is calculated as follows:
S A S F I x y = i I N i × S S F I x y i i I N i ,
where, S S F I x y i denotes S S F I x y associated with load point i I , and N i is the number of customers connected to the load point.
System sag lost energy index (SSLEI): This index indicates the expected energy lost per annum due to sag events all over the network. SSLEI can be calculated as follows:
S S L E I = i I S L E I i ,
where, S L E I i is S L E I associated with load point i I .
System sag cost index (SSCI): This index is equal to the average annual cost caused by voltage sag events all over the network and is calculated as follows:
S S C I = i I S C I i ,
System average sag cost index (SASCI): The index is equal to the average cost caused by a voltage sag event. It can be calculated as follows:
S A S C I = S S C I / S S F I 0 0.9 .
Finally, it is worthwhile to mention that the proposed framework is scalable and can be easily applied to large-scale real-world networks. In the framework, the first step is to sample likely states of the system. Needless to mention, the number of system states increases as the system size increases. However, a simulation approach for state sampling such as Monte Carlo simulation approach is a great choice for state sampling in large-scale real-world networks with several likely states. So, without loss of generality, using simulation approaches may preserve the scalability of the first step in the proposed framework. The second step is to calculate fault current and nodal voltage magnitudes, which is well-developed knowledge available in several text books. So, the second and third steps of the framework are also scalable. Therefore, it can be concluded that the proposed framework is scalable and thus, applicable to the real-world networks.

3. Numerical Analyses

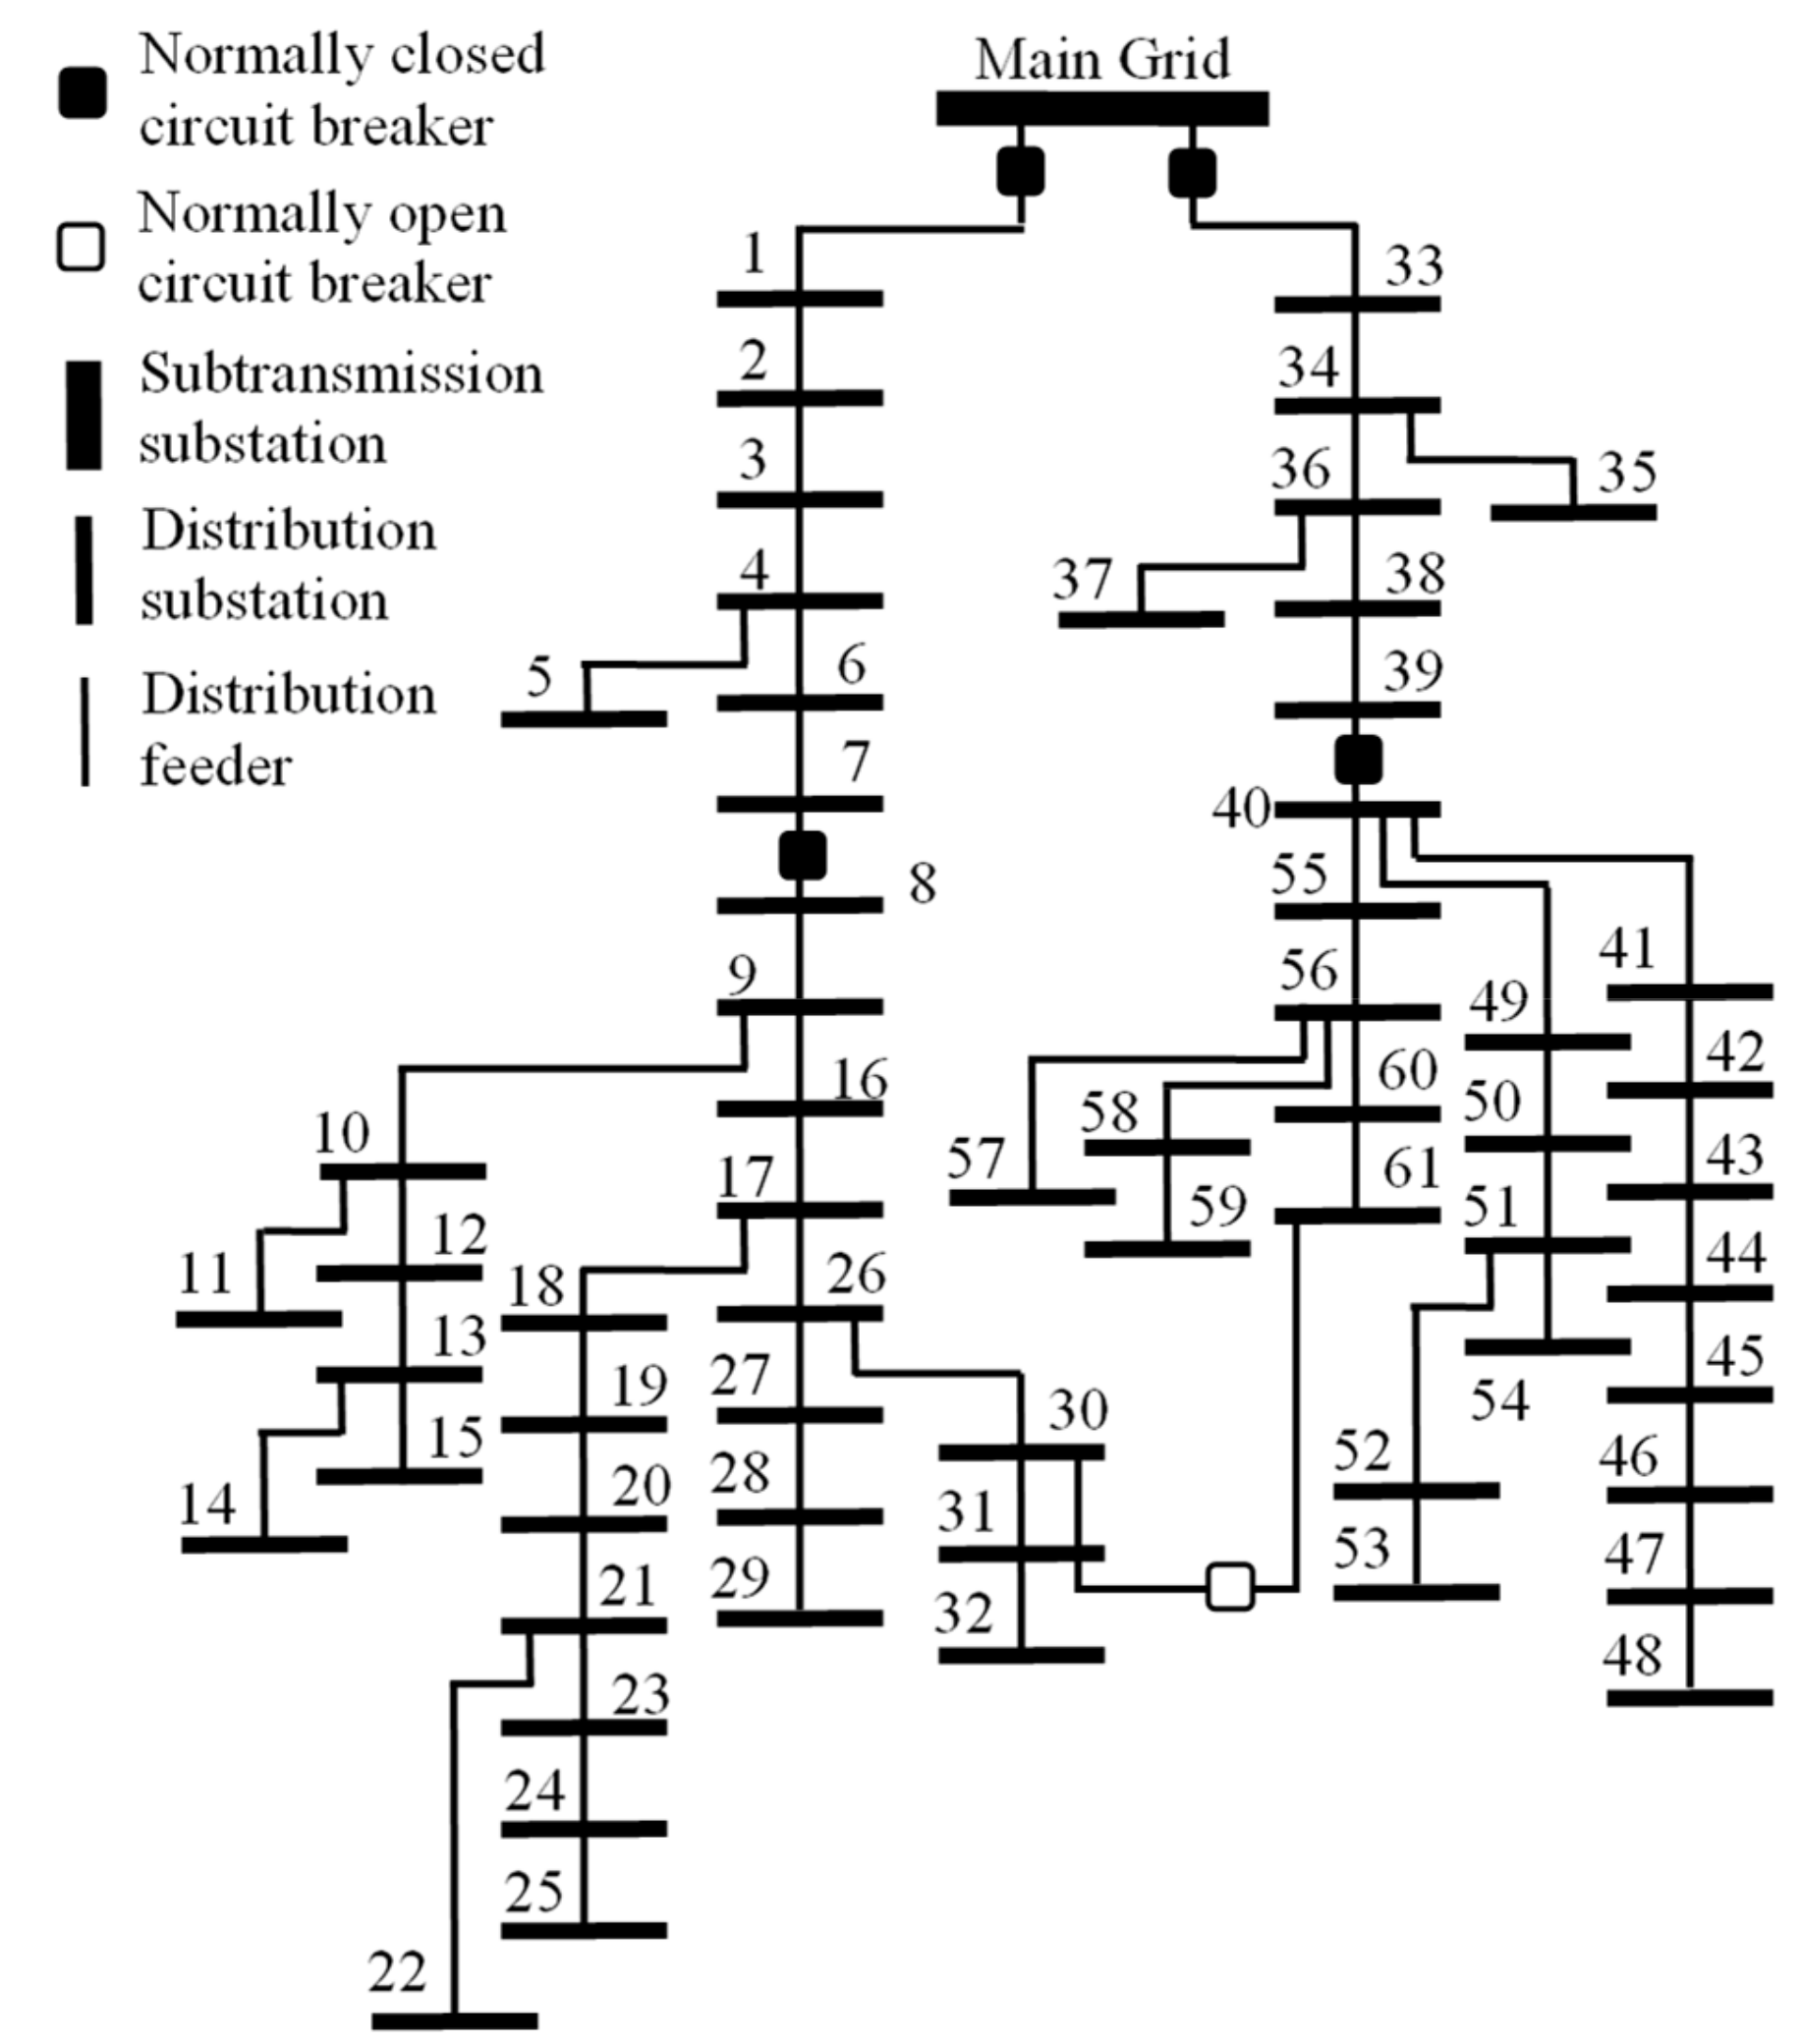
This section provides numerical analyses to demonstrate an application of the proposed framework to a realistic Finnish distribution network. The network, as shown in Figure 5, feeds 61 load points (which are numbered in the figure) through two radial feeders with a normally open tie-line between them. It is worthwhile to mention that this network has already been studied in Refs. [19,20,21,22,23,24,25]. The share of different fault types is shown in Table 1. It is worthwhile to mention that, in the table, LLL, LL, LLG, and LG stands for three phase, two phase, two phase to ground, and single phase to ground faults, respectively. The uncertainty in the fault location is modeled by a uniformly distributed probability density function. The random nature of fault duration is modeled by a Rayleigh probability density function with a scale parameter of 10 [26]. Finally, CBEMA voltage tolerance curves, shown in Figure 4, are used to assess the susceptibility of customers operations against voltage sag events.
In this analysis, without loss of generality, state selection is carried out using the Monte Carlo simulation approach. In this technique, random generation of new states is continued to the point where the indices are converged. It is worthwhile to note that the state selection could be carried out using any other state sampling approach. Figure 6 shows the evolution of SASFI and SSCI versus the number of sampled system states. As can be observed, both of the indices stabilize after sampling a few thousands states. The results provided in this study are based on 10,000 states. This large number of sampled states is to ensure that the study is converged and the final indices are precise. The selected states are then evaluated in MATLAB environment and voltage sag characteristics for each of the states are obtained. The outcomes are finally utilized to calculate both the load point and system-oriented indices. The following two sections report and thoroughly discuss the calculated indices.

3.1. Load Point Oriented Indices

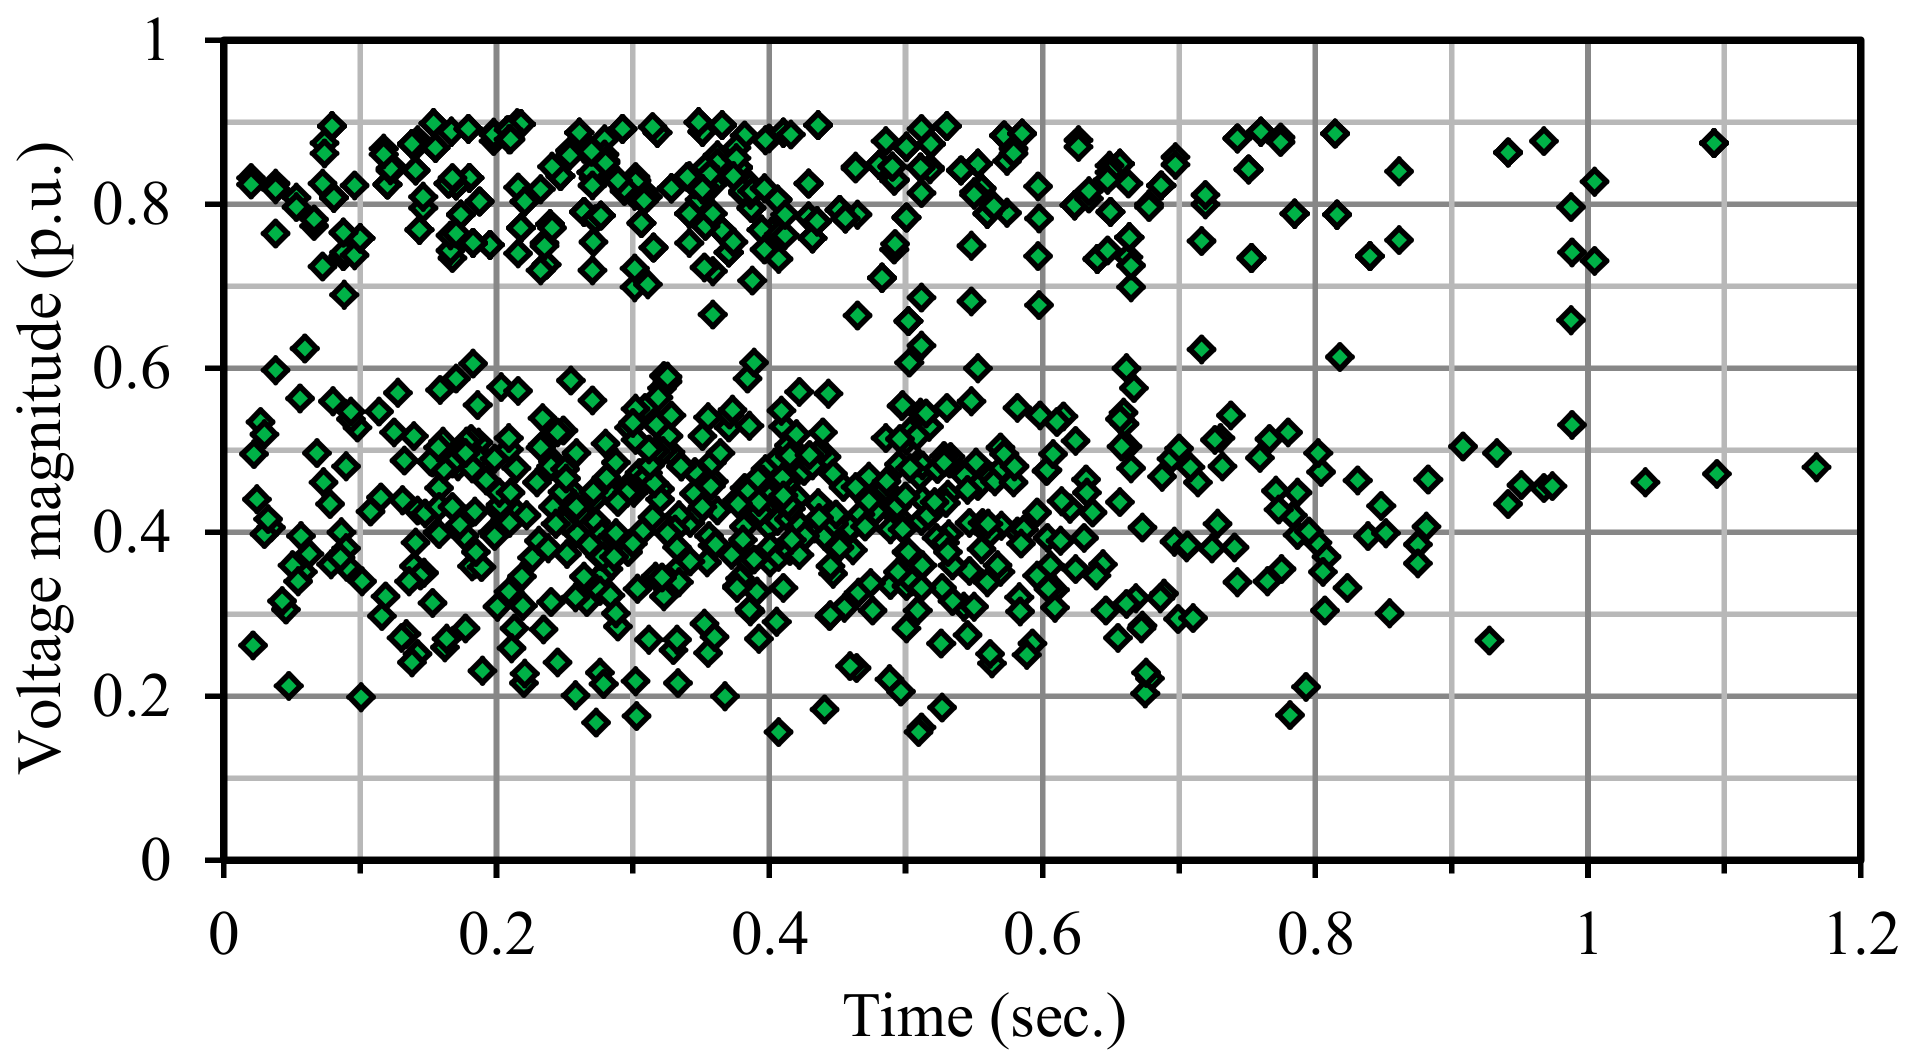
According to the single line diagram drawn in Figure 5, the network feeds 61 load points. Obviously, providing the load point-oriented indices associated with all of the load points is impossible. Therefore, due to a space limit, the indices associated with a few load points are only given. Figure 7 and Figure 8 illustrate the SD figure for load points 1 and 55, respectively. As can be seen, voltage magnitude associated with the load points is around either 0.4 pu or 0.8 pu during most of the voltage sag events. However, voltage magnitude at load point 55 is more evenly distributed rather than that of load point 1. Also, according to the results, the duration of voltage sag events is within the range of 0.1 to 0.6 seconds for most events.
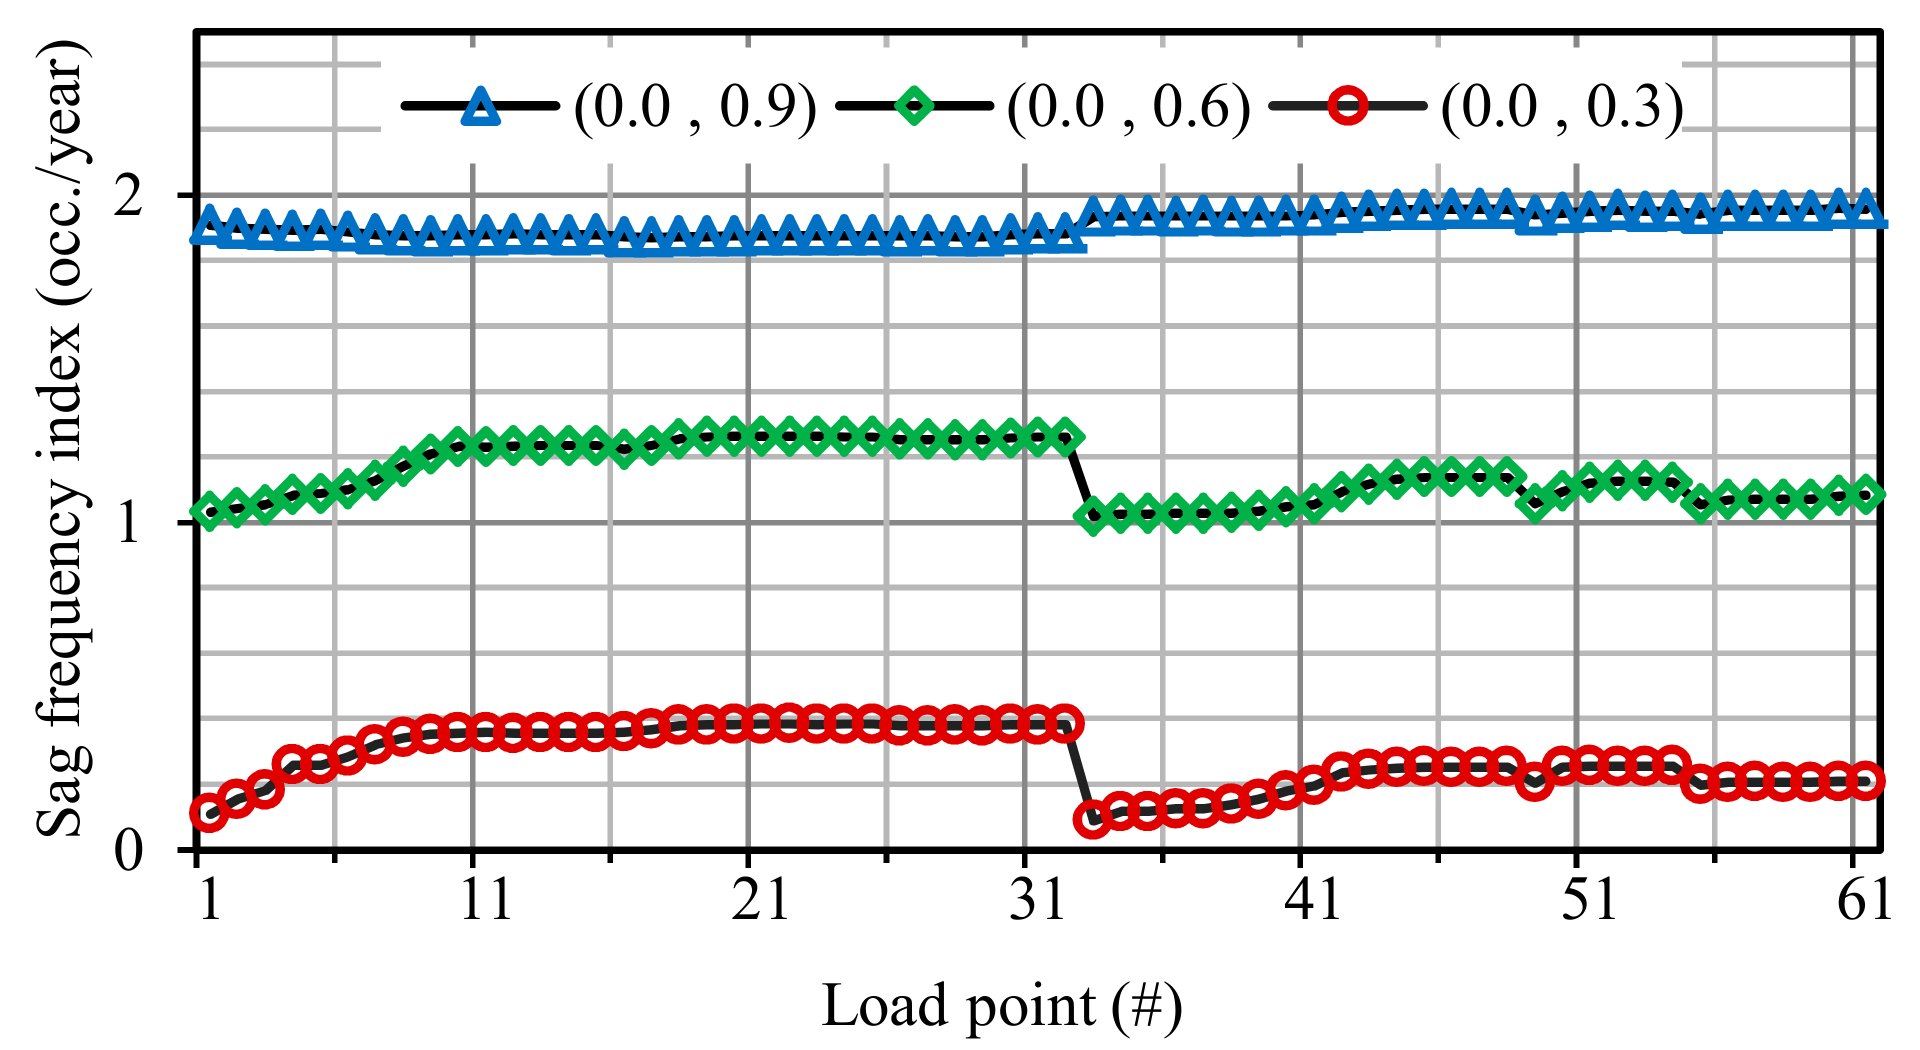
SFI at all network load points with three different voltage magnitude thresholds is shown in Figure 9. There are two major observations from the figure. First, the expected number of sag events increases by moving towards the end of the feeders. This is due to the fact that downstream load points completely sense events which occur within the upstream lines, however, upstream load points may not be affected by events which occur throughout the downstream lines. Second, there is a moderate variation in SFI associated with different load points. This is due to the fact that the electrical distance between load points in a small distribution network is short and hence, a fault anywhere in the network affects almost all load points.
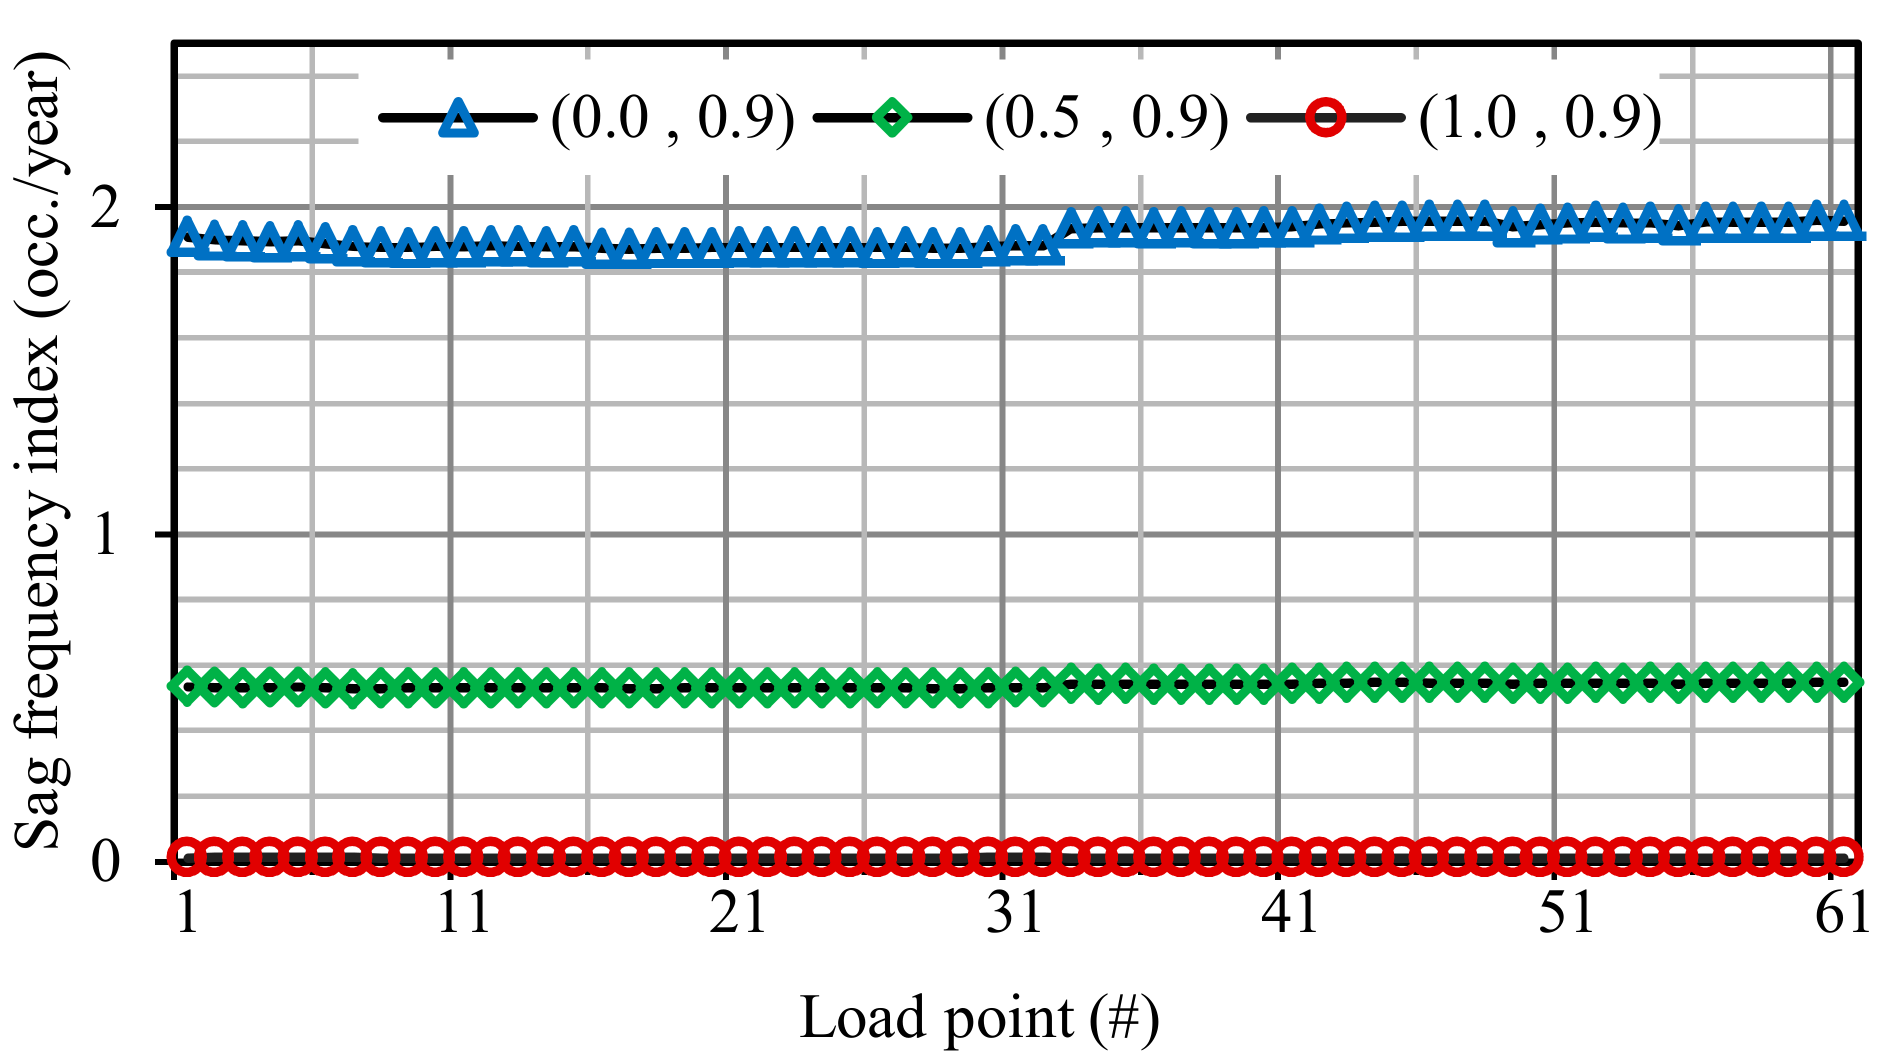
SFI with three different time duration thresholds for all network load points is shown in Figure 10. Owing to the results, SFI at all load points is almost the same. Also, most of the voltage sag events last for time durations shorter than 0.5 seconds, and voltage sag events with time durations longer than a second are scarce.
Severe voltage sag events cause malfunction in the operation of sensitive loads thereby imposing costs to customers. The well-known CBEMA curves, see Figure 4, are used here to identify severe events. SD for load points 1 and 55 are given in Table 2 and Table 3 where gray blocks indicate severe events which impose costs to customers connected to the load points. Summing up the frequencies associated with gray blocks, the occurrence frequency of severe voltage sag events can be calculated. The frequency for load points 1 and 55 is 1.1678 occ./year and 1.2684 occ./year, respectively.
Severe voltage sag events are identified for the network load points. Now, the cost imposed to customers connected to each load point is calculated, and the respective indices, i.e., SCI and ASCI, are shown in Figure 11. As can be seen, there is a large variation in SCI and ASCI indices associated with different load points. This large variation has two major reasons. First, it is due to different amounts of power demand at different load points. Second, loads connected to different load points have different unit interruption costs. For example, unit interruption costs are 3.52 €/kW and 0.73 €/kW for load points 4 and 48, respectively. According to the results, the biggest cost is imposed to load point 59 where the connected customers incur about 590 € per annum.

3.2. System-Oriented Indices

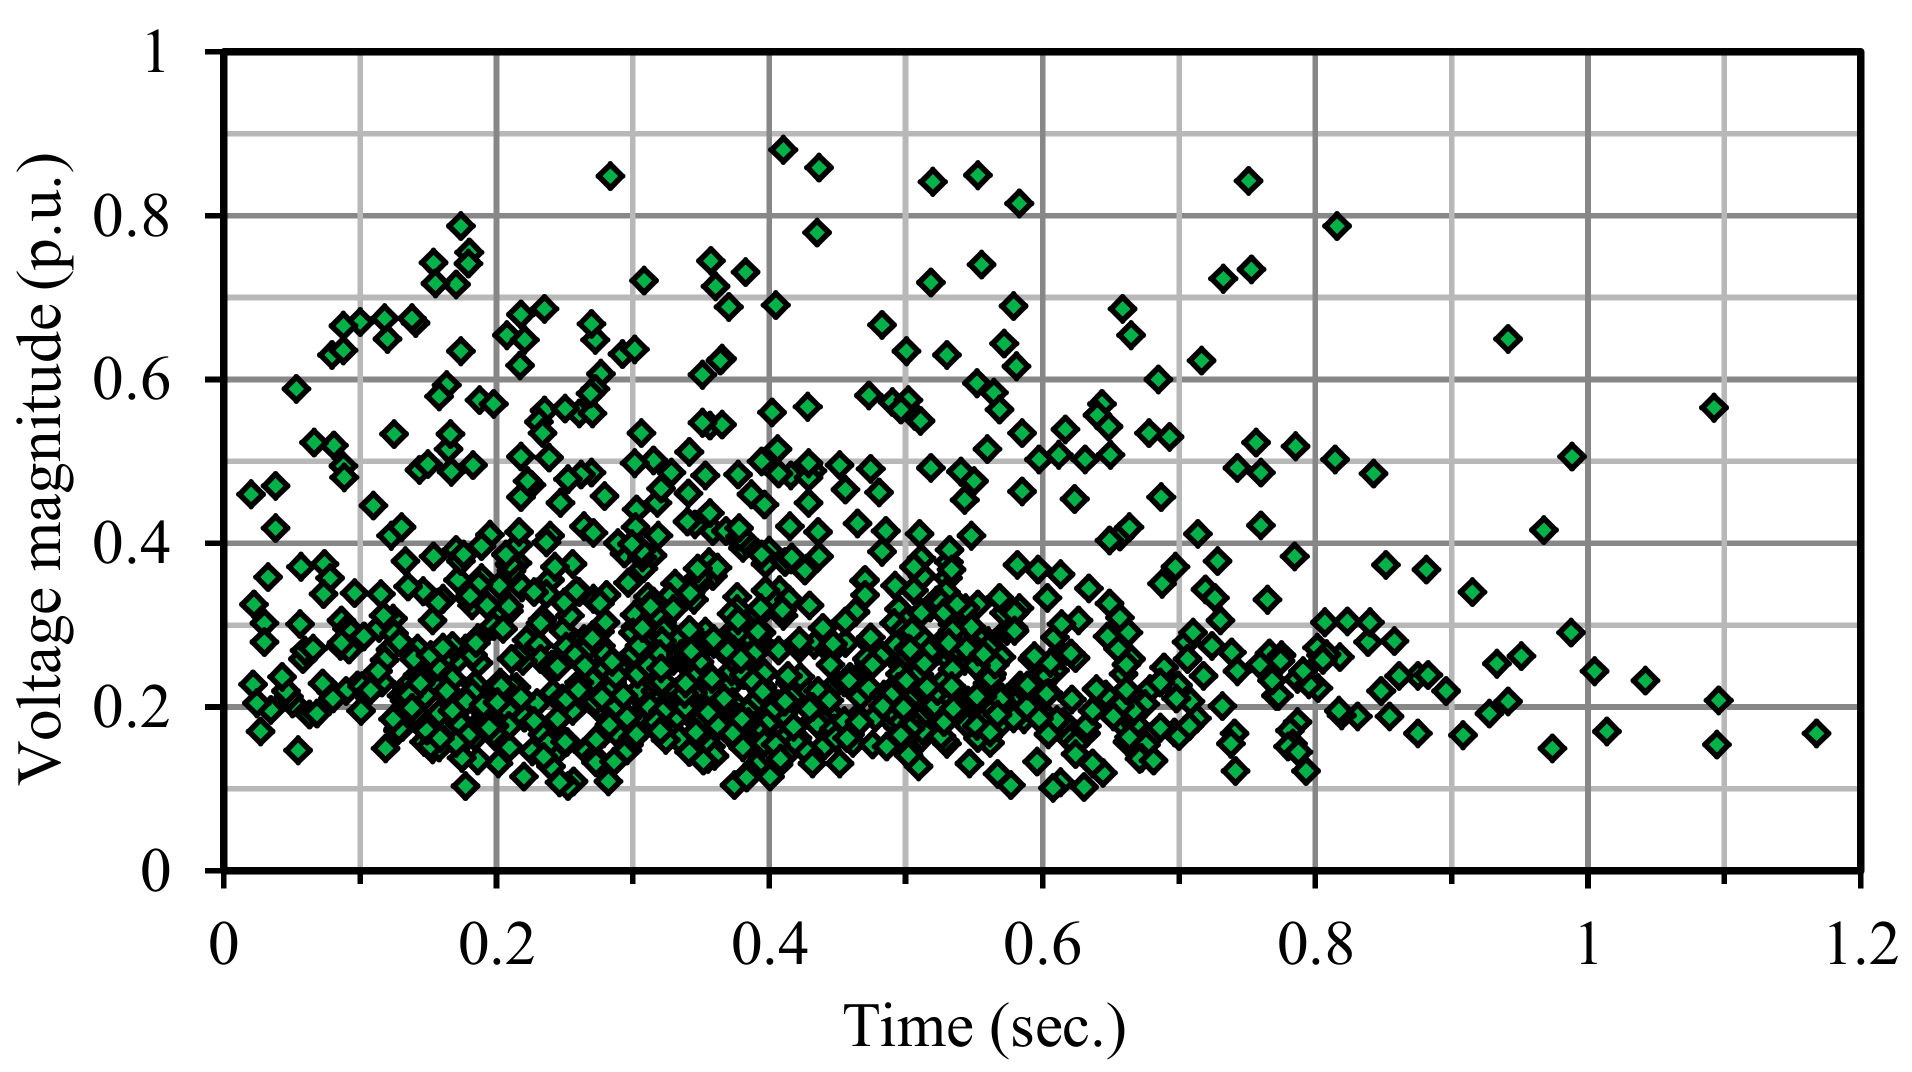
The load point-oriented indices were given and discussed in the previous section. This section provides system-oriented indices for the network under study. Figure 12 demonstrates SSD for the network under study. According to the results, voltage magnitude during most of the events is in the vicinity of 0.2 pu. Also, it can be seen that most of the events last for durations in a range of 0.1 to 0.6 seconds.
Table 4 gives SSFI for a few voltage magnitude and time duration thresholds. According to the results provided in the table, the network under study, on average, faces 4.2046 voltage sag events per annum. As can be seen from the results, most of the events are severe in voltage magnitude since nearly 94% (3.9326 out of 4.2046 events) of events lead to voltage magnitudes less than 0.6 pu, and nearly 64% (2.6731 out of 4.2046 events) of events result in voltage magnitudes less than 0.3 pu. Also, it can be seen that most of the events last less than 1 second. The share of voltage sag events with time durations longer than 1 second is around 0.6% (0.0261 out of 4.2046 events).
SASFI for a few voltage magnitude and time duration thresholds is given in Table 5. As can be observed from the table, in the network under study, load points experience, on average, 1.9119 voltage sag events per annum. The share of events with voltage magnitude less than 0.6 pu is 60% (1.1468 out of 1.9119 events). Similarly, the share of events with voltage magnitude less than 0.3 pu is 14% (0.2741 out of 1.9119 events). Again, most of the events last less than 1 second.
SSD for the network under study is provided in Table 6 where gray blocks indicate the events that impose costs to customers. According to the results, severe voltage sag events occur with a frequency of 4.1008. Comparing this value with S S F I 0 0.9 (see Table 6), more than 97.5% of voltage sag events that occur in the network impose costs to customers.
Table 7 gives system-oriented indices indicating lost costs caused by voltage sag events for the network under study. As can be seen, annual cost incurred due to voltage sag events is more than 9000 € which justifies the recent concerns on damages caused by voltage sag events. The average cost caused by each event is more than 2000 €. This large cost verifies the necessity of integrating voltage sag performance analysis in network reinforcement and planning studies.

4. Conclusions

This paper presented a general framework for voltage sag performance analysis of distribution networks. The framework consists of three consecutive stages namely state selection, state evaluation, and index calculation. The state selection stage is to select a set of system states in which voltage sag is likely. The state evaluation stage is to estimate voltage sag characteristics in the selected states. Finally, voltage sag performance of at hand network is reported by calculating a set of load point and system-oriented indices. The paper also presented a few new indices to indicate the overall characteristics of voltage sag events, their occurrence frequency, the amount of energy lost, and the cost imposed to customers due to voltage sag events. The framework was then applied to a real Finnish distribution network. The load point and system-oriented indices were calculated for the network. The obtained results indicate the significant costs imposed to customers due to voltage sag events. According to the results, the expected number of sag events increases by moving towards the end of the feeders. As another observation, there is a moderate variation in SFI associated with different load points since the studied network is a small distribution network where electrical distance between load points is short and hence, a fault anywhere in the network affects almost all load points. Owing to the results, it is of the utmost importance to consider voltage sag performance indices in network reinforcement and planning studies as well as when developing different fault management schemes. This is a topic for future research. Moreover, developing a method to estimate the duration of activity interruptions caused by voltage sag events is a potential research topic.

Author Contributions

A.S. performed the simulations and prepared the original research draft; M.F.-F. and M.L. proposed the main idea and supervised the work.

Funding

This research received no external funding.

Conflicts of Interest

The authors declare no conflict of interest.

References

  1. IEEE Std. 1159–2009. IEEE Recommended Practice for Monitoring Electric Power Quality; IEEE: Piscataway, NJ, USA, 2009. [Google Scholar]
  2. Gupta, C.P.; Milanović, J.V. Probabilistic assessment of equipment trips due to voltage sags. IEEE Trans. Power Deliv. 2006, 21, 711–718. [Google Scholar] [CrossRef]
  3. IEEE Std. 1250. Guide for Service to Equipment Sensitive to Momentary Voltage Disturbances; IEEE: Piscataway, NJ, USA, 2002. [Google Scholar]
  4. Electric Power Research Institute. Cost Analysis and Reduction of Power Quality Mitigation Equipment; Electric Power Research Institute: Palo Alto, CA, USA, 2000. [Google Scholar]
  5. Brooks, D.L.; Dugan, R.C.; Waclawiak, M.; Sundaram, A. Indices for assessing utility distribution system RMS variation performance. IEEE Trans. Power Deliv. 1998, 13, 254–259. [Google Scholar] [CrossRef] [Green Version]
  6. Heine, P.; Pohjanheimo, P.; Lehtonen, M.; Lakervi, E. A method for estimating the frequency and cost of voltage sags. IEEE Trans. Power Syst. 2002, 17, 290–296. [Google Scholar] [CrossRef]
  7. Lee, G.; Albu, M.M.; Heydt, G.T. A power quality index based on equipment sensitivity, cost, and network vulnerability. IEEE Trans. Power Deliv. 2004, 19, 1504–1510. [Google Scholar] [CrossRef]
  8. Martinez, J.A.; Arnedo, J.M. Voltage sag stochastic prediction using an electromagnetic transients program. IEEE Trans. Power Deliv. 2004, 19, 1975–1982. [Google Scholar] [CrossRef]
  9. Wang, J.; Chen, S.; Lie, T.T. System voltage sag performance estimation. IEEE Trans. Power Deliv. 2005, 20, 1738–1747. [Google Scholar] [CrossRef]
  10. Martinez, J.A.; Arnedo, J.M. Voltage sag studies in distribution networks-part I: System modeling. IEEE Trans. Power Deliv. 2006, 21, 1670–1678. [Google Scholar] [CrossRef]
  11. Xiangning, X.; Shun, T.; Tianshu, B.; Yonghai, X. Study on distribution reliability considering voltage sags and acceptable indices. IEEE Trans. Power Deliv. 2007, 22, 1003–1008. [Google Scholar] [CrossRef]
  12. Martinez, J.A.; Arnedo, J.M. Voltage sag studies in distribution networks-part II: Voltage sag assessment. IEEE Trans. Power Deliv. 2006, 21, 1679–1688. [Google Scholar] [CrossRef]
  13. Martinez, J.A.; Arnedo, J.M. Voltage sag studies in distribution networks-part III: Voltage sag index calculation. IEEE Trans. Power Deliv. 2006, 21, 1689–1697. [Google Scholar] [CrossRef]
  14. Naidu, S.R.; de Andrade, G.V.; da Costa, E.G. Voltage sag performance of a distribution system and its improvement. IEEE Trans. Ind. Appl. 2012, 48, 218–224. [Google Scholar] [CrossRef]
  15. Heine, P.; Lehtonen, M. Voltage sag distributions caused by power system faults. IEEE Trans. Power Syst. 2003, 18, 1367–1373. [Google Scholar] [CrossRef] [Green Version]
  16. Grainger, J.J.; Stevenson, W.D. Power System Analysis; McGraw-Hill Education: Noida, India, 2003. [Google Scholar]
  17. Information Technology Industry Council, ITI (CBEMA). Curve Application Note; Information Technology Industry Council, ITI (CBEMA): Washington, DC, USA, 2000. [Google Scholar]
  18. Lemström, B.; Lehtonen, M. Kostnader för elavbrott. In TemaNord; Nordisk Ministerråd: Copenhagen, Denmark, 1994; Volume 627, p. 165. [Google Scholar]
  19. Safdarian, A.; Fotuhi-Firuzabad, M.; Lehtonen, M. A medium-term decision model for DisCos: Forward contracting and TOU pricing. IEEE Trans. Power Syst. 2015, 30, 1143–1154. [Google Scholar] [CrossRef]
  20. Safdarian, A.; Fotuhi-Firuzabad, M.; Lehtonen, M. A stochastic framework for short-term operation of a distribution company. IEEE Trans. Power Syst. 2013, 28, 4712–4721. [Google Scholar] [CrossRef]
  21. Safdarian, A.; Fotuhi-Firuzabad, M.; Lehtonen, M. Benefits of demand response on operation of distribution networks: A case study. IEEE Syst. J. 2016, 10, 189–197. [Google Scholar] [CrossRef]
  22. Safdarian, A.; Degefa, M.Z.; Fotuhi-Firuzabad, M.; Lehtonen, M. Benefits of real-time monitoring to distribution systems: Dynamic thermal rating. IEEE Trans. Smart Grid 2015, 6, 2023–2031. [Google Scholar] [CrossRef]
  23. Safdarian, A.; Degefa, M.Z.; Lehtonen, M.; Fotuhi-Firuzabad, M. Distribution network reliability improvements in presence of demand response. IET Gener. Transm. Distrib. 2014, 8, 2027–2035. [Google Scholar] [CrossRef]
  24. Safdarian, A.; Ali, M.; Fotuhi-Firuzabad, M.; Lehtonen, M. Domestic EWH and HVAC management in smart grids: Potential benefits and realization. Electr. Power Syst. Res. 2016, 134, 38–46. [Google Scholar] [CrossRef] [Green Version]
  25. Safdarian, A.; Fotuhi-Firuzabad, M.; Lehtonen, M. Integration of price-based demand response in DisCos’ short-term decision model. IEEE Trans. Smart Grid 2014, 5, 2235–2245. [Google Scholar] [CrossRef]
  26. Faried, S.O.; Aboreshaid, S. Stochastic evaluation of voltage sags in series capacitor compensated radial distribution systems. IEEE Trans. Power Deliv. 2003, 18, 744–750. [Google Scholar] [CrossRef]
Figure 1. Three steps of voltage sag performance analysis.
Energies 12 02824 g001
Figure 2. Seven-step approximation of a typical normal density function.
Energies 12 02824 g002
Figure 3. Time-current characteristic curves of typical over-current relays.
Energies 12 02824 g003
Figure 4. Information Technology Industry Council (ITIC) voltage tolerance curves [17].
Energies 12 02824 g004
Figure 5. Single line diagram of Finnish distribution network under study.
Energies 12 02824 g005
Figure 6. (a) Evolution of SASFI versus the number of sampled states for the network under study; (b) Evolution of SSCI versus the number of sampled states for the network under study.
Energies 12 02824 g006
Figure 7. SD associated with load point 1.
Energies 12 02824 g007
Figure 8. SD associated with load point 55.
Energies 12 02824 g008
Figure 9. SFI with three different voltage magnitude thresholds associated with load points in the network.
Energies 12 02824 g009
Figure 10. SFI with three different time duration thresholds associated with load points in the network.
Energies 12 02824 g010
Figure 11. SCI and ASCI associated with different load points in the network.
Energies 12 02824 g011
Figure 12. SSD associated with the network under study.
Energies 12 02824 g012
Table 1. Share of different fault types in the network under study.
LLLLLLLGLG
17%9%24%50%
Table 2. SD for load point 1.
Voltage Magnitude (%)Duration (Seconds)
0–0.020.02–0.20.2–0.50.5–0.80.8–1.21.2–1.5
80–900.00130.09690.27300.12480.01820.0008
70–800.00060.06290.15950.07020.01260
60–700.00010.00950.03060.01390.00110
50–6000.03320.08400.04020.00700
40–500.00060.07840.23840.10820.01820.0001
30–400.00070.05730.16540.07680.01420.0004
20–300.00010.01710.05490.02350.00220
10–2000.00170.00660.00200.00010
Table 3. SD for load point 55.
Voltage Magnitude (%)Duration (Seconds)
0–0.020.02–0.20.2–0.50.5–0.80.8–1.21.2–1.5
80–900.00110.08940.24210.10860.01720
70–800.00100.06080.15210.06690.00940.0004
60–7000.01990.07780.03480.00570.0008
50–600.00030.04370.12850.06280.01000.0001
40–500.00030.06110.16710.07430.01110.0001
30–400.00010.05440.16010.07040.01220.0001
20–300.00070.03060.08980.04230.00860
10–2000.00520.01350.00520.00140.0001
Table 4. SSFI for the network under study (occ./year).
S S F I 0 0.9 S S F I 1 0.9 S S F I 0 0.6 S S F I 1 0.6 S S F I 0 0.3 S S F I 1 0.3
4.20460.02613.93260.02442.67310.0181
Table 5. SASFI for the network under study (occ./year).
S A S F I 0 0.9 S A S F I 1 0.9 S A S F I 0 0.6 S A S F I 1 0.6 S A S F I 0 0.3 S A S F I 1 0.3
1.91190.01161.14680.00730.27410.0018
Table 6. SSD for the network under study.
Voltage Magnitude (%)Duration (Seconds)
0–0.020.02–0.20.2–0.50.5–0.80.8–1.21.2–1.5
80–900–0.020.02–0.20.2–0.50.5–0.80.8–1.21.2–1.5
70–800.00040.00500.01980.01430.00130
60–700.00040.01850.03870.01770.00250
50–600.00040.02690.08790.03320.00460.0004
40–500.00040.05050.14340.06730.01220.0004
30–400.00040.06180.14590.06600.01050.0004
20–300.00040.13500.38100.15900.02480
10–200.00250.28470.81870.40030.05930.0004
Table 7. SSCI and SASCI for the network under study.
SSCI (€/Year)SASCI (€/occ.)
9054.232153.40