Article

The Effect of Fiber Orientation on Stochastic Reconstruction and Permeability of a Carbon Paper Gas Diffusion Layer

1
School of Automotive Studies, Tongji University, Shanghai 201804, China
2
Research & Advanced Technology Dept., SAIC Motor Corporation Limited, Shanghai 201804, China
*
Author to whom correspondence should be addressed.
Energies 2019, 12(14), 2808; https://doi.org/10.3390/en12142808
Submission received: 25 June 2019 / Revised: 11 July 2019 / Accepted: 13 July 2019 / Published: 22 July 2019
(This article belongs to the Special Issue Latest Progress for Proton Exchange Membrane Fuel Cells)

Abstract

:
By analyzing the three-dimensional digital model of a real carbon paper gas diffusion layer (GDL) reconstructed by X-ray computed tomography (CT), it was found that fibers are not distributed at any angle but within a certain range. The fiber orientation can be represented by fiber pitch (i.e., the angle between a single fiber and the in-plane direction). The effect of fiber orientation on stochastic reconstruction and transport properties (permeability) was investigated in this paper to find which fiber pitch range can achieve a better GDL on fluid flow. First, the actual fiber pitch was measured by analyzing SGL-24BA images obtained by X-ray CT. Also, seven different ranges of fiber pitch were randomly chosen to reconstruct GDL. Then, the permeability of these digital models was calculated using the Lattice Bolzmann Method (LBM) and discussed to obtain the fiber pitch range of the optimal permeability. The results show that the mean fiber pitch of SGL-24BA is 2.40° and the individual values are all less than 6°, also, the permeability of the through-plane direction increases gradually as the range of fiber pitch increases, which can be used for the structural design of carbon paper GDL.

Graphical Abstract

1. Introduction

With the growing shortage of energy and increasing environmental pollution, countries around the world are paying more and more attention to new energy technologies. Fuel cells are widely used as energy conversion devices with high energy density, high-energy conversion efficiency and low environmental pollution. Among them, the proton exchange membrane fuel cell (PEMFC) has the advantages of a low operating temperature, fast starting speed, long service life, modular installation and convenient operation, thus, it is considered as one of the most promising alternative power sources for electric vehicles, mobile devices and decentralized power stations. This new, efficient and clean power generation system can be used in transportation, military, communications and other fields. However, factors such as high cost, unsatisfactory durability, and complicated water management severely restrict the large-scale commercialization of PEMFC. Therefore, more and more scholars have begun to investigate these problems.
As one of the components of PEMFC, membrane electrode assembly (MEA) is usually composed of a gas diffusion layer (GDL), catalyst layer (CL) and proton exchange membrane and constructed by a hot-pressing process, which has a decisive influence on fuel cell performance. The GDL is a key part of MEA, and is usually made of carbon paper or carbon cloth treated with a hydrophobic agent (polytetrafluoroethylene PTFE) with a thickness of about 100–400 μm and a pore diameter of about 10 μm. It is used for supporting the catalyst layer, collecting current and providing a path for reactants and products, which helps the redistribution of reactant gas and product water between the channel and catalyst layer. The characteristics of the porous medium directly affect the internal material transfer process, and thus have a critical impact on the overall performance of PEMFC.
So far, many scholars have used flow simulation methods to study the characteristics of porous media from a microscopic point to improve its pore structure and avoid the phenomenon of “flooding” in cathodes. Among many steps, realizing the reconstruction of the real microstructure is a key step. The two existing reconstruction methods are the image synthesis method and the stochastic reconstruction method. The former method can obtain the real microstructure of GDL while the latter has lower costs and higher ease of use.
The image synthesis method reconstruction technique uses X-ray computed tomography (X-ray CT) [1,2], or focused ion beam (FIB) [2], or scanning electron microscopy (SEM) to obtain multiple sheets of 2D images. Of these, X-ray CT scans the material three-dimensionally, and FIB/SEM scans the surface of thinned materials obtained by milling and then, processes and integrates all the 2D images to obtain the 3D microscopic geometry of the material. The advantage of this method is that the micro-geometry obtained is more realistic, but the cost is higher and it is limited by the spatial resolution of the image technology and the resolving power of each phase.
At present, the resolution of X-ray CT has reached micro, even nano-scale. The micron-scale X-ray CT can recognize the pore structure inside the GDL and is not affected by the addition of a hydrophobic agent (PTFE) and binder or under different clamping forces. Therefore, micron-scale X-ray CT is widely used in the reconstruction of GDL without a micro porous layer (MPL). The pore structure of MPL can be obtained by nanoscale X-ray CT. Since this technology was only developed in the past two years, there are not many application examples. The resolution of FIB/SEM is smaller, but the fiber structure obtained by this method is discontinuous, so this method is rarely used to reconstruct GDL. In summary, we used X-ray CT technology to carry out three-dimensional reconstruction of carbon paper GDL.
There have been many previous papers that have reported the 3D reconstruction of GDL using the X-ray method [3,4,5,6,7,8,9,10]. For example, Koido et al. [4] obtained carbon paper GDL (Toray TGP-H-060) by microfocal X-ray CT using a thinning algorithm of an image processing technique to extract the connectivity number for constructing the pore network. Then, three key steps for GDL reconstruction were proposed by Rama et al. [7]: progressive acquiring of 2D images via X-ray tomography, processing of acquired images, and reconstructing the 3D digital mode. They simulated the single-phase air flow though the GDL to calculate the absolute permeability of 14 regions by introducing 3D binary mesh into the LB model, which was converted from shadow images obtained by X-ray micro/nano-tomography. GDL can be performed by X-ray CT even when it is under compression, as was proved by Inoue et al. [3]. Moreover, Rama et al. presented a 3D morphological model of a carbon cloth GDL by using the three main steps mentioned above [8]. In another study, they investigated the compression effect on the transport properties of carbon cloth [5] via applying X-ray micro-tomography with four main steps: preparation of the sample, acquisition of 2D shadow images, processing the acquired images, and reconstructing the 3D digital model. In their reconstructed GDL, which consists of fibers with binder, void space even water was presented by X-ray CT for investigating transport porosities in [3,9]. The effects of image resolution of carbon paper GDL on gas permeability were investigated by Jinuntuya et al. [10]. In [11], to obtain the complete GDL with MPL, they obtained the MPL structure by a nano-scale X-ray CT and the combined GDL-MPL structure by using micro X-ray CT.
The stochastic reconstruction method [12,13,14] generates a virtual model by using a random number generator, statistical information of the constituent materials, and setting a series of rules. By studying the 2D images of the cross-section of the material obtained by SEM, the geometrical distribution statistics of the fiber, such as porosity, fiber diameter, etc., can be obtained. These parameters are input to construct the 3D model by stochastic algorithm. The advantage of this method is that it has lower costs and is easy to implement, however, it only approximates the real micro-pore structure and the simulation results will deviate.
There are two main methods for stochastic reconstruction:
(1)
arbitrarily place cylindrical fibers in a three-dimensional space [12]
(2)
arbitrarily place a cylindrical shape in a horizontal plane to obtain a single-layer fiber structure and then stack to multiple layers [13,14].
The first method is to ensure that the overall porosity is constant, while the porosity of each layer in the second method is constant. The randomly reconstructed carbon paper obtained in this paper is based on the former method.
Fiber pitch is a parameter that describes the anisotropy of GDL, which is defined by the angle the fiber makes with the in-plane direction of the GDL material according to Hinebaugh et al. [15]. Their paper also reported the 3D orientation of fibers by measuring the nano-CT image of Toray TGP-H 090 0 wt% PTFE to be used as an input to the stochastic method. The work [16] of Fishman et al. showed through observation that the orientation of carbon fiber is largely coplanar to the GDL. So, most models have used zero pitch to reconstruct single fibers [13,17,18,19], and others have used distributions of small pitch values to fine-tune GDL anisotropy [12,20].
This paper discusses the influence of the fiber orientation (fiber pitch) of carbon paper GDL on stochastic reconstruction and permeability. First, the true GDL of SGL-24BA images were obtained by X-ray CT to measure the fiber pitch. Then, the reconstruction of carbon paper GDL was realized by the stochastic method. Finally, seven different ranges of fiber pitch were chosen randomly to reconstruct GDL and the permeability of these digital models were calculated using the LBM to get the fiber pitch range of the optimal permeability.

2. Reconstruction of Carbon Paper GDL by X-ray CT

The process of three-dimensional reconstruction of carbon paper by X-ray CT technology [7] mainly includes:
(1)
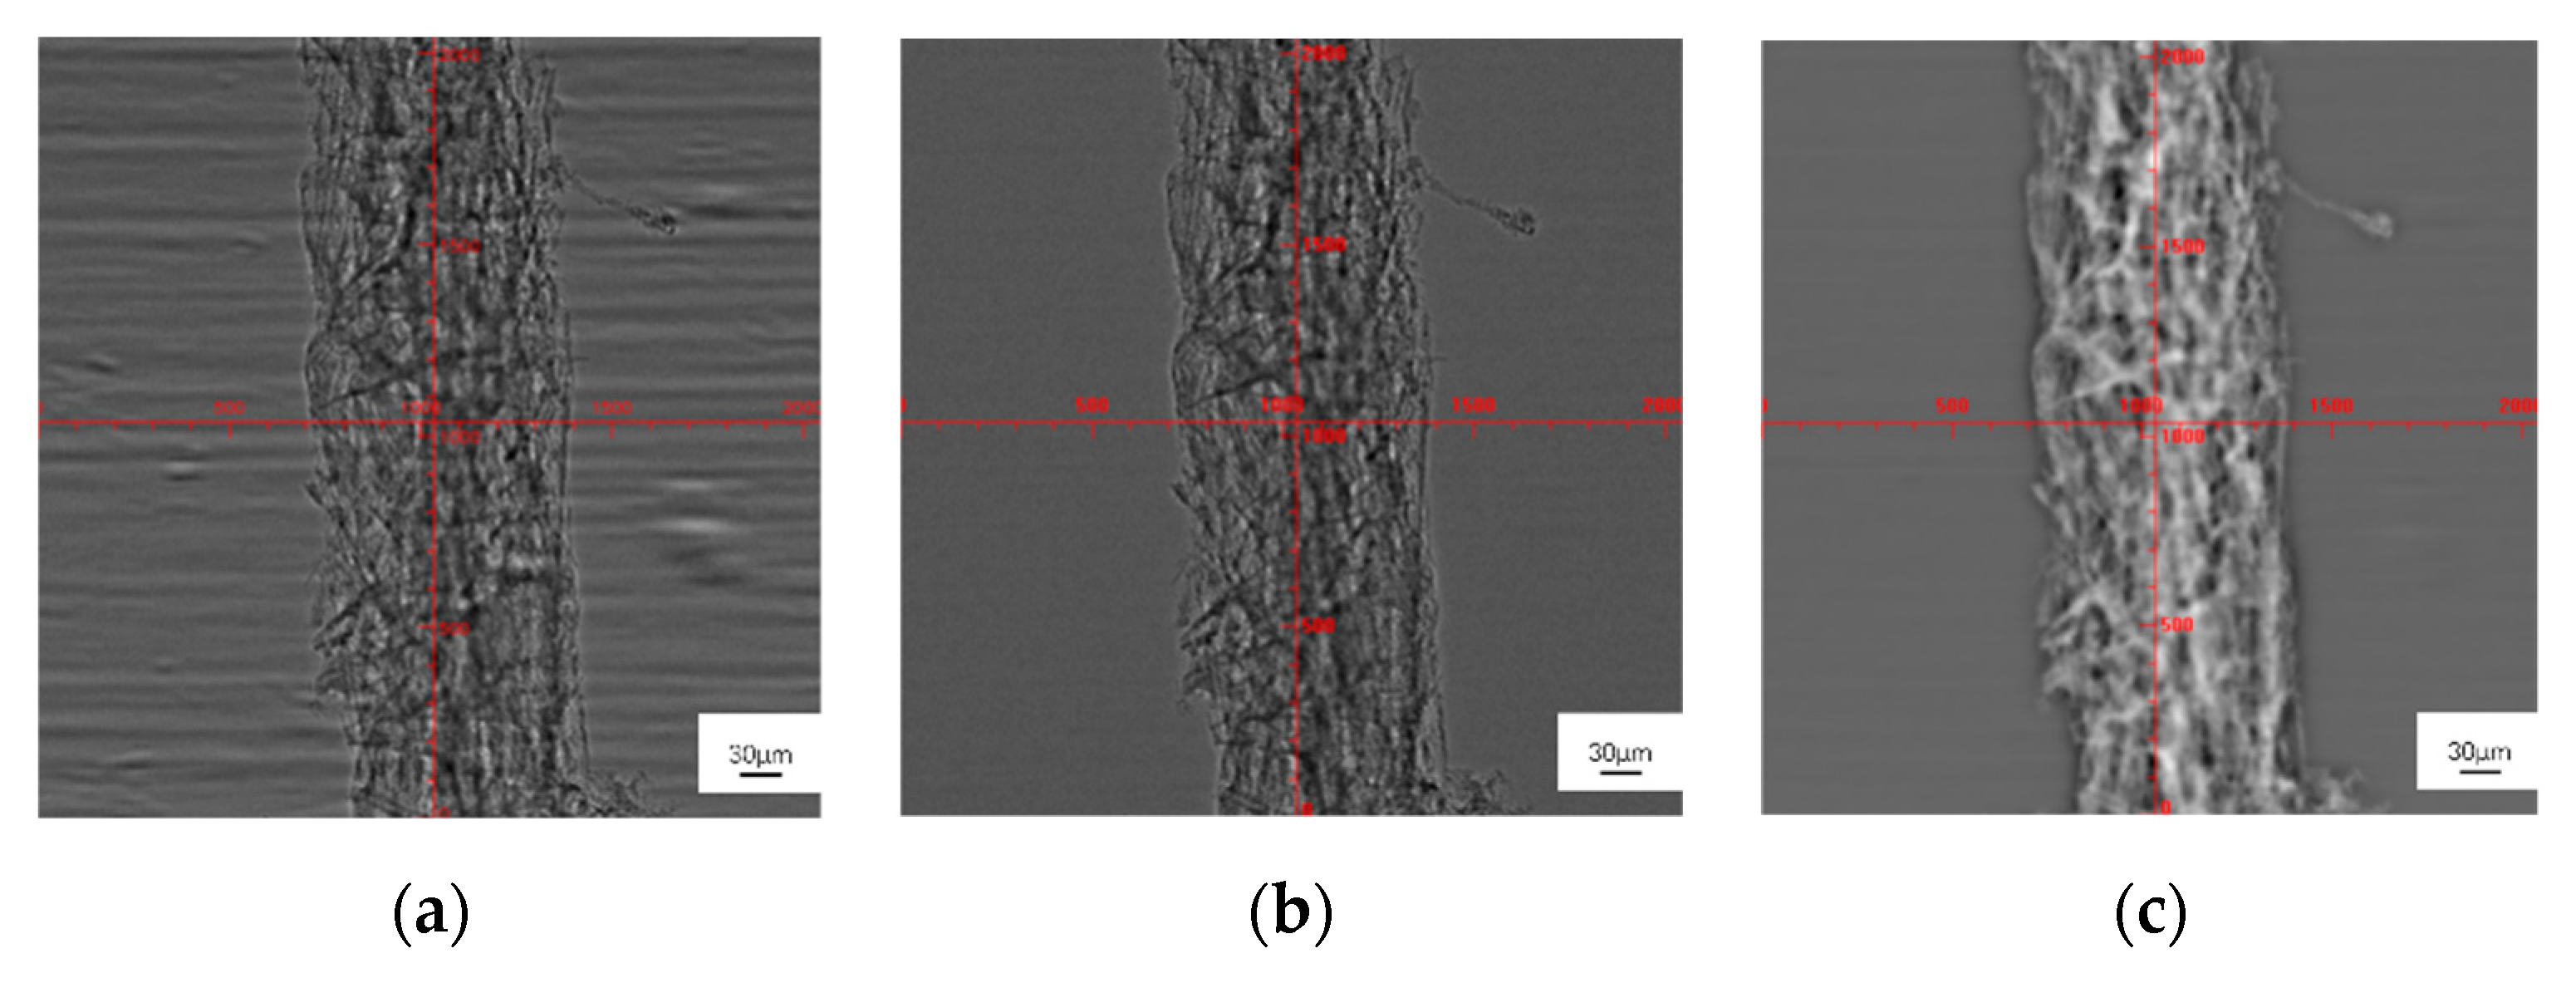
Image acquisition: take two-dimensional projection images of carbon paper by X-ray CT.
(2)
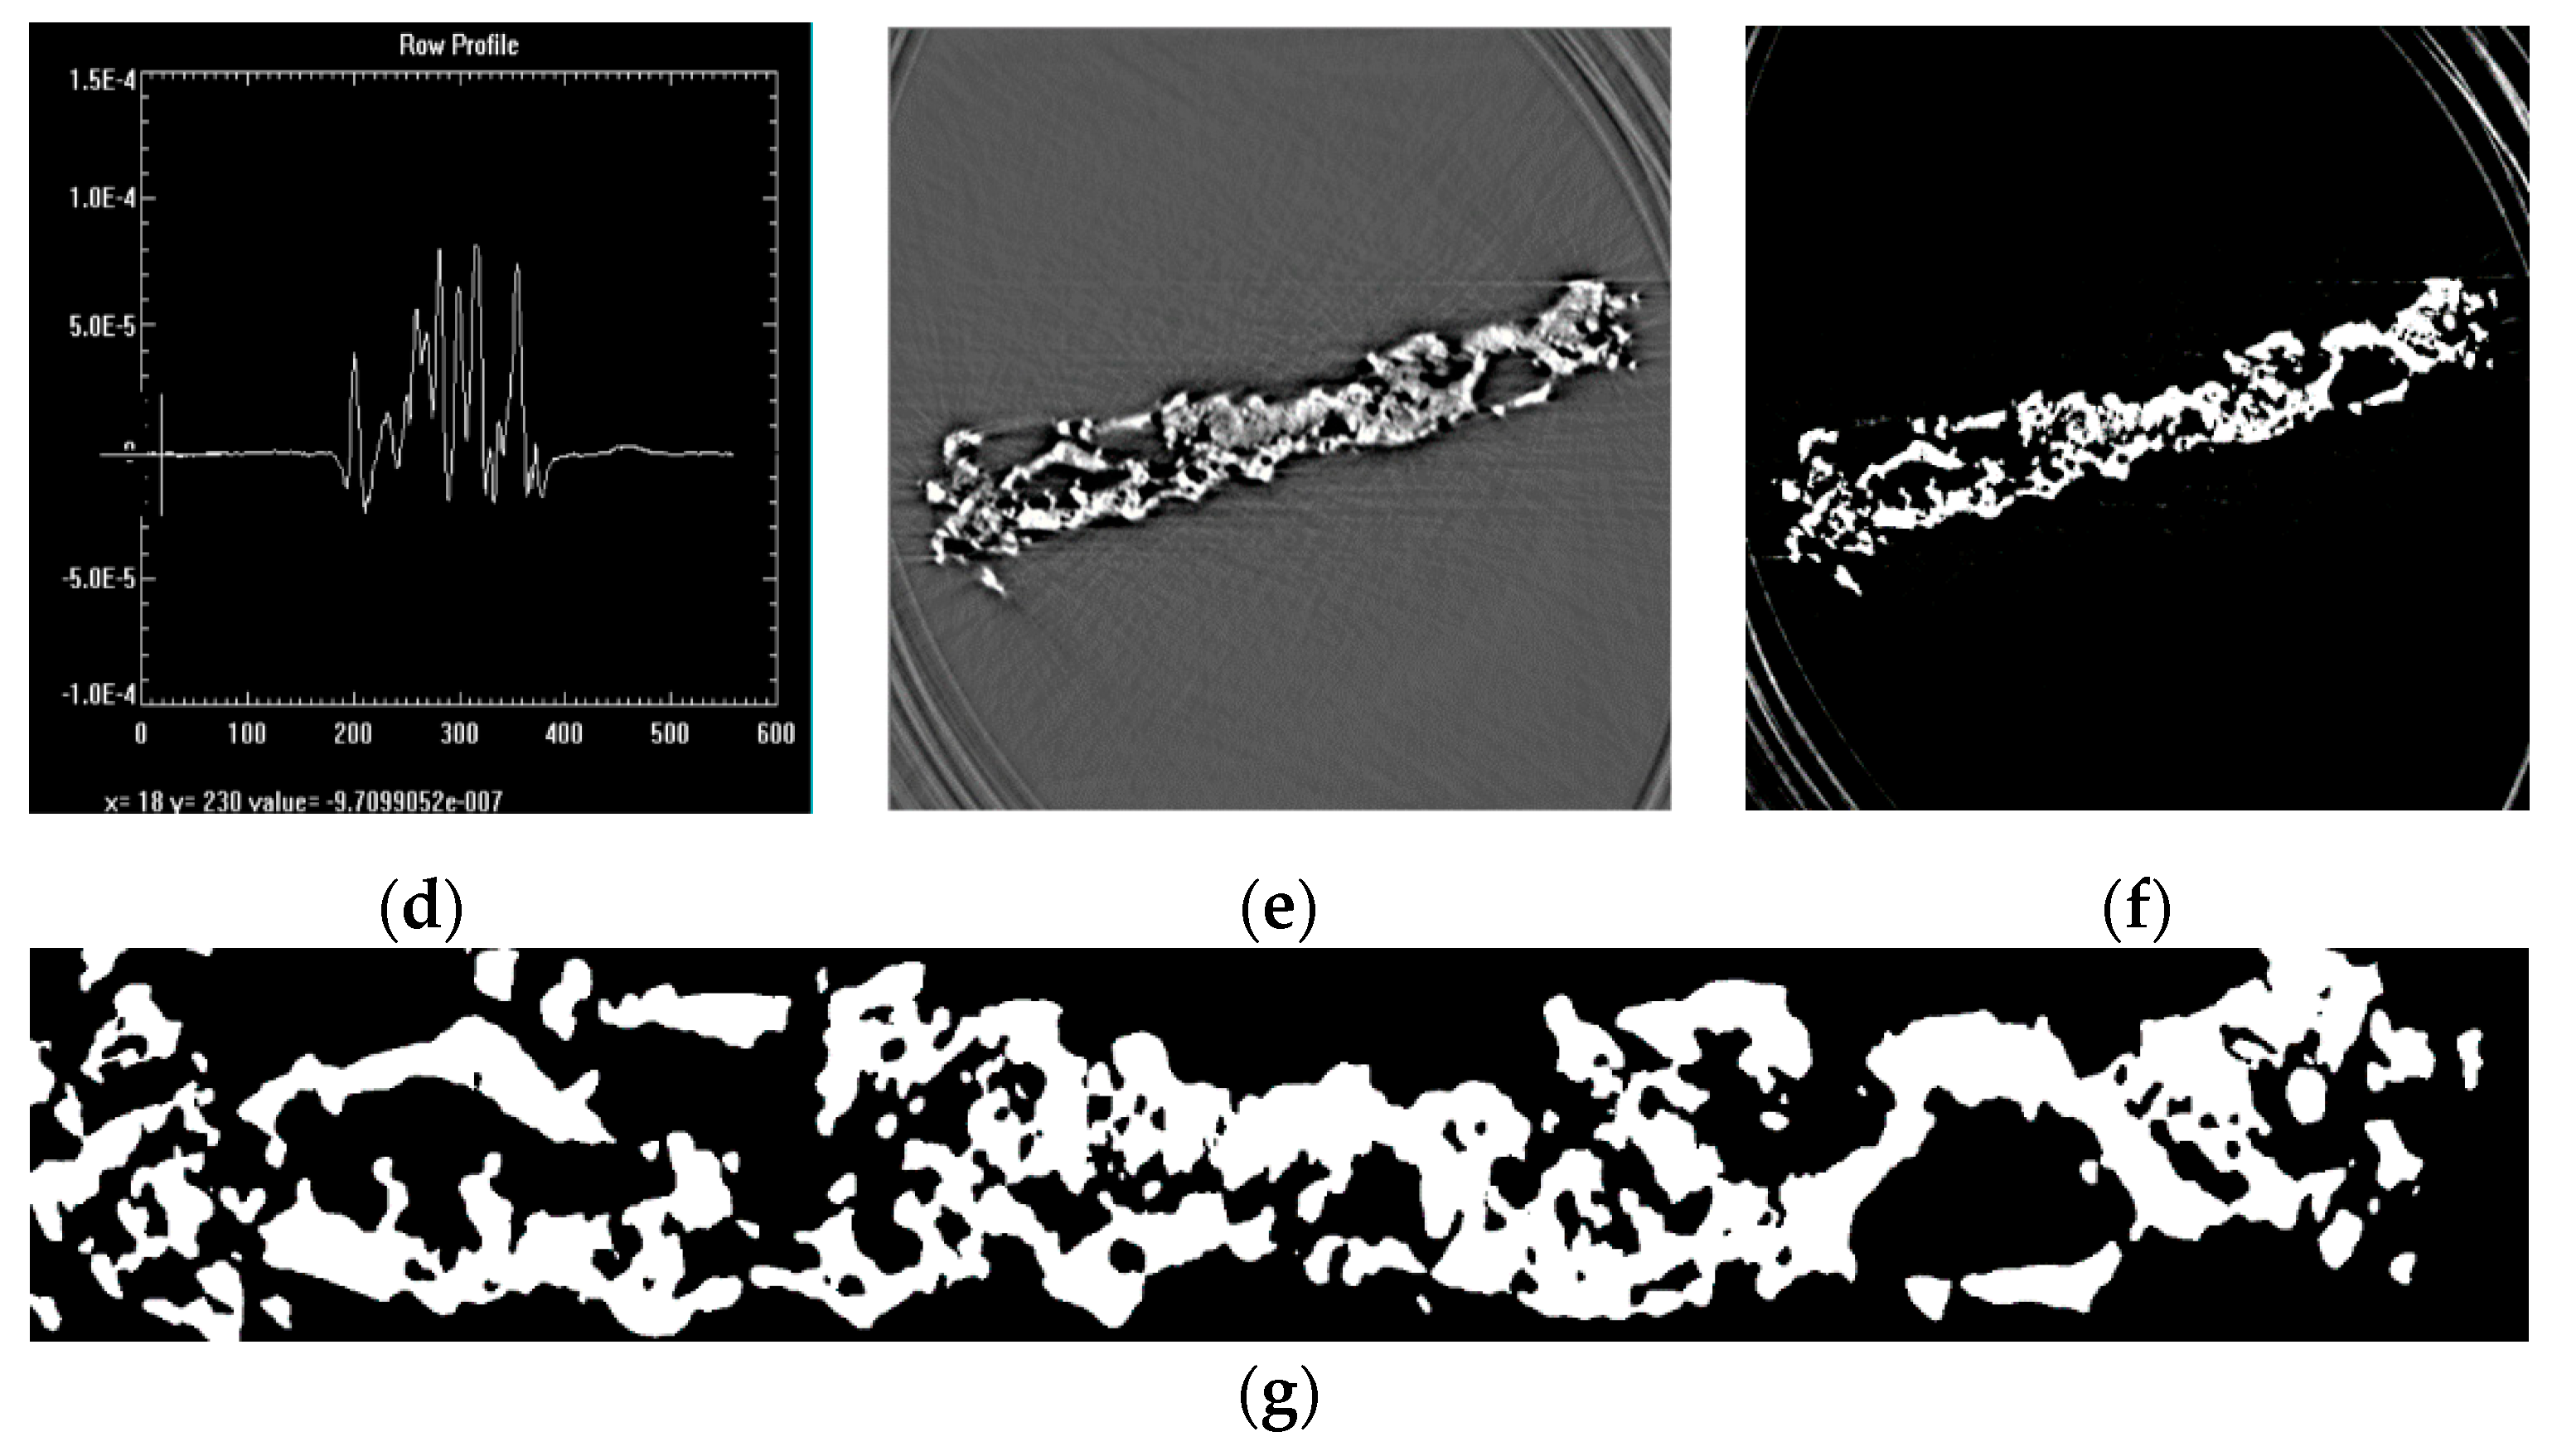
Image processing: get two-dimensional slice image of carbon paper by image processing software.
(3)
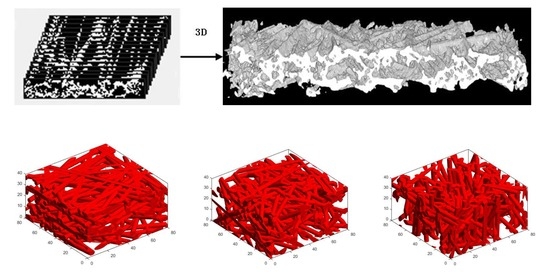
Three-dimensional reconstruction: combine two-dimensional images to obtain a microscopic three-dimensional digital model of carbon paper.
The process of software and carbon paper 3D reconstruction used in this article will be described in detail below.

2.1. Sample Selection

GDL24BA, an improved new grade from the SGL group, was selected for testing because of the clear classification of its material structure compared to products from other companies. It has been applied in portable power and automobiles. It is hydrophobized substrate with a 5 wt% PTFE loading. Its other properties are shown in Table 1.
In the column of X-ray CT results, the thickness refers to the width of the 2D rectangle image after cropping and rotating, so there is a difference compared with the actual thickness. The average porosity of all reconstruction slices at 100% scale is 83%. In this paper, the X-ray CT results were reconstructed to measure the actual fiber pitch of GDL, so there was no need to distinguish the fibers and the PTFE.

2.2. 2D Image Acquisition

Schematics of the BL13W1 in Figure 1 show how X-ray tomography works to get projections of samples. A sample is fixed on the sample holder in the front of a synchrotron beam and behind the detector. Rotating step by step, the projection images (called shadow images in [7]) are generated by X-ray detector. In this paper, the 2D shadow images of GDL sample were obtained by X-ray tomography using the BL13W1 beamline at the Shanghai Synchrotron Radiation Facility (SSRF) with 12 keV of energy and a distance of 11.5 cm between the microscope with a 10X eyepiece and the sample center. The exposure time was 5 s per shot. According to the experimental requirements, to get a resolution of 0.65 μm per pixel, the maximum transverse size of the sample is 1.3312 mm. Therefore, the carbon paper GDL sample was cut into a strip about 1 mm wide and placed in front of an X-ray source for photography. Then, 720 slices of 2D shadow images were acquired with a resolution of 0.65 μm per pixel under a rotation step of 0.5 ° . Furthermore, two flat-field images were collected at a rotation of per 180 ° and 5 dark-filed images were obtained after rotating 360 ° , which are helpful for image processing. Finally, 731 shadow images were acquired and prepared for reconstructing 2D cross-sectional image slices.

2.3. 2D Image Processing

In order to reconstruct 2D cross-sectional image slices, two softwares PITRE and PITRE_BM were used for phase-sensitive X-ray image processing, tomography reconstruction and batch manager based on the 2D shadow images with gray scale. There are four important steps: (a) phase retrieval; (b) sinogram creation; (c) sinogram pre-processing and slice reconstruction; and (d) image conversion. The input data is PPCT projections (i.e., 2D shadow images that we obtained during the step of 2D image obtaining) and the final output data is shown as 8-bit grey level images. The detailed steps are shown in Figure 2.
According to the steps shown in Figure 2, the 2D images processing results are displayed in Figure 3a–g. The output data are 2048 reconstruction image slices of 2048 × 2048 pixel with a resolution of 0.65 μm per pixel obtained after processing by PITRE, where the threshold of image conversion was selected manually. Then, every 2D carbon paper structure in 8-bit TIFF image was rotated into the proper position and cropped using Image J. The final full image of 100% scale after 2D image processing is showed in Figure 3g. Additionally, 300 slices in different scales were chosen for 3D reconstruction.

2.4. 3D Reconstruction

The goal of 3D reconstruction is to get 3D binary images for pore simulation, which is achieved by using the processing technologies of sequential images, image binarization processing and image data extraction in Image J, and the powerful array arithmetic function of MATLAB. The 3D binary images can be presented in a three-dimensional array. Similar to random complex porous structures, the image slices shown in Figure 4 can be represented by a binary phase function with a unit value for the solid matrix and a zero value on behalf of the pore space. Firstly, all values and positions of a solid matrix can be gained through the image data extraction technology of Image J after pre-processing by other technologies. Then, add the remaining positions to zero value to acquire 3D binary images using the powerful array arithmetic function of MATLAB. Finally, we can see the three-dimensional structure in Image J.

3. Reconstruction of Carbon Paper GDL by the Stochastic Method

Based on previously published papers, carbon paper GDLs consist of a large number of fibers, which are randomly oriented and distributed along a laminated microstructure. The stochastic method that we used in this paper randomly generated a number of fibers. In order to obtain a manageable model, the following assumptions were employed in the generation.
(1)
The fibers are infinitely long compared to the sample size and with negligible curvature.
(2)
The fibers are allowed to overlap with each other.
Giving the sample size, porosity and fiber diameter, the reconstruction of carbon paper was achieved. The fibers can be generated through a simplified mathematical model of intersecting, infinitely long cylinders and stored in a 3D binary image with given voxels. A cylinder oriented along an arbitrary axis is defined as the collection of points that span less than one radius from the axis of the cylinder (show in Figure 5). The radius and shape distribution can be selected according to the specifications provided by the carbon paper GDL manufacturers. The axis of the cylinder is uniquely defined in Cartesian space by the orientation vector u ( u 1 , u 2 , u 3 ) and a point P 0 ( x 0 , y 0 , z 0 ) it passes through. The distance s from the axis to an arbitrary point P ( x , y , z ) can be calculated from the modulus of the cross product of u and the vector r .
s = [ u 2 ( z z 0 ) u 3 ( y y 0 ) ] 2 + [ u 3 ( x x 0 ) u 1 ( z z 0 ) ] 2 + [ u 1 ( y y 0 ) u 2 ( x x 0 ) ] 2
Therefore, an arbitrary point P ( x , y , z ) contained by the cylinder can be defined by u ( u 1 , u 2 , u 3 ) and P 0 ( x 0 , y 0 , z 0 ) only if s is less than R. Using this formulation, any cylinder in 3D Cartesian space is well defined. Randomization of the collection of digital fibers is implemented with a pseudorandom number generator for both the orientation vector u and the point P0 (x0, y0, z0). However, the generation algorithm and the parameters used strongly influence the properties of the generated microstructure.
The most common generation algorithms are based on generating a random orientation vector and a random point P 0 ( x 0 , y 0 , z 0 ) from a uniform distribution along the Cartesian space delimited by the 3D sample size. This method is efficient and able to cover the entire spectra of possible axes that may be defined in the mentioned space. However, such parametrization is not bijective and those axes that cover more distance through the sample are more likely to be generated, which results in a heterogeneous microstructure that is much more compact at its central region than at its edges.
To solve the problem, this paper used the following method to determine u = [ u 1 ; u 2 ; u 3 ] . It is represented by polar angle θ and azimuth angle φ
u = [ s i n φ c o s θ ; s i n φ s i n θ ; c o s φ ]
where θ is the angle between the projection of the unit vector on xoy plane and the x-axis, φ is the angle between the unit vector and the z-axis. The polar angle θ and the azimuth angle φ can bijectively describe the direction of the fiber (shown in Figure 6a). When φ is randomly generated in the interval of [0, 2π], and θ is randomly generated in the interval [0, π/2], the fibers appearing in all directions can be obtained.
Based on Equation (1), the corresponding values of u 1 , u 2 and u 3 of the unit vector are determined. The anisotropy of carbon paper is determined by the vector u . The carbon fiber distributes along this vector direction, so the fiber passes through the normal plane perpendicular to the direction vector. When selecting the passing point or the reference point of carbon fiber, it should not be selected in the whole construction space, but should be selected on the normal plane. Otherwise, the distribution probability of fibers in space will be uneven. In addition, the next fixed normal plane should be determined to facilitate point selection. Finally, the normal plane of the center of the volume is selected as the reference normal plane, which also ensures that the section of the normal plane and the construction volume is the largest. In this normal plane, a Cartesian coordinate system is also needed to define one of the strip axes parallel to the xoy plane. It can be inferred that the two standard orthogonal bases a , b of this normal plane are:
a = [ u 2 u 1 2 + u 2 2 u 1 u 1 2 + u 2 2 0 ]   b = [ u 1 u 3 u 1 2 + u 2 2 u 2 u 3 u 1 2 + u 2 2 u 1 2 + u 2 2 ]
The schematic of a ,   b and the normal plane is shown in Figure 6b.
Anisotropy of the fiber in the thickness direction (through-plane) can be reflected by fiber pitch, which is defined as the angle the fiber makes with the plane of the material (stochastic modeling of polymer electrolyte membrane fuel cell gas diffusion layers, Part 1: Physical characterization). The fiber pitch α and the polar angle θ are related to each other, and the conversion formulas are shown as follows:
{ α = π 2 θ , 0 θ π 2 α = θ π 2 , π 2 < θ π
Figure 6c shows the carbon paper structure with the size of 80   ×   80   ×   40 and a prescribed porosity of 0.84 obtained by this stochastic reconstruction method. The digital model can also be represented as a three-dimensional array of 0 or 1 similar to the model obtained by X-ray CT technology (where 0 represents the pore and 1 represents the fiber entity). Figure 7 shows that the density distribution of carbon fibers obtained by this method is more uniform than the method of randomly selecting points and vectors.

4. Results and Discussion

4.1. Calculation of Fiber Pitch of GDL Obtained by X-ray CT

In [15], to get fiber pitch, the authors traced 30 easily identifiable fibers with lengths of 50–100 μ m using the GDL images computed by a nanoscale computed tomography (nano-CT). Fiber pitch, α (degrees), was calculated by:
α = s i n 1 ( | Δ z | / L )
where | Δ z | [ μ m ] is the absolute difference in the fiber center position, regarding the direction normal to the material plane, and L [ μ m ] is the traced distance. The formula is further modified to:
α = arctan ( | z 1 z 0 | ( x 1 x 0 ) 2 + ( y 1 y 0 ) 2 )
where ( x 0 , y 0 , z 0 ) is the center coordinates of the initial position of the traced single fiber, ( x 1 , y 1 , z 1 ) is the center coordinates of the terminated position.
There are 30 single fiber tracings from the X-ray CT images of SGL-24BA 5 wt% PTFE. The fiber pitch distribution is shown in Figure 8a. The mean fiber pitch of 24BA is 2.40° and individual values are all less than 6°, which is similar to the results of TGP-H 090 reported in [15]. Compared to the distribution of 30 fibers of TGP-H 090 in Figure 8b, 24BA has a more even pitch distribution.

4.2. Calculation Permeability of GDL Generated by the Stochastic Method

Permeability is a key parameter and it reflects the mass transport performance of porous media. In order to investigate the influence of the fiber orientation angle on the permeability of carbon paper GDL, multiple sets of GDL with different ranges of fiber pitch were selected randomly and were generated by the stochastic reconstruction method mentioned in Section 3 (shown in Figure 9a–f). The ranges were 0°, 0°–15°, 0°–30°, 0°–45°, 0°–60°, 0°–75° and 0°–90°. The simulation experiment was carried out six times under the same conditions to get more accurate results. The lattice unit was 80 × 80 × 40, where 40 represents the thickness (lattice unit) of the carbon paper structure. As shown in Figure 9, as the range increases, the number of fibers that have a shorter length gradually increases, which obviously change the permeability in the thickness direction.
The calculation method of permeability based on the LBM, Navier-Stokes equation and Darcy’s law was introduced in detail in our previous paper [14]. Figure 10a,b shows the permeability in the through-plane direction and in-plane direction, respectively. We can see that permeability in the thickness direction increases gradually as the range of the fiber pitch increases, while in the in-plane direction, the value of permeability initially increases slowly. When the fiber pitch angle is in the range of 0–60°, the in-plane permeability reaches a maximum value. Then, as the range of the fiber pitch increases, it slowly decreases. Considering that the material transfer in carbon paper is mainly in the thickness direction, here we chiefly focus on the influence of the fiber pitch on the through-plane permeability. The value of the through-plane permeability is as high as possible for transport properties, but it is difficult to achieve a range of 0–90° in the fiber pitch due to the limitations of the actual production process of carbon paper GDL. The actual value of the range reported in Section 4.1 also confirms this point. Moreover, whether other properties (such as thermal conduction, electricity conductivity, etc.) are also in an optimal state in the range of 0–90° remains to be discussed further.
Overall, we can conclude that: (1) The mean fiber pitch of SGL-24BA is 2.40° and individual values are all less than 6°; and (2) The permeability in the thickness direction gradually increases as the range of the fiber pitch increases. This means that in the process of actually preparing the carbon paper GDL, the transport performance can be further improved by increasing the range of the fiber pitch in the thickness direction as much as possible.

5. Conclusions

This paper discussed the influence of the fiber orientation (fiber pitch) of carbon paper GDL on stochastic reconstruction and permeability using X-ray CT, the stochastic method and LBM simulation. From this paper, the following conclusions can be drawn:
  • Reconstruction of the true GDL by X-ray CT—through image acquisition, image processing and 3D reconstruction, the true GDL models of SGL-24BA were obtained. Then it was used to measure the fiber pitch. The results show that the mean fiber pitch of SGL-24BA is 2.40° and individual values are all less than 6°.
  • Reconstruction of the virtual GDL by the stochastic method—by generating a number of fibers randomly and storing them in a 3D binary image with given voxels, the virtual GDL was obtained for flow simulation. Moreover, the method was improved to obtain a uniform density distribution of carbon fibers.
  • Calculating the permeability of different GDLs with seven pitch ranges—seven different ranges of fiber pitch were randomly chosen to reconstruct GDL and the permeability of these digital models were calculated using the LBM to get a better fiber pitch range for optimal permeability. It was concluded that the permeability in the thickness direction gradually increases as the range of the fiber pitch increases. This means that the transport performance can be further improved by increasing the range of the fiber pitch in the thickness direction as much as possible in the process of actually preparing the carbon paper GDL.

Author Contributions

Conceptualization, Y.G. and X.W.; Methodology, Y.G.; Software, X.W.; Validation, T.J. and X.W.; Formal Analysis, X.W. and T.J.; Investigation, Y.G.; Resources, T.Z.; Data Curation, T.J.; Writing-Original Draft Preparation, X.W.; Writing-Review & Editing, Y.G. and T.J.; Visualization, X.W.; Supervision, T.Z.; Project Administration, T.Z.; Funding Acquisition, Y.G. and T.Z.

Funding

This research was funded by the Natural Science Foundation of Shanghai (China), Grant number [19ZR1460300] and Special Foundation for State Major Basic Research Program of China, Grant number [2018YFB0104501] and the National Natural Science Foundation of China, Grant number [21506165].We also thank the Shanghai Synchrotron Radiation Facility for their support in the X-ray tomography (Line BL13W1).

Conflicts of Interest

The authors declare no conflict of interest. The funders had no role in the design of the study; in the collection, analyses, or interpretation of data; in the writing of the manuscript; or in the decision to publish the results.

References

  1. Becker, J.; Flückiger, R.; Reum, M.; Büchi, F.N.; Marone, F.; Stampanoni, M. Determination of material properties of gas diffusion layers: Experiments and simulations using phase contrast tomographic microscopy. J. Electrochem. Soc. 2009, 156, B1175–B1181. [Google Scholar] [CrossRef]
  2. Ostadi, H.; Rama, P.; Liu, Y.; Chen, R.; Zhang, X.X.; Jiang, K. 3D reconstruction of a gas diffusion layer and a microporous layer. J. Memb. Sci. 2010, 351, 69–74. [Google Scholar] [CrossRef] [Green Version]
  3. Inoue, G.; Yokoyama, K.; Ooyama, J.; Terao, T.; Tokunaga, T.; Kubo, N.; Kawase, M. Theoretical examination of effective oxygen diffusion coefficient and electrical conductivity of polymer electrolyte fuel cell porous components. J. Power Sources 2016, 327, 610–621. [Google Scholar] [CrossRef]
  4. Koido, T.; Furusawa, T.; Moriyama, K. An approach to modeling two-phase transport in the gas diffusion layer of a proton exchange membrane fuel cell. J. Power Sources 2008, 175, 127–136. [Google Scholar] [CrossRef]
  5. Rama, P.; Liu, Y.; Chen, R.; Ostadi, H.; Jiang, K.; Gao, Y.; Zhang, X.; Brivio, D.; Grassini, P. A numerical study of structural change and anisotropic permeability in compressed carbon cloth polymer electrolyte fuel cell gas diffusion layers. Fuel Cells 2011, 11, 274–285. [Google Scholar] [CrossRef]
  6. Rama, P.; Liu, Y.; Chen, R.; Ostadi, H.; Jiang, K.; Zhang, X. Multiscale simulation of single-phase multicomponent transport in the cathode gas diffusion layer of a polymer electrolyte fuel cell. ECS Trans. 2010, 28, 103–111. [Google Scholar]
  7. Rama, P.; Liu, Y.; Chen, R.; Ostadi, H.; Jiang, K.; Zhang, X.; Fisher, R.; Jeschke, M. An X-ray tomography based lattice Boltzmann simulation study on gas diffusion layers of polymer electrolyte fuel cells. J. Fuel Cell Sci. Technol. 2010, 7, 031015. [Google Scholar] [CrossRef]
  8. Rama, P.; Liu, Y.; Chen, R.; Ostadi, H.; Jiang, K.; Zhang, X.; Gao, Y.; Grassini, P.; Brivio, D. Determination of the anisotropic permeability of a carbon cloth gas diffusion layer through X-ray computer micro-tomography and single-phase lattice Boltzmann simulation. Int. J. Numer. Methods Fluids 2011, 67, 518–530. [Google Scholar] [CrossRef]
  9. Rosén, T.; Eller, J.; Kang, J.; Prasianakis, N.I.; Mantzaras, J.; Büchi, F.N. Saturation dependent effective transport properties of PEFC gas diffusion layers. J. Electrochem. Soc. 2012, 159, F536–F544. [Google Scholar] [CrossRef]
  10. Jinuntuya, F.; Chen, R.; Ostadi, H.; Jiang, K.; Gao, Y.; Zhang, X. The impacts of image resolution on permeability simulation of gas diffusion layer using lattice Boltzmann method. ECS Trans. 2014, 48, 93–101. [Google Scholar] [CrossRef]
  11. Satjaritanun, P.; Weidner, J.W.; Hirano, S.; Lu, Z.; Khunatorn, Y.; Ogawa, S.; Litster, S.; Shum, D.A.; Zenyuk, I.V.; Shimpalee, S. Micro-Scale Analysis of Liquid Water Breakthrough inside Gas. Diffusion Layer for PEMFC Using X-ray Computed Tomography and Lattice Boltzmann Method. J. Electrochem. Soc. 2017, 164, E3359–E3371. [Google Scholar]
  12. Schulz, V.P.; Becker, J.; Wiegmann, A.; Mukherjee, P.P.; Wang, C.Y. Modeling of two-phase behavior in the gas diffusion medium of PEFCs via full morphology approach. J. Electrochem. Soc. 2007, 154, B419–B426. [Google Scholar] [CrossRef]
  13. Inoue, G.; Yoshimoto, T.; Matsukuma, Y.; Minemoto, M. Development of simulated gas diffusion layer of polymer electrolyte fuel cells and evaluation of its structure. J. Power Sources 2008, 175, 145–158. [Google Scholar] [CrossRef]
  14. Gao, Y.; Montana, A.; Chen, F. Evaluation of porosity and thickness on effective diffusivity in gas diffusion layer. J. Power Sources 2017, 342, 252–265. [Google Scholar] [CrossRef]
  15. Hinebaugh, J.; Bazylak, A. Stochastic modeling of polymer electrolyte membrane fuel cell gas diffusion layers—Part 1: Physical characterization. Int. J. Hydrogen Energy 2017, 42, 15861–15871. [Google Scholar] [CrossRef]
  16. Fishman, Z.; Hinebaugh, J.; Bazylak, A. Microscale tomography investigations of heterogeneous porosity distributions of PEMFC GDLs. J. Electrochem. Soc. 2010, 157, B1643–B1650. [Google Scholar] [CrossRef]
  17. Daino, M.M.; Kandlikar, S.G. 3D phase-differentiated GDL microstructure generation with binder and PTFE distributions. Int. J. Hydrogen Energy 2012, 37, 5180–5189. [Google Scholar] [CrossRef]
  18. Nabovati, A.; Hinebaugh, J.; Bazylak, A.; Amon, C.H. Effect of porosity heterogeneity on the permeability and tortuosity of gas diffusion layers in polymer electrolyte membrane fuel cells. J. Power Sources 2014, 248, 83–90. [Google Scholar] [CrossRef]
  19. Thiedmann, R.; Fleischer, F.; Hartnig, C.; Lehnert, W.; Schmidt, V. Stochastic 3D modeling of the GDL structure in PEMFCs based on thin section detection. J. Electrochem. Soc. 2008, 155, B391–B399. [Google Scholar] [CrossRef]
  20. Didari, S.; Asadi, A.; Wang, Y.; Harris, T.A. Modeling of composite fibrous porous diffusion media. Int. J. Hydrogen Energy 2014, 39, 9375–9386. [Google Scholar] [CrossRef]
  21. Chen, R.; Xie, H.; Deng, B.; Tong, Y.; Hu, W.; Xue, Y.; Chen, C.; Ren, Y.; Zhou, G.; Wang, Y.; et al. Preliminary results for X-ray phase contrast micro-tomography on the biomedical imaging beamline at SSRF. Nucl. Tech. 2009, 32, 241–245. [Google Scholar]
Figure 1. Schematics of the BL13W1 beamline at SSRF (a) experimental station, (b) detailed schematic diagram, and (c) photograph of the IL-XPCT system [21].
Energies 12 02808 g001
Figure 2. The flow chart of 2D image processing.
Energies 12 02808 g002
Figure 3. (a) The shadow images by X-ray tomography (i.e., PPCT projections); (b) images after flat-field and dark-field correction; (c) the result after phase retrieval; (d) row profile of Figure 3d; (e) reconstruction image slices obtained after the step of slice reconstruction; (f) the output data of 8bit TIFF images; and (g) the final full image of 100% scale after 2D image processing.
Energies 12 02808 g003aEnergies 12 02808 g003b
Figure 4. The 2D image slices and 3D structure of carbon paper GDL.
Energies 12 02808 g004
Figure 5. Cylindrical model of the fibers.
Energies 12 02808 g005
Figure 6. (a) The schematic of the unit vector. (b) The schematic of the normal plane and a ,   b . (c) Carbon paper structure obtained by this stochastic reconstruction method.
Energies 12 02808 g006
Figure 7. The density distribution of carbon fibers obtained by the method of this paper (a) and (b), and the method of randomly selecting points and vectors (c) and (d).
Energies 12 02808 g007
Figure 8. Fiber pitch distribution of 30 fibers measured from (a) X-Ray CT image of SGL 24BA 5 wt% PTFE; and (b) nano-CT image of Toray TGP-H 090 0 wt% PTFE.
Energies 12 02808 g008
Figure 9. The random reconstruction results of carbon paper GDL (af) under different fiber pitch ranges.
Energies 12 02808 g009
Figure 10. Trend chart of the permeability of GDL with different fiber pitch range, (a) through-plane permeability, and (b) in-plane permeability.
Energies 12 02808 g010
Table 1. Properties of SIG GDL24BA and X-ray CT results.
PropertyUnitGDL 24BAX-ray CT Results
Thicknessμm190198.9
Areal Weightg/m254-
Porosity%8483
Air Permeabilitycm3/(cm2 · s )60-
Electrical Resistance (through plane)mΩ/cm2<10-

