Article

An Experimental and Numerical Case Study of Passive Building Cooling with Foundation Pile Heat Exchangers in Denmark

1
R&D Center for Building, Energy, Water and Climate, VIA University College, DK-8700 Horsens, Denmark
2
Centrum Pæle A/S, Grønlandsvej 96, DK-7100 Vejle, Denmark
3
Department of Civil Engineering and Architecture, University of Pavia, 27100 Pavia, Italy
*
Author to whom correspondence should be addressed.
Energies 2019, 12(14), 2697; https://doi.org/10.3390/en12142697
Submission received: 10 May 2019 / Revised: 24 June 2019 / Accepted: 4 July 2019 / Published: 15 July 2019
(This article belongs to the Special Issue Innovation in Geothermal Energy Exploration and Production)

Abstract

:
Technologies for energy-efficient cooling of buildings are in high demand due to the heavy CO2 footprint of traditional air conditioning methods. The ground source heat pump system (GSHP) installed at the Rosborg Gymnasium in Vejle (Denmark) uses foundation pile heat exchangers (energy piles). Although designed for passive cooling, the GSHP is used exclusively for heating. In a five-week test during the summer of 2018, excess building heat was rejected passively to the energy piles and the ground. Measured energy efficiency ratios are 24–36 and the thermal comfort in conditioned rooms is improved significantly relative to unconditioned reference rooms. A simple model relating the available cooling power to conditioned room and ground temperatures is developed and calibrated to measured test data. Building energy simulation based estimates of the total cooling demand of the building are then compared to corresponding model calculations of the available cooling capacity. The comparison shows that passive cooling is able to meet the cooling demand of Rosborg Gymnasium except for 7–17 h per year, given that room temperatures are constrained to < 26 °C. The case study clearly demonstrates the potential for increasing thermal comfort during summer with highly efficient passive cooling by rejecting excess building heat to the ground.

1. Introduction

Denmark has committed itself to be independent from fossil fuels by 2050 in order to mitigate climate changes due to CO2-emissions [1]. To ensure the transition to a fossil-fuel free energy supply, Denmark has set a number of intermediate goals, one of which is to produce all heat with renewable energy (RE) sources by 2035 [2]. Consequently, the share of fuel-based energy sources in the total heat production in Denmark (including CO2-neutral sources such as biomass) is expected to decline towards 2030, being replaced primarily by heat pumps according to a forecast by The Danish Energy Agency [3].
To further support the transition to RE, recent Danish building regulations have imposed ever increasing restrictions on the total energy consumption by heating, cooling, ventilation and domestic hot water for both larger buildings and single-family houses [4]. Energy restrictions are mainly adhered to by further insulating constructions, potentially causing involuntary heating and reduced thermal comfort in the hot season. In Denmark, high indoor temperatures during summer is typically mitigated by modifying the construction and the exterior setting by various means such as e.g., adding landscape elements like trees or hedges, overhangs or vertical fins on the exterior walls, light shelves, low shading glass, and curtains and blinds in the interior, which all adds further costs to the construction. Despite these efforts, overheating is a persistent problem encountered in low energy constructions (see e.g., [5,6]). As such, the Danish District Heating association estimates the total annual cooling needs in Denmark to be approximately 6.8 GW and 9500 GWh/year of which roughly 50% constitutes comfort cooling [7]. The United Nations Intergovernmental Panel on Climate Change (IPCC) estimates that the global cooling demand will increase from 300 TWh in 2000 to 4000 TWh by 2050, with 25% of this increase being due to global warming ([8], p. 665). Denmark is expected to follow this trend and therefore, technologies for energy-efficient cooling are in high demand due to the heavy CO2 footprint of traditional air conditioning methods.
Ground source heat pumps (GSHP) use the subsurface as an energy source and sink and fit well within the projected future energy supply system in Denmark being dominated by heat pumps. The world-wide utilization and capacity of GSHP systems has increased by 62% and 51%, respectively in the period 2010–2015, indicating a significant increase and interest in the exploitation of geothermal resources [9]. Borehole-based GSHP systems facilitate seasonal heat storage by passive cooling of buildings during the summer months, which applies to low-energy houses, and modern office buildings, where involuntary heating in the summer can be remedied with appropriate cooling measures that adhere to energy framework restrictions [10,11]. Operational experience from Sweden demonstrate exceptional seasonal energy efficiency ratios (SEER: the measured ratio between the cooling energy and electricity consumption of the circulation pump during a typical cooling season) for two GSHP systems, used for passive and active cooling of large buildings [12]. Malmö Police Station in Sweden has an annual cooling need of 100 MWh, which is fully supplied by a borehole thermal energy storage system (BTES). Cooling is done passively by circulating the cold BTES brine directly in chilled beams and cooling coils in the ventilation system, ejecting excess heat from the building to the ground during summer. Moreover, the stored heat serves to supply the building with free heating in the winter covering 9% of the total heating demand. Similarly, the astronomical observatory at the University of Lund in Sweden uses a BTES to supply an annual heating demand of 515 MWh. 130 MWh of cooling are supplied passively while a combined total peak load of 25 MWh is covered by active cooling, utilizing a reversible heat pump. Both systems demonstrate SEERs well above 20 for the passive cooling.
Energy piles are traditional foundation piles (precast or in-situ cast) with embedded heat exchangers that allow for energy exchange with the pile and the ground. The technology emerged in the 1980′s, as an alternative to traditional borehole heat exchangers (BHE), and was developed primarily by the construction industry [13]. Energy pile foundations have high initial costs however, they serve simultaneously as the building foundation and heating/cooling supply [14]. Currently, there are three energy pile installations in Denmark that use relatively small, rectangular energy piles: one in Vejle (since 2011) and two in Horsens (since 2009 and 2012, respectively). Additional installations utilizing similar piles are found in Germany [15] and in The Netherlands [16]. More case studies are described in [17,18].
Passive cooling with ground heat exchangers depends on low and stable subsurface temperatures. In Denmark, the upper 10–15 m of the subsurface are thermally disturbed by seasonal variations in the surface temperature that affects the average temperature along the heat exchanger differently for typical GSHP systems as shown in Figure 1 (see Appendix A for details).
Horizontal heat exchangers in the shallow-most part of the subsurface, experience a significant increase in ground temperatures during summer, only slightly time-lagged relative to surface temperatures, which negatively affects the possibilities for passive cooling. For BHEs, typically 100 m long in Denmark, the seasonal thermal disturbance has only a small effect on the average temperature along the heat exchanger.
Thus, BHEs are well suited for passive cooling, as long as the sizing of the heat exchanger allows for sufficient heat dissipation. The precast energy piles most frequently used in Denmark are no longer than 18.5 m and thus significantly shorter than BHEs. Thus, energy piles are potentially more sensitive to the surface temperature variations that potentially hampers the possibilities of using them for passive cooling. As seen in Figure 1, energy piles are only moderately affected by surface temperatures, implying variations in the average temperature along the pile of just ±1 °C, peaking in mid-September. Studies on the potential use of energy piles for passive cooling are rather limited. In a case study at Zürich airport it was estimated that 300 energy piles, founded to a depth of 25 m, would suffice to cover almost fully the cooling demand of a new 15,000 m2 terminal building [19]. The study is based exclusively on TRNSYS-simulations and no experimental data are reported.
The GSHP system at Rosborg Gymnasium in Vejle (Denmark) uses 219 foundation pile heat exchangers (energy piles). Although designed for passive cooling, the GSHP is used exclusively for heating. Surprisingly, the building owner has been unaware of the cooling option, despite numerous complaints by teachers and students about high temperatures in the building during summer. As such, there are no operational records on the use of passive cooling of the building. To this end, this paper presents and analyses experimental data from a 40 day passive cooling test campaign at Rosborg Gymnasium where excess building heat was rejected to the ground. The test was performed in July and early August 2018 during which the school was closed and thus totally absent of people (i.e., no internal heat gains). However, the summer of 2018 was exceptionally hot and sunny in Denmark, fully providing the thermal stresses on the building necessary for testing the cooling capacity of the energy piles.
Conditioned and unconditioned reference room temperatures are presented and compared for the test period. Cooling power and SEER are calculated and presented and the thermal comfort Predicted Mean Vote (PMV) and Predicted Percentage Dissatisfied (PPD) indices are evaluated for the conditioned and unconditioned reference rooms, respectively [20]. A simple model of the relation between the available passive cooling power, the heat transfer characteristics of the heat exchanger in the ventilation system (for cooling) and the outside, room and ground temperatures, respectively, is presented. EnergyPlus building energy simulation based estimates of the total cooling demand of the building are then compared to corresponding model calculations of the available passive cooling during the hot season in the twelfth year of operation. It is hypothesized that passive cooling with energy piles 1) modifies the thermal comfort at Rosborg Gymnasium as measured by the PMV-index and 2) is able to cover the majority of the total cooling demand of the building.
Measured energy efficiency ratios are 24–36 and the thermal comfort PMV is improved from 0.69 (σ = 0.42) to 0.085 (σ = 0.26) relative to unconditioned reference rooms, attributed mainly to a temperature drop of 4−6 °C (down to 22–24 °C) in conditioned rooms. Temperatures in the auditorium drop to 18 °C with PMVs in the lower, uncomfortable end at −0.5 (σ = 0.34). The relative humidity is 6–11% (absolute) higher in the smaller, conditioned teaching rooms, relative to reference rooms. Correspondingly, the auditorium experiences relative humidity levels up to 30% (absolute) higher, compared to the reference.
The comparison of the required and available cooling power shows that passive cooling is able to meet the cooling demand of Rosborg Gymnasium except for 7–17 h per year, given that room temperatures are constrained to < 26 °C. The case study clearly demonstrates the potential for increasing thermal comfort during summer with highly efficient passive cooling by rejecting excess building heat to the ground.

2. Materials and Methods

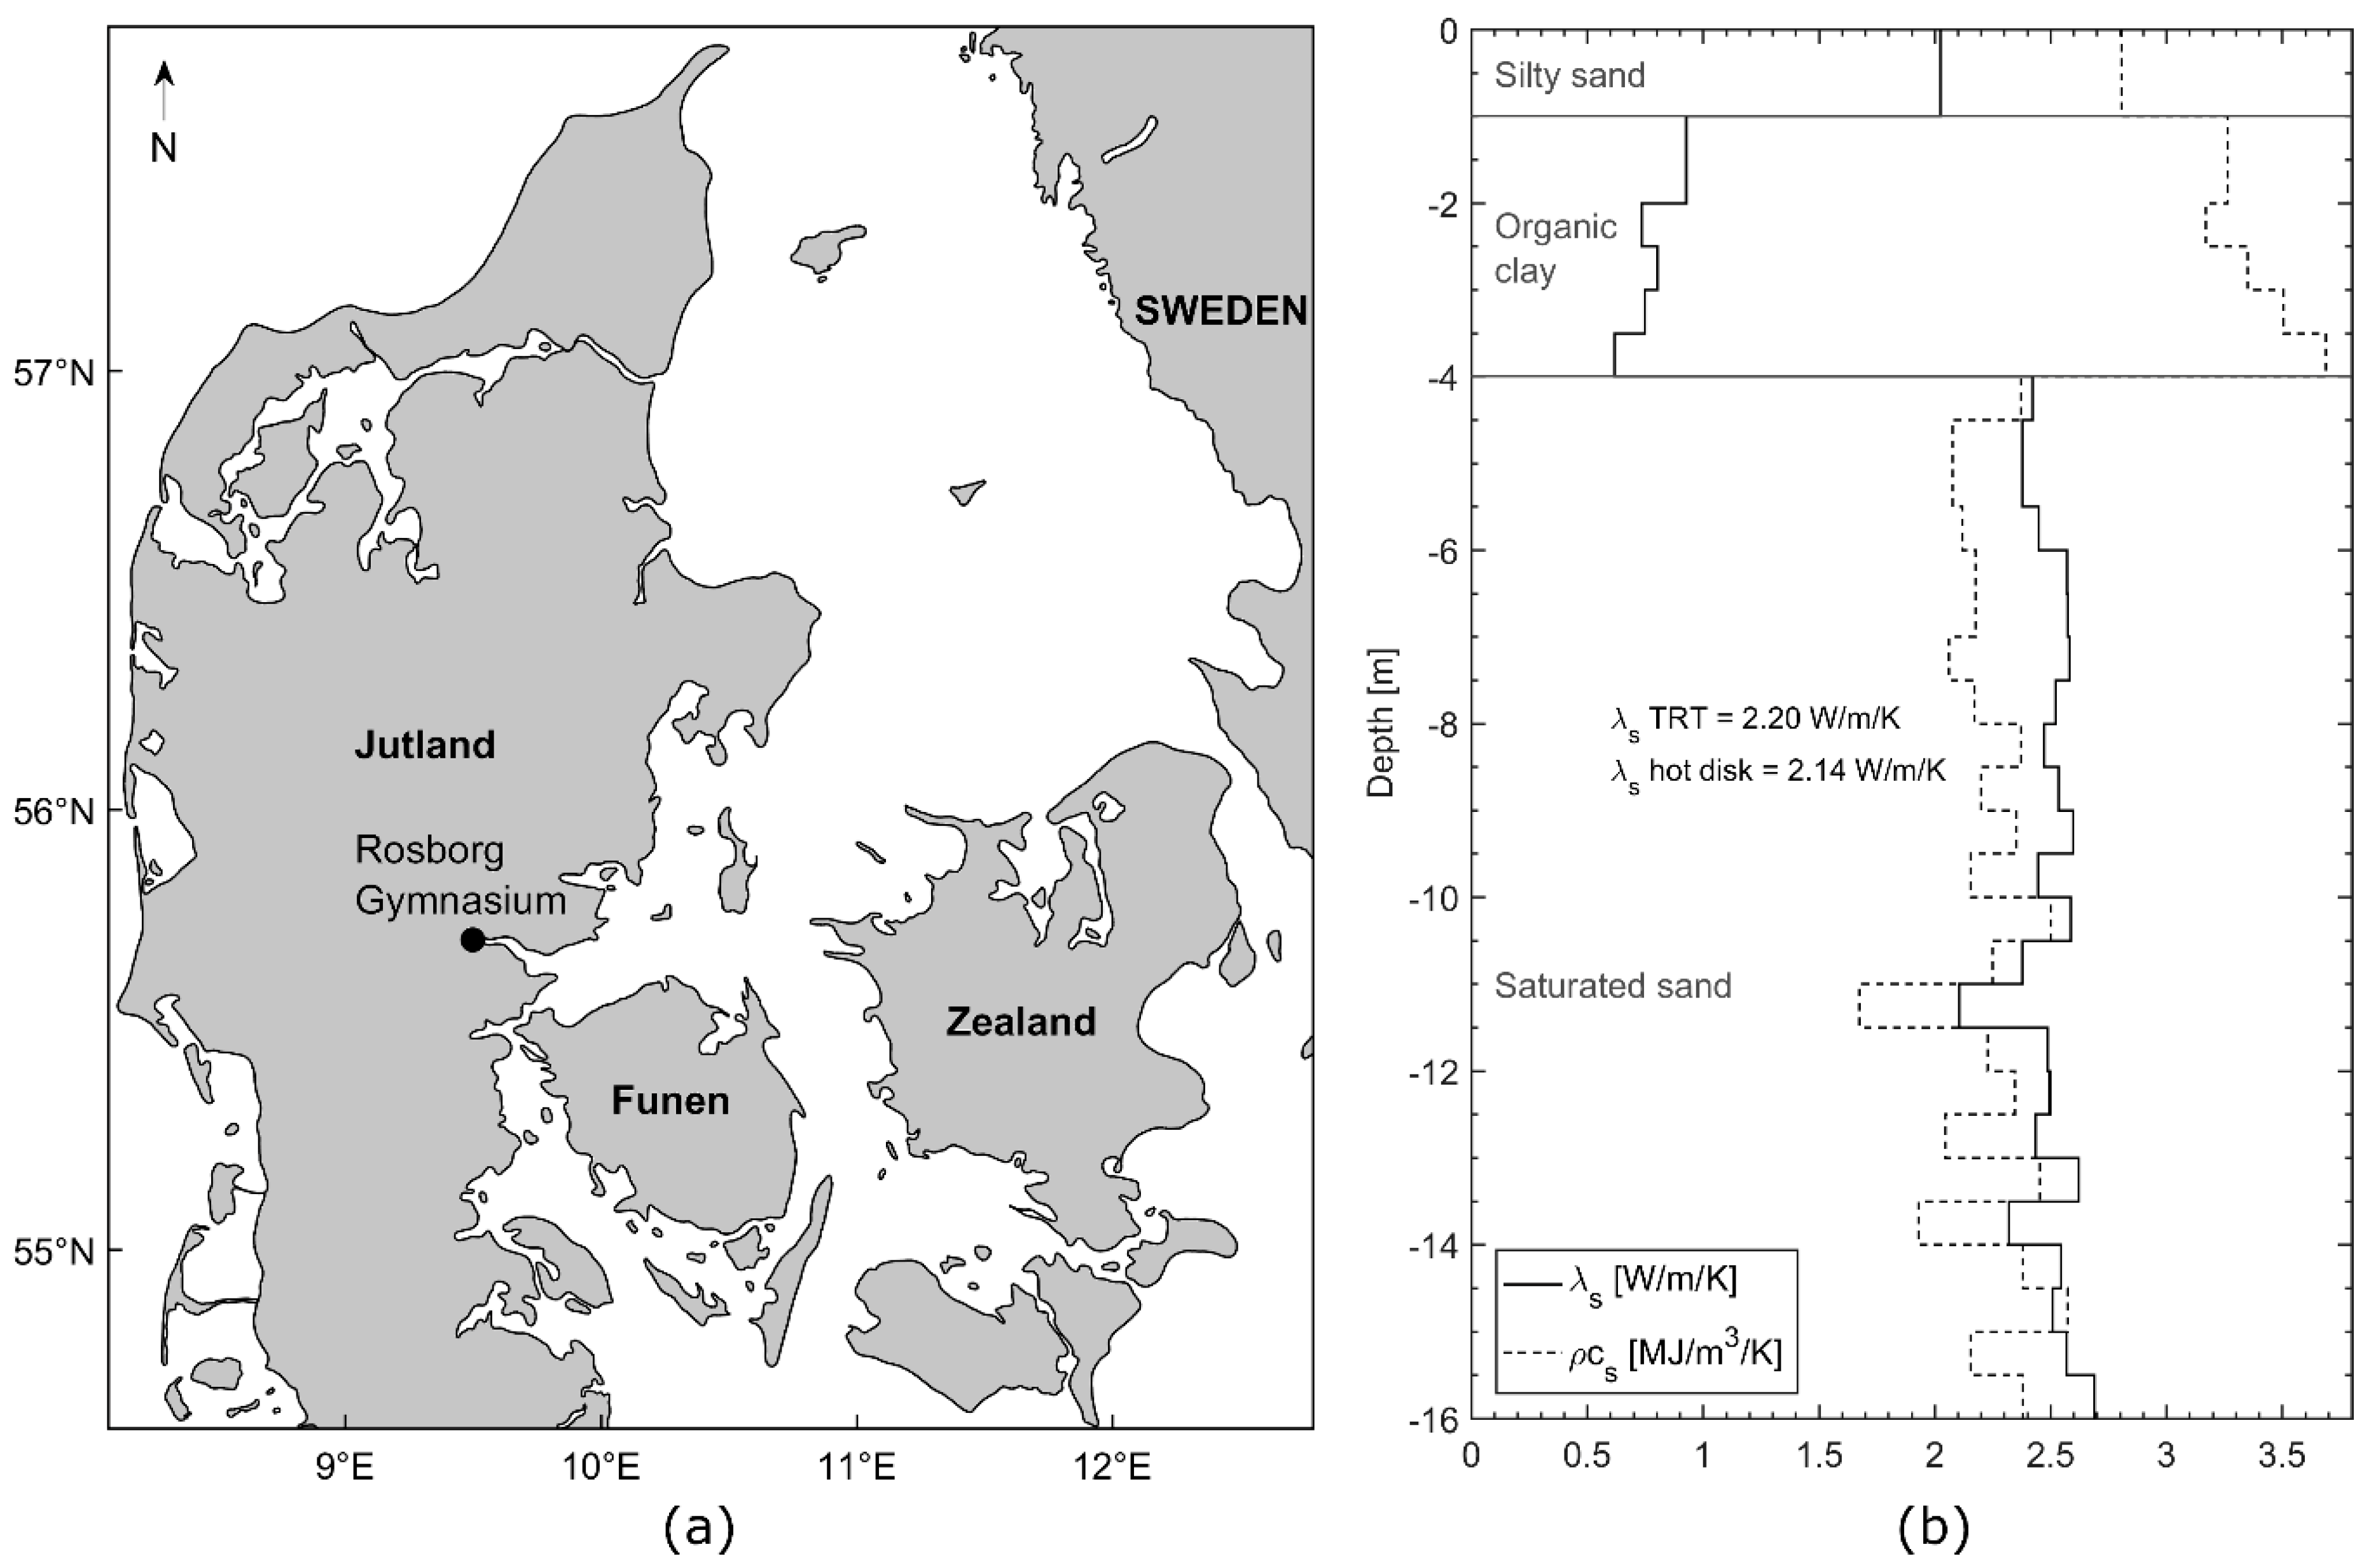
2.1. Study Site and Geological Setting

Rosborg Gymnasium (a secondary school attended prior to higher education such as university) is situated in Rosborg, Vejle, Denmark in the riverbed of Vejle Å (a stream) that discharges into Vejle Fjord (Figure 2a).
The sediments in the riverbed valley comprise roughly 1 m of silty sand from the surface that is underlain by 3 m of organic clay that prevents foundation without piles. Sand is present below 4 m depth and serves as the stabilizing layer for the foundation of the building (Figure 2b).
The soil thermal conductivity λs and volumetric heat capacity pcs at Rosborg Gymnasium were estimated in [21] by means of thermal response testing (TRT) and transient plane heat source measurements on soil samples (Figure 2b). The upper 1 m of silty sand has a thermal conductivity and volumetric heat capacity of ca. 2 W/m/K and 2.8 MJ/m3/K, respectively. The organic clay is a poor conductor of heat, having a thermal conductivity of ca. 0.7–0.8 W/m/K. Samples of the fully water-saturated sand have significantly higher thermal conductivities (ca. 2.0–2.7 W/m/K) compared to the organic clay due to the high quartz content and lower porosity. The higher water content of the organic clay yields a relatively high volumetric heat capacity of 3–3.5 MJ/m3/K, while the sand is measured to ca. 2.0–2.5 MJ/m3/K. The laboratory measurements of the thermal conductivity (2.14 W/m/K) are corroborated by the corresponding TRT estimate of the average soil thermal conductivity along the energy pile (2.20 W/m/K).

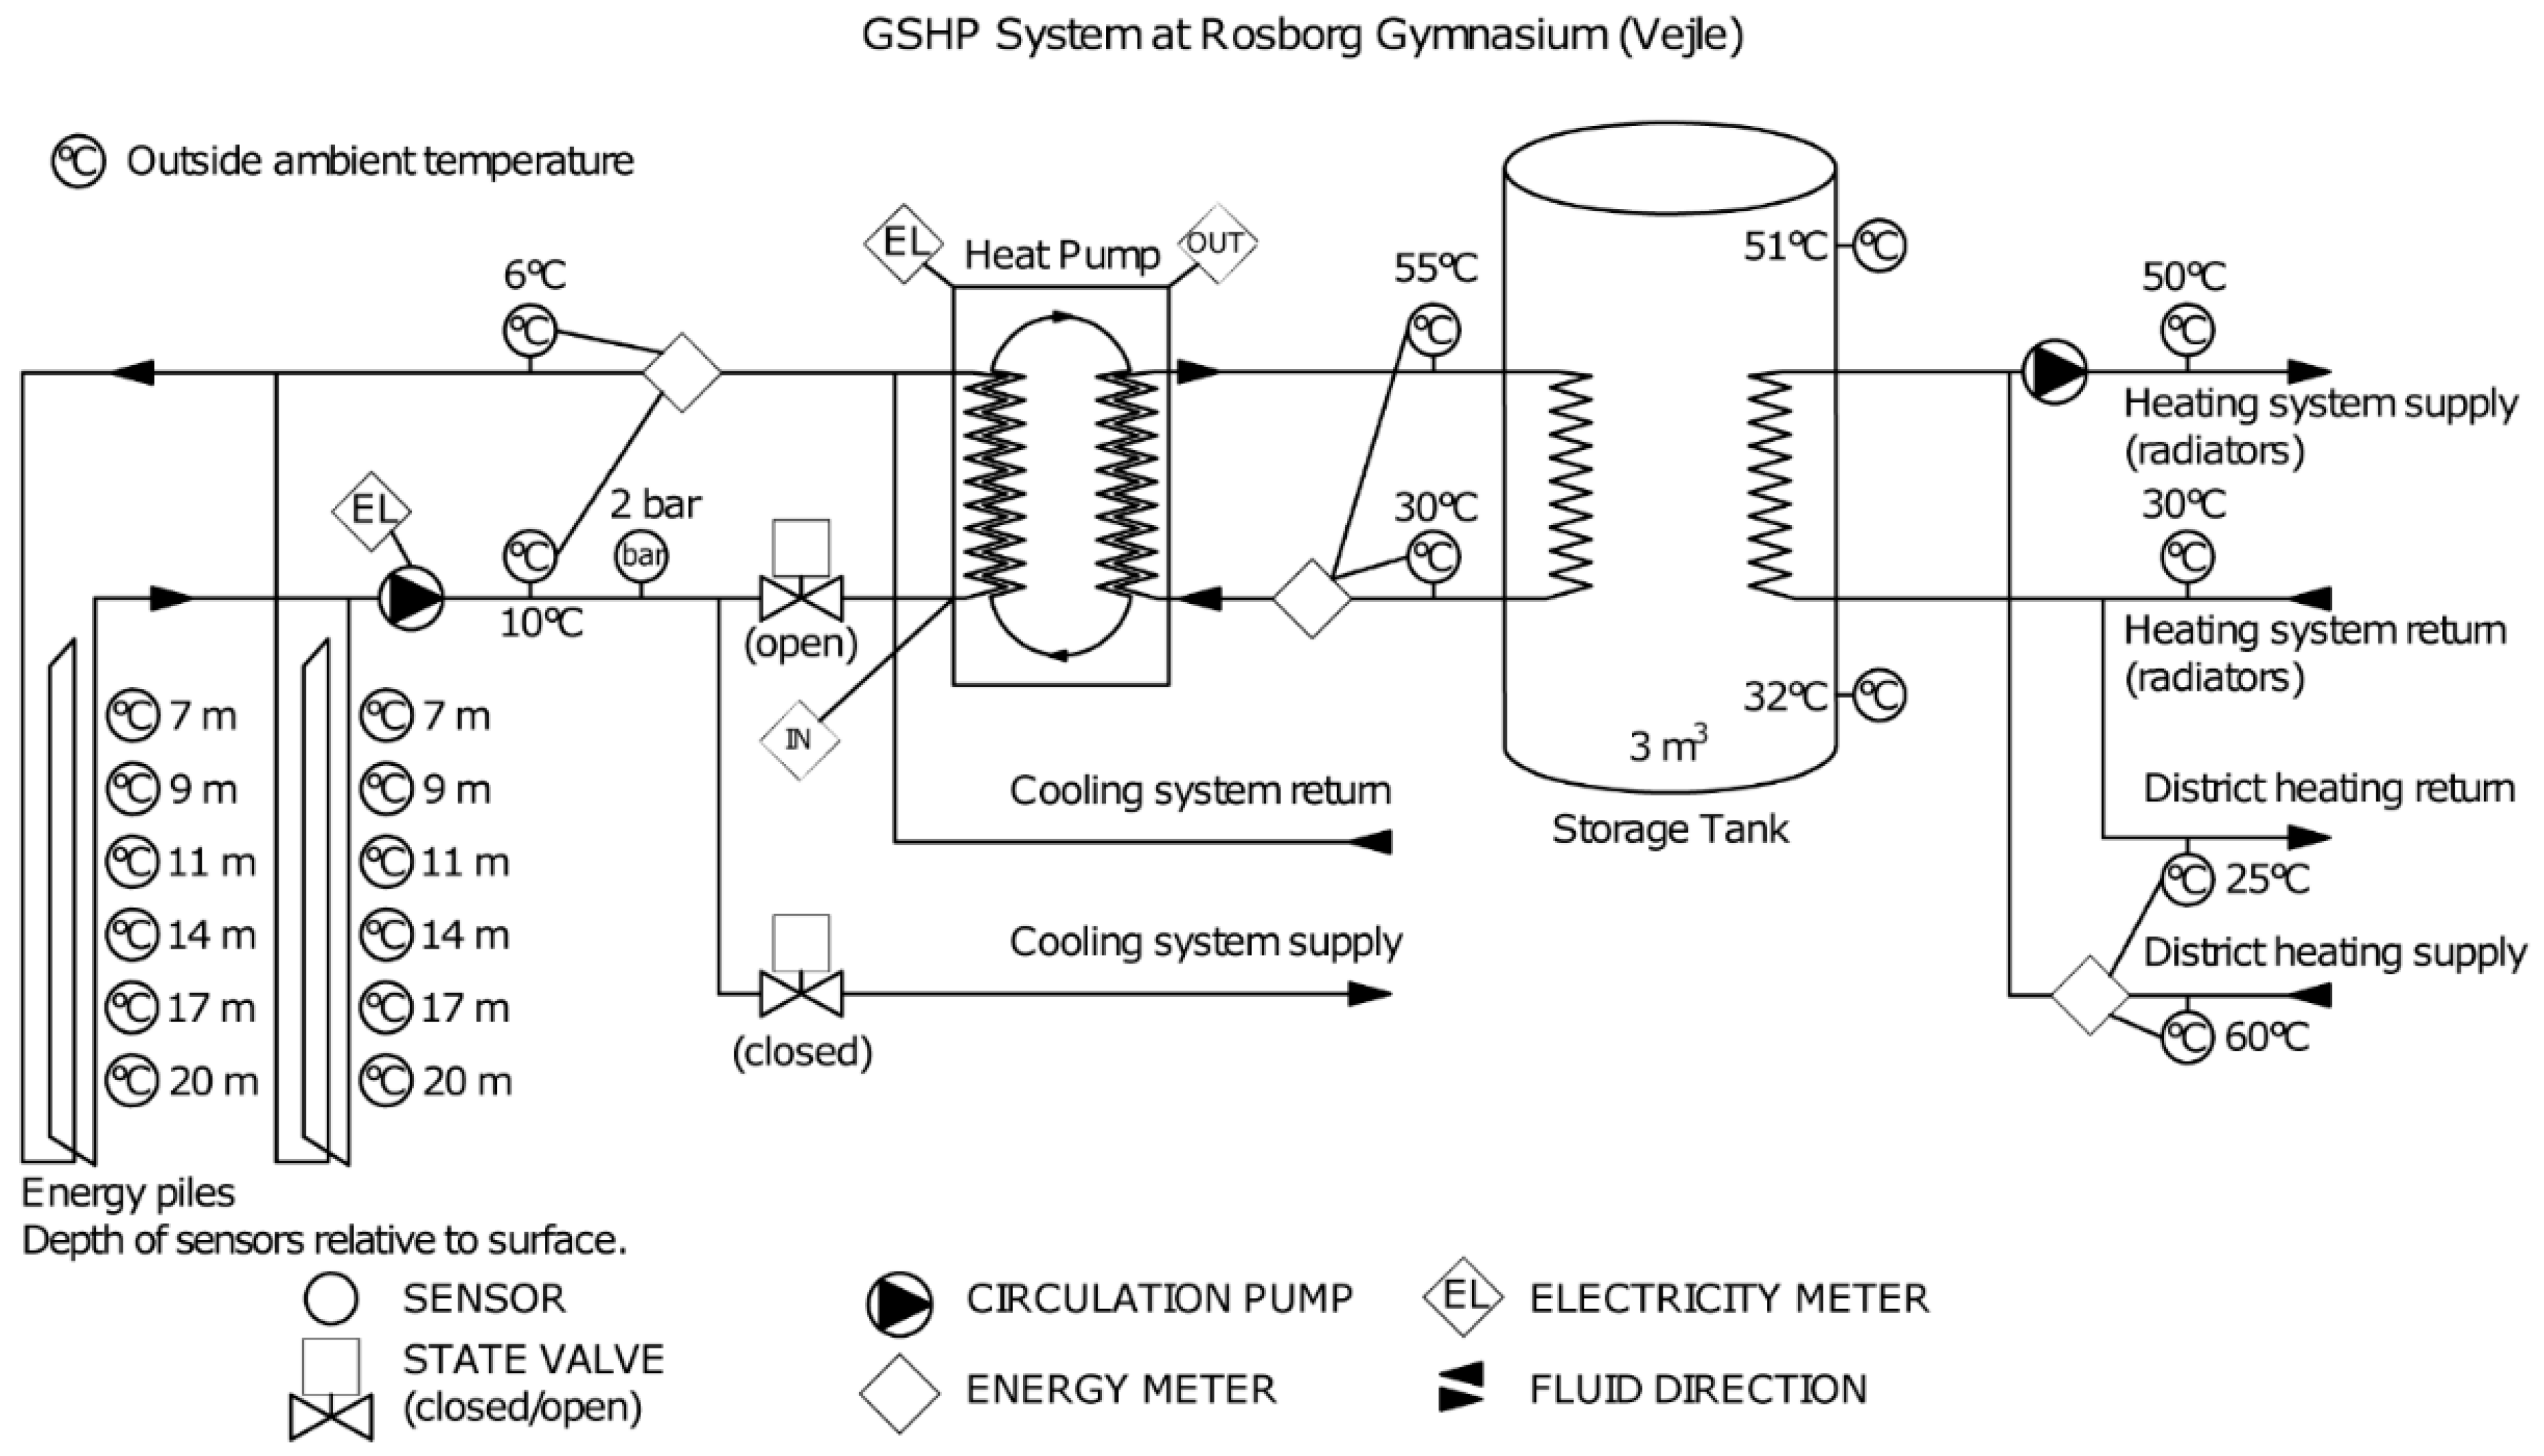
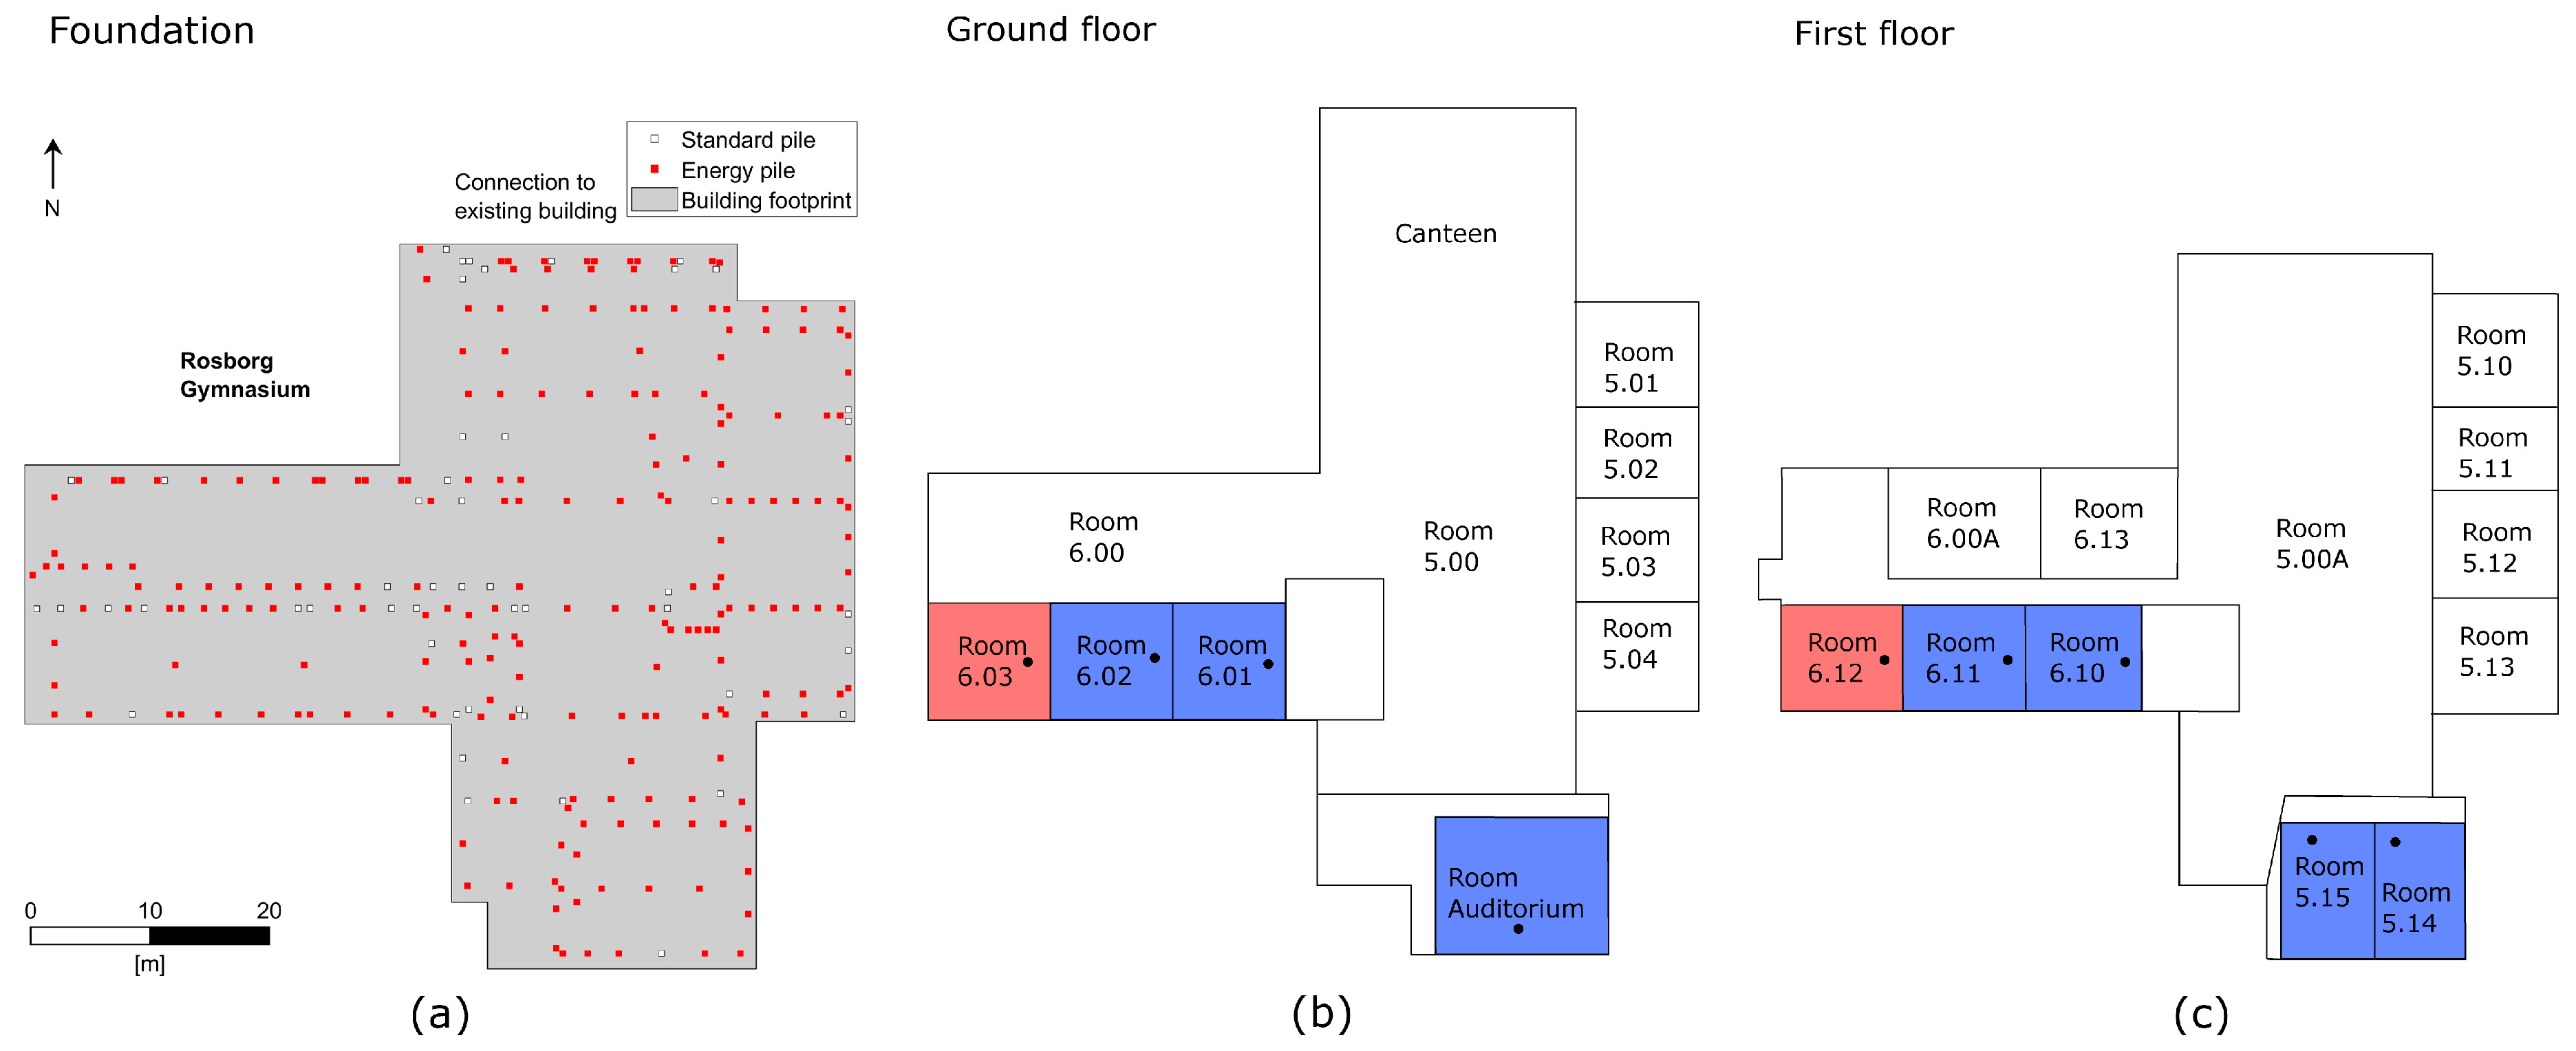
2.2. The Energy Pile Foundation and the Heating, Ventilation and Air Conditioning (HVAC) System

Rosborg Gymnasium made an extension to its existing buildings in 2012. The new building is founded on 219 precast foundation piles with embedded W-piped heat exchangers fitted to the rebar (Figure 3a).
See p. 723 in [21] for further details on the geometry and construction of the considered energy pile foundation.
The energy piles are connected in parallel and divided into 16 groups, each with separate manifolds. The heat carrier fluid is a 20% ethylene-glycol water-based solution. Two piles are instrumented with six Pt100 temperature sensors distributed on the outside of the piles at specified depths as shown to the left in Figure 4.
The piles serve as the heat source for a 200 kW water-to-water ground source heat pump with two compressors, that supplies a 3 m3 storage tank with water at 55 °C, supplying both domestic hot water and radiators for heating (Figure 4). The district heating network serves as an auxiliary heating system.
The mechanical mixing ventilation system utilizes ceiling inlets and outlets and is designed for passive cooling of all rooms facing south by cooling plates mounted in the ventilation ducts, close to the room outlet. The cooling plates measure 600 × 360 mm and 1200 × 600 mm in the teaching rooms and auditorium, respectively. Passive cooling is done by circulating the brine from the energy piles directly in the cooling plates thus circumventing the heat pump as shown in Figure 4.
Figure 4 further shows the control and monitoring system implemented at Rosborg Gymnasium in which the energy pile inlet and outlet temperatures, fluid and ventilation air flow rates, local temperatures, electricity consumption and the state of the heat pump (on/off) are recorded.

2.3. Building Characteristics and Passive Cooling Test from 2018-06-30 to 2018-08-10

The total living area and volume of the building is 3949 m2 and 23,237 m3, respectively. The building includes a large open canteen area with external window walls and roof skylights with a single internal upper level bridge and additional corridors. There are smaller classrooms in the eastern part of the building while the western part includes a long corridor connected to the canteen and laboratories. The southern part of the building features eight teaching rooms and a large auditorium, all with the possibility of passive cooling (Figure 3b,c).
During the 40 day period from 2018-06-30 to 2018-08-10, the HVAC system set point temperature was lowered to 15 °C to force continuous cooling in the daytime between the hours of 7:00–18:00 in seven of the nine rooms facing south with the possibility of passive cooling. Two rooms serve as reference without cooling (red rooms in Figure 3b,c) for comparison. The reference rooms are situated in the southwest corner of the building and are expected to experience elevated thermal stresses relative to the unconditioned rooms, from having two exterior walls exposed to the sun. However, measured room temperatures prior to the test showed that the reference rooms are slightly colder than the conditioned rooms. On that basis, it was decided that the south west corner rooms were to serve as reference during the cooling test.
Tinytag Ultra 2 temperature loggers (TGU-4017, Gemini, Chichester, UK) were installed in free air ca. 2.75 m above the floor in the nine rooms, approximately 1.5 m from the nearest wall (one logger per room). The loggers were placed as far away as possible from the in- and outlets of the ventilation. The room height on the ground and first floor are 3.385 m and 3 m, respectively while the auditorium room height varies from 2.905 m to 3.650 m due to multilevel plateaus for seat rows. The logger simultaneously measures temperature and relative humidity at a sampling interval of 15 min. The outside temperature and fluid temperatures to and from the energy piles are recorded each minute by the HVAC SCADA (supervisory control and data acquisition) system. Ventilation rates are recorded every 6 minutes. The circulation pump is a MGE90SB2-FT115-G1 (Grundfos, Bjerringbro, Denmark) throttled to a fixed 50% capacity during the test. The electricity consumption of the pump is not recorded automatically and has to be read off the display manually. This was done at the beginning and at the end of the test as access the building was prohibited during the test period. Thus, the electricity consumption of the circulation pump is assumed to be constant during the test. The nominal power consumption at 50% capacity is 750 W while the recorded, average power was 779 W during the cooling test.

2.4. Passive Heat Exchanger Model

The cooling power Pc [W] depends on the temperature difference between the ventilated air Tv [K] flowing across the surface of the heat exchanger and the fluid inside Tf [K] (the latter being the average temperature of the fluid circulating to and from the energy piles); the combined conductive and convective area-integrated heat transfer coefficient K [W/K]; and a displacement constant D [W]:
P c = K ( T v T f ) + D ,
where:
T v = ( 1 η ) ( T a T r ) 2 + T r ,
η is the efficiency of the heat recovery in the ventilation system (set to 0.7 in all calculations) [–]; Ta is the outside temperature [K] and; Tr is the temperature in the conditioned rooms [K].

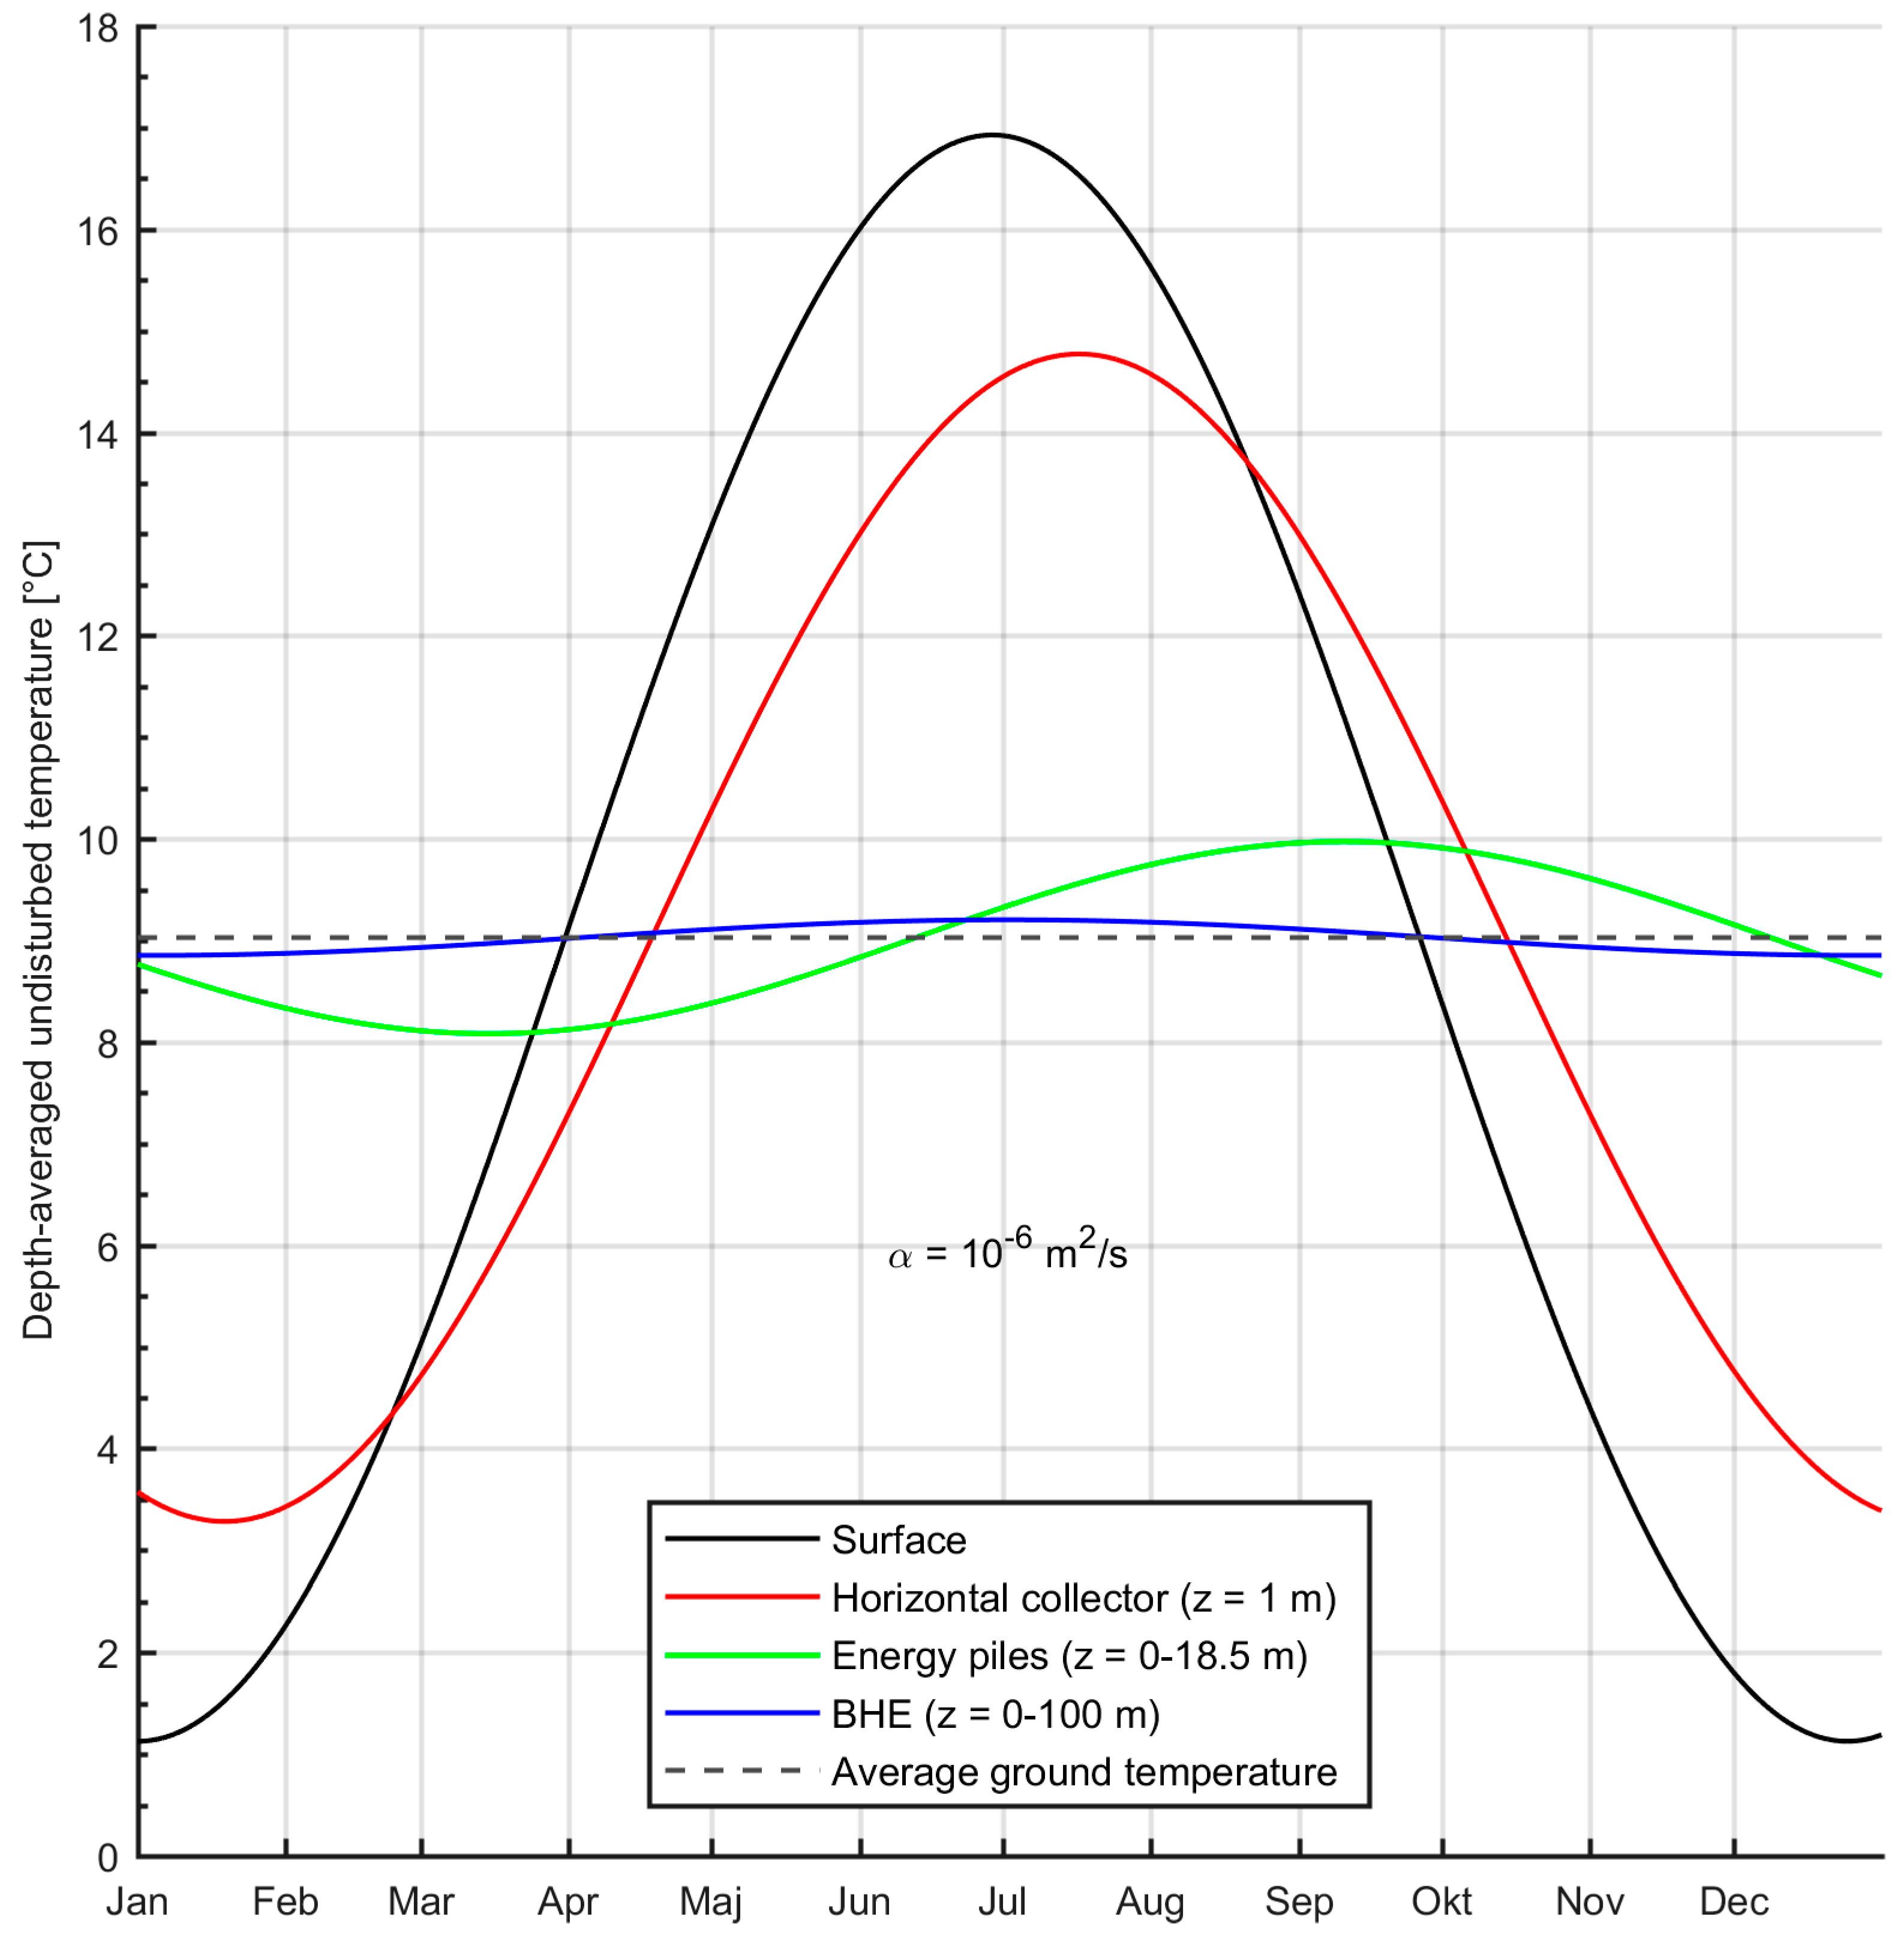
2.5. Energy Pile Fluid Temperature Model

In [22] transient FEM modelling is employed for computing dimensionless temperature response curves for the energy piles considered in this paper. The average fluid temperature response of a group of piles, Tf, is calculated by spatial and temporal superposition of responses of individual energy piles (see Equations (2) and (6), p. 204 in [22]):
T f = T u + P c L ( 1 2 π λ s G g + R c G c + R p ) ,
Tu is the undisturbed ground temperature [K]; L is the total combined length of the piles [m]; λs is the thermal conductivity of the soil [W/m/K]; Gg and Gc are the dimensionless, transient temperature responses at the pile wall and the outer geothermal pipe wall, respectively; Rc and Rp are the thermal resistances of the concrete and the geothermal piping, respectively [m·K/W]. The model assumes instant steady-state heat conduction in the geothermal piping material as indicated by the Rp term in Equation (3).

2.6. Combined Passive Heat Exchanger and Energy Pile Temperature Model

The available cooling power at a desired room temperature is determined by inserting Equation (3) in Equation (1), provided that information on outside temperatures and the efficiency of the heat recovery in the ventilation system are available (see Equation (2)):
P c = K ( T v T u ) + D 1 + K L ( 1 2 π λ s G g + R c G c + R p ) ,
the coefficients K and D in Equation (4) are estimated by linear regression of the measured cooling power Pc, and the temperature difference between the heat exchanger fluid and the ventilation air Tv-Tf in Equation (1). The energy pile fluid temperature response (Tf, Equation (3)) is precomputed for a twelve-year period (3 reiterations of the period 2015–2018) utilizing building energy simulation based estimates of the heating and cooling demand (described later in Section 2.8). The energy pile fluid temperatures from the twelfth year of operation form the basis for calculating the available cooling power in Equation (4). Associated predictions are then calculated with Equation (1) and the estimated values of the coefficients K and D, taking into account the statistical uncertainty on the linear regression model. To estimate this uncertainty, simultaneous prediction intervals for any additional predictions of cooling power are computed with the following equation:
P ^ c ( T v T f ) = P cm ± f s 2 + xSx T ,
the left side of Equation (5) is the estimated cooling power for any combination of the temperatures Tv and Tf. Pcm is the regression model estimate of the available cooling power; f is inverse of the F cumulative distribution function; s2 is the mean squared error; x is a row vector of the design matrix X and; S is the covariance matrix. Equation (5) is evaluated at the 95% confidence level.
Finally, the measured cooling power serves as a basis for calculating the energy efficiency ratio (EER) which is defined as:
EER = P c P el ,
Pel is the rate of electricity consumption of the circulation pump [W]. Pc is estimated from the measured flow rate and temperature to and from the piles and the volumetric heat capacity of the brine. The EER is estimated for all data points recorded during the test. Pc is calculated as follows:
P c = Q · Δ T f · ρ c f ,
Q is the total volumetric flow rate in the piles [m3/s], ΔTf is the temperature difference between the fluid to and from the piles [K]; and ρcf is the volumetric heat capacity of the brine [J/m3/K] which is set equal to 4.01 MJ/m3/K.
The SEER (seasonal energy efficiency ratio) is defined as follows:
SEER = E c E el ,
Ec is the total cooling energy consumed during a typical cooling season [J]. Eel is the corresponding energy consumed by the circulation pump [J].

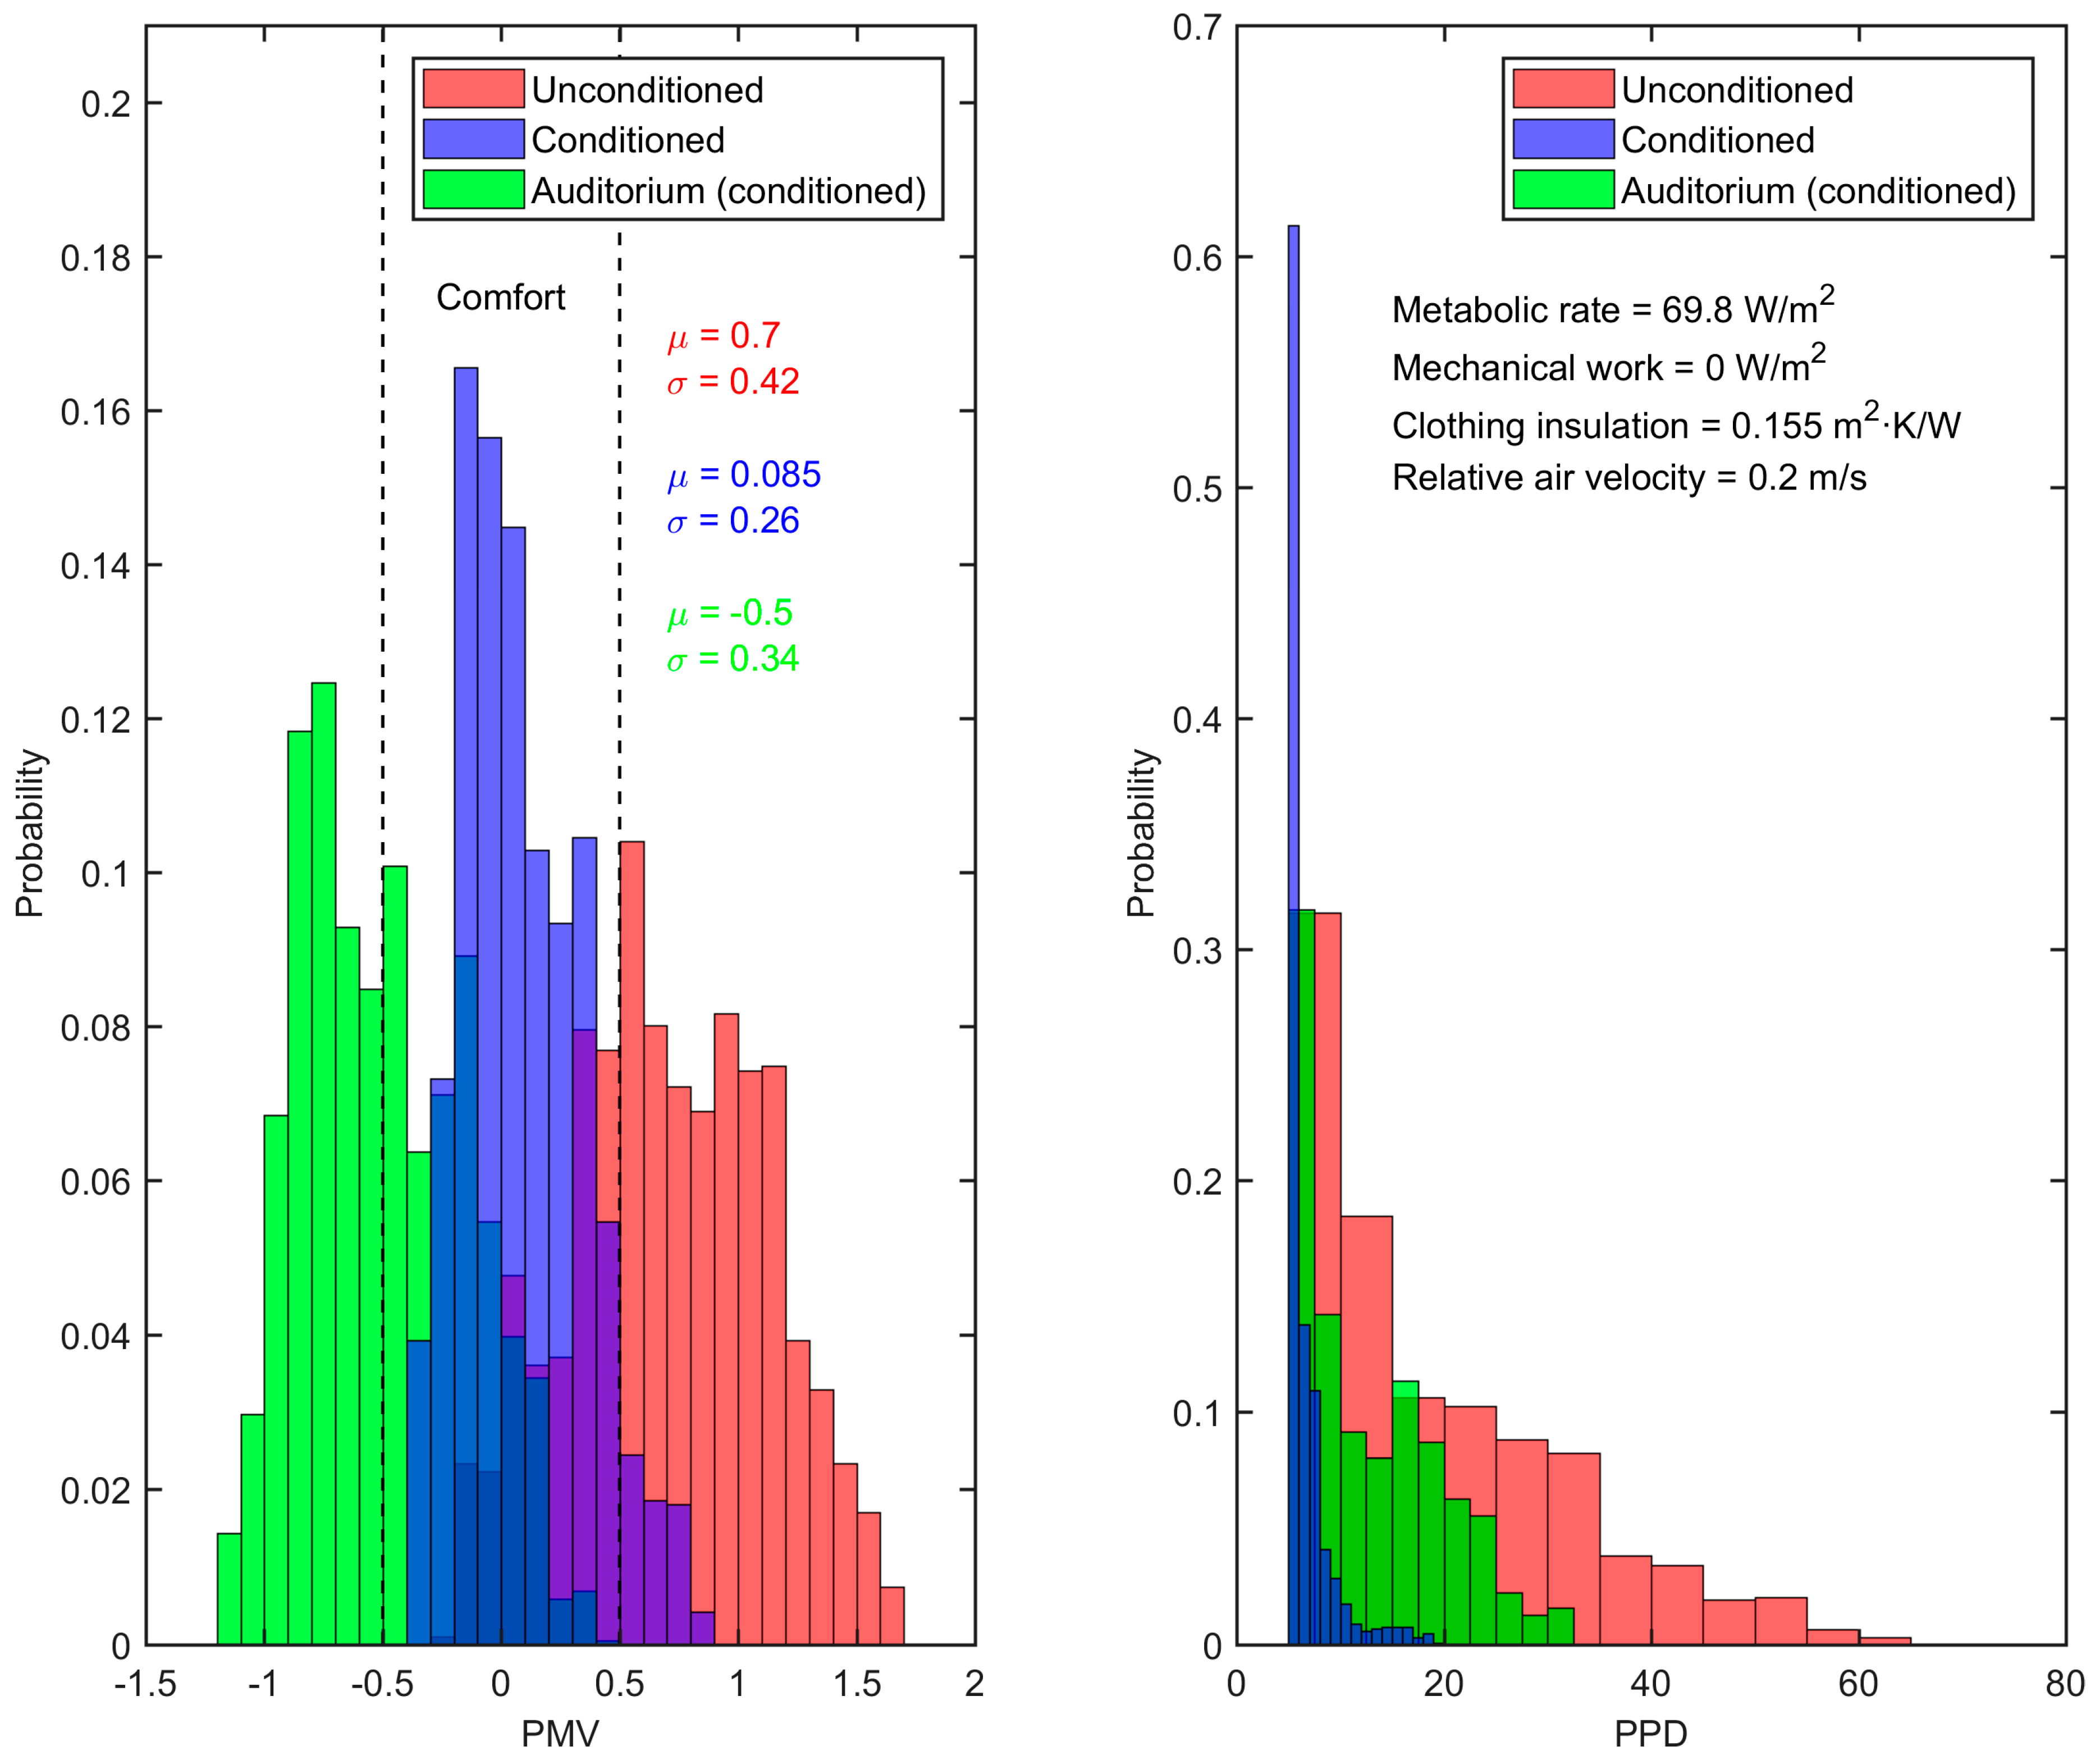
2.7. Predicted Mean Vote and Predicted Percentage Dissatisfied (PMV/PPD) Model of Thermal Comfort

Thermal comfort as perceived by humans depends largely on the air temperature, radiant temperature, air velocity, humidity, clothing and activity level. Fanger’s Predicted Mean Vote (PMV) model inputs these parameters to quantify the level of thermal comfort [20]. Optimal thermal comfort is obtained for PMV = 0 while discomfort prevails for 0.5 < PMV < −0.5. The PMV and PPD equations are given in [23].
It is obvious that the absence of people in the building during the test affects the interpretation of the PMV and PPD indices. However, the purpose of calculating PMV/PPD is to demonstrate that the thermal comfort, as measured by the PMV index, is sensitive to the use of passive cooling, regardless of the origins of the thermal stresses on the building during the test.
Table 1 lists the parameter values used in the PMV and PPD calculations. The metabolic rate corresponds to sedentary activity and clothing levels are normal. The latter assumption considers work places that enforce dress codes. Radiant temperatures equal room temperatures as there are no thermally active surfaces in the tested rooms.
The water vapour partial pressure is estimated from measured relative humidity. Finally, the MATLAB computations of PMV and PPD were thoroughly tested with the online PMV tool developed at UC Berkeley [24].

2.8. Building Energy Model

An EnergyPlus [25] building energy model was set up in DesignBuilder [26] from existing spatial and material information to estimate the total heating and cooling demand of the building. The model was set up for the building shown in Figure 3b,c. Energy exchange with the connected building to the north via the canteen is ignored in the computations (Figure 3b). The construction U-value template “Denmark, Heavyweight” forms the basis for the simulations. In the model, rooms are distinguished in the following classes based on their use and characteristics: halls, laboratories, classrooms and general.
The model assumes operational hours from 7:00 to 18:00 corresponding to the opening and closing hours of the gymnasium. The building hosts different types of activities such as concerts and theatre plays. However, for simplicity, all simulated activities follow the regular school schedule. Different types of occupancy in the classrooms and halls/corridors/stairs/toilets are assumed (Table 2).
The occupancy is estimated from actual staff and student records from 2018. Four activity templates, based on the ASHRAE standard [27], are used for the different room classes (Table 3).
Local 1 h resolution weather data from 2018-01-01 to 2018-12-31 serves as the external boundary condition for the building energy simulation and was obtained from the Danish Meteorological Institute (DMI), including the mean outside temperature [°C]; mean humidity [%]; mean wind speed (10 min average) [m/s]; mean wind direction [°]; mean pressure [hpa]; minutes of bright sunshine (Star Pyranometer) [minutes]; mean radiation (Spectral Range: 305–2800 Nm) [W/m2] and; accumulated precipitation [mm]. The meteorological station (DMI station no. 610200), from which the data was obtained, is situated 27 km from the gymnasium. EnergyPlus further requires the outside dew point temperature as input to the simulation, which is calculated directly from the measured mean temperature and humidity.
The HVAC system is implemented from CAD-drawings of the mechanical ventilation system and the information about the floor area, the minimum supply of fresh area per square meter, the occupancy density, and the minimum supply of fresh area per person and the radiator system for heating.

3. Results and Discussion

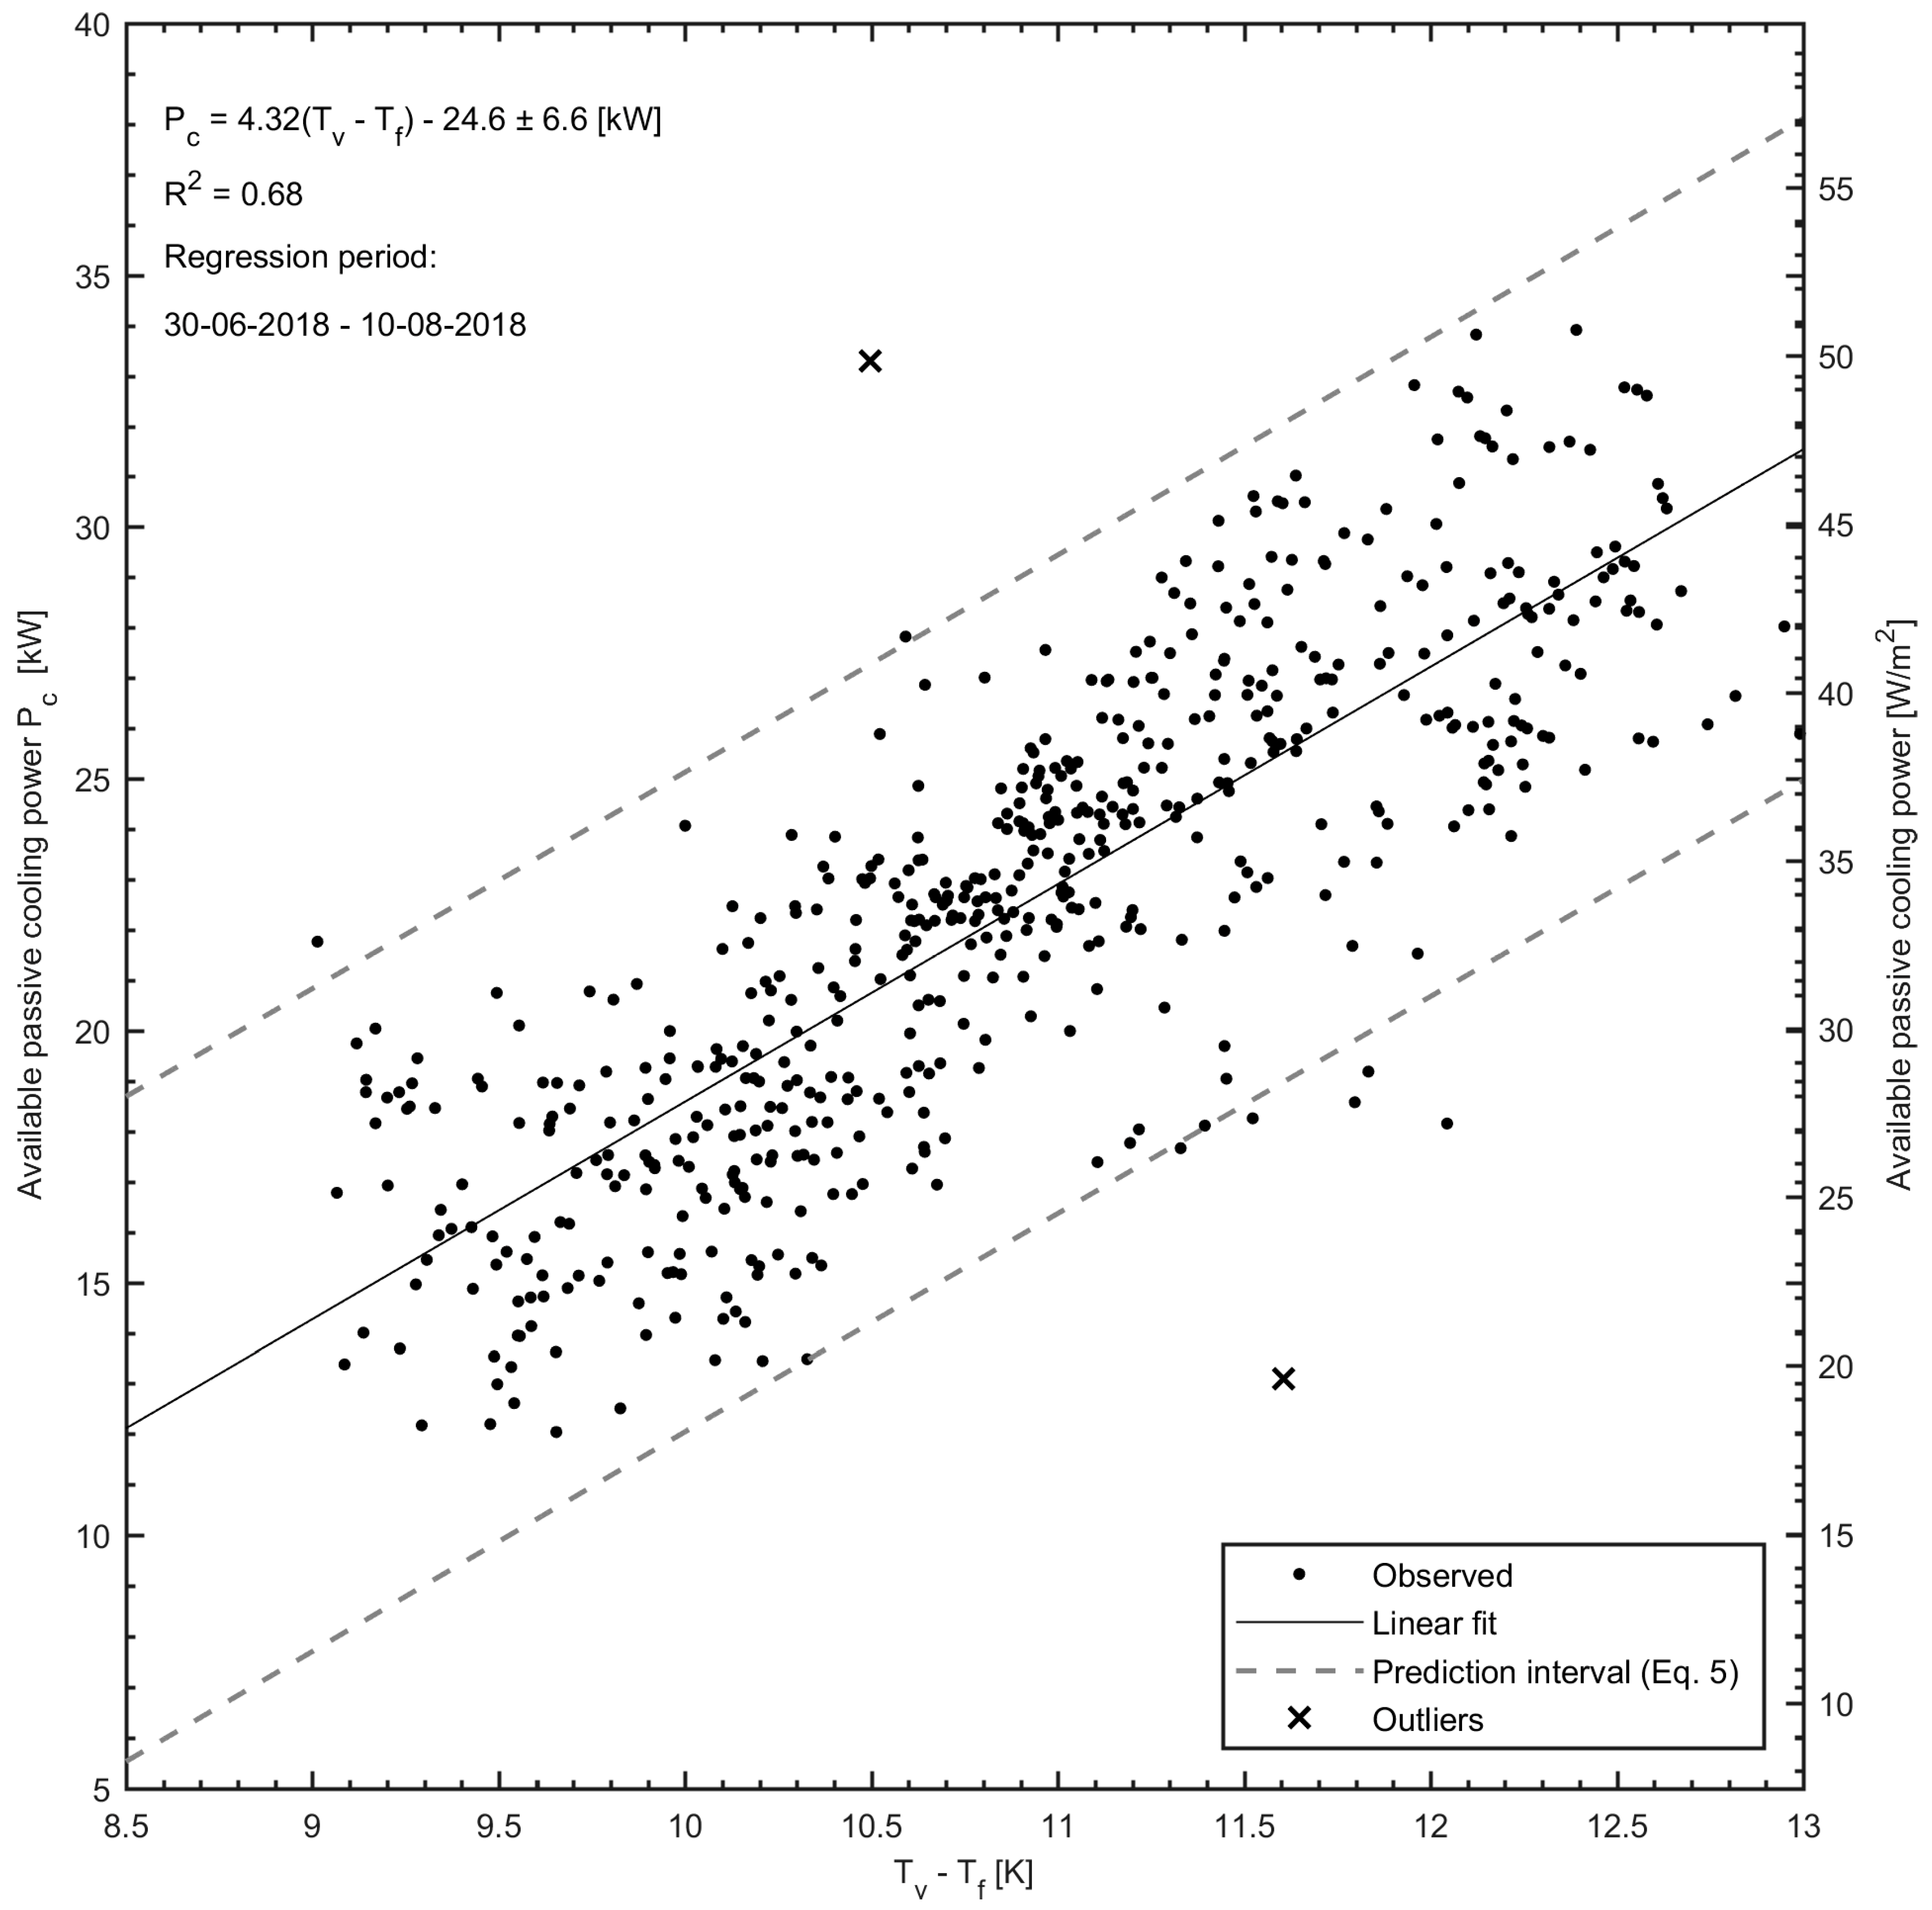
3.1. Passive Cooling Test
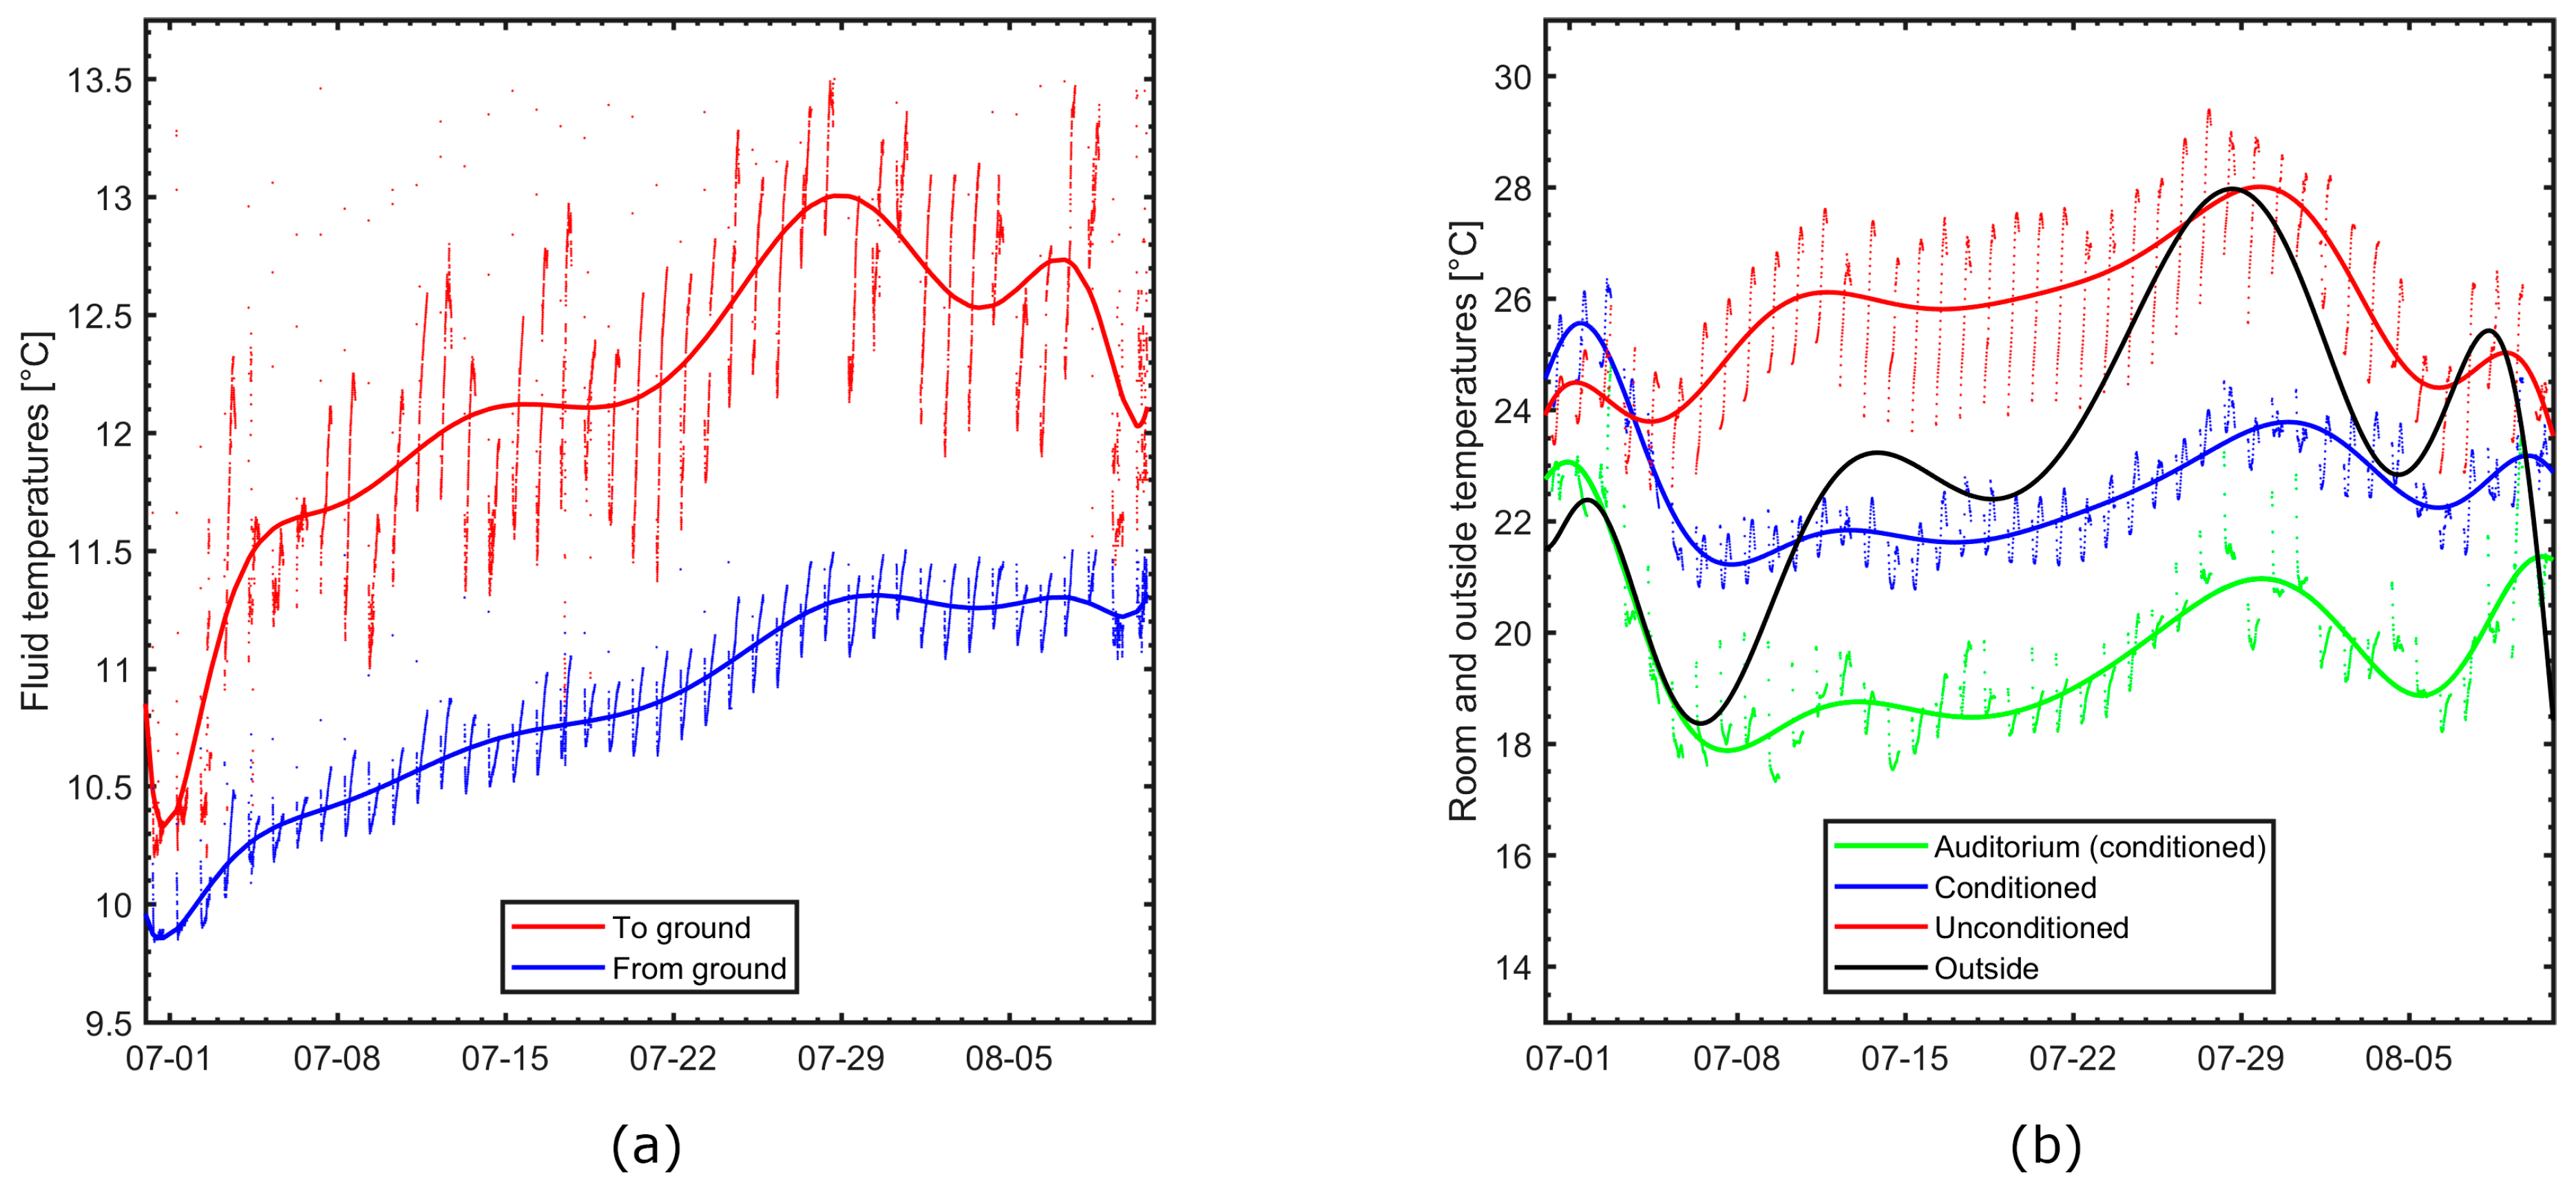
3.1.1. Temperature

The temperature of the brine from the piles is 9.9 °C initially and increases to 11.5 °C at the end of the test as heat is rejected to the ground, fluctuating somewhat with the applied cooling power (Figure 5a).
The temperature of the fluid returning to the piles obviously correlate more strongly with the applied cooling power, starting at 10.4 °C and increasing to 12.8 °C at the end of the test. Room temperatures prior to the test are slightly higher in the conditioned rooms, relative to the reference, except in the auditorium (Figure 5b). As the cooling test initiates and progresses, temperatures rapidly decrease in the conditioned rooms from approximately 26 °C to 22 °C while unconditioned rooms see temperatures increase from 24 °C to 26 °C. Temperatures in the auditorium decrease from approximately 23 °C prior to the test, to 18 °C shortly after the test initiates and remain ca. 8 °C lower than unconditioned reference rooms throughout the test. The ratio of window area to room volume is significantly smaller in the auditorium relative to the smaller, teaching rooms, serving to explain the greater decrease in auditorium temperatures during the test. At the end of July, average, daytime outside temperatures soar to more than 28 °C which elevates indoors temperatures by 1–2 °C. Over a day, temperatures vary less than 2 °C in the conditioned rooms including the auditorium while unconditioned reference rooms experience temperature variations of up to 4 °C (amplitudes of raw data in Figure 5b).

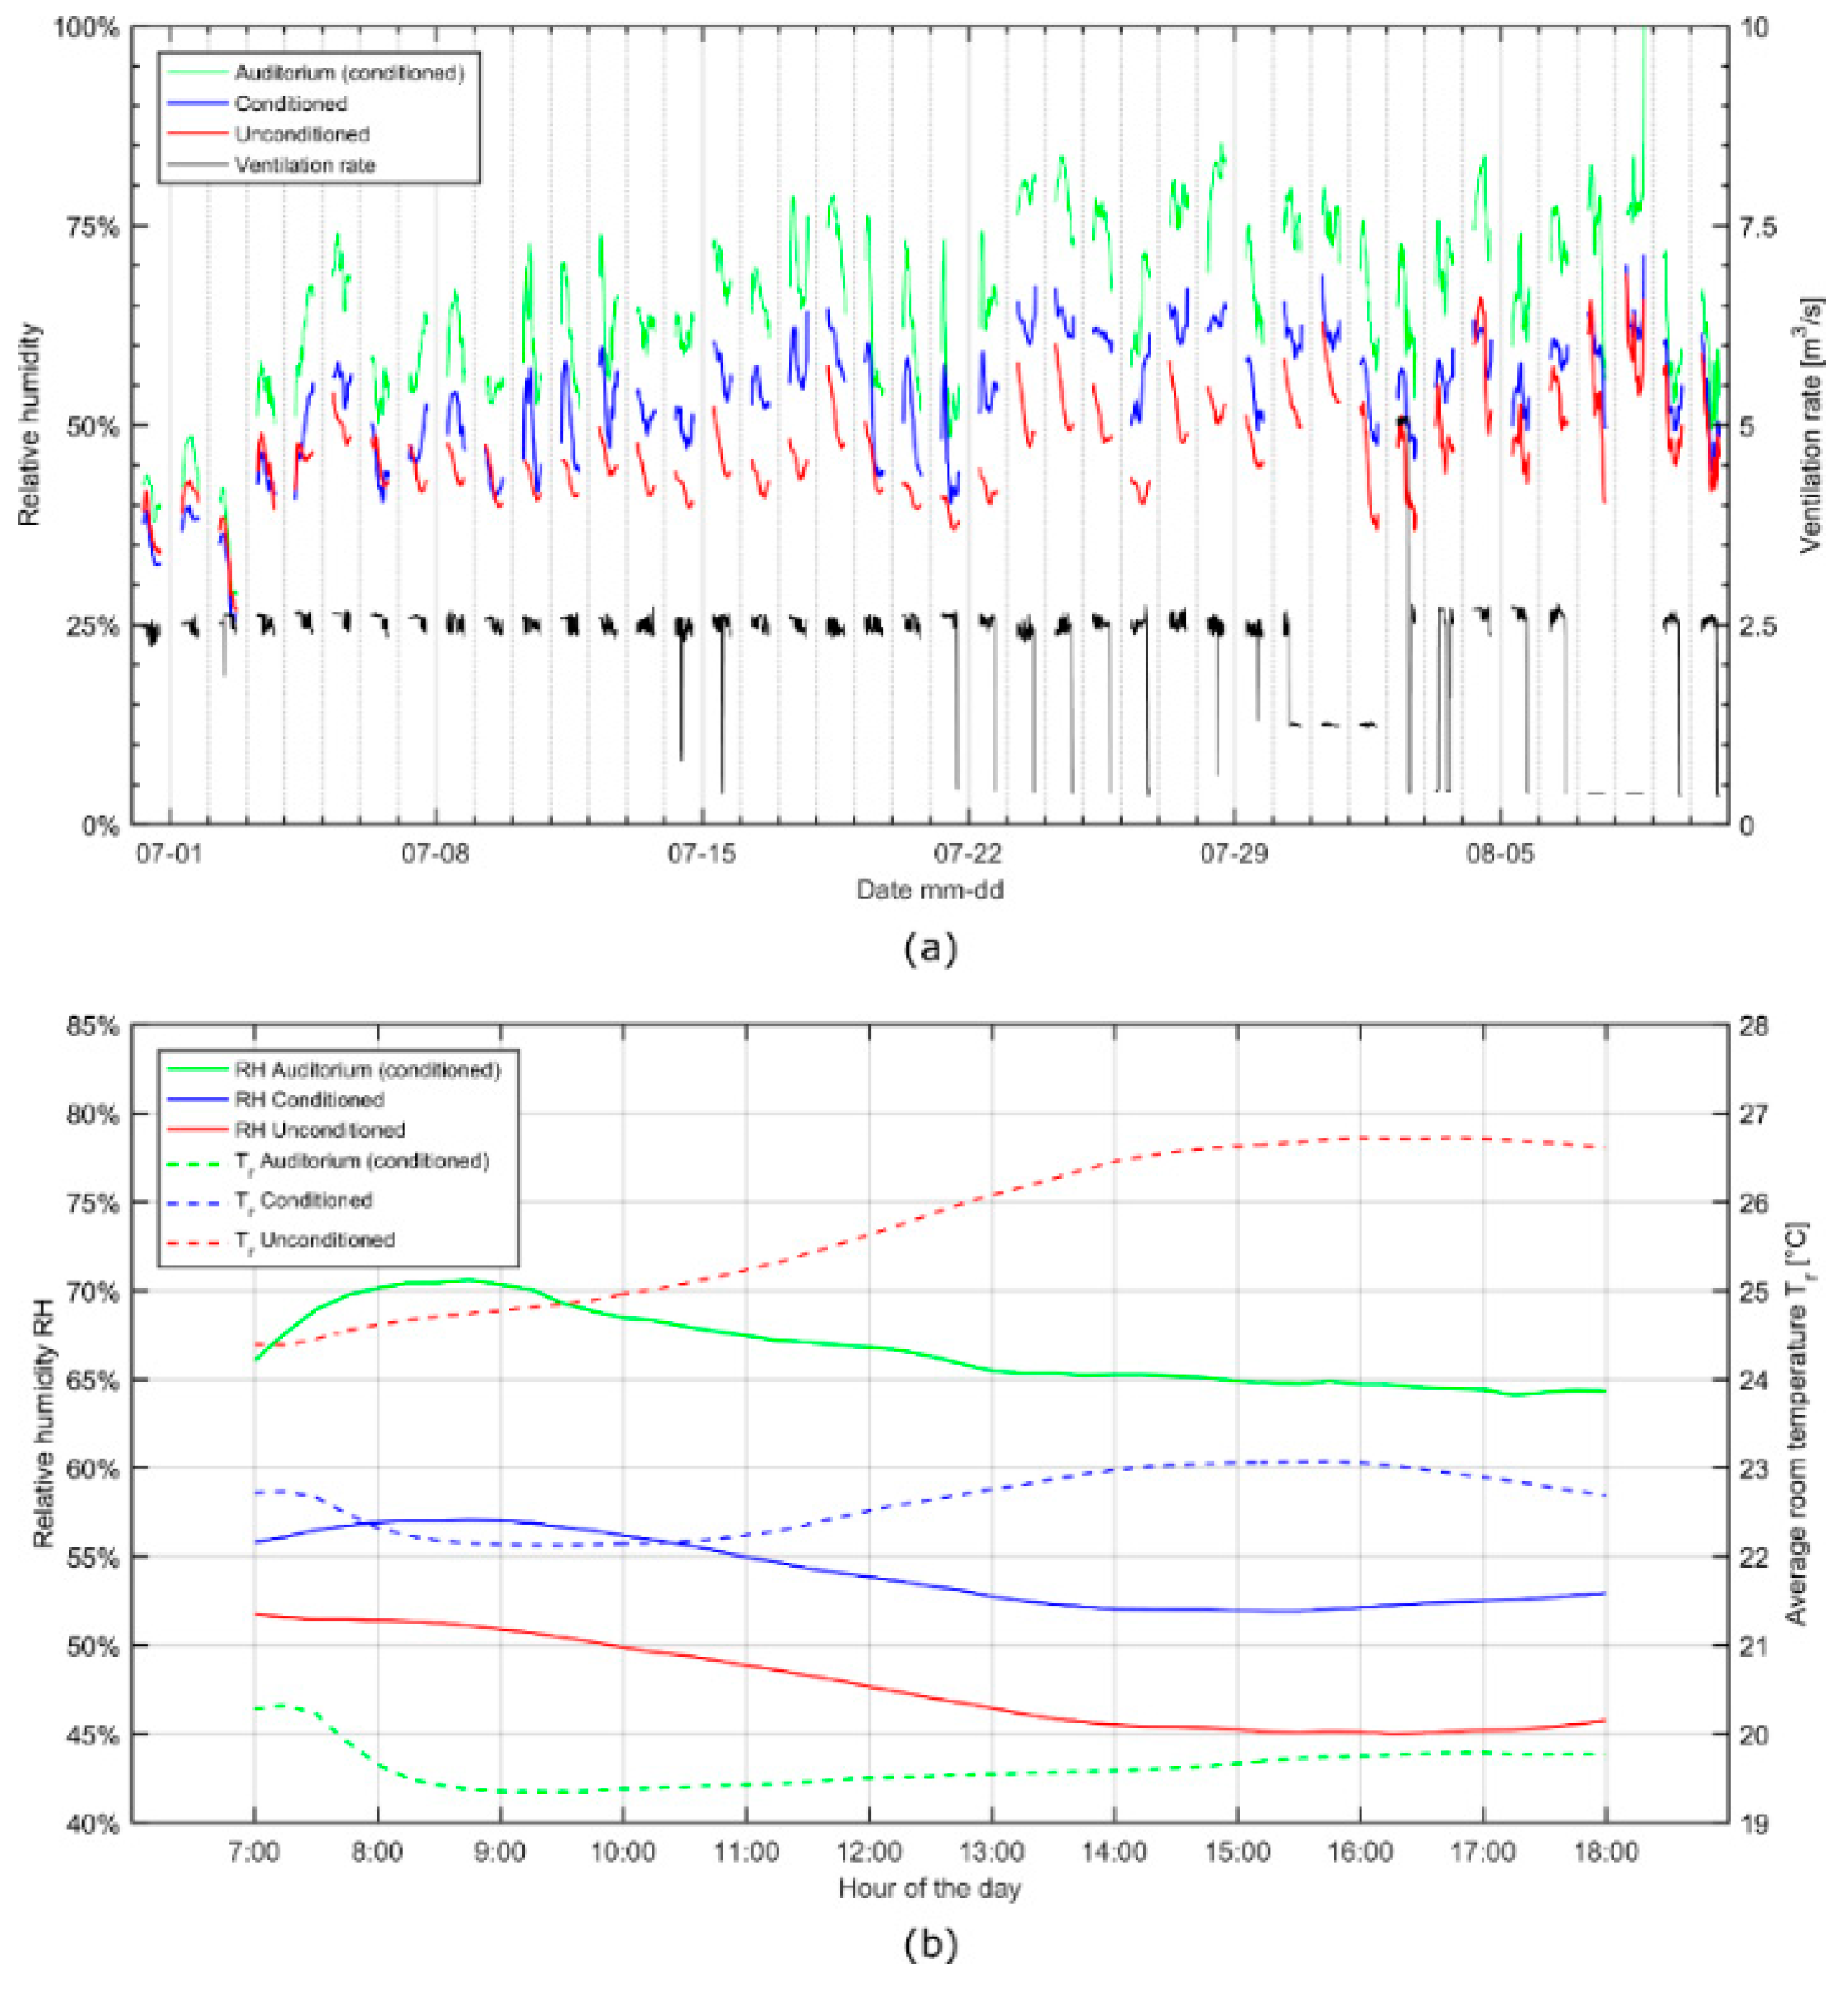
3.1.2. Humidity and Ventilation Rates

The relative humidity is up to 17% higher in the smaller, conditioned teaching rooms, relative to reference rooms (Figure 6a). Ventilation rates are stable around 2.5 m3/s. The measured relative humidity in the auditorium is up to 35% higher than in the unconditioned reference rooms (absolute, not relative) due to significantly lower temperatures in the auditorium. The average daily variation in humidity reflect changes in room temperatures (Figure 6b). In conditioned rooms, the temperatures decrease initially as cooling is initiated in the morning hours after 7:00 causing relative humidity to increase. At roughly 9:30, the elevated thermal stresses on the building cause room temperatures to increase and humidity to decrease. After 16:00, temperatures decrease slightly in both the conditioned and unconditioned rooms due to the decreasing angle of the sun relative to the room windows facing south, resulting in a minor increase in humidity.
The air moisture partly condensates on the surface of the heat exchangers in the ventilation system when cooling is initiated, however, not to the extent at which it corresponds to the reduction in dew point mass resulting from lower temperatures. For obvious reasons, the ventilation system has a tray for collecting the condensing water.

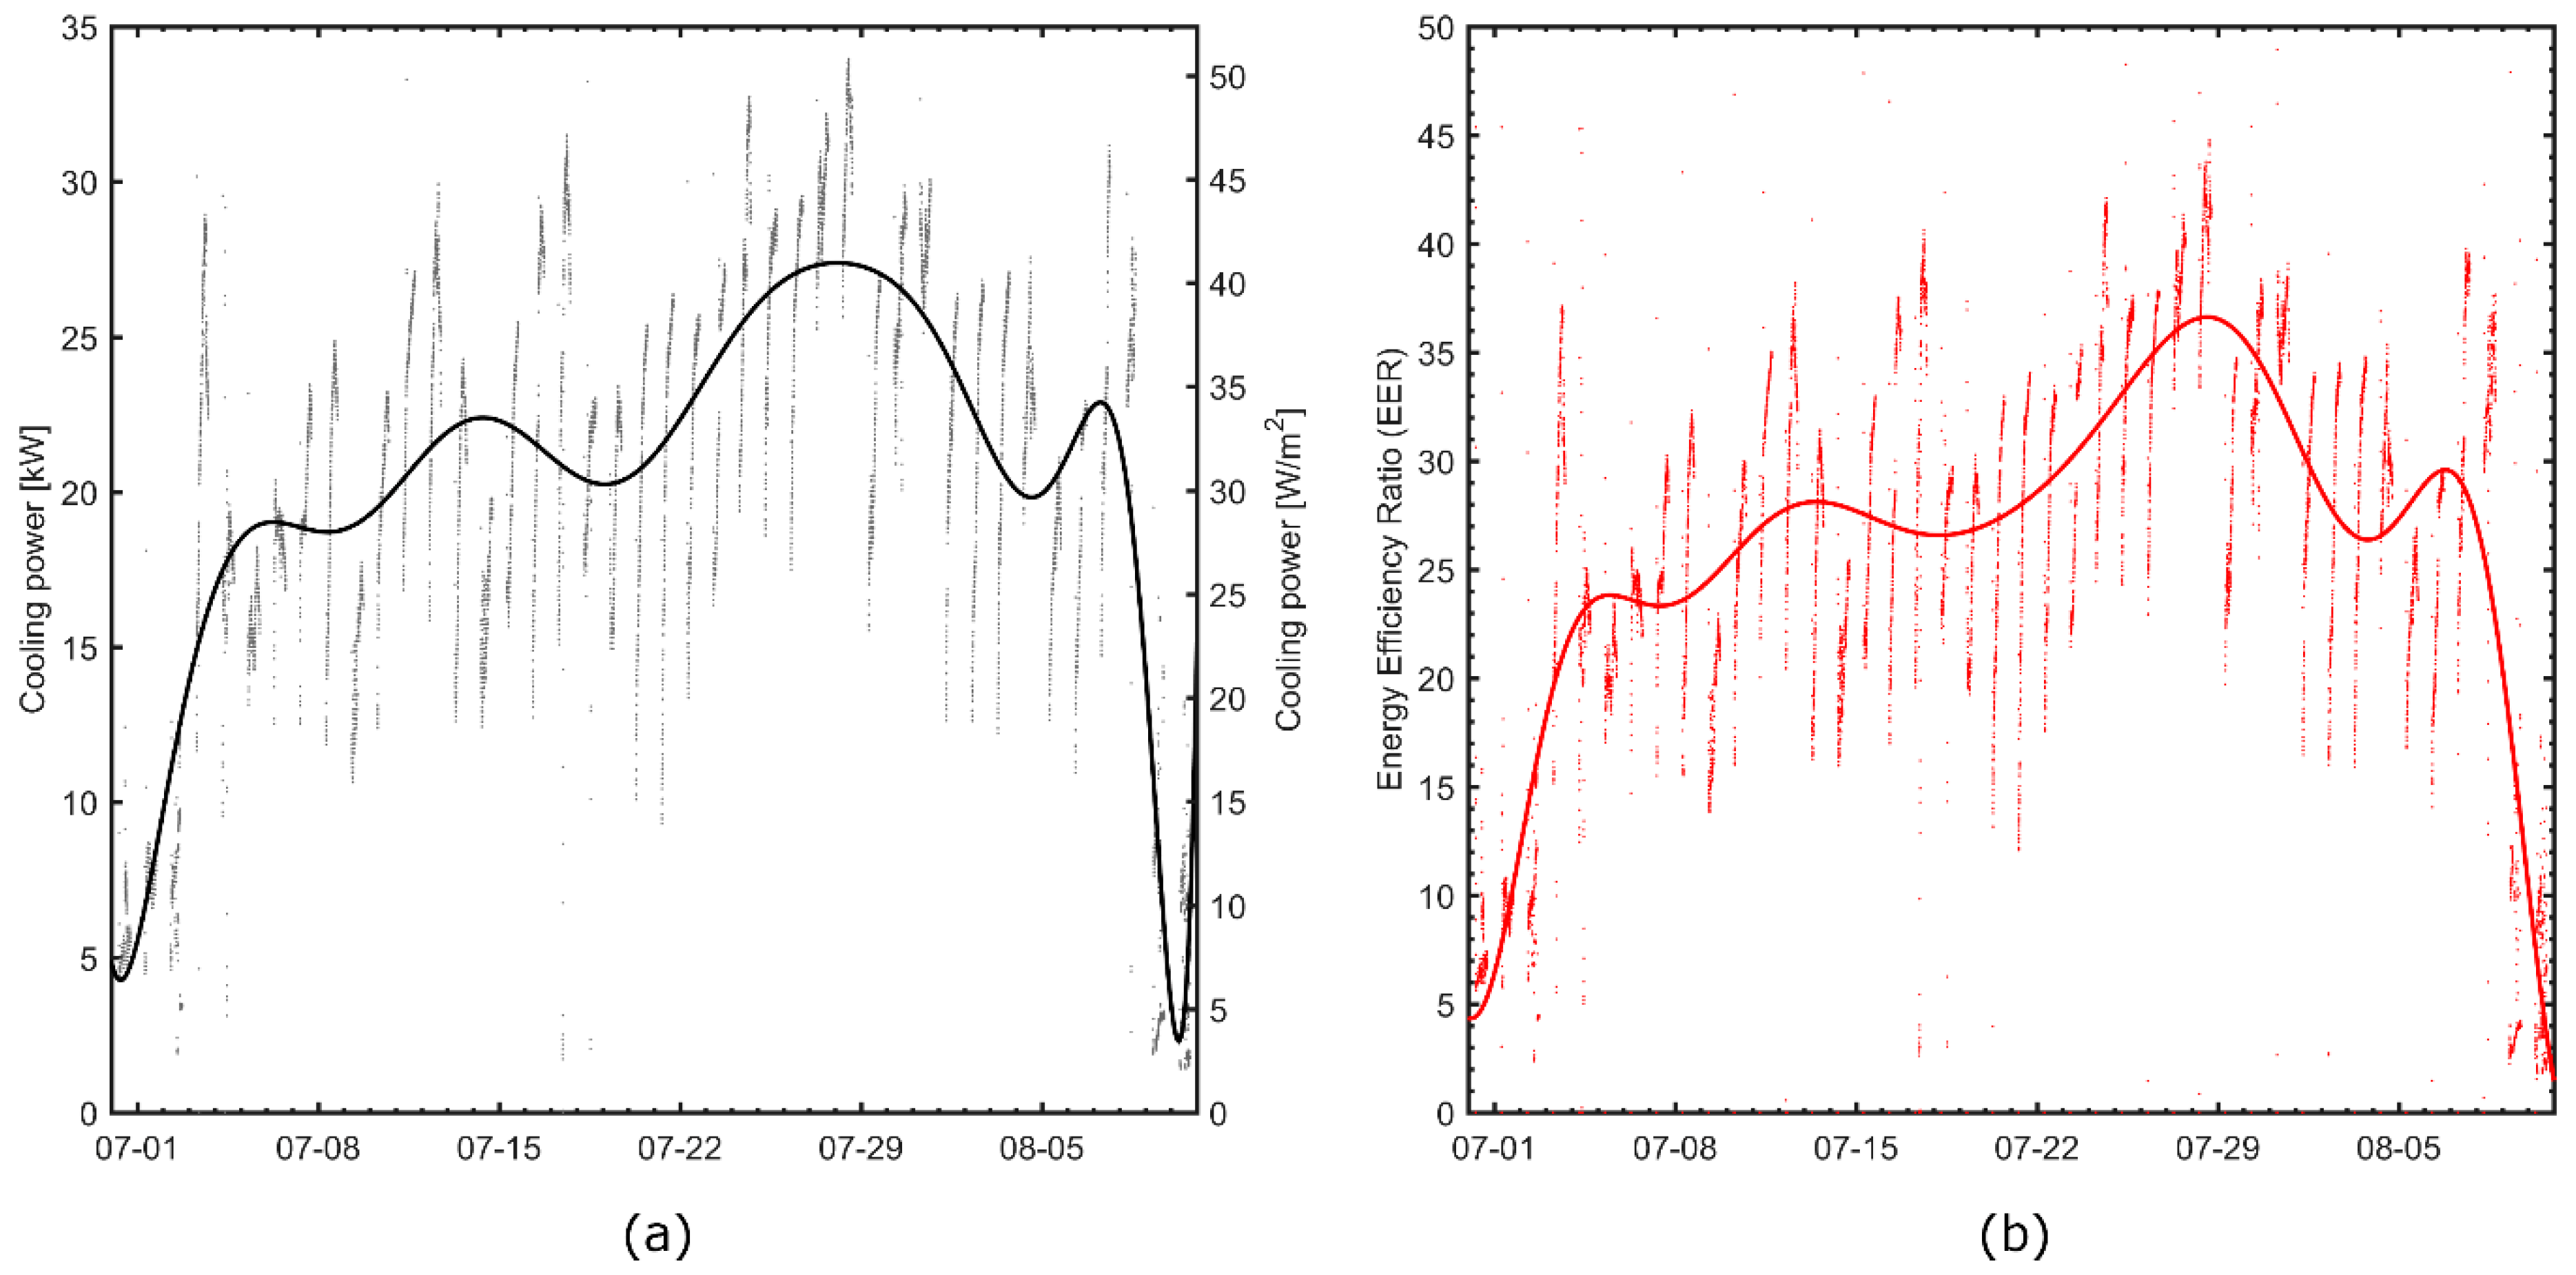
3.1.3. Cooling Power and Energy Efficiency Ratio

Cooling power varies between 4 and 50 W/m2 during the test campaign and generally correlate positively with outside temperatures (Figure 5 and Figure 7a).
During hot and sunny weather, room temperatures are elevated due to increased thermal conduction through walls and solar thermal stresses on the building. The hot, inflowing air in the ventilation system equilibrates partly to the elevated room temperature in the energy recovery system. In combination, the temperature difference between the energy pile fluid in the heat exchanger and the ventilated air increases, which amplifies the cooling power. In total, the cooling power profile integrates to 8.80 MWh of energy rejected to the ground during the test.
The EER (Equation (6)) varies between 3 and 45 and merely reflects changes in the cooling power as the electricity consumption of the circulation pump is assumed to be steady in time (Figure 7b). Consequently, passive cooling is most efficient when thermal stresses on the building are high during hot and sunny weather. Compared to the EER of traditional air conditioning units, the efficiency of passive cooling with energy piles is roughly one order of magnitude higher. Integrating the total cooling energy for the test period yields a SEER (Equation (8)) of 24.8.
In case of occupants who frequently open and closes doors and windows for creating natural ventilation during hot weather, the cooling power, and therefore also the EER, increase due to elevated indoor temperatures. However, the higher efficiencies merely mask poor management of the thermal indoor environment causing too high indoor temperatures. Behavioral control should be enforced so that opening of windows when cooling is employed is only possible in case of an emergency. Automatic door closers further serve to alleviate problems with unwanted natural ventilation.

3.1.4. Thermal Comfort (PMV and PPD)

Thermal comfort as measured by the PMV index is significantly affected by the passive cooling during the test (Figure 8a). The unconditioned reference rooms are generally too hot which causes the PMV index to increase well above the upper limit of 0.5 for thermal comfort. Consequently, the share of people that would feel dissatisfied with the thermal conditions (PPD) peaks at 60% during the hot weather at the end of July 2018 (Figure 8b). In the conditioned rooms, temperatures are about 4–6 °C lower than in the unconditioned reference rooms, which serve to lower the PMV to within the thermal comfort bounds of ±0.5 throughout the test, with an average value close to zero. Consequently, the PPD decreases to less than 10%, on average, with peaks at 20%. The auditorium temperatures are below comfortable levels (PMV < −0.5) and the increased humidity further contributes to the sensation of thermal discomfort. Optimal thermal comfort is achieved only during the hot period at the end of July 2018 where PMVs are approximately zero. In practice, cooling in the auditorium should be employed in such a way that the PMV is as close to zero as possible at all times. In case of exceptionally hot and sunny weather, where room temperatures cannot be reduced sufficiently by passive cooling, increased ventilation rates serve to further lower the PMV. For instance, increasing the air velocity from 0.2 m/s to 0.3 m/s decreases the mean PMV by 0.10 while only slightly increasing the corresponding standard deviation (0.26 to 0.29).
The thermal comfort is evaluated at a height of 2.75 m above the floor. Therefore, it is expected that temperatures potentially differ at shoulder level. The mixing ventilation system at Rosborg Gymnasium employs relatively high ventilation rates which tend to smooth out vertical temperature gradients, compared to an equivalent air displacement based system. That is, the temperature change from the point of measurement to shoulder level is expected to be rather small.
The assumed clothing level (1 Clo = 0.155 m2·K/W) corresponds to trousers, long-sleeved shirt, long-sleeved sweater and T-shirt. This assumption takes into consideration work places that impose a formal dress code. In the absence of a dress code, it is more likely that people choose a less insulating set of clothing such as a e.g., a T-shirt and pants corresponding to 0.5 Clo. Reduced clothing has a dramatic impact on thermal comfort. For the auditorium and the conditioned and unconditioned rooms, the mean PMV decreases to −1.8 (σ = 0.47), −0.94 (σ = 0.36) and −0.073 (σ = 0.58), respectively, assuming a clothing level of 0.5 Clo instead of 1 Clo. Reduced clothing lowers the average PMV to comfortable levels in unconditioned rooms, however, the standard deviation is more than doubled relative to increased clothing with passive cooling (σ = 0.58 and σ = 0.26, respectively). Thus, room conditioning, instead of reduced clothing, tends to lower the standard deviation on the PMV, thus reducing the duration of periods where PMV departs from comfortable levels.

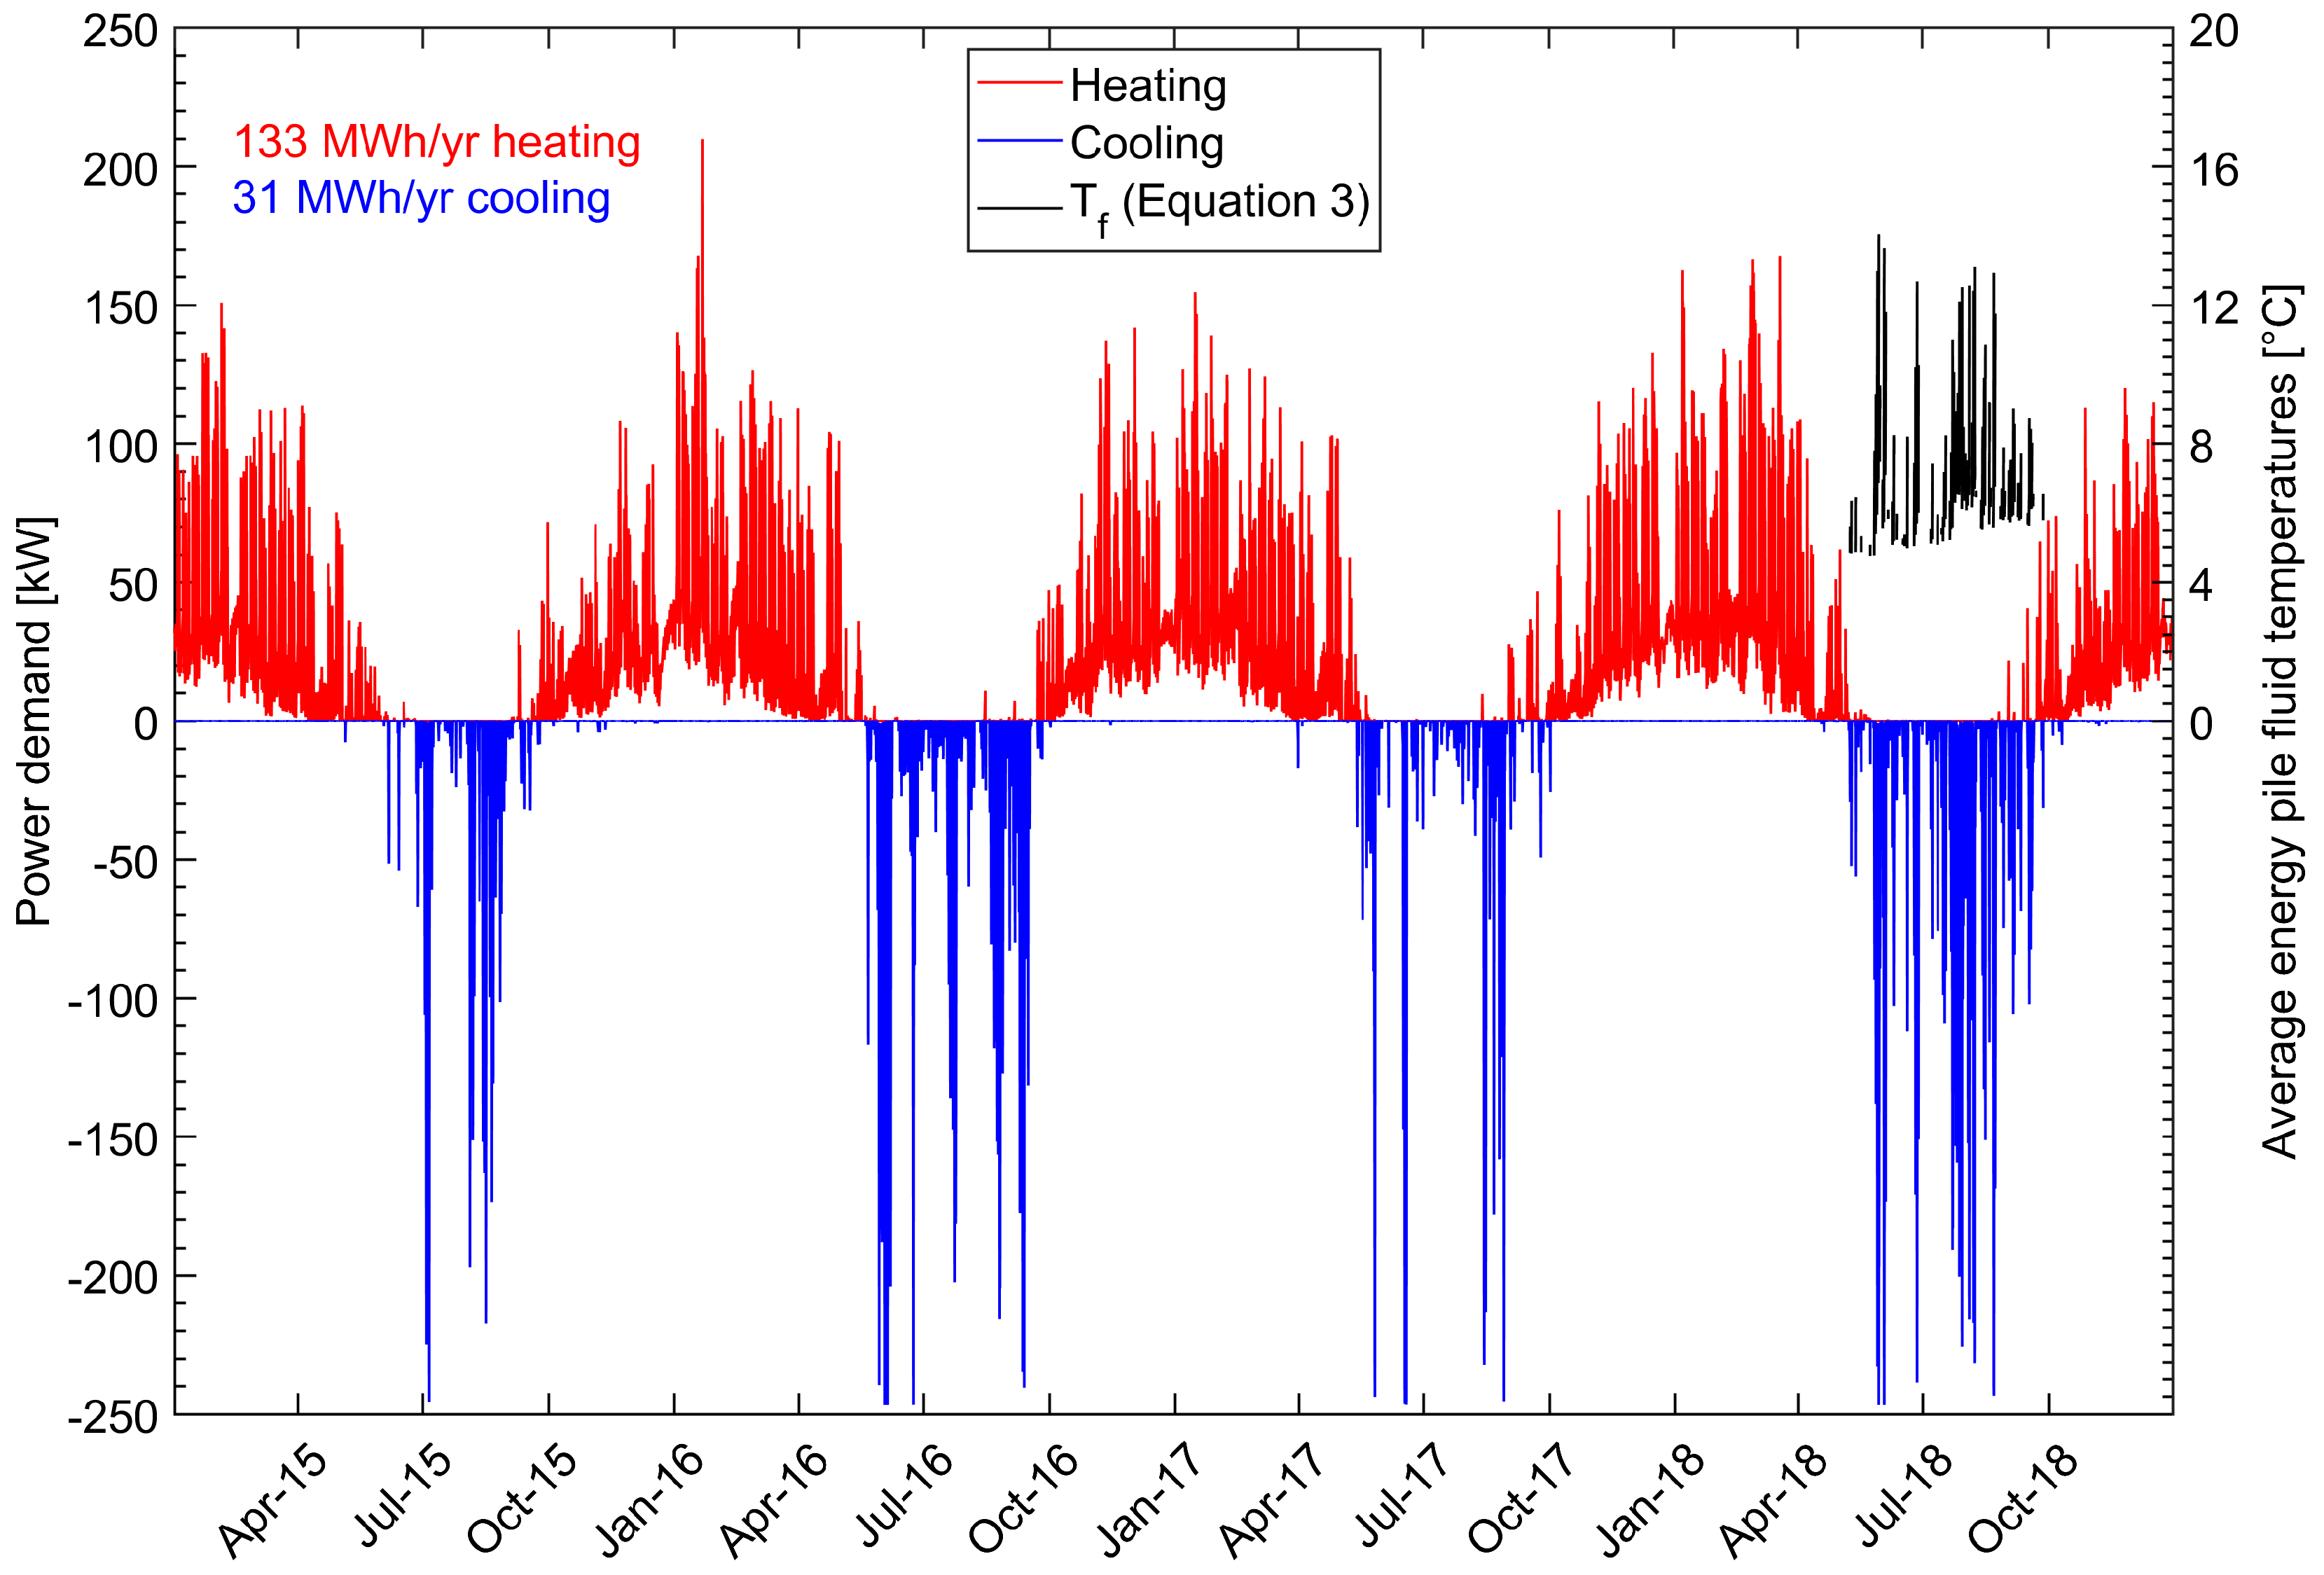
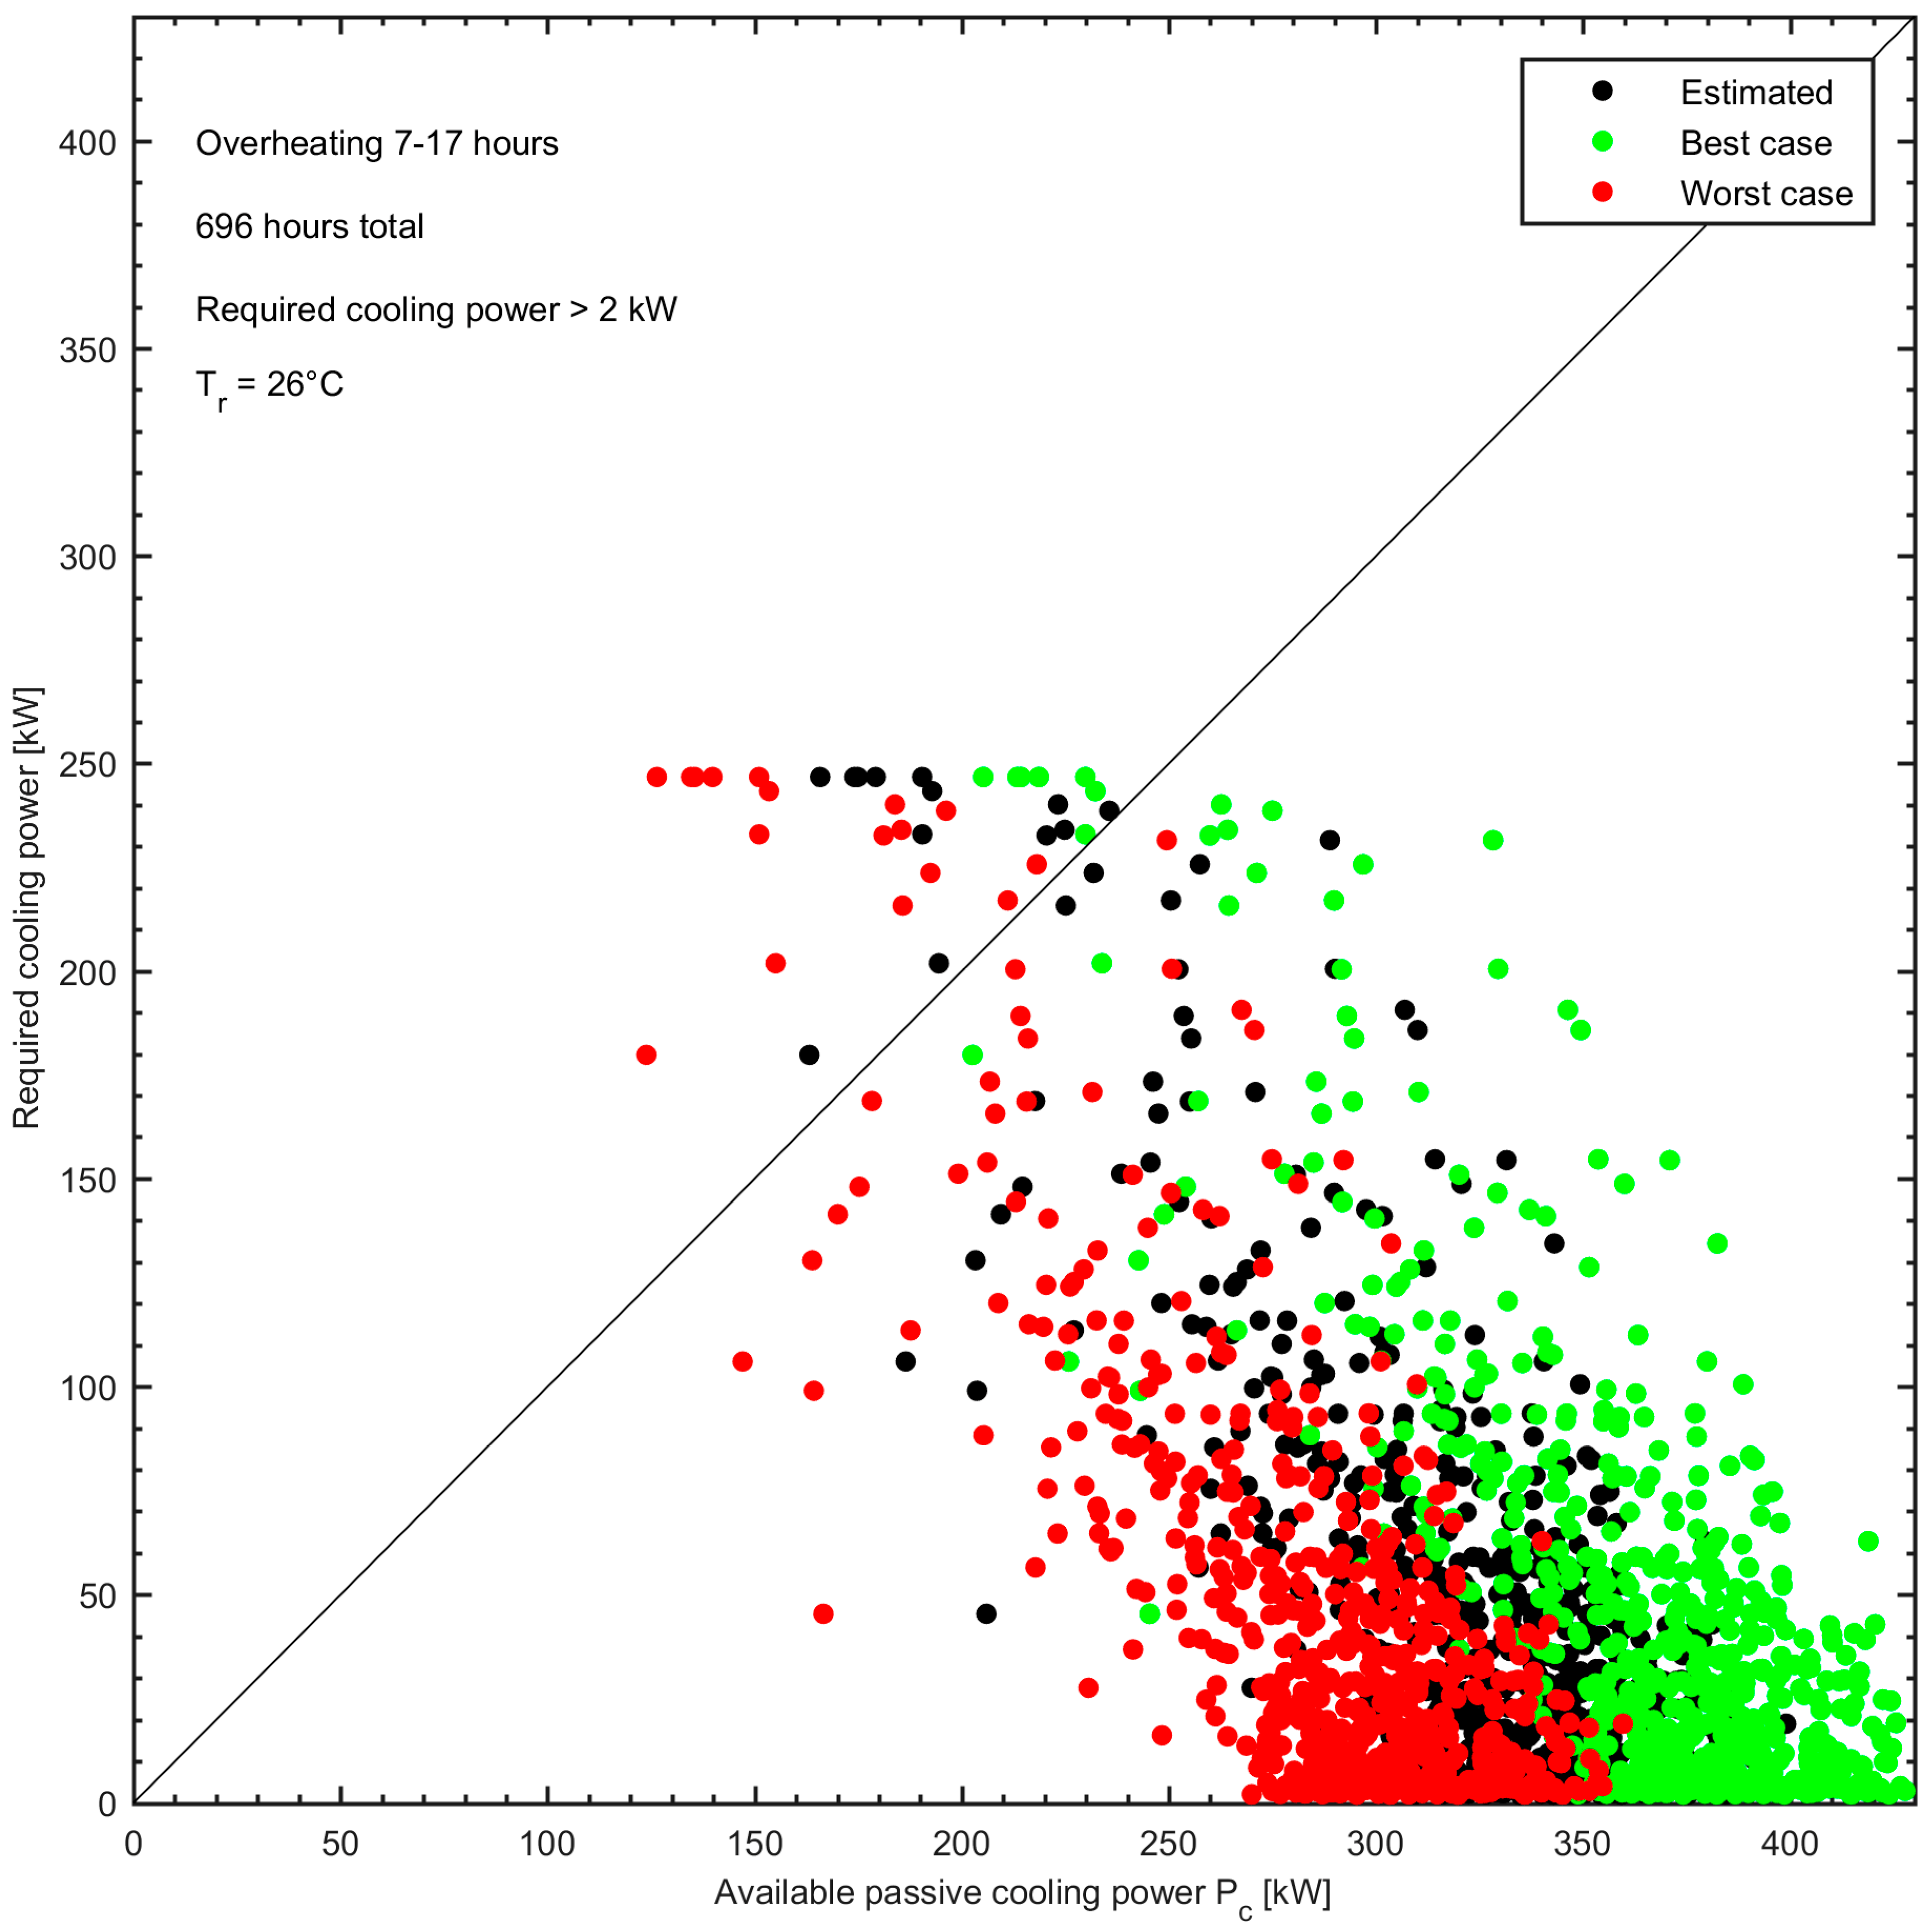
3.2. Comparison of the Required and Available Passive Cooling at Rosborg Gymnasium

The parameters K and D in Equation (1) are estimated by linear regression analysis (Figure 9).
In order to provide conservative estimates of the available cooling power, the auditorium temperatures are omitted in the linear regression, as they are significantly lower than in the smaller teaching rooms. Otherwise, the measured cooling powers are correlated with the corresponding relatively low auditorium temperatures, thus increasing the estimated available cooling power in the regression at a specified room temperature. The EnergyPlus estimated heating and cooling demand at Rosborg Gymnasium is shown in Figure 10.
The heating demand peaks at around 160 kW with a single maximum at 210 kW. On average, the required heating power peaks around 75 kW during the winter, varying somewhat steadily with the seasons and integrating to a total of 133 MWh of heating per year. For comparison, the corresponding measured annual heat consumption at Rosborg Gymnasium is 135 MWh and thus in good agreement with the simulated estimate. The required cooling power exhibits greater variation relative to heating and peaks close to 250 kW, integrating to 31 MWh of cooling per year.
Equations (1) and (5) are used for computing the most likely estimate of the available cooling power and the worst and best cases by means of the prediction intervals in Figure 9. The estimates of soil thermal conductivity and volumetric heat capacity shown in Figure 2 form the basis for calculating the energy pile fluid temperatures Tf in Equation (1) for 12 years of operation by reiterating the four-year heating and cooling demand profile, shown in Figure 10, three times. The twelfth year of operation, corresponding to the 2018 demand profile, is considered in the comparison of required and available cooling power, as energy pile fluid temperatures are no longer affected by the initial soil temperature conditions. For reference, the calculated Tf is shown for the hot season in 2018 in Figure 10. Tv is calculated from the corresponding outside temperatures included in the local climate data. The room temperature Tr in Equation (2) is set equal to 26 °C to ensure consistency with the building energy model that uses an identical cooling set point temperature (Table 3).
In order to compare Equation (1) to the total cooling demand, the coefficients K and D are scaled up by the ratio between the total liveable area (3949 m2) and the conditioned area during the cooling test (668 m2). Required cooling powers less than 2 kW are ignored in the comparison (Figure 11).
The required cooling power exceeds 2 kW for 696 h a year. Passive cooling is able to cover the demand entirely except for 7–17 h. Shaving extraordinary peaks in the cooling demand is possible with a reversible heat pump that supplies both heating and cooling. Active cooling can be applied gradually as demands increase, ensuring high efficiency of the heat pump. This is possible with only a slight reduction in the effective SEER so long that the majority of cooling is done passively as is the case at Rosborg Gymnasium.

Author Contributions

Conceptualization, P.S.E.; methodology, P.S.E. and A.-P.M.; software, P.S.E.; A.-P.M.; C.D.; M.A.; validation, P.S.E.; A.-P.M.; C.D.; formal analysis, P.S.E. and C.D.; investigation, P.S.E. and A.-P.M.; resources, P.S.E.; A.-P.M.; C.D.; M.A.; data curation, P.S.E.; A.-P.M.; C.D.; writing—original draft preparation, P.S.E.; writing—review and editing, P.S.E.; visualization, P.S.E. and A.-P.M.; supervision, P.S.E.; A.-P.M.; M.A.; project administration, P.S.E.; funding acquisition, P.S.E.

Funding

The research was carried out in the project “Sustainable, building-integrated heating and cooling supply for future resilient cities” (project number 64017−05182) kindly supported by the EUDP foundation under the Danish Energy Agency. Davide Cerra obtained his master thesis under the Erasmus+ program.

Acknowledgments

We kindly thank Rosborg Gymnasium, Vejle, Denmark for making the building available for the passive cooling test during the summer of 2018. Moreover, we wish to extend our gratitude to three anonymous reviewers whose careful reading and constructive comments improved the paper significantly.

Conflicts of Interest

The authors declare no conflict of interest.

Appendix A

The undisturbed seasonal variation in the mean temperature Tm over the length of the ground heat exchanger placed between the surface and depth L can be obtained by integrating the thermal disturbance from depth z = 0 to z = L [28]:
T m = T 0 + A L 0 L e × p ( z ω 2 α ) · cos ( ω t z ω 2 α ) dz
= T 0 + A L e × p ( ω 2 α L ) · [ sin ( ω 2 α L ω t ) cos ( ω 2 α L ω t ) ] + sin ( ω t ) + cos ( ω t ) 2 ω 2 α
T0 is the average ground temperature [K]; A is the amplitude of the seasonal temperature disturbance [K]; ω is the angular velocity [rad/s]; α is the thermal diffusivity [m2/s]; and t is time [s]. T0 in Figure 1 (=9.03 °C) is estimated from monthly, average surface temperatures in Denmark for the period 2006–2015 [29] which roughly correspond to average undisturbed ground temperatures when disregarding paleoclimatic thermal disturbances.

References

  1. IPCC. Climate Change 2013: The Physical Science Basis, Fifth Assessment Report (AR5); IPCC: New York, NY, USA, 2014; Available online: http://www.ipcc.ch/report/ar5/wg1/ (accessed on 6 March 2019).
  2. The Danish Government. The Danish Climate Policy Plan—Towards a Low Carbon Society. 2013. Available online: https://ens.dk/sites/ens.dk/files/Analyser/danishclimatepolicyplan_uk.pdf (accessed on 10 May 2019).
  3. The Danish Energy Agency. Denmark’s Energy and Climate Outlook 2018–Baseline Scenario Projection Towards 2030 With Existing Measures (Frozen Policy); The Danish Energy Agency: København, Denmark, 2018; ISBN 978-87-93180-34-5.
  4. Bygningsreglementet. Available online: https://historisk.bygningsreglementet.dk (accessed on 10 May 2019).
  5. Larsen, T.S.; Jensen, R.L.; Daniels, O. The Comfort Houses—Measurements and Analysis of the Indoor Environment and Energy Consumption in 8 Passive Houses 2008–2011; Department of Civil Engineering, Aalborg University: Aalborg, Denmark, 2012. [Google Scholar]
  6. Lomas, K.J.; Porritt, S.M. Overheating in Buildings: Lessons from Research. Building Res. Inf. 2017, 45, 1–18. [Google Scholar] [CrossRef]
  7. Danish District Heating Association. Cooling Plan Denmark 2016; Danish District Heating Association: Copenhagen, Denmark, 2016; Available online: https://dbdh.dk/wp-content/uploads/2015-04-K%C3%B8leplan-Danmark-2016.pdf (accessed on 9 April 2019).
  8. IPCC. Climate Change 2014: Impacts, Adaption, and Vulnerability. Part A: Global and Sectoral Aspects, Fifth Assessment Report (AR5); IPCC: New York, NY, USA, 2014; Available online: https://www.ipcc.ch/report/ar5/wg2/ (accessed on 6 March 2019).
  9. Lund, J.W.; Boyd, T.L. Direct utilization of geothermal energy 2015 worldwide review. Geothermics 2016, 60, 66–93. [Google Scholar] [CrossRef]
  10. Li, Z.; Zhu, W.; Bai, T.; Zheng, M. Experimental study of a ground sink direct cooling system in cold areas. Energy Build. 2009, 41, 1233–1237. [Google Scholar] [CrossRef]
  11. Sarbu, I.; Sebarchievici, C. General review of ground-source heat pump systems for heating and cooling of buildings. Energy Buildings 2014, 70, 441–454. [Google Scholar] [CrossRef]
  12. Javed, S.; Fahlén, P.; Claesson, J. Optimization of Ground-Storage Heat Pump Systems for Space Conditioning of Buildings; Department of Energy and Environment, Chalmers University of Technology: Gothenburg, Sweden, 2014. [Google Scholar]
  13. Lee, S.R. Energy Piles—Piles as Heat Exchangers; KAIST: Daejeon, Korea, 2009. [Google Scholar]
  14. Laloui, L.; Nuth, M.; Vulliet, L. Experimental and numerical investigations of the behaviour of a heat exchanger pile. Int. J. Numer. Anal. Methods Geomech. 2006, 30, 763–781. [Google Scholar] [CrossRef]
  15. Schröder, B.; Hanschke, T. Energy piles: Environment-friendly heating and cooling with geothermally activated prefabricated piles of reinforced concrete, construction technology. Bautechnik 2003, 80, 925–927. [Google Scholar]
  16. Geelen, C.; Krosse, L.; Sterrenburg, P.; Bakker, E.J.; Sijpheer, N. Energy Pile Handbook; TNO Milieu, Energie en Procesinnovatie: Apeldoorn, The Netherlands, 2003; p. 93. [Google Scholar]
  17. Brandl, H. Energy foundations and other thermo-active ground structures. Geotechnique 2006, 56, 81–122. [Google Scholar] [CrossRef]
  18. Laloui, L.; Donna, A.D. Energy Geostructures: Innovation in Underground Engineering; John Wiley & Sons: Hoboken, NJ, USA, 2013; p. 320. ISBN 978-1-848-21572-6. [Google Scholar]
  19. Pahud, D.; Fromentin, A.; Hubbuch, M. Heat exchanger pile system for heating and cooling at Zürich airport. IEA Heat Pump Centre Newsl. 1999, 17, 15–16. [Google Scholar]
  20. Fanger, P.O. Thermal Comfort; Danish Technical Press: Copenhagen, Denmark, 1970. [Google Scholar]
  21. Alberdi-Pagola, M.; Poulsen, S.E.; Loveridge, F.; Madsen, S.; Jensen, R.L. Comparing heat flow models for interpretation of precast quadratic pile heat exchanger thermal response tests. Energy 2018, 145, 721–733. [Google Scholar] [CrossRef]
  22. Alberdi-Pagola, M.; Poulsen, S.E.; Jensen, R.L.; Madsen, S. Thermal design method for multiple precast energy piles. Geothermics 2019, 78, 201–210. [Google Scholar] [CrossRef]
  23. ISO 7730:2005. Ergonomics of the Thermal Environment—Analytical Determination and Interpretation of Thermal Comfort Using Calculation of the PMV and PPD Indices and Local Thermal Comfort Criteria, 3rd ed.; International Organization for Standardization: London, UK, 2015; p. 52. [Google Scholar]
  24. Hoyt, T.; Schiavon, S.; Piccioli, A.; Cheung, T.; Moon, D.; Steinfeld, K. CBE Thermal Comfort Tool, Center for the Built Environment; University of California Berkeley: Berkeley, CA, USA, 2017; Available online: http://comfort.cbe.berkeley.edu/ (accessed on 24 April 2019).
  25. EnergyPlus. Documentation of EnergyPlus: The Official Building Simulation Program of the United States Department of Energy; United States Department of Energy: Washington, DC, USA, 2019. Available online: https://energyplus.net/ (accessed on 29 April 2019).
  26. DesignBuilder. Available online: https://www.designbuilder.co.uk (accessed on 13 October 2018).
  27. American Society of Heating, Refrigerating and Air-Conditioning Engineers, Inc. ASHRAE Guideline: Measurement of Energy and Demand Savings; American Society of Heating, Refrigerating and Air-Conditioning Engineers, Inc.: Atlanta, GA, USA, 2002. [Google Scholar]
  28. Fowler, C.M.R. The Solid Earth, An Introduction to Global Geophysics; Cambridge University Press: Cambridge, UK, 2005; pp. 230–231, 685. [Google Scholar]
  29. DMI (Danish Meteorological Institute). DMI Report 16–19 Version 2. Climate Data Denmark. Municipal Reference Data 2006–2015. Monthly and Annual Temperatures, Precipitation and Sunshine. The Municipal Weather and Climate; DMI: Copenhagen, Denmark, 2016; p. 210. [Google Scholar]
Figure 1. The annual variation in average, undisturbed mean temperature along typical ground heat exchangers (Denmark). Solar radiation is not considered (see Appendix A).
Energies 12 02697 g001
Figure 2. (a) Location of Rosborg Gymnasium in Vejle, Denmark. (b) Lithological profile from the field site at Rosborg Gymnasium including transient plane heat source measurements of soil thermal conductivity λs and volumetric heat capacity pcs. TRT = Thermal Response Test. The × −scale in (b) is indicated in the legend.
Energies 12 02697 g002
Figure 3. (a) The building footprint and the energy pile foundation. The ground (b) and first floor (c) of the building. Cooled rooms are indicated with blue while the unconditioned rooms are marked with red. Black dots in (a) and (b) show the approximate position of the temperature loggers.
Energies 12 02697 g003
Figure 4. The GSHP system at Rosborg Gymnasium (Vejle, Denmark).
Energies 12 02697 g004
Figure 5. (a) Fluid temperatures to and from the piles/ground and (b) outside and average room temperatures. Raw data are shown as points (except highly noisy outside temperatures) while fitted, polynomial trends are drawn with full lines.
Energies 12 02697 g005
Figure 6. (a) Ventilation rate and relative humidity in unconditioned and conditioned rooms, respectively. Vertical grid lines mark days for clarity. (b) Average, variation in relative humidity (RH) and room temperature (Tr) during the hours of the day (i.e., the sum of all daily responses normalized by the number of days summed).
Energies 12 02697 g006
Figure 7. (a) Measured cooling power and (b) energy efficiency ratios (SEER) during the test (right). Raw data are shown as points while fitted, polynomial trends are drawn with full lines.
Energies 12 02697 g007
Figure 8. (a) Predicted Mean Vote (PMV) including mean (µ) and standard deviations (σ) and (b) Percentage of People Dissatisfied (PPD) for the auditorium and the unconditioned (reference) and conditioned rooms. PMV mean and standard deviations are given in the left figure.
Energies 12 02697 g008
Figure 9. Linear, least square fit and simultaneous prediction intervals for the available cooling power Pc (Equations (1) and (5)).
Energies 12 02697 g009
Figure 10. The EnergyPlus estimated heating and cooling demand for Rosborg Gymnasium. Corresponding energy pile fluid temperatures Tf are plotted for the cooling season in 2018.
Energies 12 02697 g010
Figure 11. The required and available cooling power Pc when utilizing the energy pile foundation at Rosborg Gymnasium for passive cooling.
Energies 12 02697 g011
Table 1. Parameter values used in the computations of PMV and PPD.
M, metabolic rate (W/m2)69.8 (1.2 met)
W, mechanical power (W/m2)0
Icl, clothing insulation m2⋅K/W0.155, 1 clothing unit (Clo)
f, clothing surface factor (1)Computed
ta, air temperature (°C)Computed
tr, mean radiant temperature (°C)ta
va, relative air velocity (m/s)0.2
pa, water vapour partial pressure (Pa)Measured (relative humidity)
hc, convective heat transfer coefficient (W/m2/K)Computed
tcl, clothing surface temperature (°C)Computed
Table 2. Occupancy schedules used in the EnergyPlus simulations.
Occupancy/Time7:30–8:008:00–11:3011:30–12:0012:00–16:00
Classrooms10% (minor)100% (full)50% (medium)100% (full)
Halls/corridor100% (full)35% (some)100% (full)35% (some)
Table 3. Activity templates for the four room classes used in the EnergyPlus simulations. * see Table 2 for further details.
Parameter/Room ClassHallLaboratoryClass RoomGeneral
Total area fraction (%)28.31827.626.1
Occupancy density (people/m2)10.250.650
Latent fraction0.50.50.50.5
Metabolic rateEatingStandingSittingWalking
Schedule *Hall/corridorClassroomsClassroomsHall/corridor
Laptop (W/m2)111No
Office equipmentNoNoNoNo
Miscellaneous (W/m2)15000
LightingYesYesYesYes
Cooling set point (°C)26262626
Heating set point (°C)22222222
Natural ventilationNoNoNoNo
Mechanical ventilation (l/s/m2)0.30.30.30.3

