Article

A Simulation of Non-Simultaneous Ice Crushing Force for Wind Turbine Towers with Large Slopes

1
School of Naval Architecture and Ocean Engineering, Jiangsu University of Science and Technology, Zhenjiang 212003, China
2
State Key Laboratory of Hydraulic Engineering Simulation and Safety, Tianjin University, Tianjin 300072, China
3
State Key Laboratory of Coast and Offshore Engineering, Deepwater Engineering Research Center, Dalian University of Technology, Dalian 116024, China
*
Author to whom correspondence should be addressed.
Energies 2019, 12(13), 2608; https://doi.org/10.3390/en12132608
Submission received: 24 May 2019 / Revised: 26 June 2019 / Accepted: 29 June 2019 / Published: 7 July 2019
(This article belongs to the Special Issue Recent Advances in Offshore Wind Technology)

Abstract

:
When the offshore wind energy industry attempts to develop in cold regions, ice load becomes the main technological challenge for offshore wind turbine foundation design. Dynamic ice loads acting on wind turbine foundations should be calculated in a reasonable way. The scope of this study is to present a numerical model that considers the non-simultaneous ice crushing failure acting on the vertical structure of a wind turbine’s foundation. The local ice crushing force at the contact surface between the ice sheet and structure is calculated. The boundary of the ice sheet is updated at each time step based on the indentation length of the ice sheet according to its structure. Ice loads are validated against two model tests with three different structure models developed by other researchers. The time series of the ice forces derived from the simulation and model tests are compared. The proposed numerical model can capture the main trends of ice–wind turbine foundation interaction. The simulation results agree well with measured data from the model tests in terms of maximum ice force, which is a key factor for wind turbine design. The proposed model will be helpful for assisting the initial design of wind turbine foundations in cold regions.

1. Introduction

Wind energy is becoming increasingly attractive for offshore industries, since it represents a clean energy source and has few environmental effects. Severe environmental conditions are the main challenge to the wide industrial application of offshore wind turbine technology, which includes the dominant effects from waves, currents, wind, and ice. The numerical modeling of wind force has been performed extensively [1,2,3]. Banerjee et al. (2018) studied the dynamics of a monopile–type offshore wind turbine under combined wind and wave action [4]. The interaction between the monopile’s foundation and the underlying soil was highlighted. Based on the offshore wind turbine’s structure, a new way to extract geothermal power using a heat exchanger was developed [5,6]. The installation and operation of the wind turbine with a control system was also studied by some researchers [7,8].
Drifting sea ice poses a great challenge for developing offshore wind energy in cold regions (such as the Baltic Sea and Bohai Bay). Ice loads and aerodynamic load should be understood as some of the most important environmental impacts. However, dynamic effects resulting from ice loads on the structural design of turbines is not well known due to the lack of standards and guidelines. Therefore, challenges related to the effects of drifting sea ice on offshore wind turbines should be investigated in detail.
Figure 1 presents a schematic picture of a wind turbine operating under wind and ice conditions. During the interaction between ice and structures with large slopes, crushing failure usually occurs. Global pressures due to ice were found to be much smaller than local ones when the relative crushing velocity increased from moderate to high in full scale tests [9,10]. Sanderson (1988) indicated that global ice pressures decreased with an increasing area, based on both laboratory tests and full-scale tests [11]. The reason for this result is that the ice failure does not occur simultaneously in discrete local zones because of imperfect contact between ice sheets and structures and the non-homogenous properties of ice. Although crushing failure may occur over the width of structure, it is possible to focus on a limited local area across the width because of this imperfect interaction.
For interactions between sloped-structures and ice sheets, many researchers have performed experimental studies, full scale measurements, and numerical simulations during the past ten years for offshore platforms and ships [12,13,14,15,16]. Zhou et al. (2018) proposed a method to generate an ice mesh where the length of the ice gird is equal to the ice breaking length [17,18]. A simulation of dynamic ice forces exposed to an icebreaking tanker was performed, and the corresponding forces were compared to the model test results. Later, the ice load from ice ridge was also modelled, considering a head on collision between the ship and ice [19].
Several investigations have been carried out to estimate the ice load on cylindrical or large steep structures in model tests, full scale measurements, and numerical simulations. Murray et al. (2009) performed experiments with scales of 1:30 and 1:50 to measure the forces on a spar that was designed to resist ice action [20]. Jefferies et al. (2011) carried out a series of model tests to measure ice loads and the response of the Molipaq platform with nearly vertical sides [21]. Lager scale ice crushing experiments were performed at the Aker Arctic ice tank basin [22]. A full-scale test was also achieved for a slender cylinder in Bohai Bay, aiming at investigating varying ice loads and the corresponding vibrations of structures with three velocity-dependent failure modes from observation [12]. However, there are some shortcomings with these measurements. The model tests and full measurements need more resources and are expensive to perform. The properties of the ice sheets in an ice tank or on field sea ice may differ from the target values significantly.
For numerical simulations, ice loads and structural vibrations are a big concern. Gravesen and Kärnä (2009) calculated the ice crushing load exposed to the vertical foundation of an offshore wind turbine on the basis of the International Organization for Standardization (ISO) code [23]. The dynamic vibration of the blades of wind turbines were investigated together with a simulation of ice loads, considering the whole structure [24]. To reduce ice-induced vibrations, Mróz et al. (2008) used a semi-active model [25], while Karna and Kolari (2004) proposed a mass damper model [26]. Yu et al. (2014) used a rigid and plastic structure with an elastic base to simulate a floating ice cover [27]. The quasi-static forces were derived approximately, considering the interaction between structural motions and ice loads. The effect of response of a wind turbine on the ice loads was not included in the model. Shi et al. (2016) developed a simulation program for ice force coupled with the software HAWC2 to study the dynamic effect of ice sheets on the foundation of offshore wind turbines [28]. However, the present method can only be applied to calculate the ice bending load. When the structure is inclined steeply, a non-simultaneous ice crushing load may occur.
To extend the proposed method by Shi et al. (2016), the scope of this study aims to improve the dynamic ice-structure interaction model and develop an ice load analysis program to be used for cylindrical and nearly vertical structures. The updated program is used to simulate the non-simultaneous crushing force acting on the cylindrical structures of wind turbines. Particular efforts have been made to validate the numerical simulations with model test results derived by some researchers [29,30].

2. Mathematical Model

When level ice interacts with structures, it may fail in different modes. Shkhinek and Uvarova (2001) studied the dynamic interaction between ice sheets and sloped structures [31]. An analytical method was used to compare their results with physical model tests. It was concluded that ice would most likely fail from bending to compression modes when the slope angle and ice velocity increases. This will result an increased ice load. Zhou et al. (2017) proposed a numerical method to study crushing force for ice bending research [32]. Their method was used to simulate ice loads acting on the hull side of an icebreaking tanker as the hull model was pulled transversely. The maximum slope angle was around 82 degrees. However, for vertical structures, this method is not appropriate. Therefore, a further modification is needed.

2.1. Framework of Numerical Model

The numerical process is carried out in a time domain, step by step. The overall framework of the numerical model is presented in Figure 2. At first, both the ice and the structure are discretized at the waterline to generate ice and structure nodes in the horizontal plane. The overlapped areas between the ice and structure are identified based on a geometric algorithm. For each contact area, the local ice force is calculated and integrated to derive the global ice force. The global ice force acts as an external load for an equation of motion for flexible structure. The motion of structures, including displacement, velocity, and acceleration, is obtained and used to update the structure nodes. In the present study, the structure considered in the simulation is fixed, and thus the dynamics of the structure are neglected. The ice failure criteria are then applied to judge if the local ice-structure interaction will exceed limitations and become fragmented. Under the condition of ice failure, newly generated ice pieces are well cleared after failure of the intact ice sheet to generate a new ice boundary. Otherwise, the ice boundary will be kept for next time step.

2.2. Discretization

The 2D geometric models of ice sheets and structures are made in the horizontal plane. The structure at the waterline is discretized with polygonal nodes while the ice edge is composed of scattered nodes on a polyline. A geometric tool is used to detect the overlapped area between the structure polygon and ice polyline. Then, the horizontal contact area can be calculated, as shown in Figure 3.

2.3. Local Ice Force and Contact Area

There are three typical cases for a structure’s interaction with level ice. The first case is the initial ice contact with a highly-inclined structure (Case I). Here, only part of front edge of the ice sheet crushes against the structure. The contact area looks like a triangle, which tends to increase as the intrusion process advances. When the structure penetrates through the ice thickness, it comes to the second case. Here, the contact area is approximately trapezoidal (Case II). Figure 4 shows that normal force Fn occurs at the contact surface, and frictional force Ft is parallel with the contact surface. The last case is presented by the vertical structure interaction with the ice (Case III). Under this condition, the structure is only exposed to normal ice force, and no frictional force exists.
If the limiting mechanism is neglected, the local ice continuously fails, under most conditions, in the brittle crushing mode against large sloped structures. According to ISO 19906 [33], the ice’s crushing force can be identified according to:
F c r = p G A c
p G = C R 0 σ c σ 0 ( h i h 1 ) n ( w h i ) m
where pG denotes the overall mean pressure; w denotes the structural width at the contact surface in meters; hi means the ice thickness in meters; h1 is equal to 1 m; m is set to be −0.16; n is set to be −0.50+hi/5 when hi < 1.0 m, and −0.30 when hi >= 1.0 m; CR0 denotes the strength factor for the referenced sea, which can be taken as 2.8 MPa in Arctic seas and 1.8 MPa in Baltic areas. σ0 means the strength index for the reference area.
The normal force and frictional force are written as:
F n = F c r
F t = { μ F n c a s e I & I I 0 c a s e I I I
where μ is the friction coefficient between the ice and the structure.
The horizontal ice force Fx and vertical ice force Fz, which is a function of the normal force, frictional force, and slope angle, are given as:
F x = F n sin φ + F t cos φ
F z = F n cos φ F t sin φ .
The ice contact areas for the different cases are calculated according to Equation (7). Figure 5 gives a detailed sketch of the ice–structure contact cases, where the indentation length Ld is defined:
A c = { w L d 2 cos φ c a s e I w h i 2 sin φ ( 2 h i L d tan φ ) c a s e I I w h i c a s e I I I .

2.4. Ice Boundary Update

The projected crushing width w (Figure 6) should be calculated for each time step. When the width increases over the upper boundary wc, then the ice sheet becomes fragmented in local crushing. The ice boundary needs to be updated for the next time step.
The idealized radius of the ice wedge to be broken from the intact ice is given as [34]:
R l c = C l l ( 1 + C v v n r e l )
where v n r e l denotes relative normal speed between the contact surface and structural nodes; Cl and Cv are empirical coefficients, which could be derived from full-scale or model-scale tests; l denotes the ice’s characteristic length, which is expressed as [35]:
l = ( E h i 3 12 ( 1 ν 2 ) ρ w g ) 0.25
where E is the elastic modulus; ν is the Poisson’s ratio; ρ w is water density; g is gravity acceleration.
The non-dimensional coefficient Cl in Equation (8) has been studied by researchers. Based on a theoretical analysis, the non-dimensional coefficient was predicted to range from 0.6 to 0.8 [36,37,38]. Lau et al. (1999) observed the breaking length for sloping structures in the ice tank [39]. He found that the value varied from 0.1 to 0.7, depending on the ice thickness. The limitation of the breaking length was 0.1. The breaking length against the vertical structures is normally smaller than that for a sloped structure. Therefore, the coefficient Cl is taken as 0.1 in the subsequent simulation. The speed-dependent coefficient Cl is set to zero since the speed is relatively low for all simulated cases in this paper.

3. Validation with Model Tests

3.1. Validation with Model Test I

Barker et al. (2005) carried out a test campaign to measure the ice loads on offshore wind turbines in the Danish sea at the Canadian Hydraulics Centre of NRC (National Research Council) [
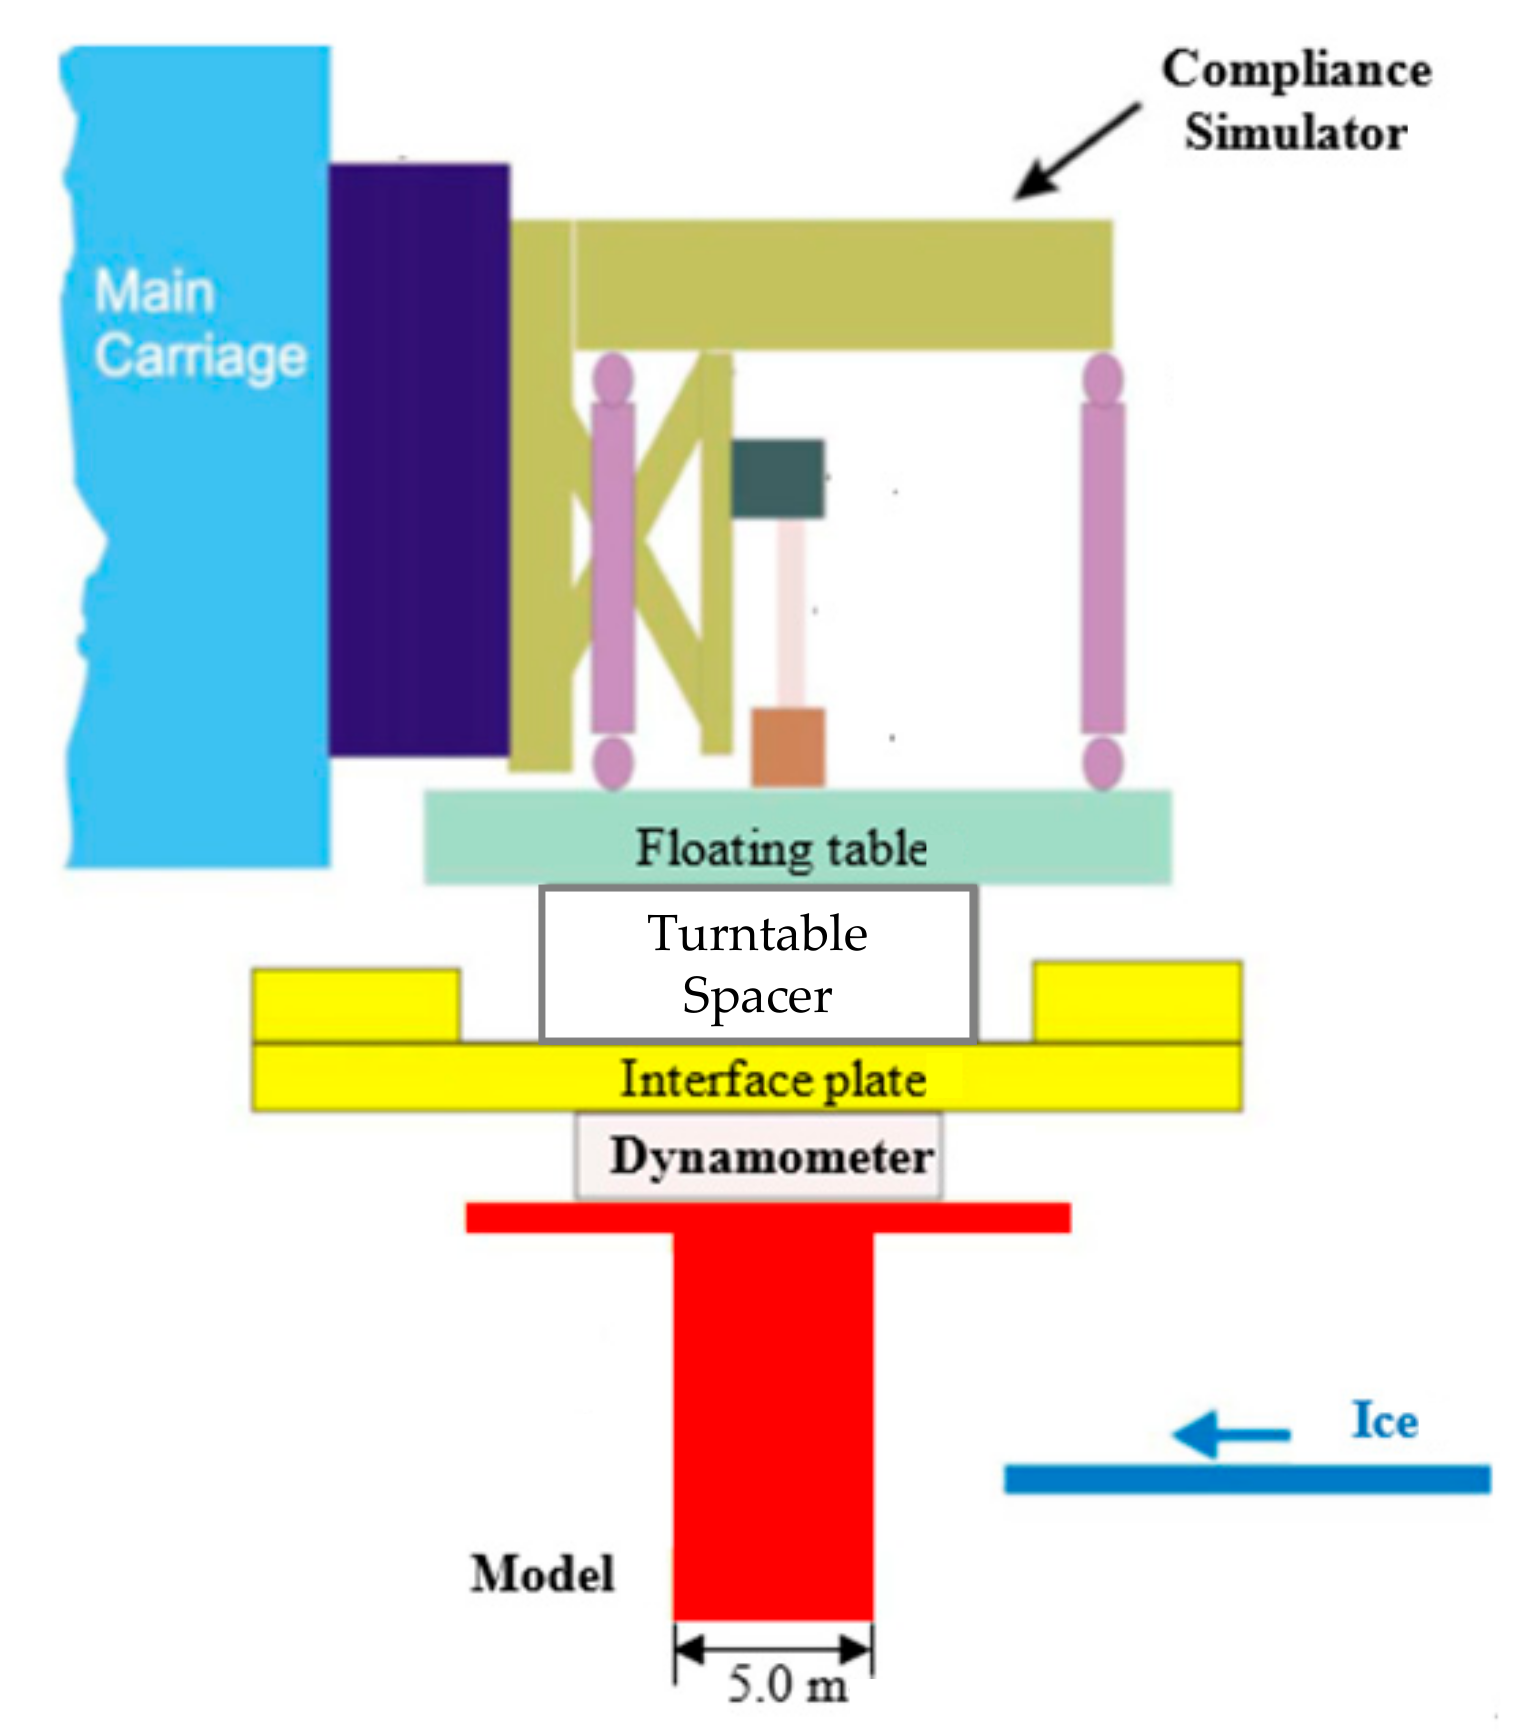
29]. The size of the tank is 21 m in length, 7 m in width, and 1.2 m in depth. Ice sheets are grown, tempered, or melted by adjusting the room’s air temperature. A main carriage could travel along the tank at a velocity of 3–650 mm/s. A small carriage pushes ice sheets towards the structures to be tested. A compliance simulator system was inflexibly fixed to a main carriage. A turntable spacer and interface plate were hung freely under a floating table. They were utilized to support the tested structure and also supply extra weight. All these components were applied to reproduce the main characteristics of wind turbine. The configuration setup is shown in Figure 7. The sampling frequency is 100 Hz in the model tests.
Model tests with seven configurations were carried out. Only one configuration was selected for the present study. The cylinder model was rigidly fixed onto the main carriage. A geometric scale factor of 1:26 was set for model tests with the Froude and Cauchy scaling method. The diameter of the cylinder is 0.192 m in a model scale. One ice sheet was made for the tests. Table 1 gives the ice properties and the test matrix. The dynamic friction coefficient between the ice and structure models was measured with a mean value of 0.07, which is used in the present simulation. The Poisson’s ratio in Equation (9) is taken as 0.3 [35]. The elastic modulus is indirectly calculated from flexural strength in the simulation [40].
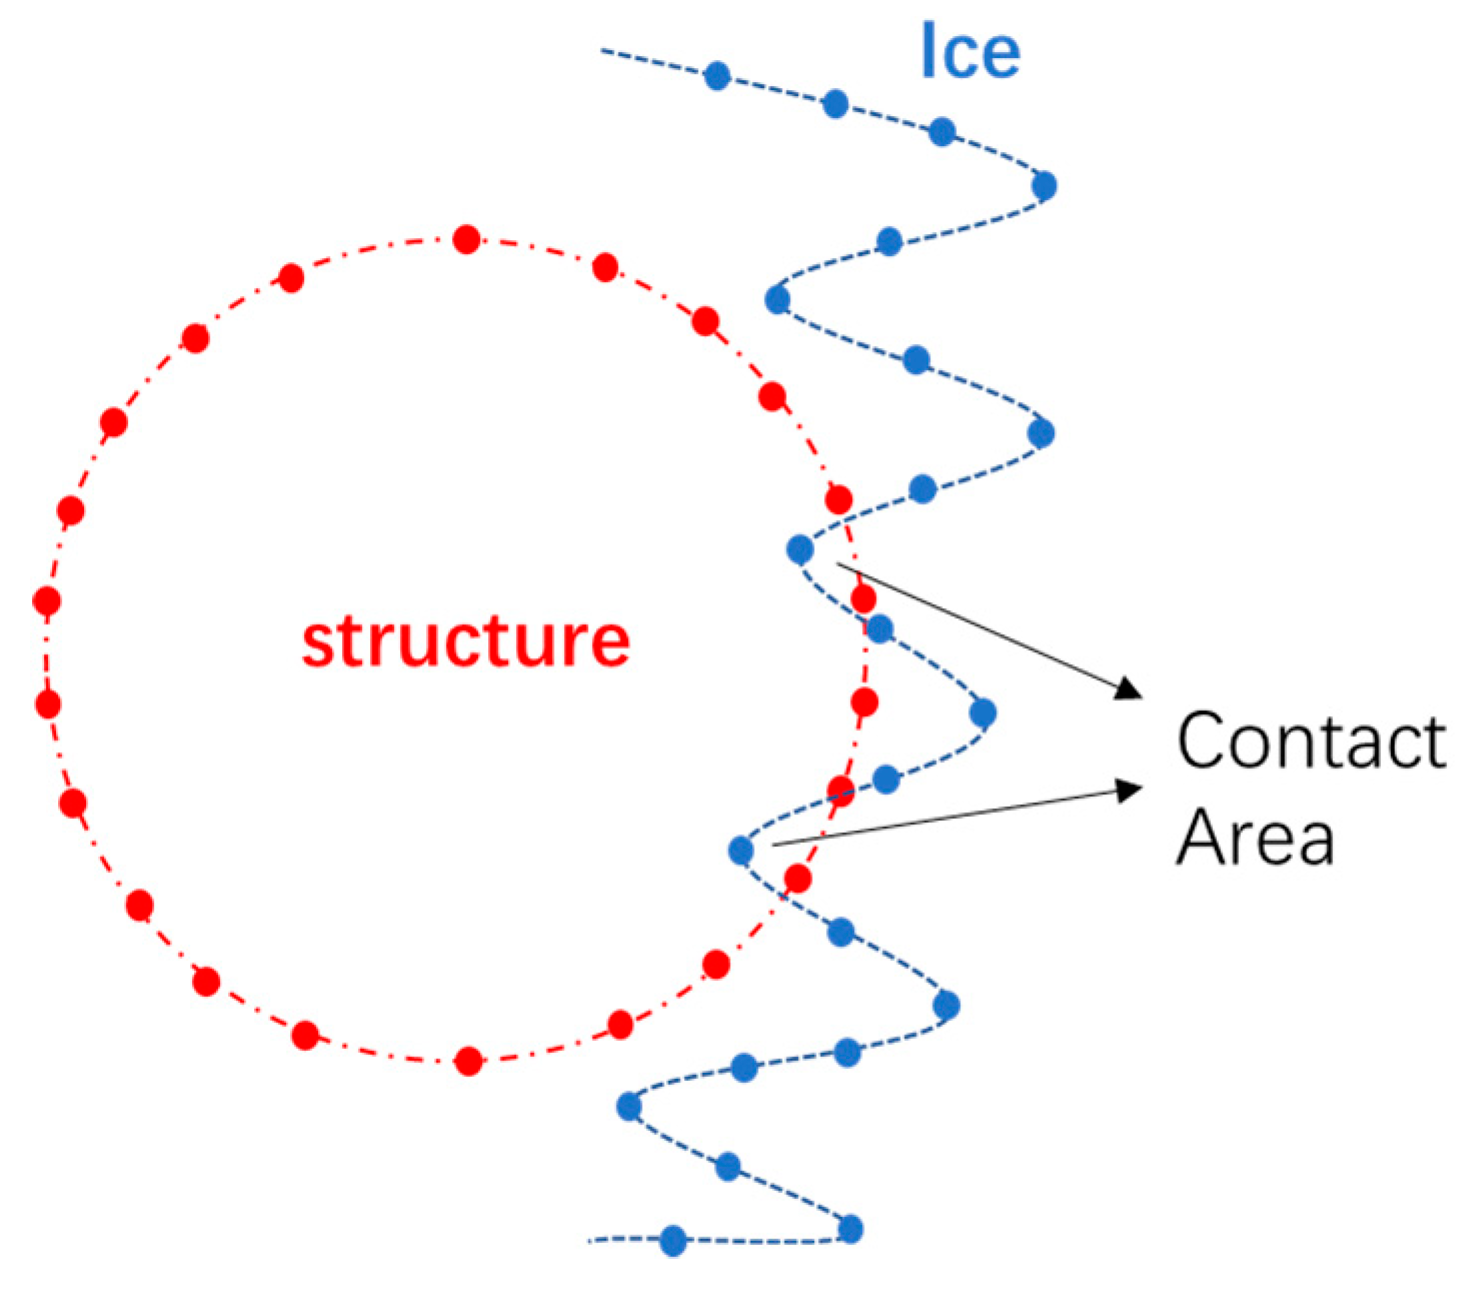
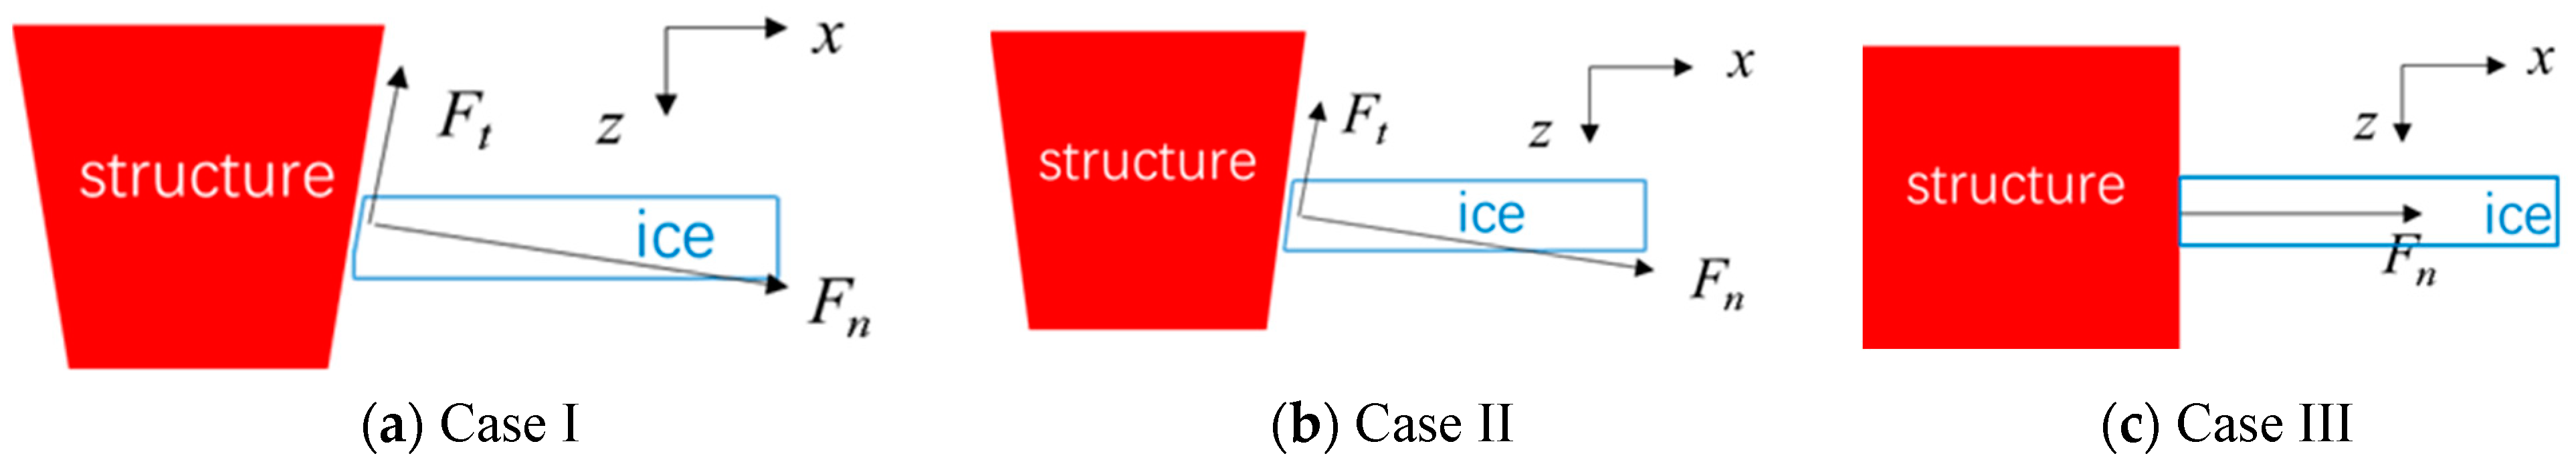
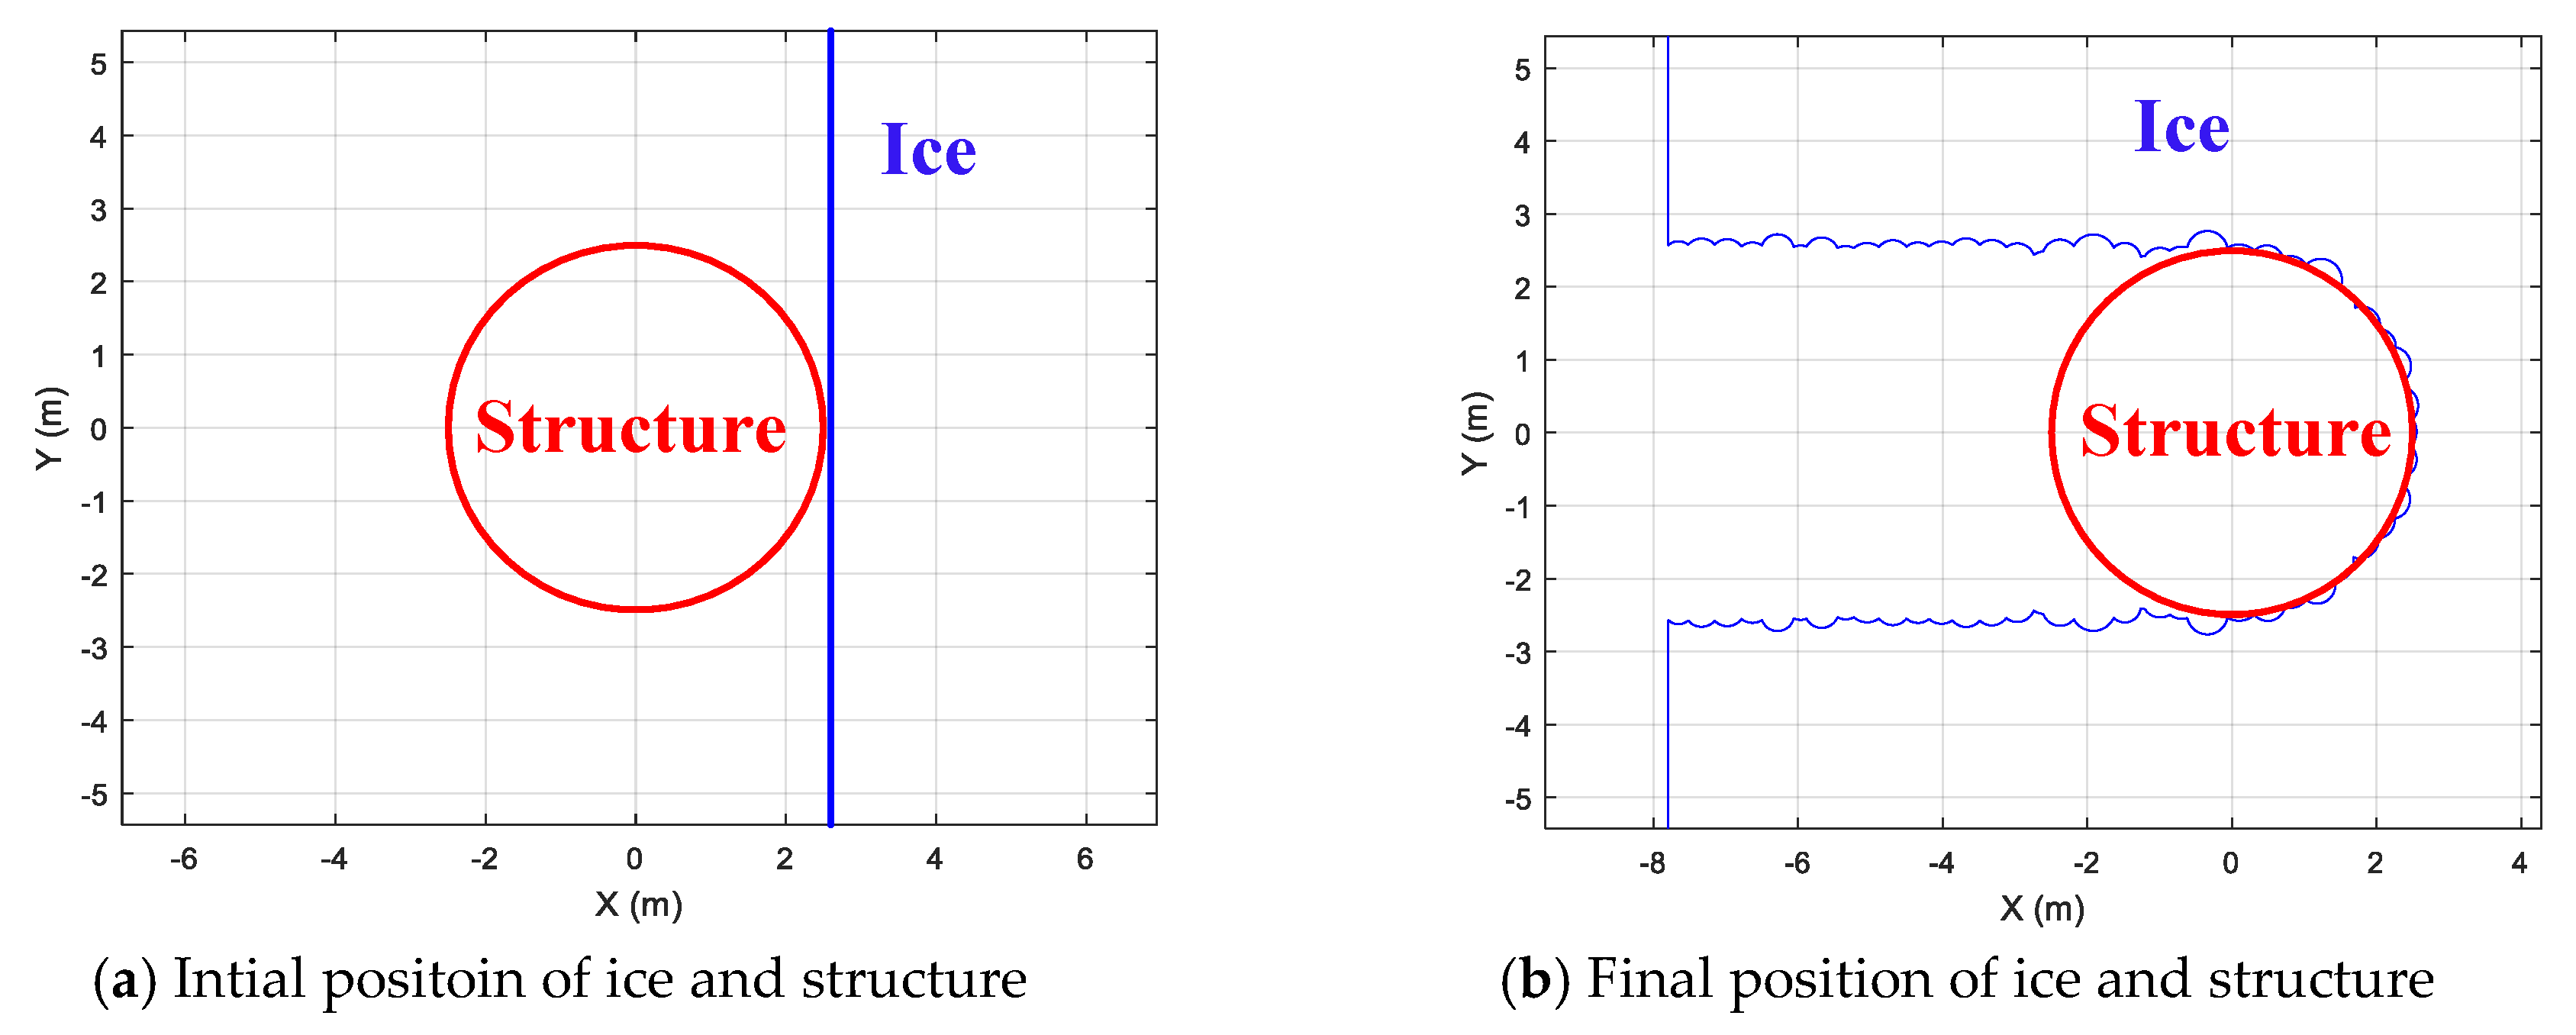
During the model tests, it was observed that continuous crushing with short durations occurred throughout the test series. The ice crushed against the cylinder at the contact surface and ice sheet was pulverized into very fine pieces. However, local flexural or buckling failures could be observed, and pure crushing events seldom occurred. Therefore, the ice-structure interaction process could be taken as non-simultaneous crushing. In the simulation, the structure is fixed and the level ice moves against the structure with a specific speed. The center of gravity for the structure is located at the origin, as shown in Figure 8. The initial ice boundary is a straight line that is very close to the structure. The right figure presents the ice boundary at the end of the simulation for test 105. It can be seen that the ice does not fail to crush perfectly.
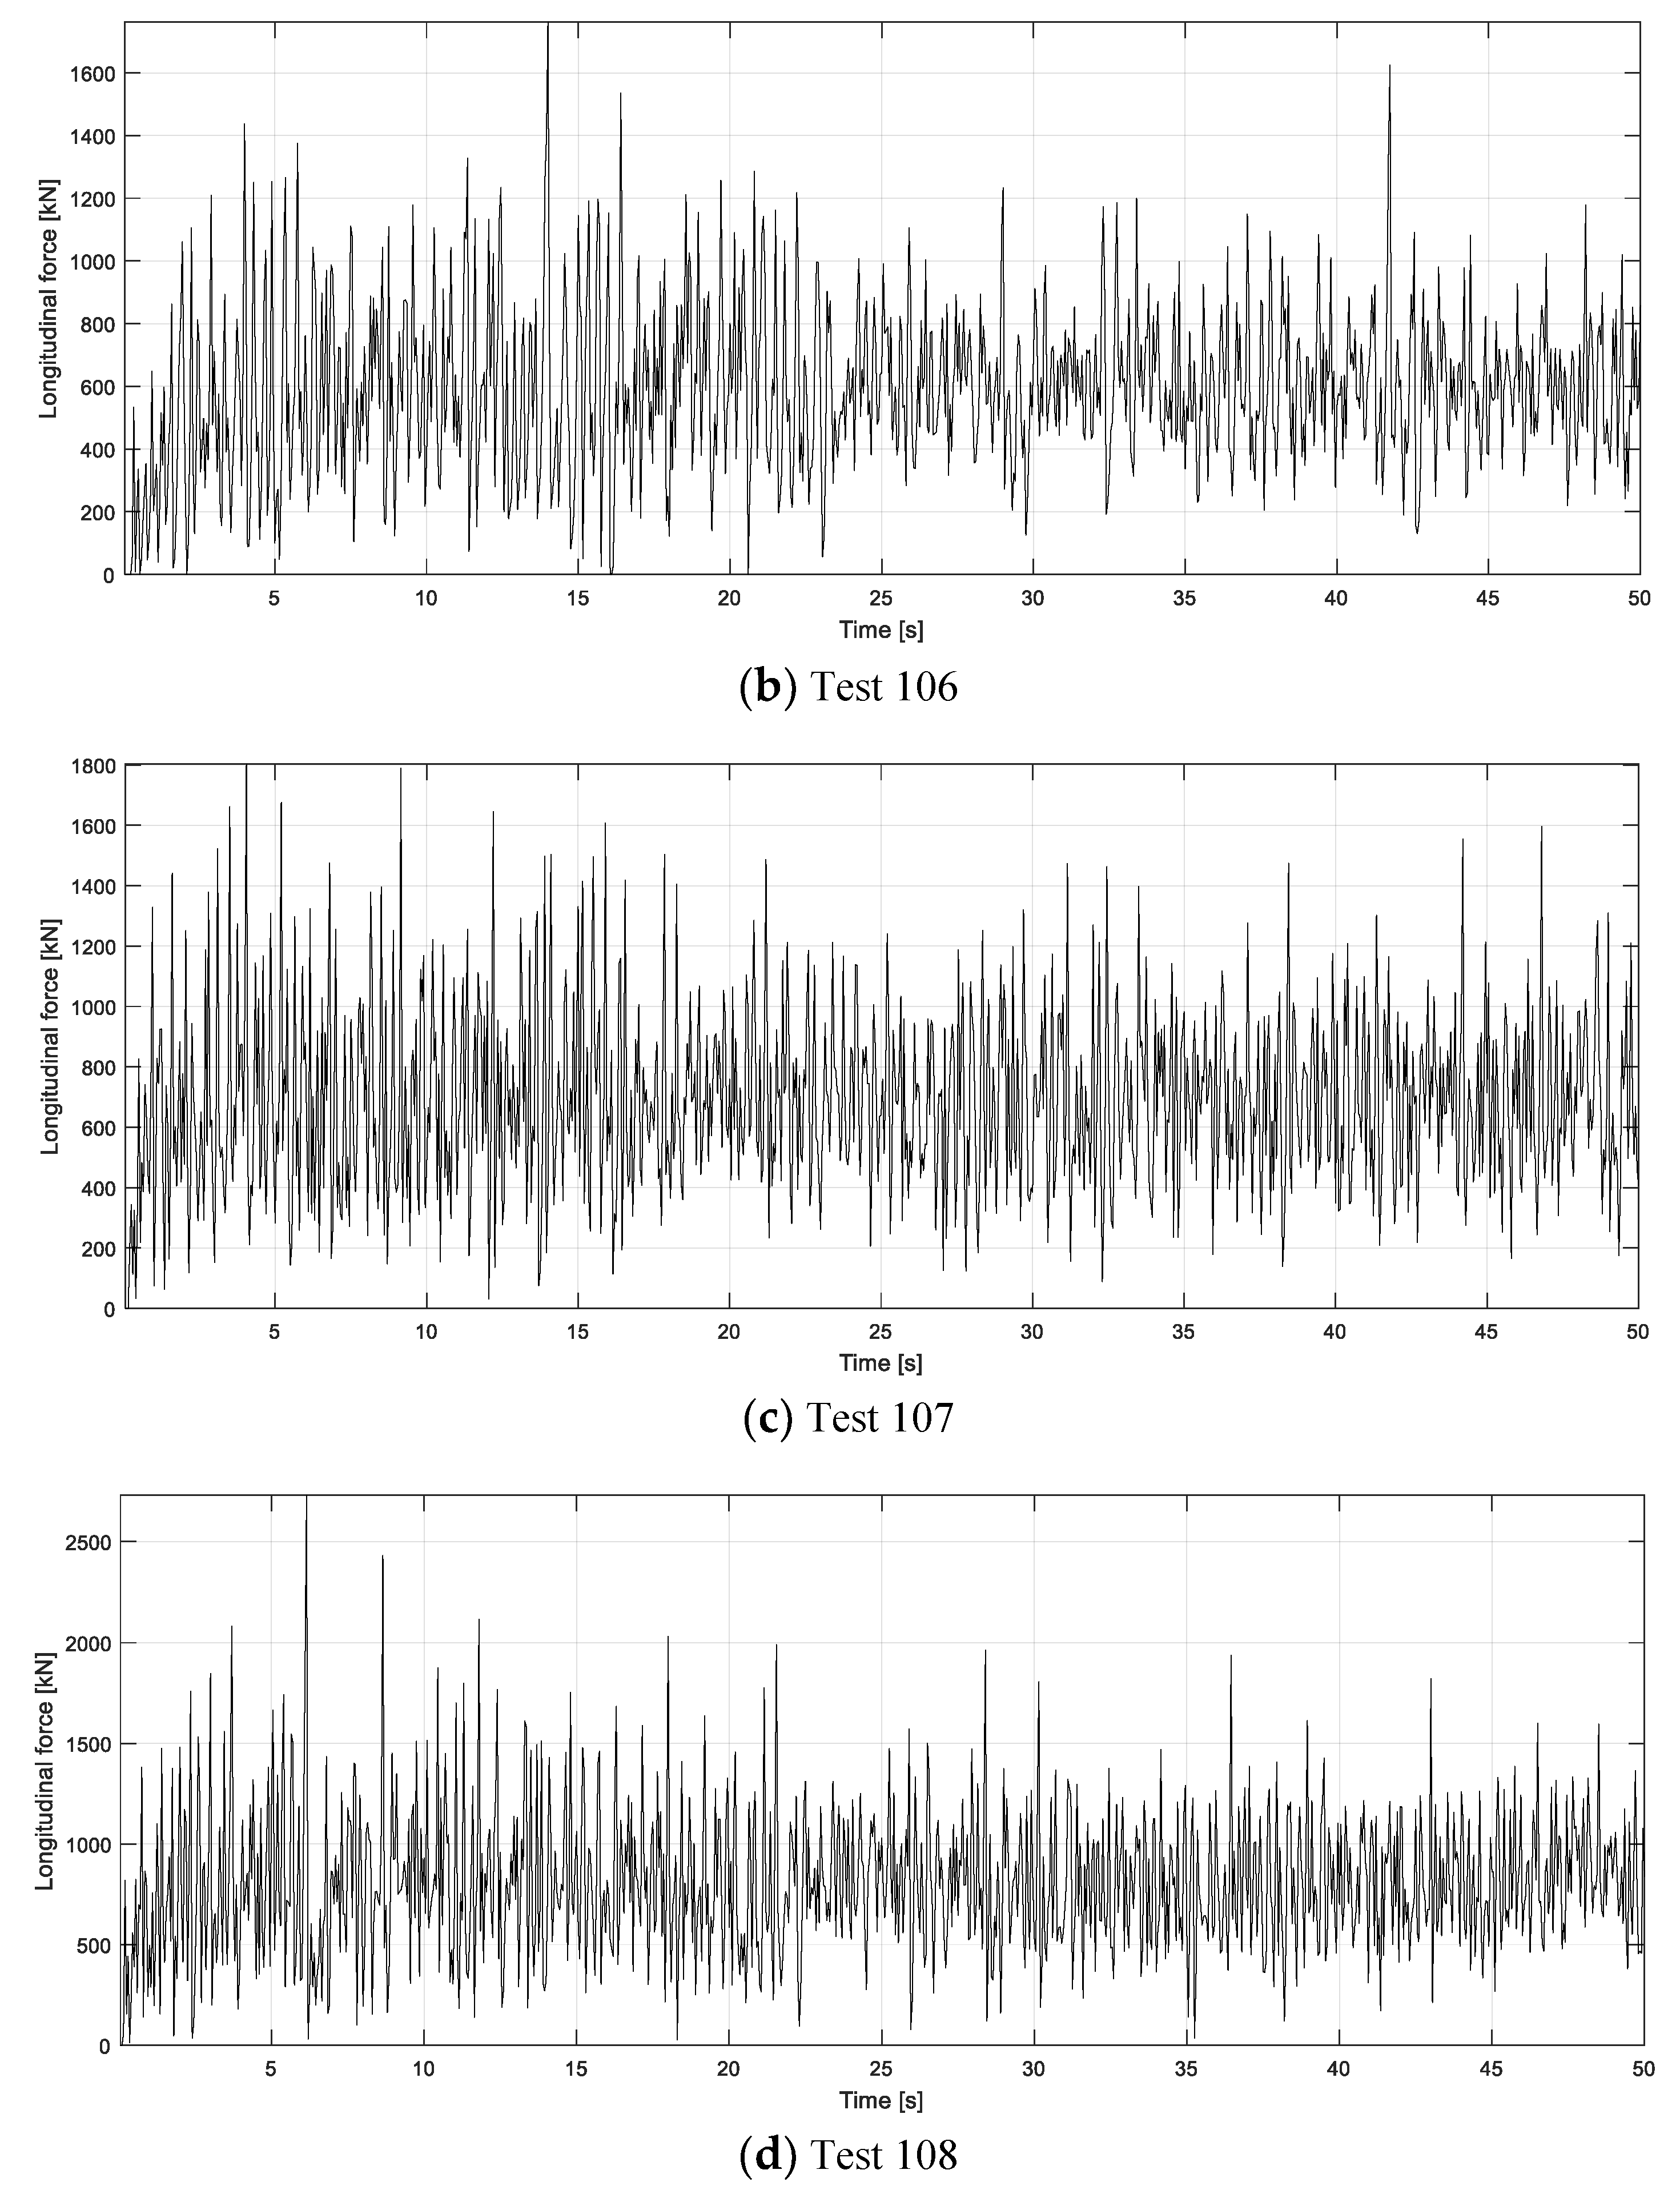
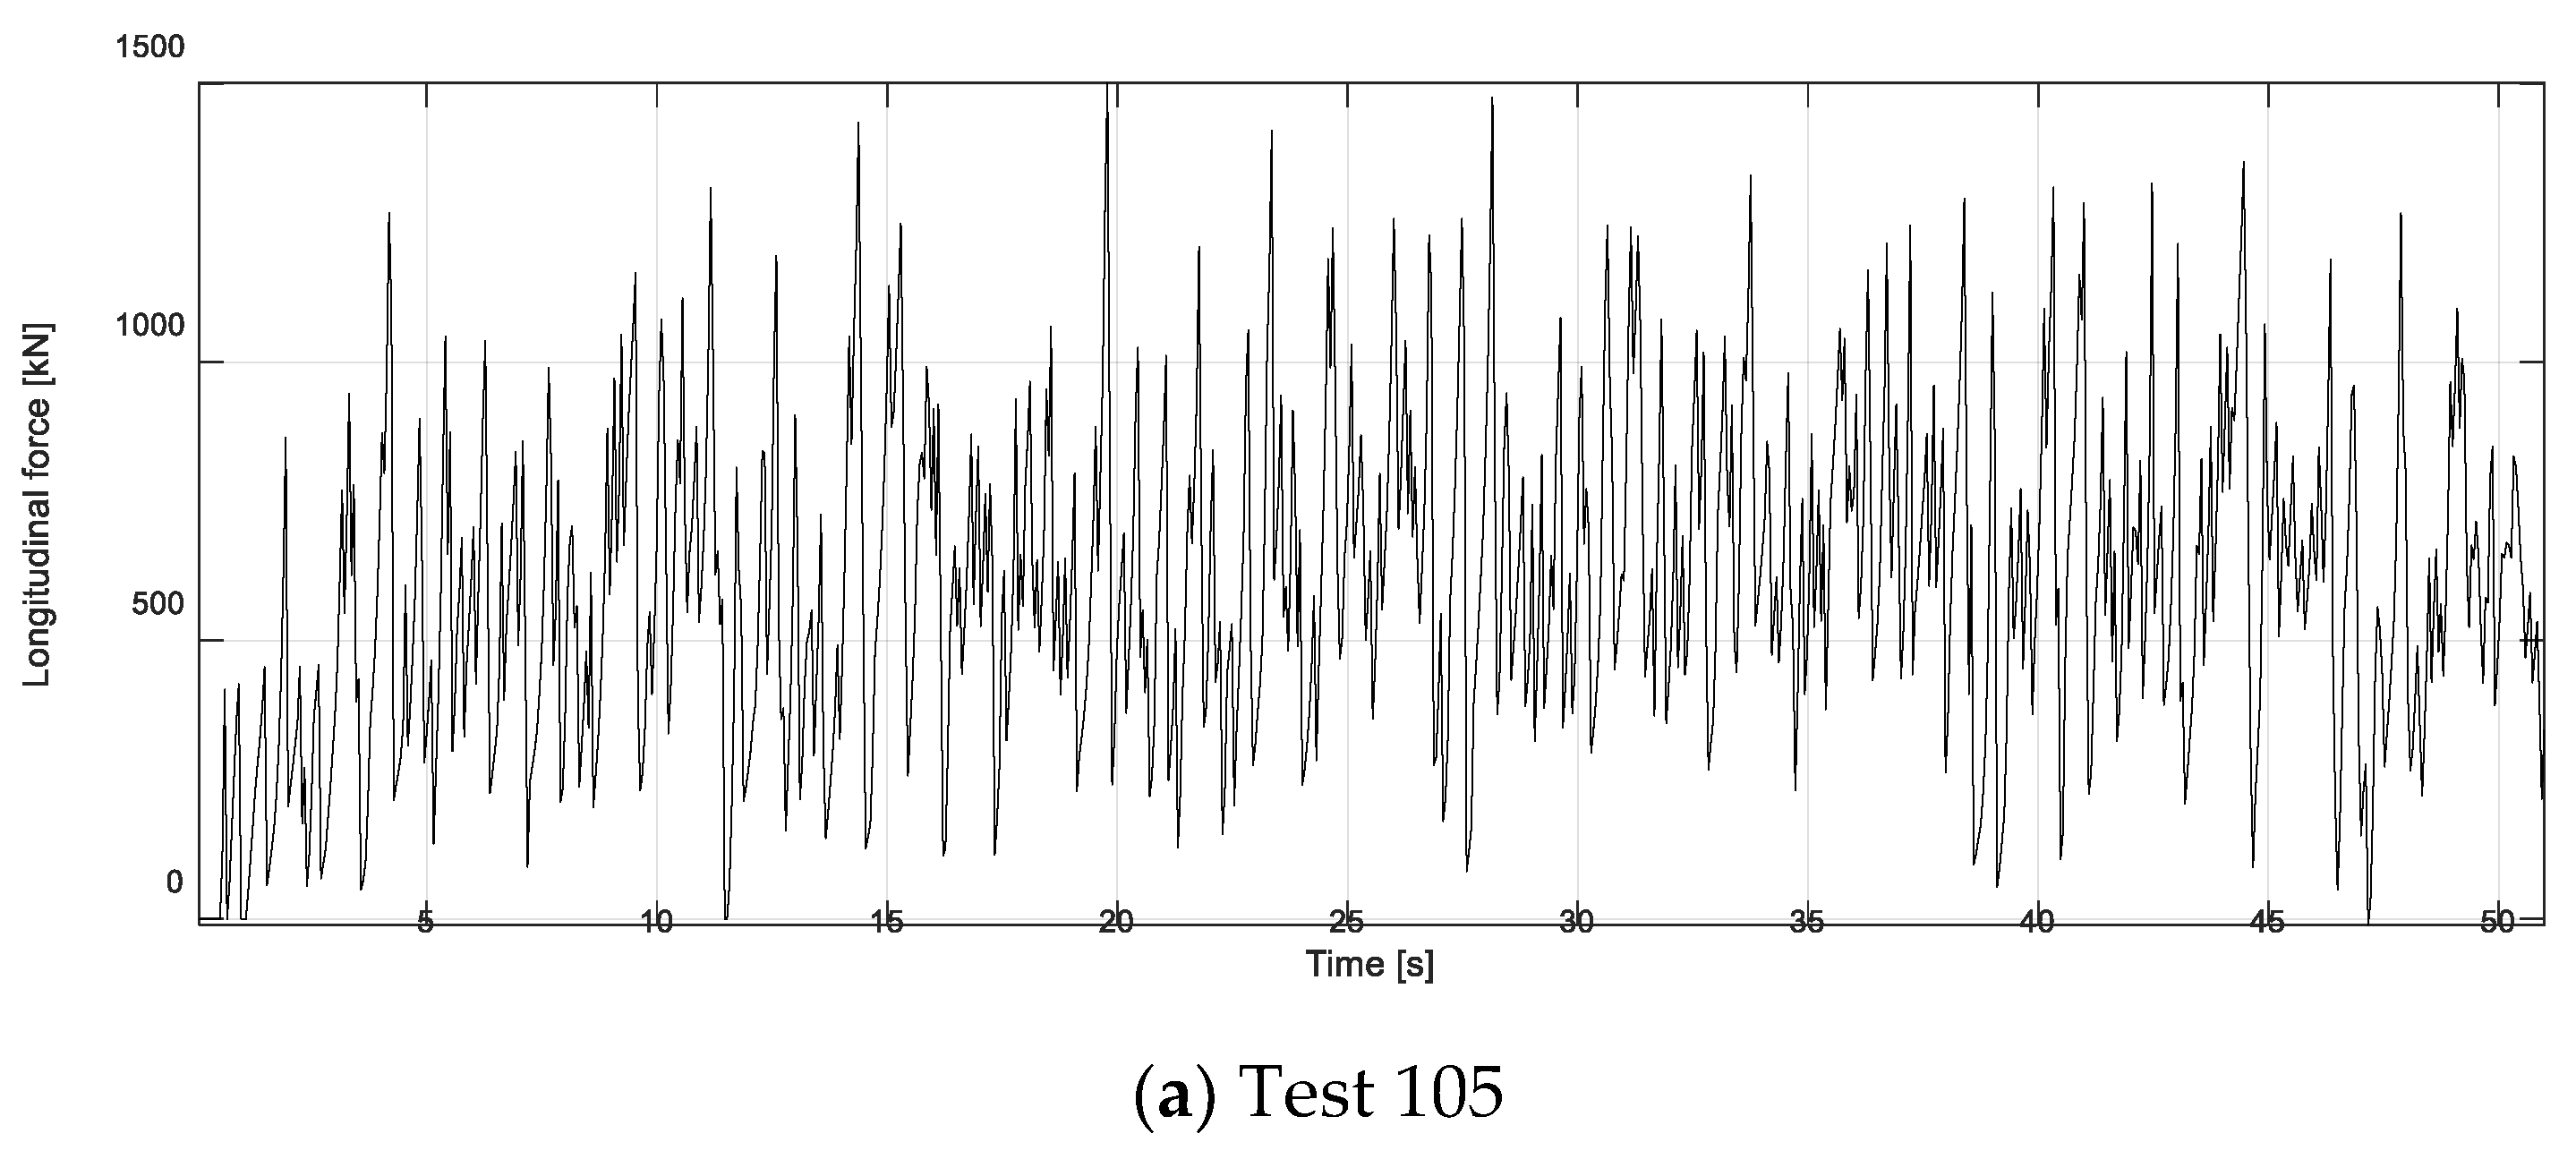
The ice force in a longitudinal direction is dominant to forces in other directions. Therefore, the longitudinal force is analyzed in this paper. The time series of the crushing force from the simulation of test 105 is given in Figure 9a. It is found that ice force changes rapidly and fluctuates around the mean value. By setting up different ice drifting speeds, the other tests (106–108) are performed. The corresponding time series of the ice forces are presented in Figure 9. The maximum ice forces derived from numerical simulation are tabulated in 
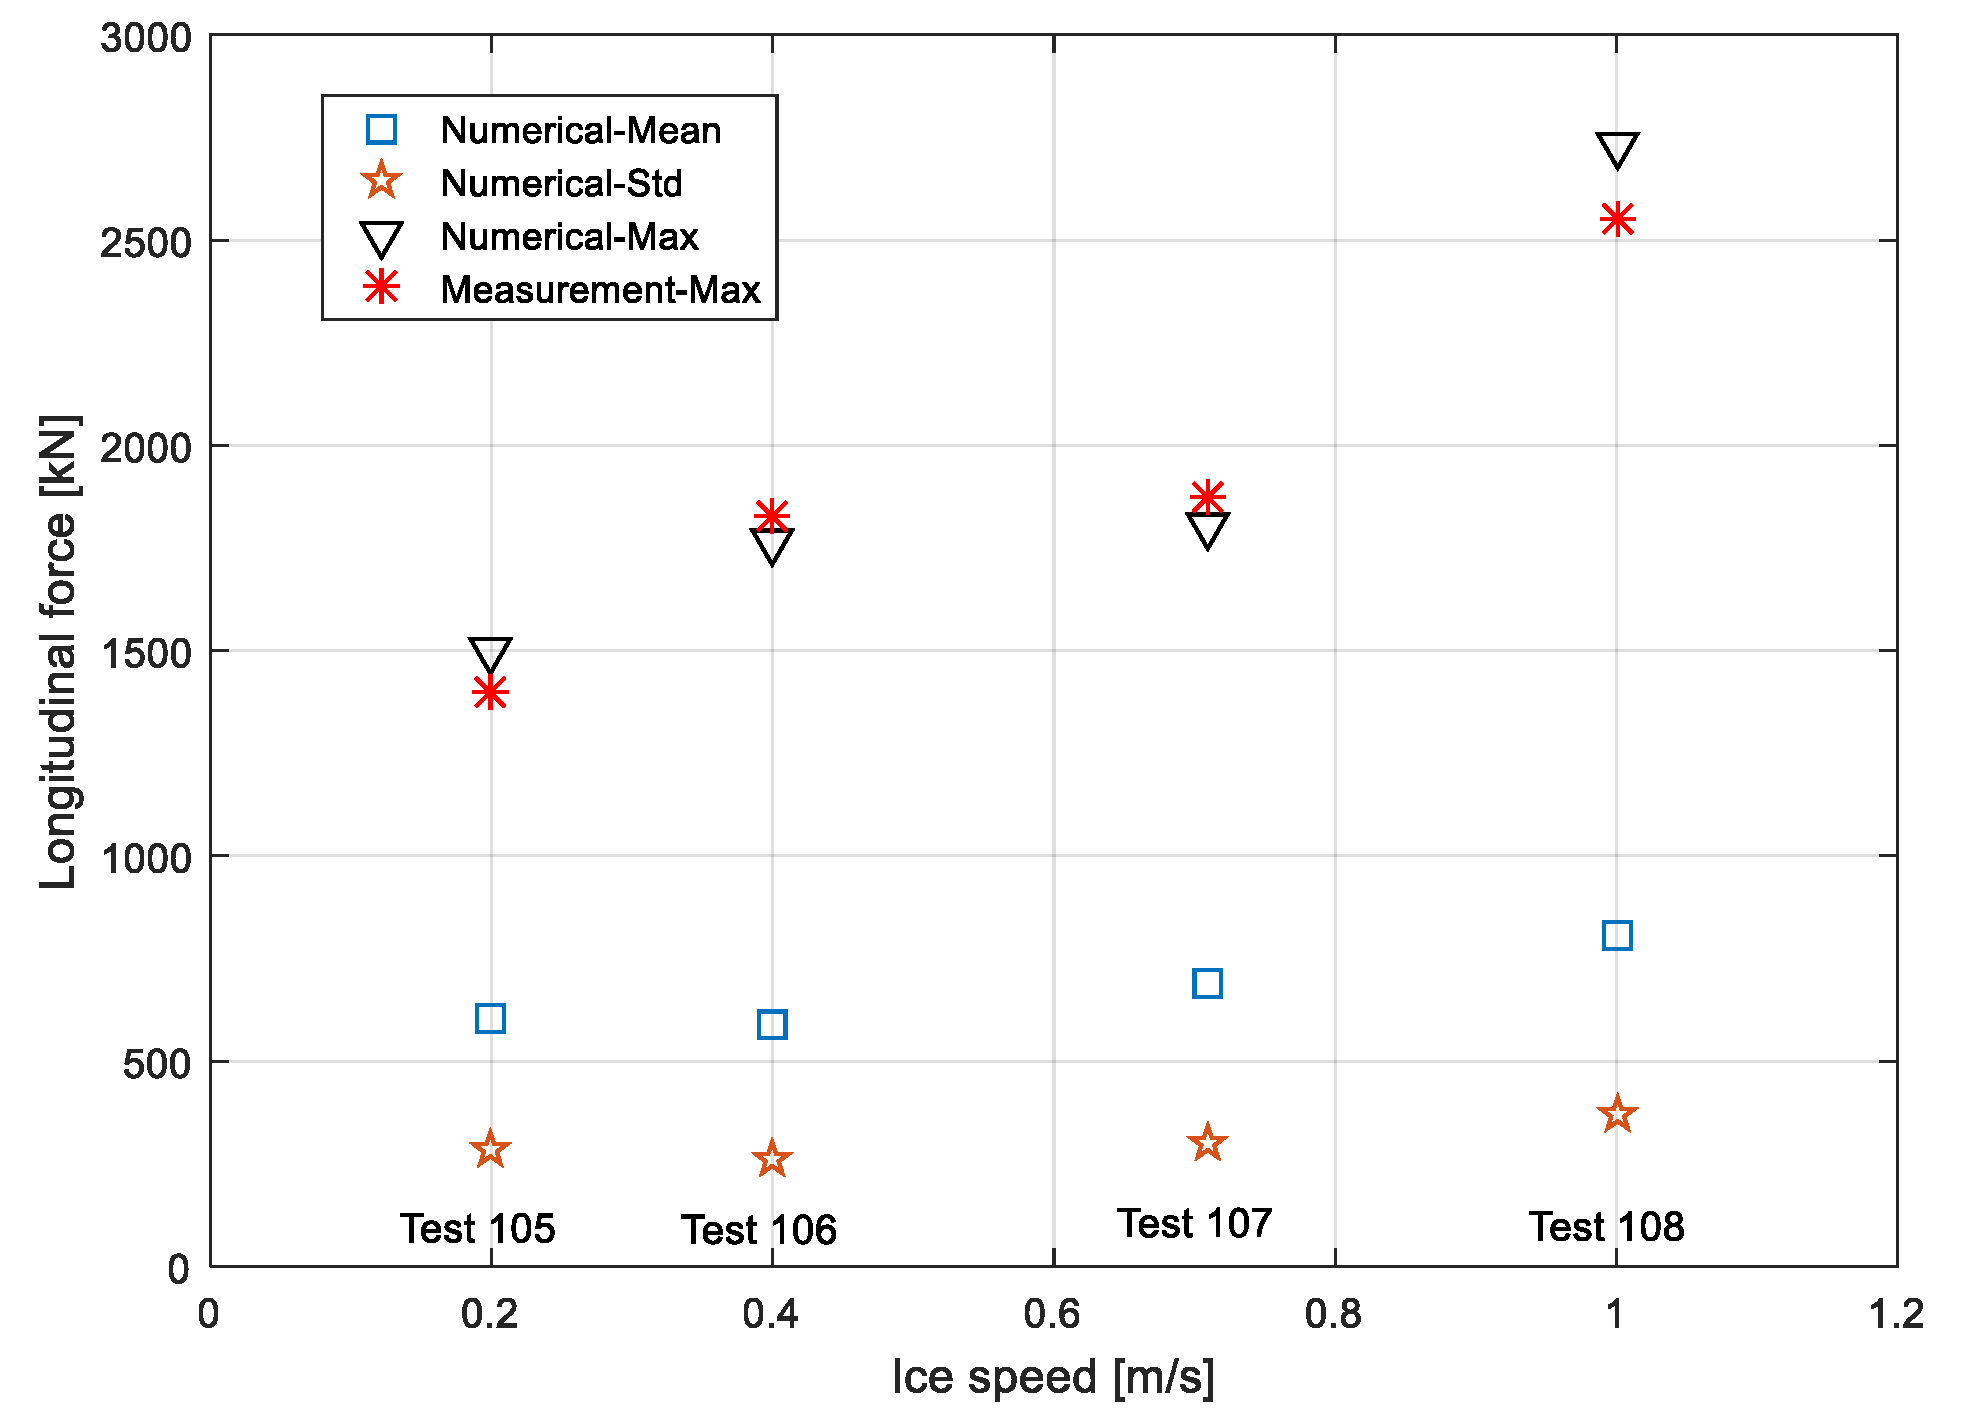
Table 2, where the measured data are also included as a comparison. The results show that the difference between the simulated and measured data ranges from 3.6% to 7.4%. The simulation results fit well with model’s test data. Both maximum data, average, and standard deviation of simulated force are also presented in Figure 10 versus the ice drifting speed. The average and standard deviation of the force tend to increase when the ice drifting speed rises, but not linearly.
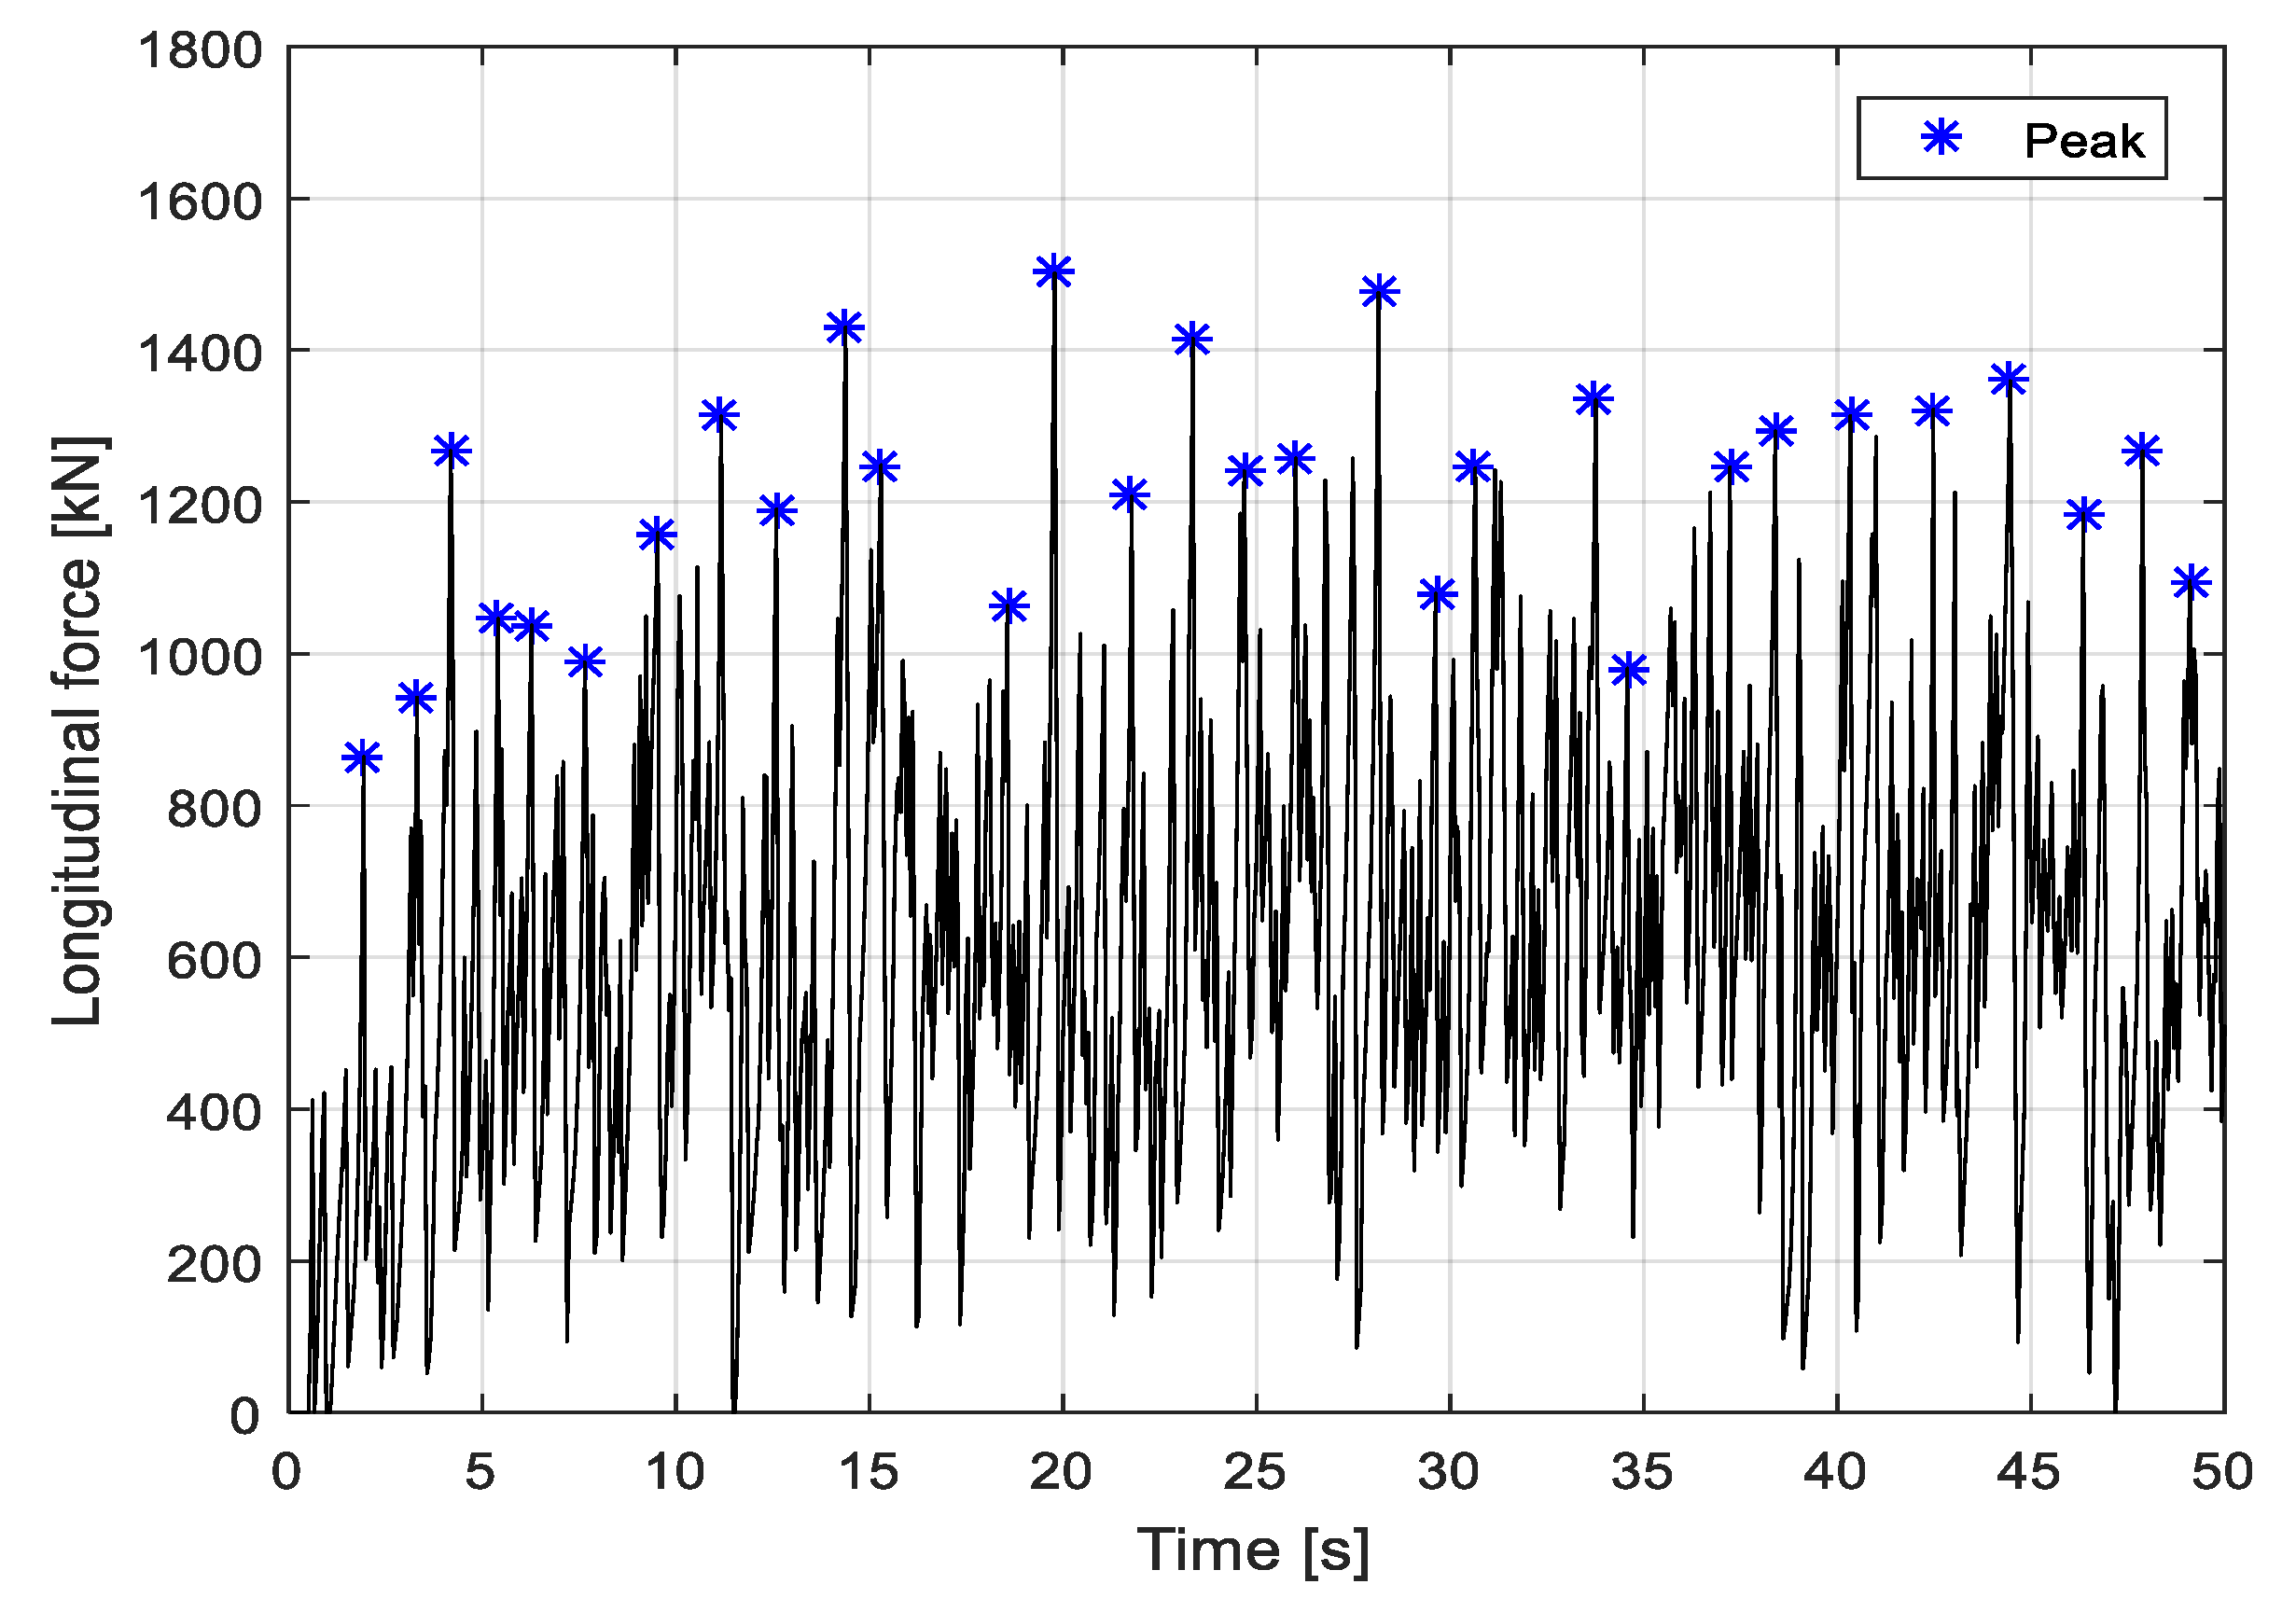
As presented in Figure 9, the time history of the simulated force for tests 105–108 show a strong non-linearity. This force is subjected to a rapid change and vibrates with many peaks corresponding to individual continuous icebreaking events as the ship advances. These peaks can be calculated and extracted from the time series of the ice force. The peaks for test 105 are presented in Figure 11.
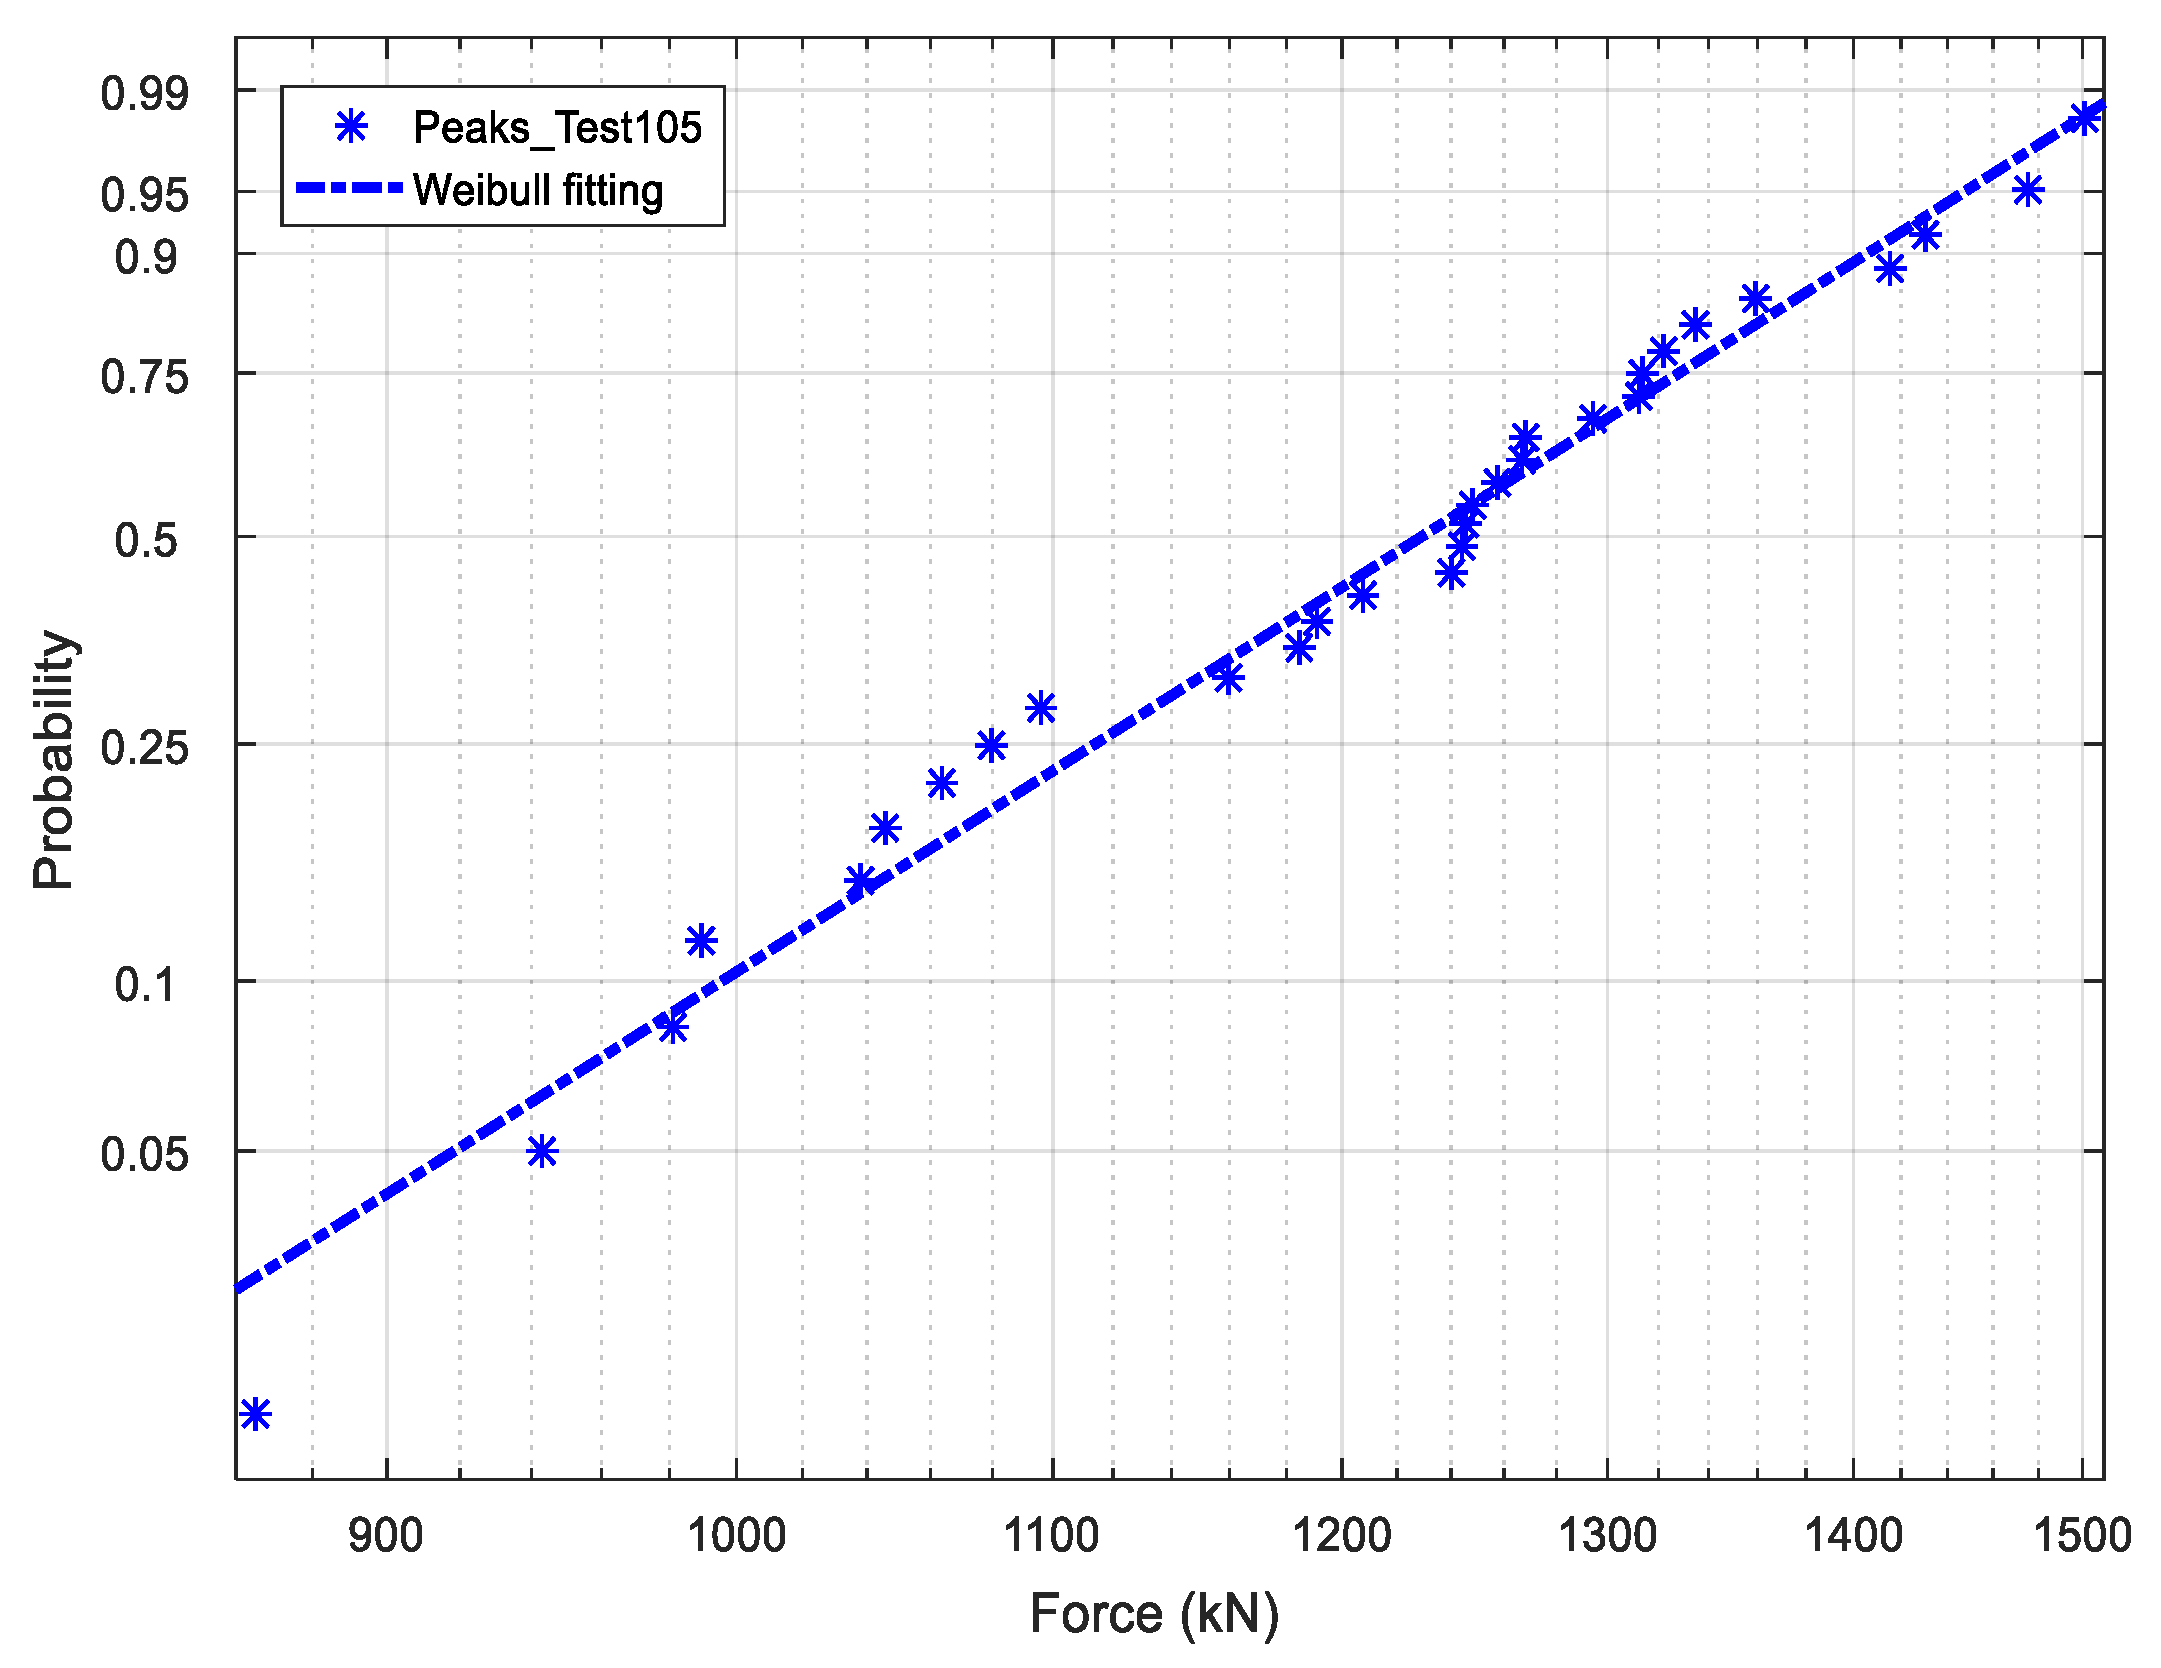
Then, the peaks derived in the time history of test 105 were collected. These peaks were then fitted based on the Weibull probabilistic model. The mathematical cumulative distribution function is shown as
F ( x ) = 1 exp ( ( x / λ ) k )
where k denotes the shape factor and λ denotes the scale factor.
The fitting results for the simulated peaks are shown in Figure 12. It is clear that the Weibull distribution is reasonable for both numerical simulation and model test data. Based on the simulation, the shape factor calculated is 6.97, and the scale factor is 1282 for test 105. The two factors for the other tests are also calculated. The results are shown in Table 3.

3.2. Validation with Model Test II

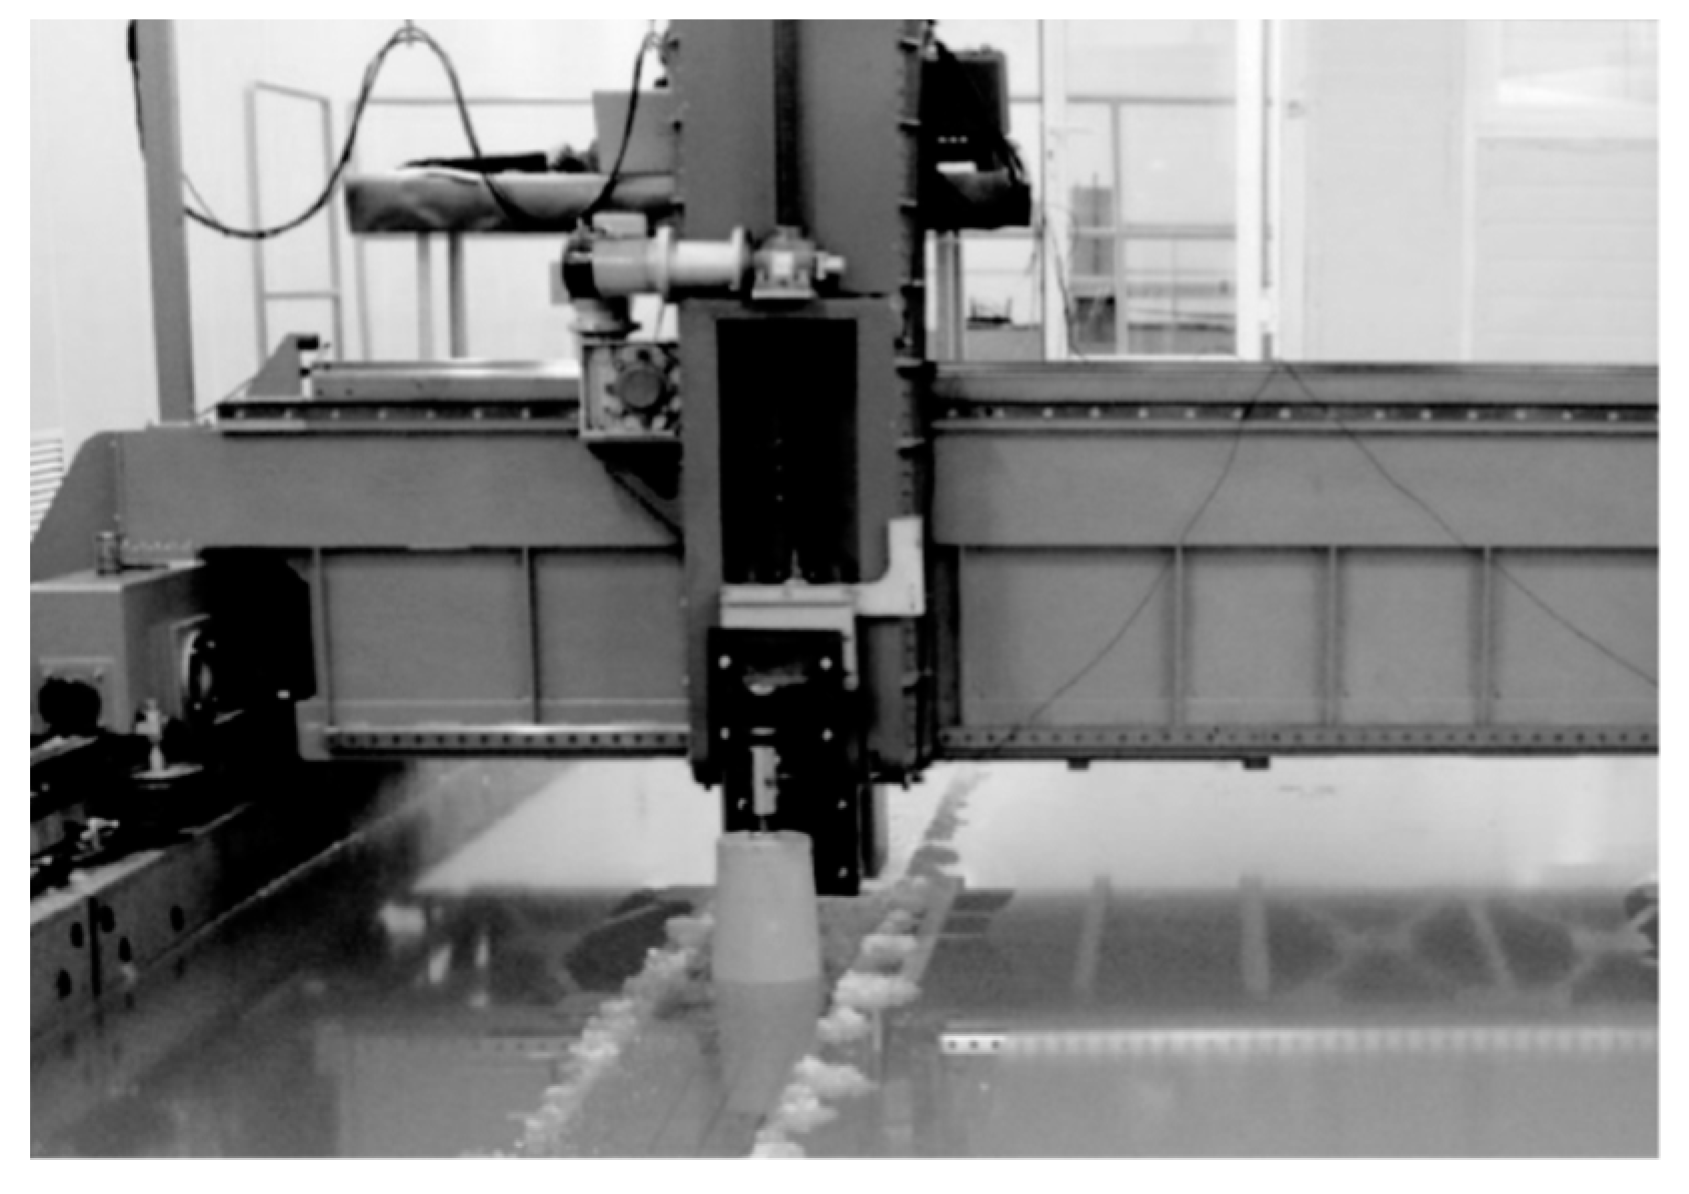
Wu et al. (2018) carried out model tests for the foundations of 3 MW and 4 MW monopile wind turbines in the ice Basin of Tianjin University [
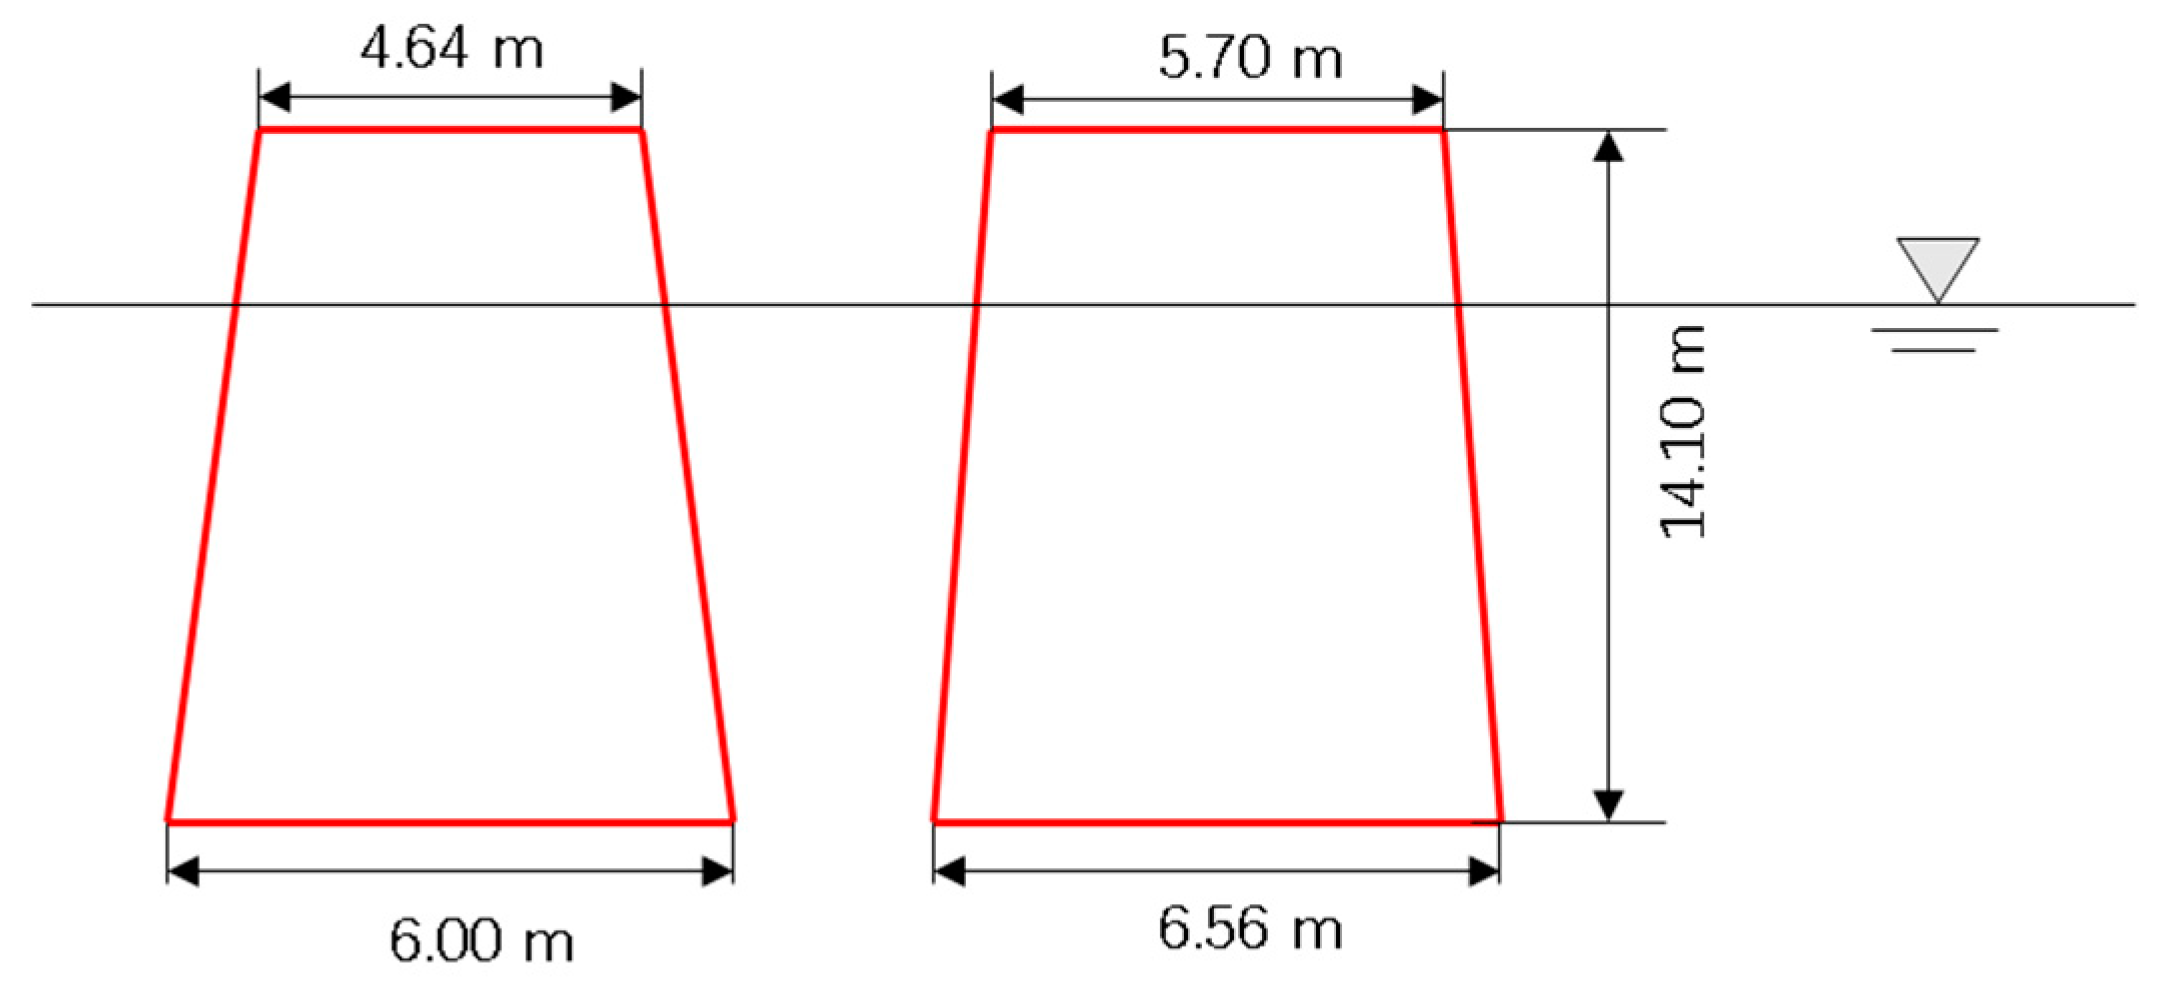
30]. The scale was set as 1:20. The ice tank was 40.0 m long, 6.0 m wide, and 1.8 m in depth. It was able to make an ice sheet with a thickness ranging from 1.0 to 30 cm. The foundations of the wind turbine towers were cone structures. The dimensions of the two icebreaking cones are shown in Table 4. The sketch of two structure models is shown in Figure 13. The model test to measure ice load on 3 MW structure is shown in Figure 14. A force transducer was installed to measure ice force. The signals were recorded at a sampling frequency of 100 Hz in the model test.
The input of the numerical simulation is set as the same as that of the model tests. The target ice thickness is 0.4 m. The bending and crushing strength are expected to be 600 kPa and 2060 kPa, respectively. The ice drift velocity varies from 0.05 to 1.2 m/s in full scale. The specific test matrix with measured ice properties is presented in Table 5. There is no information for the frictional coefficient of the ice-structure model [30]. The friction is set as 0.1 in the following simulation.
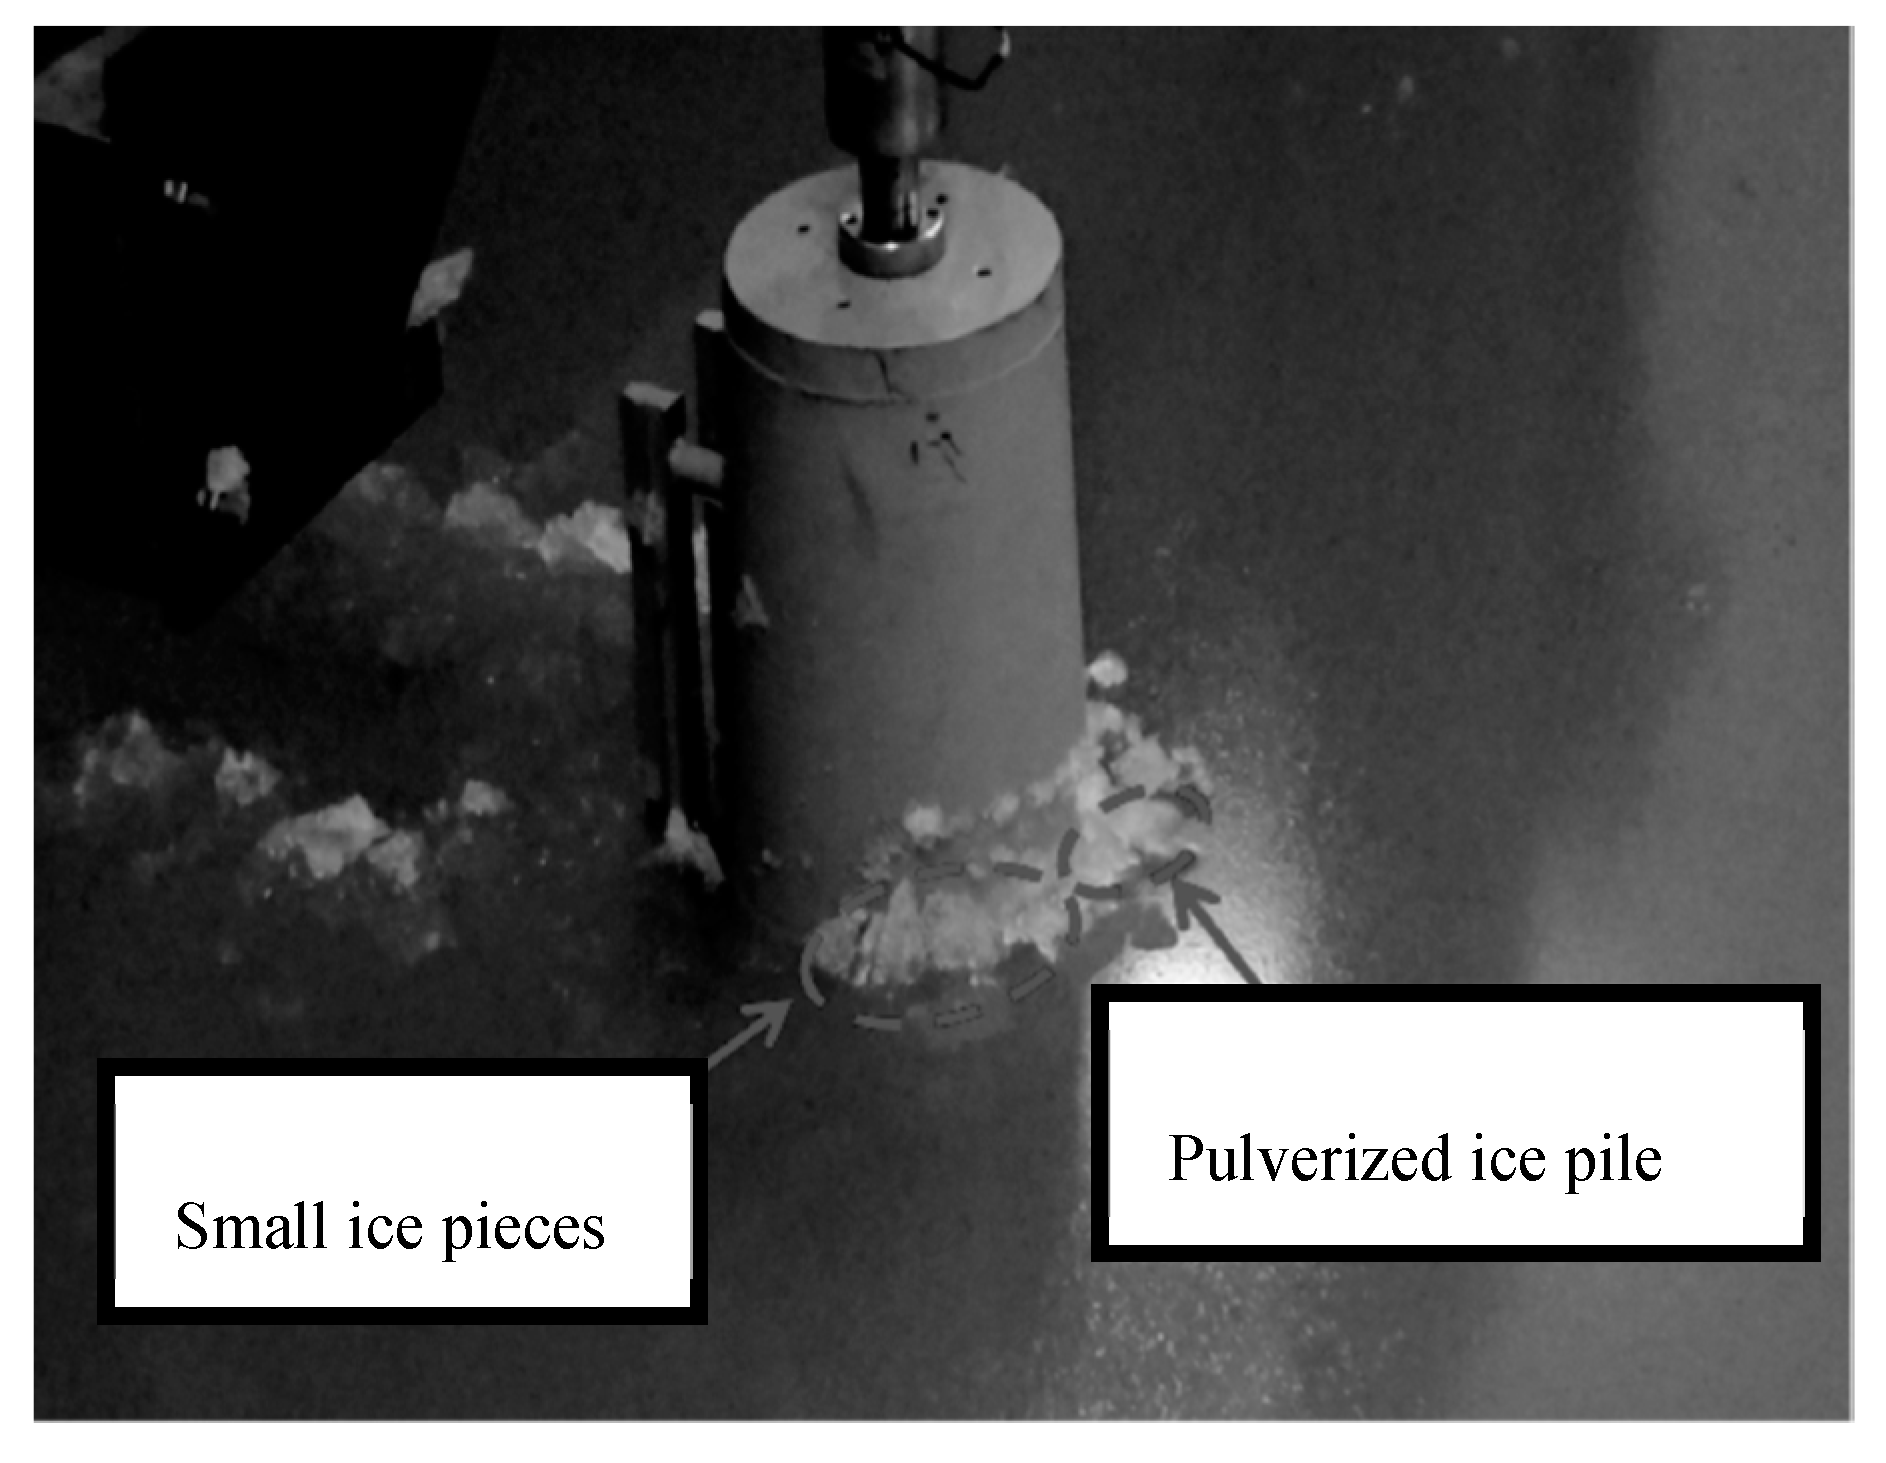
Different failure modes were identified from the ice experiments. At a low speed, the level ice would crush against the cone and then fail in both the local and global buckling modes. The local buckling was more dominant than global bulking. An abnormally low ice load often occurred after the global buckling failure because large pieces of ice were fragmented from an intact ice sheet and there was almost no contact between the intact ice and the cone. This phenomenon is different for tests with a high speed. The global buckling event became less important as the speed increased. Ice would be pulverized into small rubble and fail in the buckling at some local zones. Figure 15 gives a snapshot from the model test 306, which shows a non-simultaneous ice crushing scenario.
All tests shown in Table 5 are simulated with ice speeds ranging from 0.05 to 1.2 m/s. Herein, the time evolution of the measured ice loads from four tests was selected and used for comparison due to non-simultaneous crushing failures at the contact area. 
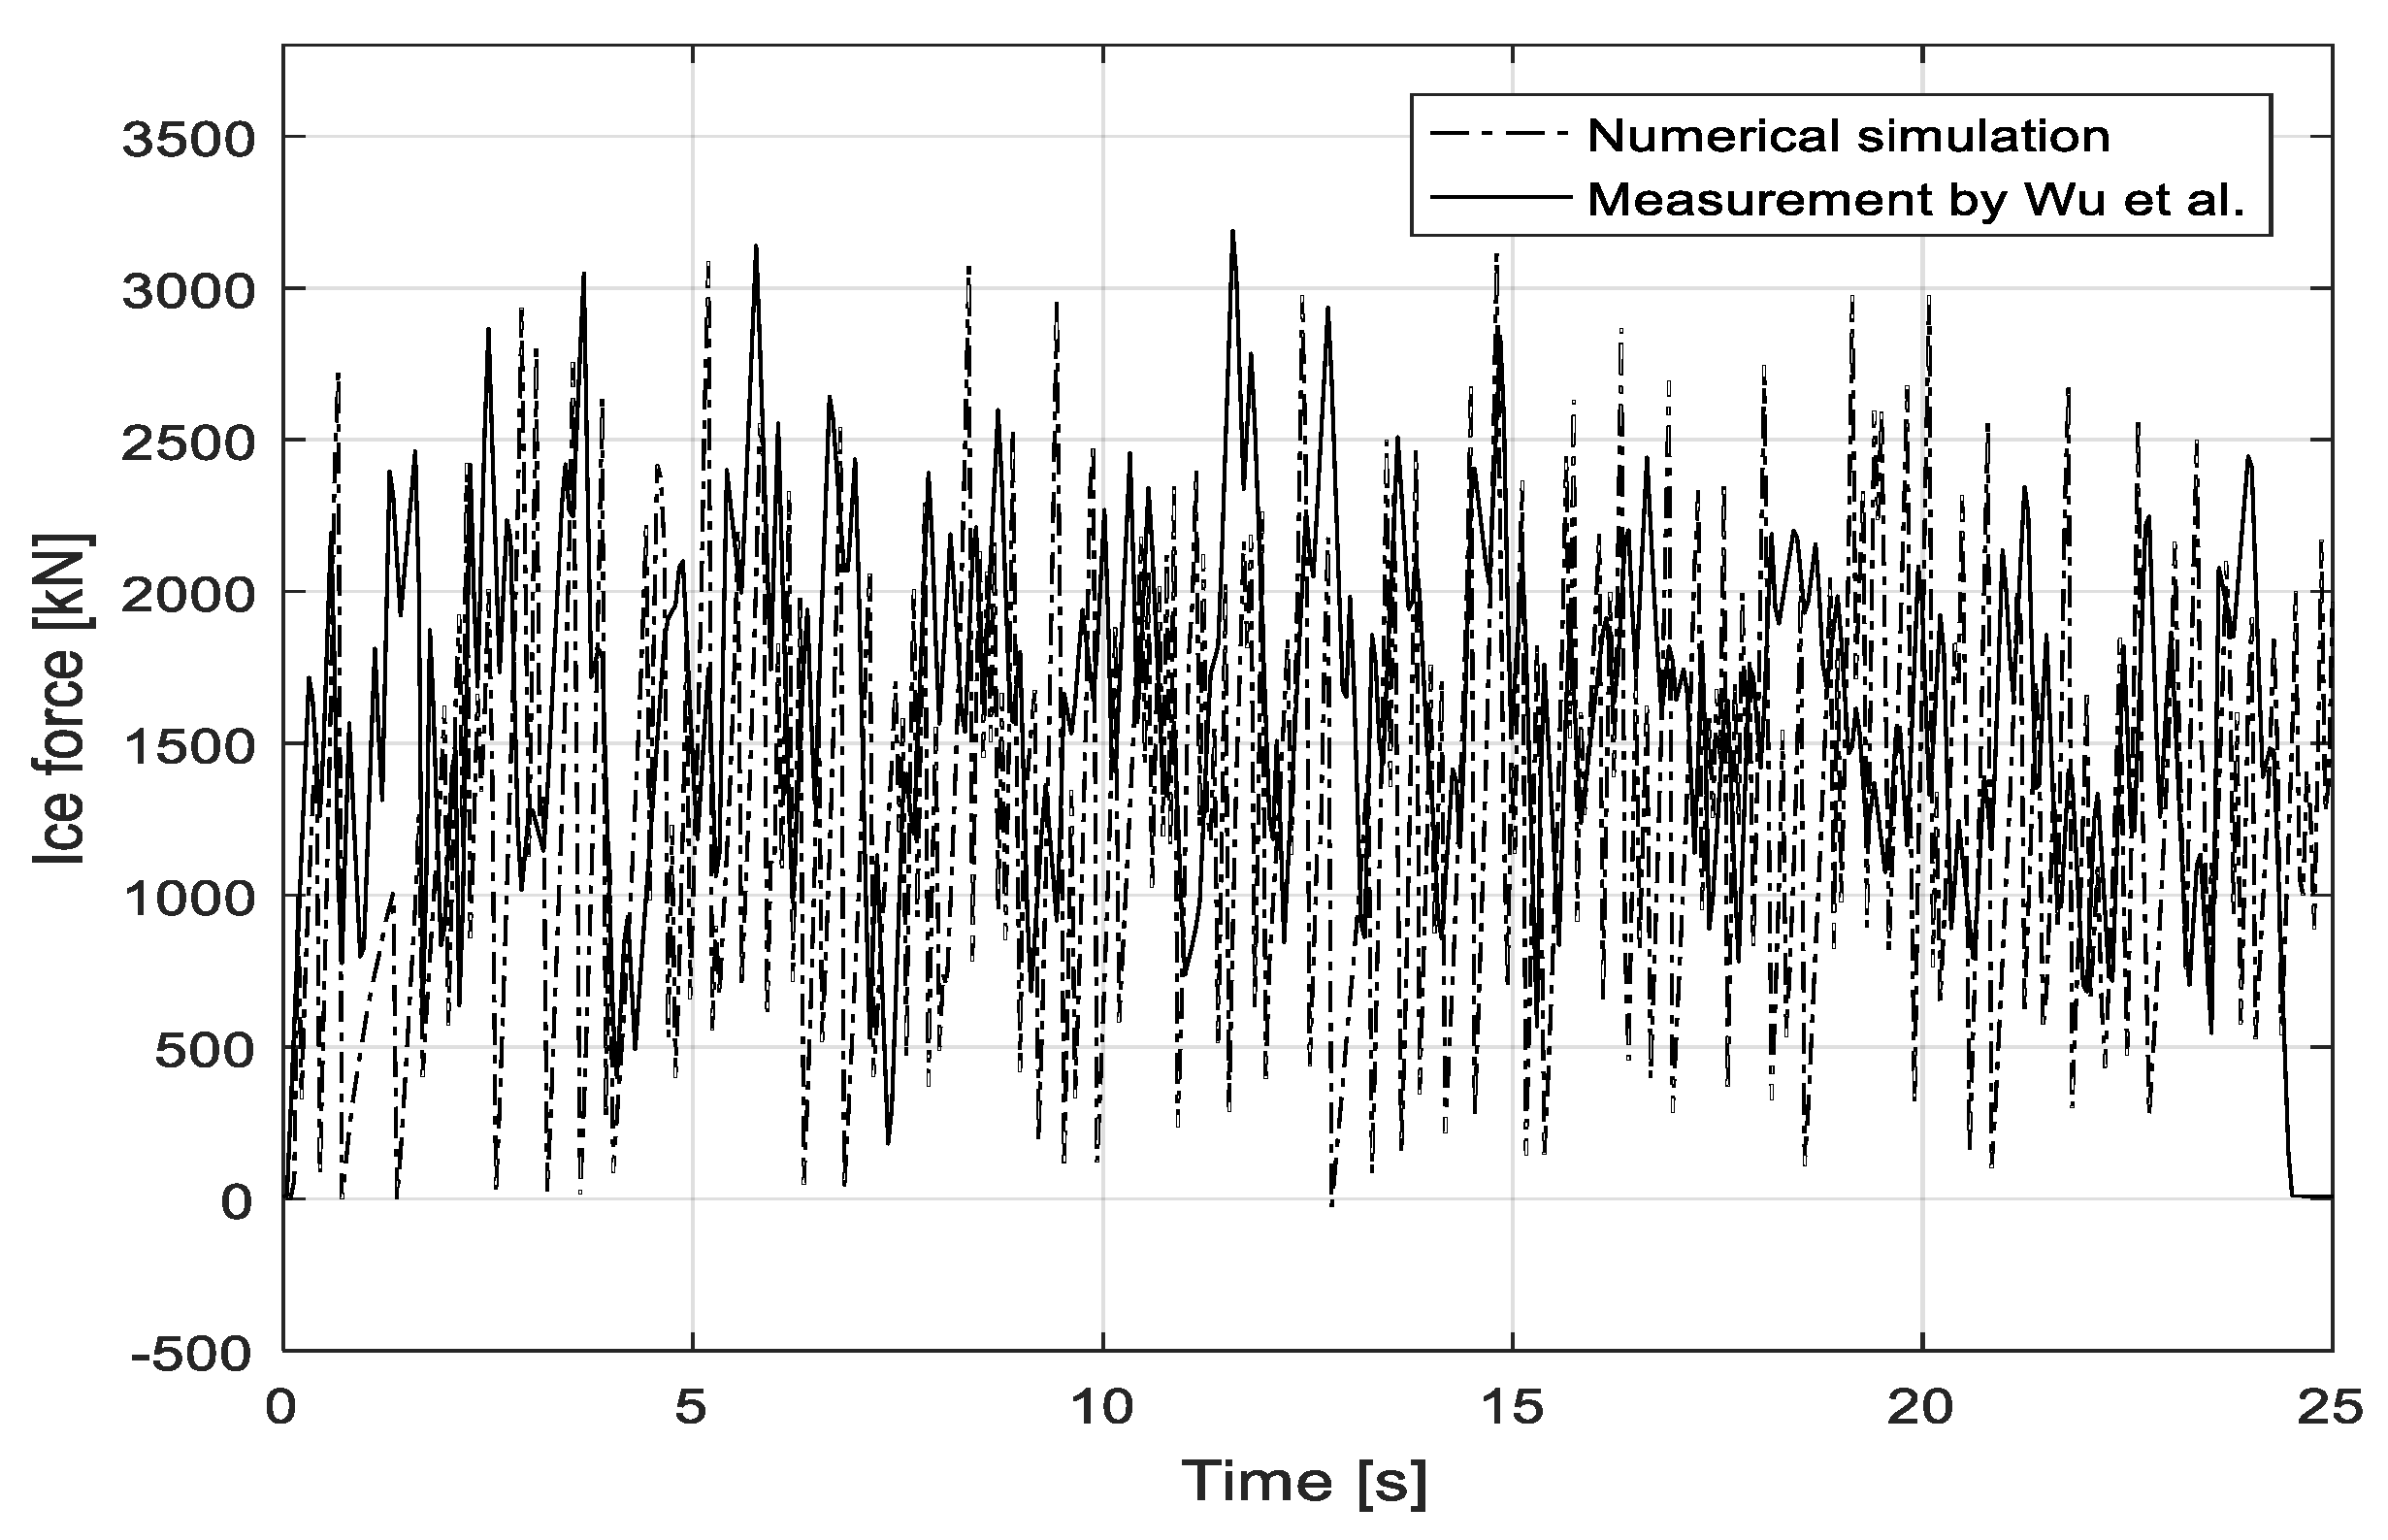
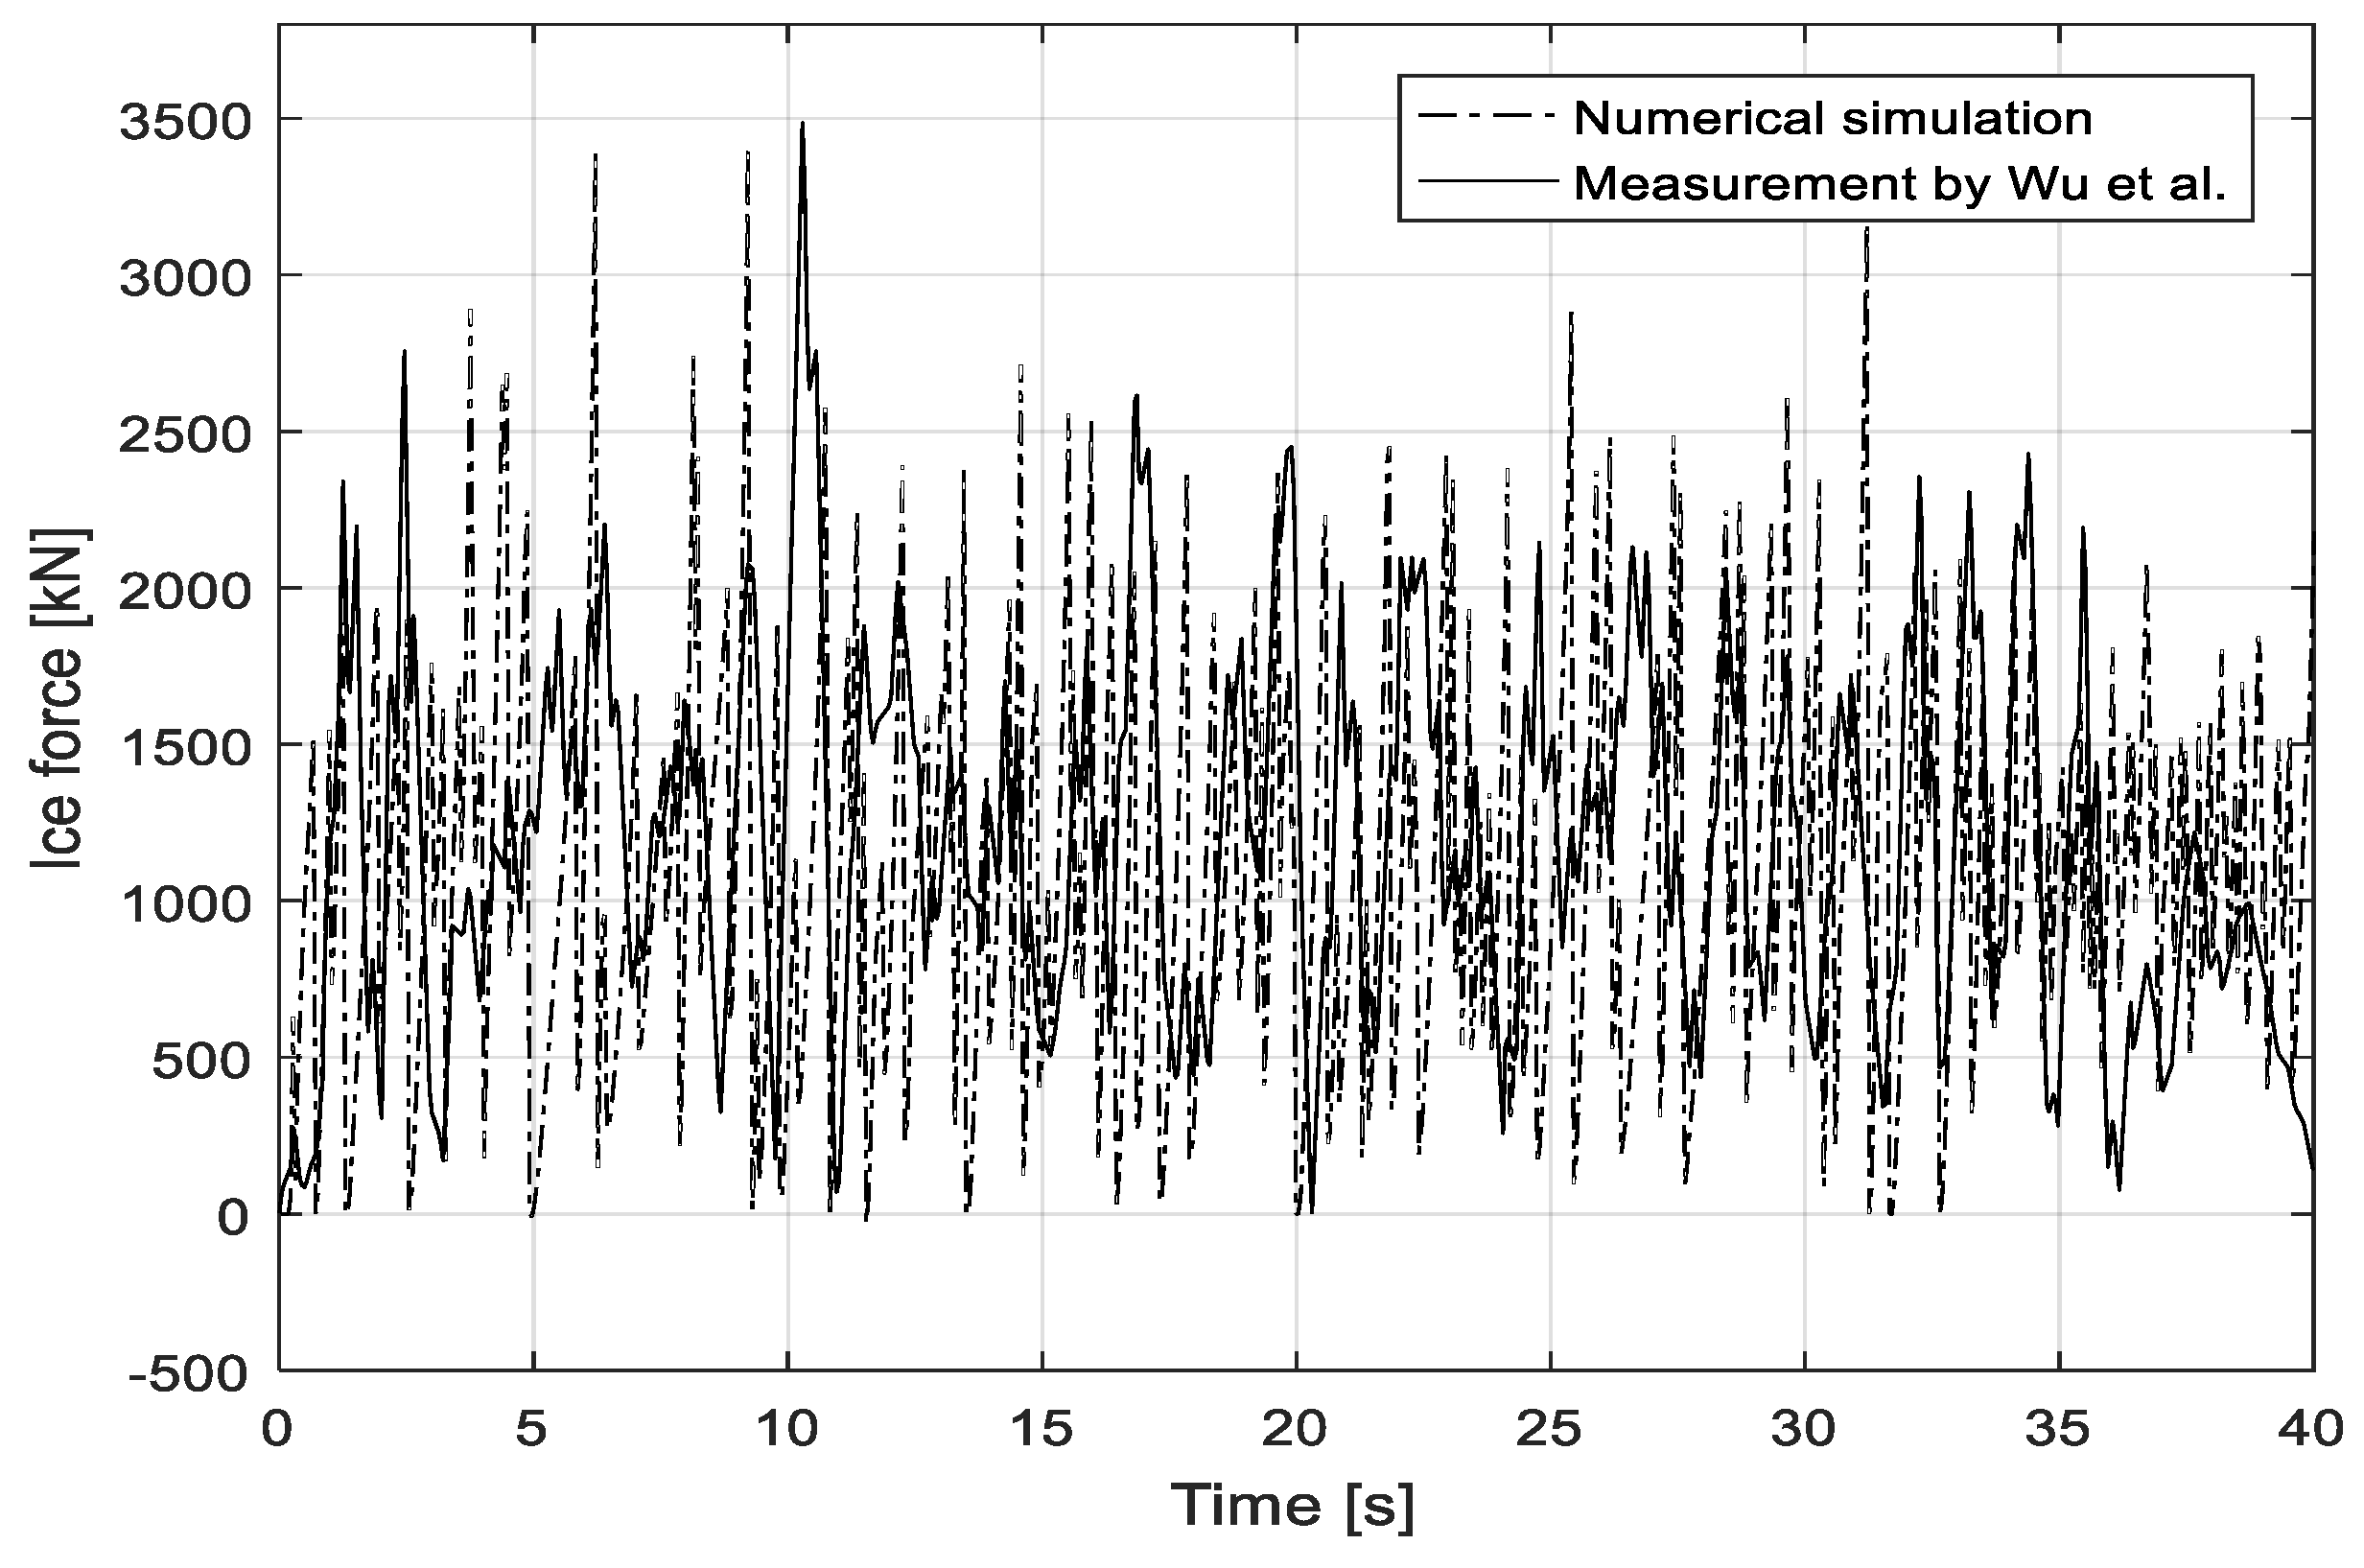
Figure 16 gives the simulated results of test 304 compared to those measured in the time domain where the drift speed is 0.6 m/s at full scale for the 3MW wind turbine’s tower. The simulation lasts 40 seconds, which is the same as the model test. The ice conditions are set as presented in 
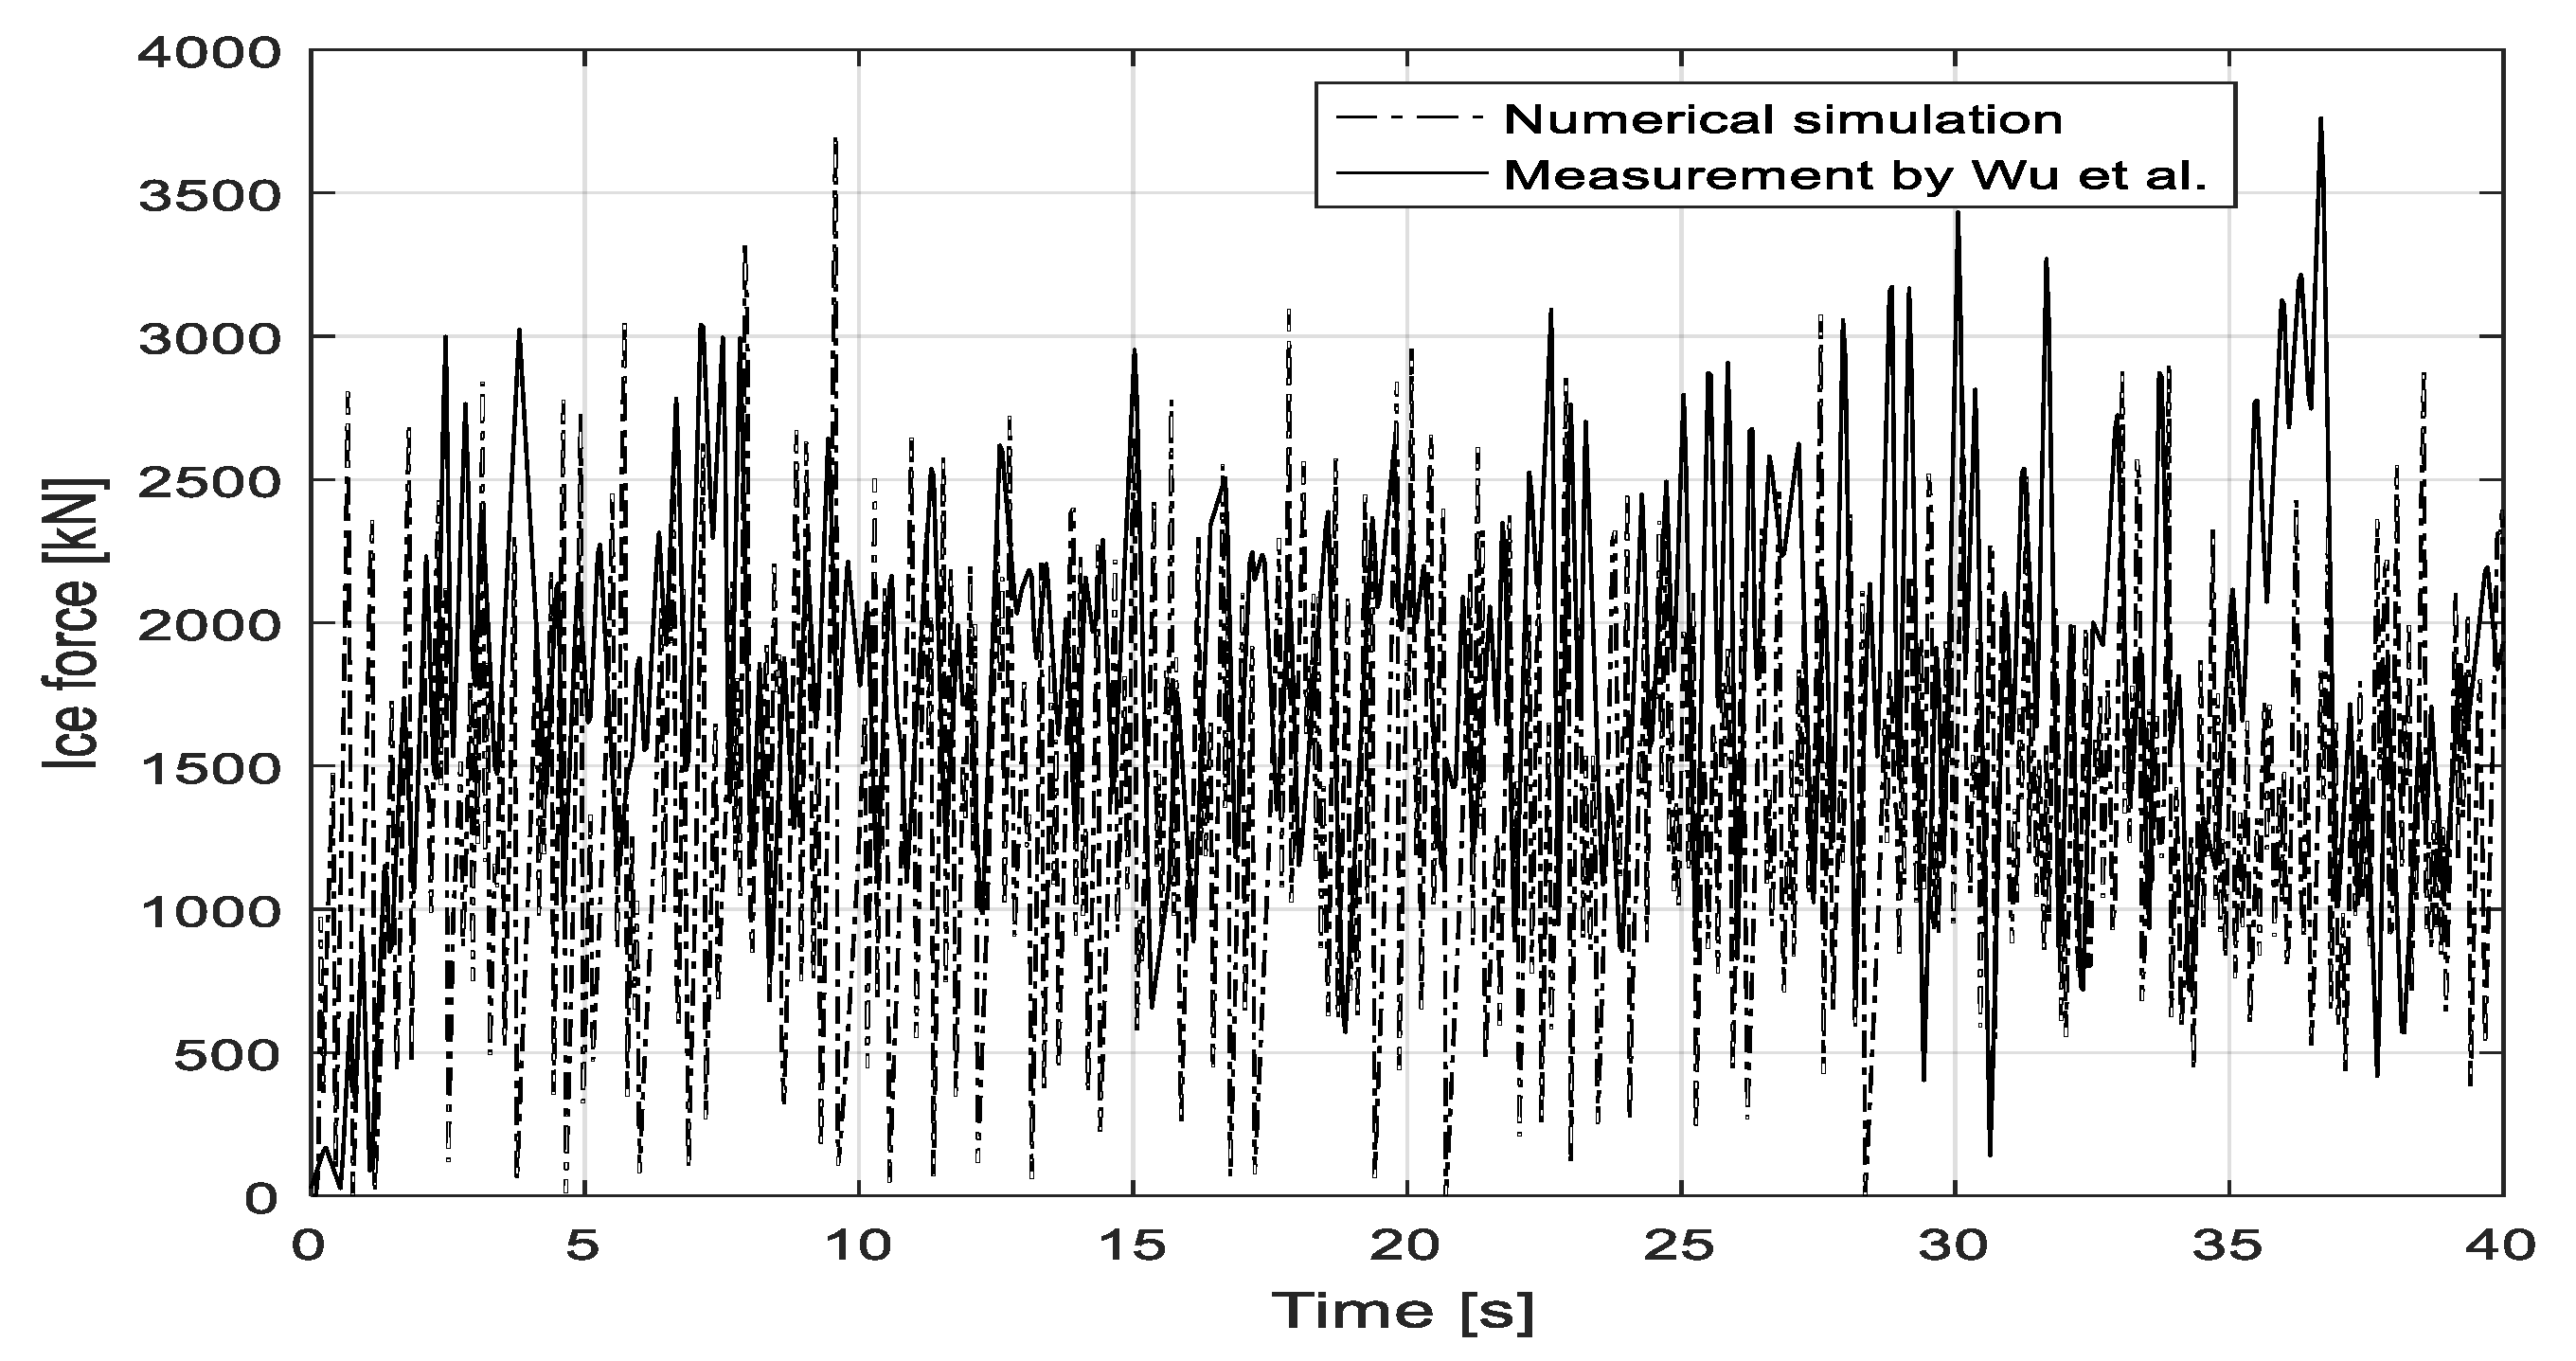
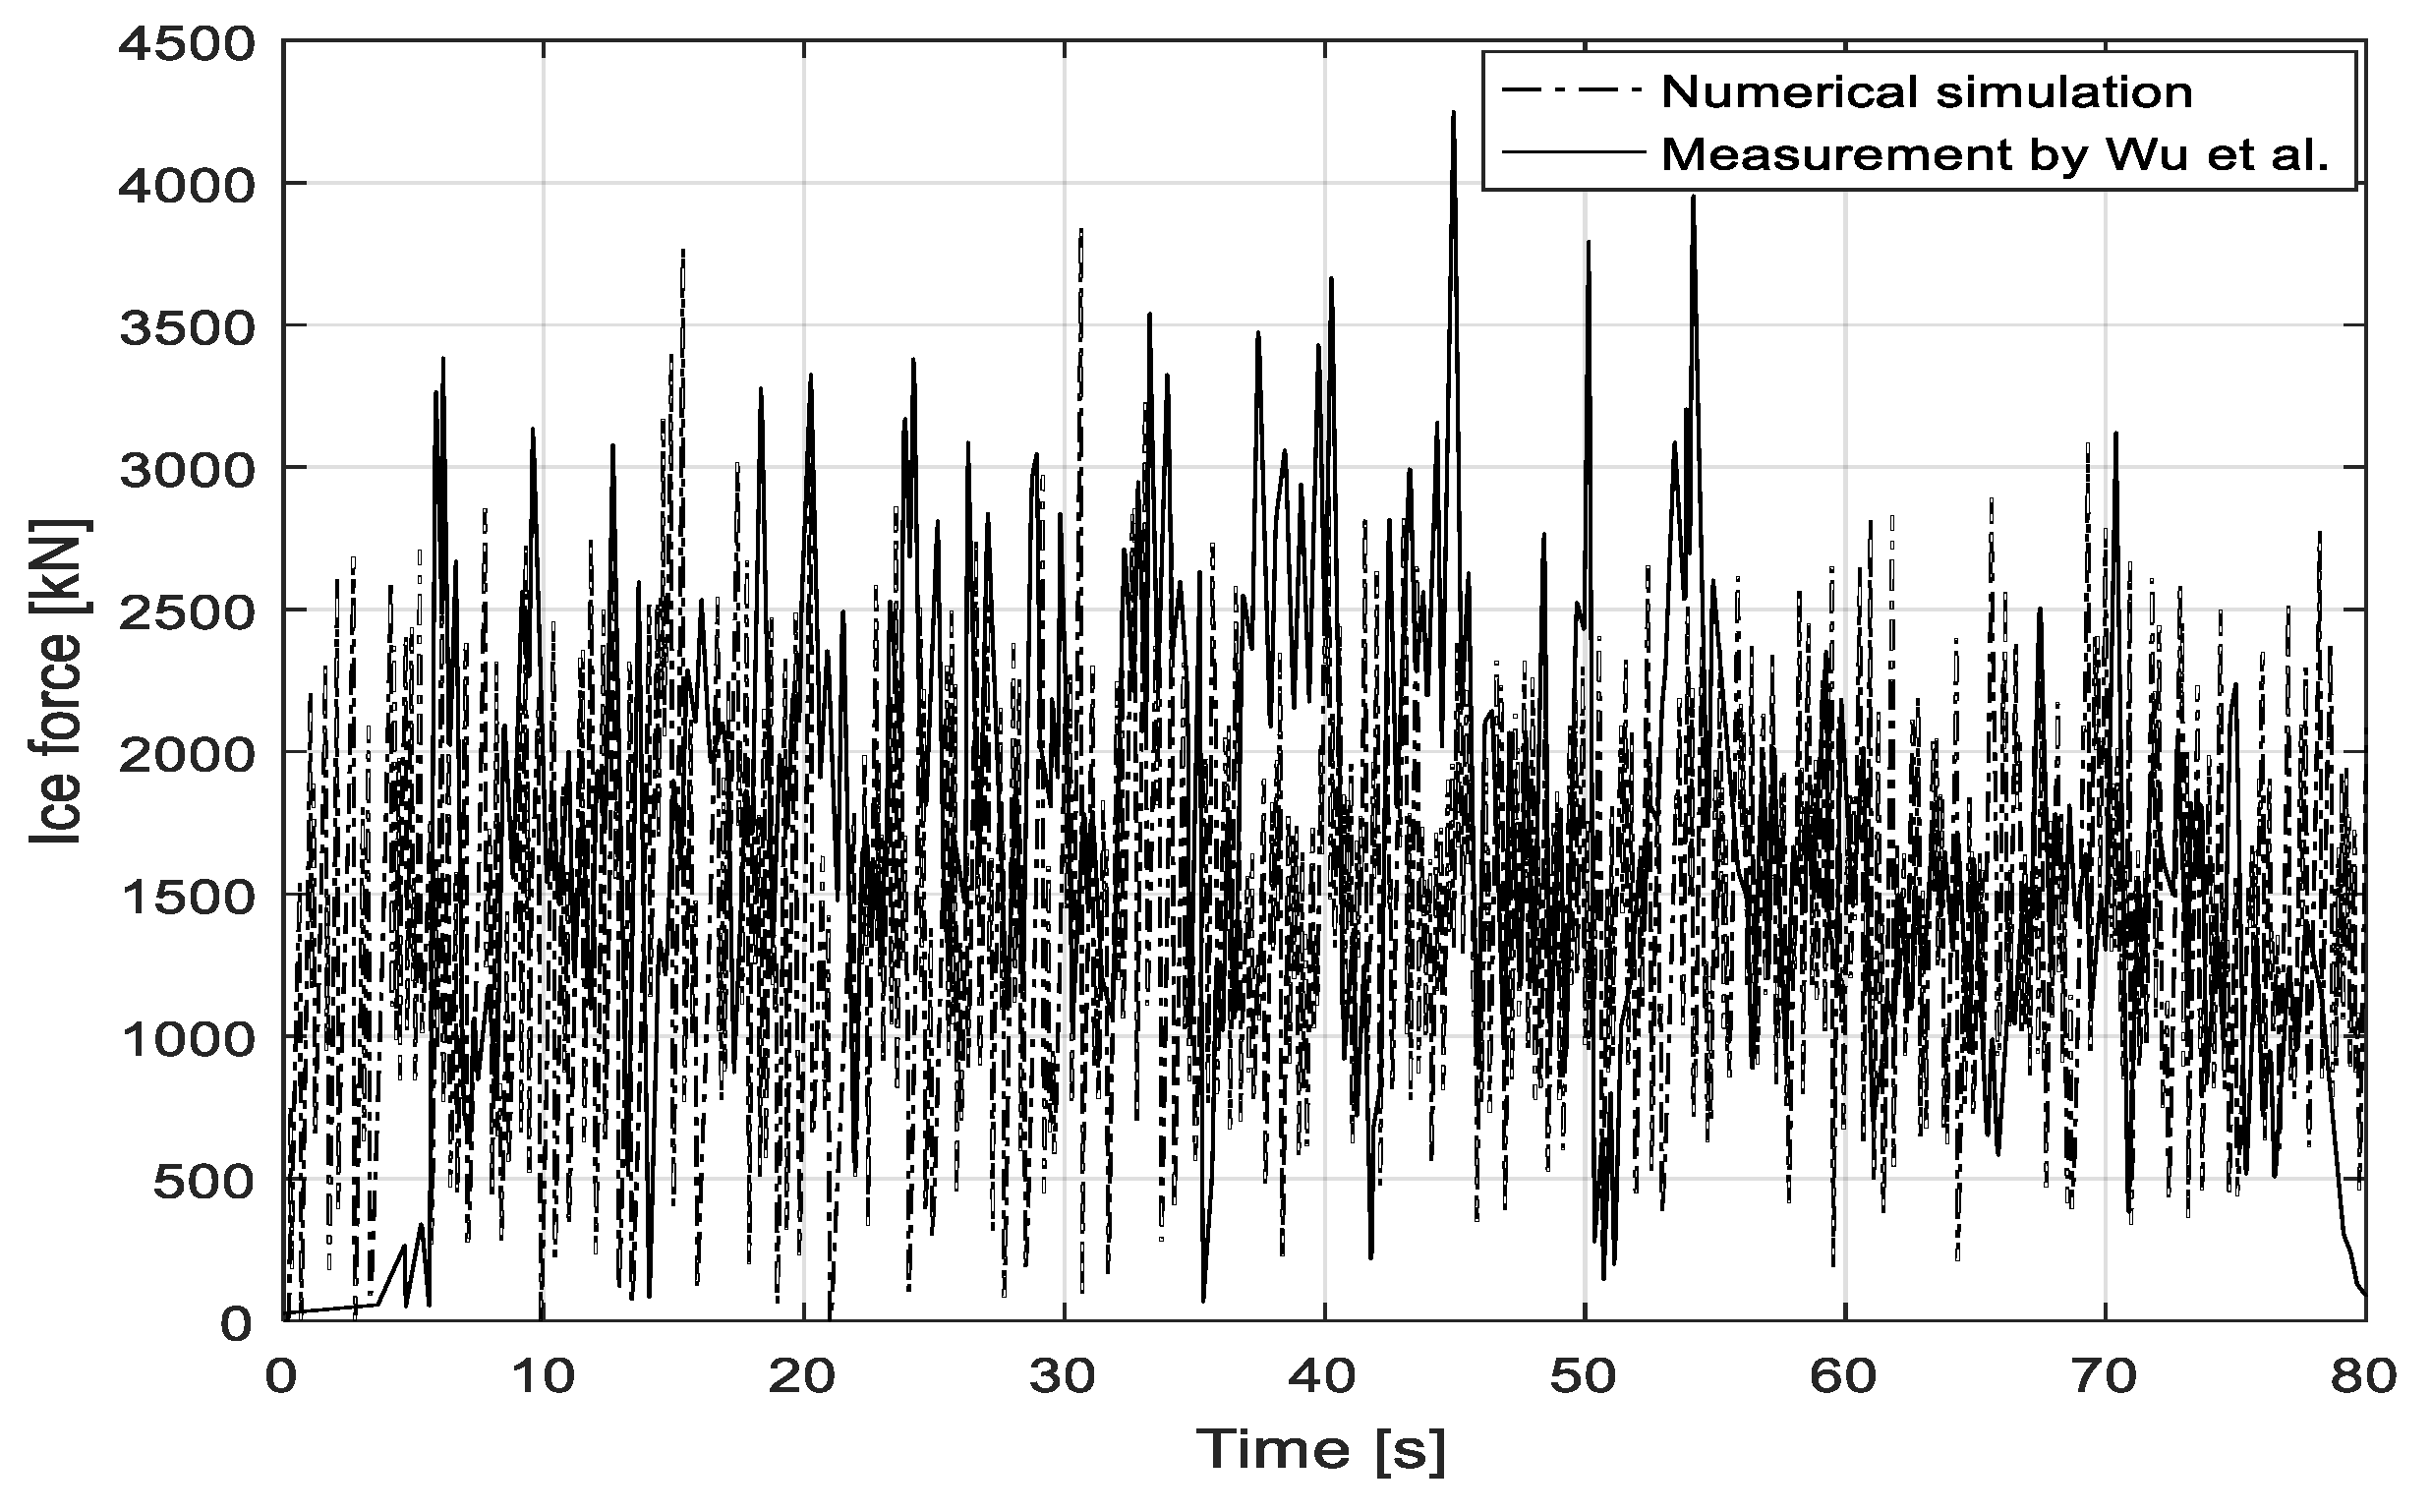
Table 5. In general, both the measured and simulated ice force show strong nonlinearity and vibration. Clearly, the two main phases, including loading and unloading, can be found from a time series of ice forces. The minimum ice force can drop to approximately zero, and the forces are cyclic with different peaks. By increasing the ice drift speed to 1.2 m/s, the time history of the simulated ice load from test 306 are shown compared to that measured in Figure 17. Similar ice force characteristics can be derived according to test 304.
Using the structural model of a 4 MW wind turbine foundation, we continued to study ice forces for tests 404 and 406, where both the measured and simulated results are presented. The time history of ice loads for both tests are shown in Figure 18 and Figure 19, respectively. The difference between tests 304 and 404 or tests 306 and 406 lies in the structure. When comparing the maximum ice forces for test 304 and test 404 or test 306 and 406, the 4 MW wind turbine foundation is subjected to larger ice loads than the 3 MW wind turbine. This is because the diameter of the 4 MW wind turbine monopile at the mean waterline and slope is relatively large. The discrepancy between the measured and simulated ice forces for the four tests are tabulated in Table 6. The statistics regarding the mean, standard deviation, and maximum values are presented for comparison. To sum up, the simulated mean force is underestimated, and the maximum difference is 20.5%. The standard deviation shows a difference of 1.7–28.2%. The error for the maximum value ranges from 1.6% to 9.4%.
The other tests in Table 5 are also simulated, and the corresponding maximum forces are presented in 
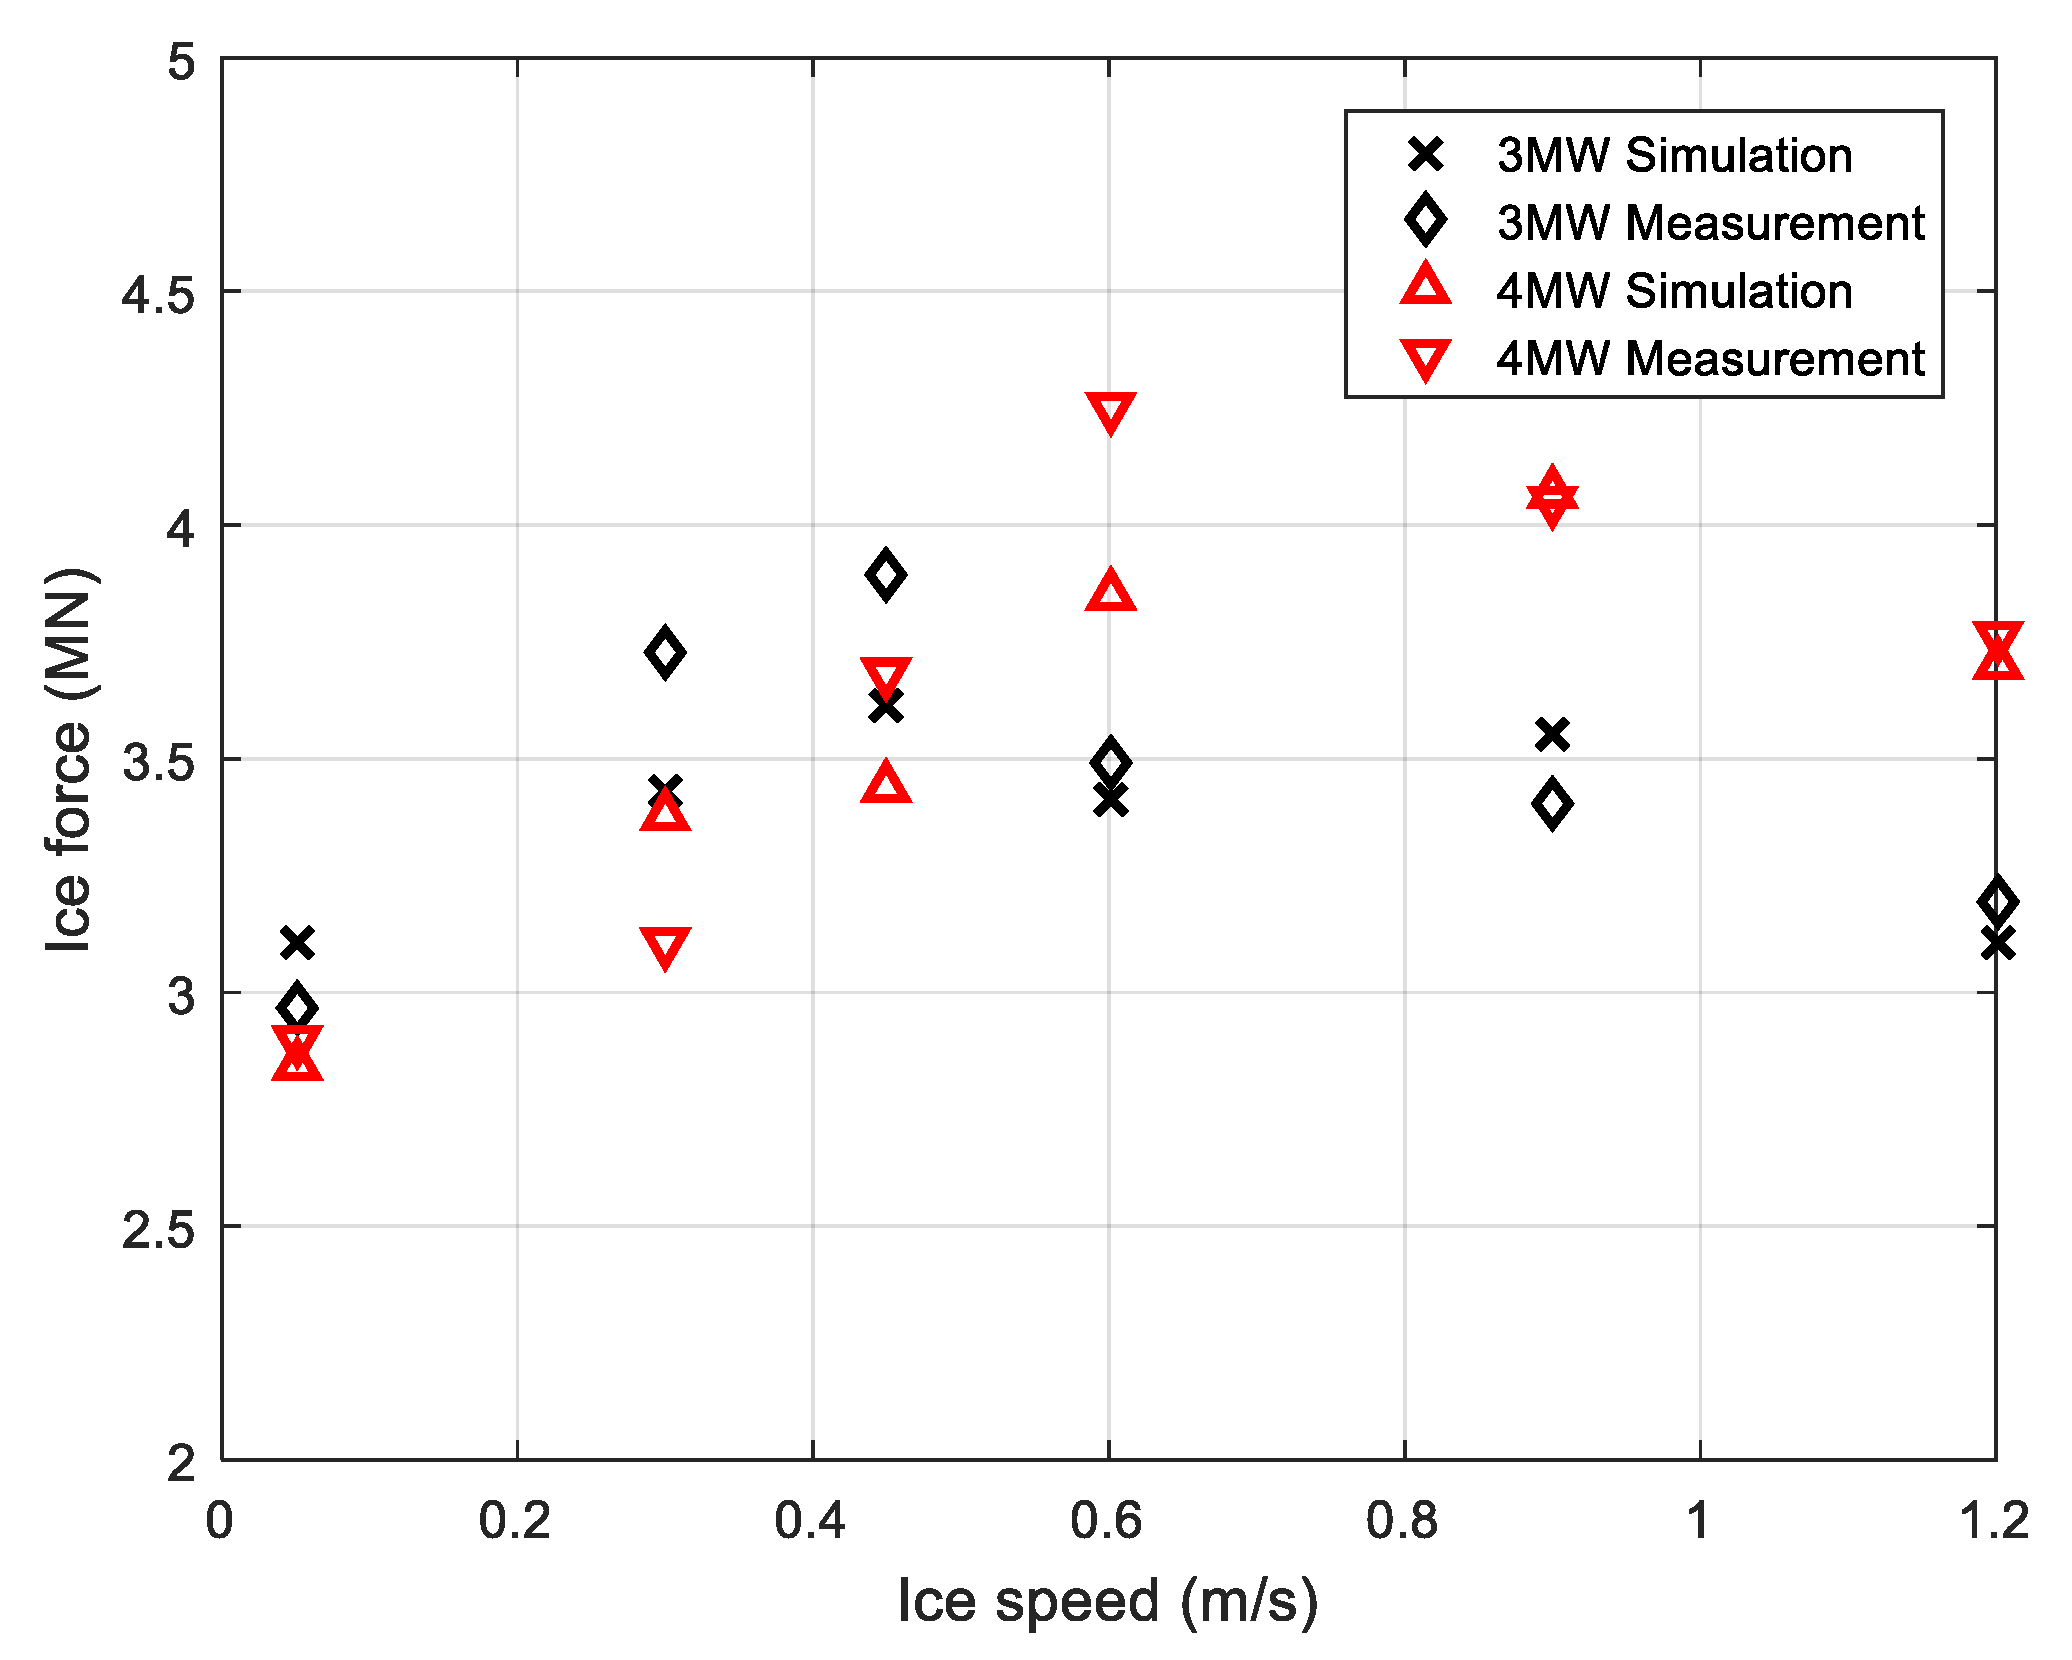
Table 7. Due to the lack of a time series for the model test data, only the maximum ice forces from the model test data are given for comparison. These forces range from 2.97 to 3.89 MN for a 3 MW structure model and 2.90 to 4.05 MN for a 4 MW structure model. Generally speaking, the calculated results fit relatively well with the measured results. This result shows that errors are relatively small, and the maximum error is less than 9%. The largest difference is 8.68% and the smallest is 0.49%. The maximum ice force derived from both the numerical simulation and the model tests are compared in Figure 20. The black solid line denotes the model test results while the dotted line denotes the numerical results. It is noted that the trends of the two lines agree well with each other. However, the peak of the maximum ice load from the simulation is smaller than that from the model test.
Moreover, the peaks of the time series of measured, and simulated ice forces are collected for tests 304, 306, 404, and 406. Weibull distributions are applied to fit these peaks approximately. The shape and scale factors for tests 304, 306, 404, and 406 are estimated from Weibull fitting. The standard error between the original peak values and the fitted data are also included in Table 8. It can be seen that the errors for the shape factor are more than 10% and less than 15.7%. The scale factor error ranges from 1.8% to 4.4%.
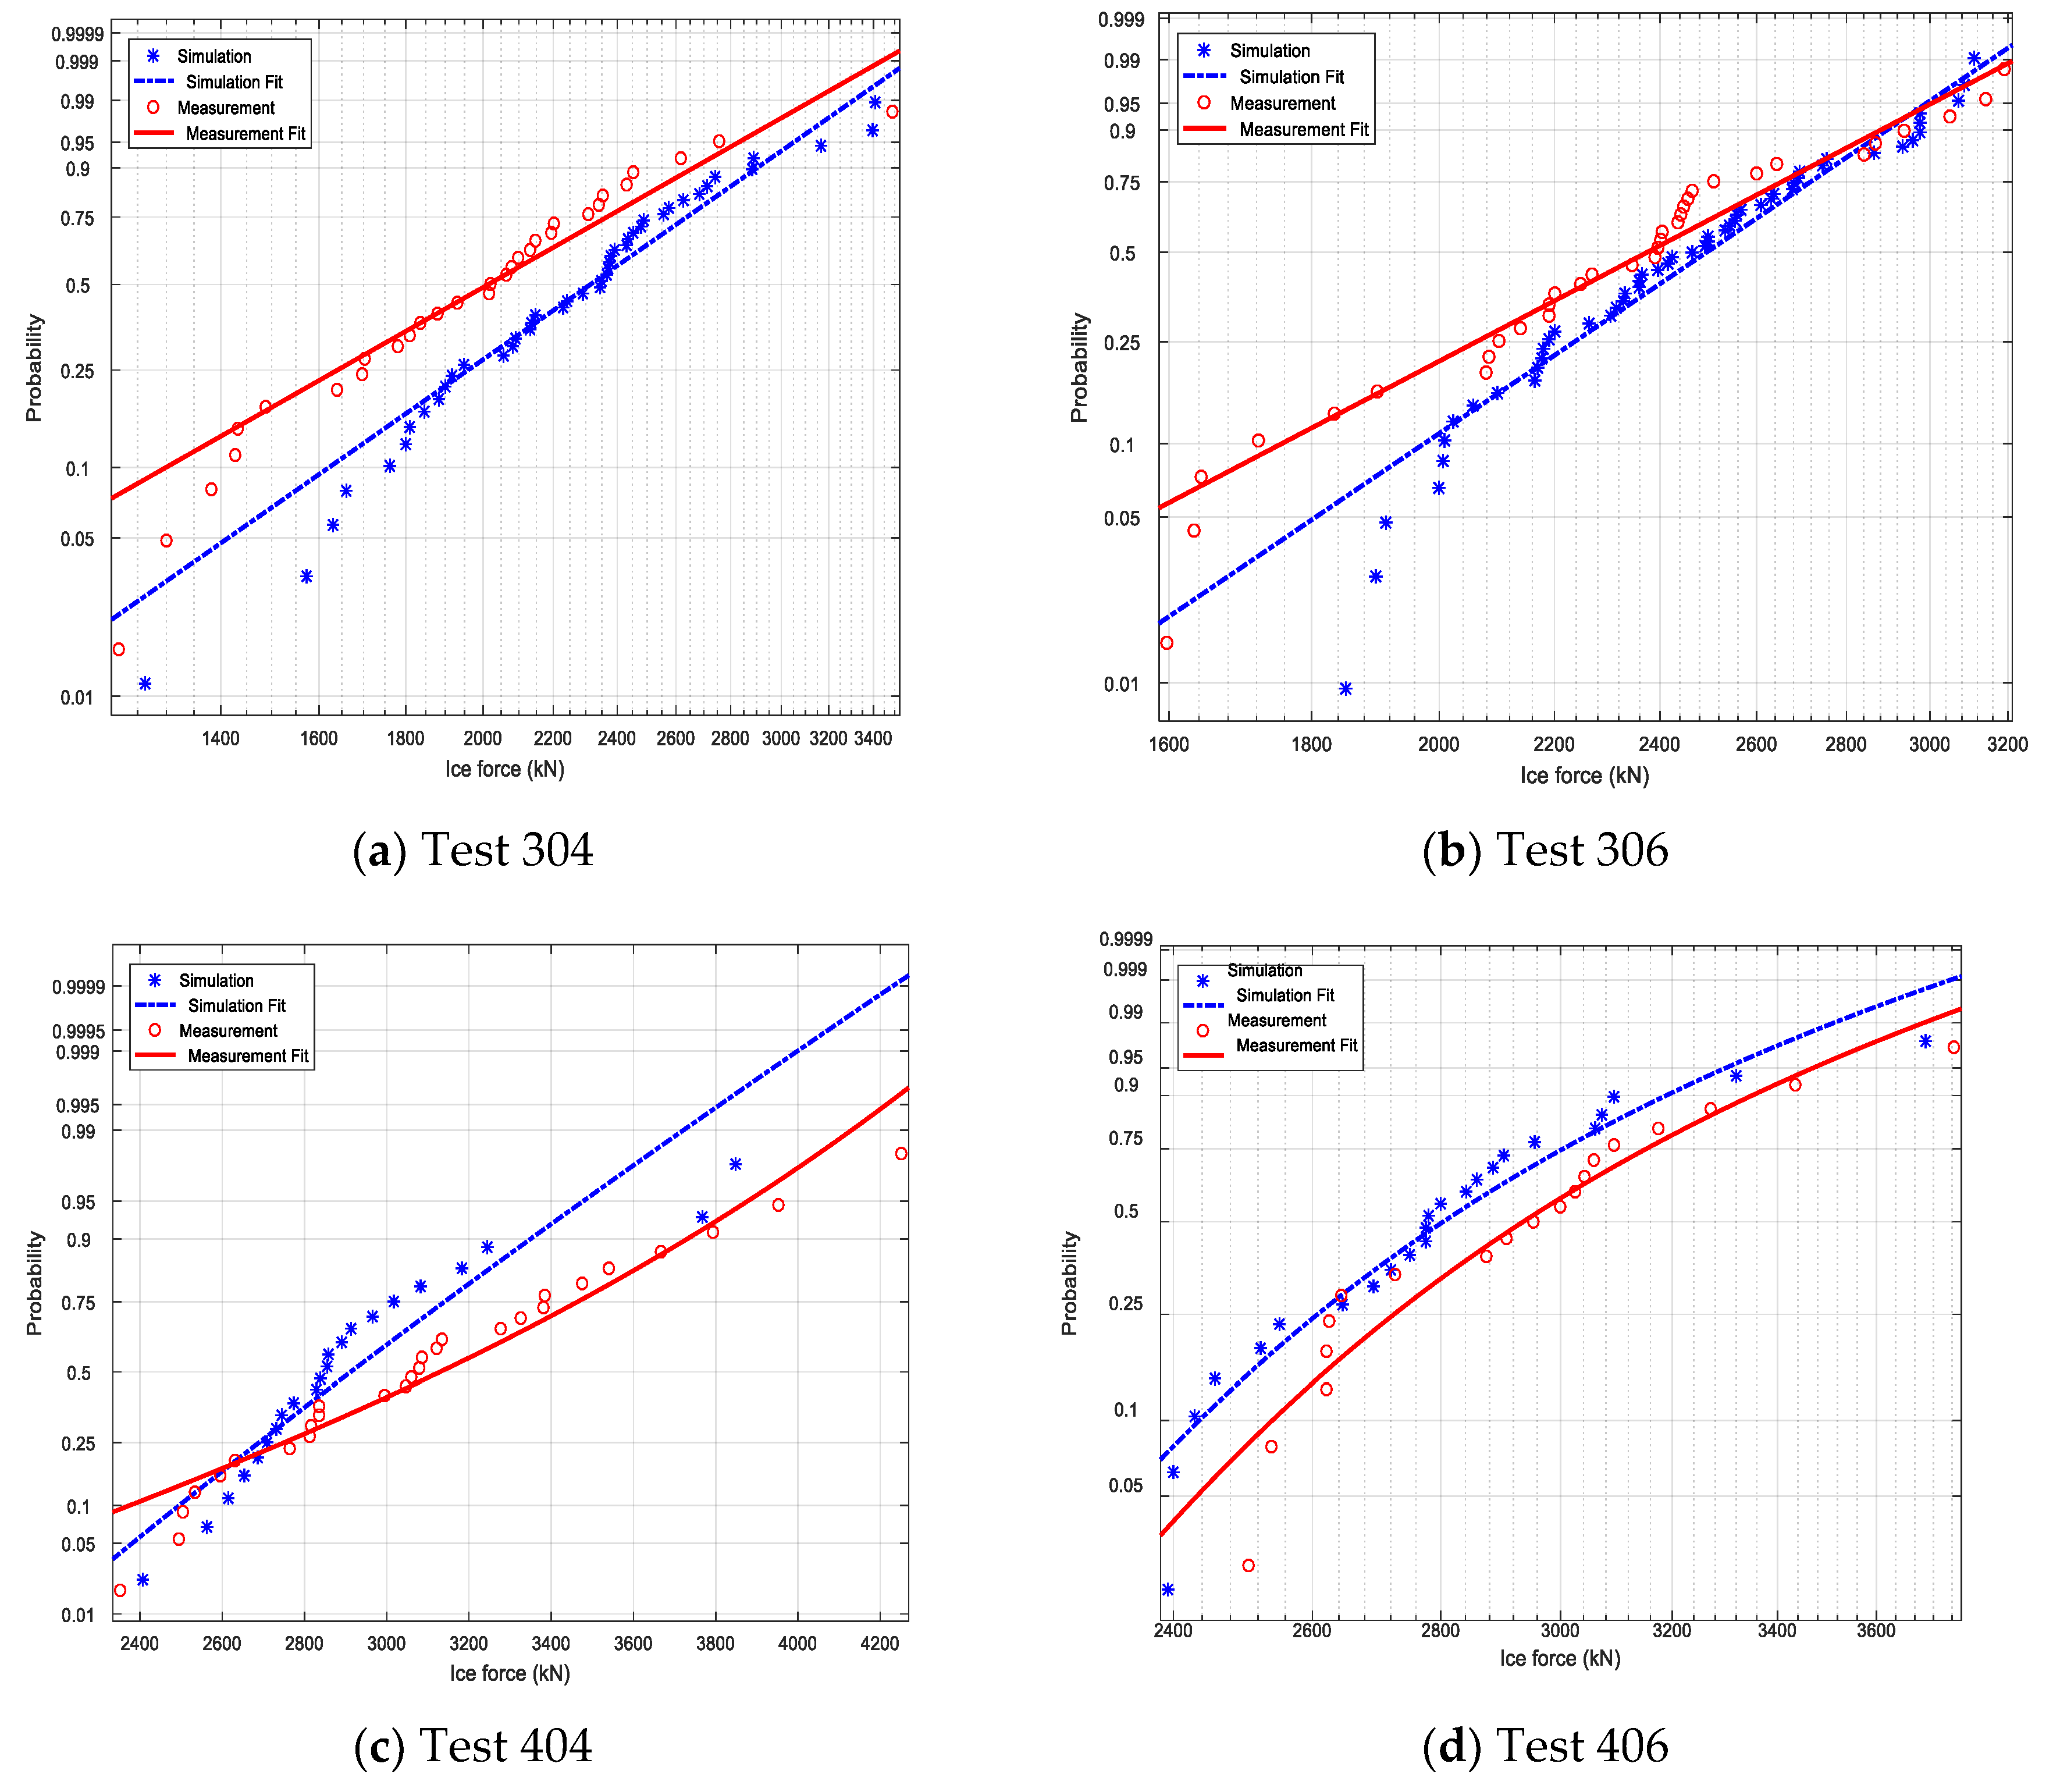
Both the measured and simulated results are plotted in Figure 21. The red solid line denotes the measured results while the blue dotted line denotes the numerical results. For tests 304 and 306 (Figure 21a,b), the simulation results are lower than the measurements, and the two lines tend to converge. For test 404 in Figure 21c, the simulation results are larger than the measurement. They intersect at a relatively low force level and tend to deviate from each other. The scale factor is around 7% higher for the measured results than the simulated ones. For test 406 in Figure 21d, the simulation data are slightly higher than the measured data. It should be noted that both the simulation and measured data fit well with the Weibull distribution for all four tests.
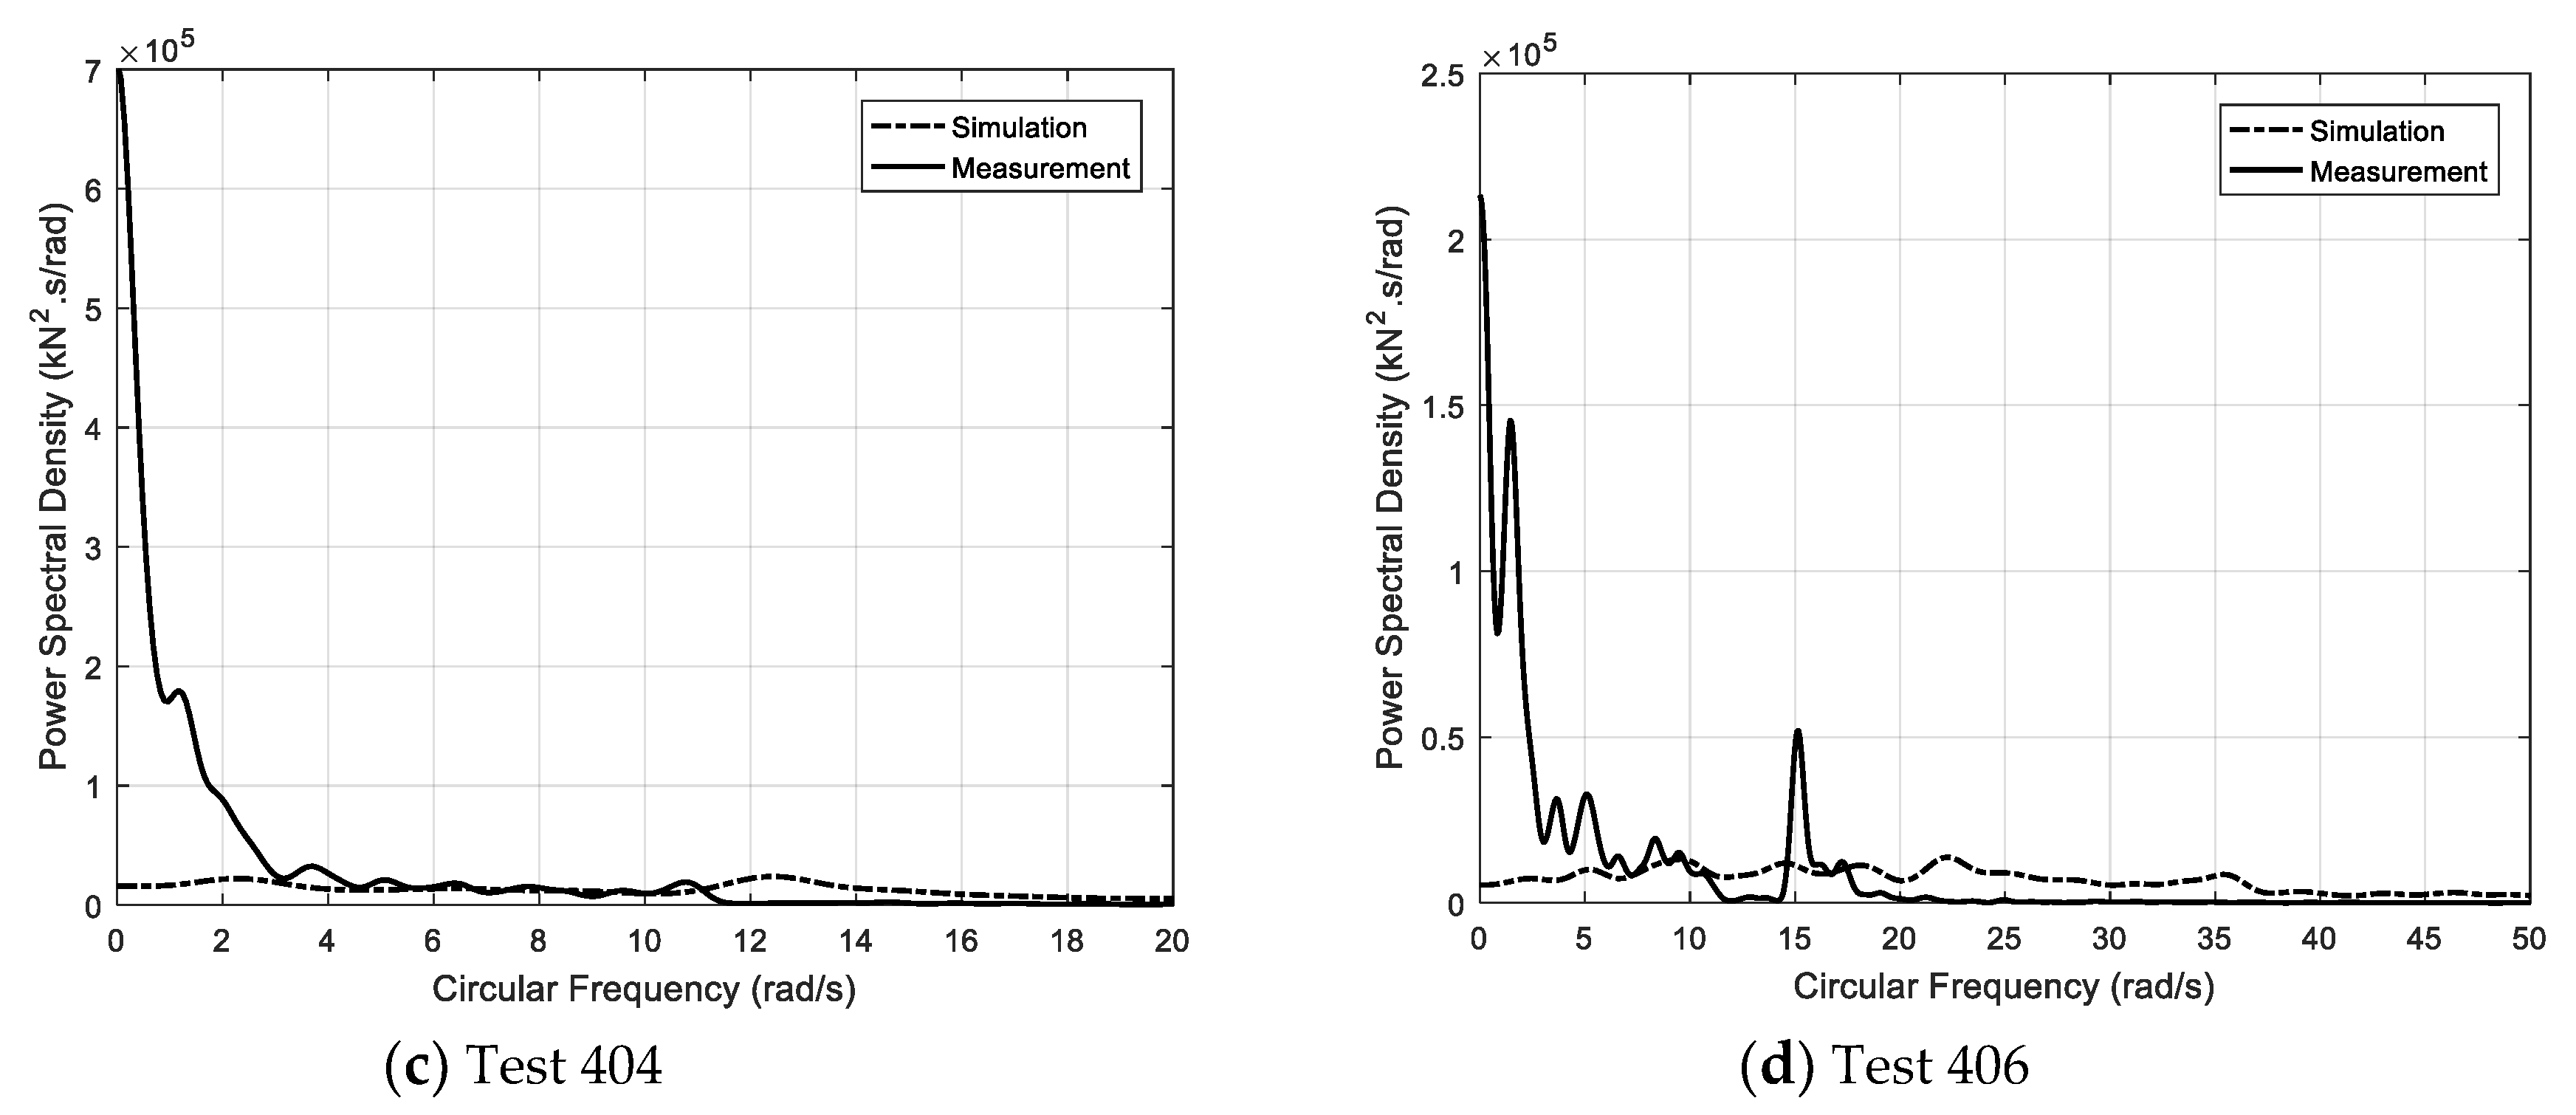
The power spectra of the simulated and measured ice loads (Figure 14, Figure 15, Figure 16 and Figure 17) are shown in 
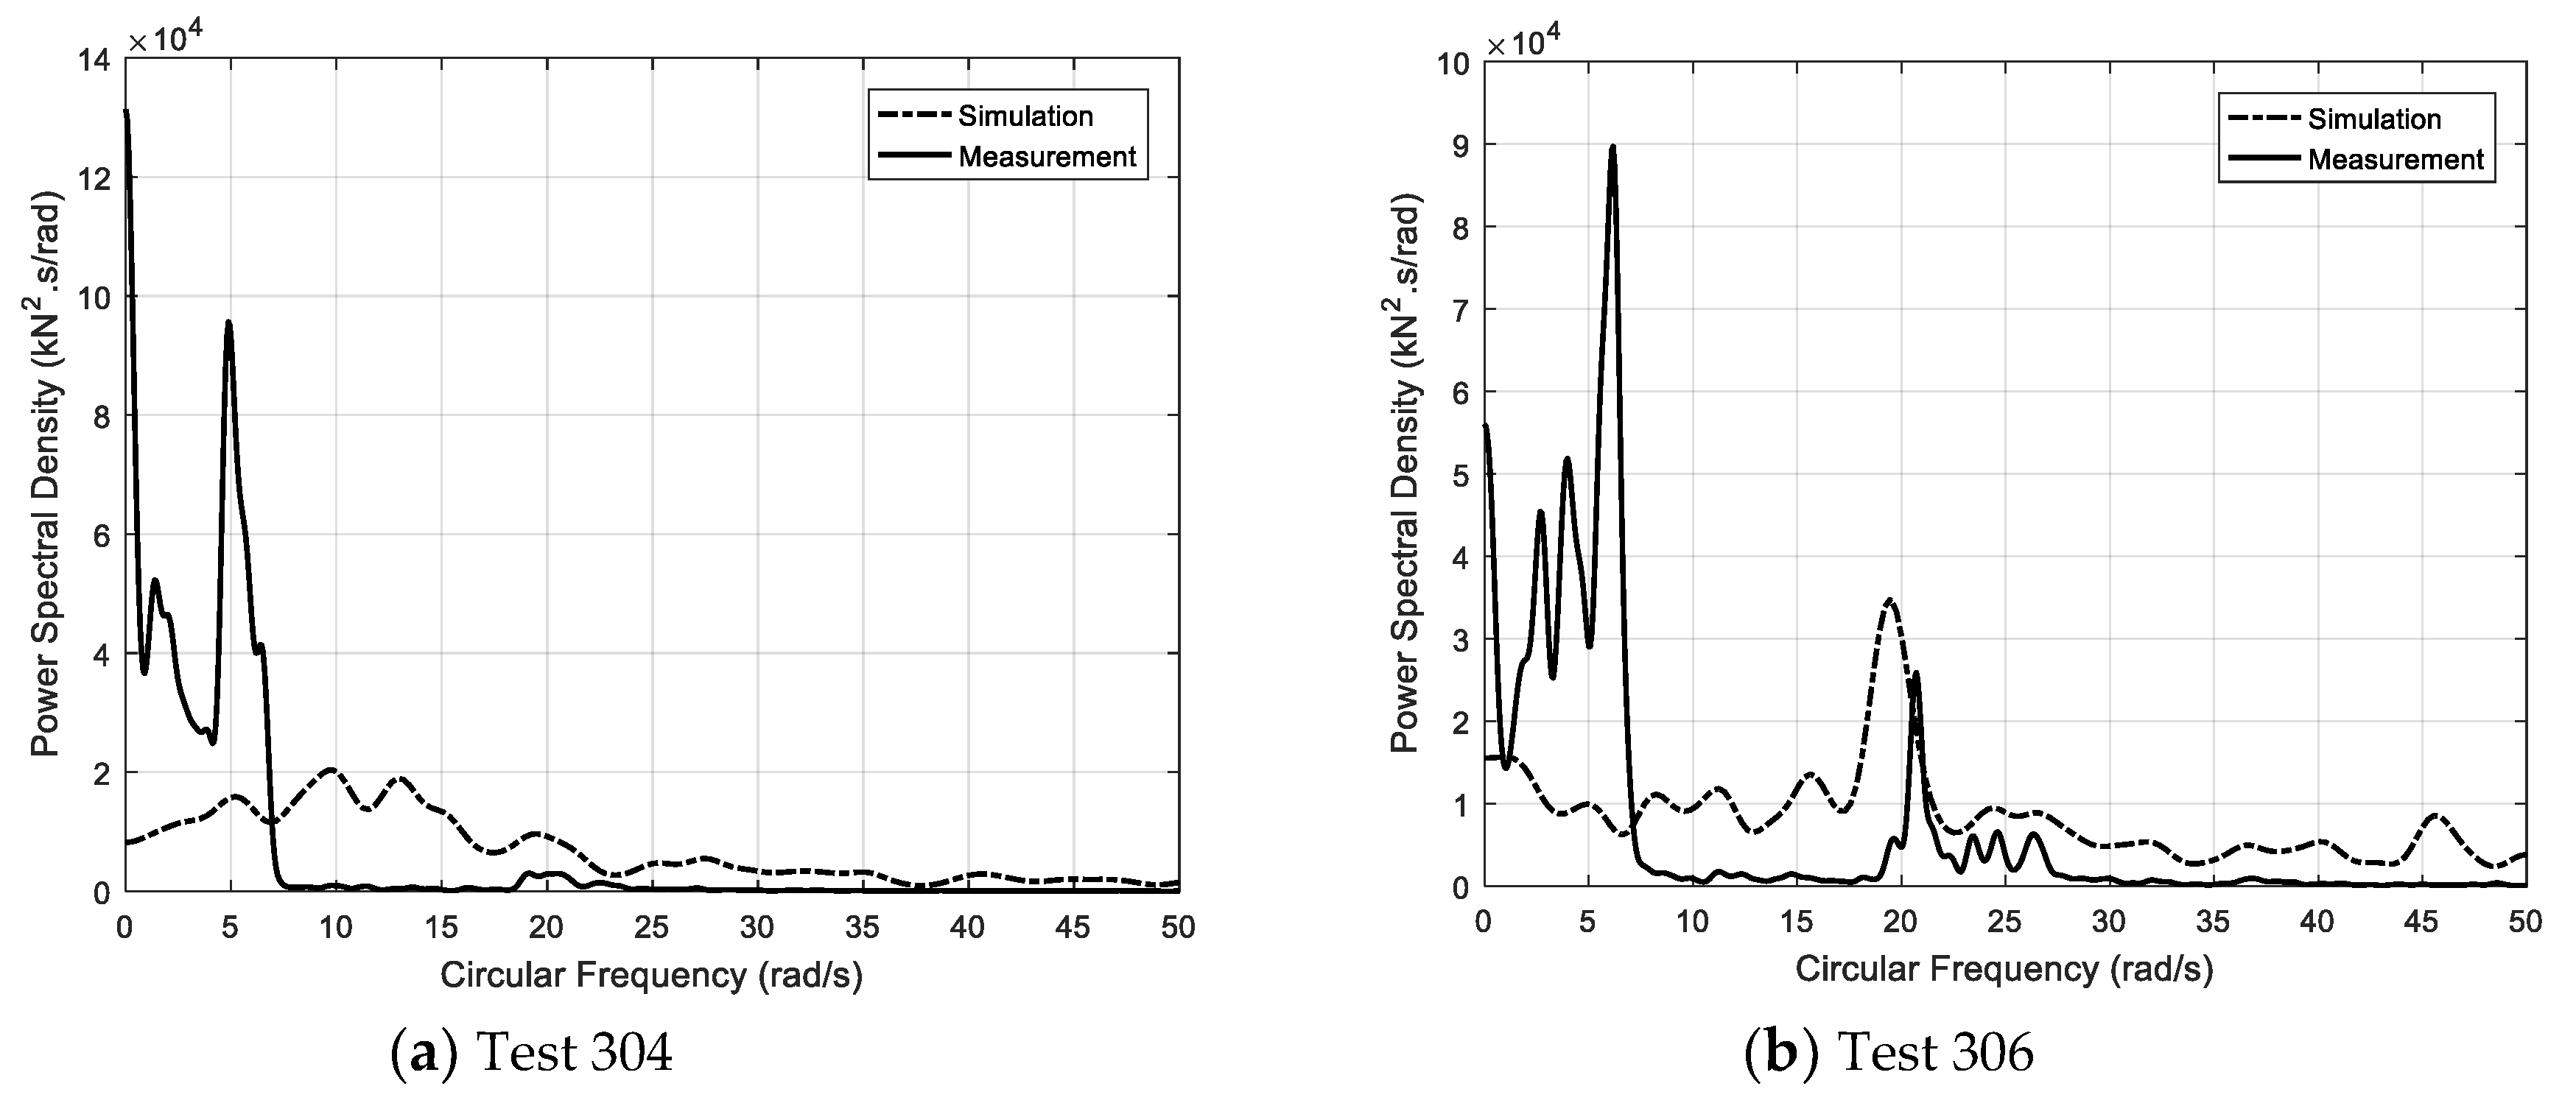
Figure 22. The simulated force spectrum is broad-banded comparison to the measured force spectrum. The power spectral density of the simulated force at a low frequency is much lower than that of the measured force. When looking at the spectrum for test 304 in Figure 22a, it is clear that the energy is concentrated in a frequency range of less than 7 rad/s, and the dominant area is around 5.0 rad/s. Moreover, there exists a small amount of energy at around 20 rad/s. As the ice speed increases to 1.2 m/s, the main frequency increases slightly to 5.8 rad/s in Figure 22b. In addition, the vibration is clearly triggered at a higher frequency of 21 rad/s. This phenomenon could be also found by studying the measured data for tests 404 and 406 in Figure 22c,d. The main energy tends to shift from a low frequency range to a high range.

4. Discussion

To summarize, the current model gives a reasonable prediction of maximum loads. The general trend of ice force simulation is consistent with measurement. However, there exists some shortcomings that needs attention. The first shortcoming is that the time interval between neighboring peaks is smaller in the simulation than in the experiment. This result means that the dynamics of ice loads are overestimated in the present numerical program, and the width of the simulated force spectrum is relatively broad. Moreover, there exists a discrepancy for the peak load distribution and power spectra of the ice load from the numerical simulation.
This result is primarily attributed to three reasons. First, the connection between the structure model and the carriage is ideally not rigid. The vibration of the structure model, as well as the carriage, may introduce measurement errors. If the rigidity of the wind turbine model is not high enough, high frequency components of ice force will be filtered out from the signals.
Second, the icebreaking pattern used in the present simulation is assumed to be an idealized arc as a part of circle. It is taken as normal that the broken ice wedge locally contacts the surface between the ice and the structure when fragmented from an intact ice sheet. However, the shape of the broken ice wedge needs to be slightly adjusted, according to Li et al. (2019), who pointed out that the observed geometry of the ice cusps during ship trials was oval instead of circular [41]. The ice breaking length looks large at the edges relative to the center. An analytical model, by solving a differential equation, was proposed to generate refined shapes for ice wedges. A more realistic ice wedge shape will generate a more precise contact area between the ice and structure and the ice breaking length, thus providing a better prediction.
Third, it is assumed in the present numerical model that ice crushing failure occurs simultaneously over ice thickness. This is idealized since ice properties vary from the top of the ice sheet to the bottom of the ice sheet. Ice is relatively strong on the top layer due to its exposure to cold air. When crushing with large sloped structure, it is this top layer with high strength that mainly resists the motion of the structure. Thus, it results in a slowly varying ice force until large scale ice failure occurs. The bottom of the ice sheet tends to fail easily and thus provides a vibrated ice force with a small magnitude attributed to its weak strength.
To extend the present numerical model, there are two ways to consider the nonlinear dynamics of ice force. First, the local ice crushing is presently understood as a constant ice crushing strength by contact area. The effective ice pressure also depends on the size of the ice-structure’s contact area [11]. A varying ice pressure as a function of the contact area should be considered to calculate local ice action, which could refine the nonlinear dynamics of ice force simulation. Second, ice properties across the ice thickness are important inputs in the present simulation. A constant value is used at present. Nonlinear ice properties over the ice thickness are expected to be introduced by using a 3D ice model.

5. Conclusions

In this paper, a numerical method is applied to calculate the ice force acting on the large sloped cone of a wind turbine. The non-simultaneous crushing failure against the vertical foundations and nearly vertical foundations of the wind turbine towers are considered. When the ice fails locally, the boundary of the intact ice sheet must be updated. By comparing th simulated and measured data, some conclusions can be drawn, as follows:
(1)
The present method can generally capture the main characteristics of the ice sheet–wind turbine foundation interaction process. The dynamics of ice loads are over predicted.
(2)
The proposed numerical tool shows a satisfactory prediction of maximum ice force for the vertical or large inclined structure of wind turbine towers. According to the comparison work, the difference between the model test and the numerical simulation is within 10%, which could be acceptable from an engineering standpoint.
(3)
However, there still exists a relatively large discrepancy for the mean and standard deviation. The main reasons for this discrepancy have been addressed.
(4)
The influence of ice drifting speed on maximum force cannot be neglected. The maximum force tends to ascend as the speed increases from very low to medium and then drops as the speed continues to increase. As the speed increases, the main energy tends to shift to a high frequency domain.
(5)
The effect of the diameter and slope angle of a structure ion’s maximum ice force is significant. The larger the diameter and slope angle is, the larger the maximum ice force becomes.
Further modifications with respect to the numerical model should be made. More validations against model tests are needed to increase the fidelity and reliability of the present model. An uncertainty analysis of the input parameters for the simulation should also be investigated.

Author Contributions

Conceptualization, L.Z.; methodology, L.Z.; software, L.Z.; validation, L.Z., S.D. and M.S.; formal analysis, L.Z.; investigation, L.Z.; resources, W.S.; data curation, J.G.; writing—original draft preparation, L.Z.; writing—review and editing, W.S.; visualization, L.Z.; supervision, L.Z.; project administration, L.Z.; funding acquisition, L.Z., W.S., and S.D.

Funding

This research was funded by the National Natural Science Foundation of China, grant number 51809124, 5181102016, 51709039; Natural Science Foundation of Jiangsu Province of China, grant number BK20170576; Natural Science Foundation of the Higher Education Institutions of Jiangsu Province of China, grant number 17KJB580006; State Key Laboratory of Ocean Engineering (Shanghai Jiao Tong University), grant number 1704 and 1807.

Conflicts of Interest

The authors declare no conflicts of interest.

References

  1. Shi, W.; Park, H.C.; Han, J.H.; Na, S.K.; Kim, C.W. A study on the effect of different modeling parameters on the dynamic response of a jacket-type offshore wind turbine in the Korean Southwest Sea. Renew. Energy 2013, 58, 50–59. [Google Scholar] [CrossRef]
  2. Jiang, Z.Y.; Karimirad, M.; Moan, T. Dynamic response analysis of wind turbines under blade pitch system fault, grid loss, and shutdown events. Wind Energy 2014, 17, 1385–1409. [Google Scholar] [CrossRef]
  3. Elias, S.; Matsagar, V.; Datta, T.K. Along-wind response control of chimneys with distributed multiple tuned mass dampers. Struct. Control. Health Monit. 2019, 26, e2275. [Google Scholar] [CrossRef]
  4. Banerjee, A.; Chakraborty, T.; Matsagar, V. Stochastic Dynamic Analysis of an Offshore Wind Turbine Considering Frequency-Dependent Soil–Structure Interaction Parameters. Int. J. Struct. Stab. Dyn. 2018, 18, 1850086. [Google Scholar] [CrossRef]
  5. Banerjee, A.; Chakraborty, T.; Matsagar, V. Dynamic analysis of an offshore monopole foundation used as heat exchanger for energy extraction. Renew. Energy 2019, 131, 518–548. [Google Scholar] [CrossRef]
  6. Banerjee, A.; Chakraborty, T.; Matsagar, V. Evaluation of possibilities in geothermal energy extraction from oceanic crust using offshore wind turbine monopoles. Renew. Sustain. Energy Rev. 2018, 92, 685–700. [Google Scholar] [CrossRef]
  7. Ren, Z.; Skjetne, R.; Gao, Z. A crane overload protection controller for blade lifting operation based on model predictive control. Energies 2019, 12, 50. [Google Scholar] [CrossRef]
  8. Ren, Z.; Skjetne, R.; Jiang, Z.; Gao, Z.; Verma, A.S. Integrated GNSS/IMU hub motion estimator for offshore wind turbine blade installation. Mech. Syst. Signal Process. 2018, 123, 222–243. [Google Scholar] [CrossRef]
  9. Dempsey, J.; Palmer, A.; Sodhi, D. High pressure zone formation during compressive ice failure. Eng. Fract. Mech. 2001, 68, 1961–1974. [Google Scholar] [CrossRef]
  10. Johnston, M.; Croasdale, K.R.; Jordaan, I.J. Localized pressures during ice-structure interaction: Relevance to design criteria. Cold Reg. Sci. Technol. 1998, 27, 105–117. [Google Scholar] [CrossRef]
  11. Sanderson, T. Ice Mechanics, Risk to Offshore Structures; Graham & Trotman: London, UK, 1988. [Google Scholar]
  12. Yue, Q.J.; Guo, F.; Kärnä, T. Dynamic ice forces of slender vertical structures due to ice crushing. Cold Reg. Sci. Technol. 2009, 56, 77–83. [Google Scholar] [CrossRef]
  13. Gürtner, A.; Bjerkas, M.; Kuhnlein, W.; Jochmann, P.; Konuk, I. Numerical simulation of ice action to a lighthouse. In Proceedings of the 28th International Conference on Ocean, Offshore and Arctic Engineering (OMAE), Honolulu, HI, USA, 31 May–5 June 2009. [Google Scholar]
  14. Bekker, A.T.; Sabodash, O.A.; Balakin, B.V. Numerical prediction of contact surface between hummock and ice fields for estimation of ice loads on structure. In Proceedings of the 23rd International Offshore and Polar Engineering Conference (ISOPE), Anchorage, AK, USA, 30 June–5 July 2013. [Google Scholar]
  15. Spencer, P.; Morrison, T.; Ausenco, C. Quantile regression as a tool for investigating local and global ice pressures. In Proceedings of the Offshore Technology Conference, Arctic Technology Conference, Houston, TX, USA, 5–7 May 2014. [Google Scholar]
  16. Xu, N.; Yue, Q.; Qu, Y.; Yuan, S.; Liu, X. Comparison and cause analysis of ice-induced structural vibration of upward and downward cones. In Proceedings of the 24th International Offshore and Polar Engineering Conference (ISOPE), Busan, Korea, 15–20 June 2014. [Google Scholar]
  17. Zhou, L.; Chuang, Z.; Ji, C. Ice forces acting on towed ship in level ice with straight drift. Part I: Analysis of model test data. Int. J. Nav. Archit. Ocean. Eng. 2018, 10, 60–68. [Google Scholar] [CrossRef]
  18. Zhou, L.; Gao, J.; Xu, S.; Bai, X. A numerical method to simulate ice drift reversal for moored ships in level ice. Cold Reg. Sci. Technol. 2018, 152, 35–47. [Google Scholar] [CrossRef]
  19. Zhou, L.; Gao, J.; Li, D. An engineering method for simulating dynamic interaction of moored ship with first-year ice ridge. Ocean. Eng. 2019, 171, 417–428. [Google Scholar] [CrossRef]
  20. Murray, J.; LeGuennec, S.; Spencer, D.; Yang, C.K.; Yang, W. Model tests on a spar in level ice and ice ridge conditions. In Proceedings of the 28th International Conference on Ocean, Offshore and Arctic Engineering (OMAE), Honolulu, HI, USA, 31 May–5 June 2009. [Google Scholar]
  21. Jefferies, M.; Rogers, B.; Hardy, M.; Wright, B. Ice Load Measurement on Molikpaq: Methodology and Accuracy. In Proceedings of the 21st International Conference on Port and Ocean Engineering under Arctic Conditions (POAC’11), Montréal, QC, Canada, 10–14 July 2011. [Google Scholar]
  22. Määttänen, M.; Marjavaara, P.; Saarinen, S.; Laakso, M. Ice crushing tests with variable structural flexibility. Cold Reg. Sci. Technol. 2011, 67, 120–128. [Google Scholar] [CrossRef]
  23. Gravesen, H.; Kärnä, T. Ice loads for offshore wind turbines in Southern Baltic Sea. In Proceedings of the 20th International Conference on Port and Ocean Engineering under Arctic Conditions (POCA’09), Luleå, Sweden, 9–12 June 2009. [Google Scholar]
  24. Heinonen, J.; Hetmanczyk, S.; Strobel, M. Introduction of ice loads in overall simulation of offshore wind turbines. In Proceedings of the 21st International Conference on Port and Ocean Engineering under Arctic Conditions (POAC’11), Montréal, QC, Canada, 10–14 July 2011. [Google Scholar]
  25. Mróz, A.; Holnicki-Szulc, J.; Kärnä, T. Mitigation of ice loading on offshore wind turbines: Feasibility study of a semi-active solution. Comput. Struct. 2008, 86, 217–226. [Google Scholar] [CrossRef]
  26. Karna, T.; Kolari, K. Mitigation of dynamic ice actions on offshore wind turbines. In Proceedings of the 3rd European Conference on Structural Control (3ECSC), Vienna, Austria, 12–15 July 2004. [Google Scholar]
  27. Yu, B.; Karr, D.G.; Sirnivas, S. Ice nonsimultaneous failure, bending and floe impact modelling for simulating wind turbine dynamics using FAST. In Proceedings of the ASME 2014 33rd International Conference on Ocean, Offshore and Arctic Engineering (OMAE), San Francisco, CA, USA, 8–13 June 2014. [Google Scholar]
  28. Shi, W.; Tan, X.; Gao, Z.; Moan, T. Numerical study of ice-induced loads and responses of a monopile-type offshore wind turbine in parked and operating conditions. Cold Reg. Sci. Technol. 2016, 123, 121–139. [Google Scholar] [CrossRef]
  29. Barker, A.; Timco, G.; Gravesen, H.; Vølund, P. Ice loading on Danish wind turbines: Part 1: Dynamic model tests. Cold Reg. Sci. Technol. 2005, 41, 1–23. [Google Scholar] [CrossRef]
  30. Wu, H.; Huang, Y.; Li, W. Experimental study on the ice load of large-diameter monopile wind turbine foundations. Ocean. Eng. 2018, 36, 83–91. [Google Scholar]
  31. Shkhinek, K.; Uvarova, E. Dynamics of the ice sheet interaction with the sloping structure. In Proceedings of the 16th International Conference on Port and Ocean Engineering under Arctic, Ottawa, ON, Canada, 12–17 August 2001; Volume 1, pp. 639–648. [Google Scholar]
  32. Zhou, L.; Riska, K.; Ji, C. Simulating transverse icebreaking process considering both crushing and bending failures. Mar. Struct. 2017, 54, 167–187. [Google Scholar] [CrossRef]
  33. ISO 19906. Petroleum and Natural Gas Industries-Arctic Offshore Structures; International Organization for Standardization: Geneva, Switzerland, 2010. [Google Scholar]
  34. Wang, S. A Dynamic Model for Breaking Pattern of Level Ice by Conical Structures. Ph.D. Thesis, Department of Mechanical Engineering, Helsinki University of Technology, Otaniemi, Finland, 2001. [Google Scholar]
  35. Su, B.; Riska, K.; Moan, T. A Numerical Method for the Prediction of Ship Performance in Level Ice. Cold Reg. Sci. Technol. 2010, 60, 177–188. [Google Scholar] [CrossRef]
  36. Hetenyi, M. Beam on Elastic Foundation; University of Michigan Press: Ann Arbor, MI, USA, 1946. [Google Scholar]
  37. George, D.A. River and Lake Ice Engineering; Water Resources Publications: Highlands Ranch, CO, USA, 1986. [Google Scholar]
  38. Frederking, R. Dynamic ice force on an inclined structure. In physics and mechanics of ice; Tryde, P., Ed.; IUTAM Symposium: Copenhagen, Danmark, 1980; pp. 104–116. [Google Scholar]
  39. Lau, M.; Malgaard, J.; Williams, F.M.; Swamidas, A.S.J. An Analysis of Ice Breaking Pattern and Ice Piece Size around Sloping Structures. Available online: https://www.google.com.tw/url?sa=t&rct=j&q=&esrc=s&source=web&cd=1&cad=rja&uact=8&ved=2ahUKEwjp1bH7xZfjAhWCM94KHVOIDEEQFjAAegQIBRAB&url=https%3A%2F%2Fwww.researchgate.net%2Fpublication%2F291993170_An_analysis_of_ice_breaking_pattern_and_ice_piece_size_around_sloping_structures&usg=AOvVaw2IjHLKgt4B8eez_8WPvhAp (accessed on 23 May 2019).
  40. Timco, G. The mechanical and morphological properties of doped ice: A search for a better structurally simulated ice for model ice basins. In Proceedings of the Port and Ocean Engineering under Arctic Conditions (POAC 79), Trondheim, Norway, 13–18 August 1979; Volume 1, pp. 719–739. [Google Scholar]
  41. Li, F.; Kotilainen, M.; Goerlandt, F.; Kujala, P. An extended ice failure model to improve the fidelity of icebreaking pattern in numerical simulation of ship performance in level ice. Ocean. Eng. 2019, 176, 169–183. [Google Scholar] [CrossRef]
Figure 1. Wind turbine in contact with wind and ice.
Energies 12 02608 g001
Figure 2. Loop of ice crushing force calculation.
Energies 12 02608 g002
Figure 3. Geometrical discretization of ice–structure interaction.
Energies 12 02608 g003
Figure 4. Ice–structure contact scenarios for the crushing process.
Energies 12 02608 g004
Figure 5. View of the ice–structure contact area.
Energies 12 02608 g005
Figure 6. Ice crushing failure and updated ice.
Energies 12 02608 g006
Figure 7. Configuration of model test [29].
Energies 12 02608 g007
Figure 8. Initial and final ice boundaries.
Energies 12 02608 g008
Figure 9. Simulated ice load for (a) test 105, (b) test 106, (c) test 107, and (d) test 108 in the time domain.
Energies 12 02608 g009aEnergies 12 02608 g009b
Figure 10. Numerical and measured ice force as a factor of ice speed.
Energies 12 02608 g010
Figure 11. Numerical and measured ice force as a factor of ice speed.
Energies 12 02608 g011
Figure 12. Weibull fitting of peaks of the ice force for test 105.
Energies 12 02608 g012
Figure 13. Sketch of the tested structures in full scale.
Energies 12 02608 g013
Figure 14. A static ice load experiment scenario for a 3 MW model test [30].
Energies 12 02608 g014
Figure 15. Experimental scenarios of non-simultaneous ice crushing at a mean waterline for test 306.
Energies 12 02608 g015
Figure 16. Time history of ice force from the measurement and simulation for test 304.
Energies 12 02608 g016
Figure 17. Time history of ice force from the measurement and simulation for test 306.
Energies 12 02608 g017
Figure 18. Time history of ice force from the measurement and simulation for test 404.
Energies 12 02608 g018
Figure 19. Time history of ice force from the measurement and simulation for test 406.
Energies 12 02608 g019
Figure 20. Maximum ice forces from the model test and simulation.
Energies 12 02608 g020
Figure 21. Weibull fitting of the simulated and measured peaks for tests (a) 304, (b) 306, (c) 404 and (d) 406.
Energies 12 02608 g021
Figure 22. Spectrum of simulated and measured ice force for tests (a) 304, (b) 306, (c) 404, and (d) 406.
Energies 12 02608 g022aEnergies 12 02608 g022b
Table 1. Test matrix and ice properties (in full scale).
Test No.ComplianceIce Thickness (m)Bending Strength (kPa)Crushing Strength (kPa)Ice Speed (m/s)
105rigid0.6557217420.2
106rigid0.6557217420.4
107rigid0.6557217420.71
108rigid0.6557217421.0
Table 2. Statistics for the simulation and model test data.
Test No.Ice Speed (m/s)Numerical SimulationModel TestRelative Error (%)
Mean (kN)Std (kN)Maximum (kN)Maximum (kN)
1050.2602286150113977.4
1060.4588264176218283.6
1070.71686300180318733.9
1081.0803367273025497.1
Table 3. Statistics for the shape and scale factor of tests 105–108.
Test No.kλ
1058.91281
1065.51252
1077.41475
1084.61807
Table 4. The main parameters of wind turbines in full scale.
Item3 MW Wind Turbine4 MW Wind Turbine
Diameter at waterline (m)5.305.83
Slope angle (deg)87.288.3
Table 5. Test matrix and measured ice conditions.
Test No.StructureIce Thickness (m)Bending Strength (kPa)Crushing Strength (kPa)Ice Drifting Speed (m/s)
3013 MW0.470421840.05
3023 MW0.3858421400.3
3033 MW0.4260421080.45
3043 MW0.457219800.6
3053 MW0.4661819640.9
3063 MW0.466421221.2
4014 MW0.470421840.05
4024 MW0.3858421400.3
4034 MW0.4260421080.45
4044 MW0.457219800.6
4054 MW0.4661819640.9
4064 MW0.466421221.2
Table 6. Comparison of the maximum ice load from the model test and simulation.
Test No.Test 304Test 306Test 404Test 406
StatisticsMeanStd.MaximumMeanStd.MaximumMeanStd.MaximumMeanStd.Maximum
Simulation (MN)1.100.613.411.290.693.111.410.613.851.360.643.70
Measurement (MN)1.150.603.491.590.603.191.580.854.251.710.723.76
Relative error (%)4.31.72.318.815.02.510.828.29.420.511.11.6
Table 7. Comparison of maximum ice load from the model test and simulation.
Test No.StructureModel Test (MN)Numerical Simulation (MN)Relative Error (%)
3013 MW2.973.114.71
3023 MW3.733.436.43
3033 MW3.893.617.20
3053 MW3.403.554.41
4014 MW2.902.842.07
4024 MW3.113.388.68
4034 MW3.683.446.52
4054 MW4.054.070.49
Table 8. Statistics for the shape and scale factors for tests 304, 306, 404, and 406 (estimated / Std. error).
Test No.SimulationMeasurement
kλkλ
3045.3/0.582480/754.3/0.542190/97
3068.1/0.842610/476.2/0.82520/73
4047.6/1.13080/926.8/0.943300/97
4068.5/1.22950/758.9/1.43090/85

