Article

The Concept of Dynamic Hosting Capacity for Distributed Energy Resources: Analytics and Practical Considerations

by
Tiago Elias Castelo de Oliveira
1,*,
Math Bollen
2,*,
Paulo Fernando Ribeiro
3,*,
Pedro M. S. de Carvalho
4,*,
Antônio C. Zambroni
3,* and
Benedito D. Bonatto
3,*
1
Electrical Energy Systems, Technological University of Eindhoven, 5612 AZ Eindhoven, The Netherlands
2
Energy Science, Luleå University of Technology, 971 87 Luleå, Sweden
3
Advanced Power Technologies and Innovations in Systems and Smart Grids Group, Federal University of Itajuba, Av. BPS, 1303, 37500-903 Itajuba, Brazil
4
Energy Scientific Area, Instituto Superior Tecnico, Av. Rovisco Pais 1049-001 Lisbon, Portugal
*
Authors to whom correspondence should be addressed.
Energies 2019, 12(13), 2576; https://doi.org/10.3390/en12132576
Submission received: 30 May 2019 / Revised: 1 July 2019 / Accepted: 2 July 2019 / Published: 4 July 2019

Abstract

:
The hosting capacity approach is presented as a planning, improving, and communication tool for electrical distribution systems operating under specific uncertainties, such as power quality issues, power stabilities, and reliability, among others. In other words, it is an important technique, when renewable sources are present, to answer the amount of power that is possible to supply to the system without trespassing power performance limits. However, the power flow in a distribution system, for instance, can change throughout time due to the penetration of distributed generation, as well as load consumption. Based on the dynamic nature existing in distribution grids nowadays, it is important to highlight that the hosting capacity should not be calculated in a specifically chosen time only, but must be analyzed throughout a period of time. Thus, this paper introduces an extended concept of hosting capacity in relation to an integrated impact of harmonic voltage distortion and voltage rise as a function of time for daily, weekly, monthly, or even yearly periods. This extended concept is named as Dynamic Hosting Capacity (DHC(t)). General aspects of DHC(t) are demonstrated via measured data on a photovoltaic system (PV) connected at a low-voltage (LV) side of a university building.

1. Introduction

The integration of distributed energy resources (DER) (for example, large amounts of roof-top photovoltaic systems—PV) is expected to increase as fast as predicted. Over the last years, there has been growing interest in DER installations at the low-voltage (LV) residential side and commercial sites, or even as solar farms, given the substantial price reductions that resulted from a stretched manufacturing capacity of PV modules [1,2,3]. Therefore, voltage rise problems have been described in the literature as the biggest problem of integration of a large amount of DERs [1,2,4,5]. Some studies regarding voltage rise and harmonic injection by DER in electrical networks have been carried out [6]. However, there are still some critical issues in control, protection, operation, and planning of distribution systems with high penetration of DER, due to change in network settings. Therefore, along with interruptions, voltage regulation, and voltage sags, voltage rise issues have become a serious and increasing concern in distribution systems [1,2,7].
In accordance with Reference [7], the maximum permissible voltage rise caused by a DER, is defined as “the one that brings the maximum voltage magnitude exactly to the regulatory overvoltage limit.” The maximum amount of generation that can be introduced without compromising the power quality indexes, while still ensuring the reliability of the system, is defined as hosting capacity [4,7,8,9,10]. Throughout the next few years, hosting capacity analysis is expected to become an important tool for planning and design improvement in distribution networks.
Several studies, for example References [8,9,10,11,12,13], have been carried out on the hosting capacity concept in many different paths. Those studies calculated the hosting capacity for distribution networks regarding voltage rises, caused by PV systems of new “prosumers” (producers and consumers at the same time). Different approaches have been applied to determine the hosting capacity value of existing distribution networks to evaluate increasing levels of DERs. The most recent evidence suggests statistical approaches, aiming at defining the optimal DER generation location and sizing [12,14,15,16]. The hosting capacity value has been estimated by large network operators, when evaluating the large integration number of renewable electricity production into the electrical networks under analysis [10]. It is important to highlight that what makes the hosting capacity method unique is the integrated use of power quality indexes in order to calculate a global value of hosting capacity, in order to provide system reliability. More recent studies [9,10,11,16,17,18,19] suggest that other performances indexes, such as power stability and philosophy protection, can be defined as well as mathematical-technical variables to be considered in the hosting capacity method. Other authors have analyzed different impacts and methods to define the hosting capacity concept.
One important issue is addressed in Reference [14] in which a methodology, based on an extension lead of the hosting capacity concept, is described and aimed at evaluating the effects of plug-in electric vehicles (PEVs). Moreover, an index called time-dependent hosting capacity was proposed by the authors, thus making it possible to incorporate in its formulation the charging duration of PEVs, as well as the grid’s constraints. Additionally, in Reference [17], studies have indicated that a high photovoltaic (PV) penetration can result in voltage rises as well as reverse power flow concerns in the distribution network. It shows that the hosting capacity for PV systems depends on various fundamental factors, such as the feeder’s voltage classification, PV allocation, short circuit levels, among others. The main focus of the author was to calculate the sensitivity of the hosting capacity to various factors affecting it. Moreover, a study from 2011 [9] addressed the hosting capacity as a “tool for distribution-system planning under uncertainties”. The tool was illustrated by estimating the ability of two low-voltage networks for rising amounts of customers with PV panels on their roofs or with EV chargers. Moreover, general aspects of the hosting capacity calculations have also been discussed, such as performance indices, limits, and calculation methods. Those aspects are discussed in relation to other phenomena as well (overcurrent, voltage unbalance, harmonic, among others) [4,10,11,13,14,18,19,20,21,22,23,24,25,26,27,28,29,30,31,32,33,34,35,36,37].
However, there has been little discussion on the integration of different disturbances characteristics in order to determine the hosting capacity value for the electrical system in a distribution or transmission level. The community has raised some concerns about a large integration scale of active power electronics [4,23,24,25,26,27,28] in the electrical systems, where it can result in further disturbances, such as voltage rise due to harmonic distortion [4], interharmonics or supraharmonics [10], among others. Thus, integrating different disturbances in order to find a global value of the hosting capacity has been discussed by different authors according to our previous state of art. Despite the integration of different electrical disturbances phenomena, one of the main issues what it is known about hosting capacity approach and analysis regarding the lack of considerations throughout different periods of time. For instance, another aspect addressed in current studies is the amount of capacitance and the number of inverters connected to the grid, both of which are expected to increase at all voltage levels in the grid through different values in different time windows [4]. Seemingly, those phenomena are variant in time, which means that its power quality indexes are changeable throughout a period of time. Consequently, the maximum amount of generation permissible to connect to the grid will change. Therefore, the dynamic behavior of the hosting capacity throughout a period of time is still not widely understood.
The aim of this research is to analyze the behavior of the levels of harmonic distortions and voltage profile over a specific period of time. These power injections will directly impact the voltage rise profile of the system, as well as the global hosting capacity value [4].
This paper provides a new approach to find a time-varying hosting capacity behavior through instants of time. This extended hosting capacity approach can better represent external and internal variations of the system along the time, as for example, the impact of voltage rise and harmonic distortion caused by non-linear loads and DERs. Thus, this paper is an overview and the applicability of the new methodology to determine the Dynamic Hosting Capacity (DHC(t)) for voltage rise due to power injections and harmonics introduced by the DERs [4].
DHC(t) is defined as the time-varying hosting capacity within a dynamic profile determined for a PV installation in a university building, as a practical example. Thus, it is important to highlight the real case in a university building was chosen, as a way to illustrate the discussed methodology presented in this paper.
This paper is divided into five sections. The Section 1 contains a brief overview of the distributed energy resources and their impact on distribution systems. The hosting capacity approach as well as its evolution and strategies concerning distribution systems are outlined in Section 2; a general concept is also presented in this section. In Section 3, a new hosting capacity approach is put forward, called Dynamic Hosting Capacity (DHC(t)) where a new methodology is described in order to bring further discussion in relation to time-variant hosting capacity. Finally, in Section 4 and Section 5, a case study is described in detail and its results discussed.

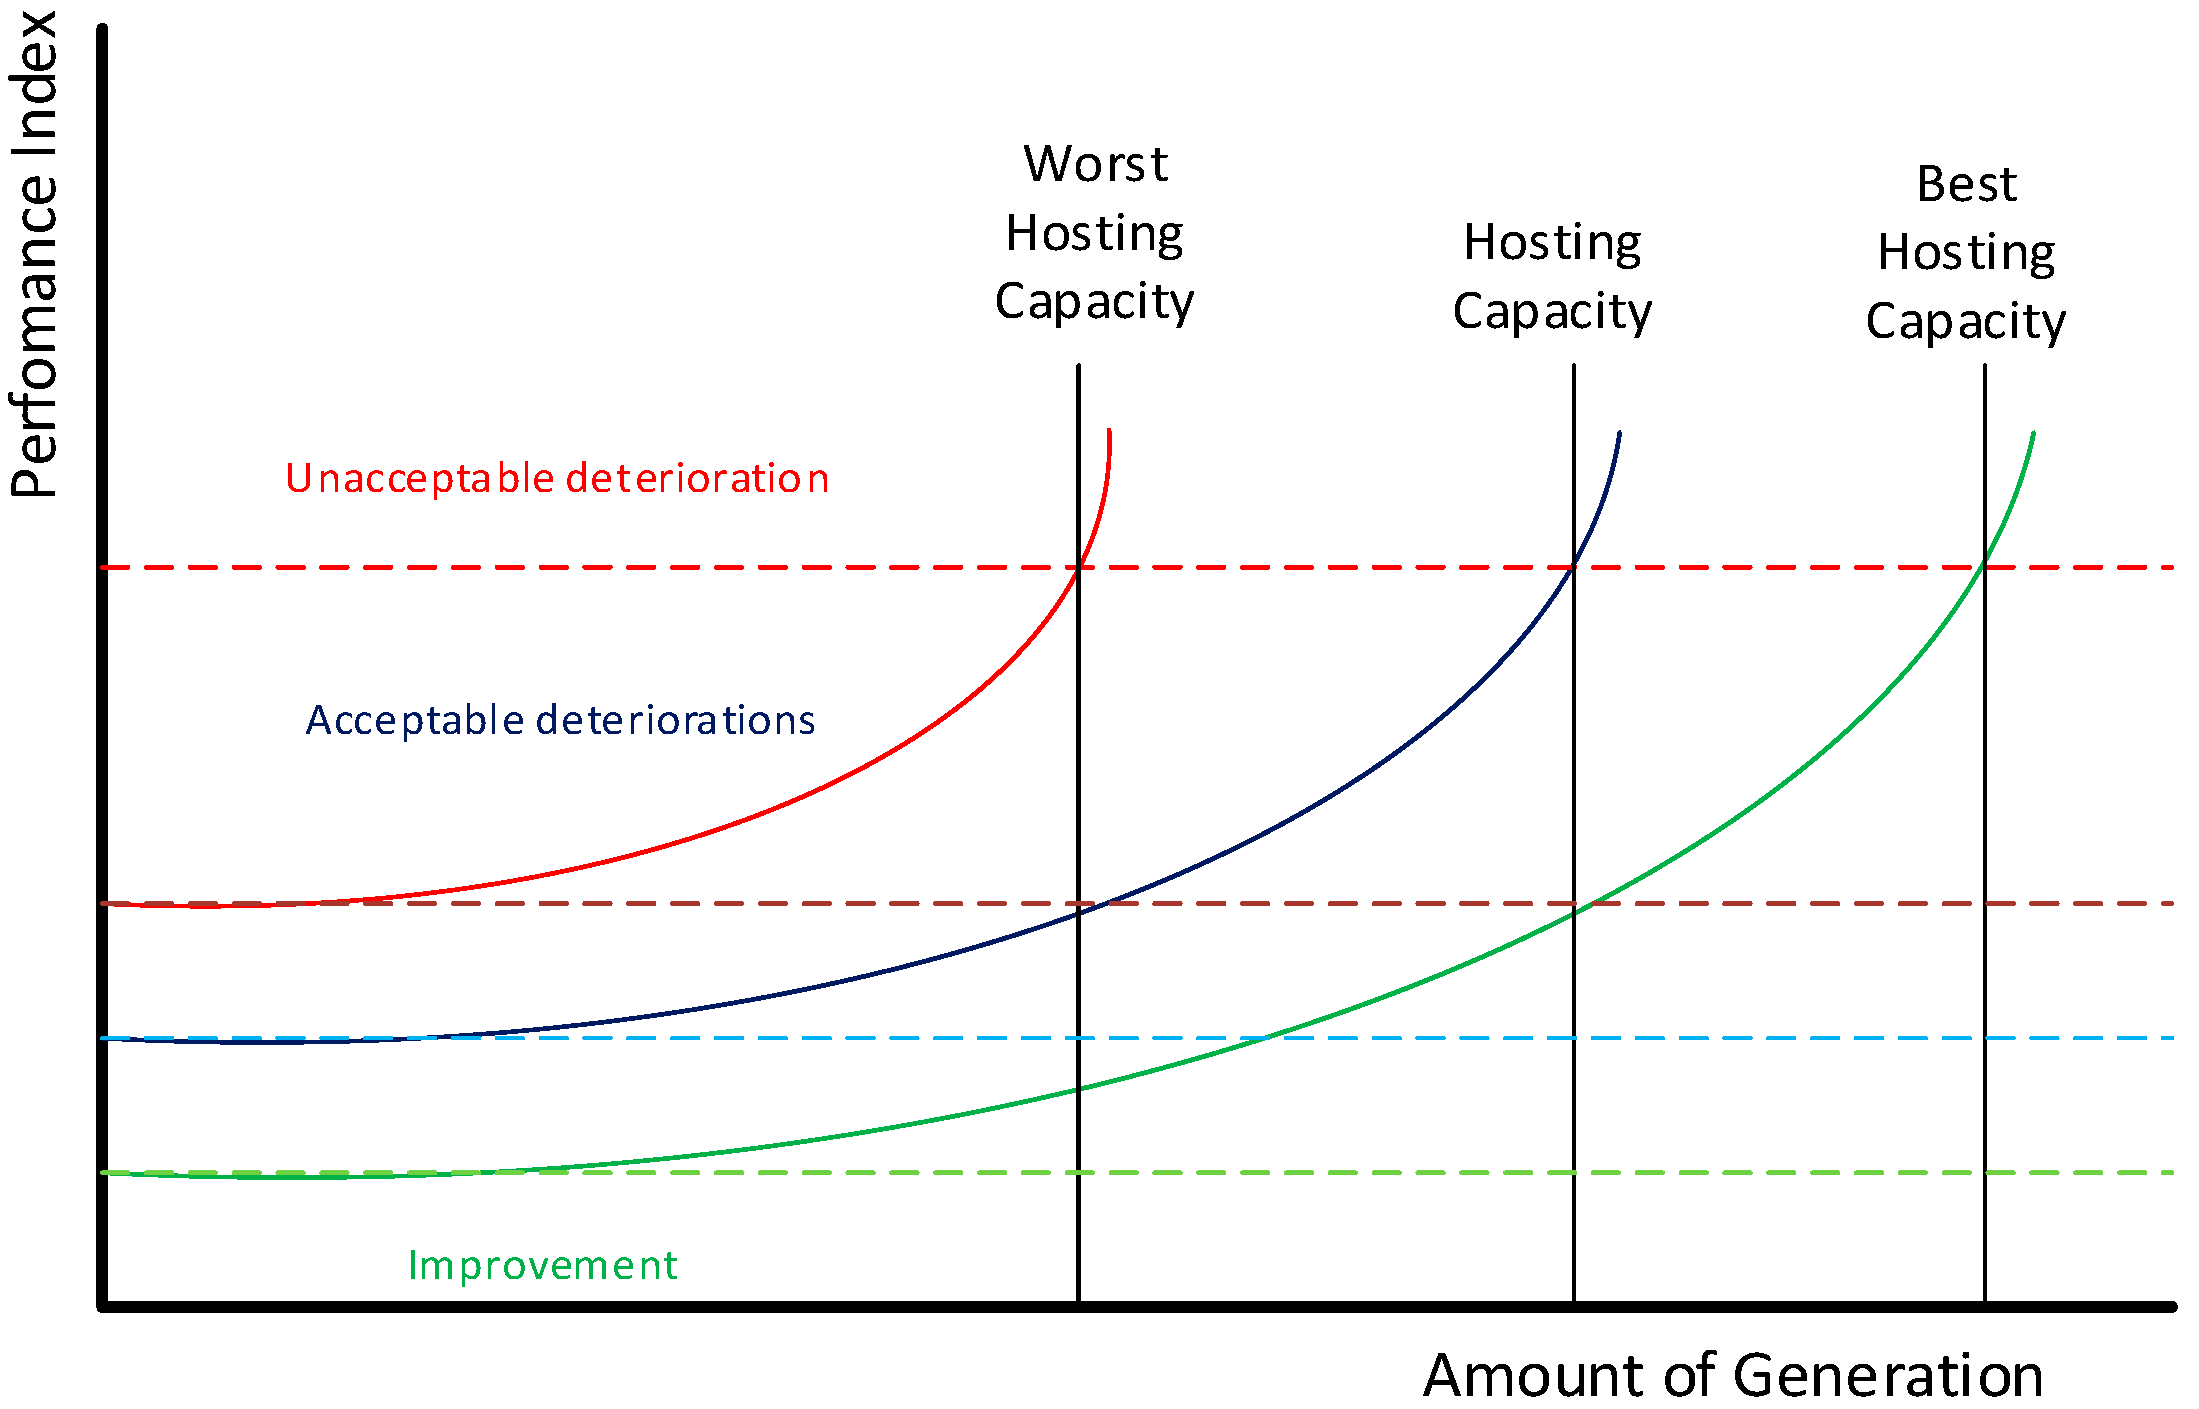
2. Hosting Capacity Approach
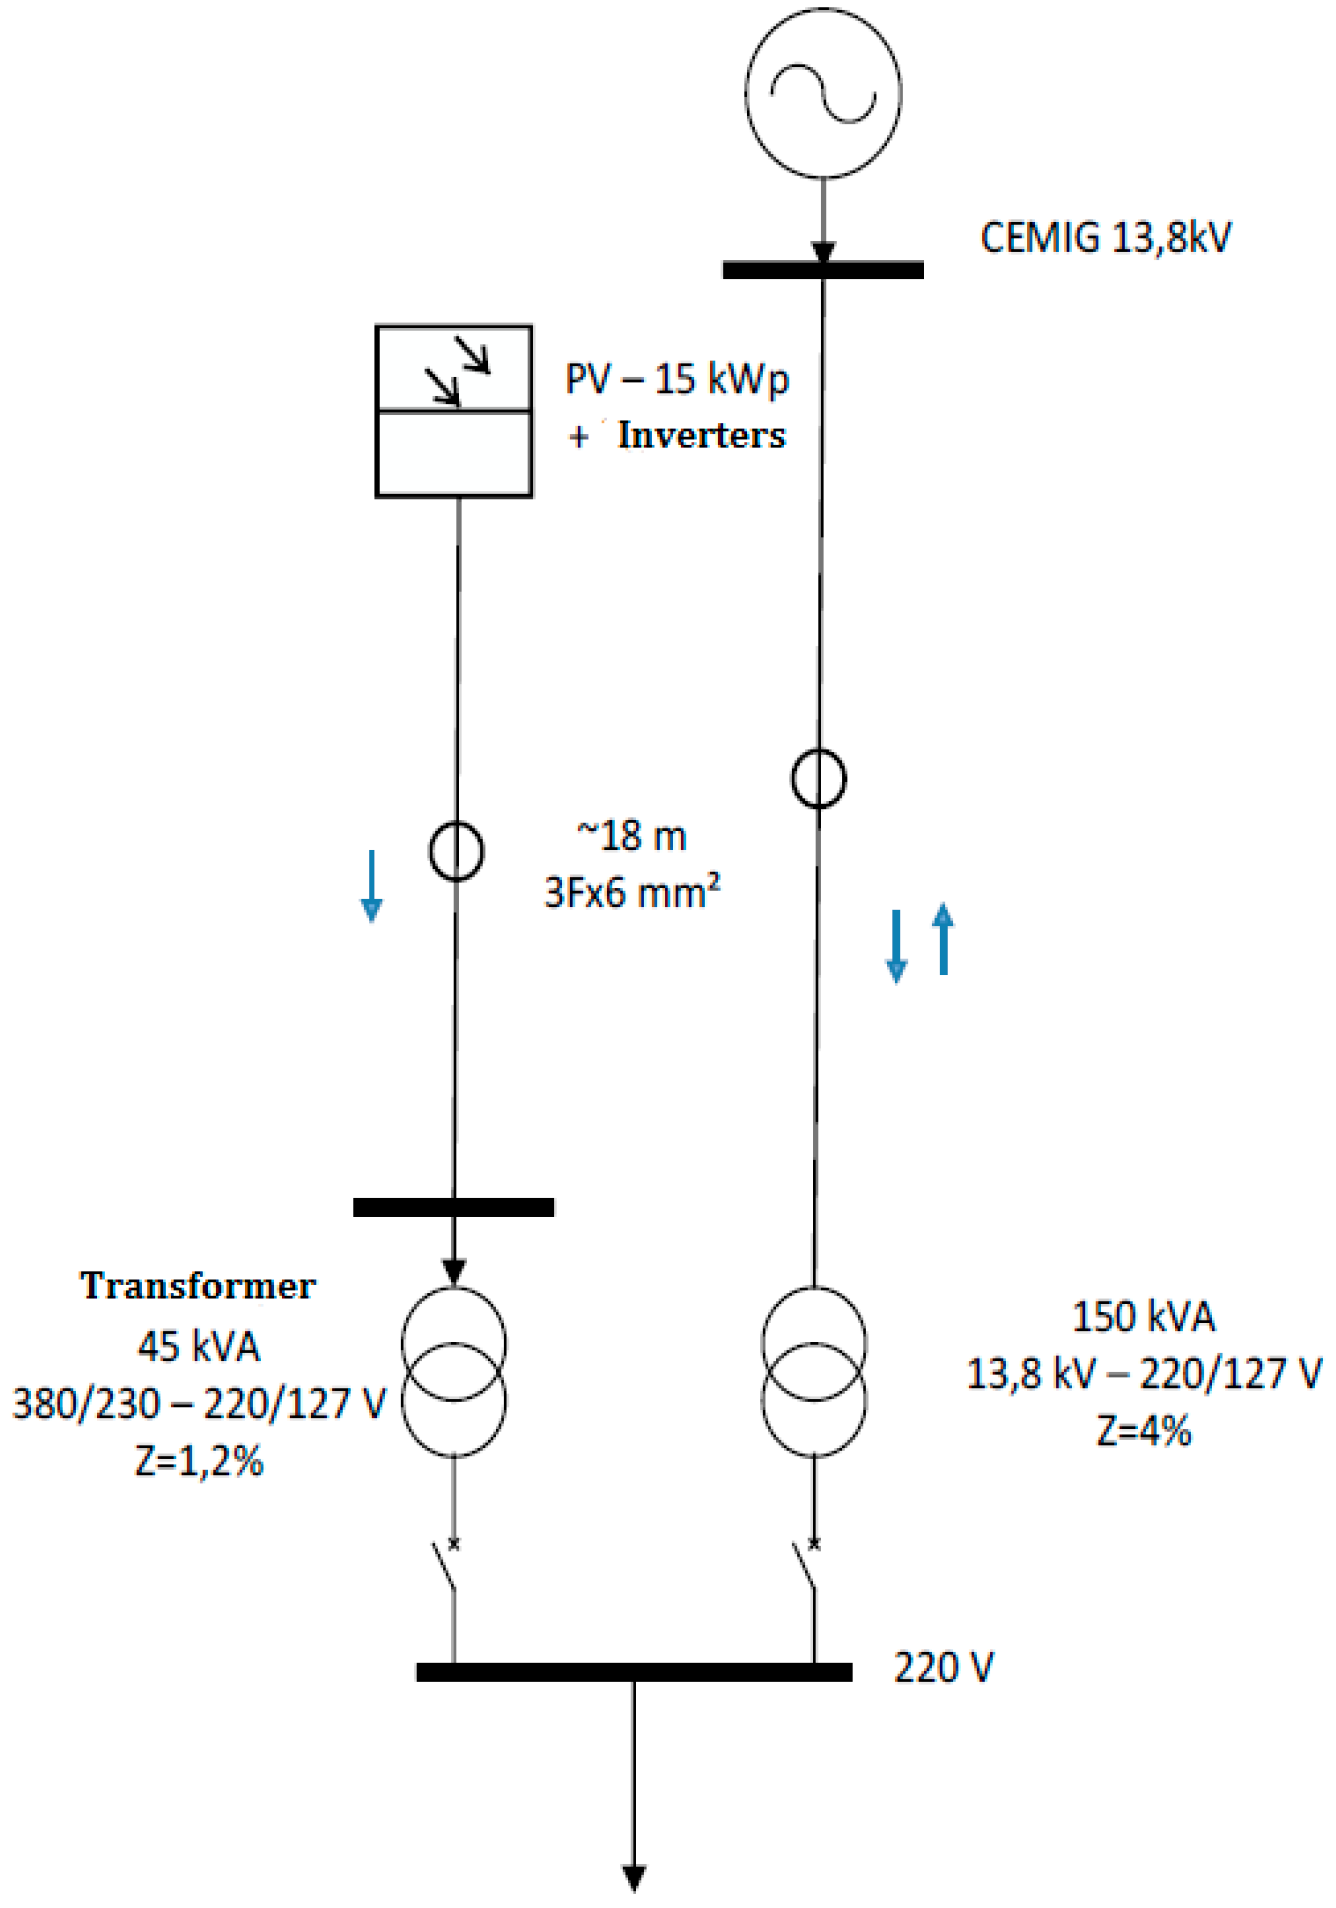
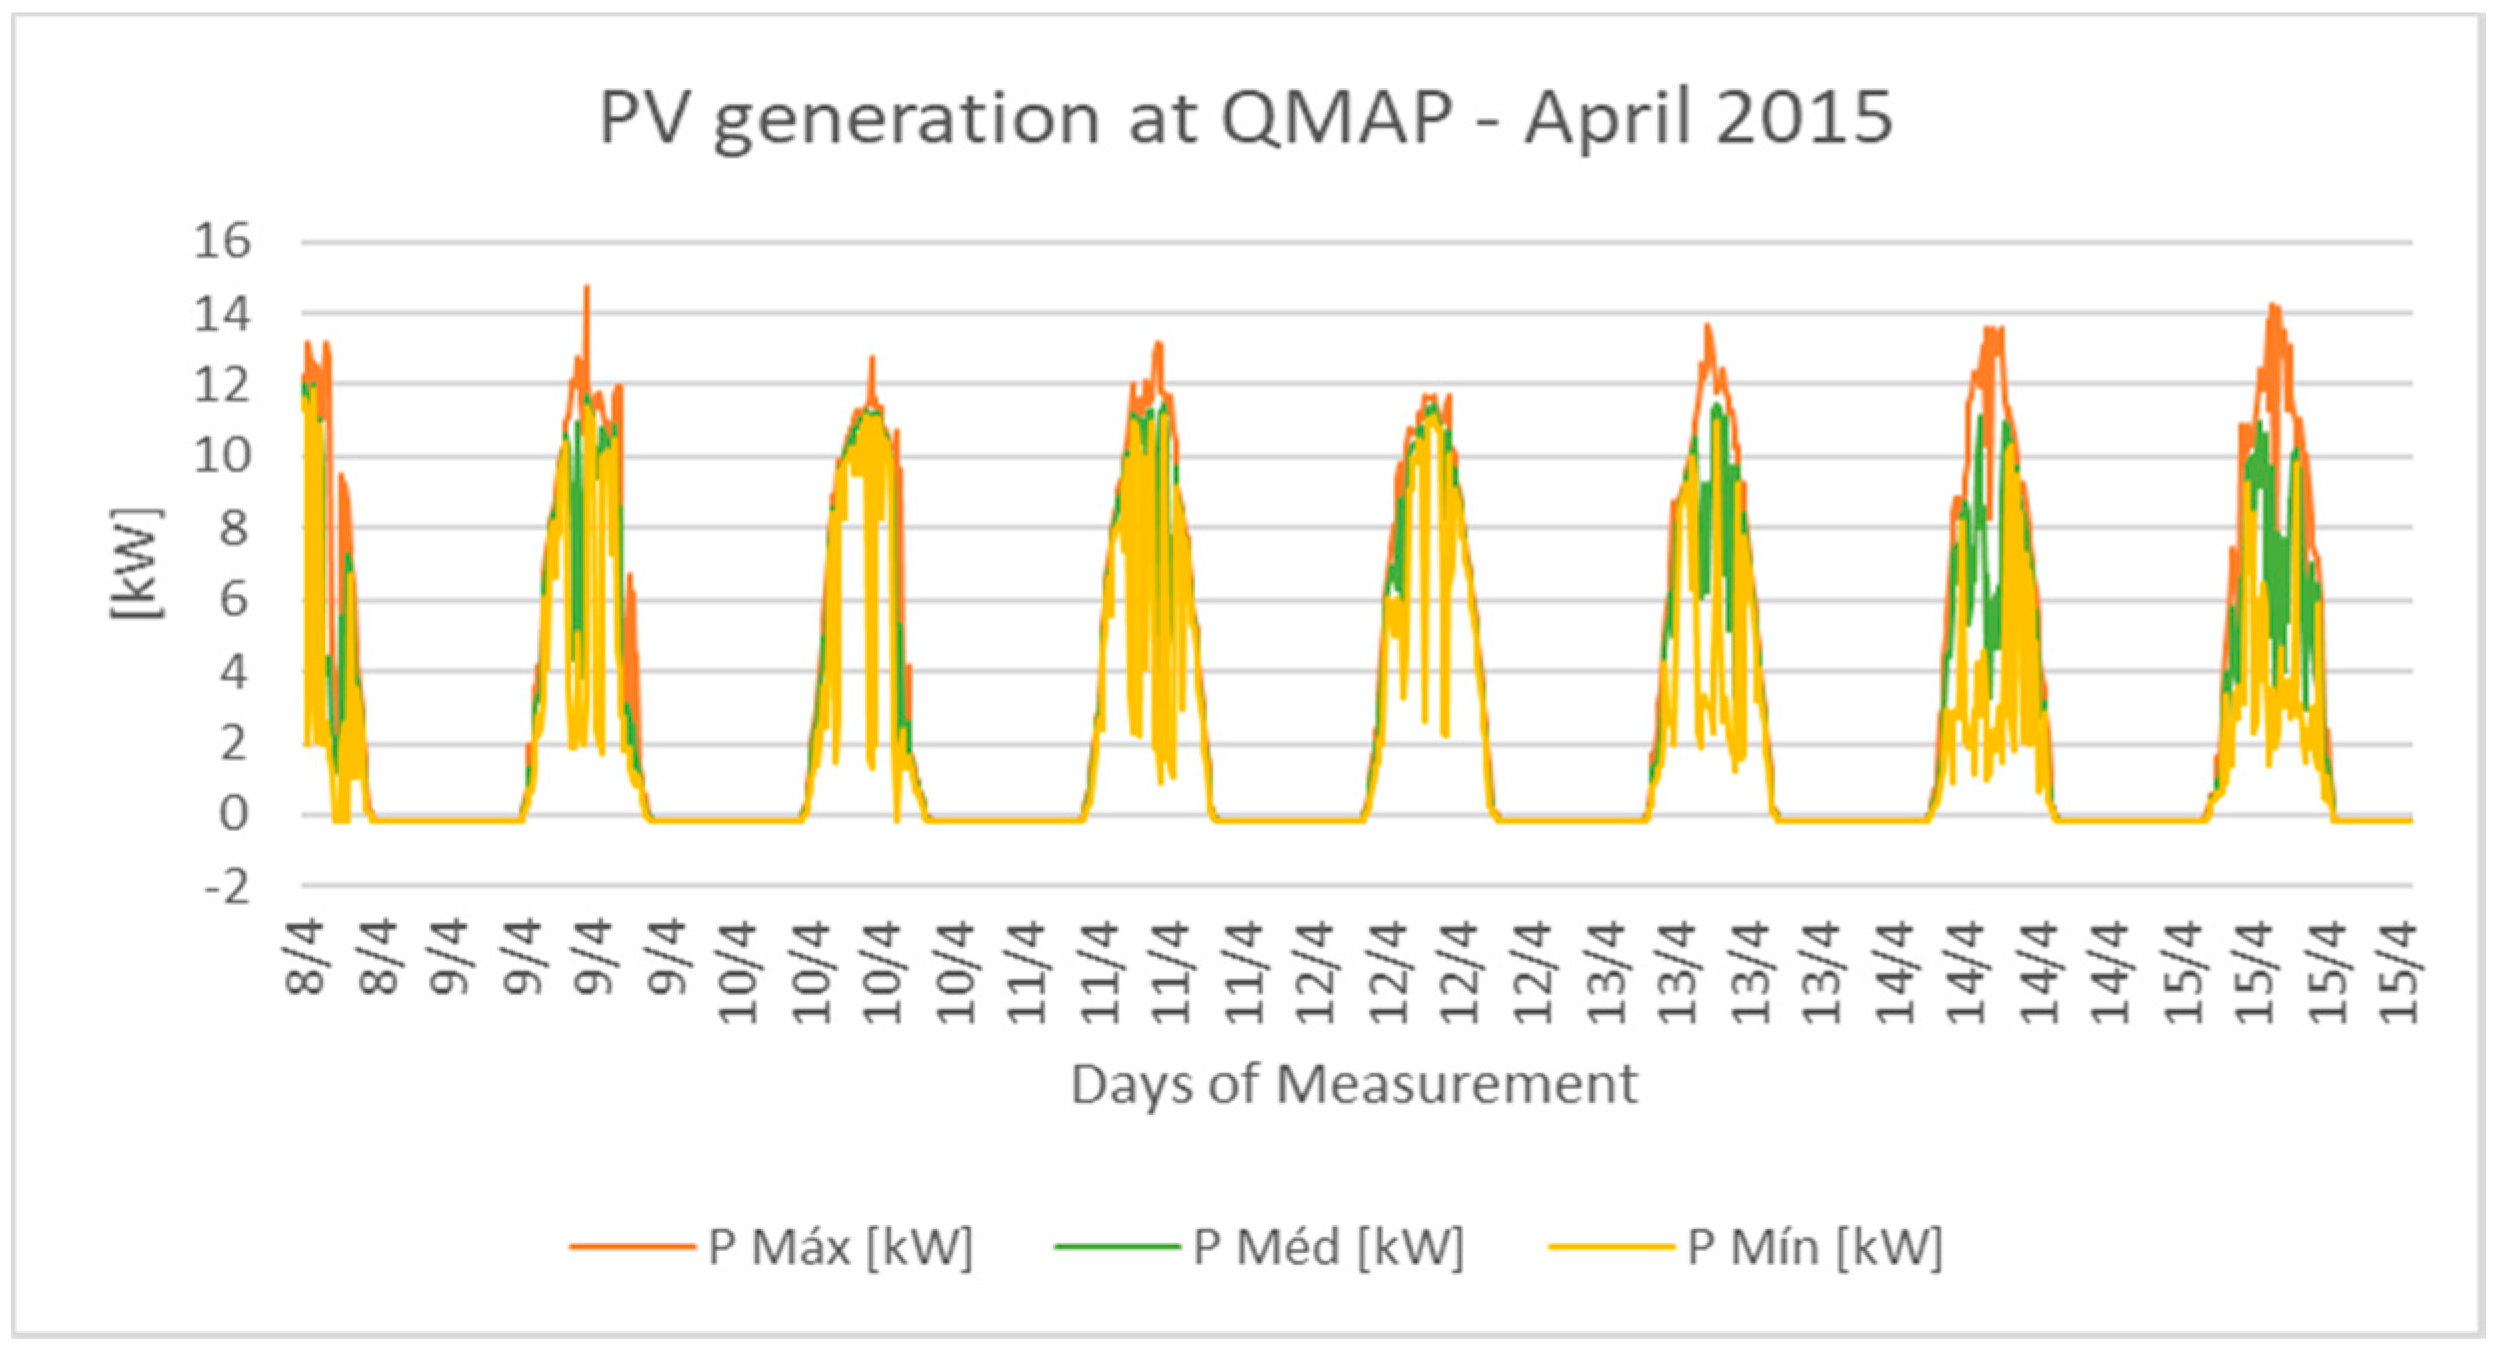
Initial studies on hosting capacity considered its contributions in order to apply those concepts into distribution systems. Moreover, its terminology according to Reference [6], “was brought about in 2004 during discussions within the integrated European EU—DEEP project”. Some preliminary work [10,13,22,29,37] involving the term hosting capacity was carried out in different fields, such as for internal servers, for watermarking of images and for the settlement of refugees, for instance. Since then, the hosting capacity concept has gained considerable attention as a part of the planning process, where the idea of developing better assessments of DER, involving power quality issues, is paramount [10].
Hosting capacity has been investigated as an important strategic instrument applied into distribution network systems due to its connection with distributed generation. Previous studies have focused on planning and improving a strategy using the hosting capacity approach as an instrument of calculation [3,6,7,8,9,10,11,12,13,14,15,16,24,26,27,28].
In Reference [6], the authors define the hosting capacity approach as a transparent tool in order to communicate with stakeholders concerning the grid to which the DER is connected. An increasing number of studies have reiterated that the hosting capacity is “defined as the maximum amount of new energy generation, as well as energy consumption, which can be connected to the electrical grid without endangering its reliability or compromising power quality” [3,4,5,6,7,8,9,10,16,17,18,20,21,22,23,24,25,26,27,28,29]. In other words, the hosting capacity is the amount of DER that can be integrated into a given system to the point where the performance index reaches its limits [4,8,9,10]. The maximum amount of generation can be classified as: The worst-hosting capacity, usual hosting capacity and the best-hosting capacity [4]. As shown in Figure 1, the curve range can be defined as the acceptable deterioration region between the best-hosting capacity ranges, which is attached to the best background distortion level of the system, and the worst-capacity range, which is attached to the worst background distortion level of the system, defines the region where it is possible to retain the system operational, free of uncertainties disturbances, while in respect to its limits index which depends on local standards.
It is strongly suggested that it is important to take into account uncertainties when performing hosting capacity studies, in order to determine the region referred to as deterioration region, shown in Figure 1, where it is possible to improve the DER production [4,10]. For example, a recent review of the literature on PV generation topic [10] discovered that uncertainties in its production can include: The type of installations, whether the configuration is a three-phase or a single-phase one, the orientation of the PV panel, the type and size of inverters, active and reactive controls implemented, among others.
In the literature, there are several examples of the hosting capacity approach into electrical systems. What it is known about hosting capacity, so far, is largely based on studies where the exact amount of generation is solicited, which can be set up considering power quality indexes. A lot is known about different methods to find a global number for the chosen systems under analysis.
Many studies have been published on the hosting-capacity-based planning approach mentioned previously. Those approaches are based on high PV penetration, which can cause overvoltage in the system. Moreover, there is even a risk of undervoltage, due to the no-load considerations, as well as a risk of voltage unbalance as a consequence of large single-phase connection devices. In this context, harmonic voltage distortions occur due to current injection by electronic devices, system existent background harmonics, electrical losses caused by heating—a consequence of overcurrent—among others [4,10,12,18].
In the traditional approach, hosting capacity is calculated considering each phenomenon described before, separately. This has proven to be effective, especially taking into account that hosting capacity approaches have received an enormous deal of awareness given their practicality and efficiency in determining the maximum amount of generation for distribution systems under DER’s connections.
However, in Reference [4], a new approach in order to calculate the hosting capacity regarding different phenomena was addressed, where two important phenomena in the power quality field are addressed into the same equation. In order to understand the local hosting capacity dependence on harmonic voltage distortion, the maximum active power injected by DER source can be assumed by Equation (1), assuming that the maximum of V h   is V g m a x ,   h V o h , where V g m a x ,   h is the voltage limit for each frequency imposed by standards, for instance, IEEE 519. It can be composed for all harmonic orders as in Equation (1),
P g m a x ,   h   =   V g m a x ,   h ( V g m a x ,   h V o h ) R f ( 1 + t a n ( φ ) h X f R f )
where
V g m a x ,   h   is the voltage magnitude limit for harmonic order h;
V o h   is the actual voltage magnitude of harmonic in relation to order h at the PCC;
φ is the arcos (PF) where the PF is the power factor measured at the PCC;
R f is the Thévenin’s resistance calculated at the PCC.
As mentioned by Reference [3], the modelled DER includes electronic components, which are capable of injecting harmonic currents. For PV systems, their inverters are represented as the sum of harmonic current sources in parallel at the PCC, which will impact the RMS voltage at the PCC [3], as given by Equation (2).
V R M S h = 1 N V h 2
The generated power, as a function of the RMS voltage, is given by Equation (3).
P g = V R M S 2 R f = ( V h 2 ) 2 R f = V h 2 R f
In accordance with Reference [3], the voltage rise due to the fundamental and the harmonic insertion/injection is analyzed and discussed with the aim of validating the previous discussed model. Several recommendations were presented for connecting PV generation, for instance, across other electrical network systems. Assuming Equations (1) and (3), the P g m a x is given by Equation (4).
P g m a x   =   1 R f h = 1 N V g m a x ,   h ( V g m a x ,   h V o h ) ( 1 + t a n ( φ ) h X f R f )  
Extensive work on the potential applications of an integrated hosting capacity approach is still lacing. However, some critical issues should be analyzed, as shown in Reference [3], which depicts the integration of two different performance index, which refers to voltage rise and harmonic voltage distortion, beneath background harmonic distortion existing at the PCC for different electronic loads or DGs.
As described before through the state of art, recent research has tended to focus on hosting capacity calculation at specific instants of time [30,32,33,37]. These references mostly show the hosting capacity related to voltage regulation and reverse power flow. However, it is necessary to also consider the impact of harmonics on the voltage regulation caused by renewables, according to Reference [4], as well as given by Equations (3) and (4).
Based on this fact, a dynamic harmonic injection is considered in order to properly assess the impact on the resultant voltage profile, and consequently, the global hosting capacity. It is important to consider that a dynamic harmonic injection is composed by the background harmonic distortion as well as distortions produced by the inverters (for PVs). Moreover, the resultant voltage harmonic vector can be represented by Equation (5).
V ( t ) o h =   V ( t ) B a c k g r o u n d h + V ( t ) I n v e r t e r s h
The fundamental characteristic of Dynamic Hosting Capacity (DHC(t)) allows to increase and improve the usual hosting capacity by applying a time-gap, which can describe its behavior against external and internal variations of the system, such as load conditions, background harmonic distortion, irradiation index, among others. Based on Equations (4) and (5), as mentioned before, the hosting capacity at the PCC can be defined as the sum of maximum power to be injected for each frequency [3,4] into the network system. Furthermore, in this analysis, time variation is set as a relevant parameter as defined in Equation (6).
P g m a x   ( t ) = h = 1 h P P V m a x ,   h ( t ) =   1 R f h = 1 N V g m a x ,   h ( V g m a x ,   h V o h ( t ) ) ( 1 + t a n ( φ ) h X f R f )  
It is important to underline that the maximum amount of power depends on the harmonic voltage values, which are defined for each instant of time. A generic graph of DHC(t) is shown in Figure 2. Moreover, the time resolution in order to find the global value of the hosting capacity and its profile can be defined as daily, weekly, monthly, or even yearly.
The maximum and minimum hosting capacity values do have analytical consequences to the grid. The minimum value will be the deterministic value used to describe the effectiveness of the grid, since the region under the minimum value can be considered unacceptable for working conditions. That is, the harmonic background at the PCC, as well as the voltage values, are almost crossing their respective limits imposed by standards. On the other hand, the maximum value determines that the region has the lowest power qualities indexes. But to achieve these values it is necessary to carry out conditioning improvements, which can be led by previous studies in the grid. This range of values suggests that there is a satisfactory work region defined between the minimum and maximum hosting capacity value. Thus, the region can also be defined as the region where DER systems will no longer work properly considering power quality issues. As a conclusion based on the previous fact, the larger the accepted region is, the more efficient the system performance will be.
This implies that the DHC(t) analysis is important to evaluate the time varying robustness conditions of the grid, considering DERs. These findings add to a growing body of literature on the hosting capacity concept and its derivations.

3. Case Study

In order to understand the DHC(t), a case study has been used according to [4,31,32]. The model was implemented using specific measurement data of the voltage RMS profile and harmonic spectrum, mainly. Power Quality monitoring equipment were used to record the RMS magnitude of the nodal voltage as well as the current injection at the 220 V bus, for one week in a row, with a 10 min time interval.
The studied system is composed of a 220 V feeder connected to a busbar, a 150 kVA transformer connected to 13.8 kV–220 V, and one PV system with 15 KW p (Solar panels + Inverter + autotransformer) [4,31,32]. The maximum PV generation is approximately 15 KW p , even though the maximum load for the considered building is 4 kW since it was not fully operational. The exceeding power supply other buildings in the campus through the 13.8 kV distribution feeder. The electric schematic is shown in Figure 3. Table 1 shows the values of the factors for the simulations.
In order to illustrate the calculation of DHC(t) using the maximum power capacity equation given in Equation (6), the voltage rise and harmonic source injection are based on measurement data of the voltage profile, harmonic injection, THD profile, frequency, and others. Therefore, two power quality analyzers were installed on the 220 V side of the transformer and of the autotransformer.
This seems to be a useful approach to get a weekly power quality measurement. Thus, the DHC(t) capacity can be calculated in order to define a hosting capacity profile considering the maximum amount of power calculated by Equation (6).

4. Results

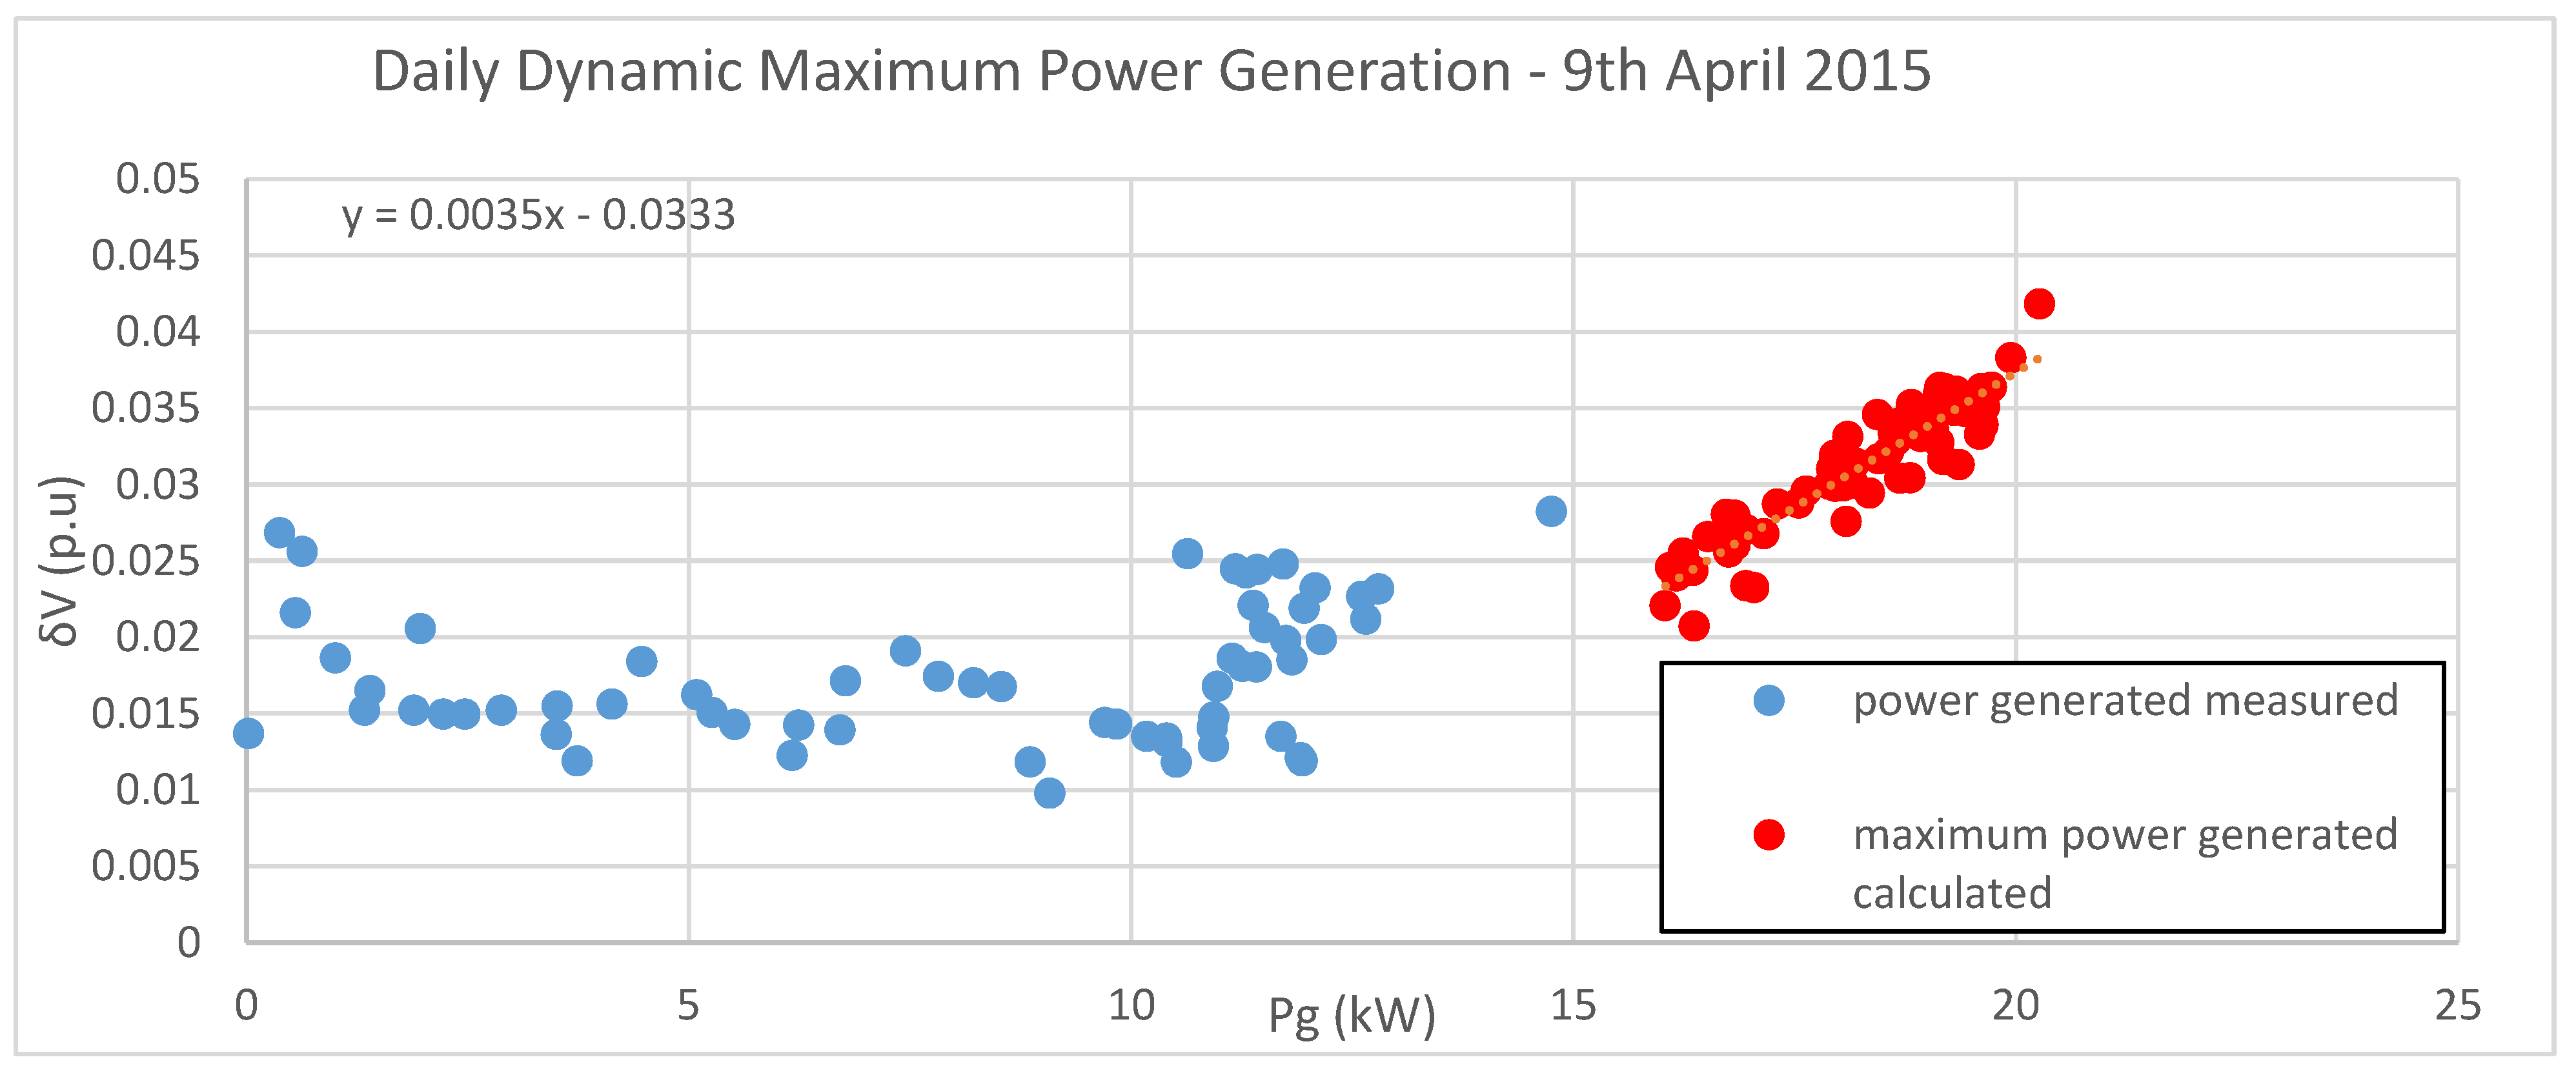
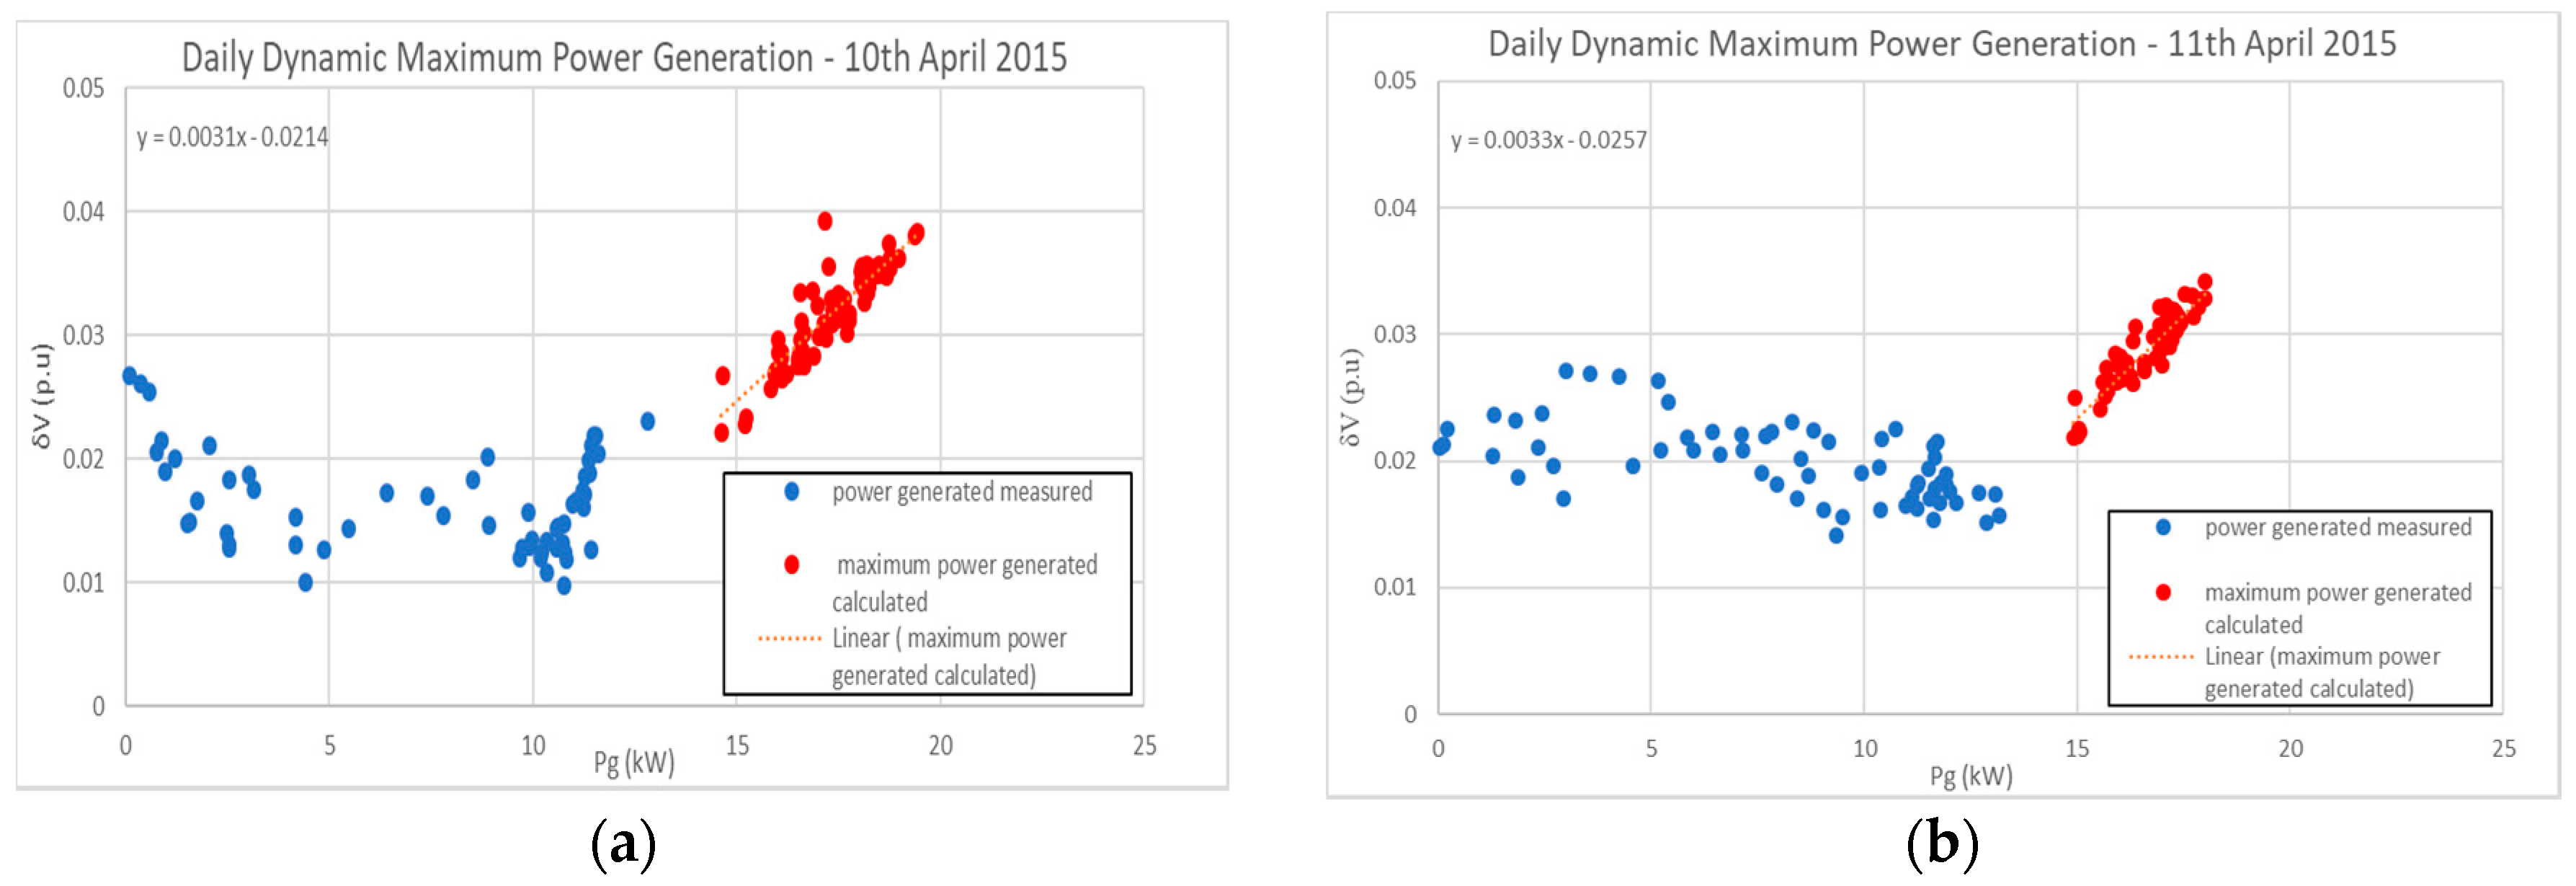
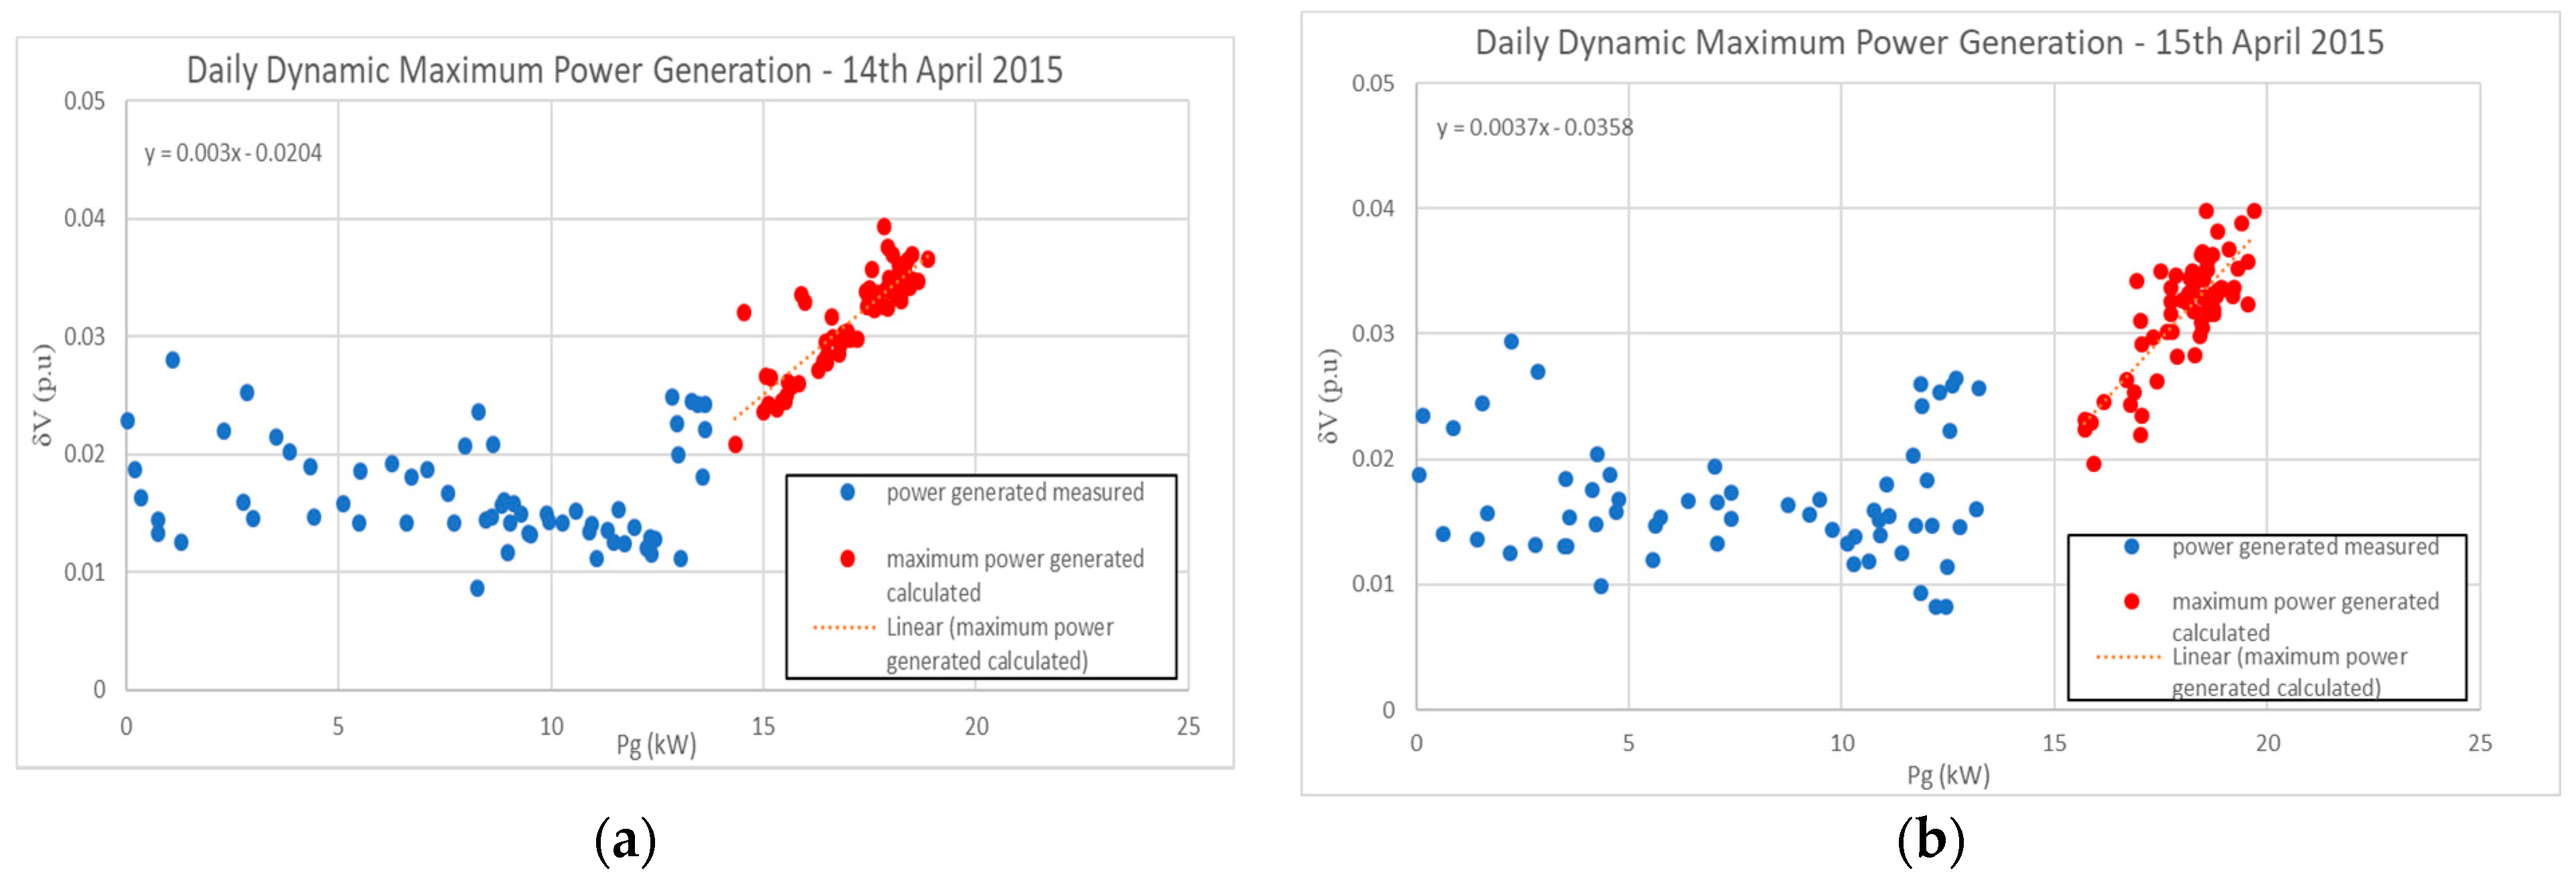
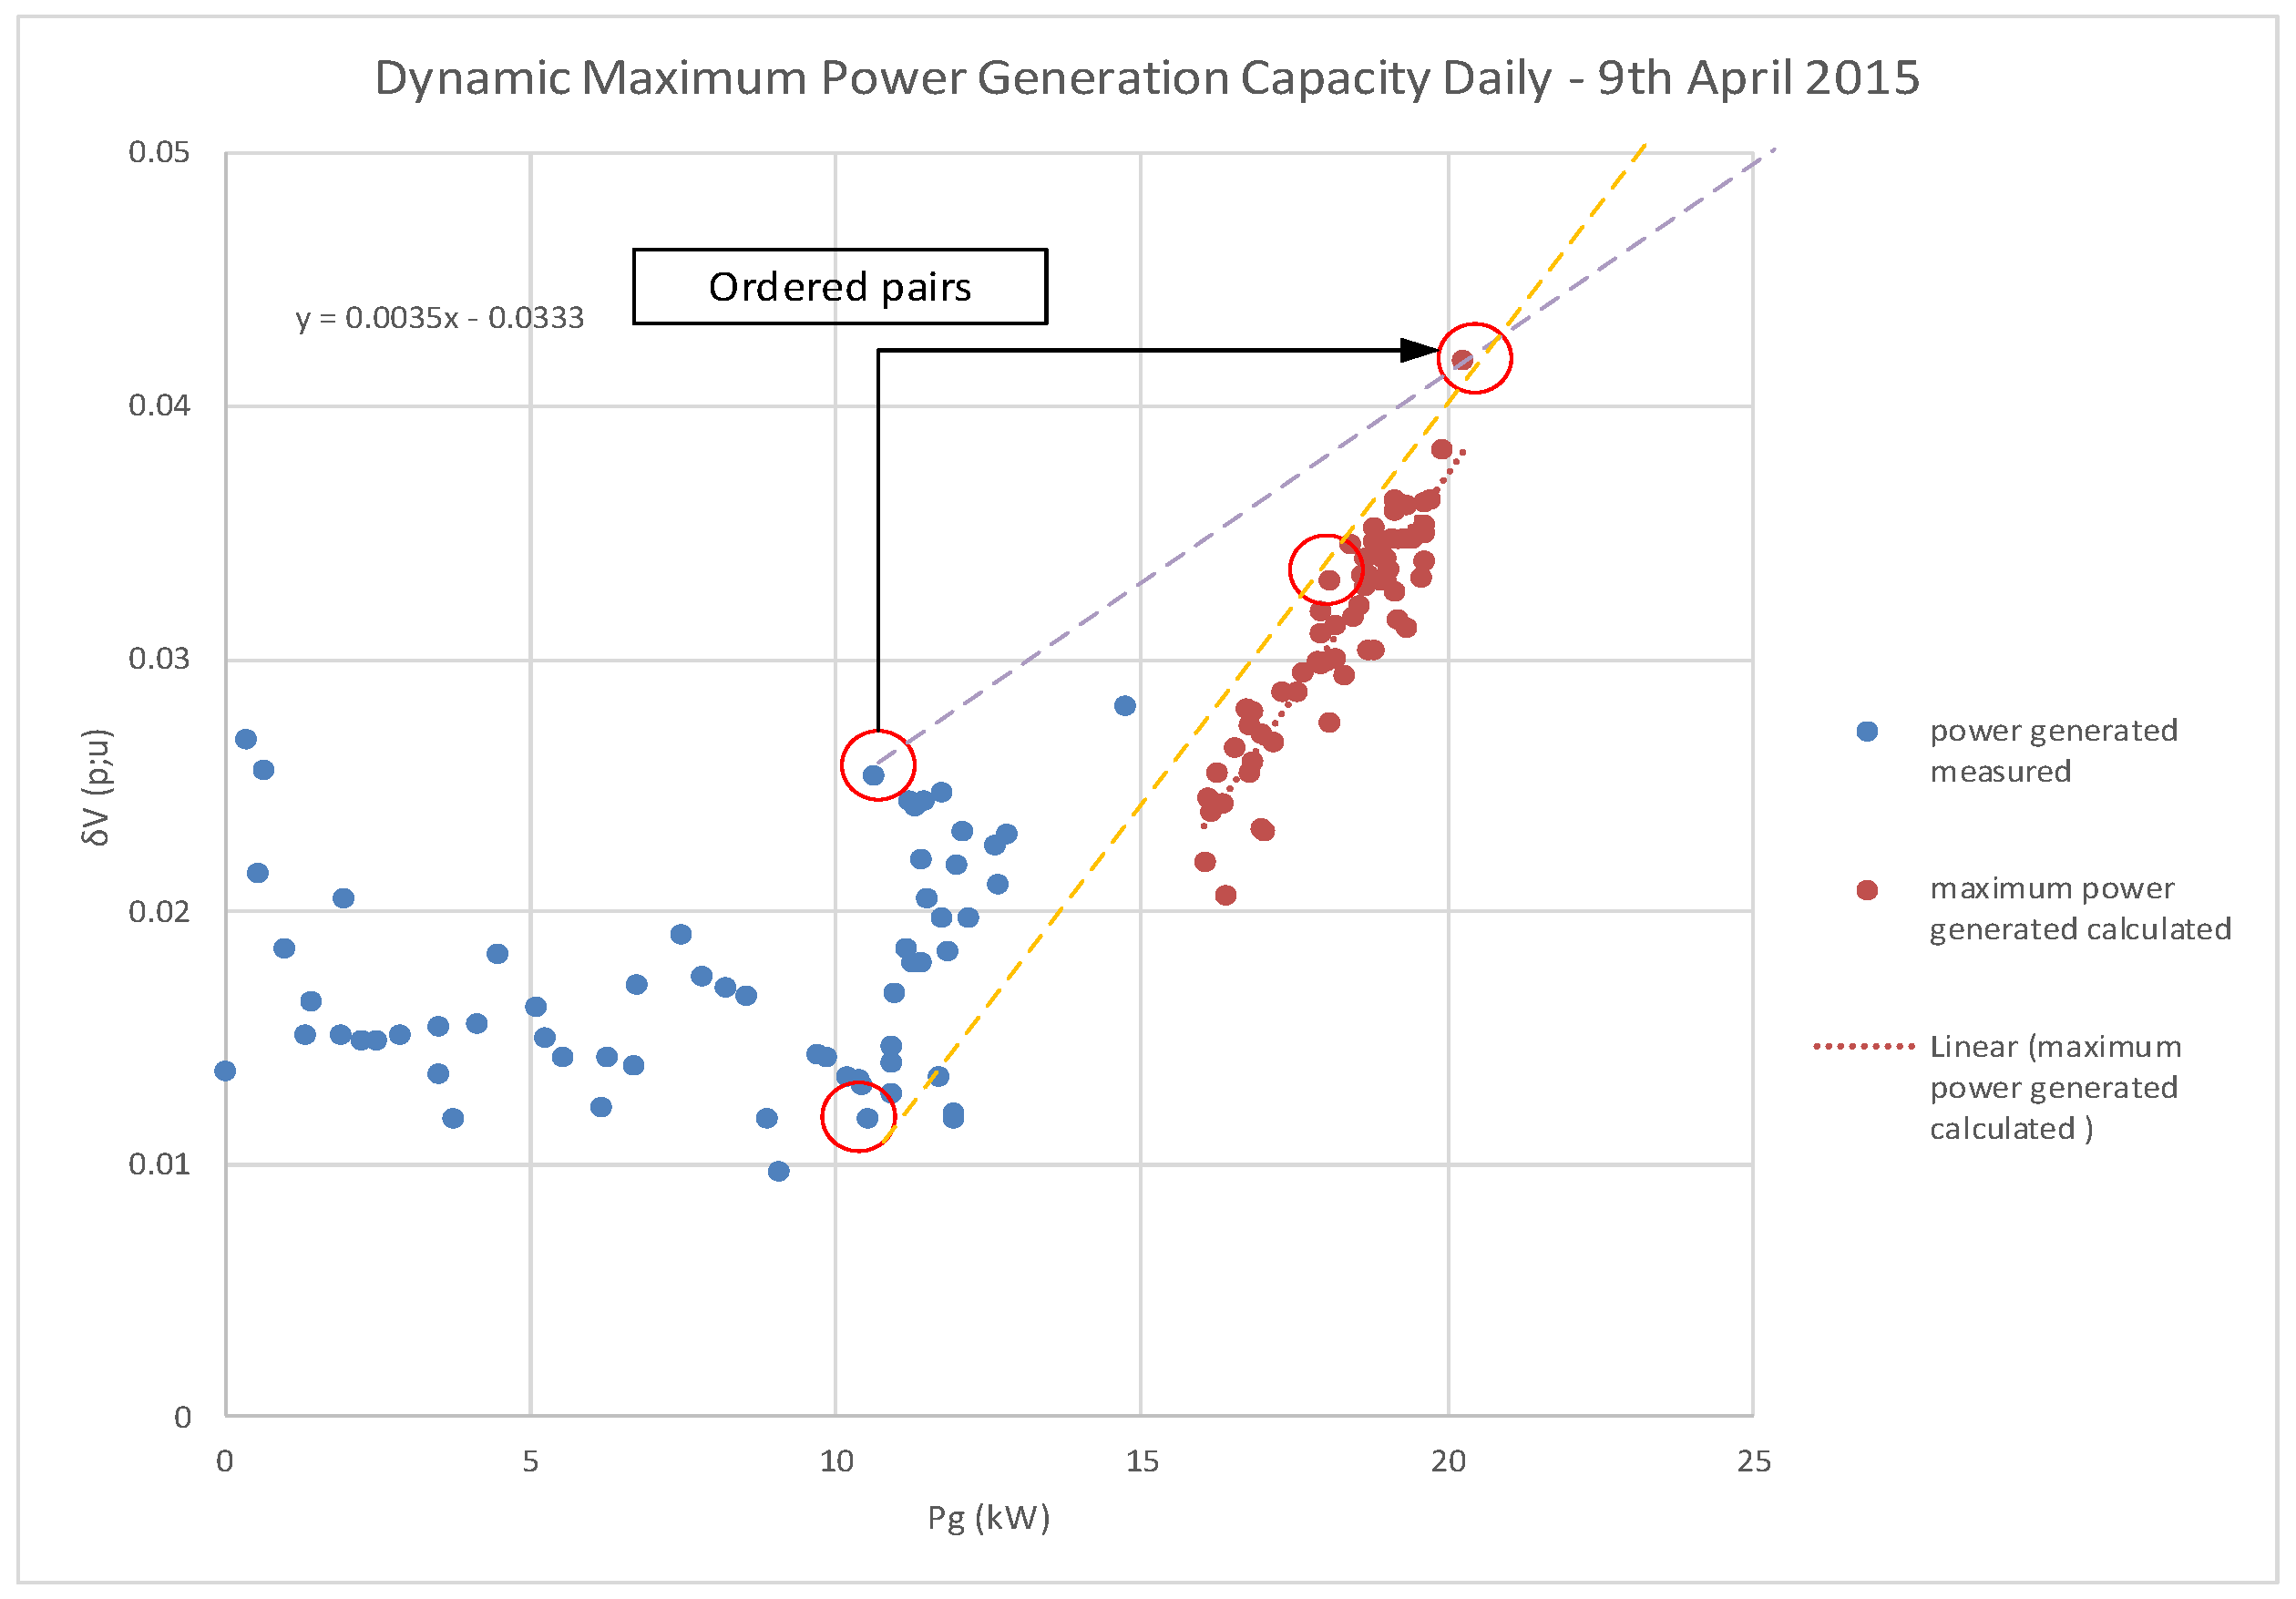
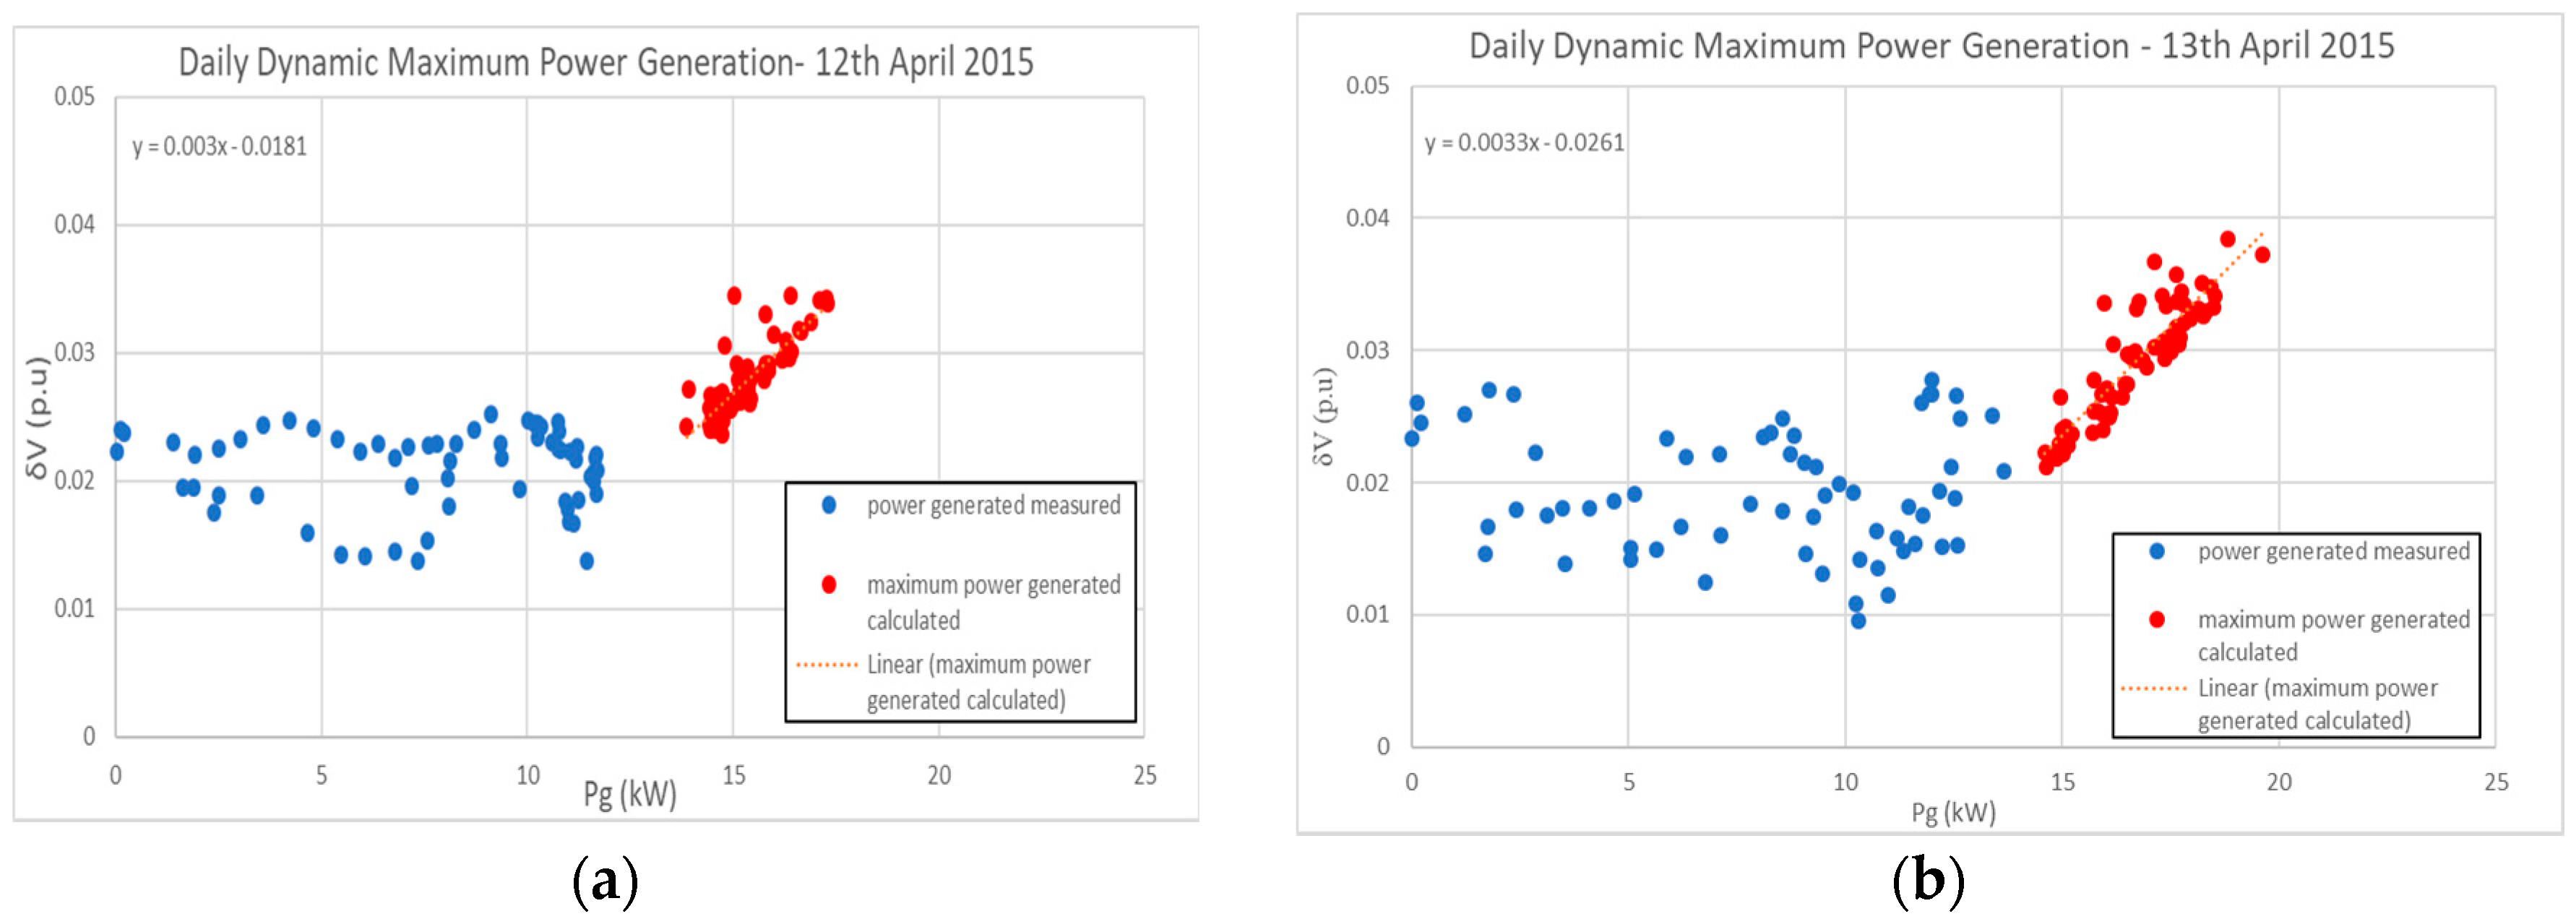
4.1. Global Maximum Hosting Capacity Daily

The first set of analysis examined the impact on the calculation of the DHC(t) by using the measurements of the system. The correlation between the data measurements of generated power and the maximum power generation calculated by Equation (6) was tested and plotted for all the days in the week of measurement. That is, for all measured values of generated power, a maximum amount of power generation was calculated using Equation (6), creating a linear dependency, which linear regression using the y = a x + b   formulation is shown in Figure 4 and Figure 5.
If a linear extrapolation is created using these points, it is possible to determine the hosting capacity when the calculated line crosses the overvoltage limit index at 5%. For example, for the 9th of April 2015, the linear regression found regarding the maximum amount of power calculated is equal to y = 0.0035   x 0.0333 , where the variable y represents the overvoltage margin of the system, and x represents the calculated power for any overvoltage margin considered. In this case, the overvoltage margin of 5% will be replaced in y in order to find its respective x value. Thus, the final solutions contained represent the average hosting capacity in relation to the chosen day. In Figure 4, it is possible to see that the hosting capacity calculated is 24 kW for the 9th of April 2015.
These tests were also reproduced for other days. The results are shown in Figure 5, Figure 6 and Figure 7.
Technically, ordinary least squares (OLS) regression minimizes the sum of the squared residuals. It is important to mention that the coefficient of determination from our analysis has achieved 99.98%. As mentioned before, a linear extrapolation is created using these points to determine the hosting capacity when the line crosses the overvoltage limit index at 5% for all days.
These tests highlighted that there is a possible DHC(t) profile for the measured week in order to draw a better view of the behavior of the system. The results on local hosting capacity for all days can be seen in Table 2.

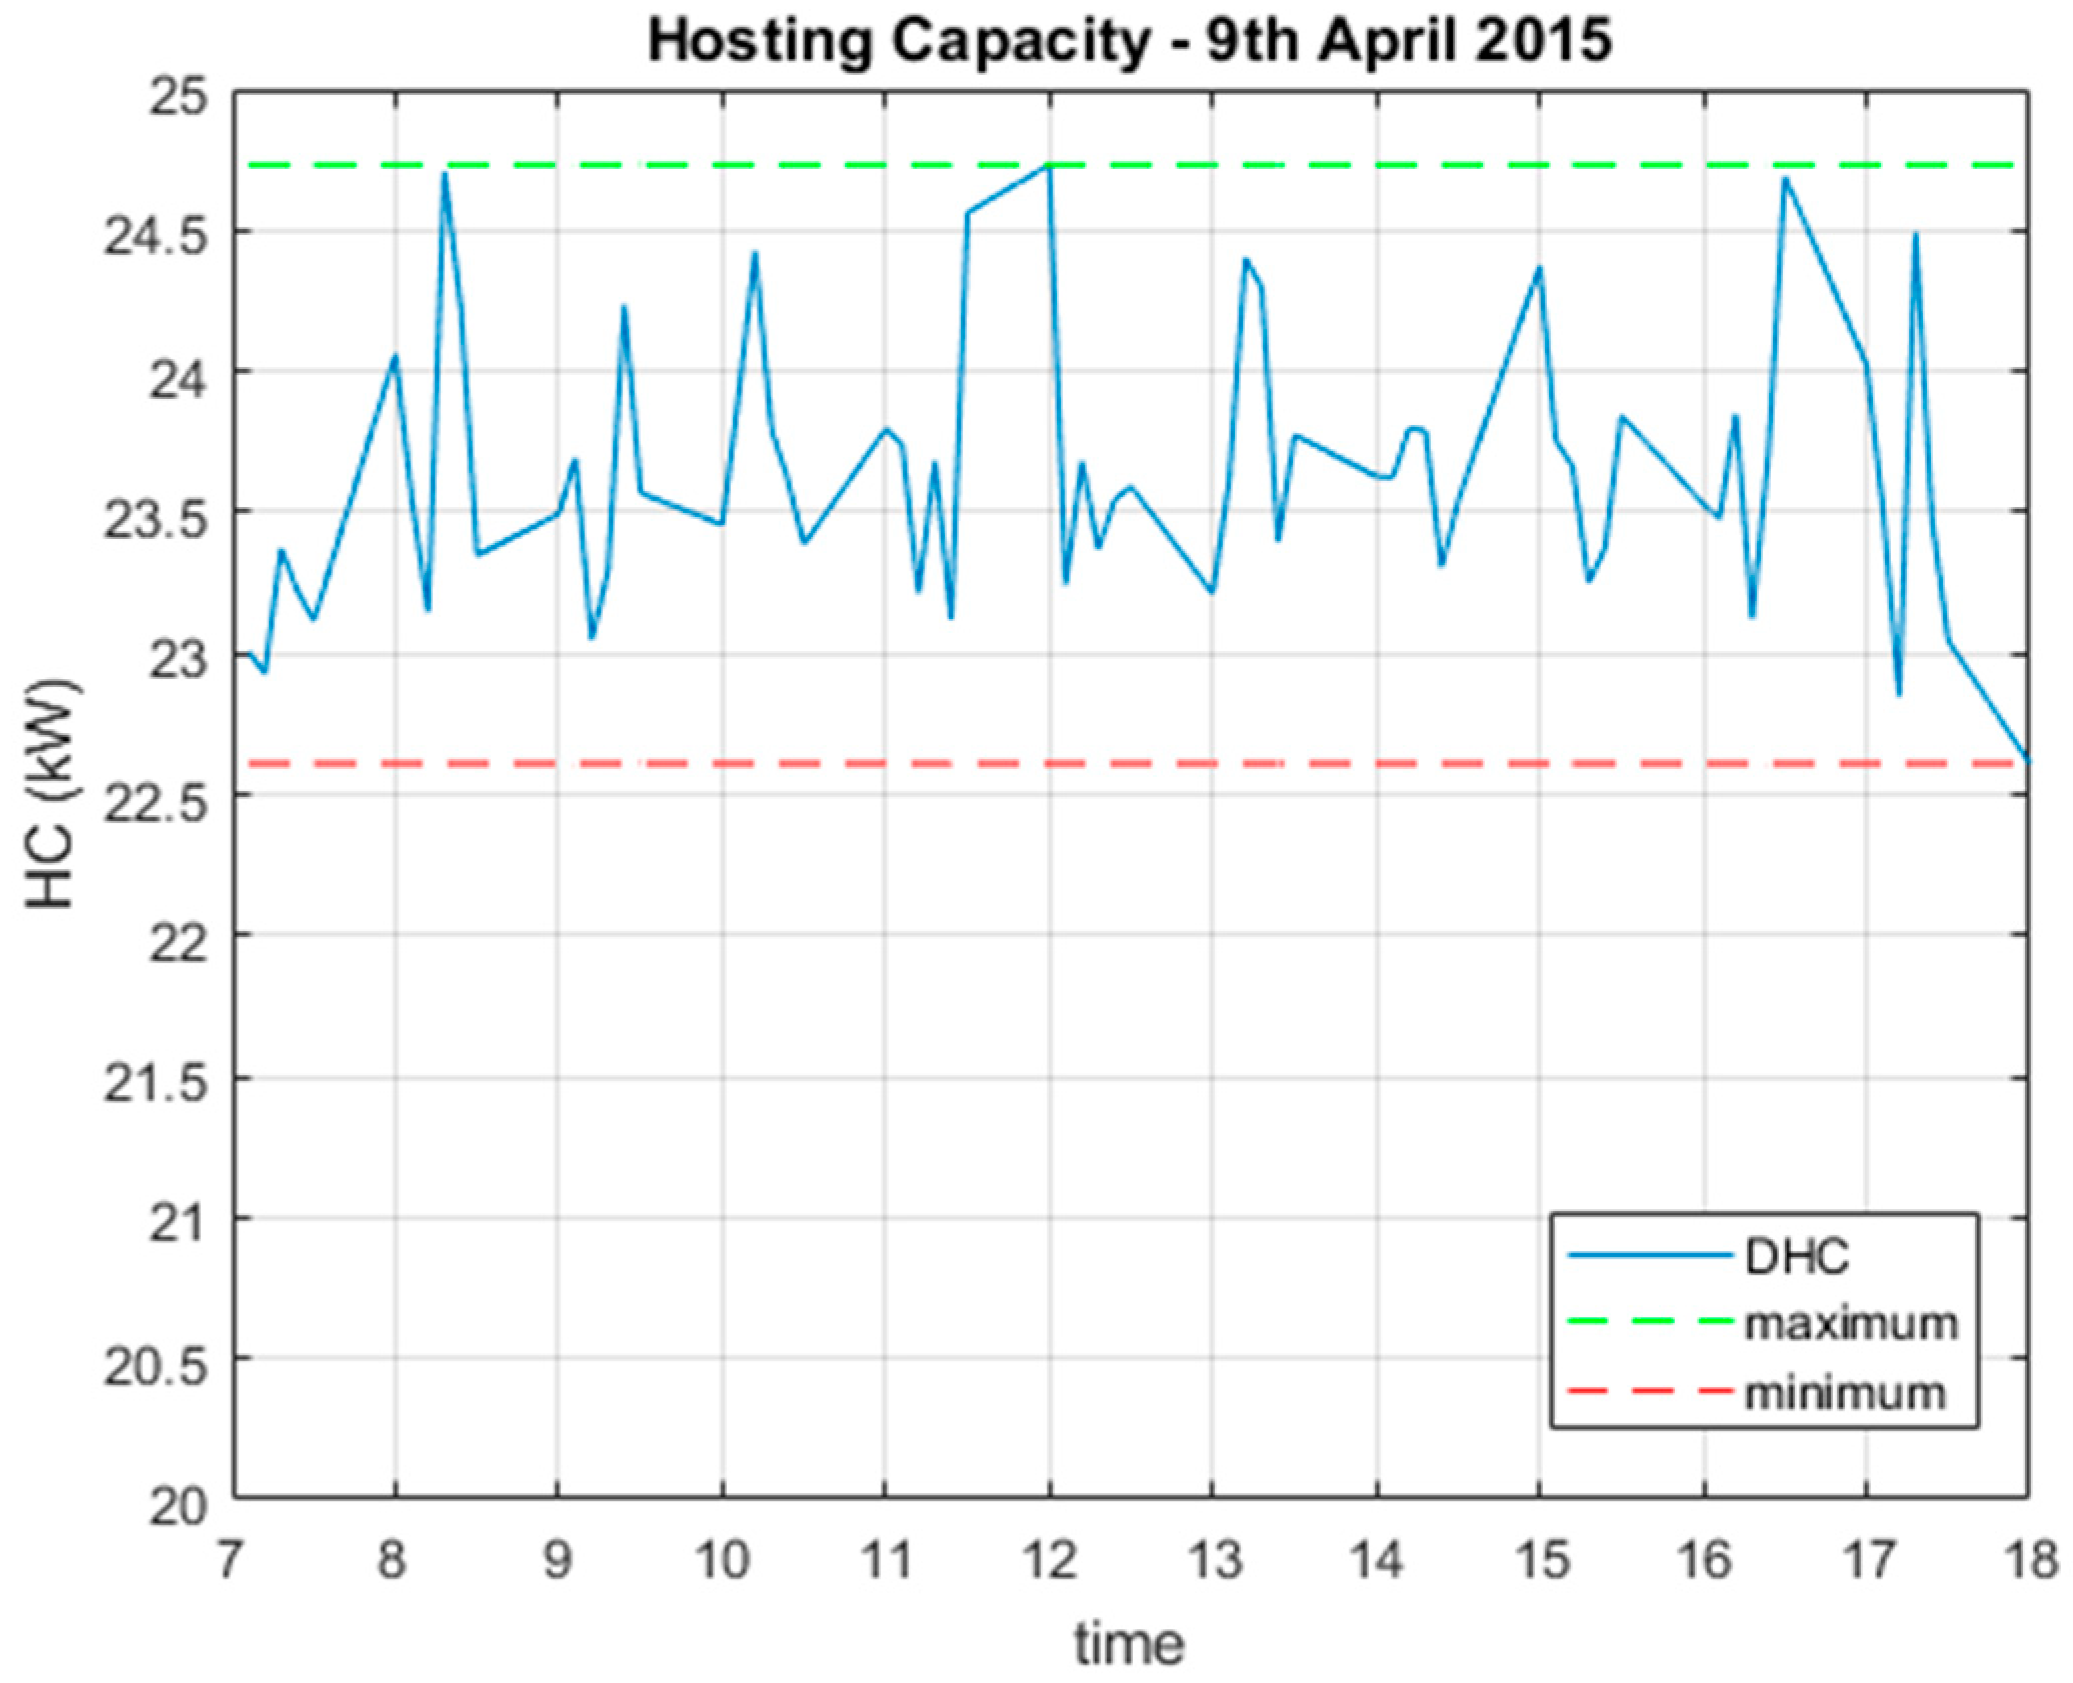
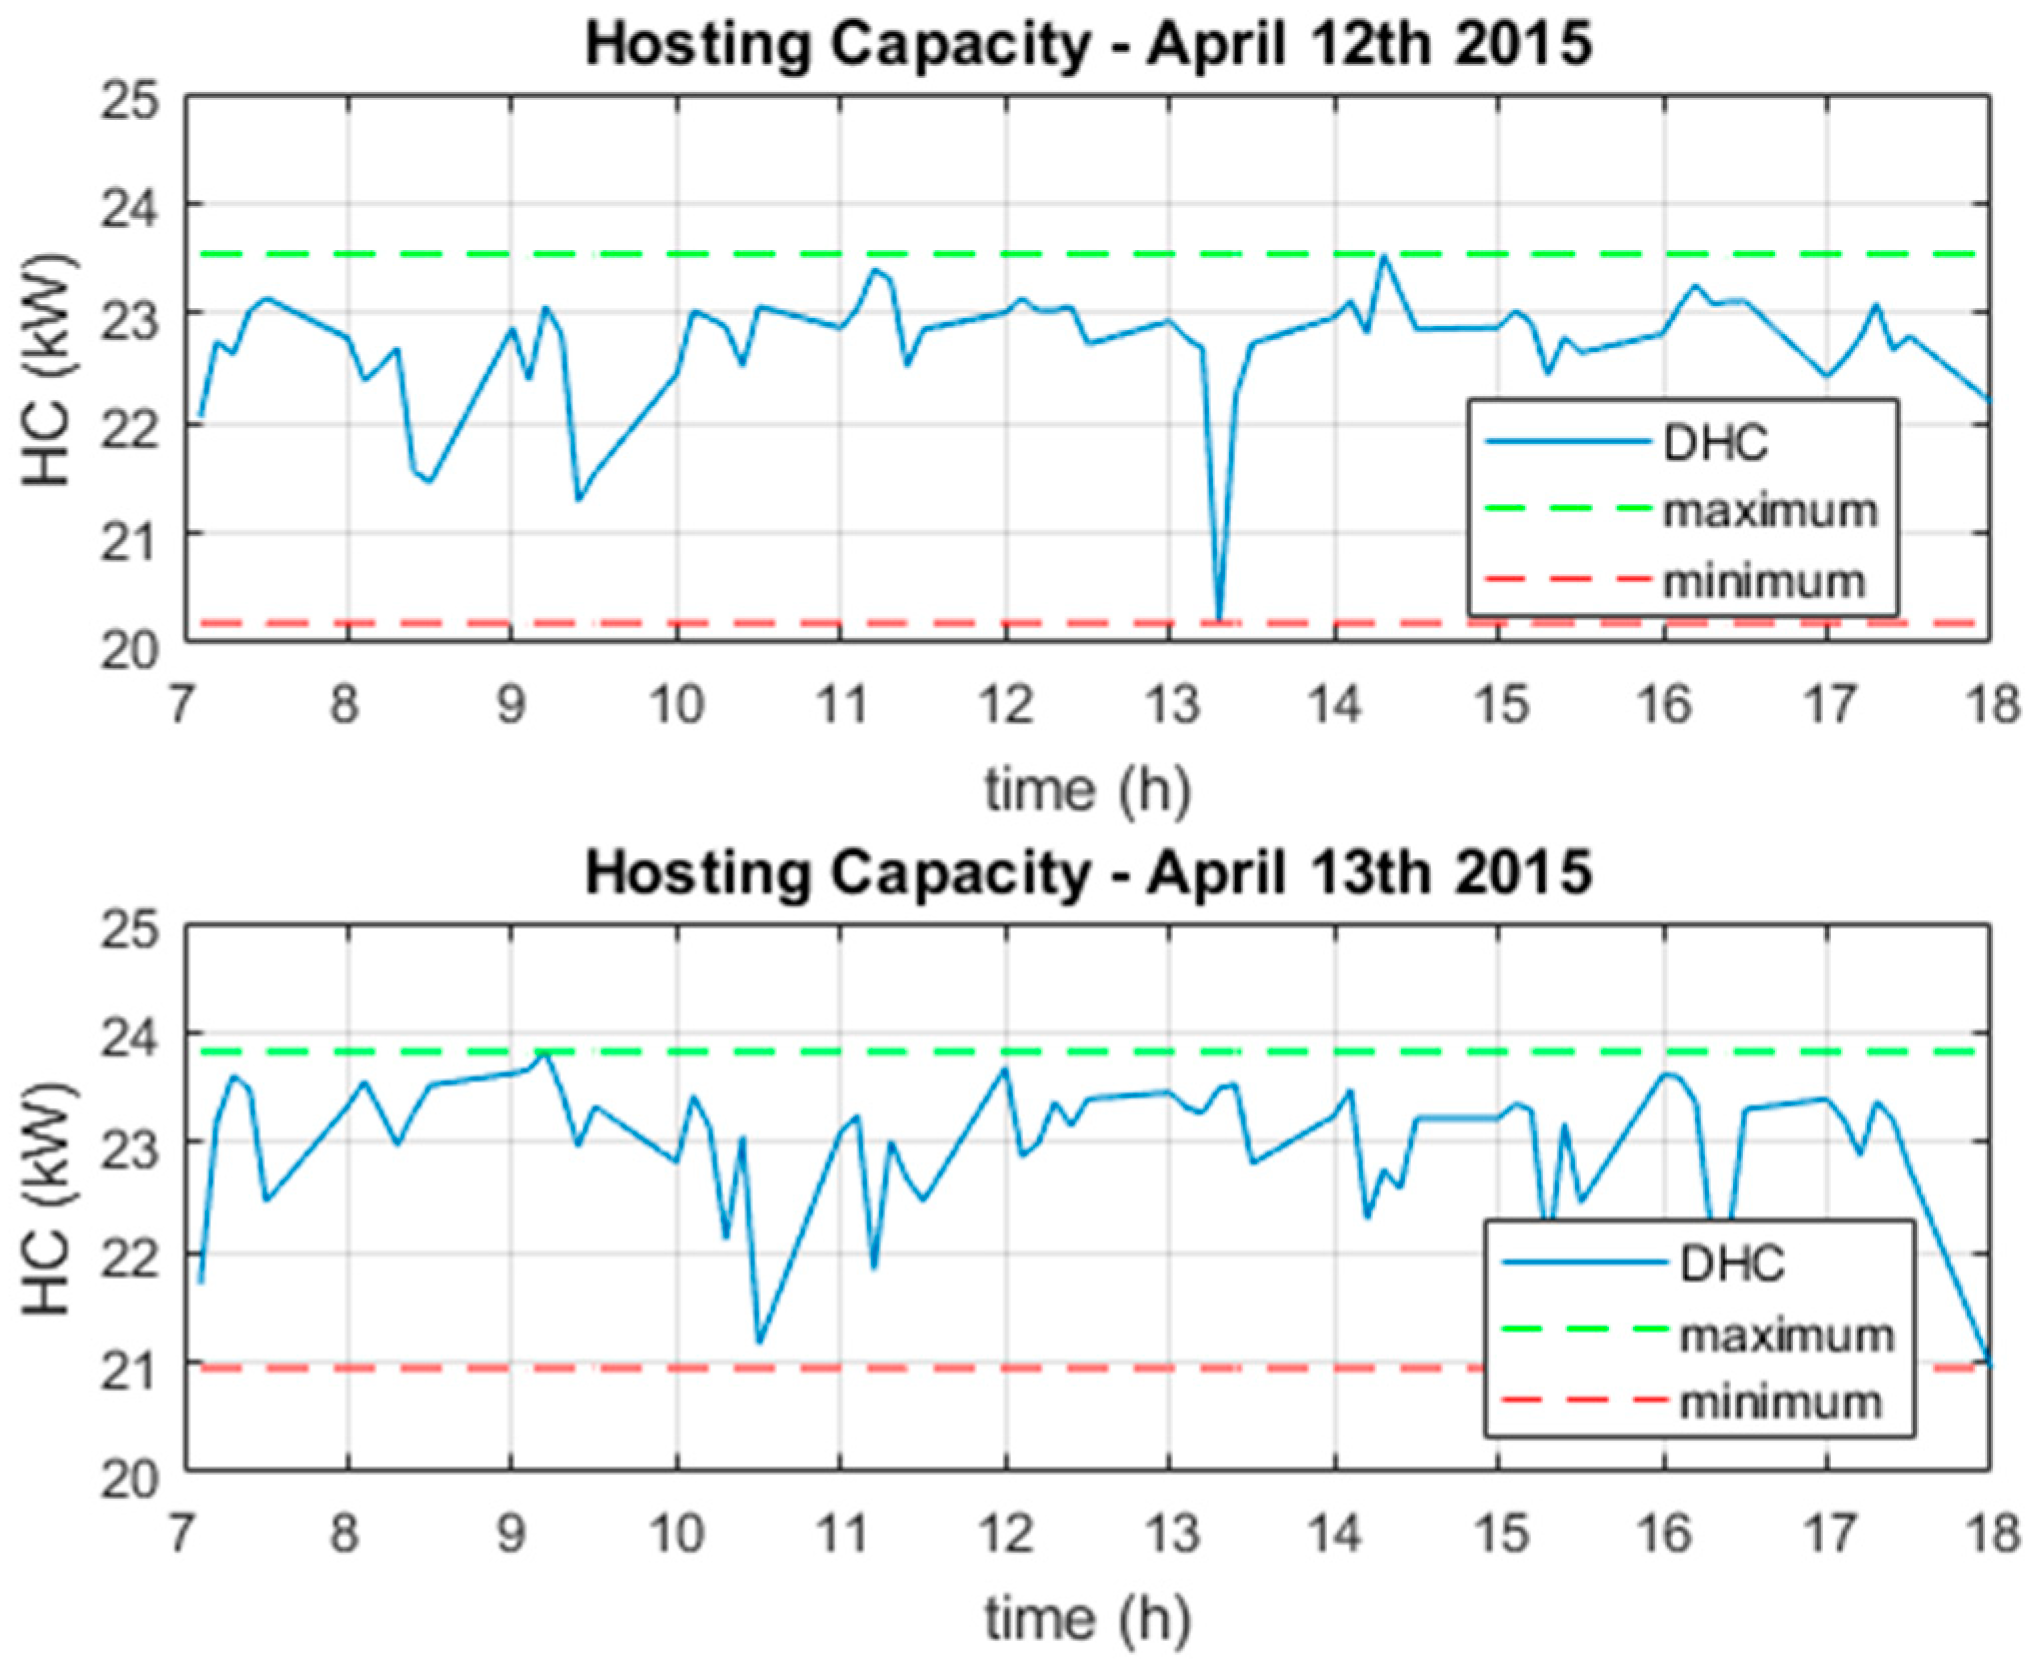
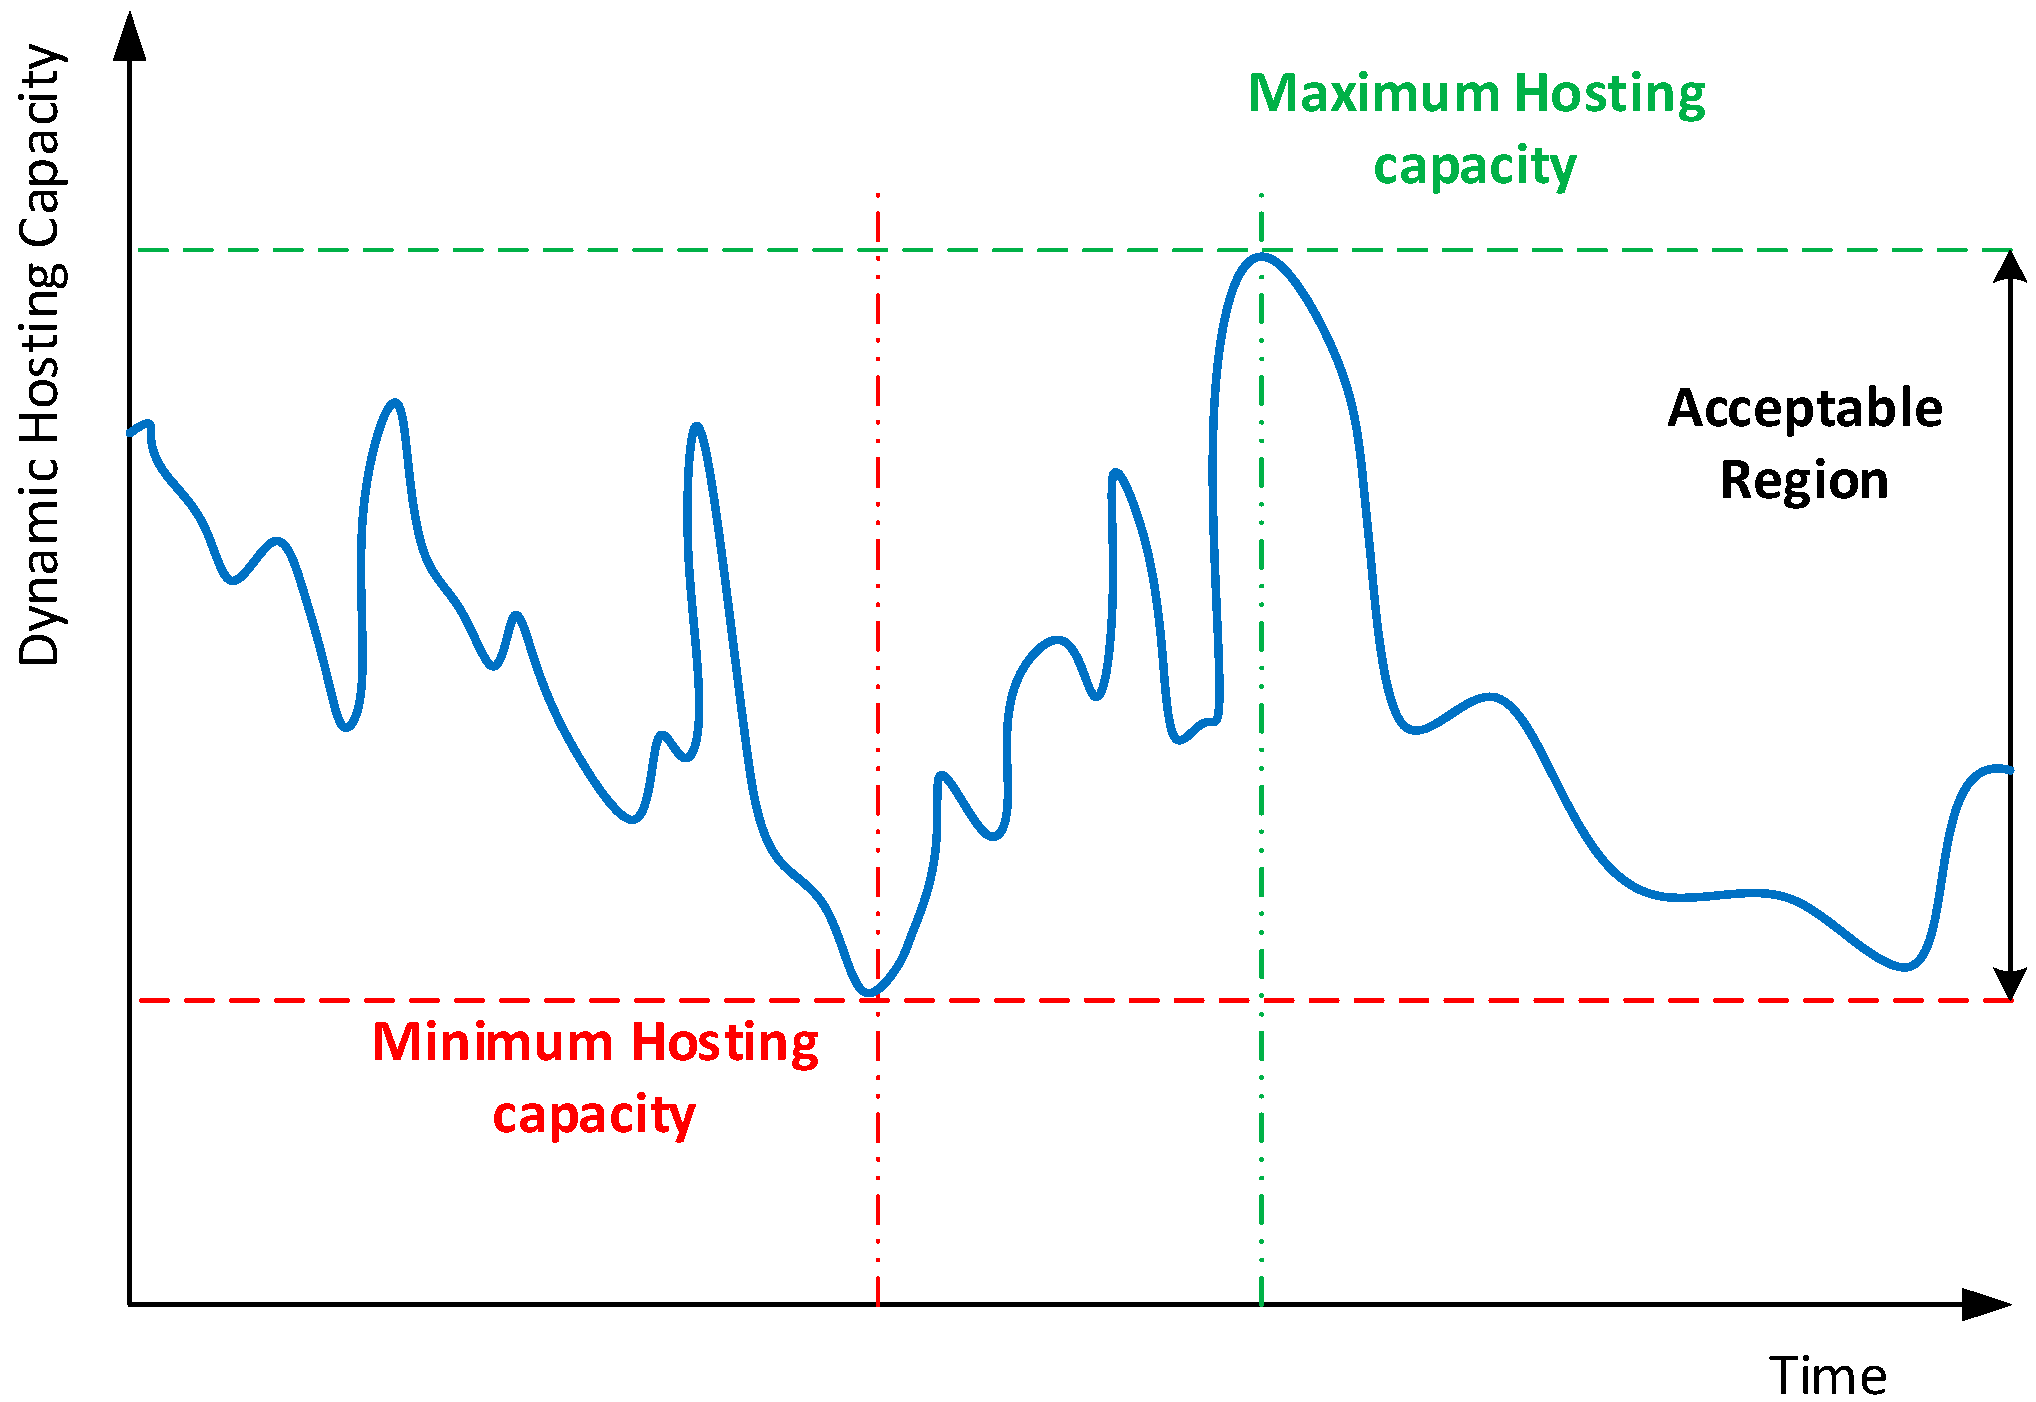
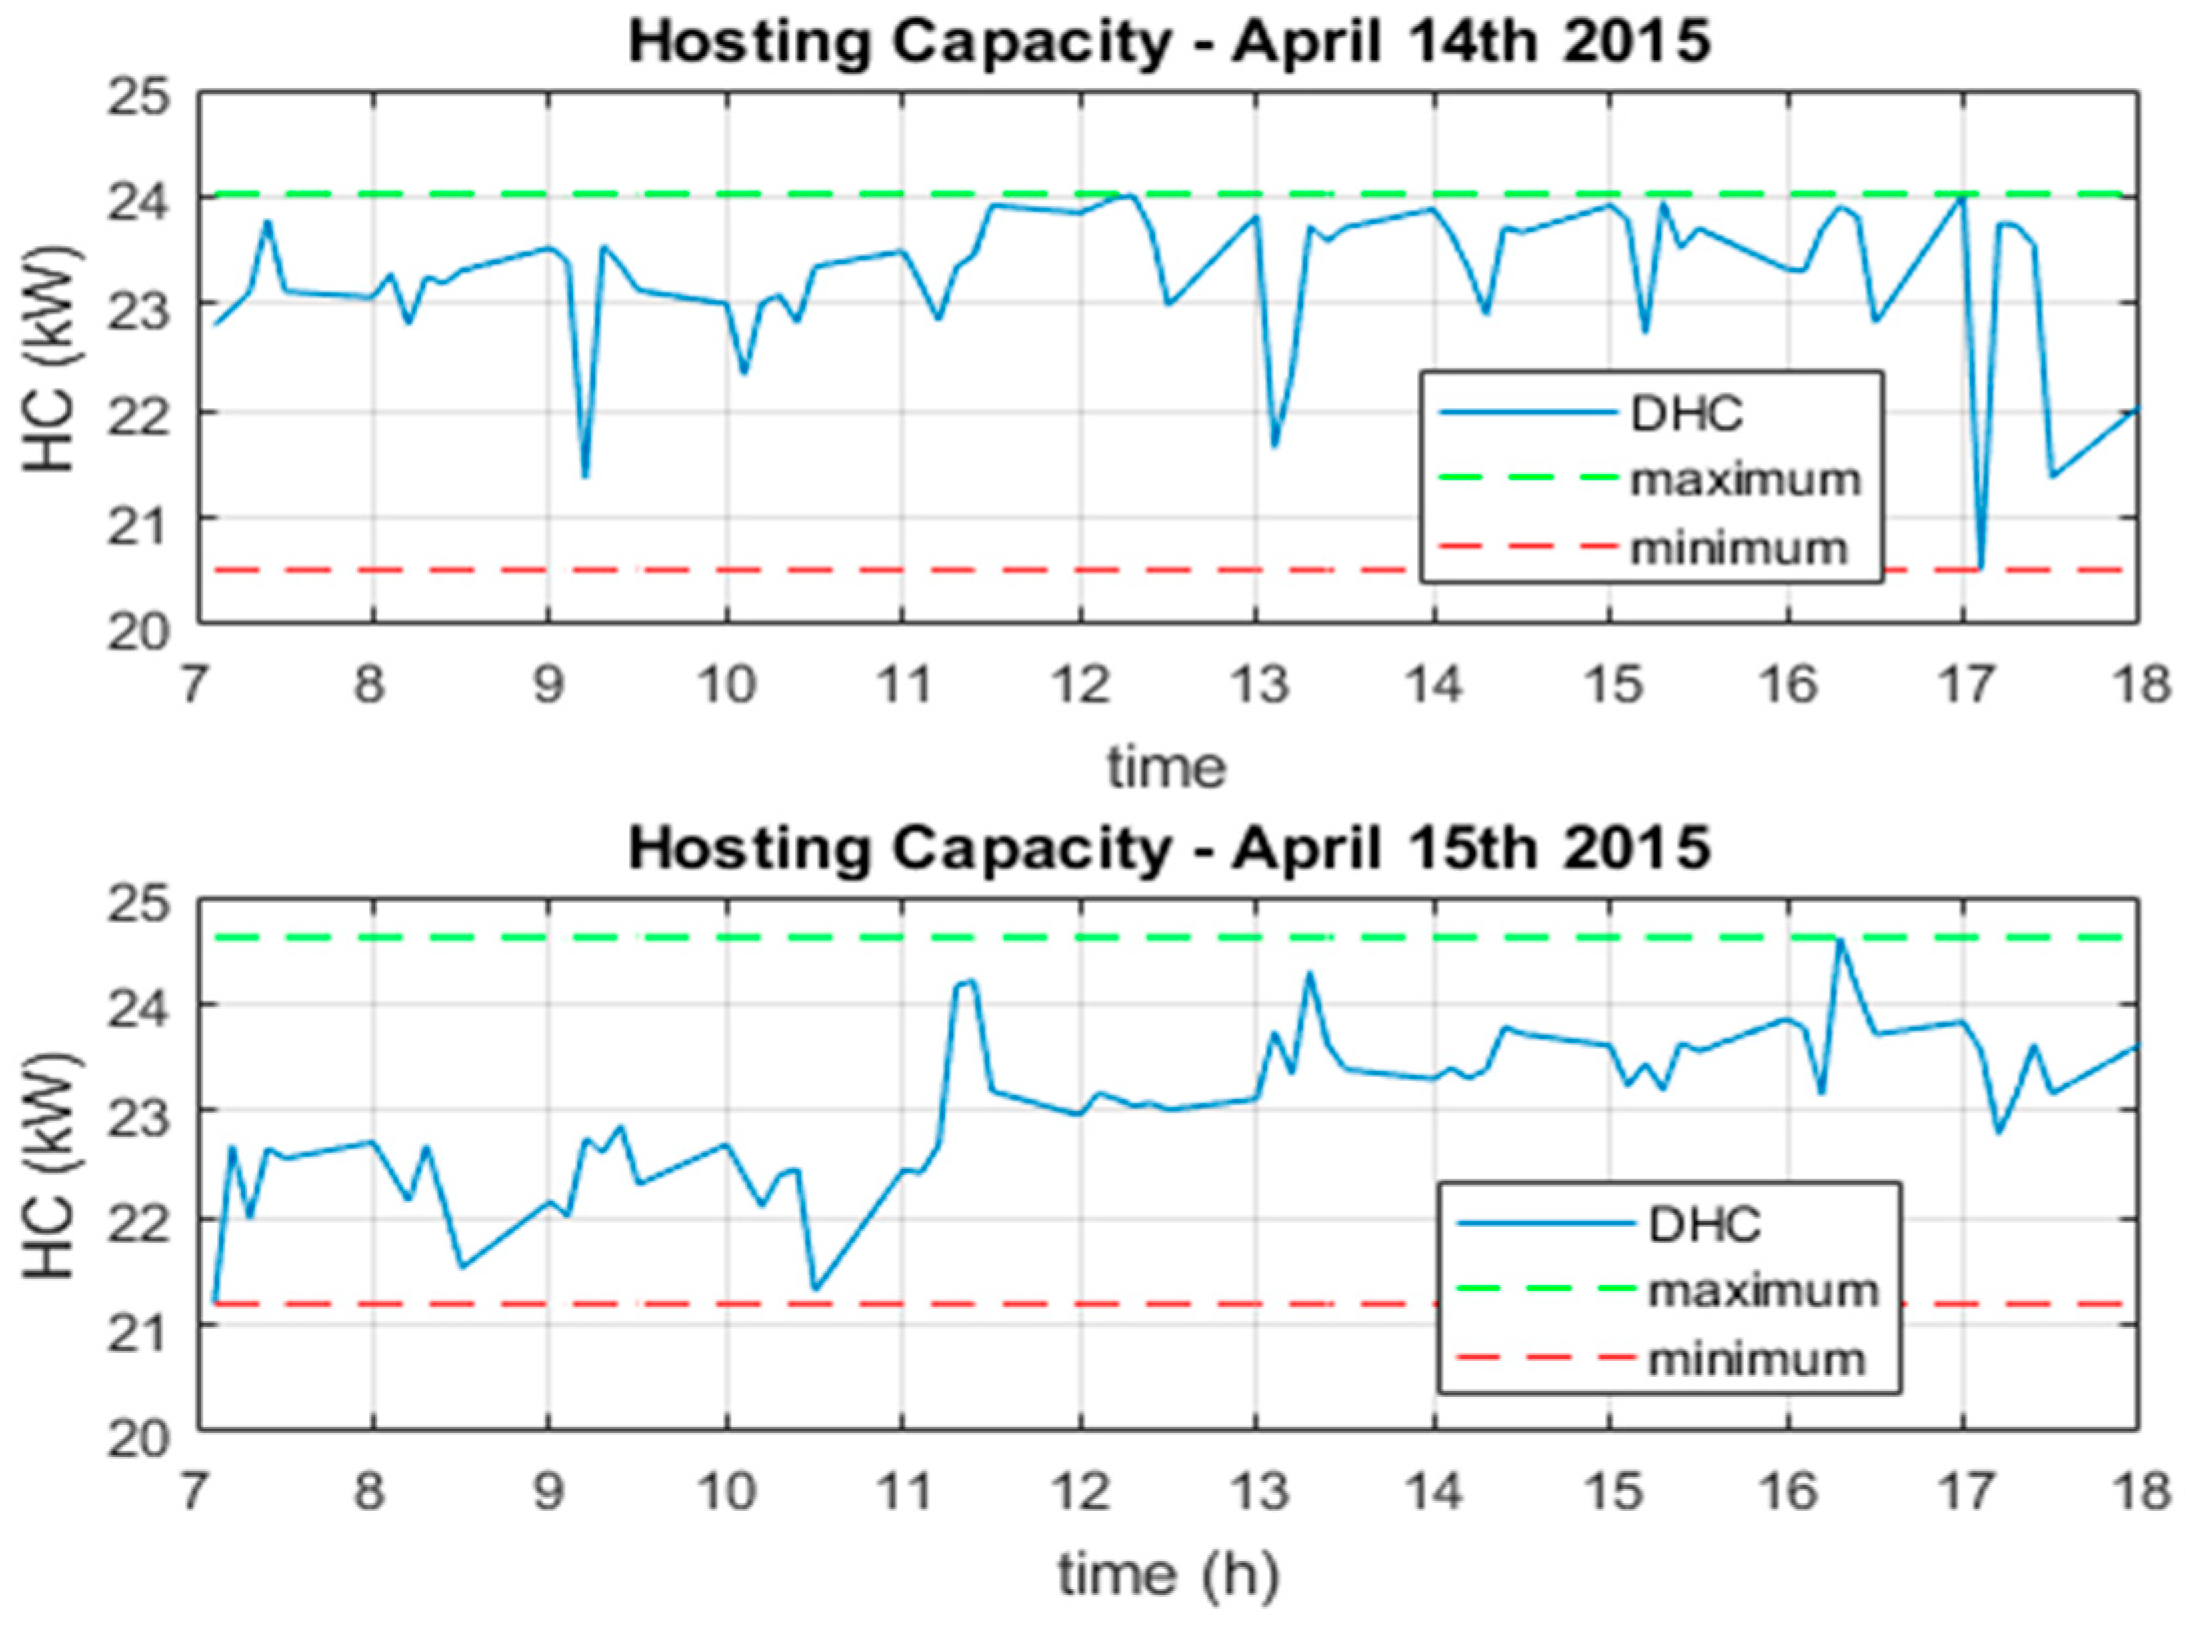
4.2. Dynamic Hosting Capacity Profile

This method represents a useful and initial alternative to drawing the DHC(t) profile considering the day mentioned before, where for each instant of measurement, a maximum power generation, using Equation (6), has been calculated. Therefore, as stated earlier, a linear correlation is calculated for all these instants of time using the overvoltage margin as well as the measured power from the PV. These factors will be responsible for this result. Let us take a look at Figure 8 where an exemplification of the calculation of the daily DHC(t) is given.
As in the local hosting capacity method, when these lines cross the limit index at 5%, a group of lines will be drawn as a result of the hosting capacity value. These lines are created due to the existence of the ordered pairs: The measured pair ( δ V ; P g )   and the calculated pair ( δ V m a x ; P g m a x )   by Equation (5). It is important to notice that all ordered pairs are related by an instant in time. In Figure 8, as an example, we have defined two ordered pairs in order to illustrate the method. For each ordered pair, as mentioned before, we will extend those lines until they reach the limit index set as 5% of the overvoltage margin. In the example, the purple line created by the first ordered pair will reach a hosting capacity value of 5% of the maximum overvoltage margin of 25 kW. On the other hand, the yellow line created by the second ordered pair will reach 23 kW of hosting capacity for a certain instant in time. Based on this methodology, we will repeat the procedure for all ordered pairs created by Equation (5). Thus, the daily DHC(t) profile for April 9th is shown in Figure 9.
The average score for the 9th of April was 24 kW, as calculated through the daily DHC(t) profile. Remarkably, some values of hosting capacity are slightly higher and lower than the average. These phenomena might have occurred because some external and internal factors had contributed to these differences. In this case, the maximum daily hosting capacity is 24.8 kW, whereas the minimum value is 22.6 kW. In relation to one of the highest value, it is possible to offer an explanation. This result is only significant at a moment when there is almost no solar production because it is early in the morning or there are clouds covering the panels. Thus, the voltage rise will be low due to the lack of solar production, coupled with the fact that the building is empty. For example, one of the highest DHC(t) found was at 12 p.m., which is defined as lunch time and all the building’s equipment are turned off, while of the presence of some clouds in the sky might have decreased the solar production as well. On the other hand, the smaller values observed in the daily DHC(t) could be explained as a result of a huge solar production and no load being fed at that moment. Moreover, the minimum value reached was at 06:00 p.m., which might have happened because most of the electronic equipment of the building was turned on and injecting high levels of distortion at the PCC. Unfortunately, it cannot be ruled out that the factors cited before may have influenced the extreme local hosting capacity values. Further analysis must be conducted.
As a conclusion, due to the special characteristic of the building connected to the system, the lower the solar production is, the lower the voltage rise will be. Finally, it can be offered as an explanation regarding the region between the maximum value and the minimum value. As mentioned in the section before, the smaller the acceptable region is, the worse the conditions of the grid will be. In this case, the performance regarding the 9th of April could be related to the fact that the day has presented one of the biggest solar production, as shown in Figure 10. Thus, if the load of the building is lower than expected and the PV production is almost reaching its peak, the range of harmonic distortion, as well as the voltage rise, would impact its DHC(t) profile.
Applying this calculation process to the other days results the daily profile for each day, as shown in Figure 11, Figure 12 and Figure 13.
These tests highlighted that there is a relation between the PV production and the area, which can be calculated in relation to the maximum and minimum daily hosting capacity.

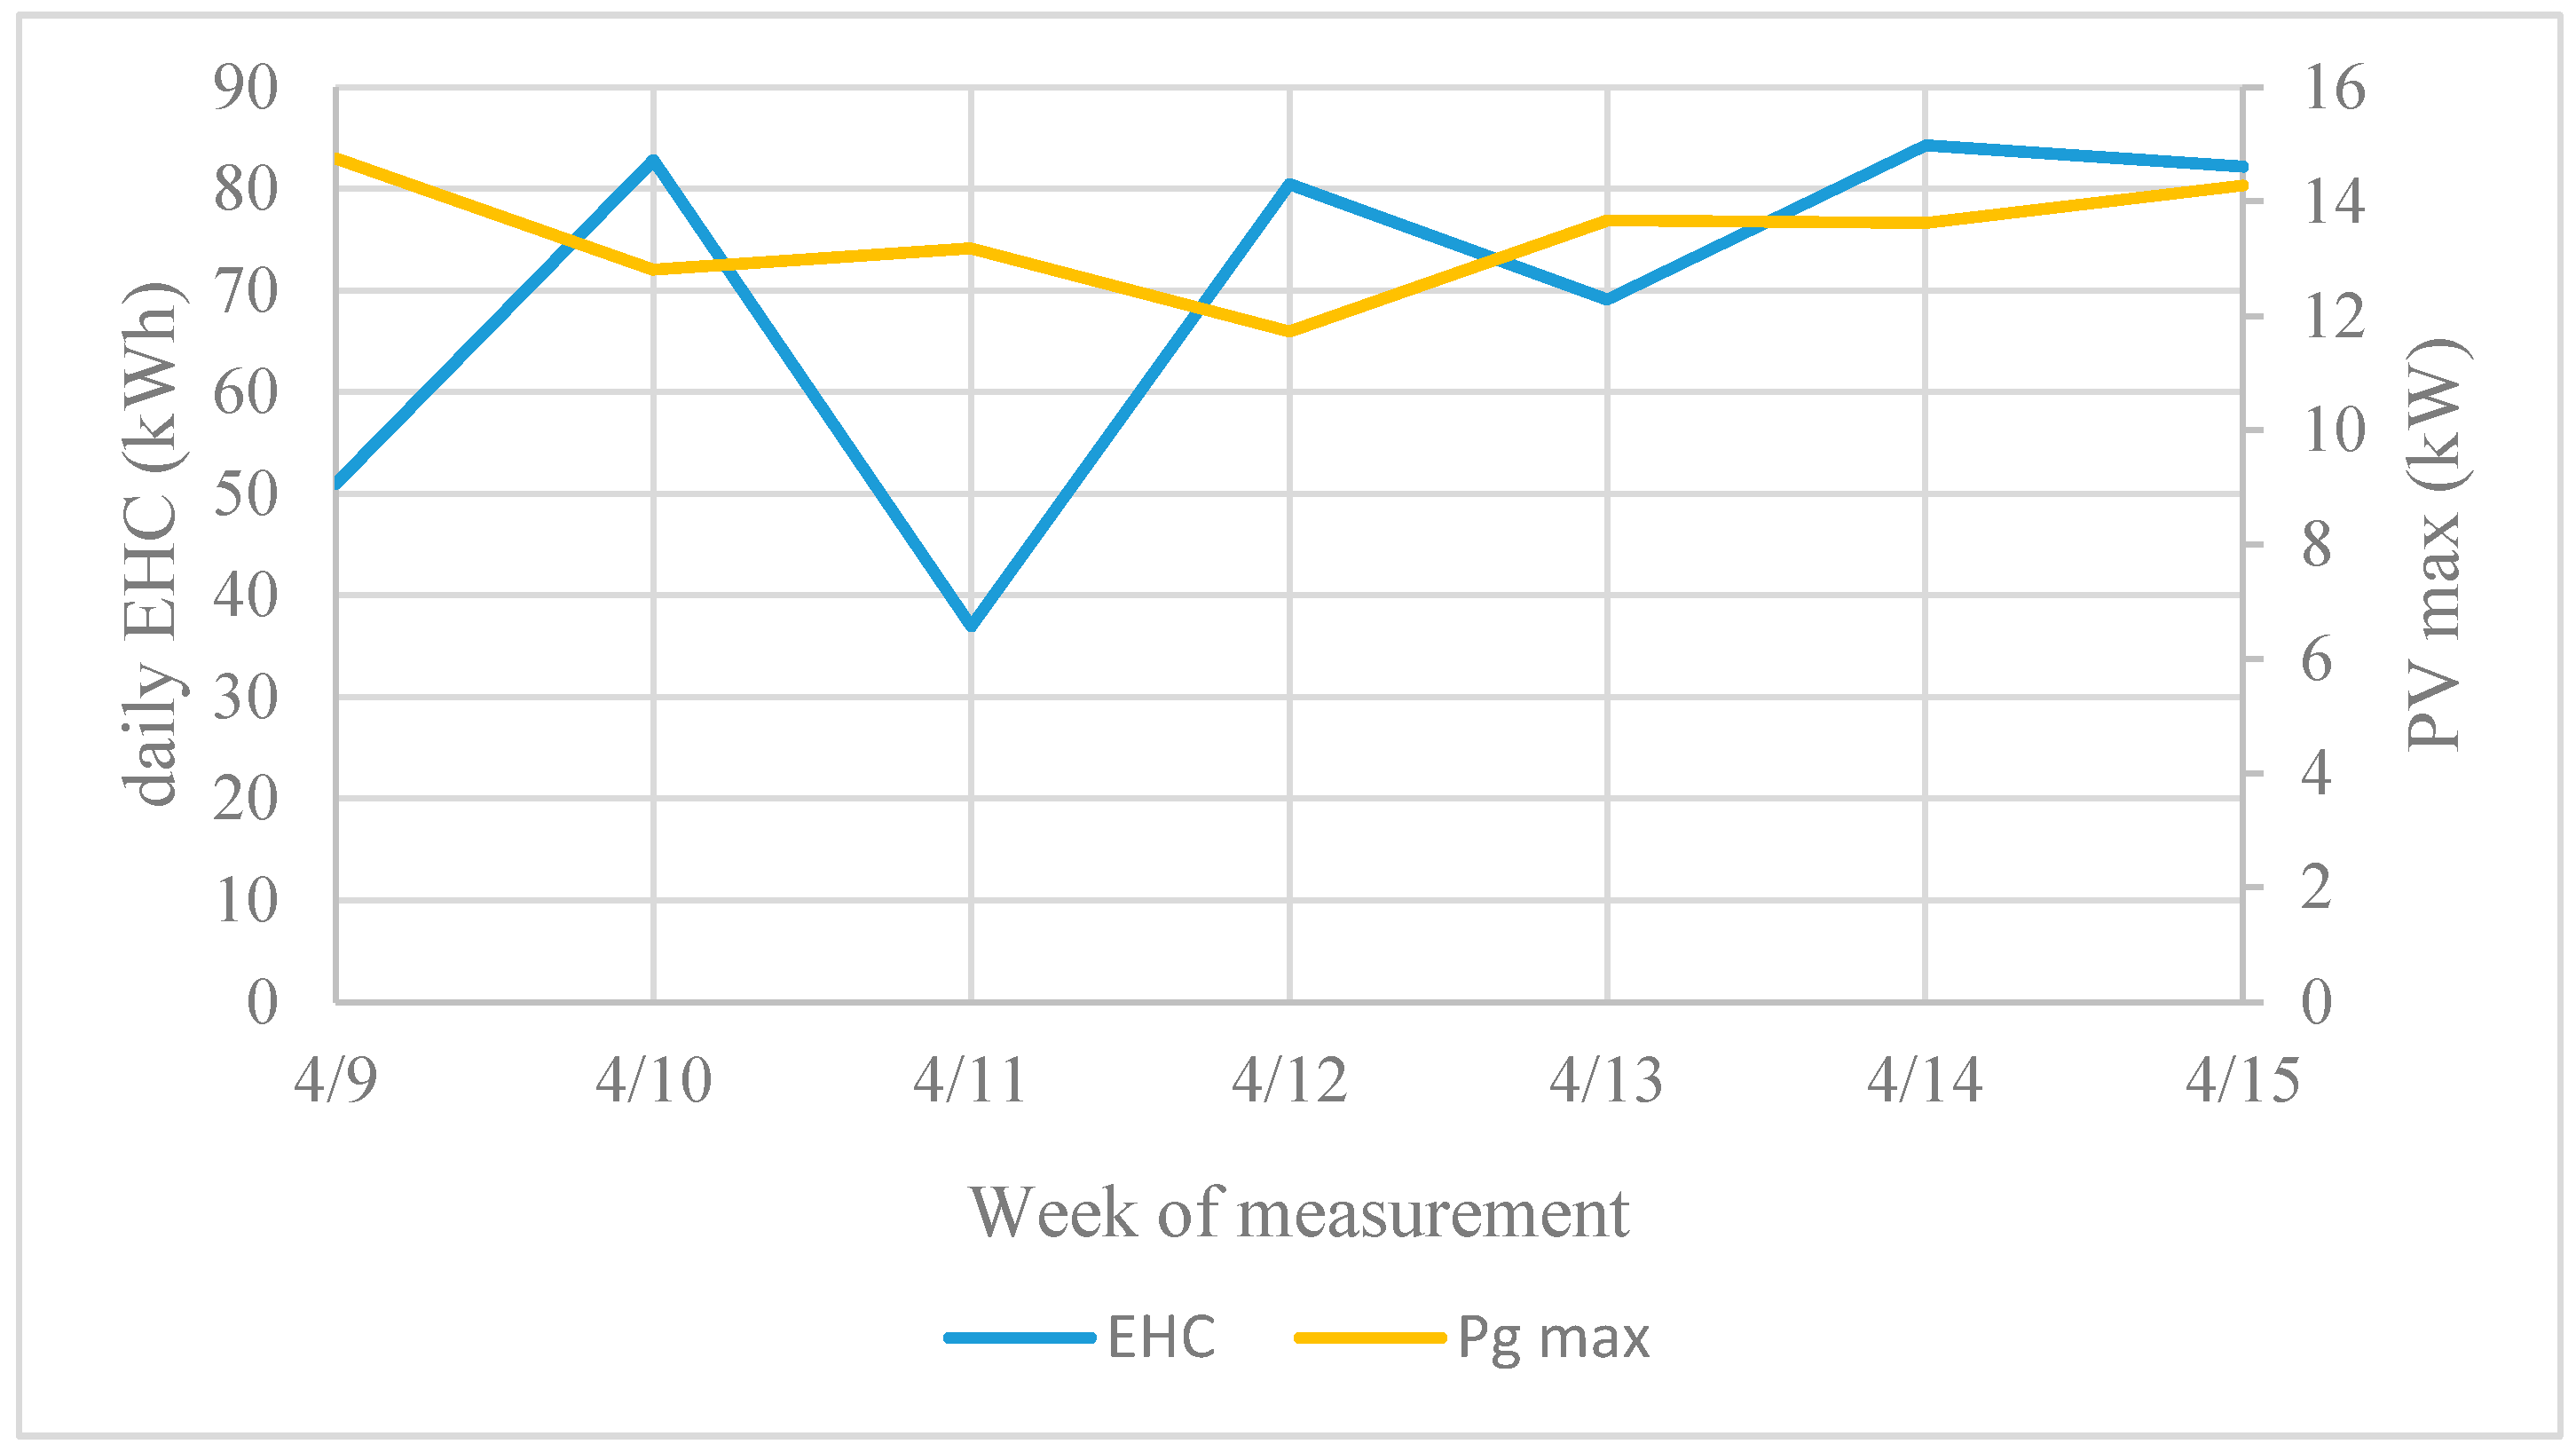
4.3. The Energy-Hosting Capacity Area (EHC)

Strong related evidence was found, making it possible to sustain that the higher the PV production is, the worse the performance of the grid will be or the smaller the daily hosting capacity area will be, according to the analysis in Section 4.2. Therefore, the daily hosting capacity area can be defined as energy-hosting capacity (EHC) and this relation can be calculated, as given in (7).
E H C d a i l y = ( H C m a x H C m i n ) . ( 24   h )   [ kWh ]
The average score for the daily EHC was calculated using (7) based on the maximum and minimum values discussed in Figure 9, Figure 10, Figure 11, Figure 12 and Figure 13. Moreover, the values of PV production were taken from Figure 10. The data and results are shown in Table 3.
Based on the values from Table 3, the daily EHC profile and the maximum PV generation can be drawn, which is shown in Figure 14.
These results are only significant for the performance of the grid based on the PV production. Interestingly, this correlation is related to the maximum PV production, as well as the load conditions at the PCC. It is important to highlight that our results could not be tested on loading conditions, because there was no exclusive measurement of the load level. Thus, the single most marked observation to emerge from the data comparison was the larger the PV production is, the smaller the energy-hosting capacity (daily hosting capacity area) will be, which can be mitigated by power quality improvement processes. These mitigation processes can be found in the next sections.

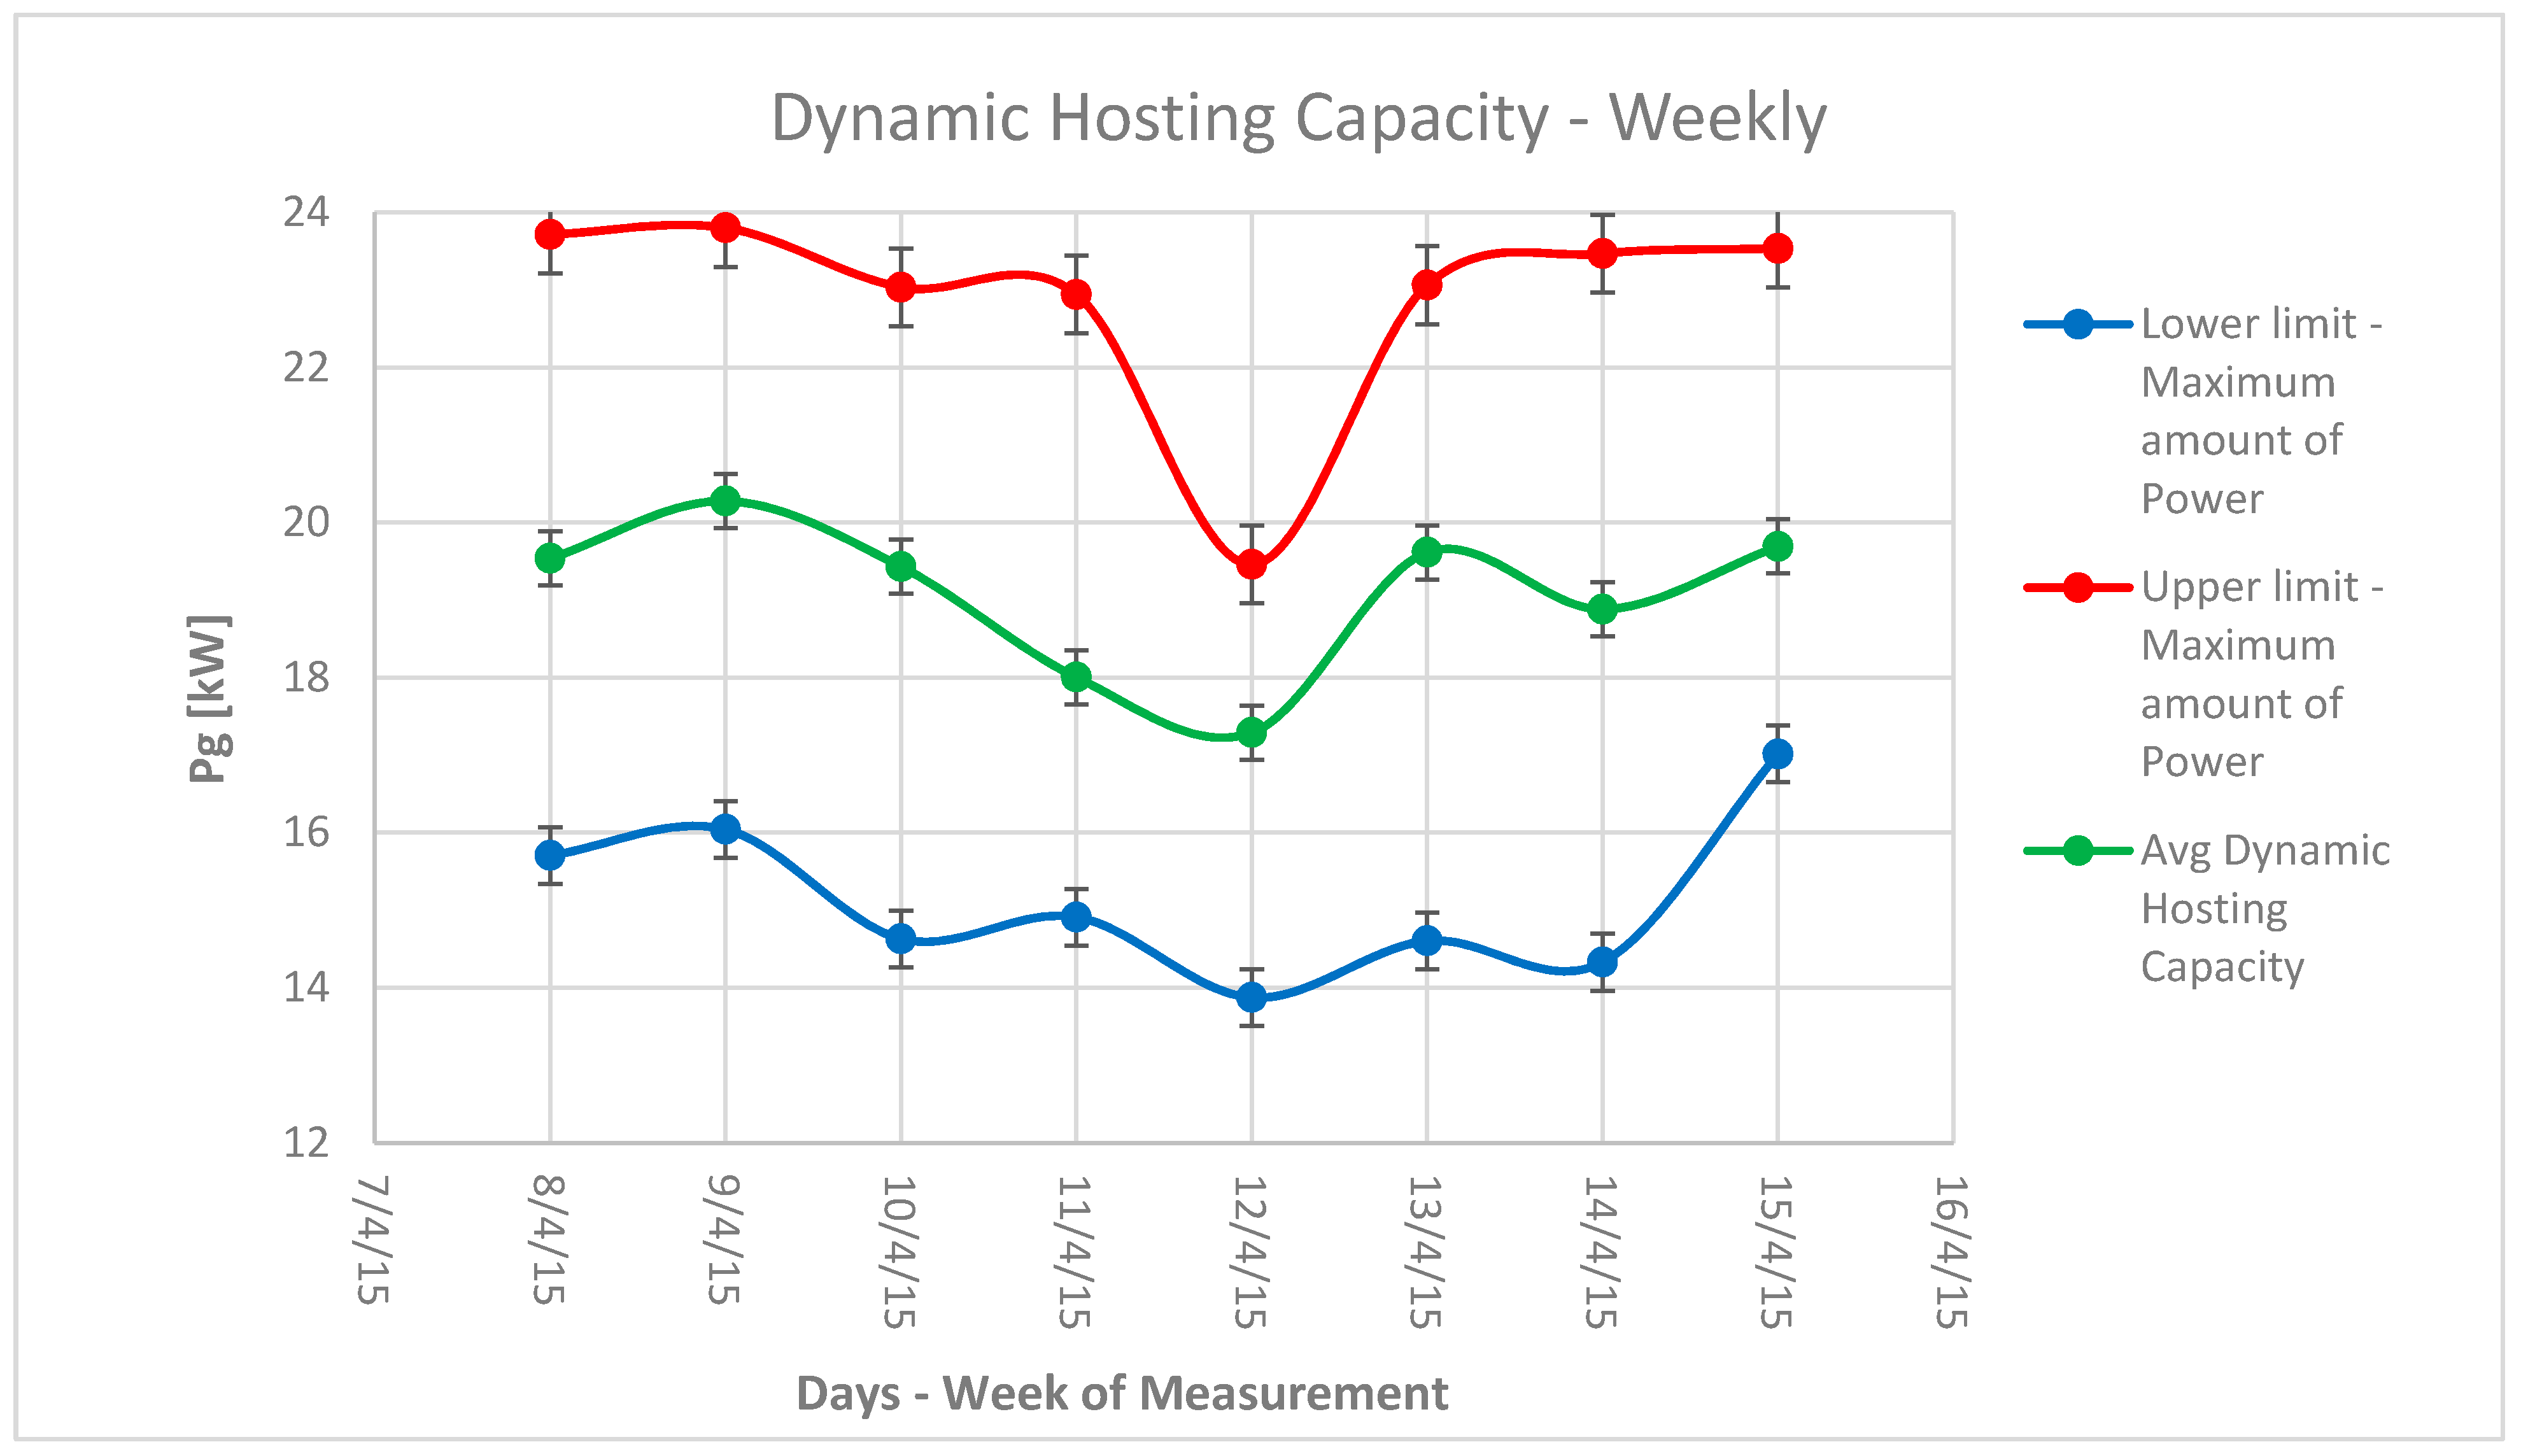
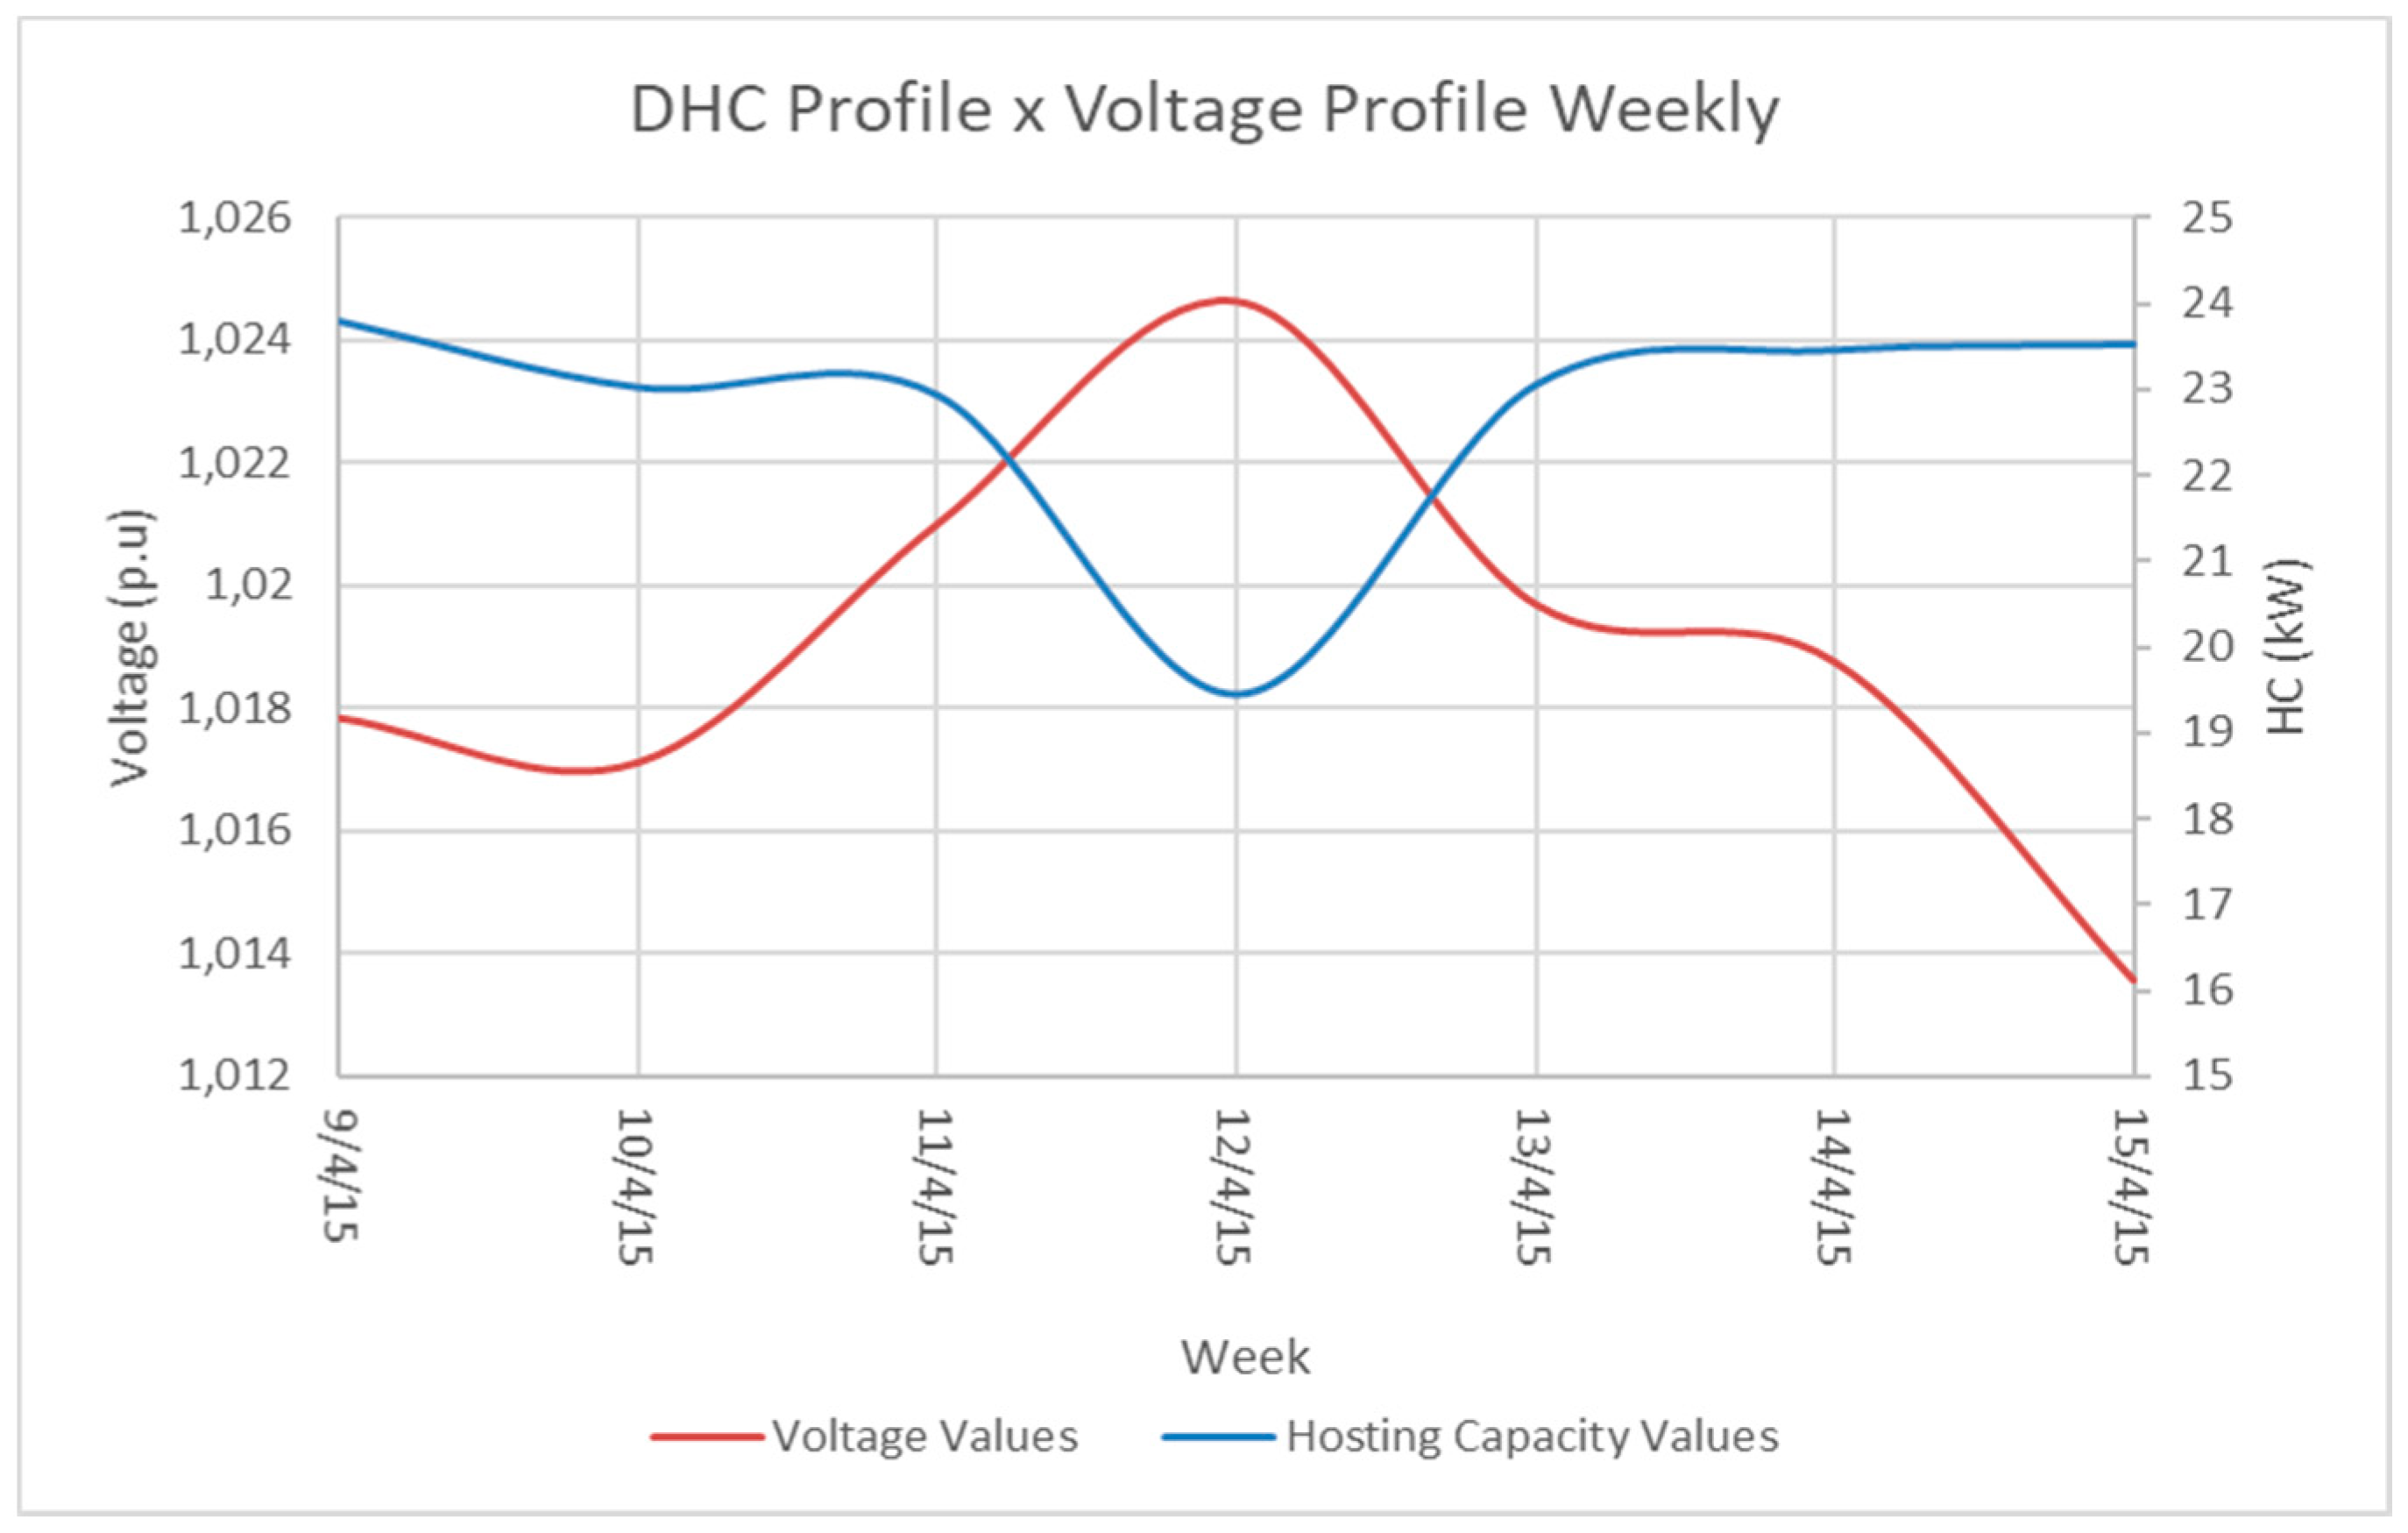
4.4. Weekly Dynamic Hosting Capacity throgh Upper and Lower Limit

As mentioned before, it is important to mention that these results weren’t exclusively for one day of measurement, since they were also calculated for other days during the week of measurement as shown in Figure 10. The most remarkable result which emerges from the set of data is that the weekly DHC(t) profile is drawn for the system using the values of Table 2. Interestingly, the results are related to the maximum and minimum points in the final curve, as shown from Figure 4 till Figure 7 and from Figure 11 till Figure 13, where the maximum hosting capacity found remained at 23.8 kW and the minimum hosting capacity was 19 kW, describing a 4.8 kW gap between these two values. The DHC(t) profile, as well as the lower and upper limits of the maximum amount of generated power, are shown in Figure 15.

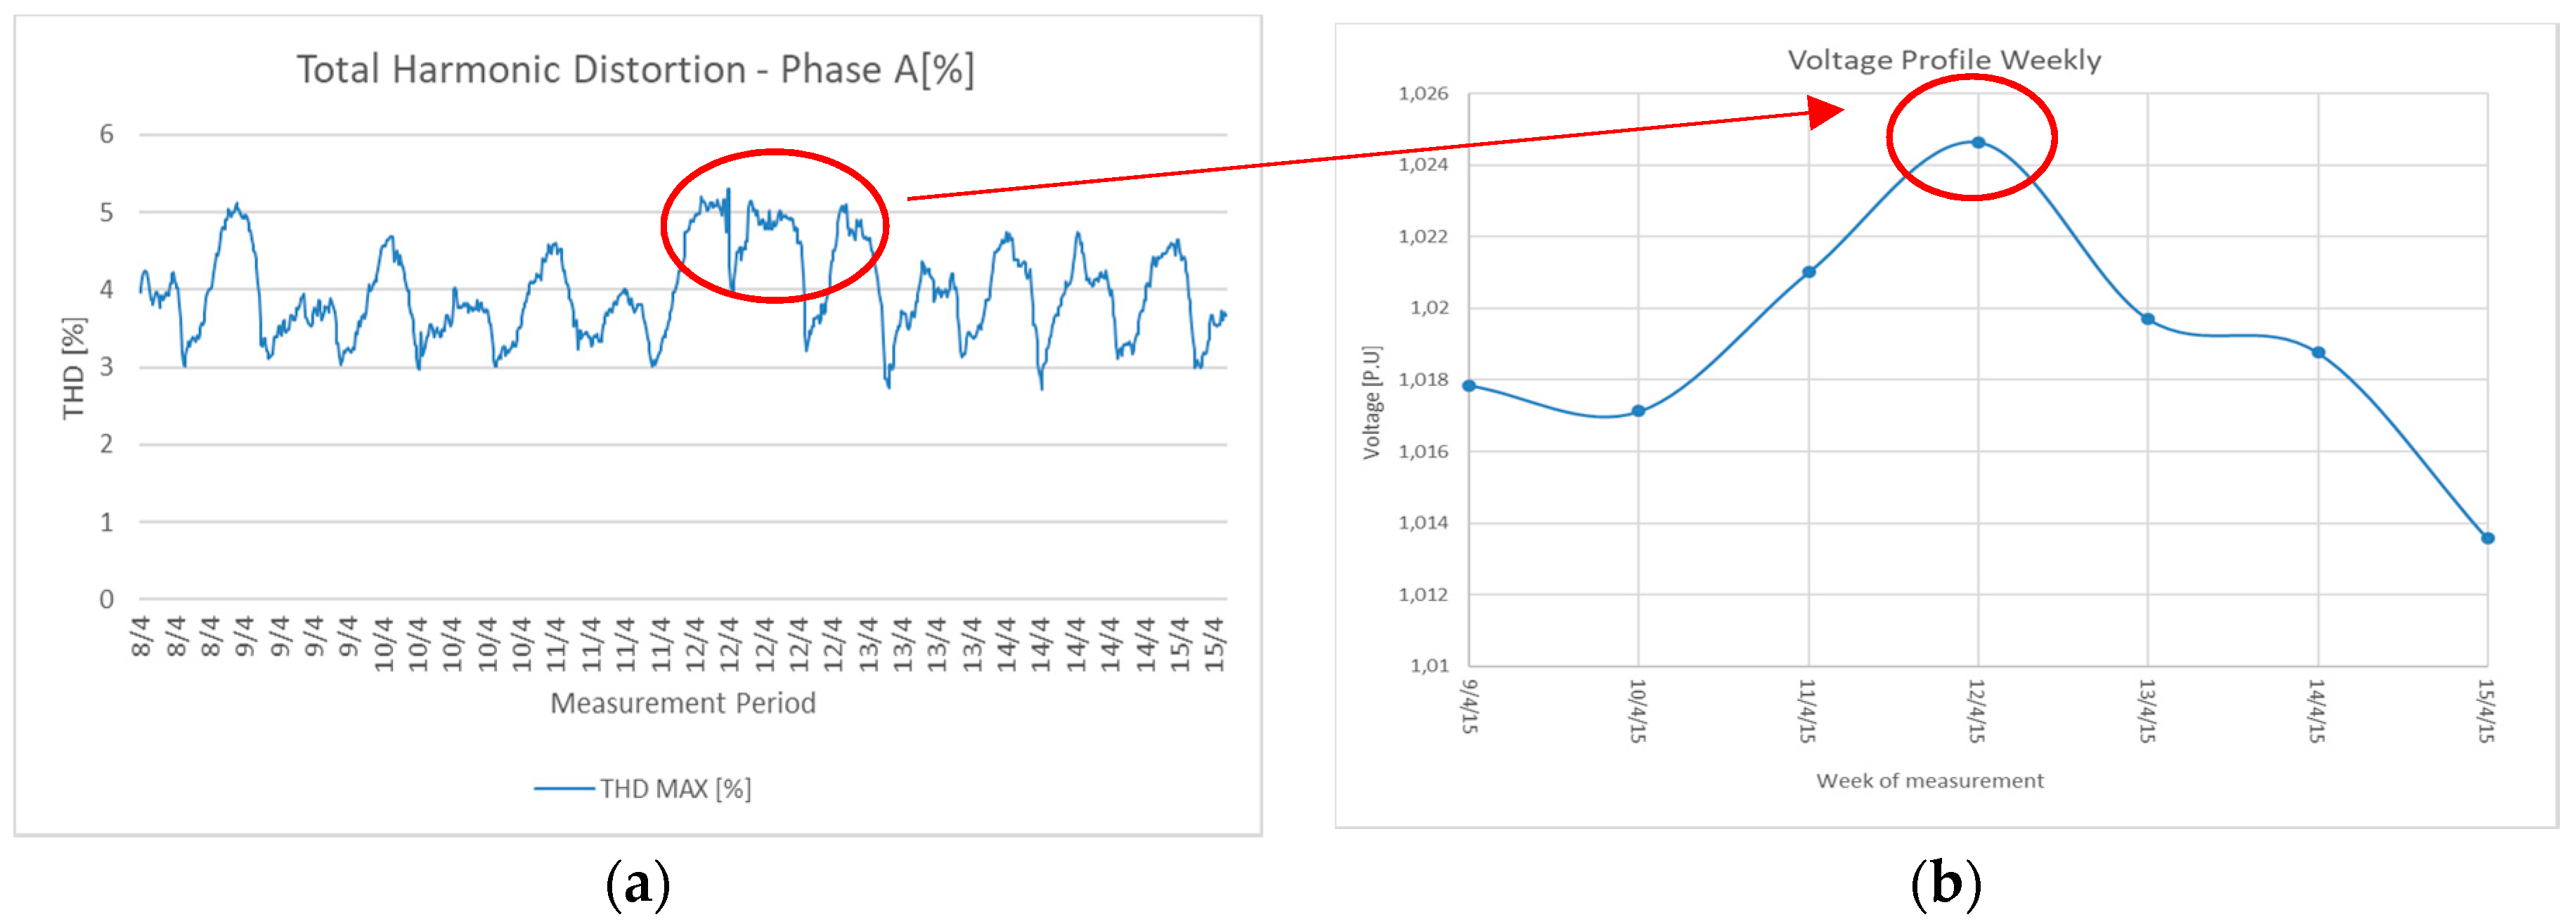
4.5. The Relation between the THD and DHC

It is fundamental to note that the DHC(t) profile has a strong correlation to external and internal phenomena into the system, which will be shown in the next figures. These analyses will demonstrate what has been discussed in Reference [3] in relation to the impact of the harmonic distortion into the voltage rise due to DERs, where the Total Harmonic Distortion (THD) was used to confirm the correlation with the voltage rise.
Firstly, in Figure 16a, the THD profile of the system is shown. Additionally, it is possible to estimate that the highest value of the measured THD regarding the week of measurement is related to the high incidence of the 5th harmonic, which is a consequence of the inverters connected to the system. Nevertheless, this value has been found to be typical of PV systems. It is worth observing in Figure 9 that the day 12th of April had the highest THD distortion regarding the measured week. The most striking result to emerge from the data, shown in Figure 16b, is that the highest voltage value was on the 12th of April as well. Thus, the correlation between the THD and the voltage rise is worth mentioning. Consequently, Equation (5) captures the exact response of the voltage rises due to the harmonic distortion. Therefore, there is a satisfactory agreement between the THD and the voltage profile as well as the hosting capacity value. These results are only significant at a DHC(t) profile level.
These results further expand the usefulness of the DHC(t) and its consequences about the system. The minimum value of the local hosting capacity is directly connected to the THD, which impacts the voltage rise, as shown in Figure 16b. As a conclusion, the higher the THD is, the higher the voltage rise is, and the more limited the local hosting capacity will be. On the other hand, the lower the THD is, the lower the voltage rise is and the less limited the local hosting capacity will be, providing a bigger range to increase the local power generation.
From this perspective, the results emphasize the validity of the proposed model to calculate a DHC(t) due to harmonic voltage distortion and its consequences on the voltage rise. These tests revealed that the DHC(t) approach must be considered and calculated for the systems in order to minimize issues of planning and re-fitting projects. Thus, the experiments are in line with the previous discussion shown in Section 3 and its consequences cited. Regarding this correlation, the results were plotted in Figure 17, where the relation between the voltage rise and the hosting capacity value is clearly shown.

5. Conclusions

The evidence from this study suggests that the DHC(t) is an important tool in order to get further understanding of the distribution systems capacity in the presence of distributed renewable generation. This work has helped to conclude that the local hosting capacity should not be analyzed only statically because its dynamic nature can help operators to better deal with intermittent distributed renewable resources.
As hypothesized, the paper demonstrates that the hosting capacity must be considered as a time variant function. There is satisfactory agreement among the previous studies in the hosting capacity field, which have been considered as a very useful tool for distribution systems planning.
Through this work it was obtained satisfactory results demonstrating that the DHC(t) has the potential to predict the hosting capacity consequently facilitating the planning and operation of the system under constantly varying and unpredictable generation and demand conditions. Applications in more complex systems are encouraged.

Author Contributions

T.E.C.d.O. is the lead author and creator of the presented methodology in this paper. M.B. has given his enriching contribution in relation to his knowledge in hosting capacity for electrical systems. P.F.R. and P.M.S.d.C. have provided their contributions as advisors. B.D.B. and A.C.Z. have given equal contributions to this paper.

Funding

This research received was funded by CAPES and Erasmus Mundus—SMART2.

Acknowledgments

This research was supported/partially supported by CAPES, CNPq, INERGE, and FAPEMIG. We thank our colleagues from Federal University of Itajubá, Luleå University of Technology and Instituto Superior Técnico who provided insight and expertise that greatly assisted this research.

Conflicts of Interest

The authors declare no conflict of interest.

References

  1. Carvalho, P.M.; Correia, P.F.; Ferreira, L.A. Distributed Reactive Power Generation Control for Voltage Rise Mitigation in Distribution Networks. IEEE Trans. Power Syst. 2008, 23, 766–772. [Google Scholar] [CrossRef]
  2. Carvalho, P.M.S.; Ferreira, L.A.F.M.; Santana, J.J.E. Single-phase generation headroom in low-voltage distribution networks under reduced circuit characterization. IEEE Trans. Power Syst. 2015, 30, 1006–1011. [Google Scholar] [CrossRef]
  3. Hatziargyriou, N. MICROGRIDS—Large Scale Integration of Micro-Generation to Low Voltage Grids. In Proceedings of the CIGRE 2006, 41st Session Conference, Paris, France, April 2006. [Google Scholar]
  4. De Oliveira, T.E.C.; Carvalho, P.M.S.; Ribeiro, P.F.; Bonatto, B.D. PV Hosting Capacity Dependence on Harmonic Voltage Distortion in Low-Voltage Grids: Model Validation with Experimental Data. Energies 2018, 11, 465. [Google Scholar] [CrossRef]
  5. Ferreira, P.D.F.; Carvalho, P.M.S.; Ferreira, L.A.F.M.; Ilic, M.D. Distributed energy resources integration challenges in low-voltage networks: Voltage control limitations and risk of cascading. IEEE Trans. Sustain. Energy 2013, 4, 82–88. [Google Scholar] [CrossRef]
  6. Busatto, T.; Rönnberg, S.; Bollen, M.H.J. Photovoltaics and Harmonics in Low-Voltage Networks; Energiforsk: Stockholm, Sweden, 2017. [Google Scholar]
  7. Bollen, M.; Hassan, F. Integration of Distributed Generation in the Power System; John Wiley & Sons: Hoboken, NJ, USA, 2011. [Google Scholar]
  8. Santos, N.; Bollen, M.H.J.; Ribeiro, P.F. Methodology for estimation of harmonic hosting. In Proceedings of the 2014 16th International Conference on Harmonics and Quality of Power, Bucharest, Romania, 25–28 May 2014. [Google Scholar]
  9. Etherden, N.; Bollen, M.H.J. Increasing the hosting capacity of distribution networks by curtailment of renewable energy resources. In Proceedings of the 2011 IEEE Trondheim PowerTech, Trondheim, Norway, 19–23 June 2011. [Google Scholar]
  10. Bollen, M.H.J.; Rönnberg, S.K. Hosting capacity of the power grid for renewable electricity production and new large consumption equipment. Energies 2017, 10, 1325. [Google Scholar] [CrossRef]
  11. Rylander, M.; Smith, J.; Sunderman, W. Streamlined Method for Determining Distribution System Hosting Capacity. In Proceedings of the 2015 IEEE Rural Electric Power Conference, Asheville, NC, USA, 19–21 April 2015. [Google Scholar]
  12. Capitanescu, F.; Ochoa, L.F.; Member, S.; Margossian, H.; Hatziargyriou, N.D. Assessing the Potential of Network Recon fi guration to Improve Distributed Generation Hosting Capacity in Active Distribution Systems. IEEE Trans. Power Syst. 2014, 30, 346–356. [Google Scholar] [CrossRef]
  13. Altin, M. Distributed Generation Hosting Capacity Calculation of MV Distribution Feeders in Turkey. In Proceedings of the 2014 IEEE PES Innovative Smart Grid Technologies, Istanbul, Turkey, 12–15 October 2014. [Google Scholar]
  14. Baccino, F.; de Nigris, M.; Gianinoni, I.; Grillo, S.; Massucco, S.; Tironi, E. A methodology for evaluating PEVs hosting capacity margins in distribution grids. In Proceedings of the 2012 IEEE Power and Energy Society General Meeting, San Diego, CA, USA, 22–26 July 2012. [Google Scholar]
  15. O’Connell, A.; Smith, J.; Keane, A. Distribution feeder hosting capacity analysis. In Proceedings of the 2017 IEEE PES Innovative Smart Grid Technologies Conference Europe, Torino, Italy, 26–29 September 2018. [Google Scholar]
  16. Sáiz-marín, E.; Member, S.; Lobato, E.; Egido, I. Local Hosting Capacity Increase by Means of Wind Farm Voltage Control Provision. IEEE Trans. Power Syst. 2014, 29, 1731–1738. [Google Scholar] [CrossRef]
  17. Dubey, A.; Santoso, S. On Estimation and Sensitivity Analysis of Distribution Circuit’s Photovoltaic Hosting Capacity. IEEE Trans. Power Syst. 2017, 32, 2779–2789. [Google Scholar] [CrossRef]
  18. Abdel-salam, M.; Ziedan, H.; Kamel, R.M.; Sayed, K. Effect of Micro-Grid Renewable Micro-sources on Short Circuit Capacity of Hosting Distribution Networks. In Proceedings of the 35th International Telecommunications Energy Conference, Hamburg, Germany, 13–17 October 2013. [Google Scholar]
  19. Harrison, G.P.; Djokic, S.Z. Incorporating harmonic limits into assessment of the hosting capacity of active networks. In Proceedings of the CIRED 2012 Workshop: Integration of Renewables into the Distribution Grid, Lisbon, Portugal, 29–30 May 2012. [Google Scholar]
  20. Arshad, A.; Lindner, M.; Lehtonen, M. An analysis of photo-voltaic hosting capacity in finnish low voltage distribution networks. Energies 2017, 10, 1702. [Google Scholar] [CrossRef]
  21. Falabretti, D.; Merlo, M.; Delfanti, M. Network Reconfiguration and Storage Systems for the Hosting Capacity Improvement. In Proceedings of the 22nd International Conference on Electricity Distribution, Stockholm, Sweden, 10–13 June 2013. [Google Scholar]
  22. Schwaegerl, C.; Bollen, M.H.J.; Karoui, K.; Yagmur, A. Voltage control in distribution systems as a limitation of the hosting capacity for distributed energy resources. In Proceedings of the IET CIRED Conference, Turin, Italy, 6–9 June 2005. [Google Scholar]
  23. Ryckaert, W.R.A.; Ghijselen, J.A.L.; Melkebeek, J.A.A. Harmonic mitigation potential of shunt harmonic impedances and the influence of background distortion. In Proceedings of the 2003 IEEE Bologna Power Tech Conference Proceedings, Bologna, Italy, 23–26 June 2003. [Google Scholar]
  24. Ribeiro, P.F.; Leitao, J.J.A.L.; Lira, M.M.S.; Macedo, J.R.; Grandi, A.L.Z.; Testa, A.; Langella, R.; Cobben, J.F.G.; Browne, N.R. Harmonic distortion during the 2010 FIFA World Cup. In Proceedings of the 2011 IEEE Power and Energy Society General Meeting, San Diego, CA, USA, 24–29 July 2011. [Google Scholar]
  25. Ghijselen, J.A.; Ryckaert, W.R.; Melkebeek, J.A. Required Load Behaviour for Power. In Proceedings of the IEEE Power Engineering Society Summer Meeting, Chicago, IL, USA, 21–25 July 2002. [Google Scholar]
  26. Macedo, R.J.; Carneiro, V.J.R.; Martins, G.A.; Siqueira, V.M.J. The impact of FIFA World Cup 2006 on Power. In Proceedings of the 2007 9th International Conference on Electrical Power Quality and Utilisation, Barcelona, Spain, 9–11 October 2017. [Google Scholar]
  27. Leitão, J.J.A.L.; Fonseca, L.C.A.; Lira, M.M.S.; Soares, L.R.; Ribeiro, P.F. Harmonic distortion on a transmission system during games of the Brazilian National Team in the 2006 world cup. In Proceedings of the 2007 IEEE Power Engineering Society General Meeting, Tampa, FL, USA, 24–28 June 2007. [Google Scholar]
  28. Testa, A.; Langella, R. Harmonic pollution in Italian distribution networks in coincidence with important sport events. In Proceedings of the 2007 IEEE Power Engineering Society General Meeting, Tampa, FL, USA, 24–28 June 2007. [Google Scholar]
  29. Bollen, M.H.J.; Hager, M. Power Quality: Interactions Between Distributed Energy Resources, the Grid, and Other Customers. Electr. Power Qual. Util. Mag. 2005, 1, 51–61. [Google Scholar]
  30. Ribeiro, P.F.; Polinder, H.; Verkerk, M. Planning and designing smart grids: Philosophical considerations. IEEE Technol. Soc. Mag. 2012, 31, 34–43. [Google Scholar] [CrossRef]
  31. De Oliveira, T.E.C.; Ribeiro, P.F.; Santos, I.N. Determining the harmonic hosting capacity of PV sources for a university campus. In Proceedings of the 2016 17th International Conference on Harmonics and Quality of Power, Belo Horizonte, Brazil, 16–19 October 2016. [Google Scholar]
  32. De Oliveira, T.E.C.; Bonatto, B.D.; Filho, J.M.C.; Ribeiro, P.F.; Santos, I.N. Análise Econômica da Hospedagem de Fontes de Geração Distribuída no Sistema Elétrico de um Campus Universitário. In Proceedings of the An. do CBQEE 2015—XI Conferência Bras. sobre Qual. da Energ. Elétrica, Campina Grande, Paraíba, Brazil, 7–10 June 2015. [Google Scholar]
  33. MAthari, H.; Wang, Z.; Eylas, S.H. Time-series analysis of photovoltaic distributed generation impacts on a local distributed network. In Proceedings of the 2017 IEEE Manchester PowerTech, Manchester, UK, 18–22 June 2017. [Google Scholar]
  34. Fan, S.; Pu, T.; Li, L.; Yu, T.; Yang, Z.; Gao, B. Evaluation of impact of integrated distributed generation on distribution network based on time-series analysis. In Proceedings of the 2016 China International Conference on Electricity Distribution (CICED), Xi’an, China, 10–13 August 2016. [Google Scholar]
  35. Smith, J. Modeling and Hosting Capacity Analysis of 16 Feeders; Electric Power Research Institute: Palo Alto, CA, USA, 2015. [Google Scholar]
  36. Rylander, M.; Smith, J.; Lewis, D.; Steffel, S. Voltage impacts from distributed photovoltaics on two distribution feeders. In Proceedings of the 2013 IEEE Power & Energy Society General Meeting, Vancouver, BC, Canada, 21–25 July 2013. [Google Scholar]
  37. Zhu, D.; Jain, A.K.; Broadwater, R.; Bruna, F. Feeder Voltage Profile Design for Energy Conservation and PV HostingCapacity Enhancement. Electr. Power Syst. Res. 2018, 164, 263–271. [Google Scholar] [CrossRef]
Figure 1. Hosting capacity general approach—worst, usual, and best cases.
Energies 12 02576 g001
Figure 2. Dynamic hosting capacity (DHC(t)) approach.
Energies 12 02576 g002
Figure 3. One-line diagram for the PV System of the Center of Excellence in Smart Grids situated in UNIFEI’s campus (Federal University of Itajubá) [4,31,32].
Energies 12 02576 g003
Figure 4. Voltage variation x generated power and the linear dependency in relation to the maximum amount of power calculated by (5)—April 9th, 2015.
Energies 12 02576 g004
Figure 5. Voltage variation x generated power and the linear dependency in relation to the maximum amount of power calculated by Equation (5) for 10th of April 2015 and 11th of April 2015.
Energies 12 02576 g005
Figure 6. Voltage variation x generated power and the linear dependency in relation to the maximum amount of power calculated by Equation (5) for 12th of April 2015 and 13th of April 2015.
Energies 12 02576 g006
Figure 7. Voltage variation x generated power and the linear dependency in relation to the maximum amount of power calculated by Equation (5) for 14th of April 2015 and 15th of April 2015.
Energies 12 02576 g007
Figure 8. Exemplification of calculation of dynamic daily hosting capacity in relation to April 9th, 2015.
Energies 12 02576 g008
Figure 9. The dynamic daily hosting capacity in relation to April 9th, 2015.
Energies 12 02576 g009
Figure 10. PV generation for one week of measurement.
Energies 12 02576 g010
Figure 11. The daily DHC(t) for the in relation to April 10th and 11th, 2015.
Energies 12 02576 g011
Figure 12. The daily DHC(t) for the in relation to April 12th and 13th, 2015.
Energies 12 02576 g012
Figure 13. The daily DHC(t) for the in relation to April 13th and 15th, 2015.
Energies 12 02576 g013
Figure 14. Daily EHC profile versus maximum PV generation.
Energies 12 02576 g014
Figure 15. The Weekly Dynamic Hosting Capacity Profile.
Energies 12 02576 g015
Figure 16. (a) The Total Harmonic Distortion for the System and (b) voltage rise profile for the system.
Energies 12 02576 g016
Figure 17. The DHC(t) profile versus the voltage profile and its meaning.
Energies 12 02576 g017
Table 1. Parameters of the CERIn System [4,31,32].
ParameterDefault Value
Autotransformer45 kVA, 380/230–220/127 V, Z = 1.2%
Transformer 150 kVA 13.8 kV–220/127 V, Z = 4%
PV Cable 18 m, 3P × 6 mm 2 , Cu
PV system + Inverters 15 kW p + 2 Inverters (7.5 kW)
CEMIG 13.8 kVScc = 1000 MVA
Table 2. Hosting Capacity values for the measured week crossing δV = 5%.
DateApril 9thApril 10thApril 11thApril 12thApril 13thApril 14thApril 15th
HC24 kW23.5 kW23.4 kW19.5 kW23.3 kW23.6 kW23.6 KW
Table 3. Daily EHC and PV maximum production.
DayDaily EHC (kWh)Max PV Production (kW)
09/04/201550.9537414.7561
10/04/201582.8177312.8069
11/04/201536.9498213.1786
12/04/201580.4758611.7228
13/04/201569.125513.6711
14/04/201584.2692113.6245
15/05/201582.1810614.2848

