Article

T2S2G: A Novel Two-Tier Secure Smart Grid Architecture to Protect Network Measurements

1
Cluster and Grid Computing Laboratory, Services Computing Technology and System Laboratory, School of Computer Science and Technology, Huazhong University of Science and Technology, Wuhan 430074, China
2
College of Sciences, University of Mosul, Mosul 41002, Iraq
3
The School of Information and Software Engineering, University of Electronic Science and Technology of China, Chengdu 610054, China
4
College of Law, University of Kerbala, Karbala 56001, Iraq
5
State Company of the North Distribution Electricity, Ministry of Electricity, Baghdad 10013, Iraq
*
Authors to whom correspondence should be addressed.
Energies 2019, 12(13), 2555; https://doi.org/10.3390/en12132555
Submission received: 8 June 2019 / Revised: 29 June 2019 / Accepted: 1 July 2019 / Published: 3 July 2019
(This article belongs to the Special Issue Cybersecurity in Smartgrids)

Abstract

:
False data injection (FDI) attacks are a major security threat to smart grid (SG) communication systems. In FDI attacks, the attacker has the ability of modifying the measurements transmitted by smart grid entities such as smart meters, buses, etc. Many solutions have been proposed to mitigate FDI attacks in the SG. However, most of these solutions rely on centralized state estimation (SE), which is computationally expensive. To engulf this problem in FDI attack detection and to improve security of SGs, this paper proposes novel two-tier secure smart grid (T2S2G) architecture with distributed SE. In T2S2G, measurement collection and SE are involved in first tier while compromised meter detection is involved in second tier. Initially the overall SG system is divided into four sections by the weighted quad tree (WQT) method. Each section is provided with an aggregator, which is responsible to perform SE. Measurements from power grids are collected by remote terminal units (RTUs) and encrypted using a parallel enhanced elliptic curve cryptography (PEECC) algorithm. Then the measurements are transmitted to the corresponding aggregator. Upon collected measurements, aggregator estimates state using the amended particle swarm optimization (APSO) algorithm in a distributed manner. To verify authenticity of aggregators, each aggregator is authenticated by a logical schedule based authentication (LSA) scheme at the control server (CS). In the CS, fuzzy with a neural network (FNN) algorithm is employed for measurements classification. Our proposed T2S2G shows promising results in the following performance metrics: Estimation error, number of protected measurements, detection probability, successful detection rate, and detection delay.

1. Introduction

In recent times, smart grids (SGs) have become emerging technology in the electricity market since it offers remote monitoring of distributed energy generation [1,2,3]. Typically, SGs are autonomous and self-sufficient systems that resolve the problems that existed in traditional electrical distribution systems. An SG provides the following advantages over traditional electrical systems: Reliability, flexibility in network topology, efficiency, load adjustment/load balancing, peak curtailment, sustainability, market-enabling, demand response support, enables platform for advanced services, and requires the minimum amount of data. However, the integration electrical systems and cyber infrastructure brings many security threats in SGs [4,5]. In SGs, meter measurements, system parameters, and price information are subjected to vulnerabilities since this information plays a vital role in critical control processes such as state estimation (SE), economic dispatch, load aggregation, demand response, and so on. Attackers inject the false data in the above mentioned information and attempted to compromise smart meters. It is necessary to improve SG security in the following aspects: Data generation security, data acquisition security, data storage security, and data processing security.
A false data injection (FDI) attack is considered as the most harmful attack since it modifies the measurements from grid sensors (or) remote terminal units (RTUs) in order to introduce undetected errors in the estimation of significant state variables [6]. Many research works have been conducted on SG in order to mitigate FDI attacks. The principal component analysis (PCA) approximation method is involved in bad data detection (BDD) in SGs [7]. In the PCA based method, the Jacobian matrix and distribution of state variables are secured from attackers. Game theoretic approaches are also utilized for false data detection [8]. Here the Stackelberg game model with hybrid satisfaction equilibrium-Nash equilibrium algorithm is designed. The effect of FDI attack is evaluated by bi-level modeling method [9]. This evaluation shows that securing the minimal set of sensors (or RTUs) is sufficient to secure an entire SG system since the minimal set of sensors are required to launch the attack. Machine learning approaches such as perceptron, K-nearest neighbor approach, support vector machine (SVM) algorithm, sparse logistic regression method, ensemble learning method, and multiple kernel learning method are also adapted for false data detection [10]. In graph-based cyber security analysis system, FDI attack detection is carried out by maximum matching algorithm, commodity flow maximization algorithm, tree pruning algorithm, and minimum S-cut algorithm [11].
Utmost of the FDI detection methods rely on the SE process. In an SG, SE is a process of estimating state variables that defines the operating conditions of power system such as bus voltage, branch current, and power [12]. Upon estimating operating conditions of the power system, the state of the power system can be predicted. Typically SE is performed in a centralized manner as well as in a distributed manner. Extended Kalman filter is combined with the particle swarm optimization (PSO) algorithm for dynamic SE [13]. The combined SE method is able to tolerate practical issues of missing measurements. An interval SE (ISE) method is presented by utilizing the deep learning algorithm [14]. The stacked auto-encoder (SAE) is designed for ISE to support feature extraction from an electric load. The data driven approach that uses the K-nearest neighbor algorithm and kernel trick is exploited for SE [15]. In the data driven approach, historical data has a major role for SE. Cryptographic algorithms are contributed in the provision of data security in SG [16,17]. In both works, the elliptic curve cryptography (ECC) algorithm is utilized for authentication as well as data security. Involvement of cryptography techniques protects measurement data from intruders during transmission.
The major contributions of this paper in smart grid security are listed as follows,
  • A novel two-tier secure smart grid (T2S2G) architecture is designed with RTUs, aggregators in first tier and control server in second tier. T2S2G protects SG system from FDI attacks and detects compromised meters.
  • Initially the entire T2S2G system is segregated into four sections by the weighted quad tree (WQT) method in order to support the distributed SE process. In each section, an aggregator is deployed in the static position.
  • All measurements are secured by RTUs using the parallel enhanced elliptic curve cryptography (PEECC) algorithm, which ensures high level data security with minimum time consumption.
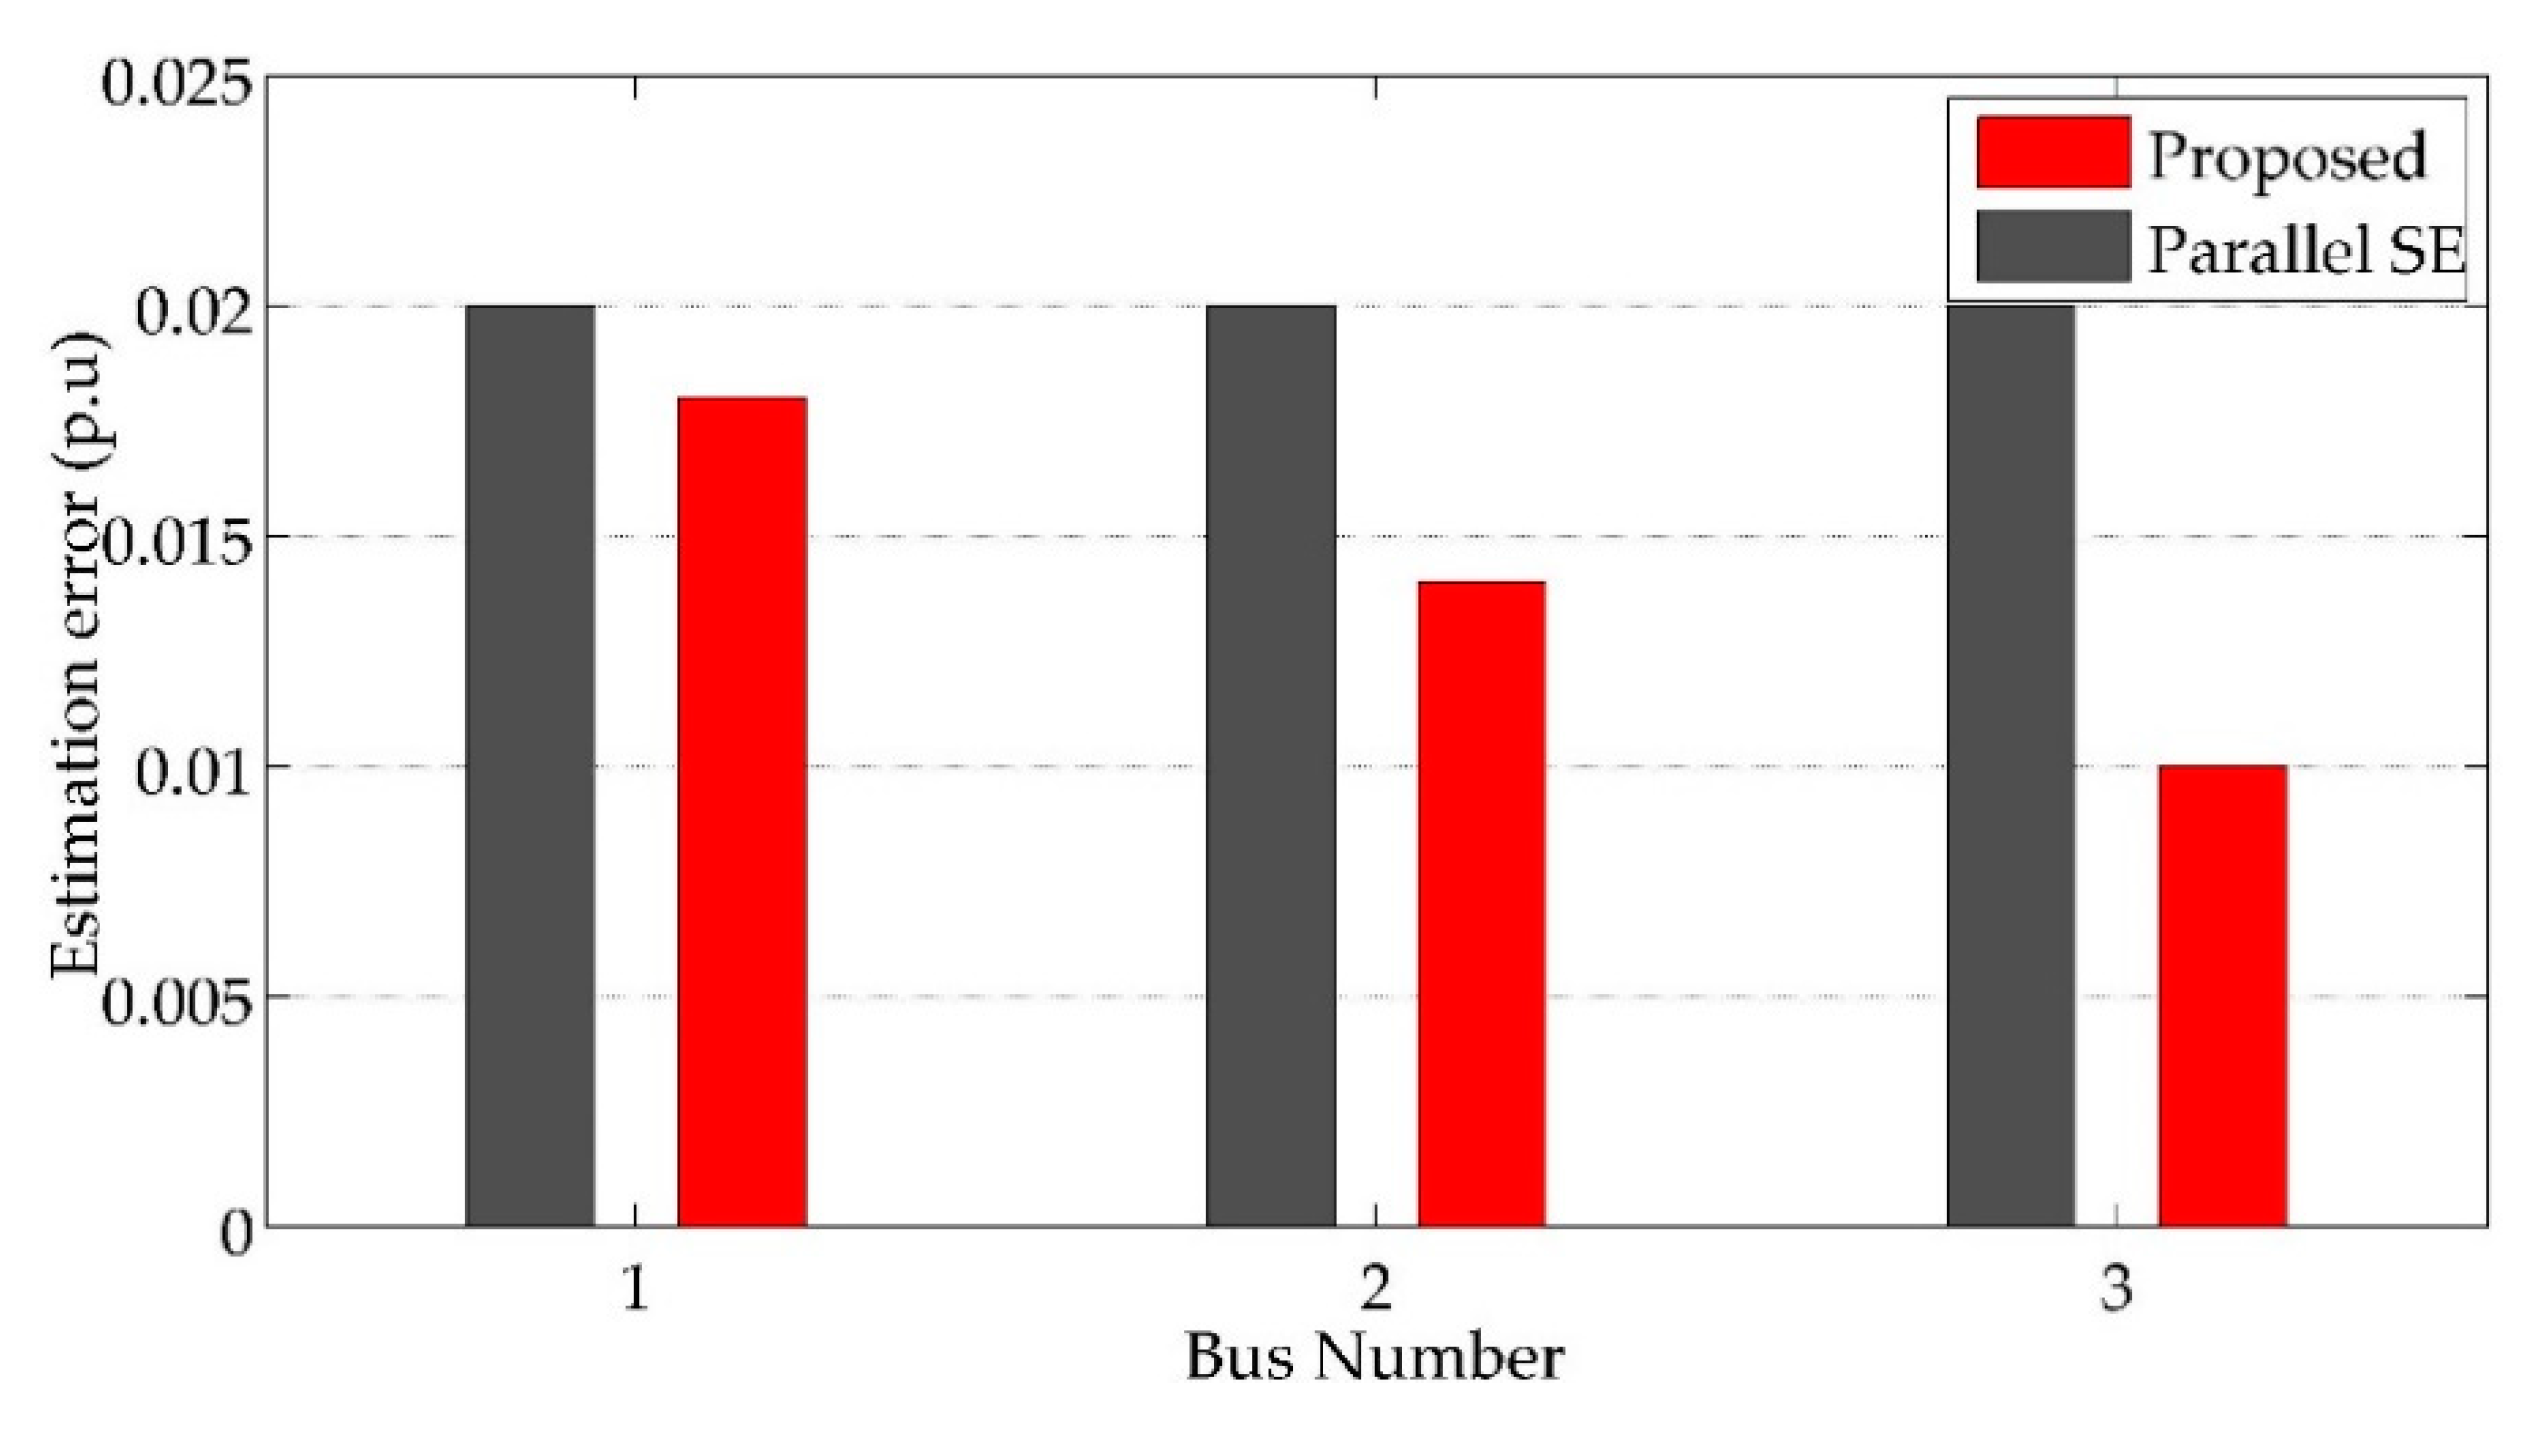
  • After receiving all measurements from RTUs in the section, aggregator performs SE. For SE, we proposed an amended PSO (APSO) algorithm. The proposed SE method minimizes computational overhead as well as estimation error.
  • For verifying authenticity of aggregators, each aggregator is authenticated at the control server by using the logical schedule based authentication (LSA) scheme. Involvement of the LSA scheme prevents processing of unnecessary measurements from intruders in the control server.
  • Compromised meters in the system are identified effectually by analyzing received SE information of each meter. For compromised meter detection, the fuzzy with neural network (FNN) algorithm is employed in the control server.
The rest of this paper is organized as follows: Section 2 discusses the background overview of SGs, SE, and FDI in SG. In Section 3, we survey significant previous works held on SG in the perspective of FDI detection. In Section 4, problems that existed in previous research works and are resolved by the T2S2G system are highlighted. Section 5 explains the T2S2G system with novel algorithms. In Section 6, the performance of the proposed T2S2G system is evaluated in terms of performance metrics. In Section 7, we conclude our achieved contributions with future work.

2. Background Overview

This section provides an overview on the SG system and cyber security. This section comprises two subsections as follows: (i) Security in SG, and (ii) state estimation in SG.

2.1. Security in SG

SG is an electrical grid that uses analog or digital information and communication technology in electrical systems [18,19]. The SG system is able to supply electricity to consumers through two-way digital communication. It enables monitoring, analysis, control, and communication within the supply chain, which improves efficiency with reduced cost. Smart meter and the supervisory control and data acquisition (SCADA) system are significant entities of the SG system. Here the SCADA system is responsible of having the overall control of the system and is often called the control server. A modern SG system has the following capabilities: Self-repairing ability, encouraging participation of consumer in grid operations, ensuring minimum power leakages, and support growth of electricity markets. Typically, SGs are involved with the following benefits:
  • Provides more efficient transmission of electricity,
  • Supports quick restoration of electricity after power disturbances,
  • Efficient in terms of operational and management costs for utilities,
  • SG helps to lower the power costs for consumers,
  • Provides reduced peak amount as well as electricity rates,
  • Supports large-scale renewable energy systems,
  • Integrates consumer–owner power generation systems.
Even though SG is involved with significant benefits; security and privacy is still a challenging issue [20,21]. Involvement of numerous devices such as smart meters, intelligent appliances, distributed generation, and storage equipment located in a physically insecure environment in SG increases the vulnerability of the system. In addition, the wireless technologies used for communication in SG are also vulnerable to several security threats. FDI is a significant security threat in SGs [22]. An FDI attack is launched by attackers within the power system as well as in the wireless technology. In an FDI attack, an attacker modifies the measured value during transmission between smart meters and the control server. Illustration of an FDI attack held on an SG system is depicted in Figure 1.

2.2. State Estimation in SG

SE is a significant function in modern SGs that contributes to the management and control of operations of electrical transmissions [23,24]. Typically, the system state is defined as the minimum set of state variables that are used to define the entire power system through network topology, impedance parameters, etc. The prime objectives of state estimator are listed as follows:
  • Bad data detection,
  • Minimizing small errors found in measurements,
  • Topology errors and wrong switch statuses detection,
  • Managing missing and delayed measurements through providing estimation for unmonitored parts of the system,
  • Analyzing measurements redundancy for estimating network parameters.
The SE process is carried out using two systems as follows: (i) Centralized SE system, and (ii) distributed SE system. The major problems involved in the centralized SE system are high computational overhead and high complexity burdens for the control center [25]. To resolve all problems existing in the centralized SE system, the distributed SE system was introduced. In the distributed SE system, state estimator performs SE in a distributed manner (i.e., on each branch, bus, etc.). The distributed SE system supports high R/X ratios, low real-measurements availability, better scalability, and minimized complexity. Distributed SE achieves better performance than centralized SE in SGs when applied on a high voltage direct current (HVDC) system [26].

3. Related Works

In this section, significant previous research works were analyzed in order to identify the problems raised in SG security. The critical survey opens up the way for innovative research work on SG security.

3.1. Related Works on FDI Attack Detection

Covert cyber assault is a type of FDI attack held on SGs, which was detected by SE [27]. For attack detection, a supervised machine learning algorithm based bad data detector was designed. Initially, the attack was launched by altering the measurements aggregated by sensors. Then the measurements collected over a period were used to train the classifier. In the bad data detector, an SVM classifier was utilized. In SVM, optimal features were selected by the genetic algorithm (GA) in order to improve classification accuracy. However, this method detects modified data and is not able to detect compromised meters. Furthermore, centralized SE introduces high complexity and overhead in the system.
The data injection attack was detected based on the chi-square method and cosine similarity measurement [28]. In this method, measurements were acquired from SCADA using sensors. Upon collected measurements, Kalman filter based SE was performed. Further, a chi-square test and cosine similarity measure were carried out on the estimated value and original measurement. Based on the similarity level (by cosine similarity measure) and deviation level (by chi-square test) the FDI attack was detected. Recursive systematic convolutional (RSC) was combined with the Kalman filter in order to detect FDI attacks in SGs [29]. In such a system, the RSC code was employed to handle impairments in the system states and the Kalman filter was used for SE. Based on semi-definite programming, a feedback control strategy was employed for voltage regulation. In both methods, involvement of the Kalman filter based SE limits the performance of FDI detection in a non-linear system and in uncertainties. However, in general SGs are non-linear. These methods are not suitable for effectual attack detection.
For real-time FDI detection, an attack detection model based on Markov chain based analytical model and the cumulative sum (CUSUM) method was designed [30]. In addition, the CUSUM method was modified as the adaptive CUSUM method in order to improve delay and accuracy. This detection model was recursive in nature and each recursion was comprised with the following tests: (i) Unknown variable solver based on the Rao test, and (ii) multithread CUSUM test. This method detects modified data only and is not able to detect compromised meters. Thus, the possibility of attackers in the system is increased. A collaborative intrusion detection mechanism was presented for FDI attack detection in SGs [31]. In order to protect the measurements from smart meters, a spying domain concept was utilized. The approach was relying on the following constraints: Secret information, event log, and spying domain. Then the attackers were classified into innocent attackers, skilled attackers, and powerful attackers. In this method, secret information is required to be shared in advance. However, if the secret is known to the attacker then the attacker is able to compromise the system easily.
Therefore, most of the FDI detection methods rely on the centralized SE method, which increases the system overhead. In addition, the performance of detectors is limited to linear systems only.

3.2. Related Works on SE and Security in SG

The hybrid PSO (HPSO) algorithm was introduced for SE in a distributed manner [32]. Here the PSO algorithm was improved by incorporating the tournament selection process, which was inspired from GA. In this method, the HPSO algorithm was employed in each sensor, smart meters, phasor measurement unit (PMU), etc., which increases overhead and complexity in the sensors. A PMU based robust SE method (PRSEM) was introduced for real-time monitoring in SGs [33]. In this method the robustness of the SE process was improved by an adaptive weight assignment function. Here the weight assignment function was involved to adjust the measurement weight based on unwanted disturbances from the PMU measurements. This method increases computational complexity due to involvement of multiple computations. Furthermore, SE in this method is not optimal since this method relies on mathematical computations. Hamiltonian cycle theory was adapted for SE in the power system [34]. In this method, the network states were obtained quickly through a calculation scheme in a distributed manner. For tolerating high computation cost, the search space was reduced in this work. However, minimizing search space only was not able to reduce computational cost since Hamiltonian cycle requires high computational cost. In addition, this method is not able minimize the estimation errors.
A mathematical morphology (MM) method was proposed to defend against major security attacks in the SG system [35]. In this method, intrinsic components were obtained by decomposing power system measurements. Based on intrinsic components, the time-frequency sparsity mapping was established. With this information, the measurement source was authenticated by the server. Perhaps this method authenticates the source; this method is not able to secure the measurements. To provide security for measurements, a random-noise-disturbed triple data encryption standard (3DES) algorithm was introduced [36]. Here random computation was introduced by considering power consumption characteristics. Here a 3DES algorithm was involved for wireless links protection whereas an authentication scheme was proposed for terminal protection. However, 3DES algorithm is inefficient in terms of security and time consumption (i.e., it consumes more time to provide low level security). To improve the security level, a state estimation based dynamic encryption and authentication (SEDEA) approach was presented to protect communication between the control center and RTUs [37]. All measurements were encrypted by the SEDEA approach and SE was performed by the control server. In SEDEA, magnitude and phase voltage were considered as a common secret to generate dynamic encryption. Generating the encryption key for each communication in a dynamic manner increases the complexity and overhead in the system. In addition, involvement of the centralized SE also leads to large computational overhead.
Therefore, security provision against FDI attacks in SGs still requires improvements. In addition, SE, which plays a significant role in FDI detection, also needs to be improved with reduced computational complexity.

4. Problem Definition

In FDI attack detection, compromised PMU was identified based on suggestion from host monitors [38]. In this method, SE was performed by utilizing four rules in order to detect anomaly measurements. FDI was detected based on a corresponding rule deployed whereas compromised PMU was detected by enabling a majority voting method. Here the accuracy of FDI detection scheme depends upon the number of rules specified. Increasing the number of rules results in high detection accuracy and also in higher time consumption and complexity. In compromised PMU detection, involvement of the majority rule limits the detection accuracy since it is not ensured that all host monitors are trustworthy. For FDI detection, parallel dynamic SE with the Markov chain model and Euclidean distance was adapted in SGs [39]. To place PMUs optimally, a set of smart meters was considered as critical meters. The states estimated by the Markov chain model were verified to detect an FDI attack with the support of trusted buses. Here attack detection accuracy is improved by measuring the Euclidean distance between trusted bus measurements with all historical data. The Euclidean distance measurement requires large computational time and results in high overhead. Furthermore, requirement of additional trusted buses limits the performance of the detection system.
A greedy subset searching algorithm and a minimal subset selection algorithm were presented to improve the accuracy of the FDI attack detection [40]. Attack detection was carried out by robust principal component analysis (RPCA) algorithm with entry wise constraints. Involvement of centralized SE increases time consumption, complexity, and estimation errors. In addition, this method is only suitable for an attack that alters small number of measurements and fails to detect large attacks in the system. The nodes involved in the SG system were clustered into the most vulnerable nodes, moderately vulnerable nodes, and least vulnerable nodes to defend against an FDI attack [41]. Cluster formation was performed by the constriction factor-PSO (CS-PSO) algorithm. Then authentication and intrusion detection system were enabled to the nodes presented in the most vulnerable cluster. It is worth mentioning here that providing security for the most vulnerability node is not an intelligent decision since moderately vulnerable nodes are also affected by attackers. In other words, this method is not able to detect an attack launched on measurements from the moderately and least vulnerable nodes. To minimize attack detection time in wide area SGs, sequential detector based on generalized likelihood ratio was designed [42]. This method was specially designed to handle a variety of attacking strategies and load situations in power systems. Employing the attack detector and SE in a centralized manner leads to the introduction of huge complexity. Measurement transmission without security encourages the presence of attackers in the system.
Therefore, many of the existing FDI detection methods achieve high detection accuracy in the cost of large computational complexity. In addition, SE, which supports FDI detection, also is involved with high computational complexity. The problems highlighted in this section were resolved by our proposed T2S2G system.

5. Proposed T2S2G System

5.1. System Overview

In this paper, we designed a novel T2S2G system that consisted of power generators ( G ), buses ( B ), load ( L ), RTUs, aggregators ( A ), and control server ( C S ). The overall system architecture is depicted in Figure 2.
Here, the power generated by power generators is distributed among loads through transmission line. The control server is involved with SCADA, and the energy management system. All measurements generated by smart meters ( S M s ), and PMUs are collected by RTUs and transmitted to the control server (CS) through buses. The attackers attempted to inject false data during measurement transmission. To defend against such FDI attacks, distributed SE is performed in T2S2G. To support distributed SE, the entire T2S2G system is segmented into four sections initially. For system partitioning, the WQT method is proposed. In each section, an aggregator node is deployed in static position. All measurements collected by RTUs are encrypted using the PEECC algorithm to protect measurements from adversaries. Then the aggregator performs the SE upon aggregated measurements using the APSO algorithm in a distributed manner. Each aggregator is authenticated at the CS through the LSA scheme. Finally, the CS detects compromised meters and PMUs by analyzing measurements collected from aggregators. For compromised meter detection, the FNN algorithm is employed in the CS. Each significant process is explained in the following sections.

5.2. WQT Method Based System Partitioning

System partitioning is the foremost process and it is performed by using the WQT method. The first tier in the system is partitioned into four sections as S = { S 1 , S 2 , S 3 , S 4 } based on the weight value. Here each generator and load involved in the system is provided as the weight value. Typically, quad tree divides the space into adaptable cells based on the capacity value. In quad tree, each cell is provided with a maximum capacity value. When the cell reaches its maximum capacity value, then the cell is divided into four cells. This process is iterated until the necessary conditions are met. However, in the T2S2G system, quad tree is adapted for dividing the first tier in the system space into four sections. In quad tree the entire system space ( S y s S ) is initiated as the root ( R ) node of the tree. Then the system space is divided into four sections such that the root node has exactly four children. Here each section has the maximum capacity value, which is computed from weight values. The major entities of the SG system are G , B , and L . Each entity has different specification in the different SG system. We utilize these specification values as weight values for the entities. Based on weight value, the capacity of each section is assigned. The system is partitioned until each section reaches its maximum capacity. For example, in the IEEE-9 bus system, the G and L has relative power specification as depicted in Table 1.
Based on the related power value, maximum capacity for each section is assigned. For IEEE-9 bus system, the capacity of each section is assigned as follows:
C ( S 1 ) = W ( G 1 ) ,
C ( S 2 ) = W ( L 1 ) + W ( L 2 ) ,
C ( S 3 ) = W ( G 2 ) ,
C ( S 4 ) = W ( G 3 ) + W ( L 3 ) .
The above equations are suitable only for the IEEE-9 bus system and have different values for different bus systems. Upon capacity of each section, the system is partitioned into four sections. The capacity of four sections is determined by Table 1 as follows:
C ( S 1 ) = W ( G 1 ) = 512 ,
C ( S 2 ) = W ( L 1 ) + W ( L 2 ) = 125 + 90 = 215 ,
C ( S 3 ) = W ( G 2 ) = 270 ,
C ( S 4 ) = W ( G 3 ) + W ( L 3 ) = 125 + 100 = 225 .
The first tier of the system is partitioned into four sections based on weight values of power generators and load. System partitioning is performed to enable distributed SE in the system. The network partitioning by the WQT method is shown in Figure 3.
After completion of system partitioning, the aggregator is deployed in each section as follows:
S 1 A 1 ; S 2 A 2 ; S 3 A 3 ; S 4 A 4 .
Here A 1 is responsible to aggregate measurements from G 1 , B 2 , and B 7 whereas A 2 is responsible for aggregating measurements from L 1 , L 2 , B 1 , and B 8 . Similarly, A 3 aggregates measurements from G 2 , B 1 , and B 4 . Measurements from G 3 , L 3 , B 3 , and B 9 are aggregated by A 4 . In this manner, all measurements are collected by a deployed aggregator in each section. The measurements are collected from buses, generators by RTUs.

5.3. PEECC Algorithm for Measurements Protection

To protect the measurements from adversaries during transmission, all measurements collected by RTUs are encrypted before transmitting to aggregator. For measurement protection, we proposed the PEECC algorithm based encryption scheme, which is similar in terms of performance to [43]. In the PEECC algorithm, measurement security is ensured with minimum time consumption. Typically, the ECC algorithm is a public key algorithm in which two separate keys such as the private key ( K P r i v ) and public key ( K P u b ) . In the PEECC algorithm, the ECC algorithm is adapted for key generation. In the PEECC algorithm, at first the measurements are converted into American standard code for information interchange (ASCII) codes. The generated ASCII codes are divided into ‘ n ’ number of data and encrypted in a parallel manner using ‘ K P u b ’ of the aggregator. Here key generation is performed based on the elliptic curve, which is represented as follows:
y 2 = x 3 + a x + b ,
where, 4 a 3 + 27 b 2 0 . A prime number ‘ P ’ is a point on elliptic curve if it satisfies the following equation:
y 2 ( m o d   P ) = x 3 + a x + b ( m o d   P ) .
When the condition is satisfied then the key generation process is performed as follows:
  • Select a random number ‘ ’ between the range of [ 1 ,   P 1 ] where ‘ P ’ is a prime number that satisfies Equation (11).
  • Generate the public key ‘ K P u b ’ as follows:
    K P u b = * G ,
    where ‘ G ’ is a base point in ECC curve. In this manner the public key is generated in the ECC algorithm.
  • Generate the private key ‘ K P r i v ’ using the public key.
After generation of ‘ K P u b ’ and ‘ K P r i v ’, the next process is to secure the measurements obtained from meters and buses. Initially the measurement ( Z i ) from buses/meters is divided into ‘ n ’ sub-measurements by RTU. The measurement from ‘ i t h ’ bus/meter is divided as follows:
Z i = [ Z i 1 , Z i 2 , , Z i n ] .
Then each sub-measurement is encrypted using ‘ K P u b ’ of the corresponding aggregator. Encryption is performed in a parallel manner in order to minimize the time consumption. The overall process of the PEECC algorithm is depicted in Figure 4. The PEECC algorithm involves of two steps as follows: In the first step, each sub-measurement is converted into an ASCII code, and in the next step each coded measurement is encrypted using ‘ K P u b ’. Using the PEECC algorithm, RTUs convert all measurements into the ciphertext. Then, the measurements are transmitted to aggregators.
Algorithm 1 explains the process of the PEECC algorithm. Then, the measurements are transmitted to aggregators. In the aggregator, the collected measurements are decrypted using ‘ K P r i v ’ in order to obtain the original measurements. Here the decrypted measurements are obtained in the form of the ASCII code, which is to be converted into plaintext again.
Algorithm 1 PEECC algorithm
Input: Plain text of Z i
Output: Cipher text of Z i ( E n [ Z i ] )
  • Begin
  •  Obtain P that satisfies (11)
  •  Generate K P u b using (12)
  •  Divide Z i Z i 1 , Z i 2 , , Z i n
  • For each Z i n Z i
  •   Convert Z i n A S C I I i n
  •   For all A S C I I i n
  •    Obtain ciphertext,
  •     E n [ Z i n ] = { G ,   A S C I I i n + K p u b }
  •    Generate E n [ Z i ]
  •     E n [ Z i ] = { E n [ Z i 1 ] , E n [ Z i 2 ] , , E n [ Z i n ] }
  • End for
  • End for
  • End
Involvement of the PEECC algorithm protects the measurements during transmission from aggregators to the CS.

5.4. APSO Algorithm Based Distributed SE

In the T2S2G system, SE is performed at each aggregator in a distributed manner. For SE, we employed the APSO algorithm in each aggregator. In general, SE consists of estimating the state vector ( v ) from a set of measurements ( z ) in the presence of an error ( e ). The functional relation between v , z , e is mathematically modeled as follows:
z i = f i ( v ) + e i .
Here, i = 1 , 2 , 3 , , m represents ‘ m ’ number of measurements. The ‘ i t h ’ measurement vector is denoted as ‘ z i ’. The non-linear function relating the state variables is represented as ‘ f i ( v ) ’ and ‘ v ’ is the state vector of dimension ‘ n ’. Noise presented in the measurements is represented by noise vector ‘ e i ’. When the errors are minimized, then all available measurements and calculated measurement variables are contained in the function ‘ f ( v ) ’. The estimated measurement can be rewritten as:
Z i = Z T r u e + R A N D × σ i ,
where ‘ Z t r u e ’ represents the true measurement and ‘ R A N D ’ denotes the random number. The standard deviation of ‘ i t h ’ measurement error is represented by ‘ σ i ’. The estimated variables are voltage magnitudes, angles, and tap positions (i.e., v i = [ V i k   δ i k   t i k ] ) . Based on true measurements and estimated measurements the error values can be computed. Here we have provided true measurement values for the three-phase power system ( l = 3 ). The objective of the proposed SE is to minimize the square of difference between the true measurement and estimated measurement (i.e., estimation error). It can be expressed as follows:
m i n J ( v ) = i = 1 m e i 2 .
In the T2S2G system, the PSO algorithm is improved as the APSO algorithm for SE. In general, the PSO algorithm is a population based optimization algorithm proposed to find the optimal solution. We adapt the APSO algorithm for SE and it includes the following steps:
  • Step 1: In this step, all particles are initialized in the APSO algorithm. In APSO based SE, the state variables such as V i k , δ i k , t i k are initialized as particles.
  • Step 2: The next step is to evaluate the fitness value of each particle initialized. In APSO, the fitness value ( F V ) of each particle is computed as follows:
    F V = 1 J ( v ) + P e ( v ) .
    The penalty function ( P e ( v ) ) is computed as follows:
    P e ( v ) = ρ i Q ( v i v 0 ) 2 .
    The penalty function is computed in terms of the number of penalized control variables ( Q ), scalar quadratic penalty weight ( ρ ), current value of control variable ( v 0 ), and control variable penalty offset ( v i ).
  • Step 3: In this step, the velocity of each particle is updated based on ‘ F V ’. Firstly, the fitness value of the particle in the current iteration is compared with the previous value in order to update the particle best ( p b e s t ) value. If the current ‘ F V ’ value is higher than the previous ‘ F V ’ then the current value is updated as ‘ p b e s t ’, otherwise the previous value is maintained as ‘ p b e s t ’. Then the current ‘ F V ’ of a particle is compared with ‘ F V ’ of other particles in order to update the global best ( g b e s t ) value. After the update of ‘ p b e s t ’ and ‘ g b e s t ’, the velocity of each particle is updated as follows:
    υ [ c + 1 ] = υ [ c ] + * r a n d * ( p b e s t p r e s e n t ) + * r a n d ( g b e s t p r e s e n t ) .
    Current velocity of the particle ( υ [ c + 1 ] ) is computed in terms of the previous velocity of the particle ( υ [ c ] ), two learning factors ( , ), and random number ( r a n d ). The current position of particle is updated as:
    P o s [ c + 1 ] = P o s [ c ] + υ [ c + 1 ] .
    Current position P o s [ c + 1 ] is computed based on the previous position ( P o s [ c ] ) and current velocity ( υ [ c + 1 ] ).
  • Step 4: This step in the APSO algorithm differs from the traditional PSO algorithm. In this step, new solutions are generated by employing L e v y   f l i g h t s in the PSO algorithm. In this step, new solutions are generated as follows:
    v ( t + 1 ) = v t + α L e v y ( λ ) .
    Here ‘ α ’ is step size and always ‘ α > 0 ' while ‘ L e v y ( λ ) ’ is the transition probability. Then the new solutions also are evaluated based on the fitness value as in Step 2 until maximum iteration has been reached. After completion of the maximum iteration, the optimal solution for each state variable is estimated.
  • Step 5: In this step, attack detection is carried out based on estimated states. For standard direct current (DC) power flow, the measurements are received by aggregators as follows in the absence of an attacker:
    z = H v + e .
The measurements are obtained by (22) where ‘ H ’ represents the measurements matrix and ‘ e ’ represents the error matrix. In the presence of false data, the measurement vector is defined as follows:
z = H v + a + e .
Here ‘ a ’ is the attack vector injected by the attacker and it is non-zero for the measurement vectors obtained by compromised meters or sensors. This can be defined as follows:
a i 0 ,           i f   ( i t h   m e t e r   i s   c o n t r o l l e d   b y   a t t a c k e r ) .
In SG, an attacker is able to control more than one meter. For all compromised meters the attack vector is non-zero in the measurement vector. In addition, the attack vector becomes strong when a = H C . For such an attack, we obtain measurements as:
z = H ( v + C ) + e .
Here ‘ v ’ is indistinguishable from ‘ v + C ’. The aggregator decides that ‘ v + C ’ as a true measurement. Attack detection is carried out based on the similarity between estimated measurements and obtained measurements. We adapt Cosine similarity measurement for attack detection. Similarity between the estimated measurement ‘ v ^ ’ and obtained measurement ‘ v ˇ ’ is computed as follows:
S i m ( v ^ , v ˇ ) = v ^ . v ˇ | v ^ | × | v ˇ | .
When both estimated and obtained measurements are exactly the same then the similarity will be ‘ 1 ' . Otherwise, the similarity value will be decreased. Here we can see that when the attack vector is injected, then the obtained measurement has a large deviation with estimated measurements, which results in a lower similarity level. If the similarity level is too low, then the FDI attack is detected. In our work, attack detection accuracy is improved since we have estimated states using the APSO algorithm accurately. The affected measurements are detected in this step by the aggregator.
In Algorithm 2, the overall process involved in the APSO algorithm based SE and FDI detection is illustrated. In this manner, the injected false data is identified by aggregators.
Algorithm 2 APSO based SE
Input: Measurements from RTUs Z i Z
Output: Estimated state variables v i = [ V i k   δ i k   t i k ]
  • Begin
  •  For all aggregators
  •  Collect Z i from RTUs
  •   For each Z i Z
  •    Initialize all particles
  •    For each particle
  •     Evaluate F V
  •     Update p b e s t and g b e s t
  •     If (current p b e s t > previous p b e s t )
  •      Assign current p b e s t p b e s t
  •     Else
  •      Keep previous p b e s t p b e s t
  •     If (current p b e s t > g b e s t )
  •      Assign current p b e s t g b e s t
  •     Else
  •      Goto next particle
  •     End if
  •     End if
  •     Update velocity and position
  •     If (Maximum iteration reached)
  •      Obtain optimal v i = [ V i k   δ i k   t i k ]
  •     Else
  •      Goto 10
  •     End if
  •    End for
  •    Compute S i m ( v ^ , v ˇ )
  •    If ( S i m ( v ^ , v ˇ ) < 0.5)
  •     FDI is identified
  •    Else
  •     Data is not false data
  •    End if
  •   End for
  • End for
  • End

5.5. LSA Based Authentication and FNN Based Classification

The aggregator is responsible to estimate the state variables and to report to the CS in tier-2. In the CS, each aggregator is authenticated by the LSA based authentication scheme. Authentication is performed in order to verify the authenticity of aggregators presented in tier-1 of T2S2G system. All four aggregators are registered with the CS and provided with secure keys ( K P u b , K P r i v ) generated by the ECC algorithm. Here each aggregator has its own ID, and secure keys. In LSA, the logical operator is adapted for authentication in a scheduled manner. Here we have utilized AND operator in which the output will be true if both inputs are true. In the LSA scheme, scheduling is performed on secrets shared between the aggregator and CS. The process is performed in two stages as follows:
  • First stage: In LSA, the first stage is initiated by the aggregator. In this stage, the aggregator submits the ID and password ( P W ) to the CS. The CS verifies the ID and ‘ P W ’, if ID and ‘ P W ’ is matched then it considers the aggregator request for the second stage. In this stage, AND logic is utilized. Otherwise, the aggregator request is denied.
  • Second stage: The aggregator that completes the first stage is considered for the second stage. In this stage, the CS requests for a shared secret value ( S S S ) for the current session from the aggregator. Each aggregator is provided with a set of ‘ S S ’ including four secret values initially. Each value is scheduled for different sessions. Upon receiving a ‘ S S S ’ request, the aggregator submits its current session ‘ S S S ’. If the current session ‘ S S S ’ submitted by the aggregator is true, then the aggregator is authenticated at the CS.
The scheduling process enabled in the LSA scheme is depicted in Figure 5. For each session, the aggregator must submit the corresponding ‘ S S S ’ value in order to crack the LSA scheme.
After completion of successful authentication, all measurements aggregated by the aggregator are collected by the CS.
Here each aggregator reports the aggregated measurements, estimated state variables, similarity level, and error level. Upon received measurements, the CS classifies measurements into two classes as: (i) Measurements from normal meters, and (ii) measurements from compromised meters. For efficient classification, the FNN algorithm is employed in the CS. In FNN, error level ( e l i ) between estimated measurement and true measurement, similarity level ( S i m l i ) between estimated measurements and obtained measurements, and trust level ( T l i ) for ‘ i t h ’ bus/meter are considered as fuzzy metrics. Here the error level and similarity level are provided by the aggregator and the trust level of the meter/bus is estimated by the CS. All measurements are taken as input in the input layer of FNN and fuzzy rules are applied on a hidden layer. The classified result is obtained in the output layer as shown in Figure 6.
Here the weight value is computed in each hidden layer in order to detect the malicious measurements. If a measurement is classified as malicious, then the meter from which the measurement is obtained is verified. The trust value of that meter is checked. If the trust value is also too low, then that meter is identified as the compromised meter. In this manner, the compromised meter detection is carried out in the CS by using the FNN algorithm. The fuzzy rules deployed in FNN are depicted in Table 2.
Here the trust level is computed based on previous behavior of the bus/meter. Trust value is considered to be 100 to represent that the meter is highly trusted and 0 to represent that the meter is highly untrusted. Error level and similarity level are computed in the rage between [0, 1]. By utilizing fuzzy rules, all measurements are classified.
Our proposed T2S2G architecture improves the security of the SG system by employing effective system partitioning, security for measurements, efficient distributed SE process, authentication process, and compromised meter detection process.

6. Performance Evaluation

In this section, the performance of the proposed T2S2G system was evaluated in terms of performance metrics. This section comprises two subsections as follows: (i) The simulation setup, and (ii) comparative analysis.

6.1. Simulation Setup

To explore the efficiency of our proposed T2S2G in FDI detection and security provision, we performed simulations on MATLAB-2017b (MathWorks, Natick, MA, USA). The experiments were conducted on a 2.5 GHz Intel i3-M380 processor, with a Windows 7 operating system of 64-bits, and 4 GB RAM (Lenovo PC HK limited, Hong Kong, China). The proposed T2S2G system was modeled based on the IEEE-9 bus system. The overall system was partitioned into four sections by the WQT method. The overall simulation setup is shown in Figure 7.
In Table 3, significant simulation parameters considered to implement T2S2G system are depicted. Here bus9 and bus6 are compromised buses.

6.2. Comparative Analysis

In this sub-section, we compared our proposed T2S2G system with previous works parallel dynamic SE [39], sparse method [40], and quickest detection method [42]. The evaluation was performed in terms of the estimation error, number of protected measurements, detection probability, successful detection rate, and detection delay. One of most of the evaluation assumption attack scenarios in SG communication is that the presence of one attacker has knowledge on grid topology and security mechanisms [39].
In Table 4, significant previous works were analyzed with demerits involved in each method. Our proposed work was compared with these methods in order to show betterment achieved by our work.
• Effectiveness on estimation error.
Estimation error is defined as the difference between the real state and estimated state. The estimation error is too large under the attack condition and minimized in the normal condition. The voltage magnitude estimated in the T2S2G system is compared with its original state. The proposed APSO algorithm in the T2S2G system estimates voltage magnitude near to real-state values (i.e., estimated states and real states are nearly the same).
In Figure 8, we compared the estimation error obtained by our proposed APSO based SE with the previous parallel SE method. Here we could see that APSO based distributed SE minimized the estimation error significantly compared with parallel SE even in the presence of an FDI attacker. The reason behind large estimation error in the parallel SE method is that this method requires additional trusted buses for SE and attack detection. However, it is not ensured that the trusted buses always provide original values. In the T2S2G system, all measurements are protected by the PEECC algorithm before being transmitted for SE. This will prevent the measurements from alterations. In addition, the APSO algorithm has the ability to estimate states optimally by considering the estimation error and penalty function in the fitness function. The proposed work minimized the estimation error significantly. In parallel SE, average estimation error was obtained as 0.02 p.u whereas the APSO algorithm obtained an average estimation error as 0.014 p.u. In our proposed T2S2G system, 0.6% of the estimation error was minimized compared with parallel SE.
• Effectiveness on the number of protected measurements.
This metric estimates the number of measurements protected from the adversaries in the system. The number of measurements protected in the proposed work was compared with the sparse method since it protects a subset of measurements from adversaries.
In Figure 9, the number of measurements protected in the T2S2G system and in the sparse method was compared. In the sparse method, the minimal subset of measurements was identified and the measurements in that subset were protected from adversaries. The sparse method was only able to protect the minimum number of measurements up to five measurements. However, in the T2S2G system the PEECC algorithm was proposed to protect the measurements and the FNN algorithm was employed to identify the compromised meters and buses. Each measurement collected by RTU was encrypted using the PEECC algorithm, which protects the measurements from adversaries during transmission. With the support of the PEECC algorithm, it protects 85% of measurements from adversaries. Here 300 measurements out of 350 measurements were protected by the PEECC algorithm. This analysis shows that the proposed T2S2G system had the ability to protect the measurements in the SG system.
• Effectiveness of detection probability.
Detection probability defines the ability of the attack detection method to identify the attacker accurately. In the SG system, this metric evaluates the efficiency of the SE method since attack detection is carried out based on estimated states.
We compared the detection probability attained by the sparse method and proposed T2S2G system in Figure 10. The graphical analysis shows that the proposed T2S2G system achieved a detection probability better than the sparse method. Detection probability was minimized in the sparse method since it increases estimation errors due to the centralized SE process.
However, SE plays an important role in attack detection in the SG system. The sparse method suffers from lower detection probability. In the T2S2G system, better detection probability is achieved with the support of an effective APSO algorithm based SE, and FNN based compromised meter detection. Involvement of efficient processes in the T2S2G system improved the detection probability. Averagely, 81% of attackers were detected by the sparse method whereas 90% of attackers were identified accurately in the T2S2G system. The T2S2G system improved detection probability up to 9% compared with the sparse method.
• Effectiveness on the successful detection rate.
This metric is also evaluating the efficiency of the proposed T2S2G system in attack detection. This metric measures the number of compromised meters/attackers identified as attackers accurately.
In Figure 11, we compared the successful detection rate achieved by the proposed T2S2G system and existing quickest detection method. From the analysis we can understand that the proposed T2S2G system achieved a detection rate better than the previous quickest method. In our work, 88% of attackers and compromised meters were detected with the help of APSO based SE and FNN based measurement classification processes. However, in the quickest detection method measurement security is not focused and the centralized SE process increases the system complexity. Since the measurements are not protected, there are more chances for measurements to be corrupted by attackers. The SE method results in inaccurate estimation, which leads to minimized detection rate. In the quickest detection method, 68% attackers were detected averagely (i.e., the proposed work achieved a 20% better detection rate than previous work).
• Effectiveness on detection delay.
Detection probability and detection rate measures the efficiency of the T2S2G system in attack detection. The attack detection performance is further evaluated based on the detection delay. Detection delay is defined as the time consumed for attack detection by the T2S2G system.
Comparative analysis on detection delay is illustrated in Figure 12. For an efficient detection system, this metric should be low as possible. The analysis shows that the proposed T2S2G system required a minimum time for attack detection. The detection delay in the quickest detection method was large since the involvement of centralized SE increases the time consumption for attack detection. However, in the T2S2G system SE process was performed in a distributed manner that minimizes the time required for attack detection. In addition, the involvement of FNN in CS also helps to minimize the detection delay. In the quickest method, 6.5 ms of detection delay was averagely experienced for attack detection. This delay was minimized to 1.95 ms in the T2S2G system 4.55 ms lower than the previous quickest method.
The overall comparative analysis shows that the proposed T2S2G system achieved a better performance than previous works in security provisioning of SG systems. Involvement of the WQT method supports the distributed SE process. The measurements are protected by the PEECC algorithm and SE is performed by using the APSO algorithm. Each aggregator is authenticated in the CS through the LSA scheme. In the CS, FNN is employed for compromised meter detection by analyzing aggregated measurements. The proposed T2S2G system improved security of SG systems under an FDI attack.

7. Conclusions

This paper proposed a novel T2S2G system to provide protection for SG systems against an FDI attack. To minimize overhead and complexity distributed SE process is involved in the T2S2G system. The distributed SE process is supported by system partition, which is performed by the WQT method. In each partition, an aggregator is deployed to enable the distributed SE process. All measurements collected by RTUs are encrypted using the PEECC algorithm in order to ensure that no adversary can alter the measurements during transmission. Upon aggregated measurements, aggregator estimates state variables. For the SE process, the APSO algorithm is proposed in which the estimation error is minimized. Aggregators are authenticated at the CS through the LSA scheme to verify the authenticity of aggregator. Then the measurements are received by the CS from legitimate aggregators. For measurement classification, FNN is employed in the CS to identify the compromised meter/buses. The proposed T2S2G system improved security of SGs under an FDI attack through SE, encryption, authentication, and classification processes. Simulation of the T2S2G system showed better performance was achieved by the T2S2G system in terms of estimation error, number of protected measurements, detection probability, detection rate, and detection delay.
In the future, we have planned to extend the T2S2G system with other attack detection mechanisms to defend against attacks held on the SCADA system and under more diverse conditions. In addition, the T2S2G system can be extended for more investigation regarding to energy consumption, measurements computation, and communication overhead.

Author Contributions

The work was supervised by H.J. Simulation and analysis of the results have been performed by I.T.A. The modeling process has been performed and discussed by I.H.A.; S.M.T.; W.H.A. and F.M.F.F.

Funding

This research received no external funding.

Acknowledgments

The authors would like to thank the staff of the School of Computer Science & Technology/Huazhong University of Science & Technology, Wuhan, China and all the people who assisted in this work.

Conflicts of Interest

The authors declare no conflict of interest.

Acronyms

AcronymsParameter
3DESTriple Data Encryption Standard
APSOAmended Particle Swarm Optimization
BDDBad Data Detection
CSControl Server
CS-PSOConstriction Factor Particle Swarm Optimization
ECCElliptic Curve Cryptography
FDIFalse Data Injection
FNNFuzzy with Neural Network
GAGenetic Algorithm
HPSOHybrid Particle Swarm Optimization
ISEInterval State Estimation
LSALogical Schedule Based Authentication
MMMathematical Morphology
PCAPrincipal Component Analysis
PEECCParallel Enhanced Elliptic Curve Cryptography
PMUPhasor Measurement Unit
PRSEMPMU based Robust State Estimation Method
PSOParticle Swarm Optimization
RPCARobust Principal Component Analysis
RSCRecursive Systematic Convolutional
RTURemote Terminal Unit
SAEStacked Auto Encoder
SCADASupervisory Control and Data Acquisition
SEState Estimation
SEDEAState Estimation Based Dynamic Encryption and Authentication
SGSmart Grid
SVMSupport Vector Machine
T2S2GTwo-Tier Secure Smart Grid
WQTWeighted Quad Tree

References

  1. Tuballa, M.L.; Abundo, M.L. A review of the development of Smart Grid technologies. Renew. Sustain. Energy Rev. 2016, 59, 710–725. [Google Scholar] [CrossRef]
  2. Cintuglu, M.H.; Mohammed, O.A.; Akkaya, K.; Uluagac, A.S. A survey on smart grid cyber-physical system testbeds. IEEE Commun. Surv. Tutor. 2016, 19, 446–464. [Google Scholar] [CrossRef]
  3. Bayindir, R.; Colak, I.; Fulli, G.; Demirtas, K. Smart grid technologies and applications. Renew. Sustain. Energy Rev. 2016, 66, 499–516. [Google Scholar] [CrossRef]
  4. Asghar, M.R.; Dán, G.; Miorandi, D.; Chlamtac, I. Smart meter data privacy: A survey. IEEE Commun. Surv. Tutor. 2017, 19, 2820–2835. [Google Scholar] [CrossRef]
  5. Tan, S.; De, D.; Song, W.-Z.; Yang, J.; Das, S.K. Survey of security advances in smart grid: A data driven approach. IEEE Commun. Surv. Tutor. 2017, 19, 397–422. [Google Scholar] [CrossRef]
  6. Liang, G.; Zhao, J.; Luo, F.; Weller, S.R.; Dong, Z.Y. A review of false data injection attacks against modern power systems. IEEE Trans. Smart Grid 2017, 8, 1630–1638. [Google Scholar] [CrossRef]
  7. Yu, Z.-H.; Chin, W.-L. Blind false data injection attack using PCA approximation method in smart grid. IEEE Trans. Smart Grid 2015, 6, 1219–1226. [Google Scholar] [CrossRef]
  8. Sanjab, A.; Saad, W. Data injection attacks on smart grids with multiple adversaries: A game-theoretic perspective. IEEE Trans. Smart Grid 2016, 7, 2038–2049. [Google Scholar] [CrossRef]
  9. Khanna, K.; Panigrahi, B.K.; Joshi, A. Bi-level modelling of false data injection attacks on security constrained optimal power flow. IET Gener. Transm. Distrib. 2017, 11, 3586–3593. [Google Scholar] [CrossRef]
  10. Ozay, M.; Esnaola, I.; Vural, F.T.Y.; Kulkarni, S.R.; Poor, H.V. Machine learning methods for attack detection in the smart grid. IEEE Trans. Neural Netw. Learn. Syst. 2015, 27, 1773–1786. [Google Scholar] [CrossRef]
  11. Bi, S.; Zhang, Y.J.A. Graph-based cyber security analysis of state estimation in smart power grid. IEEE Commun. Mag. 2017, 99, 2–9. [Google Scholar] [CrossRef]
  12. Dehghanpour, K.; Wang, Z.; Wang, J.; Yuan, Y.; Bu, F. A survey on state estimation techniques and challenges in smart distribution systems. IEEE Trans. Smart Grid 2018, 10, 2312–2322. [Google Scholar] [CrossRef]
  13. Hu, L.; Wang, Z.; Rahman, I.; Liu, X. A constrained optimization approach to dynamic state estimation for power systems including PMU and missing measurements. IEEE Trans. Control Syst. Technol. 2015, 24, 703–710. [Google Scholar] [CrossRef]
  14. Wang, H.; Ruan, J.; Wang, G.; Zhou, B.; Liu, Y.; Fu, X.; Peng, J. Deep learning-based interval state estimation of AC smart grids against sparse cyber attacks. IEEE Trans. Ind. Inform. 2018, 14, 4766–4778. [Google Scholar] [CrossRef]
  15. Weng, Y.; Negi, R.; Faloutsos, C.; Ilić, M.D. Robust data-driven state estimation for smart grid. IEEE Trans. Smart Grid 2016, 8, 1956–1967. [Google Scholar] [CrossRef]
  16. Abbasinezhad-Mood, D.; Nikooghadam, M. An anonymous ECC-based self-certified key distribution scheme for the smart grid. IEEE Trans. Ind. Electron. 2018, 65, 7996–8004. [Google Scholar] [CrossRef]
  17. He, D.; Chan, S.; Guizani, M. Cyber security analysis and protection of wireless sensor networks for smart grid monitoring. IEEE Wirel. Commun. 2017, 24, 98–103. [Google Scholar] [CrossRef]
  18. Hossain, M.; Madlool, N.; Rahim, N.; Selvaraj, J.; Pandey, A.; Khan, A.F. Role of smart grid in renewable energy: An overview. Renew. Sustain. Energy Rev. 2016, 60, 1168–1184. [Google Scholar] [CrossRef]
  19. Nafi, N.S.; Ahmed, K.; Gregory, M.A.; Datta, M. A survey of smart grid architectures, applications, benefits and standardization. J. Netw. Comput. Appl. 2016, 76, 23–36. [Google Scholar] [CrossRef]
  20. Jokar, P.; Arianpoo, N.; Leung, V.C. A survey on security issues in smart grids. Secur. Commun. Netw. 2016, 9, 262–273. [Google Scholar] [CrossRef]
  21. Eder-Neuhauser, P.; Zseby, T.; Fabini, J. Resilience and security: A qualitative survey of urban smart grid architectures. IEEE Access 2016, 4, 839–848. [Google Scholar] [CrossRef]
  22. Deng, R.; Xiao, G.; Lu, R.; Liang, H.; Vasilakos, A.V. False data injection on state estimation in power systems—Attacks, impacts, and defense: A survey. IEEE Trans. Ind. Inform. 2017, 13, 411–423. [Google Scholar] [CrossRef]
  23. Khorshidi, R.; Shabaninia, F.; Niknam, T. A new smart approach for state estimation of distribution grids considering renewable energy sources. Energy 2016, 94, 29–37. [Google Scholar] [CrossRef]
  24. Ahmad, F.; Rasool, A.; Ozsoy, E.; Sekar, R.; Sabanovic, A.; Elitaş, M. Distribution system state estimation-A step towards smart grid. Renew. Sustain. Energy Rev. 2018, 81, 2659–2671. [Google Scholar] [CrossRef] [Green Version]
  25. Xia, S.; Zhang, Q.; Jing, J.; Ding, Z.; Yu, J.; Chen, B.; Wu, H. Distributed state estimation of multi-region power system based on consensus theory. Energies 2019, 12, 900. [Google Scholar] [CrossRef]
  26. Grahn, P.; Briggner, V.; Johansson, L.; Babazadeh, D.; Nordstrom, L. Centralized versus distributed state estimation for hybrid AC/HVDC grid. In Proceedings of the IEEE PES Innovative Smart Grid Technologies Conference Europe (ISGT-Europe), Torino, Italy, 26–29 September 2017; IEEE: Piscataway, NJ, USA, 2017; pp. 1–6. [Google Scholar]
  27. Ahmed, S.; Lee, Y.; Hyun, S.-H.; Koo, I. Feature selection–based detection of covert cyber deception assaults in smart grid communications networks using machine learning. IEEE Access 2018, 6, 27518–27529. [Google Scholar] [CrossRef]
  28. Rawat, D.B.; Bajracharya, C. Detection of false data injection attacks in smart grid communication systems. IEEE Signal Process. Lett. 2015, 22, 1652–1656. [Google Scholar] [CrossRef]
  29. Rana, M.M.; Li, L.; Su, S.W. Cyber attack protection and control of microgrids. IEEE CAA J. Autom. Sin. 2018, 5, 602–609. [Google Scholar] [CrossRef]
  30. Huang, Y.; Tang, J.; Cheng, Y.; Li, H.; Campbell, K.A.; Han, Z. Real-time detection of false data injection in smart grid networks: An adaptive CUSUM method and analysis. IEEE Syst. J. 2014, 10, 532–543. [Google Scholar] [CrossRef]
  31. Liu, X.; Zhu, P.; Zhang, Y.; Chen, K. A collaborative intrusion detection mechanism against false data injection attack in advanced metering infrastructure. IEEE Trans. Smart Grid 2015, 6, 2435–2443. [Google Scholar] [CrossRef]
  32. Nanchian, S.; Majumdar, A.; Pal, B.C. Three-phase state estimation using hybrid particle swarm optimization. IEEE Trans. Smart Grid 2015, 8, 1035–1045. [Google Scholar] [CrossRef]
  33. Zhao, J.; Zhang, G.; Das, K.; Korres, G.N.; Manousakis, N.M.; Sinha, A.K.; He, Z. Power system real-time monitoring by using PMU-based robust state estimation method. IEEE Trans. Smart Grid 2015, 7, 300–309. [Google Scholar] [CrossRef]
  34. Leite, J.B.; Mantovani, J.R.S. Distribution system state estimation using the Hamiltonian cycle theory. IEEE Trans. Smart Grid 2015, 7, 366–375. [Google Scholar] [CrossRef]
  35. Cui, Y.; Bai, F.; Liu, Y.; Liu, Y. A measurement source authentication methodology for power system cyber security enhancement. IEEE Trans. Smart Grid 2018, 9, 3914–3916. [Google Scholar] [CrossRef]
  36. Chen, L.; Dong, X.; Wu, Z.; Liu, Z.; Chen, B. Evaluating the reliability and security of power distribution wireless network. CIRED Open Access Proc. J. 2017, 2017, 1102–1106. [Google Scholar] [CrossRef] [Green Version]
  37. Liu, T.; Tian, J.; Gui, Y.; Liu, Y.; Liu, P. SEDEA: State estimation-based dynamic encryption and authentication in smart grid. IEEE Access 2017, 5, 15682–15693. [Google Scholar] [CrossRef]
  38. Li, B.; Lu, R.; Wang, W.; Choo, K.-K.R. Distributed host-based collaborative detection for false data injection attacks in smart grid cyber-physical system. J. Parallel Distrib. Comput. 2017, 103, 32–41. [Google Scholar] [CrossRef]
  39. Karimipour, H.; Dinavahi, V. Robust massively parallel dynamic state estimation of power systems against cyber-attack. IEEE Access 2017, 6, 2984–2995. [Google Scholar] [CrossRef]
  40. Hao, J.; Piechocki, R.J.; Kaleshi, D.; Chin, W.H.; Fan, Z. Sparse malicious false data injection attacks and defense mechanisms in smart grids. IEEE Trans. Ind. Inform. 2015, 11, 1–12. [Google Scholar] [CrossRef]
  41. Anwar, A.; Mahmood, A.N.; Tari, Z. Identification of vulnerable node clusters against false data injection attack in an AMI based smart grid. Inf. Syst. 2015, 53, 201–212. [Google Scholar] [CrossRef]
  42. Li, S.; Yılmaz, Y.; Wang, X. Quickest detection of false data injection attack in wide-area smart grids. IEEE Trans. Smart Grid 2015, 6, 2725–2735. [Google Scholar] [CrossRef]
  43. Azarderakhsh, R.; Reyhani-Masoleh, A. Parallel and high-speed computations of elliptic curve cryptography using hybrid-double multipliers. IEEE Trans. Parallel Distrib. Syst. 2014, 26, 1668–1677. [Google Scholar] [CrossRef]
Figure 1. False data injection (FDI) attack on a smart grid (SG) system.
Energies 12 02555 g001
Figure 2. Two-tier secure smart grid (T2S2G) system architecture based on the IEEE-9 bus system.
Energies 12 02555 g002
Figure 3. Weighted quad tree (WQT) based system partitioning.
Energies 12 02555 g003
Figure 4. Encryption in the parallel enhanced elliptic curve cryptography (PEECC) algorithm.
Energies 12 02555 g004
Figure 5. Scheduling process in the logical schedule based authentication (LSA) scheme.
Energies 12 02555 g005
Figure 6. Fuzzy with neural network (FNN) algorithm based measurement classification.
Energies 12 02555 g006
Figure 7. The T2S2G system based on the IEEE-9 bus system.
Energies 12 02555 g007
Figure 8. Analysis on the estimation error.
Energies 12 02555 g008
Figure 9. Analysis on the number of protected measurements.
Energies 12 02555 g009
Figure 10. Analysis on the detection probability.
Energies 12 02555 g010
Figure 11. Analysis on the successful detection rate.
Energies 12 02555 g011
Figure 12. Analysis on detection delay.
Energies 12 02555 g012
Table 1. Weight values for G and L .
GeneratorPowerLoadPower
G 1 512 L 1 125
G 2 270 L 2 90
G 3 125 L 3 100
Table 2. Fuzzy rules deployed in the FNN.
InputOutput
e l i S i m l i T l i
<0.5<0.5<50Malicious
<0.5<0.5>50Normal
<0.5>0.5<50Normal
<0.5>0.5>50Normal
>0.5<0.5<50Malicious
>0.5<0.5>50Malicious
>0.5>0.5<50Malicious
>0.5>0.5>50Medium
Table 3. Simulation parameters.
ParameterValue
Bus systemIEEE-9 bus system
Measurement variables V i k   δ i k   t i k
Number of RTUs15
Number of aggregators4
Number of attackers1
Number of compromised meters/buses2
Total number of measurements350
Number of malicious measurements35
APSOInitial population100
, 2
α 1
Maximum iteration100
PEECCNumber of keys4
Key size256 bits
Value of ‘ n 10 (Maximum)
Table 4. Analysis on previous works.
ParameterParallel SESparse MethodQuickest Detection
SEDynamic SECentralized SECentralized SE
Attack detectionMarkov chain modelRPCA methodSequential detector
Demerits
  • Requires large computational time
  • Performance of the detector is limited
  • Increases complexity and estimation errors
  • Not suitable for a large number of affected measurements
  • Complexity and overhead are increased
  • Measurements are not protected

