Electricity Theft Detection in Smart Grid Systems: A CNN-LSTM Based Approach


 ,
,  and
and 
Abstract
:1. Introduction
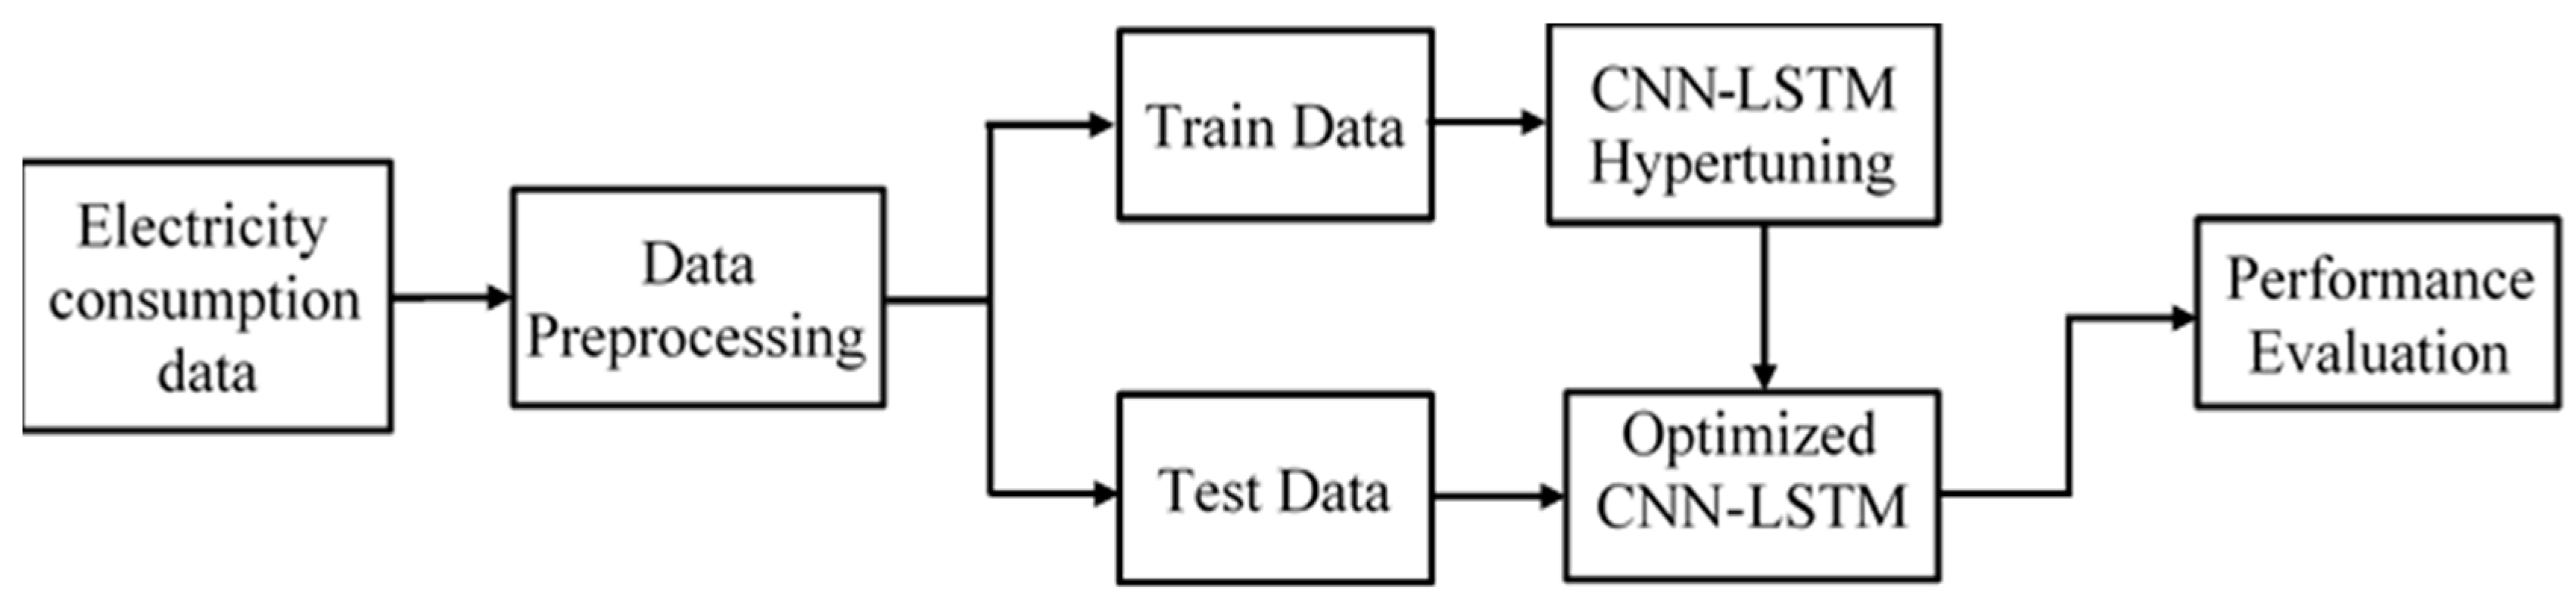
2. Materials and Methods
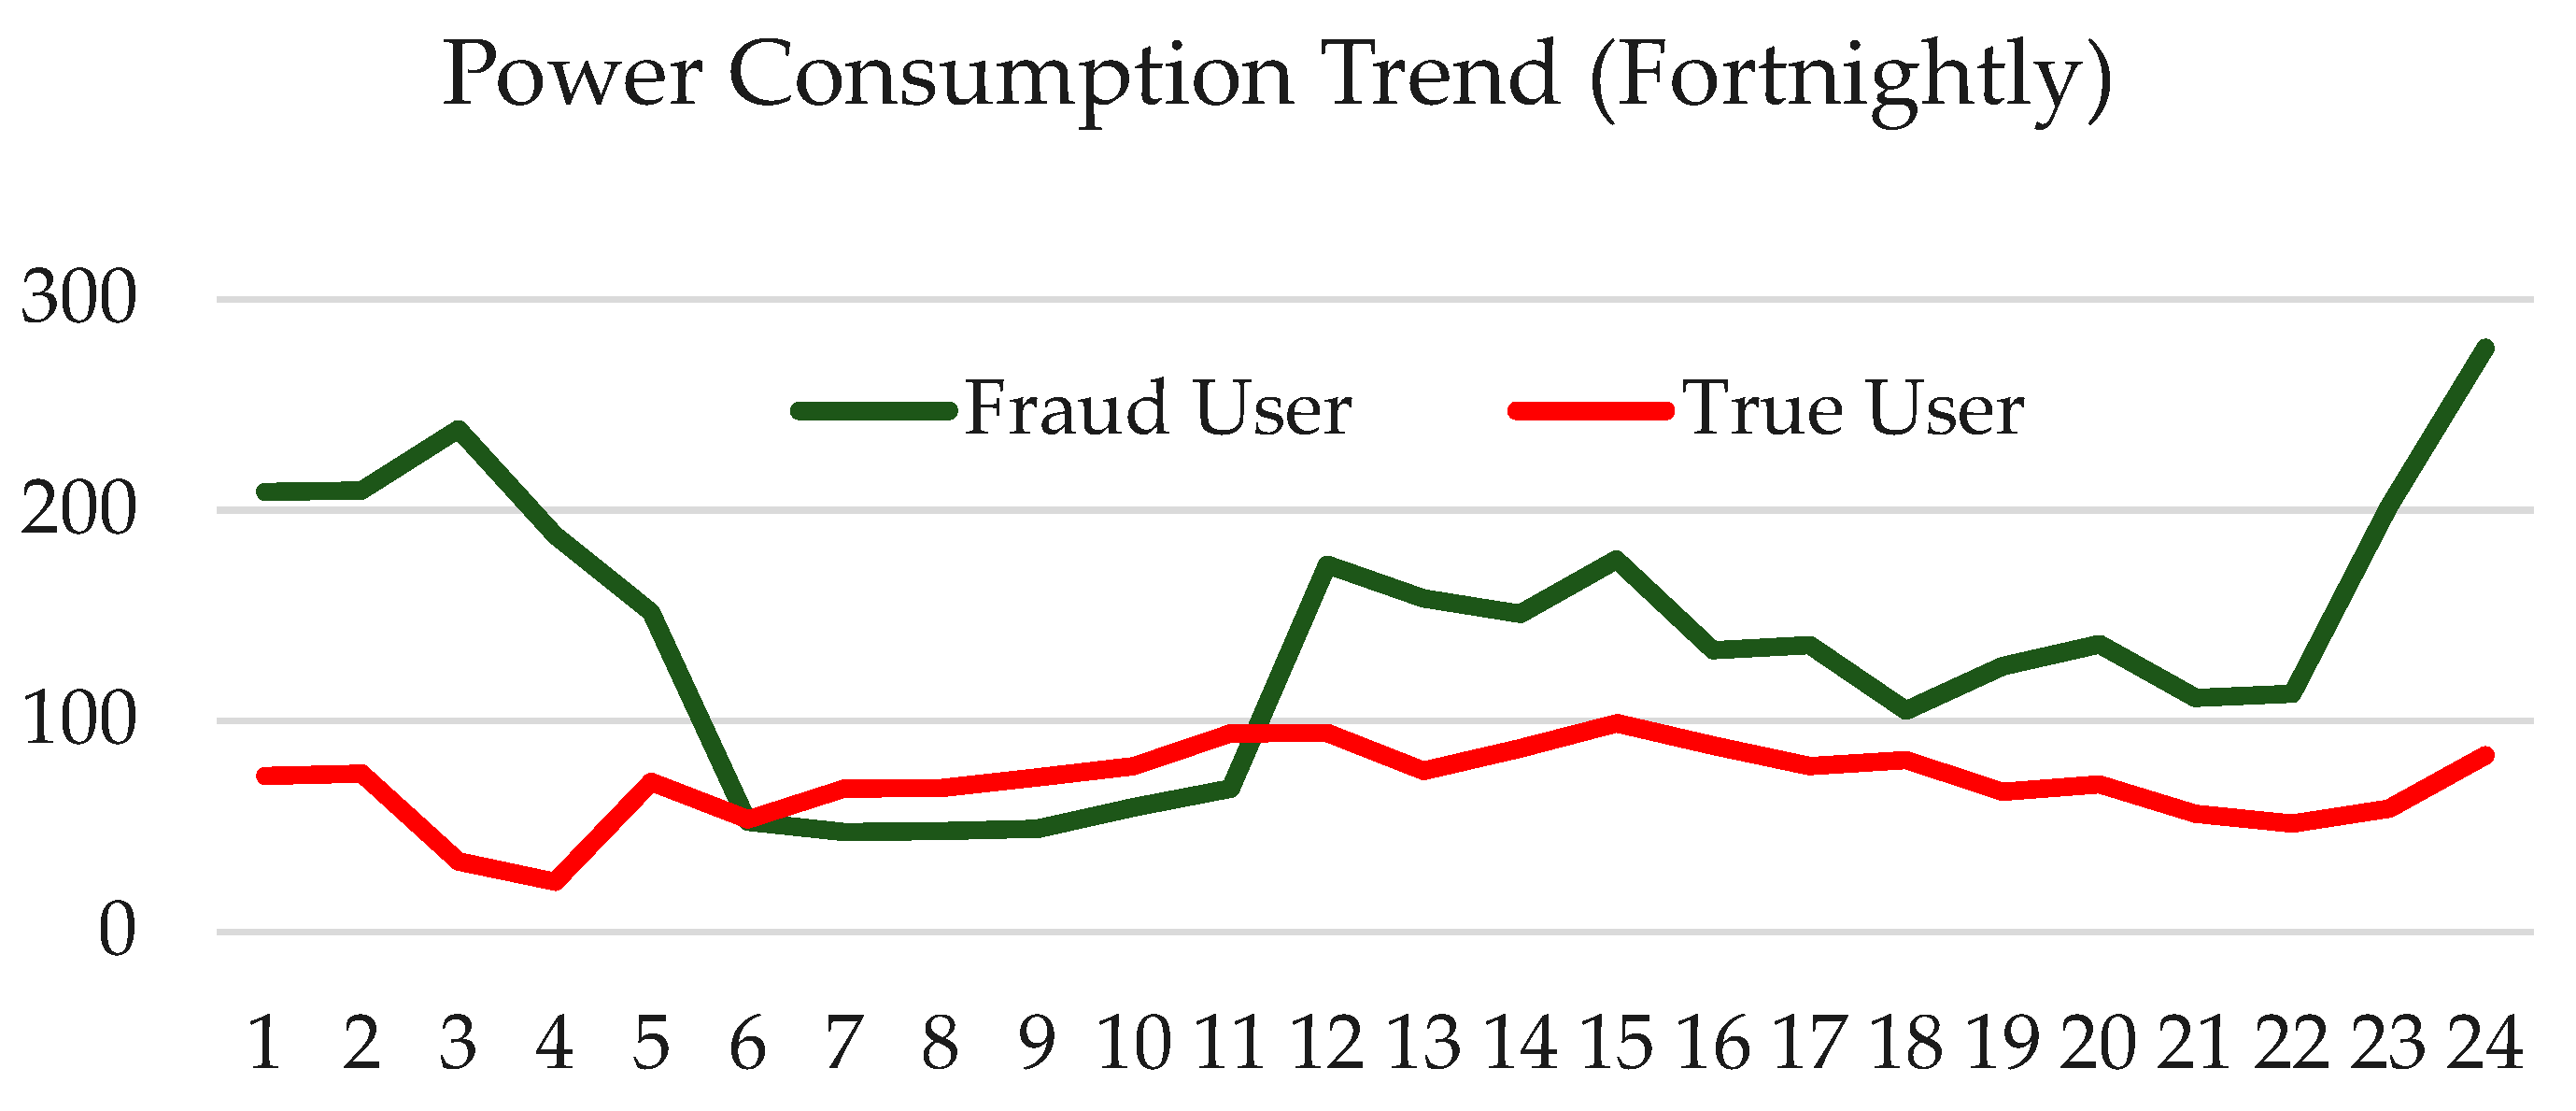
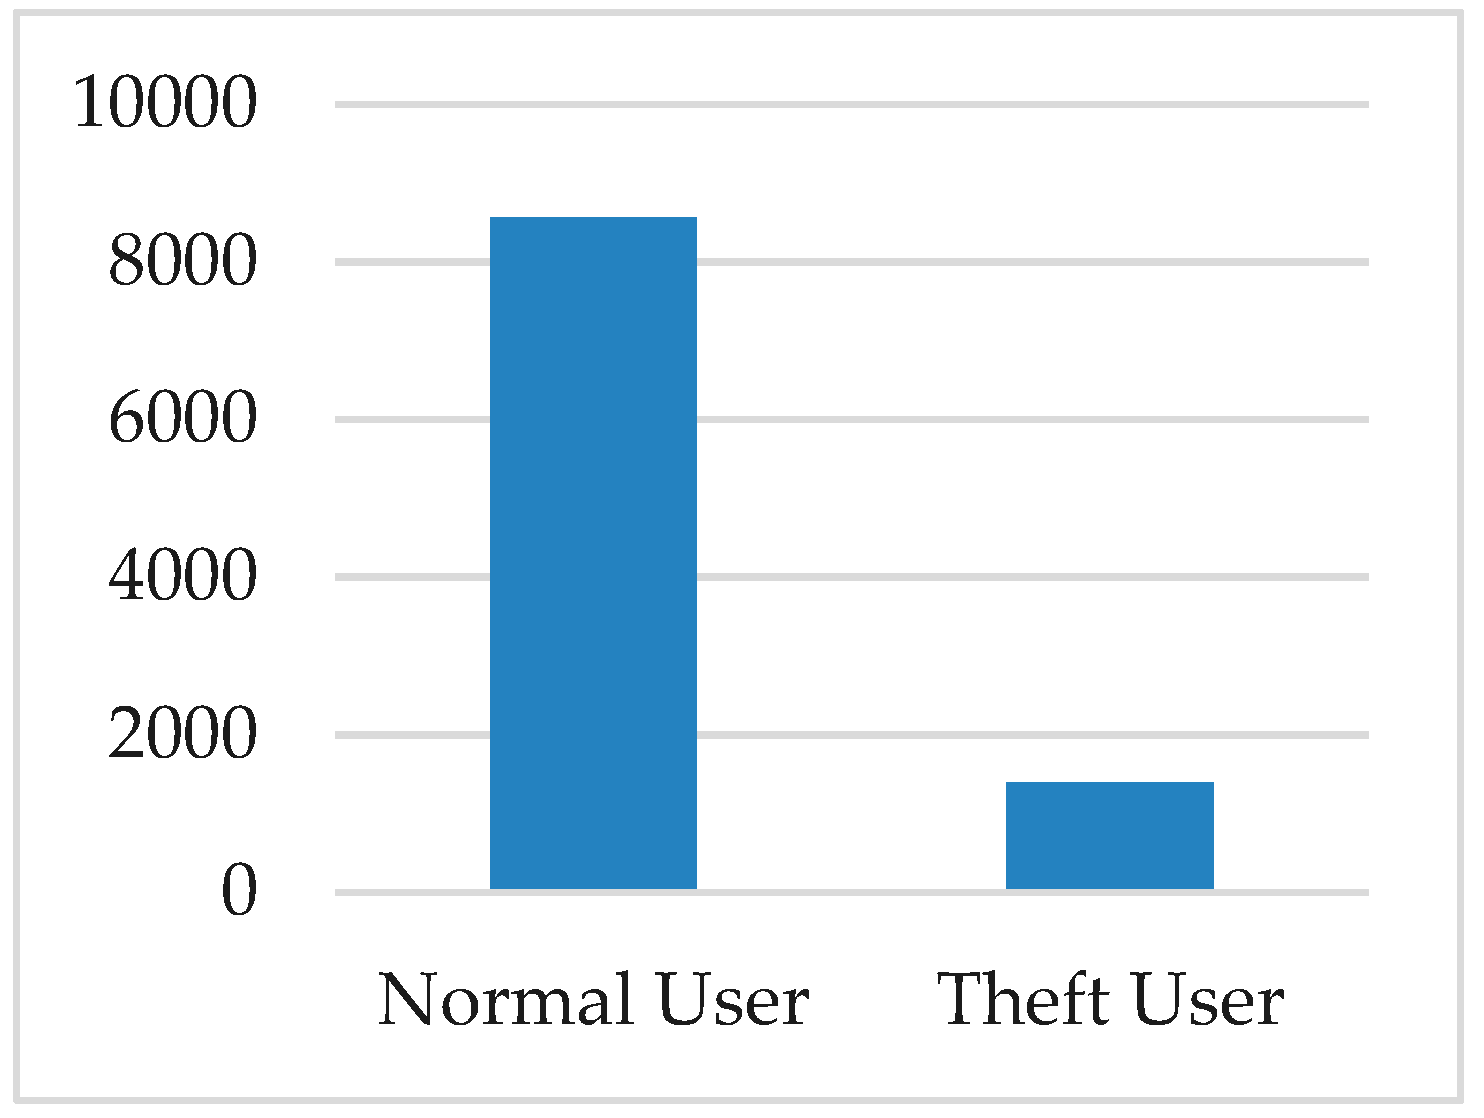
2.1. Electricity Theft Data
2.2. Data Preprocessing
2.2.1. Computing the Missing Values
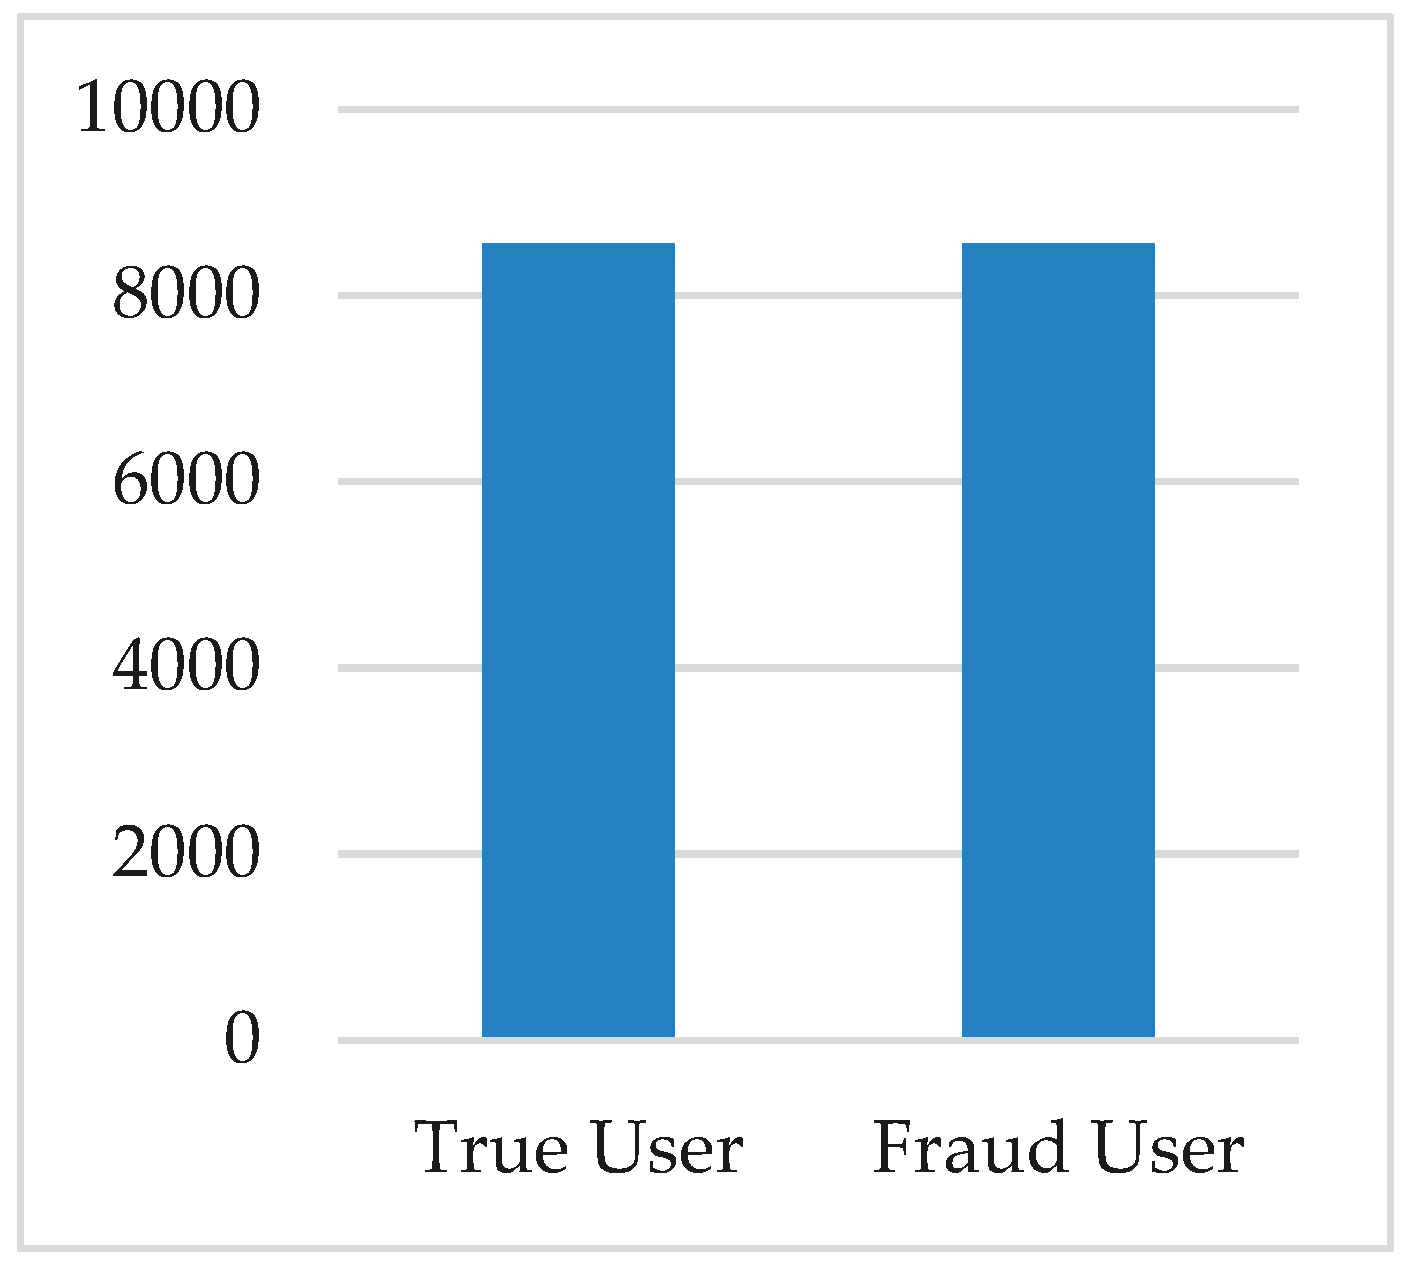
2.2.2. Generation of Synthetic Data Points
| Algorithm 1: Data Pre-processing Algorithm |
|
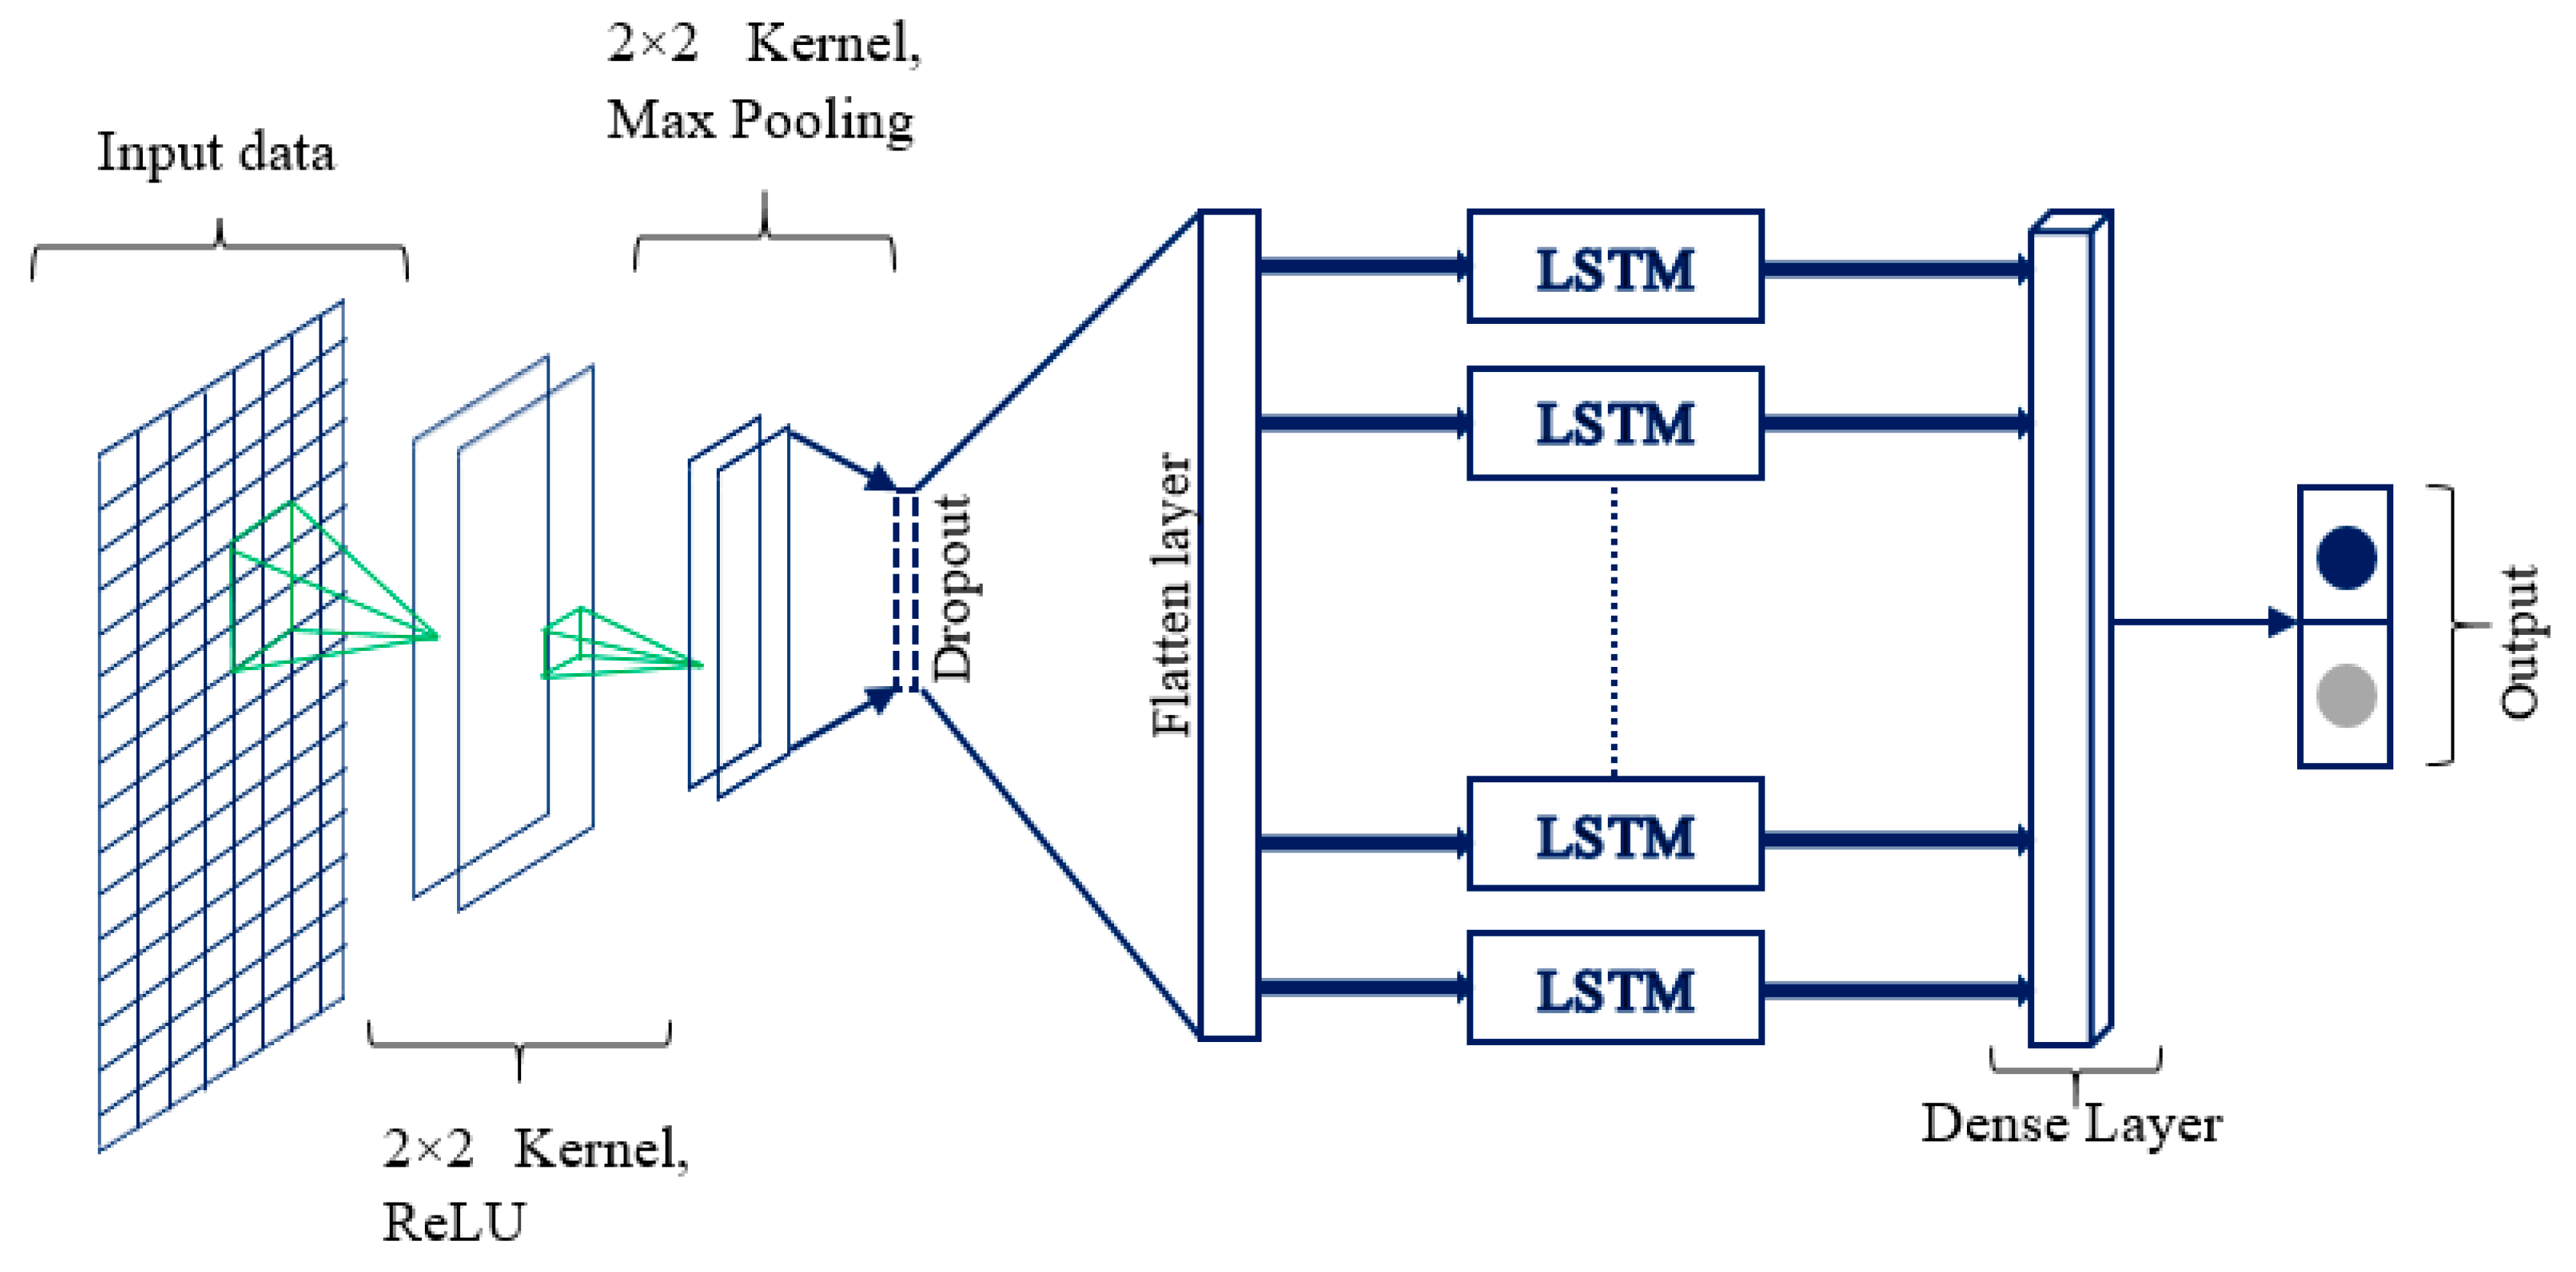
2.3. Proposed CNN-LSTM Architecture for Smart Grid Data Classification
2.3.1. CNN Model
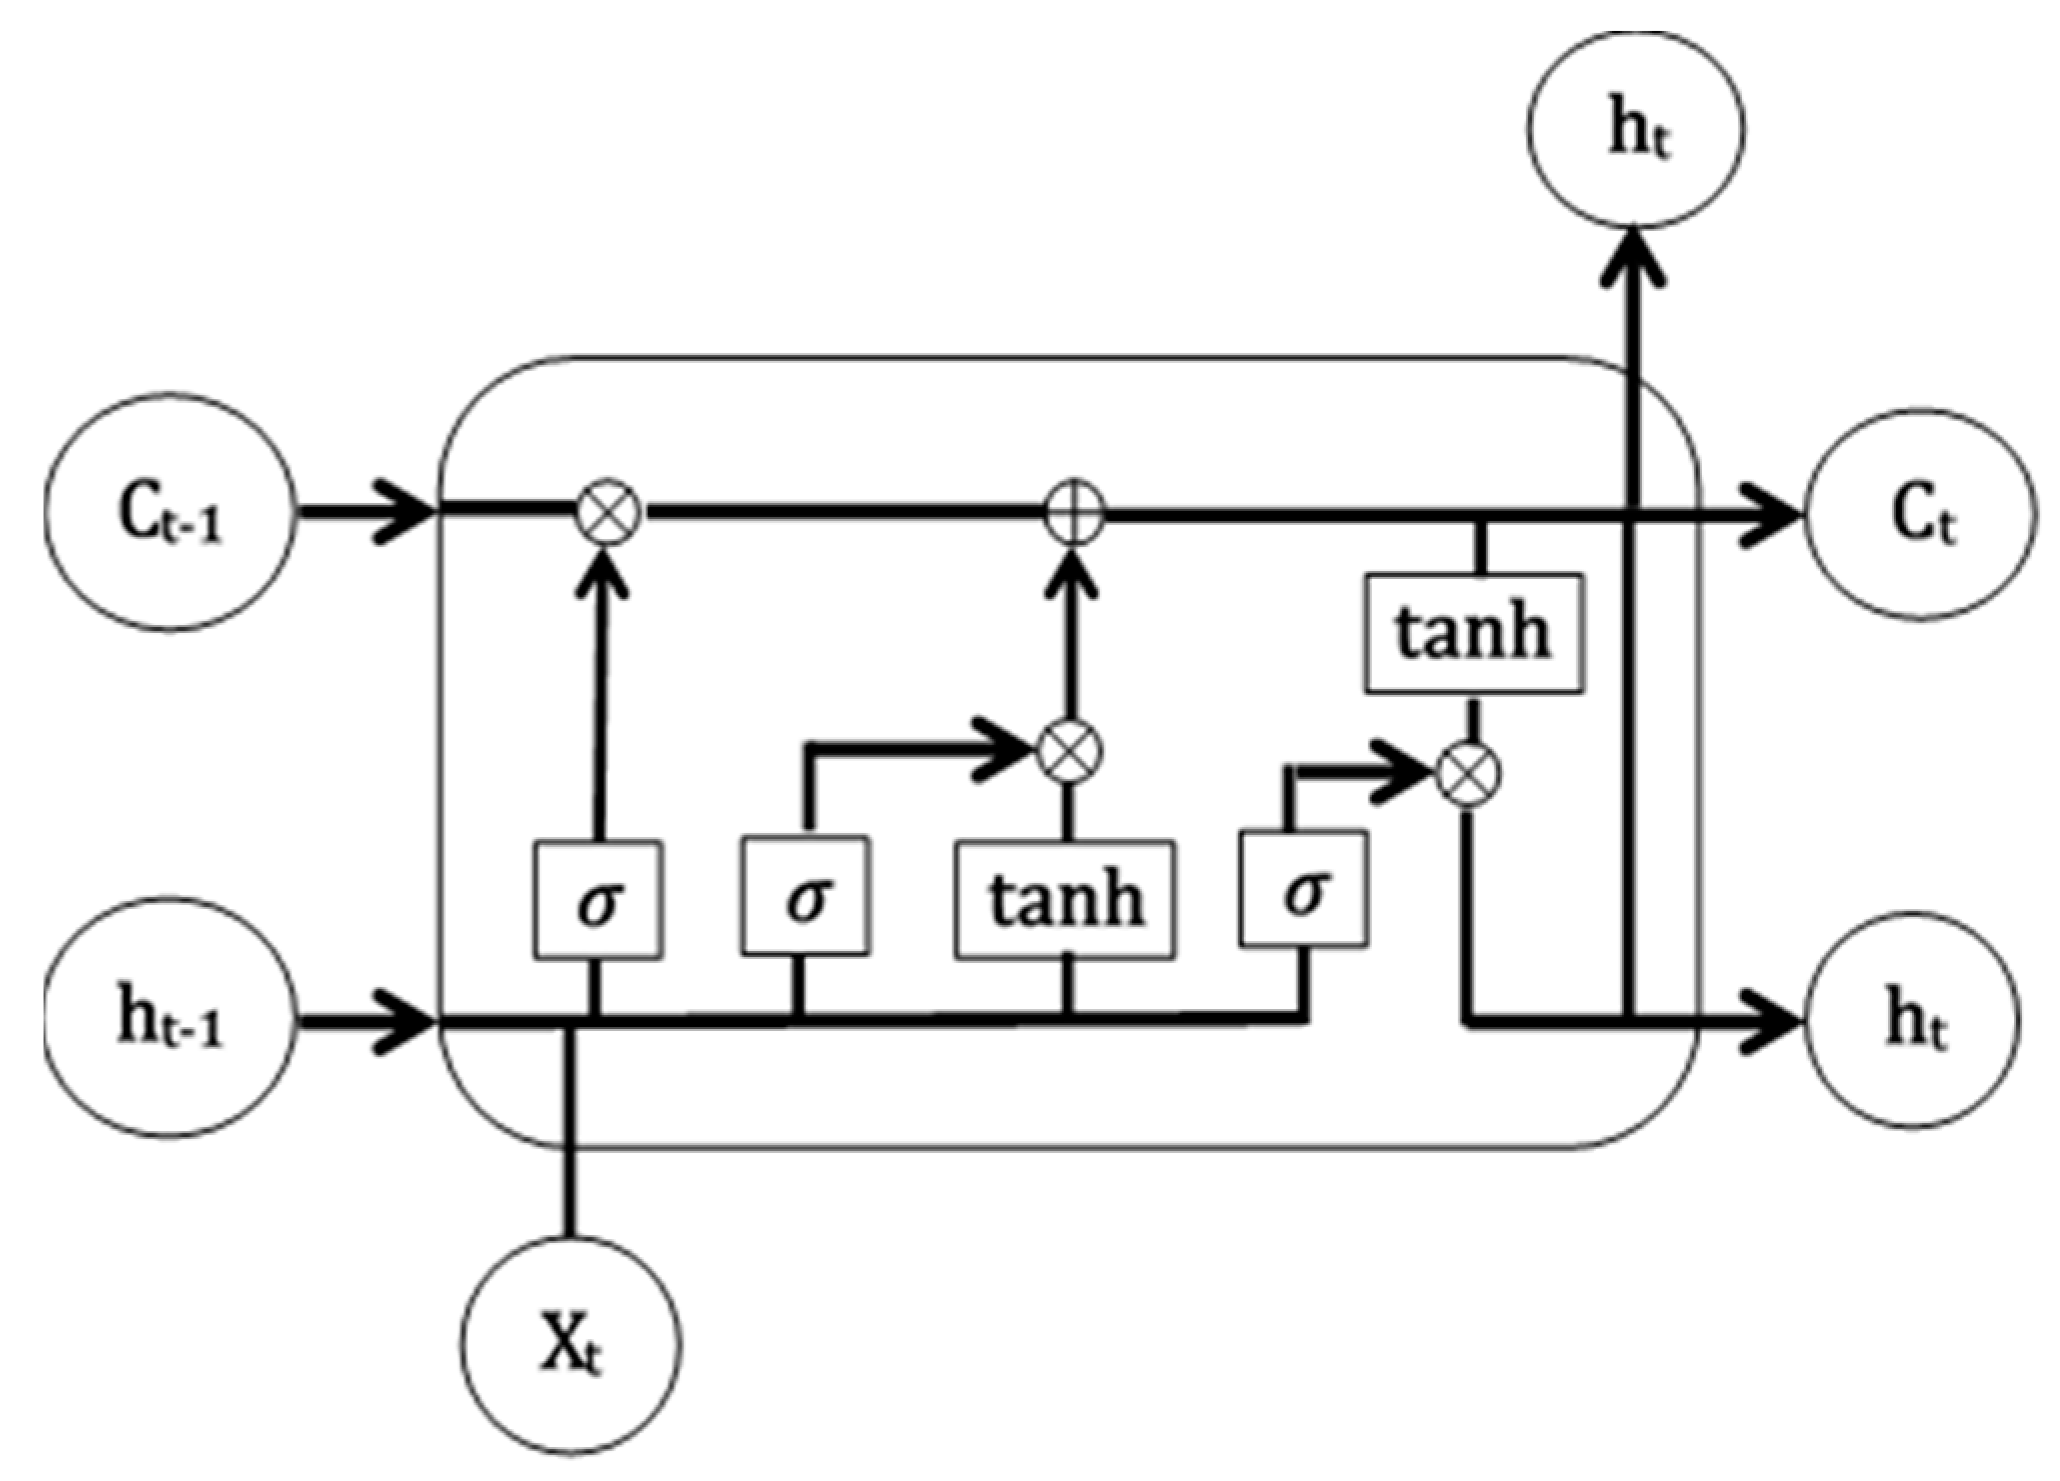
2.3.2. LSTM
3. Results and Discussion
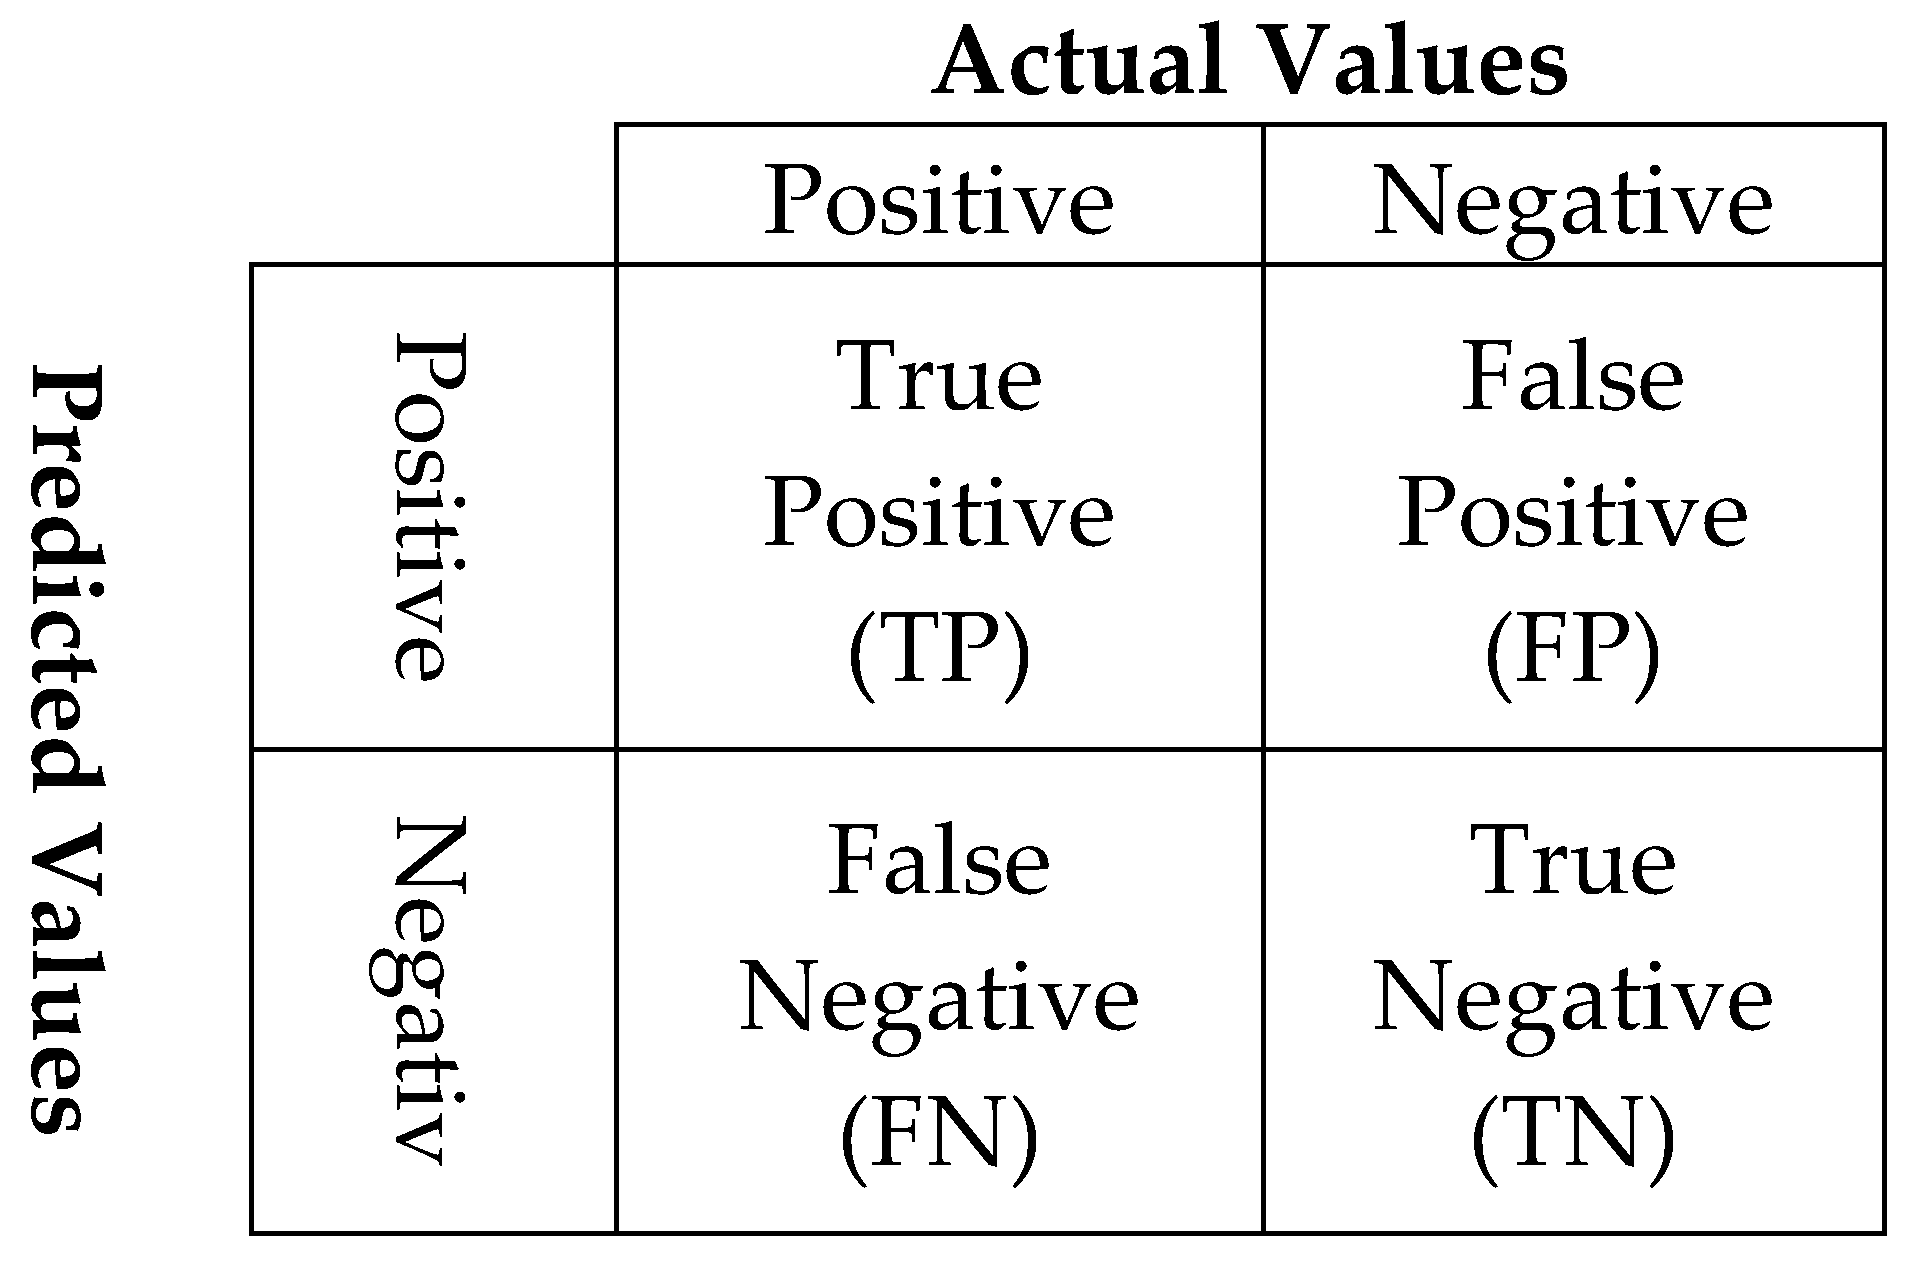
3.1. Performance Matrices
3.1.1. Binary Cross-Entropy
3.1.2. Matthews Correlation Coefficient (MCC)
3.1.3. F-measure
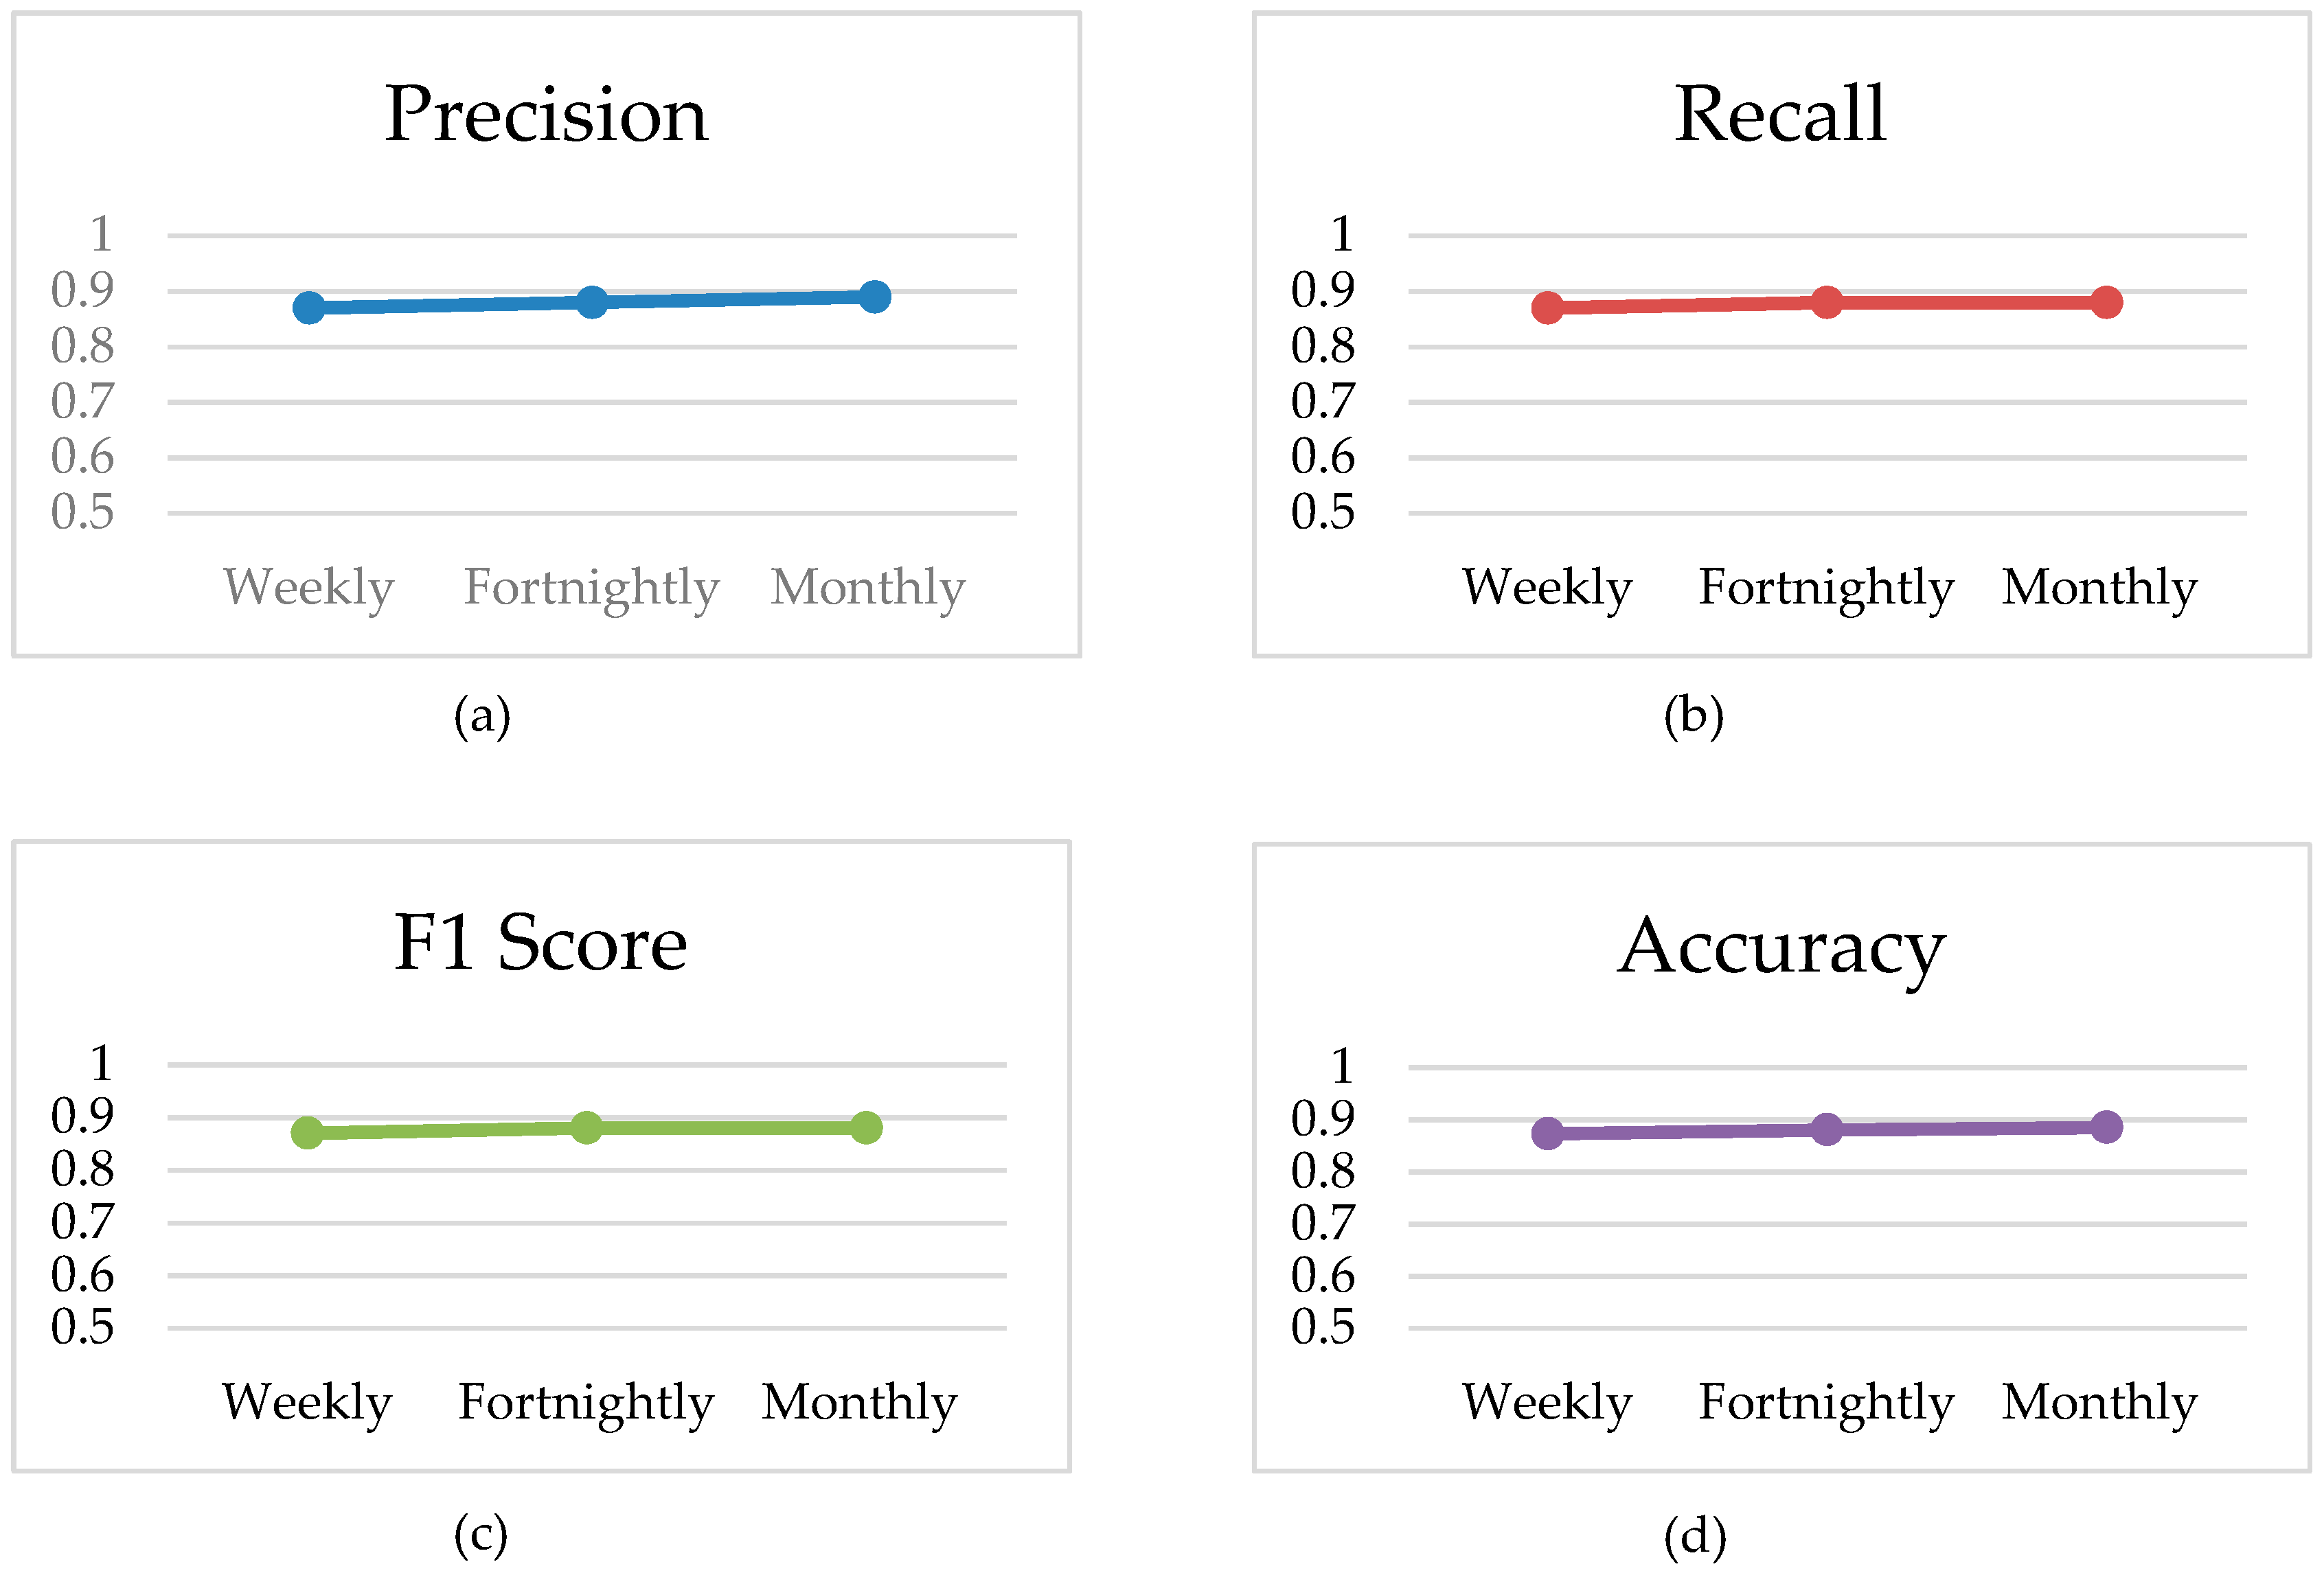
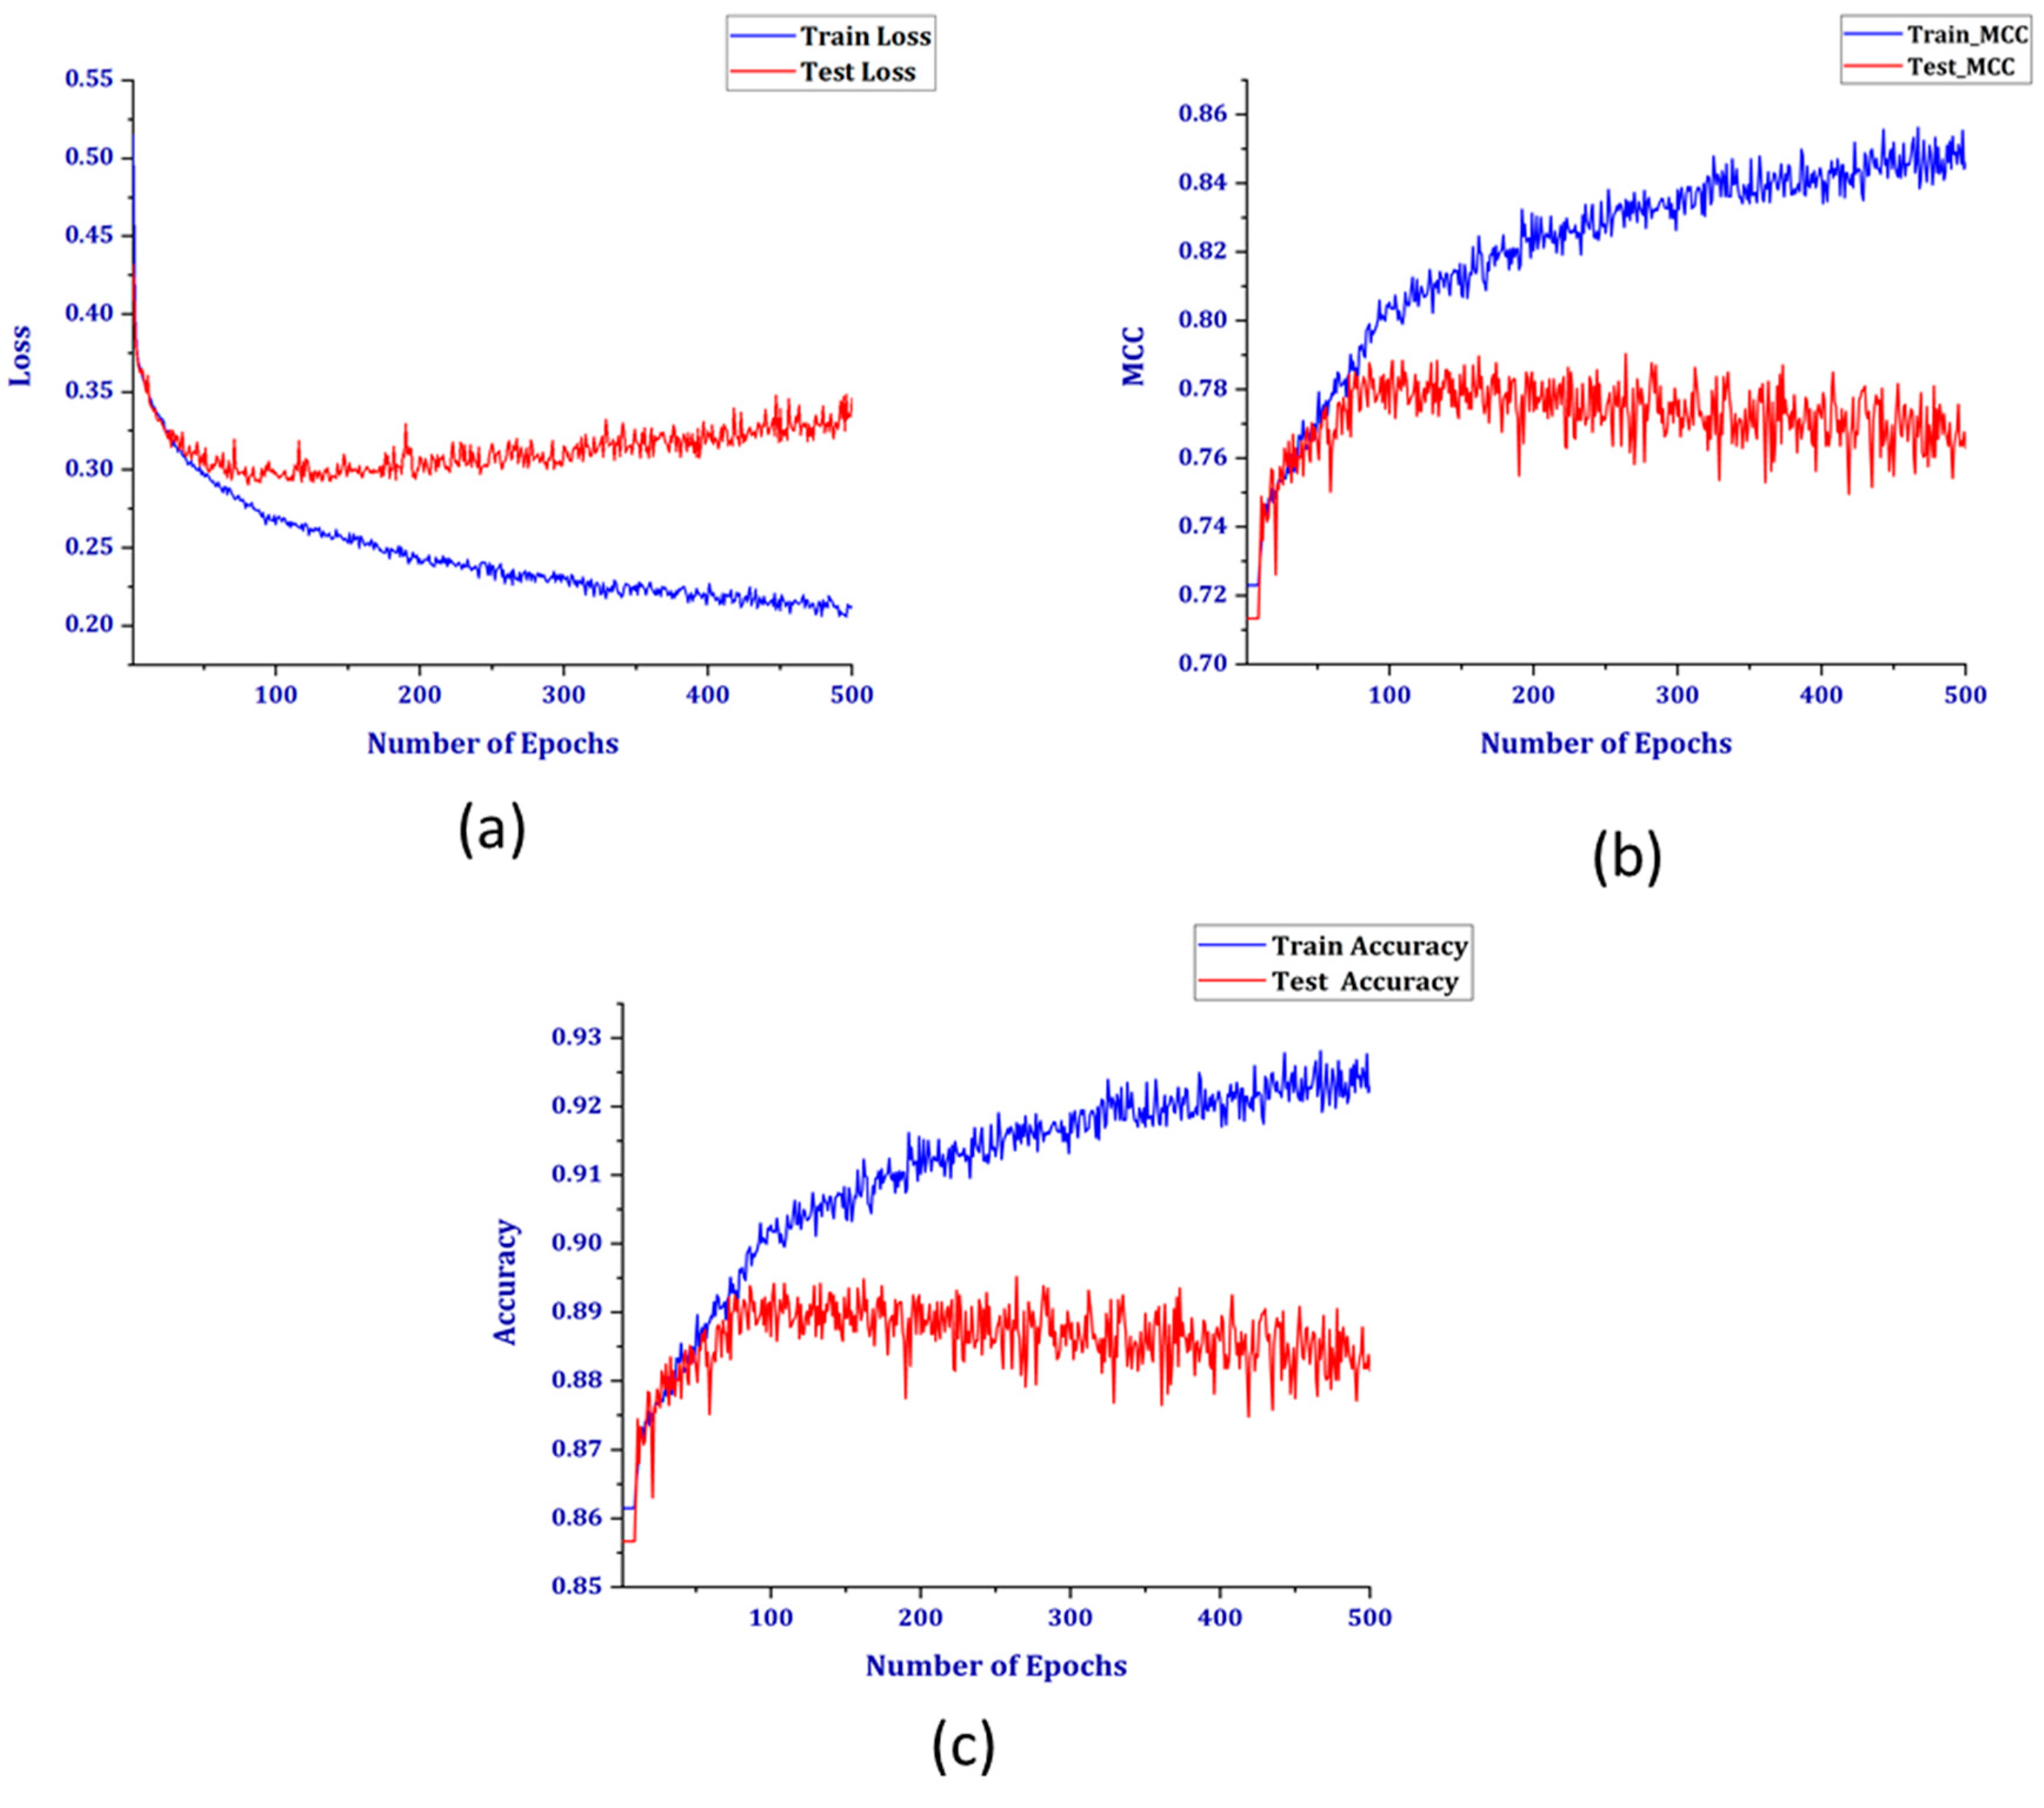
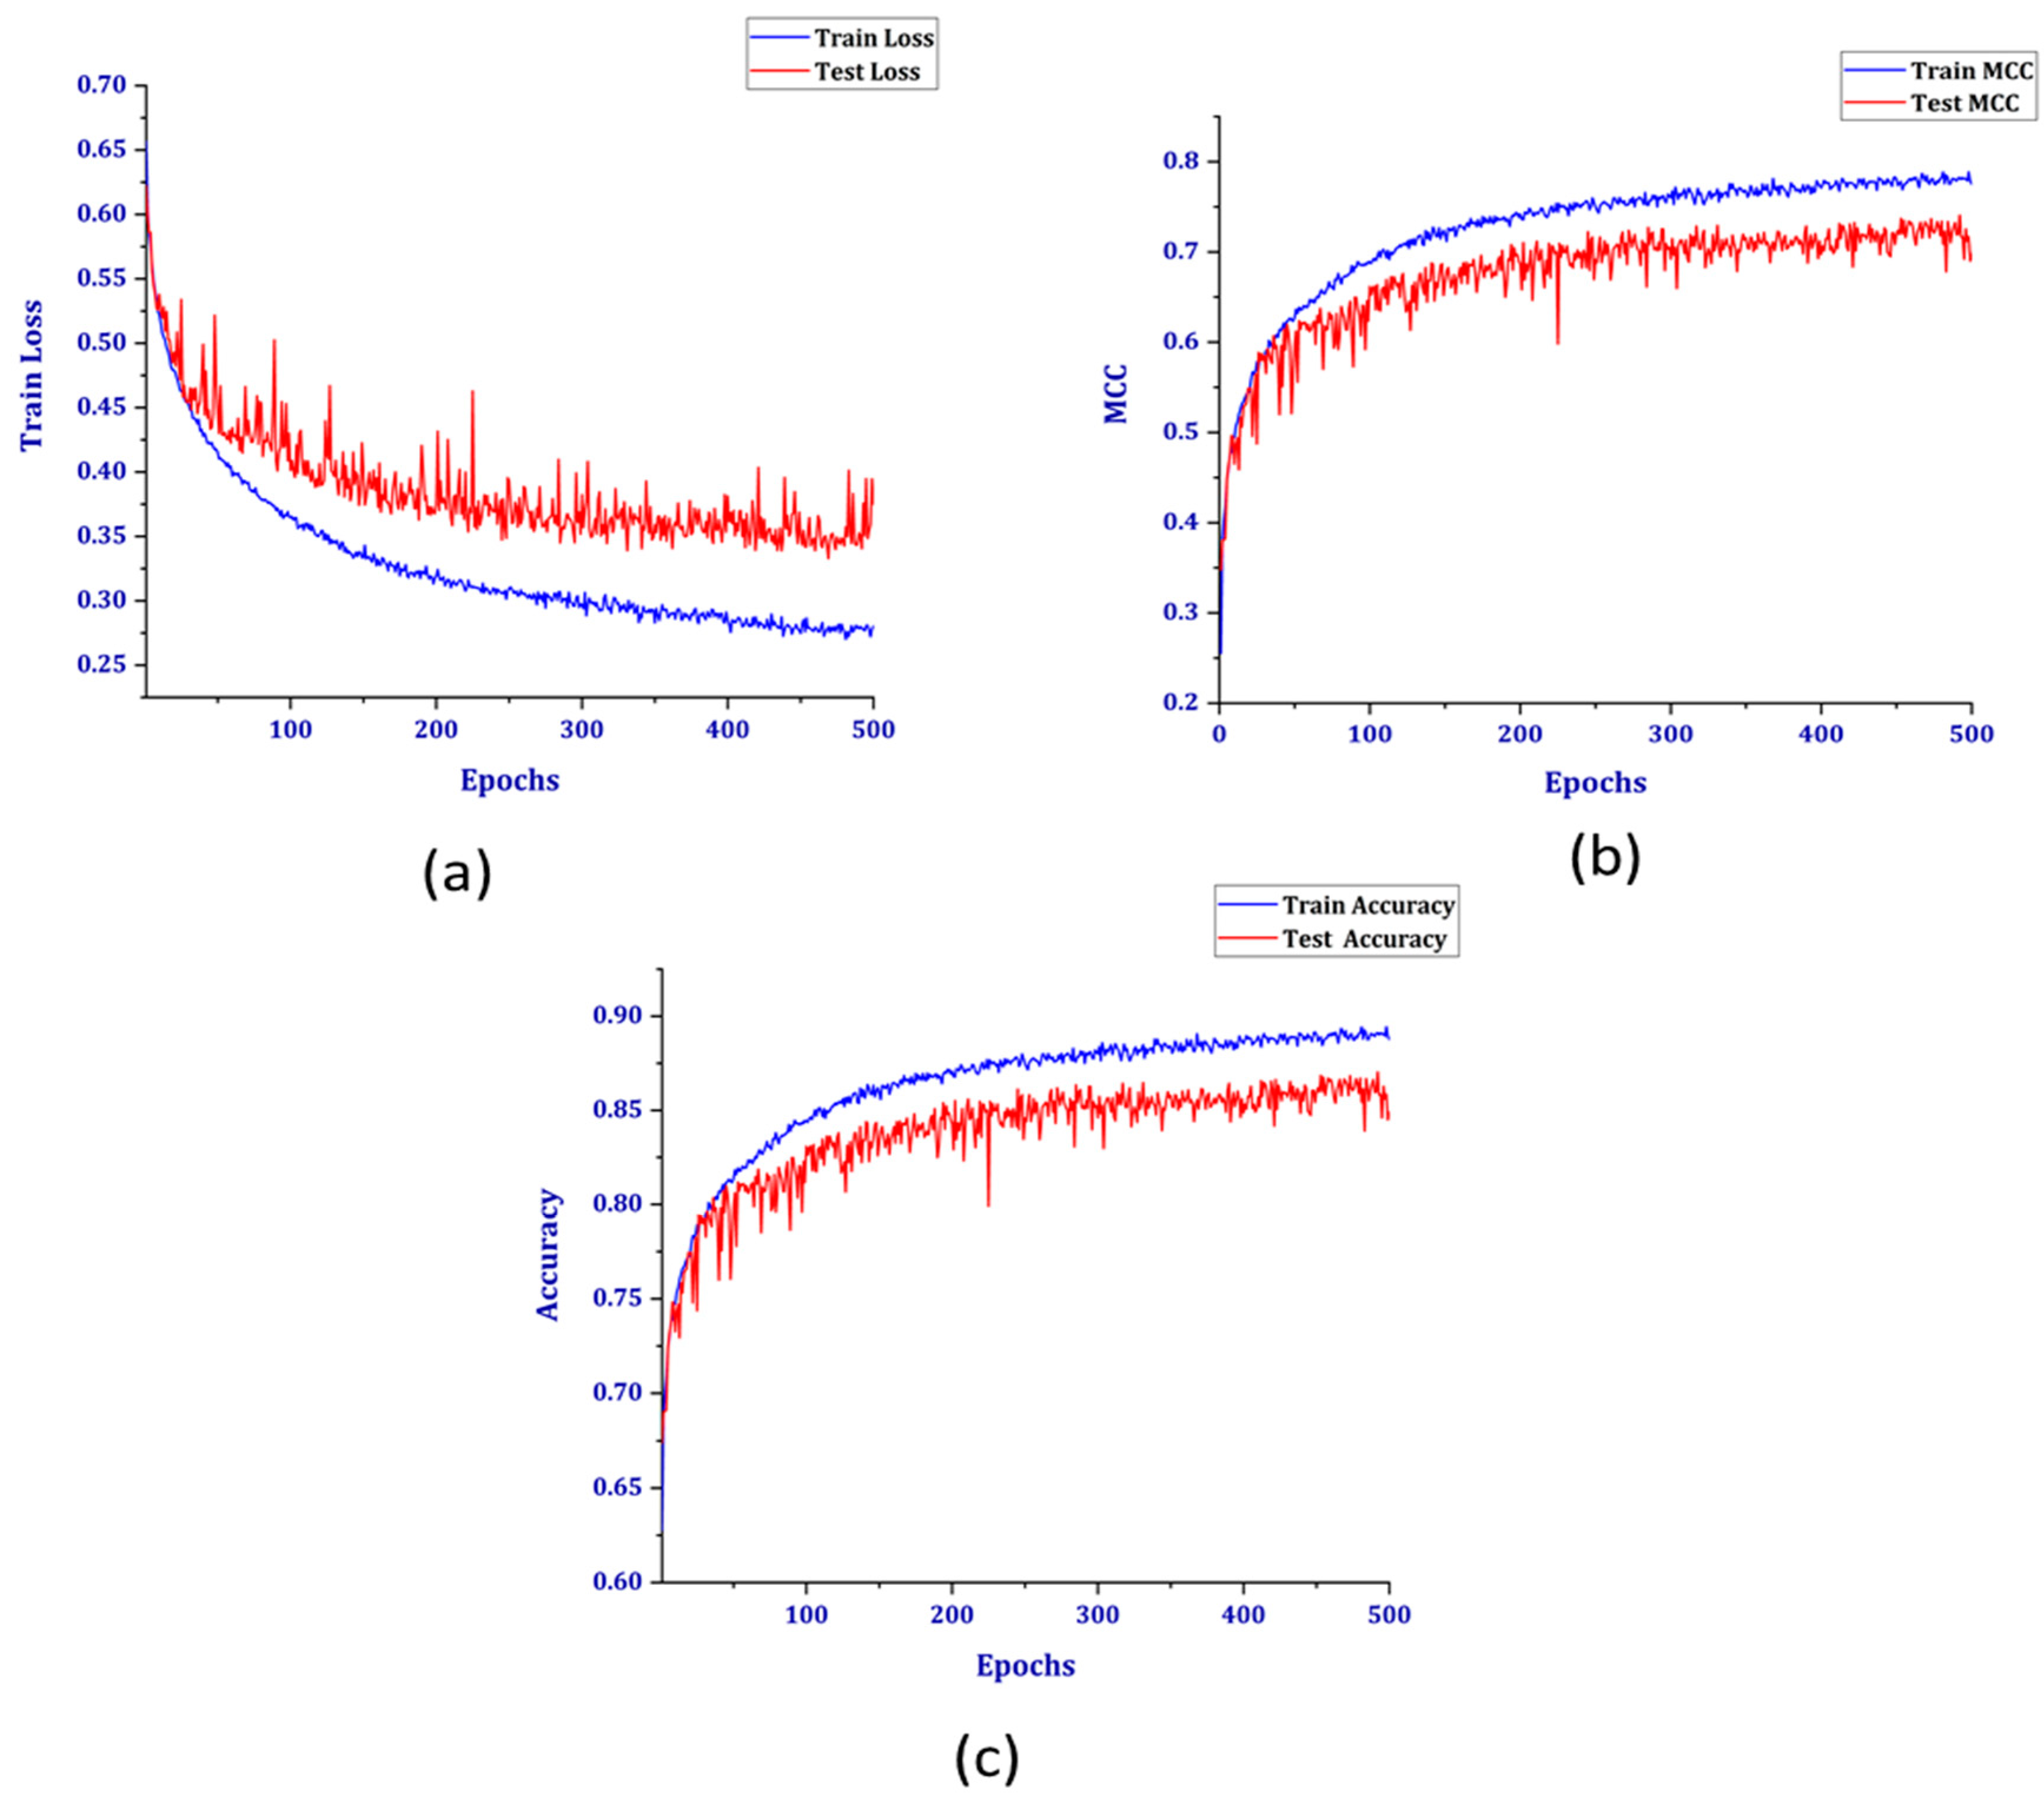
3.2. Experimental Results
Performance Comparison
4. Conclusions
Author Contributions
Funding
Conflicts of Interest
References
- Yu, X.; Cecati, C.; Dillon, T.; Simoes, M.G. The new frontier of smart grids. IEEE Ind. Electron. Mag. 2011, 5, 49–63. [Google Scholar] [CrossRef]
- Mavridou, A.; Papa, M. A situational awareness architecture for the smart grid. In Global Security, Safety and Sustainability & e-Democracy; Springer: Berlin/Heidelberg, Germany, 2011; pp. 229–236. [Google Scholar] [CrossRef]
- Bank, W. World Development Indicators 2003; The World Bank: Washington, DC, USA, 2003; Volume 1. [Google Scholar]
- Bank, T.W. Electric Power Transmission and Distribution Losses (% of output); IEA: Paris, France, 2016. [Google Scholar]
- Zheng, J.; Gao, D.W.; Lin, L. Smart meters in smart grid: An overview. In Proceedings of the 2013 IEEE Green Technologies Conference (GreenTech), Denver, CO, USA, 4–5 April 2013; IEEE: Piscataway, NJ, USA, 2013; pp. 57–64. [Google Scholar] [CrossRef]
- Depuru, S.S.S.R.; Wang, L.; Devabhaktuni, V.; Gudi, N. Smart meters for power grid—Challenges, issues, advantages and status. In Proceedings of the 2011 IEEE/PES Power Systems Conference and Exposition, Phoenix, AZ, USA, 20–23 March 2011; IEEE: Piscataway, NJ, USA, 2011; pp. 1–7. [Google Scholar] [CrossRef]
- Zheng, Z.; Yang, Y.; Niu, X.; Dai, H.-N.; Zhou, Y. Wide and deep convolutional neural networks for electricity-theft detection to secure smart grids. IEEE Trans. Ind. Inform. 2018, 14, 1606–1615. [Google Scholar] [CrossRef]
- Agüero, J.R. Improving the efficiency of power distribution systems through technical and non-technical losses reduction. In Proceedings of the PES T&D 2012, Orlando, FL, USA, 7–10 May 2012; pp. 1–8. [Google Scholar] [CrossRef]
- McLaughlin, S.; Holbert, B.; Fawaz, A.; Berthier, R.; Zonouz, S. A multi-sensor energy theft detection framework for advanced metering infrastructures. IEEE J. Sel. Areas Commun. 2013, 31, 1319–1330. [Google Scholar] [CrossRef]
- Smith, T.B. Electricity theft: A comparative analysis. Energy Policy 2004, 32, 2067–2076. [Google Scholar] [CrossRef]
- Cabral, J.E.; Gontijo, E.M. Fraud detection in electrical energy consumers using rough sets. In Proceedings of the 2004 IEEE International Conference on Systems, Man and Cybernetics (IEEE Cat. No. 04CH37583), The Hague, The Netherlands, 10–13 October 2004; IEEE: Piscataway, NJ, USA, 2004; pp. 3625–3629. [Google Scholar] [CrossRef]
- Depuru, S.S.S.R.; Wang, L.; Devabhaktuni, V.; Green, R.C. High performance computing for detection of electricity theft. Int. J. Electr. Power Energy Syst. 2013, 47, 21–30. [Google Scholar] [CrossRef]
- Nagi, J.; Yap, K.S.; Tiong, S.K.; Ahmed, S.K.; Nagi, F. Improving SVM-based nontechnical loss detection in power utility using the fuzzy inference system. IEEE Trans. Power Deliv. 2011, 26, 1284–1285. [Google Scholar] [CrossRef]
- Bhatia, G.; Gulati, M. Reforming the Power Sector: Controlling Electricity Theft and Improving Revenue; The World Bank: Washington, DC, USA, 2004. [Google Scholar]
- Abbott, D. Keeping the energy debate clean: How do we supply the world’s energy needs? Proc. IEEE 2009, 98, 42–66. [Google Scholar] [CrossRef]
- Li, B.; Xu, K.; Cui, X.; Wang, Y.; Ai, X.; Wang, Y. Multi-scale DenseNet-based electricity theft detection. In Proceedings of the International Conference on Intelligent Computing, Wuhan, China, 6 July 2018; pp. 172–182. [Google Scholar] [CrossRef]
- Lo, C.-H.; Ansari, N. CONSUMER: A novel hybrid intrusion detection system for distribution networks in smart grid. IEEE Trans. Emerg. Top. Comput. 2013, 1, 33–44. [Google Scholar] [CrossRef]
- Xiao, Z.; Xiao, Y.; Du, D.H.-C. Non-repudiation in neighborhood area networks for smart grid. IEEE Commun. Mag. 2013, 51, 18–26. [Google Scholar] [CrossRef]
- Cárdenas, A.A.; Amin, S.; Schwartz, G.; Dong, R.; Sastry, S. A game theory model for electricity theft detection and privacy-aware control in AMI systems. In Proceedings of the 2012 50th Annual Allerton Conference on Communication, Control, and Computing (Allerton), Monticello, IL, USA, 1–5 October 2012; pp. 1830–1837. [Google Scholar] [CrossRef]
- Jindal, A.; Dua, A.; Kaur, K.; Singh, M.; Kumar, N.; Mishra, S. Decision tree and SVM-based data analytics for theft detection in smart grid. IEEE Trans. Ind. Inform. 2016, 12, 1005–1016. [Google Scholar] [CrossRef]
- Depuru, S.S.S.R.; Wang, L.; Devabhaktuni, V.; Nelapati, P. A hybrid neural network model and encoding technique for enhanced classification of energy consumption data. In Proceedings of the 2011 IEEE Power and Energy Society General Meeting, San Diego, CA, USA, 24–29 July 2011; IEEE: Piscataway, NJ, USA, 2011; pp. 1–8. [Google Scholar] [CrossRef]
- Giani, A.; Bitar, E.; Garcia, M.; McQueen, M.; Khargonekar, P.; Poolla, K. Smart grid data integrity attacks: Characterizations and countermeasures π. In Proceedings of the 2011 IEEE International Conference on Smart Grid Communications (SmartGridComm), Brussels, Belgium, 17–20 October 2011; IEEE: Piscataway, NJ, USA, 2011; pp. 232–237. [Google Scholar] [CrossRef]
- Najmeddine, H.; Drissi, K.E.K.; Pasquier, C.; Faure, C.; Kerroum, K.; Jouannet, T.; Michou, M.; Diop, A. Smart metering by using “Matrix Pencil”. In Proceedings of the 2010 9th International Conference on Environment and Electrical Engineering, Prague, Czech Republic, 16–19 May 2010; pp. 238–241. [Google Scholar] [CrossRef]
- Cabral, J.E.; Pinto, J.O.; Pinto, A.M. Fraud detection system for high and low voltage electricity consumers based on data mining. In Proceedings of the 2009 IEEE Power & Energy Society General Meeting, Calgary, AB, Canada, 26–30 July 2009; IEEE: Piscataway, NJ, USA, 2009; pp. 1–5. [Google Scholar] [CrossRef]
- Ugurlu, U.; Oksuz, I.; Tas, O. Electricity price forecasting using recurrent neural networks. Energies 2018, 11, 1255. [Google Scholar] [CrossRef]
- Bolton, R.J.; Hand, D.J. Statistical fraud detection: A review. Stat. Sci. 2002, 17, 235–249. [Google Scholar]
- Kou, Y.; Lu, C.-T.; Sirwongwattana, S.; Huang, Y.-P. Survey of fraud detection techniques. In Proceedings of the IEEE International Conference on Networking, Sensing and Control, Taipei, Taiwan, 21–23 March 2004; IEEE: Piscataway, NJ, USA, 2004; Volume 2, pp. 749–754. [Google Scholar] [CrossRef]
- Nizar, A.; Dong, Z.; Jalaluddin, M.; Raffles, M. Load profiling method in detecting non-technical loss activities in a power utility. In Proceedings of the 2006 IEEE International Power and Energy Conference, Putra Jaya, Malaysia, 28–29 November 2006; IEEE: Piscataway, NJ, USA, 2006; pp. 82–87. [Google Scholar] [CrossRef]
- Nizar, A.H.; Dong, Z.Y.; Zhang, P. Detection rules for non technical losses analysis in power utilities. In Proceedings of the 2008 IEEE Power and Energy Society General Meeting-Conversion and Delivery of Electrical Energy in the 21st Century, Pittsburgh, PA, USA, 20–24 July 2008; IEEE: Piscataway, NJ, USA, 2008; pp. 1–8. [Google Scholar] [CrossRef]
- Coma-Puig, B.; Carmona, J. Bridging the Gap between Energy Consumption and Distribution through Non-Technical Loss Detection. Energies 2019, 12, 1748. [Google Scholar] [CrossRef]
- Hodge, V.; Austin, J. A survey of outlier detection methodologies. Artif. Intell. Rev. 2004, 22, 85–126. [Google Scholar] [CrossRef]
- Jokar, P.; Arianpoo, N.; Leung, V.C. Electricity theft detection in AMI using customers’ consumption patterns. IEEE Trans. Smart Grid 2015, 7, 216–226. [Google Scholar] [CrossRef]
- Nagi, J.; Mohammad, A.; Yap, K.S.; Tiong, S.K.; Ahmed, S.K. Non-technical loss analysis for detection of electricity theft using support vector machines. In Proceedings of the 2008 IEEE 2nd International Power and Energy Conference, Johor Bahru, Malaysia, 1–3 December 2008; IEEE: Piscataway, NJ, USA, 2008; pp. 907–912. [Google Scholar] [CrossRef]
- Di Martino, M.; Decia, F.; Molinelli, J.; Fernández, A. Improving Electric Fraud Detection using Class Imbalance Strategies. In Proceedings of the International Conference on Pattern Recognition Applications and Methods (ICPRAM), Vilamoura, Portugal, 6–8 February 2012; pp. 135–141. [Google Scholar]
- Nagi, J.; Yap, K.S.; Tiong, S.K.; Ahmed, S.K.; Mohamad, M. Nontechnical loss detection for metered customers in power utility using support vector machines. IEEE Trans. Power Deliv. 2009, 25, 1162–1171. [Google Scholar] [CrossRef]
- Nagi, J.; Yap, K.S.; Tiong, S.K.; Ahmed, S.K.; Mohammad, A. Detection of abnormalities and electricity theft using genetic support vector machines. In Proceedings of the TENCON 2008-2008 IEEE Region 10 Conference, Hyderabad, India, 19–21 November 2008; IEEE: Piscataway, NJ, USA, 2008; pp. 1–6. [Google Scholar] [CrossRef]
- Nizar, A.; Dong, Z. Identification and detection of electricity customer behaviour irregularities. In Proceedings of the 2009 IEEE/PES Power Systems Conference and Exposition, Seattle, WA, USA, 15–18 March 2009; IEEE: Piscataway, NJ, USA, 2009; pp. 1–10. [Google Scholar] [CrossRef]
- Nizar, A.; Dong, Z.; Wang, Y. Power utility nontechnical loss analysis with extreme learning machine method. IEEE Trans. Power Syst. 2008, 23, 946–955. [Google Scholar] [CrossRef]
- Nizar, A.; Dong, Z.; Zhao, J.; Zhang, P. A data mining based NTL analysis method. In Proceedings of the 2007 IEEE Power Engineering Society General Meeting, Tampa, FL, USA, 24–28 June 2007; IEEE: Piscataway, NJ, USA, 2007; pp. 1–8. [Google Scholar] [CrossRef]
- Lighari, S.N.; Jensen, B.B.; Shaikh, A.A. Attacks and their defenses for advanced metering infrastructure. In Proceedings of the 2014 6th International Congress on Ultra Modern Telecommunications and Control Systems and Workshops (ICUMT), St. Petersburg, Russia, 6–8 October 2014; IEEE: Piscataway, NJ, USA, 2014; pp. 148–151. [Google Scholar] [CrossRef]
- Angelos, E.W.S.; Saavedra, O.R.; Cortés, O.A.C.; de Souza, A.N. Detection and identification of abnormalities in customer consumptions in power distribution systems. IEEE Trans. Power Deliv. 2011, 26, 2436–2442. [Google Scholar] [CrossRef]
- Jiang, R.; Tagaris, H.; Lachsz, A.; Jeffrey, M. Wavelet based feature extraction and multiple classifiers for electricity fraud detection. In Proceedings of the IEEE/PES Transmission and Distribution Conference and Exhibition, Yokohama, Japan, 6–10 October 2002; IEEE: Piscataway, NJ, USA, 2002; Volume 3, pp. 2251–2256. [Google Scholar] [CrossRef]
- Chicco, G.; Napoli, R.; Postolache, P.; Scutariu, M.; Toader, C. Customer characterization options for improving the tariff offer. IEEE Trans. Power Syst. 2003, 18, 381–387. [Google Scholar] [CrossRef]
- Gerbec, D.; Gašperič, S.; Šmon, I.; Gubina, F. Determining the load profiles of consumers based on fuzzy logic and probability neural networks. IEE Proc.-Gener. Transm. Distrib. 2004, 151, 395–400. [Google Scholar] [CrossRef]
- Pitt, B.; Kirschen, D.S. Application of data mining techniques to load profiling. In Proceedings of the 21st International Conference on Power Industry Computer Applications. Connecting Utilities. PICA 99. To the Millennium and Beyond (Cat. No. 99CH36351), Santa Clara, CA, USA, 21 May 1999; IEEE: Piscataway, NJ, USA, 1999; pp. 131–136. [Google Scholar] [CrossRef]
- Krizhevsky, A.; Sutskever, I.; Hinton, G.E. Imagenet classification with deep convolutional neural networks. In Proceedings of the Advances in Neural Information Processing Systems, Lake Tahoe, NV, USA, 3–6 December 2012; pp. 1097–1105. [Google Scholar]
- Hinton, G.; Deng, L.; Yu, D.; Dahl, G.; Mohamed, A.-R.; Jaitly, N.; Senior, A.; Vanhoucke, V.; Nguyen, P.; Kingsbury, B. Deep neural networks for acoustic modeling in speech recognition. IEEE Signal. Process. Mag. 2012, 82–97. [Google Scholar] [CrossRef]
- Tian, C.; Ma, J.; Zhang, C.; Zhan, P. A Deep Neural Network Model for Short-Term Load Forecast Based on Long Short-Term Memory Network and Convolutional Neural Network. Energies 2018, 11, 3493. [Google Scholar] [CrossRef]
- Yan, K.; Wang, X.; Du, Y.; Jin, N.; Huang, H.; Zhou, H. Multi-Step short-term power consumption forecasting with a hybrid deep learning strategy. Energies 2018, 11, 3089. [Google Scholar] [CrossRef]
- Kuo, P.-H.; Huang, C.-J. An electricity price forecasting model by hybrid structured deep neural networks. Sustainability 2018, 10, 1280. [Google Scholar] [CrossRef]
- Kim, T.-Y.; Cho, S.-B. Predicting the Household Power Consumption Using CNN-LSTM Hybrid Networks. In Proceedings of the International Conference on Intelligent Data Engineering and Automated Learning, Madrid, Spain, 21–23 November 2018; Springer: Berlin/Heidelberg, Germany, 2018; pp. 481–490. [Google Scholar] [CrossRef]
- Yang, R.; Zhang, C.; Gao, R.; Zhang, L. A novel feature extraction method with feature selection to identify Golgi-resident protein types from imbalanced data. Int. J. Mol. Sci. 2016, 17, 218. [Google Scholar] [CrossRef] [PubMed]
- LeCun, Y.; Bengio, Y.; Hinton, G. Deep learning. Nature 2015, 521, 436. [Google Scholar] [PubMed]
- Nagi, J.; Yap, K.S.; Nagi, F.; Tiong, S.K.; Koh, S.; Ahmed, S.K. NTL detection of electricity theft and abnormalities for large power consumers in TNB Malaysia. In Proceedings of the 2010 IEEE Student Conference on Research and Development (SCOReD), Putrajaya, Malaysia, 13–14 December 2010; IEEE: Piscataway, NJ, USA, 2010; pp. 202–206. [Google Scholar] [CrossRef]
- Muniz, C.; Figueiredo, K.; Vellasco, M.; Chavez, G.; Pacheco, M. Irregularity detection on low tension electric installations by neural network ensembles. In Proceedings of the 2009 International Joint Conference on Neural Networks, Atlanta, GA, USA, 14–19 June 2009; IEEE: Piscataway, NJ, USA, 2009; pp. 2176–2182. [Google Scholar] [CrossRef]
- Muniz, C.; Vellasco, M.M.B.R.; Tanscheit, R.; Figueiredo, K. A Neuro-fuzzy System for Fraud Detection in Electricity Distribution. In Proceedings of the IFSA/EUSFLAT Conference, Lisbon, Portugal, 20–24 July 2009; pp. 1096–1101. [Google Scholar]
- Bhat, R.R.; Trevizan, R.D.; Sengupta, R.; Li, X.; Bretas, A. Identifying nontechnical power loss via spatial and temporal deep learning. In Proceedings of the 2016 15th IEEE International Conference on Machine Learning and Applications (ICMLA), Anaheim, CA, USA, 18–20 December 2016; IEEE: Piscataway, NJ, USA, 2016; pp. 272–279. [Google Scholar] [CrossRef]

| Description | Value |
|---|---|
| Time window of data collection | 1 January 2015–31 December 2015 |
| Total number of consumers | 9956 |
| Number of normal users | 8562 |
| Number of aberrant user or electricity thieves | 1394 |
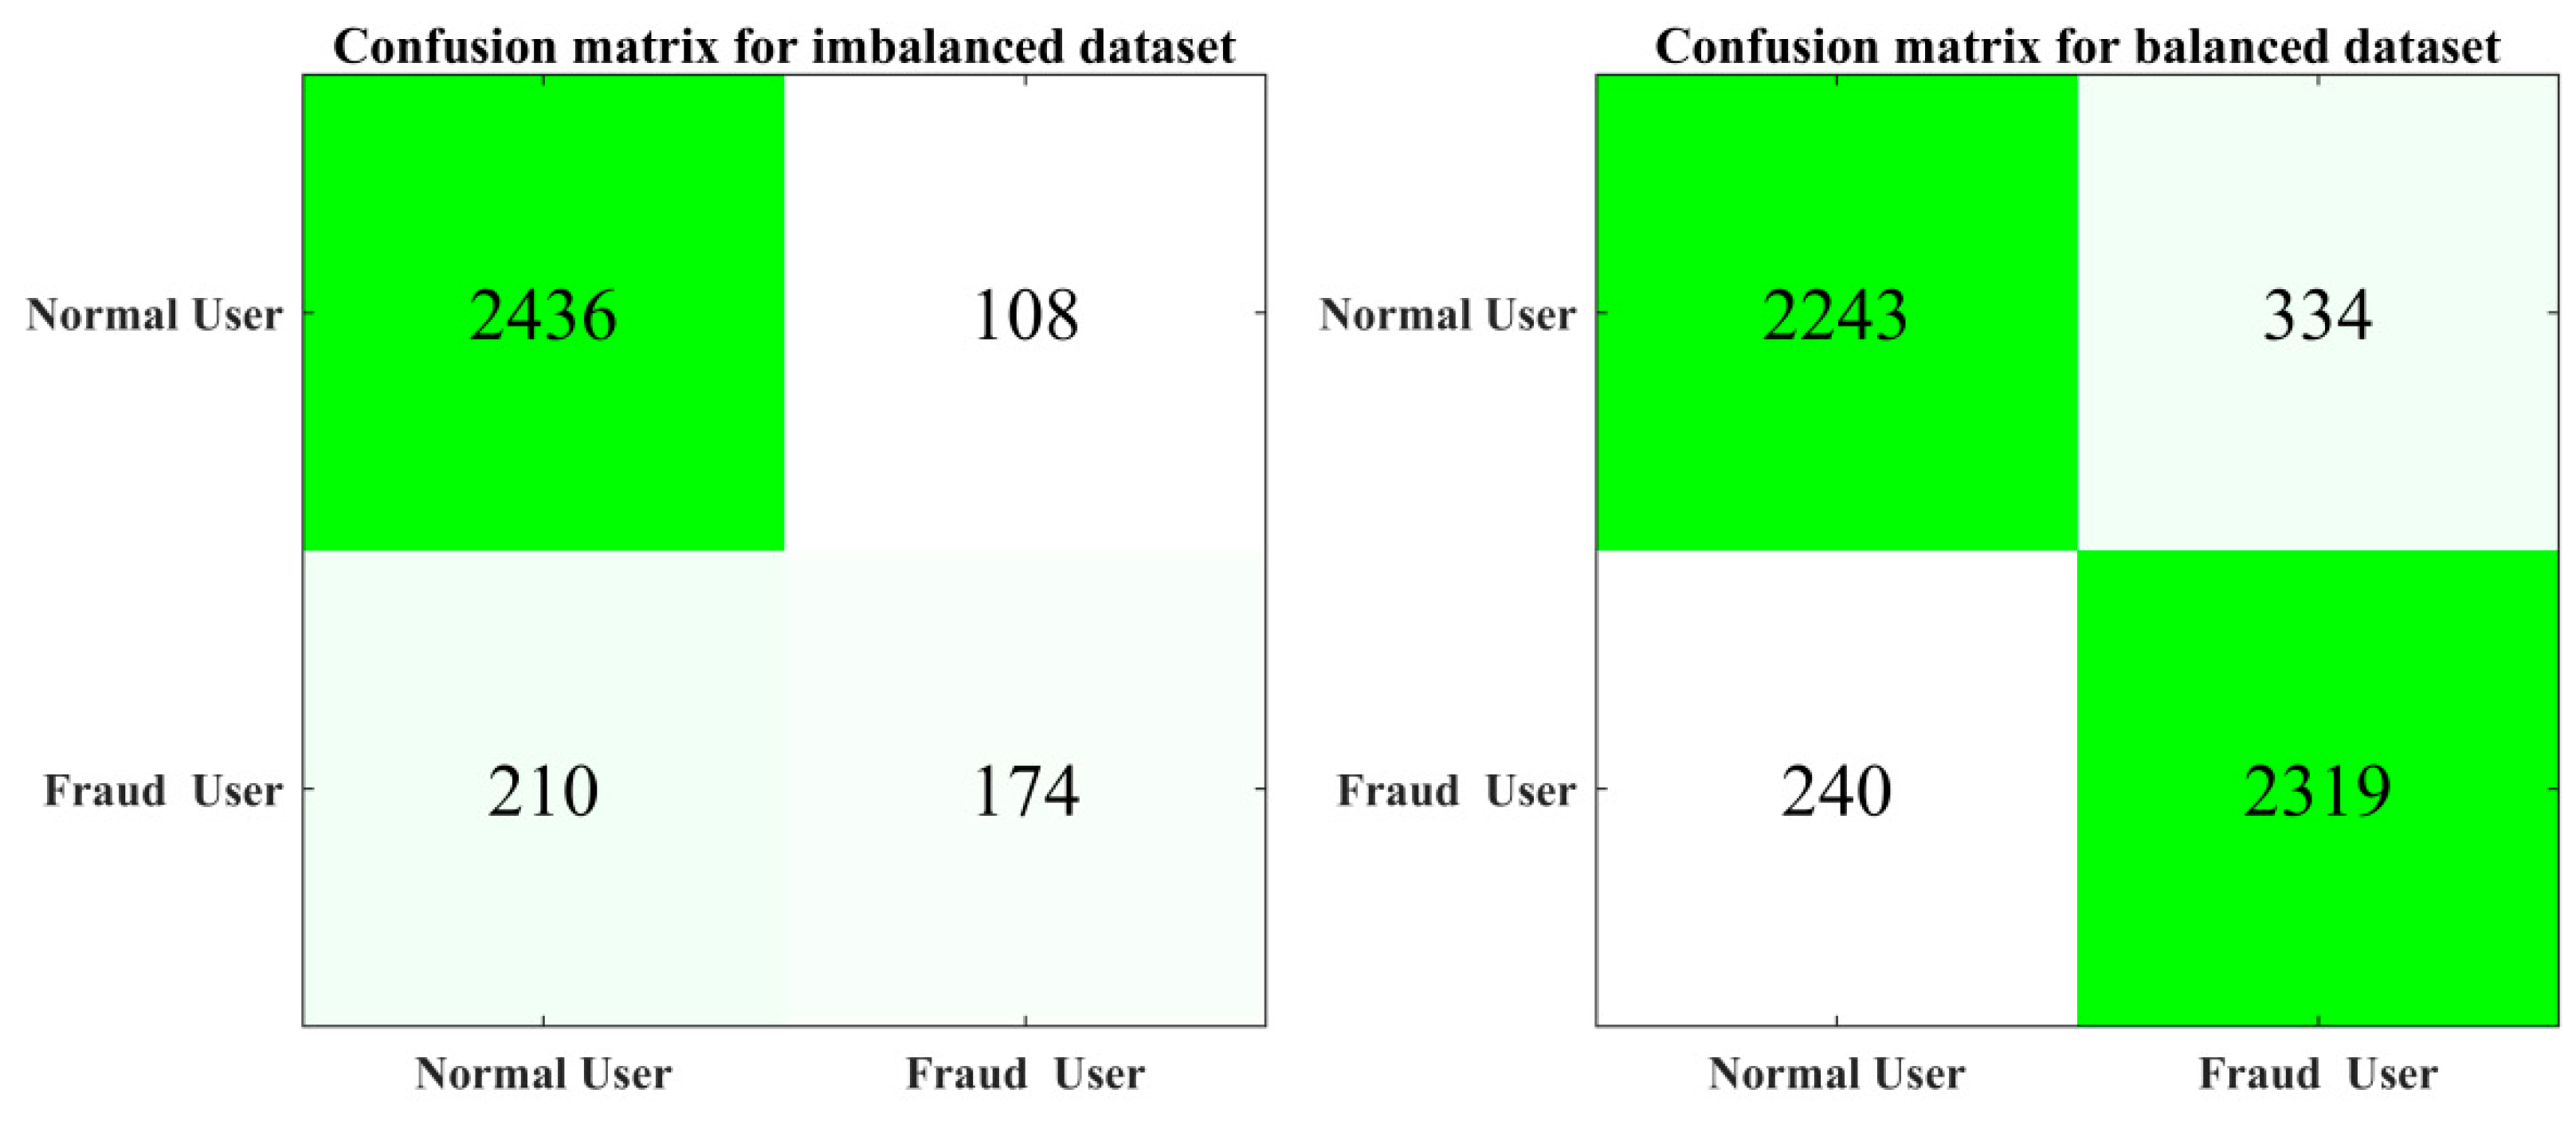
| Parameters | Before applying SMOTE | After applying SMOTE | |
|---|---|---|---|
| Precision | Normal user | 0.92 | 0.90 |
| Theft user | 0.62 | 0.87 | |
| Recall | Normal user | 0.96 | 0.87 |
| Theft user | 0.45 | 0.91 | |
| F1-Score | Normal user | 0.94 | 0.89 |
| Theft user | 0.52 | 0.89 | |
| Overall Accuracy | 0.89139 | 0.8882 | |
| Methods | Precision | Recall | F1-Score | Accuracy |
|---|---|---|---|---|
| Logistic regression | 0.7 | 0.69 | 0.69 | 69% |
| SVM | 0.79 | 0.79 | 0.78 | 79% |
| CNN-LSTM | 0.92 | 0.96 | 0.94 | 89% |
| # | Reference | Techniques applied | Number of Customers | Accuracy (%) | Precision | Recall | Source |
|---|---|---|---|---|---|---|---|
| 1 | [20] | DT coupled SVM | NA | 92.50 | NA | NA | |
| 2 | [34] | Combination functions (SVM, OPF, C4,5 tree) | NA | 86.20 | 54.4 | 64 | Uruguayan Electric Company (UTE) |
| 3 | [20] | Regression | 30 | 78 | NA | 1 | Electricity Thefts Surge in Bad Times,” March 16, 2009, USA Today, via Factiva, © 2009 USA Today. |
| 5 | [33] | SVM | 36176 | 60 | NA | NA | Tenaga Nasional Berhad Distribution (TNBD), Sdn. Bhd. |
| 6 | [13] | SVM-based fraud detection model (FDM) with the introduction of a fuzzy inference system (FIS)- SVM-FIS | 36176 | 72 | NA | NA | Tenaga Nasional Berhad Distribution (TNBD), Sdn. Bhd. |
| 7 | [36] | Genetic- SVM | 186,968 | 62 | NA | NA | Tenaga Nasional Berhad Distribution (TNBD), |
| 8 | [13] | SVM -fuzzy | 36173 | 72 | NA | NA | Tenaga Nasional Berhad Distribution (TNBD) |
| 9 | [54] | Fuzzy logic | 55 | NA | NA | TNB Metering Services database | |
| 10 | [41] | Fuzzy classification | 74.50 | NA | NA | brazil | |
| 11 | [55] | Neural networks (NN) | 83.5 | 24.929.8 | Light S.A. Company, Brazil | ||
| 12 | [56] | Neuro-fuzzy | 4159 | 68.2 | 51.2 | Light S.A. Company, Brazil | |
| 13 | [57] | Convolutional Neural Networks (CNN), Long Short-Term Memory (LSTM) and Stacked Autoencoder. | 12,180 | 96.9 | NA | NA | |
| 14 | [7] | Wide and Deep CNN | 42372 | 94.04 | NA | State Grid Corporation of China (SGCC) | |
| 15 | This work | Convolutional Neural Networks (CNN), Long Short-Term Memory (LSTM) | 17120 | 89 | 0.90 | 0.87 |
© 2019 by the authors. Licensee MDPI, Basel, Switzerland. This article is an open access article distributed under the terms and conditions of the Creative Commons Attribution (CC BY) license (http://creativecommons.org/licenses/by/4.0/).
Share and Cite
Hasan, M.N.; Toma, R.N.; Nahid, A.-A.; Islam, M.M.M.; Kim, J.-M. Electricity Theft Detection in Smart Grid Systems: A CNN-LSTM Based Approach. Energies 2019, 12, 3310. https://doi.org/10.3390/en12173310
Hasan MN, Toma RN, Nahid A-A, Islam MMM, Kim J-M. Electricity Theft Detection in Smart Grid Systems: A CNN-LSTM Based Approach. Energies. 2019; 12(17):3310. https://doi.org/10.3390/en12173310
Chicago/Turabian StyleHasan, Md. Nazmul, Rafia Nishat Toma, Abdullah-Al Nahid, M M Manjurul Islam, and Jong-Myon Kim. 2019. "Electricity Theft Detection in Smart Grid Systems: A CNN-LSTM Based Approach" Energies 12, no. 17: 3310. https://doi.org/10.3390/en12173310
APA StyleHasan, M. N., Toma, R. N., Nahid, A.-A., Islam, M. M. M., & Kim, J.-M. (2019). Electricity Theft Detection in Smart Grid Systems: A CNN-LSTM Based Approach. Energies, 12(17), 3310. https://doi.org/10.3390/en12173310