1. Introduction
With the advancement of smart grid construction, sensing, computation, communication, and control technologies have been deeply embedded in power systems. Therefore, the traditional power system has gradually been updated to a multi-dimensional complex system integrating the cyber and physical environment, i.e., cyber physical power system (CPPS) [
1,
2]. Supported by high-speed communication networks and distributed by intelligent terminals, comprehensive power services can be ensured. However, the vulnerabilities and defects in the information layer may be exploited by hackers to invade the software, hardware, and data [
3,
4].
Unlike the traditional Internet, power communication networks are closely coupled with the operation of physical power grids [
5]. Once attacked, the power infrastructure will be mis-operated by wrong control instructions. Due to the spatio-temporal transitivity of power flow, the cyber-attacks may even trigger the cascading faults, resulting in serious security and economic losses [
6,
7].
According to the target, the attackers mainly aim at three key elements of information security, i.e., confidentiality, integrity, and availability [
8,
9]. Among them, the denial of service (DoS) attack is a classic way to destroy information availability. This attack method makes use of the network defects, consumes the system resources, and finally disables the normal services [
10].
The independent DoS attack mainly penetrates into servers with insufficient memory and low processing speed in a one-to-one way. With the development of computer technology, the capacity, parallel processing ability, and transmission speed of hosts have been greatly improved. Therefore, the capabilities of DoS attack are insufficient to block the communication networks, and the distributed puppet clients are utilized together to carry out coordinated attacks, known as distributed denial of service (DDoS) attacks [
11].
Compared with other attacks, there is no need for a DDoS attack to have access to the read–write permission, operation parameters, and topological knowledge of the power grid. It can be implemented in the distributed terminals and exert impacts on the server. This kind of attack is easy to realize, which can cause congestion or even paralysis to power services. Moreover, it is difficult to locate because the puppets are used to hide the attacker itself. As a result, it has become a common attack method to destroy the CPPS.
This paper presents the co-simulation technology to develop coordinated defense strategies. The simulation network of the CPPS provides a whole description of the operation characteristics in both normal and emergent environments. Then, the detection method in the information layer and recovery method in the power layer against the DDoS attacks are put forward, which are a double insurance to minimize the attack impact.
The rest of the paper is organized as follows. In
Section 2, related work is discussed and compared to show the contributions of this paper. The attack–defense platform of the CPPS is elaborated in
Section 3. In
Section 4, the process and construction of a DDoS attack are introduced. In
Section 5, centering on load frequency control (LFC) services, the impact of a DDoS attack on communication delay and control effects is analyzed. Coordinated defense strategies implemented in the information layer and physical layer are presented in
Section 6. In
Section 7, a simulation case of the attack–defense process in the IEEE 14-bus and 57-bus system is given and discussed. The conclusion appears in
Section 8.
2. Related Works
The key of DDoS attack research is divided into two parts: Attacker perspective and defender perspective. For the attackers, the problem is how to dig the communication loopholes and flood the network. For the defenders, the problem is how to detect, clean the attack scripts, and recover the power services. In chronological order, a whole DDoS attack–defense process includes the intrusion setup, risk transitivity, and secure protection.
For the intrusion setup, related works discuss various attacking methods according to various attacking goals [
12]. The types of DDoS attack are introduced in reference [
13] from the perspective of volume-based attack, protocol attack, and application layer attack. Reference [
14] concludes the DDoS attacks as reflection-based, protocol exploitation, and amplification-based attacks. These researchers mainly mine vulnerabilities of communication protocols by inductive methods, without giving the detailed realization ways.
For the risk transitivity between the information layer and power layer, in existing research, the impact of cyberattacks on control services is mainly analyzed through modeling methods, including complex network, correlation matrix, impact diagram, and switching system [
15]. From the perspective of the complex network, the respective architectures of the random network, scale-free network, and small-world network are utilized together with the network topology and power communication services. Therefore, the mechanism of cascading failure propagation considering network vulnerability can be obtained [
16,
17,
18,
19]. From the perspective of a correlation matrix, reference [
20] establishes the coupling model of primary physical nodes and secondary information nodes, then quantitatively analyzes the influence of communication link failure on the delay and reliability of physical services. From the perspective of an influence diagram, possible methods of DoS attack against remote terminal units (RTU) have been modeled for preparing countermeasures [
21]. From the perspective of a switch system, the state space model of power systems under DoS attacks is formulated as a switched system. The existence of DoS attacks disabling the LFC service [
22] and feedback control system [
23] has been proved. While converting the physical relationships into mathematical model, these researchers make some simplifications and assumptions, which may affect the key features of the CPPS environment.
For secure protection against the attack, a whole loop includes the prevention strategies before attack, detection strategies during attack, and recovery strategies after attack. Reference [
24] proposes a preventing method with a firewall. It reduces the data computation and data storing burden of the automated metering infrastructure by cloud computing technology. Reference [
25] puts forward a detection mechanism with an information divergence scheme to discard the attackers’ false requests. Reference [
26] proposes a collaborative reputation-based topology configuration, which enables safe cyber communication nodes to converge quickly for recovering the dynamic stability while other nodes are under attack. Most of these researchers only adopt one kind of protection methods; in fact, in various parts of CPPS, joint protection strategies focusing on various sequential stages are more effective.
Current research mainly focuses on cyber physical attacks against power systems through modeling methods. The various indexes are proposed to reflect the correlation between cyberattacks and power services. However, significant shortcomings lie in the limited application scope and unclear physical mechanism. Moreover, current defense strategies are mainly aimed at the single layer (i.e., cyber layer or physical layer). According to the interaction effects between the power and information layer, attack impact may be spread across all the CPPS space. Correspondingly, coordinated defense strategies need to be considered. Compared with the modeling method, simulation is a more practical method for revealing the attack and defense details in the CPPS. However, a single simulation tool cannot resurrect the dynamic feature of data flow and energy flow of CPPS after cyberattacks. Therefore, various power, communication, and control simulators are integrated and the synchronization methods among them are designed to form the co-simulation platform [
27]. The co-simulation technologies are utilized to research DDoS attacks and coordinate defense. Compared with previous research, this work is unique in that it proposes a real-time co-simulation platform that can realize a complete and closed loop attack–defense process in the CPPS [
28]. Simulation results of electrical and information quantities are taken as the optimized target instead of abstract indexes. The main contributions of this paper are summarized as follows:
- (1)
Through co-simulation, an attack–defense platform is set up. Moreover, the vulnerability of the communication network is analyzed. Based on the transmission control protocol (TCP) loopholes, the flood attack method is utilized to organize a DDoS attack.
- (2)
The cross-space interaction of the risks resulting from DDoS attacks is analyzed. The LFC service, which is a wide-area control process that maintains frequency stability by balancing the generation and load, is used to prove the impact of the communication delay caused by DDoS attacks on the frequency and power stability.
- (3)
The impact of system scale, attack resources, and defense strategies are verified in various attack–defense conditions. To relieve consequences of the attack, coordinated defense strategies both in the power and information layers are taken, which can be divided into the detection and recovery part.
3. Co-simulation Structure of CPPS Attack–Defense Process
Various types of power and outside environment information support the multi services of the CPPS, like monitoring, protection, and dispatching. The CPPS consists of power, communication, and control layers, where the control layer is mainly made up of the station layer, bay layer, and process layer. The state of the network is ascertained by the measurement units and transmitted to the control center. The data are received in the process layer, transmitted in the bay layer, and analyzed in the station layer from bottom to top. The control center generates commands according to the control algorithm in order to realize the situation awareness and optimal control of the power grid. The flow process of data can be summarized as collection, uploading, processing, downloading, and execution [
29].
In the CPPS environment, a large amount of distributed computing, control, and power equipment is coupled into a whole entity by communication network. Once a subsystem is attacked, the risk will spread across space, which is difficult to locate, detect, and protect. Therefore, research on cyberattacks and coordinated defense requires the interactive characteristics of the physical environment, communication network, and control devices. In order to establish a complete attack–defense cycle with a unified framework, CPPS co-simulation technology is used to integrate different layers by data interface and time synchronization scheme. Then, the process of attack recurrence, fault location, security analysis, and fault recovery in various layers can be simulated to realize the coordinated defense.
The framework of CPPS real-time attack–defense co-simulation platform is shown in
Figure 1, where the power layer based on RT-LAB and communication layer based on OPNET are integrated by the control layer developed in C language. A real-time power system simulator, RT-LAB, is equipped with several special model libraries like RT-events, RT-Drive, and ARTEMIS, covering various power system scenarios. In order to meet the real-time simulation requirements of RT-LAB, the model scale is limited. Therefore, the original power network is usually simplified to build the equivalent network. Moreover, with the TCP/user datagram protocol (UDP) socket communication module (i.e., OpAsyncRecv and OpAsyncSend module), it is convenient for RT-LAB to be connected with other simulators.
A discrete-event network simulator, OPNET is able to analyze and test communication performance. It provides a variety of standard applications, such as database, e-mail, HTTP, print, remote login, video conferencing, and voice. Most of the power services can be covered by combining the above applications. Furthermore, OPNET provides a hardware-in-the-loop simulation interface called system-in-the-loop (SITL). The existing model provided by the SITL module can support many protocols and map the real data packets to virtual OPNET packets. Through the SITL module, OPNET and the exterior environment can be made into a unified entity.
To make the information from one simulator compatible with that of another, it is necessary to apply a time synchronization strategy to ensure a unified simulation clock. The control layer consists of three modules: (1) The protocol conversion module used for parsing the measurement packets in the TCP protocol; (2) the data processing module used for analyzing the real-time state of power grid; and (3) the control decision module used for generating optimal control strategies according to the power state awareness. Therefore, the coordinated and consolidated control of distributed simulators could be reached.
On the basis of the common platform, the attack and defense processes are added to all layers. As shown in
Figure 2, firstly the time delay resulting from DDoS attack is used to trigger LFC effects. Moreover, concerning the impact of attacks on the power and information layer, protection and recovery strategies are adopted to realize a sequential coordinated defense.
4. Modeling and Simulation Process of DDoS Attack
4.1. Principles of DDoS Attacks
In the CPPS environment, according to the attacked data, DDoS attacks can be divided into types that cause unavailability of measurement and control data flow. The former is designed to cause the loss of power system observability, whereas the latter is designed to cause the loss of device controllability by non-response or delayed response. According to the attacking objects, DDoS attacks can be divided into types that occupy network bandwidth resources and system resources. According to protocol defects, DDoS attacks can be divided into types based on address resolution protocol (ARP), Internet control message protocol (ICMP), Internet protocol (IP), user datagram protocol (UDP), transmission control protocol (TCP), and application layer defects.
As shown in
Figure 3, a complete DDoS attack process can be divided into four stages, i.e., attacker, master controller, agents, and victim server. Several master controllers are utilized to send attack commands and hide the attacker itself. Moreover, a large number of clients in the network are manipulated by the attacker as agents to block the servers. Among various kinds of attack, synchronize sequence number (SYN) flood attack is common with easy realization methods. It takes advantage of the defects of three-way handshakes of TCP protocol to flood the server. Before the beginning of TCP-based communication, requirements need to be confirmed three times between the clients and servers, where SYN packets are used to initialize the connection, and acknowledge (ACK) packets are used to confirm the connection status. In DDoS attacks, the attacker manipulates many agents to send SYN packets to the servers. When the servers reply to ACK confirmation packets, the invaded agents no longer respond. Therefore, there remain numerous waiting TCP connections in the attacked servers, and the network is full of useless packets. Thus, the victim server is unable to operate normal services.
4.2. Simulation of DDoS Attacks by Opnet
To realize the DDoS attack, the cyber-effects module is used in OPNET to simulate the effects of cyber-attacks in various protocols and devices. The configuration file of the cyber-effects module specifies the attack and defense actions. On this basis, the basic events of cyberattacks and defense can be designed. Based on the basic functions, configuration files can be integrated into the form of effect, script, and phase groups. In the power communication network, the cyber-effects module can be organized for simulating a whole DDOS attack. The whole attack process is described in
Table 1.
(1) Build the communication scenario of DDoS attack. The network contains infected nodes, normal nodes, server nodes, attack nodes, and monitoring nodes. The routing table, database, and services such as HyperText transfer protocol (HTTP), voice, video in each terminal, and server are configured. Thus, a whole power communication network with monitoring and control services can be set up, which provides a scenario for the attacks.
(2) Configure cyber-effect scripts. Four basic operations are provided by OPNET: Infection, confirmation of infection, generation of data traffic, and scanning of infected nodes. Through these scripts, a series of attack and defense actions can be defined. A combination of these four operations can obtain the required attack–defense scripts by defining the time, location, and degree of the infecting, scanning, and clearing scripts.
(3) Link attack profiles. The attack includes two stages: Attack authority acquisition and traffic flooding attacks. The above-mentioned scripts need to be linked to form a complete attack–defense cycle. Firstly, the central client in the network is taken as the master controller, and security loopholes of other clients are scanned, infected, and manipulated. The infected clients will send the confirmation to the attacker and become the agents. Secondly, SYN flooding attack is used to block the server through the agents. By adding a false source address to the message, a large number of semi-connection requests are sent to the target server, which disables the three-way handshakes of TCP protocol. Therefore, the resources of the server are exhausted, and the communication delay increases sharply.
4.3. Attack Consequences
After the DDoS attack, the direct consequence is network congestion due to numerous useless data packets. Thus, normal power services are weakened. The LFC service is taken as an example. It is responsible for restoring the frequency and tie-line power stability as soon as possible, which relies on the real-time sampling of intelligent measurement terminals and high-speed communication tunnels in the wide area system. However, when the DDoS attack happens, the delay of data transmission will harm the performance of these normal services, which finally reduces the security and stability of power systems.
5. LFC Services Considering Delay in Multi-Area Power Systems
5.1. Overview of Wide Area Information Services
Typical wide area information services of the power system include supervisory control and data acquisition (SCADA), relay protection, fault information transmission, dispatch management, energy metering, lightning location, and automatic generation control (AGC). The data flow structure of services is shown in
Figure 4. Intranet of power system enterprise will be used to transmit all kinds of wide area traffic generated by monitoring, protection, and control systems between control servers and execution clients. To guarantee the quality of service and solve the traffic confliction of multiple services, the reliable and real-time performance of information management and transmission need to be guaranteed.
5.2. LFC Effects Considering Delay in Multi-Area Power Systems
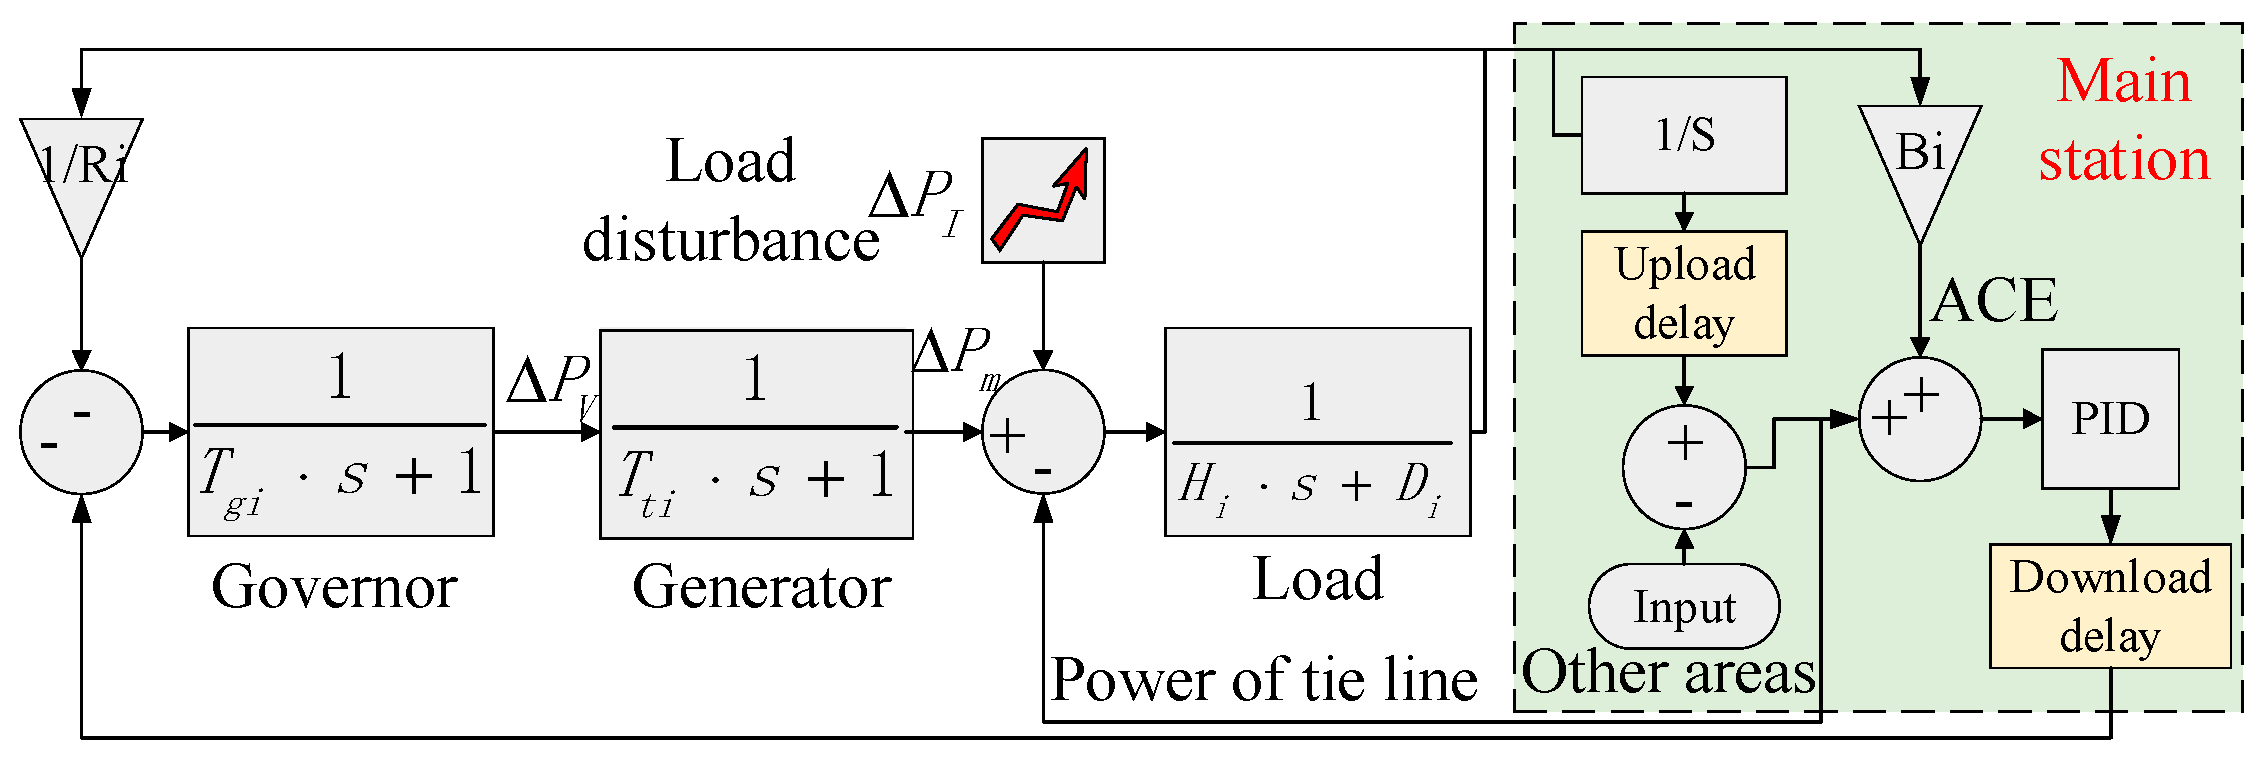
Load frequency control is an important sub-service of AGC services, which is responsible for load and frequency stability. The frequency of power systems is mainly determined by active power. In a multi-area interconnected system, any sudden change of the load may lead to a deviation in power exchange between tie-lines and a fluctuation of system frequency. Therefore, it is necessary to adjust generator parameters by LFC to recover the regional frequency and turn tie-line power into nominal value, thus minimizing unplanned variation. The LFC flow for an area interconnected with other areas is shown in
Figure 5.
In the above diagram,
represents the governor time constant,
represents the turbine time constant, H represents the inertia moment of generator and D represents the damping coefficient; R denotes the sagging characteristics;
represents the deviation of valve position,
represents the deviation of mechanical energy output, and
represents load disturbance; i indicates the ith area, and B denotes the frequency deviation coefficient. The LFC ensures not only that the frequency deviation of each area returns to zero, but also that the active power of the tie-line is minimized. Therefore, the area control error (ACE) is adopted to meet the above requirements. For area i, ACE is defined as
Based on ACE, frequency and active power can be optimized by the proportion-integral-derivative (PID) controller, which has strong robustness and high reliability. It is a commonly used control strategy whose transfer function is as follows:
where
,
and
are proportional, integral, and differential gains, respectively.
One of the major challenges faced by LFC is the delay caused by communication networks. The service data are transmitted between the control center and remote phasor measurement units (PMUs). For the natural and short delay, it can be neglected because of the robustness of the PID controller. However, if DDoS attacks occur in the network, it will lead to large delay, affect the real-time control effects, even lead to system instability. Therefore, the key of LFC is the real-time state awareness, so as to predict the frequency accurately and take emergency control measures quickly.
6. Coordinated Defense Strategies against DDoS Attacks
Considering the concealment and distributed attack method, it is difficult for defenders to detect and eliminate DDoS attacks quickly. Current defense strategies mainly detect the attack behavior from the time, content, and protocol characteristics of the traffic. However, it needs enough time to analyze and identify the numerous traffic. Therefore, there is still no real-time defense strategy with a 100% success rate against DDoS attacks. The impact of DDoS attacks on power services is unavoidable, so the coordinated defense, considering detection in the communication network and recovery in the power grid, is regarded as a reasonable way to minimize the impact of attack.
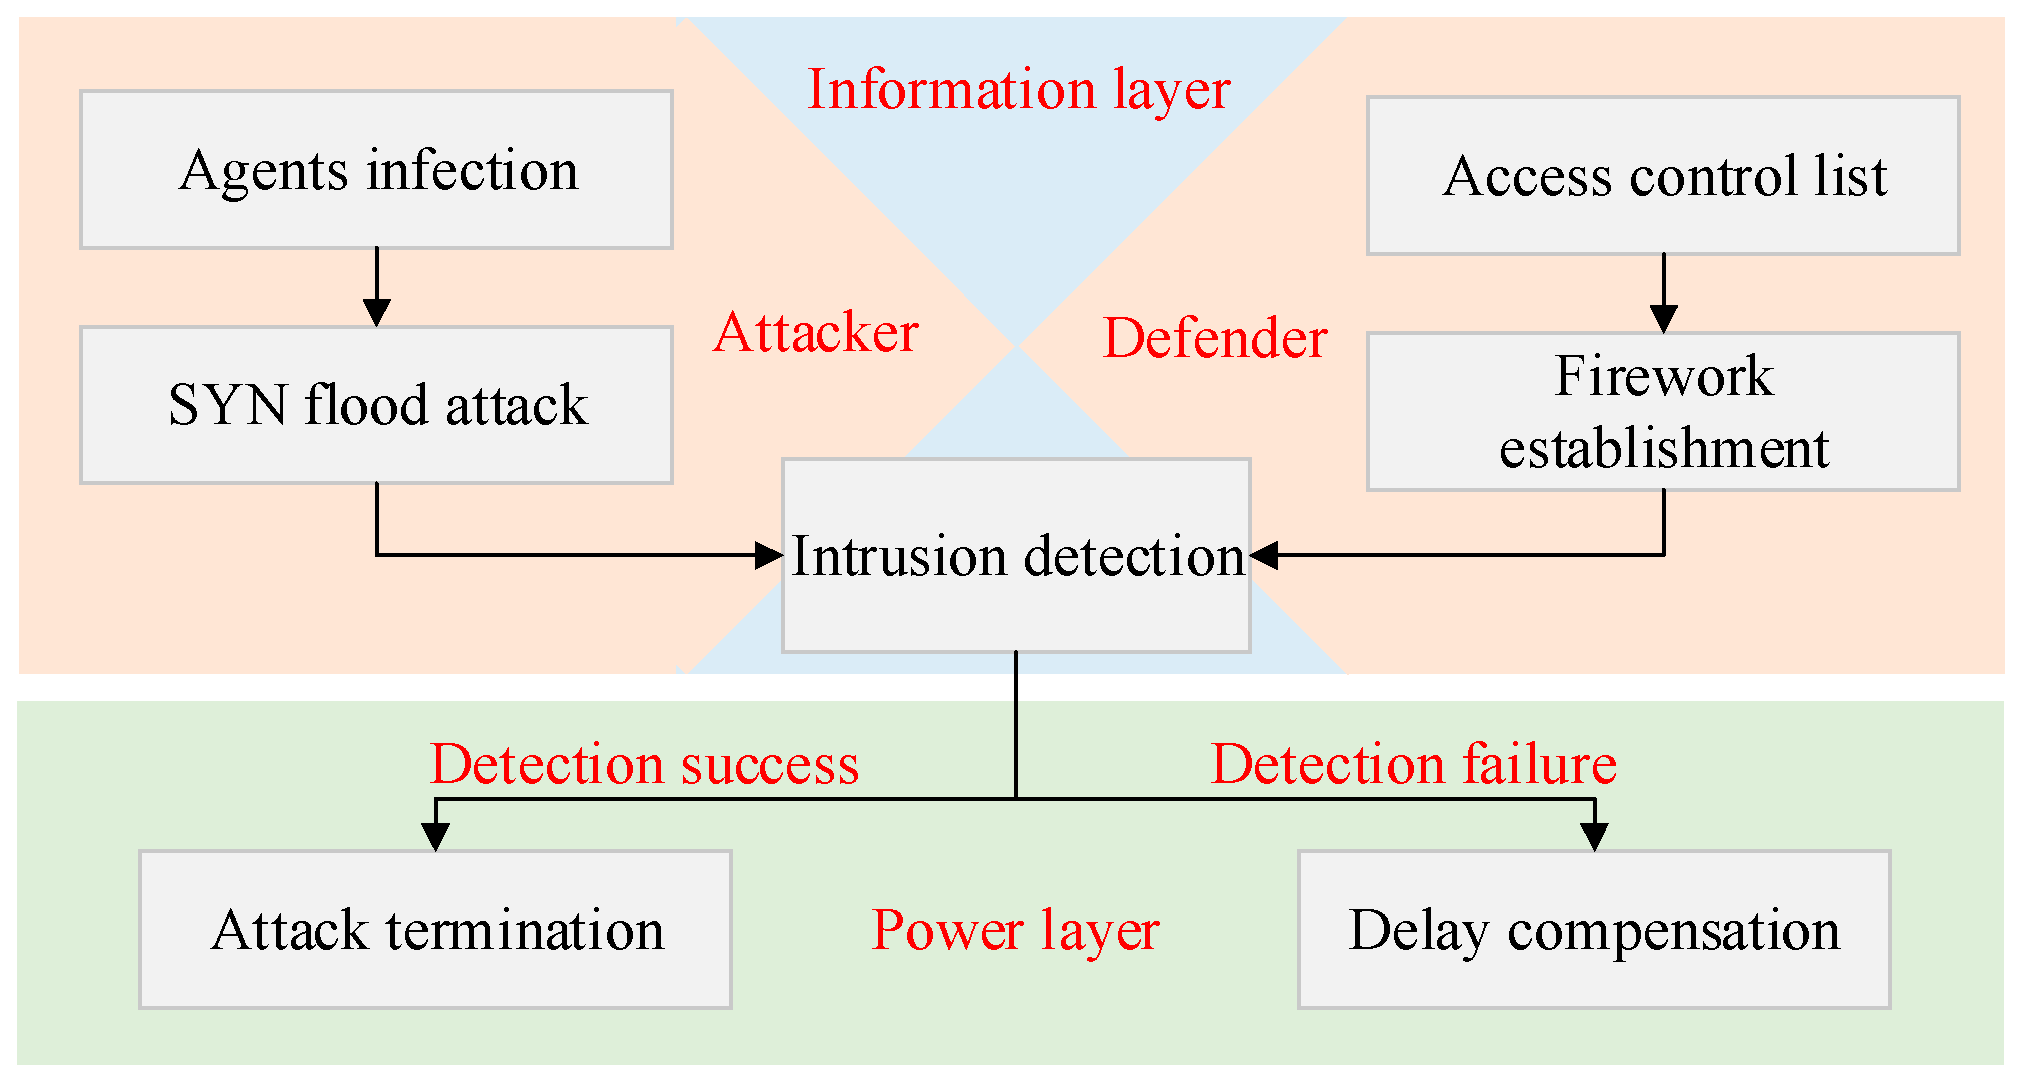
On the one hand, information availability should be guaranteed; on the other, frequency and power stability should be guaranteed. Therefore, it is necessary to establish the coordinated defense strategies based on the cross-space transmission mechanism of risk between both layers. As shown in
Figure 6, the detection and recovery processes are integrated. In the information layer, the access control list and firewall are established to detect possible infected agents. If attacks bypass the firewall and harm the power layer, compensation strategies are used for recovery.
6.1. Defense Strategies in the Information Layer
The attack process in OPNET mainly includes the control rights of the agents and traffic flooding against the server. The defense strategy in OPNET is mainly aimed at the latter. In order to identify wrong traffic from the infected agents, the defense scripts of the cyber-effects module in OPNET are used to build a firewall in substation routers, which is configured using an access control list (ACL).
As shown in
Figure 7, an ACL is used to set the matching relations, conditions, and query statements. By comparing the normal and abnormal data, traffic analysis is used to confirm the attack rules. They are applied to identify the data packets, and filter the traffic with unauthenticated address, destination, and port number. On this basis, the user load caused by malicious applications can be released; therefore, the stability of the network and server can be enhanced. The work process of ACL is as follows.
Based on the addresses of current nodes and the feature of power services in the network, define the white list of traffic before the attack happens.
During the attack process, according to white list, identify the traffic content, such as the source address, port, service type, and packet type. For the suspected attack traffic, add them to the black list.
If the DDoS attack still happens while the traffic content is correct, detect the timing characteristics of the traffic. If there are lots of connections within a short time, limit the maximum queue length and retry the SYN connection. Then, the traffic with abnormal sending frequency is taken as the attack traffic.
In the DDoS attack process, the attack success probability depends on the attack resource and information resource mastered by attackers. The former means the agent number controlled by attackers, whereas the latter includes the number, configuration, and performance of the main station. Moreover, in a CPPS environment, as the servers and networks are constrained in computation, bandwidth, and memory and demanded in real-time transmission, the deployment and passing condition of ACL should not be too complex. Lightweight and proactive methods are more practical, in which the detection may be lagging but the real-time performance of communication can be guaranteed. Therefore, for the DDoS attacks with a well-designed address and content camouflage, the firewall and detection methods may take a long time to come into force. Risk may be transmitted to the power services. Corresponding recovery strategies should be built in the power layer.
6.2. Defense Strategies in the Power Layer
If the attack bypasses the firework protection and causes the network delay, to relieve the attack effects and recover normal services, a network delay compensator can be added based on predictive control. After the attack, LFC forms a hysteresis system whose control structure can be simplified as in
Figure 8. The LFC model is a feedback control process formed by the PID controller
and a delayed system response
.
In the original model without the compensator, the total transfer function is
The delay element in the denominator may lead to overshoot and oscillation. When the delay is too large, the frequency response characteristics of the closed-loop system will be disturbed or even unstable.
To solve this problem, the delay should be separated from the feedback loop of the system response. By introducing a compensator in parallel with the PID controller, the hysteresis effects can be weakened and eliminated. As shown in
Figure 8, the transfer function of the compensator is
Therefore, the improved total transfer function is
The improved model can be simplified as the equivalent model in
Figure 8. Obviously, the delayed effect is eliminated from the feedback control part. The output considering delay is a simple hysteresis attached to a normal control model. Therefore, due to the feedback correction process, the compensated control has a strong resilience against disturbance and uncertainties.
7. Case: Attack and Defense Simulation in the CPPS
Firstly, the structure of the CPPS co-simulation platform is set up. The control logic and physical map are shown in
Figure 9. The control master station is the bridge that implements the control logic and time synchronization between both simulators. Based on this, cyber-attack behavior can be realized in OPNET, and detection and recovery strategies can be generated in the control station and be fed back to OPNET and RT-LAB [
29]. Therefore, the attack–defense simulation can be achieved. On this basis, the attack–defense process is simulated in the IEEE 14-bus and 57-bus systems.
Compared with the real systems, the A/D switching process of data is omitted in the simulation, and the delay may be affected by the computation model of the software and the computation capability of the computer, which is unable to be quantified. Due to the real-time simulation, the error can be maintained into the millisecond magnitude, so the simulation can reflect the features of CPPS in a high authenticity.
7.1. Attack and Defense Process in the IEEE 57-bus System
7.1.1. Topology and Area Partition of the IEEE 14-bus System
The power layer topology and wide area communication network of the IEEE 14-bus system are shown in
Figure 10. In the IEEE 14-bus system, three PMUs are respectively located in bus 2, 6, and 9. According to the PMU location and electrical distances, the original system can be regarded as a 3-area interconnected system, which is shown in
Figure 11a. The lines 5–6, 4–7, and 10–11 become the tie-lines among areas, and buses 2, 6, and 9 are the measurement and execution locations in each area.
The corresponding communication network is shown in
Figure 11b. In the OPNET simulation model, the whole network is divided into three areas:
-
are 14 substations, and
is taken as the master station. Each station is connected by a local switch with fiber Ethernet in 100 Mbit/s, and switches are connected with traditional cable Ethernet in 20 Mbit/s. Router
-
are used to connect various areas to form a wide area communication network. The processing delay of Ethernet elements is set to 15 us. Open shortest path first (OSPF) is taken as the router protocol and priority queuing scheduling strategy is adopted in network devices. For the application data type, a database model in OPNET running in TCP protocol is utilized to realize the voltage and frequency data in the power system, and other data are simulated in background traffic. The attack profile is defined and gets access to router
, which initializes the DDoS attack parameters.
7.1.2. Attack Consequences of DDoS Attacks
The attack period is set from 100 s to 400 s. During the attack, the delay of each line will increase sharply. Due to the two-way transmission, the delay can be divided into the upload delay from substation to server and download delay from server to substation. These lines are assumed to carry the load and frequency measurements, which are uploaded to the server for the subsequent services. During the DDoS attack, the optimal transmission path of power services in each substation may change due to the time delay. According to the Dijkstra optimization algorithm, the shortest path from the main server to each substation is obtained. The accumulated delay is calculated by the delay in each link, which is shown in
Figure 12. After DDoS attacks, the upload and download delay are significantly increased. Due to the limit of storage and process ability of the server, the delay of download control commands is larger than the upload delay, overall. With the increase of the distance from the substation to center, the communication delay becomes larger as a whole.
7.1.3. Analysis of LFC
The parameters of generators and tie-lines are shown in
Table 2.
Three cases in which 20% of the load is added in each area are set up, then the frequency and tie-line power response results in each area are simulated and compared with them without delay. The results are shown in
Figure 13 and
Table 3. It can be concluded that in ideal conditions without delay, both frequency and tie-line power can quickly return to a pre-disturbance condition. The overshoot and regulation time of the system increase when the delay is small (i.e., area 1 and 2), but the system can recover the frequency and power stability in a short time of 3.41 s and 3.91 s, respectively. When the delay is large (i.e., area 3), the fluctuation and instability of the response curve obviously increases sharply, and the system requires 13.88 s and 11.41 s to stabilize frequency and power, respectively. The recovery time means the settling time within a specified error band of 0.05 Hz in frequency and 0.01 pu in tie-line power. Moreover, the lowest frequency of system decreases with the increase of the delay.
7.1.4. Deployment and Results of Defense Strategies
a) Defense Results in the Information Layer
To detect the DDoS attacks, ACL-based fireworks are deployed in the routers. Through the traffic analysis, the infected clients are confirmed gradually and cleaned, and the time delay will return to a normal level.
Figure 14 shows the infected device number of the network, CPU occupancy ratio and received packets of the host server before, during, and after the attack. At 110 s, the attacker begins to infect the target clients gradually, and the number of infected buses is up to 11. At about 240 s, the attacked agents are utilized to send flooding attacks to the server, which leads to a sharp increase in the proportion of server memory and received traffic. After deploying defense strategies in 310 s, the system gradually carries out the filtering and cleaning process of abnormal traffic. Finally, the flow and memory occupancy return to normal state at 400 s.
b) Defense Results in the Power Layer
From
Figure 14, hundreds of seconds are needed to construct a detection circle. The hysteresis of the detection and concealment of the DDoS attacks may mean that defenders cannot clean the attacks in the information layer in time. Before the firewall takes effect, communication delay will maintain a high level. Therefore, single communication detection is not enough for the DDoS defense. In coordination with firewall detection, the recovery methods in the power layer need to be adopted to reduce and eliminate attack impact. Under the action of a DDoS attack, a series of delays in the power service will occur, which will lead to the obvious overshoot and deteriorating stability of the system. In the case of area 3, with a large delay, the hysteresis can be weakened and eliminated by introducing a network compensation controller. The simulation results in
Figure 15 and
Table 4 show that under the compensated control, the overshoot and adjusting time are greatly reduced, except that the rising time is slightly increased. Overall, the control effect is greatly improved.
7.2. Attack and Defense Process in the IEEE 57-bus System
7.2.1. Topology and Area Partition of the IEEE 57-bus System
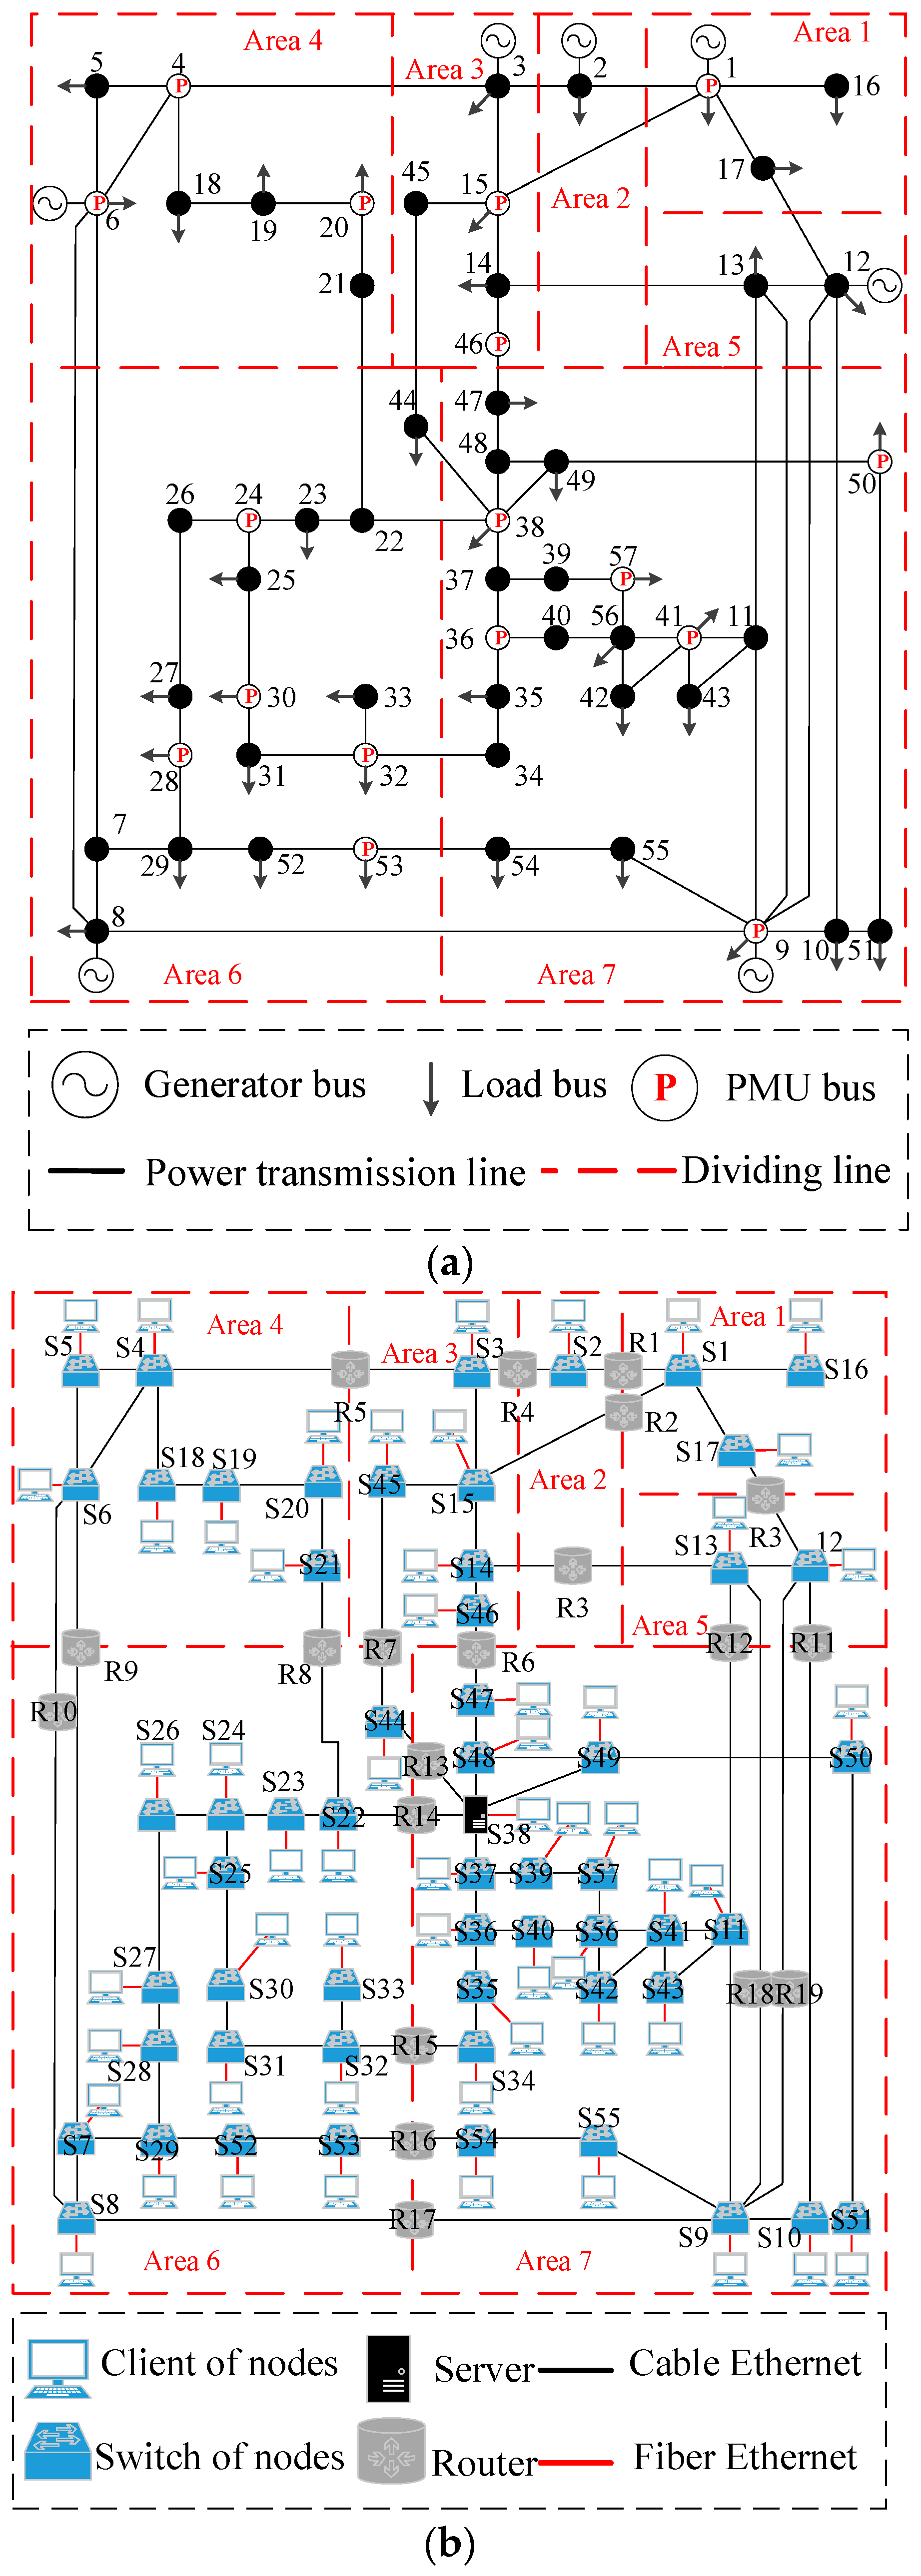
To verify the impact of the system scale on the DDoS attack, an IEEE 57-bus system is taken as a comparison. The power and communication topology are shown in
Figure 16. 17 PMUs are deployed to ensure the system observability. According to the location of generator buses, the system is divided into seven areas. Routers are used to connect various areas, and LFC strategies are deployed respectively in each area. Bus 38 is chosen as the main server, and others are the substations.
7.2.2. Impact of the Attack Resources on the Attack and Defense Effects
Two kinds of attack resources are compared, one is the same resource (infecting 11 buses) as the IEEE 14-bus system case, and the other is double the number of infected buses. After the DDoS attacks, the delay from each area to the server is shown in
Table 5. Compared to the situation in the IEEE 14-bus system, the delay is relatively lower, and the stability is stronger under the same attack resource. In a larger system, the redundancy of communication lines and tie-lines are higher, therefore more attack resources are required for the attackers to make an efficient attack.
In the power layer, the largest delay occurs in the case of area 7, and the response results with and without the time compensator under various attack resources are shown in
Figure 17. For the response under high-resource attack, the oscillation of frequency and tie-line power shows no convergence and finally causes system instability. Therefore, the utilization of delay compensator is effective. For the response under low-resource attack, compared with the compensated control, though the response without compensation shows few fluctuations, it does not exceed the threshold line (0.05 Hz). Meanwhile, the response with compensation takes more time to return to stability. Therefore, for the situation with little delay, the adoption of compensated control may bring drawbacks.
8. Conclusions
As an attack destroying information availability, a DDoS attack is easy to implement through the distributed devices and exert an effect in the central control devices. When the power physical layer is in a normal status, the communication delay will show less effect. However, in an emergency status, such as load disturbance, there is a strong real-time requirement for the LFC service to execute correctly. Otherwise, DDoS attacks can cause severe power system stability problems.
This paper discusses the whole DDoS attack and defense process, including attack penetration, flood intrusion, compensation recovery, and traffic filtering strategies, which is realized by co-simulation methods. Overall, the cross-space transmission mechanism of risk and coordinated defense strategies are analyzed. Therefore, the complete attack–defense cycle of CPPS is described, which discusses the impact of attack resources and system scale and provides guidance for risk assessment and security defense.
There are still some limitations in the current work. For attackers, the infecting behavior is simplified with a success probability, and the choice of attack targets is random, without considering the importance of each region. For defenders, the real-time performance of ACL detection is still weak, and the compensated control in the power layer may be negative in little delay situations. The improvement of these limitations is the focus of the future work. In the future, on one hand, the filtering rule of detection strategies can be strengthened by history data; on the other hand, the optimal attack and defense area can be decided by game theory. Therefore, defense resources will be deployed and utilized in a highly economical way.


