Tip-Bed Velocity and Scour Depth of Horizontal-Axis Tidal Turbine with Consideration of Tip Clearance

 ,
, 

Abstract
:1. Introduction
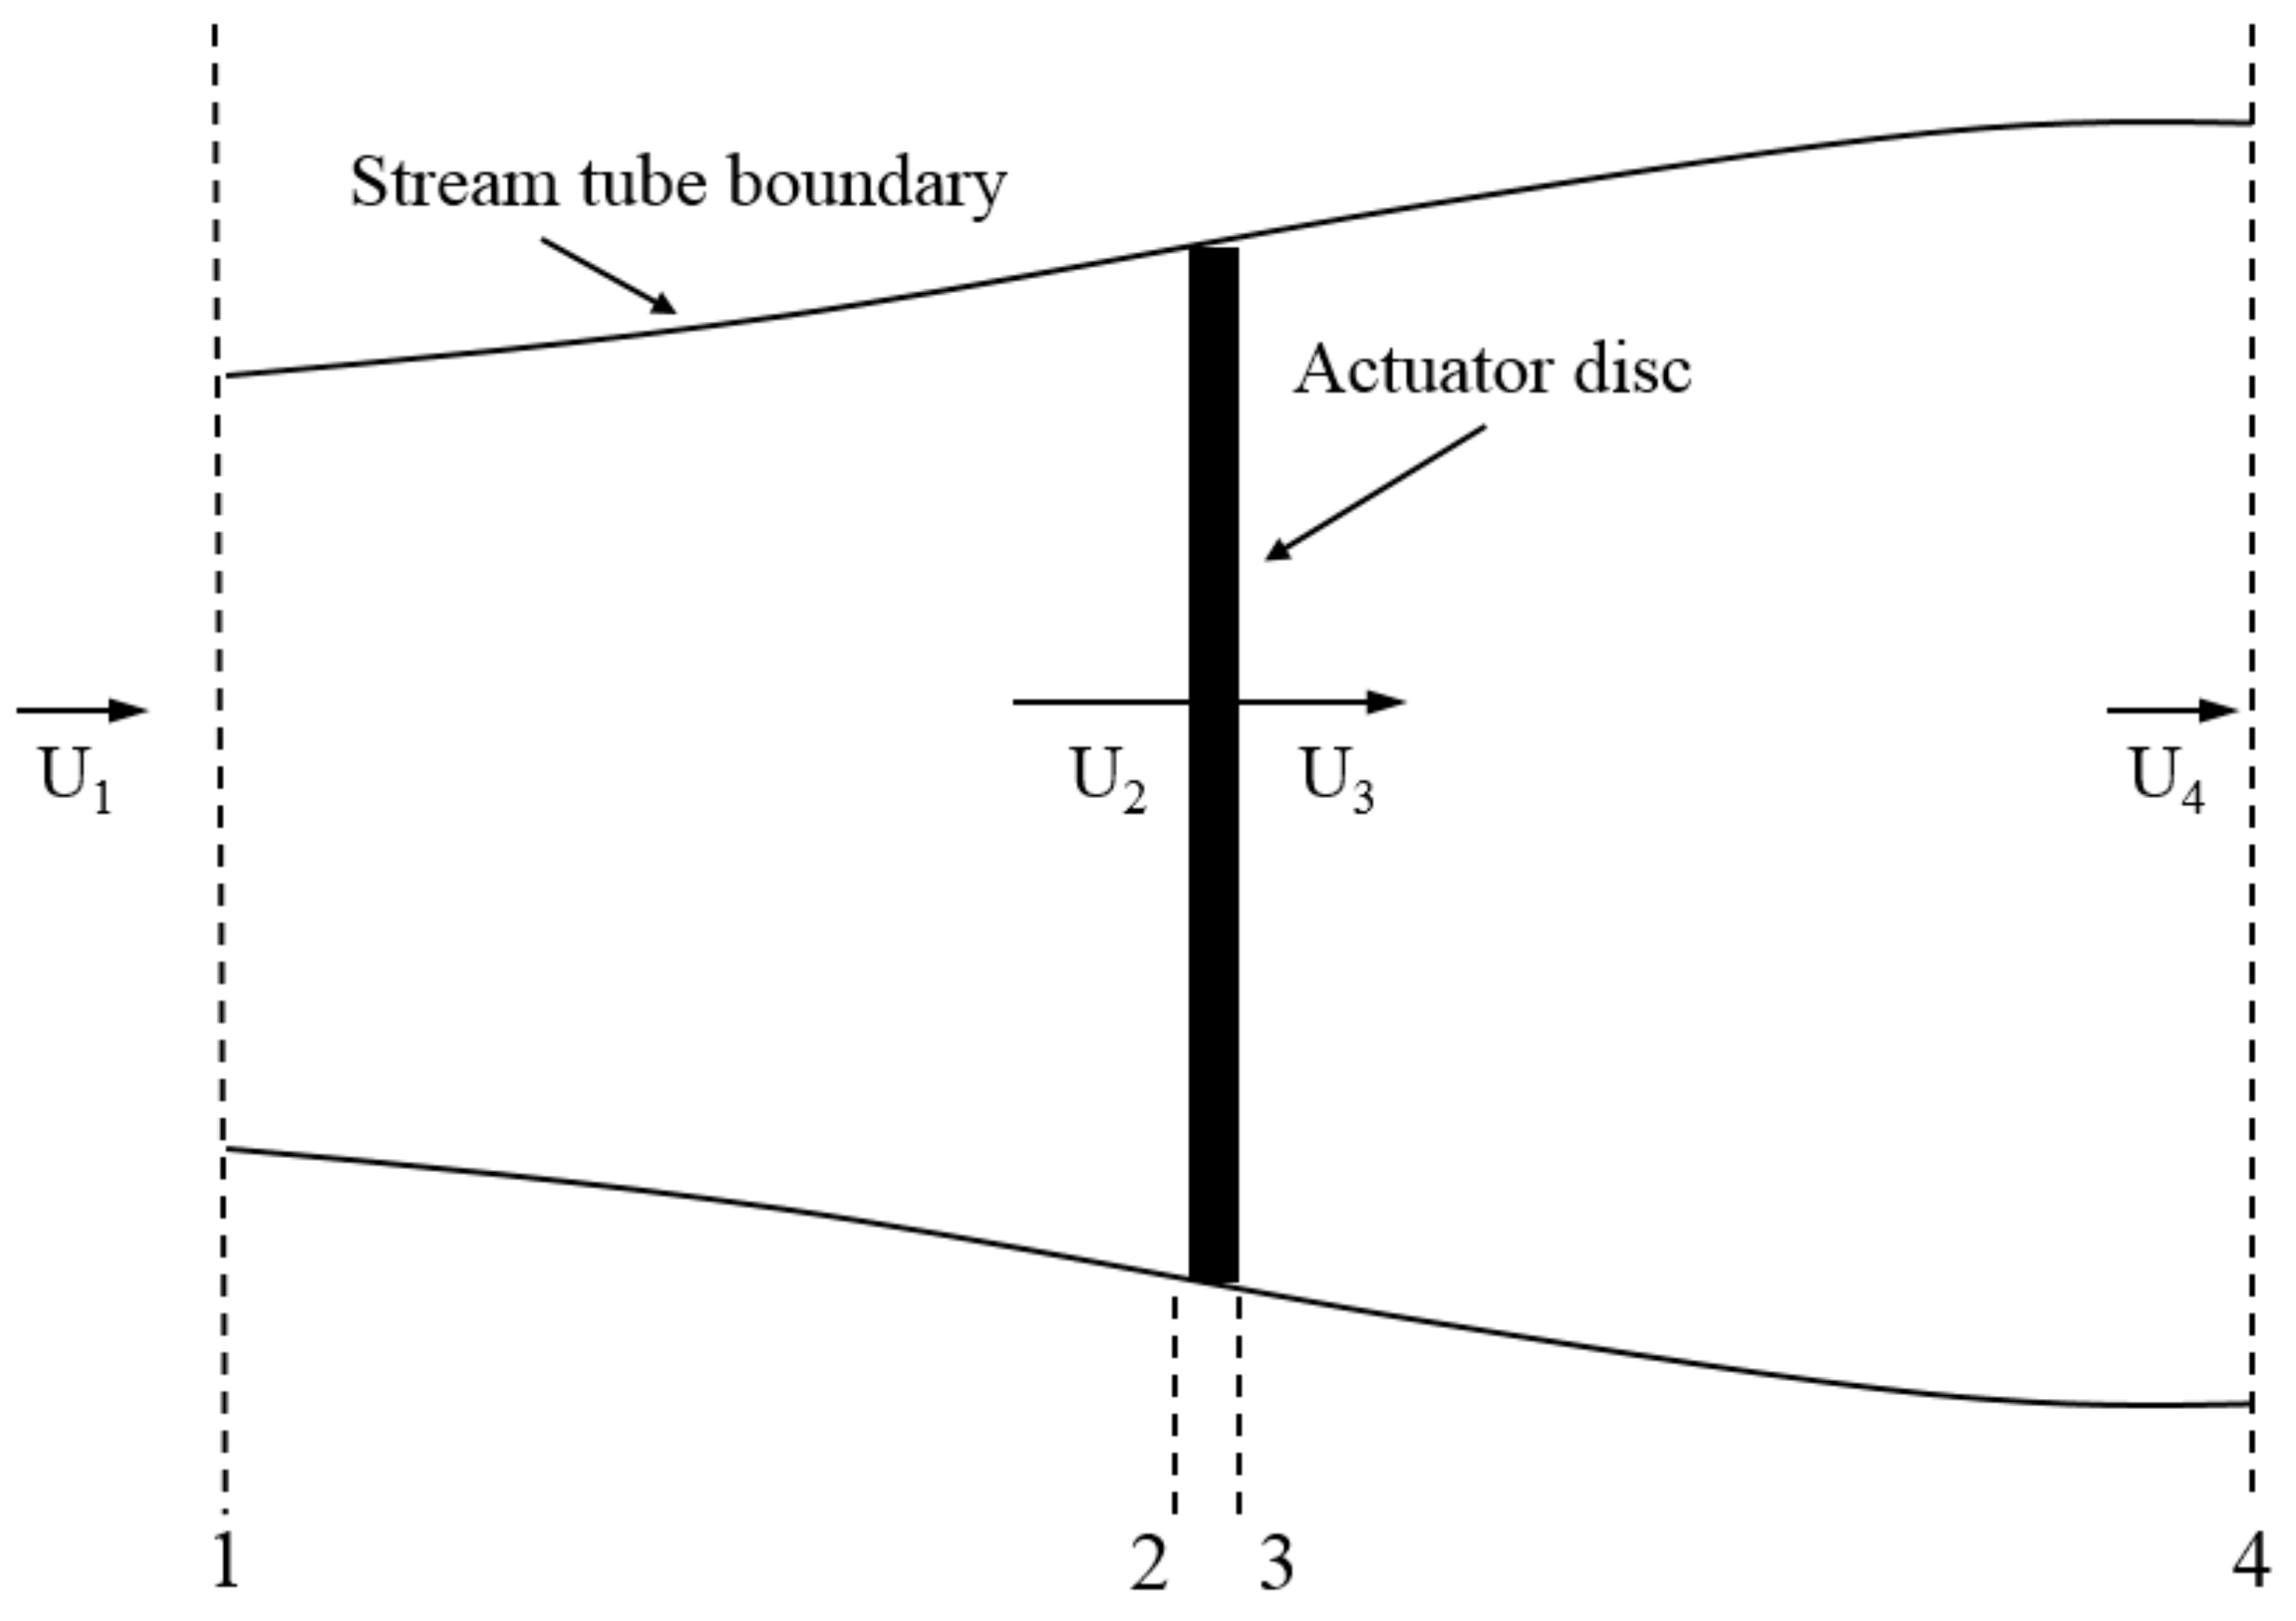
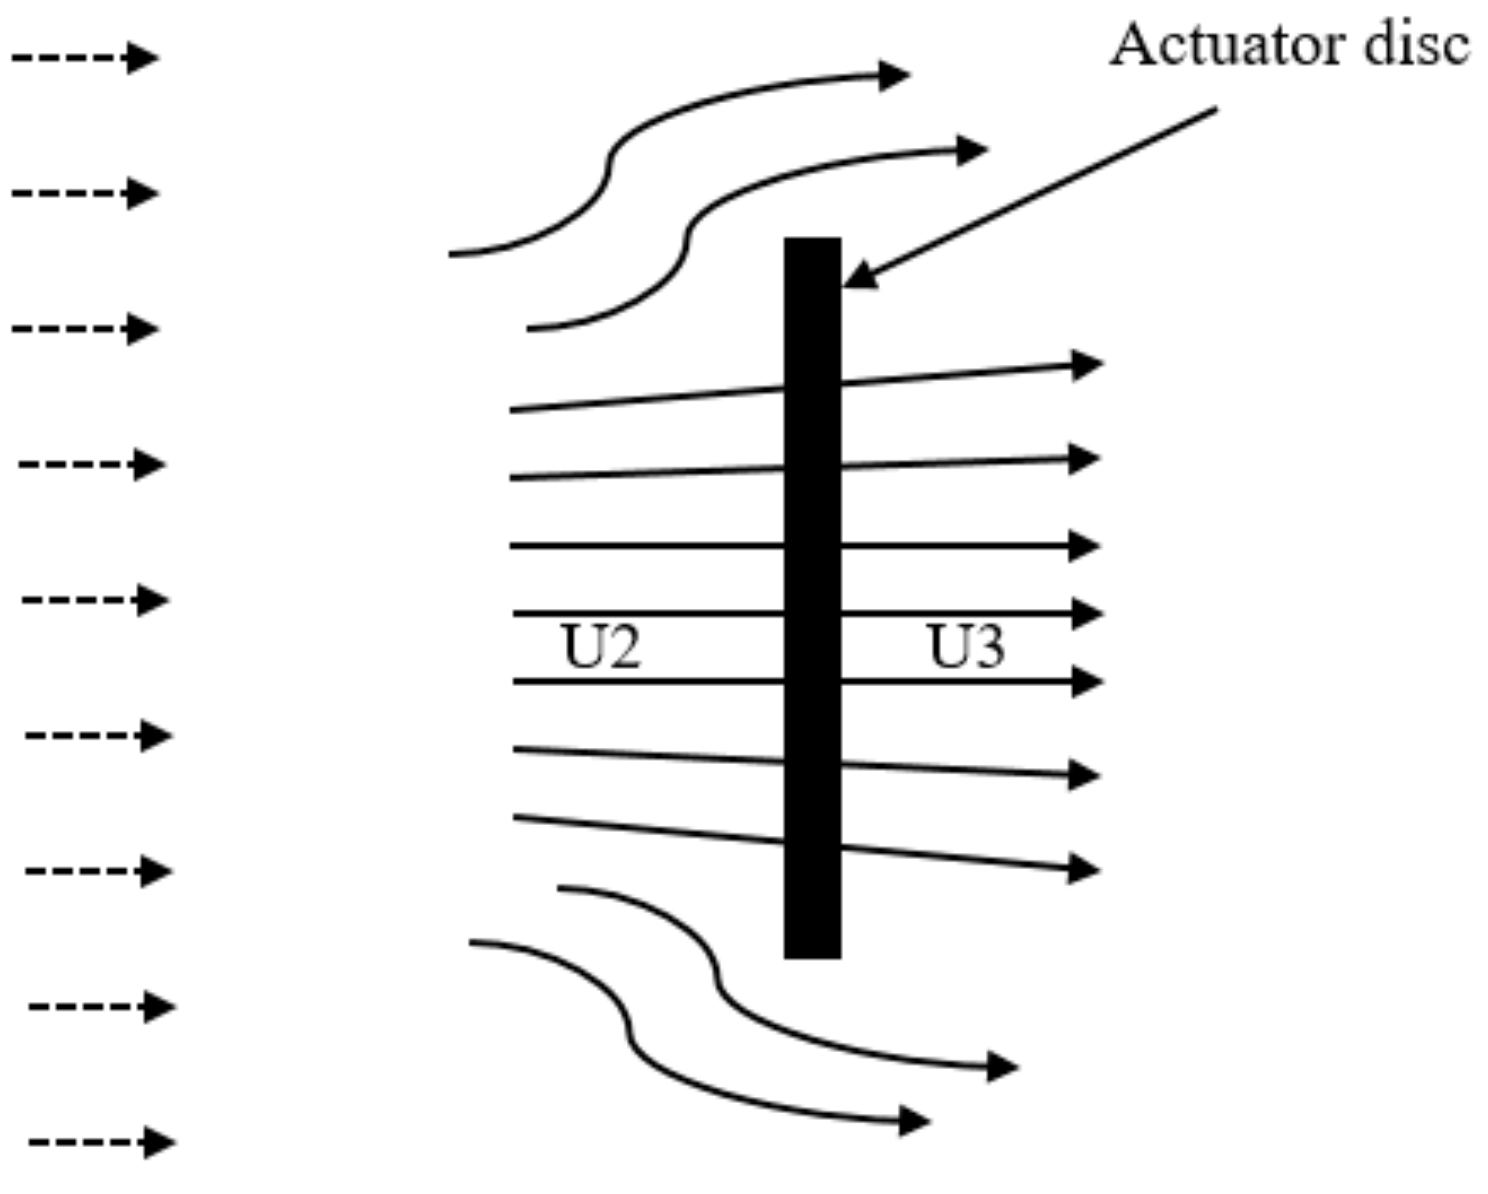
2. Tip-Bed Velocity Used for Seabed Scouring
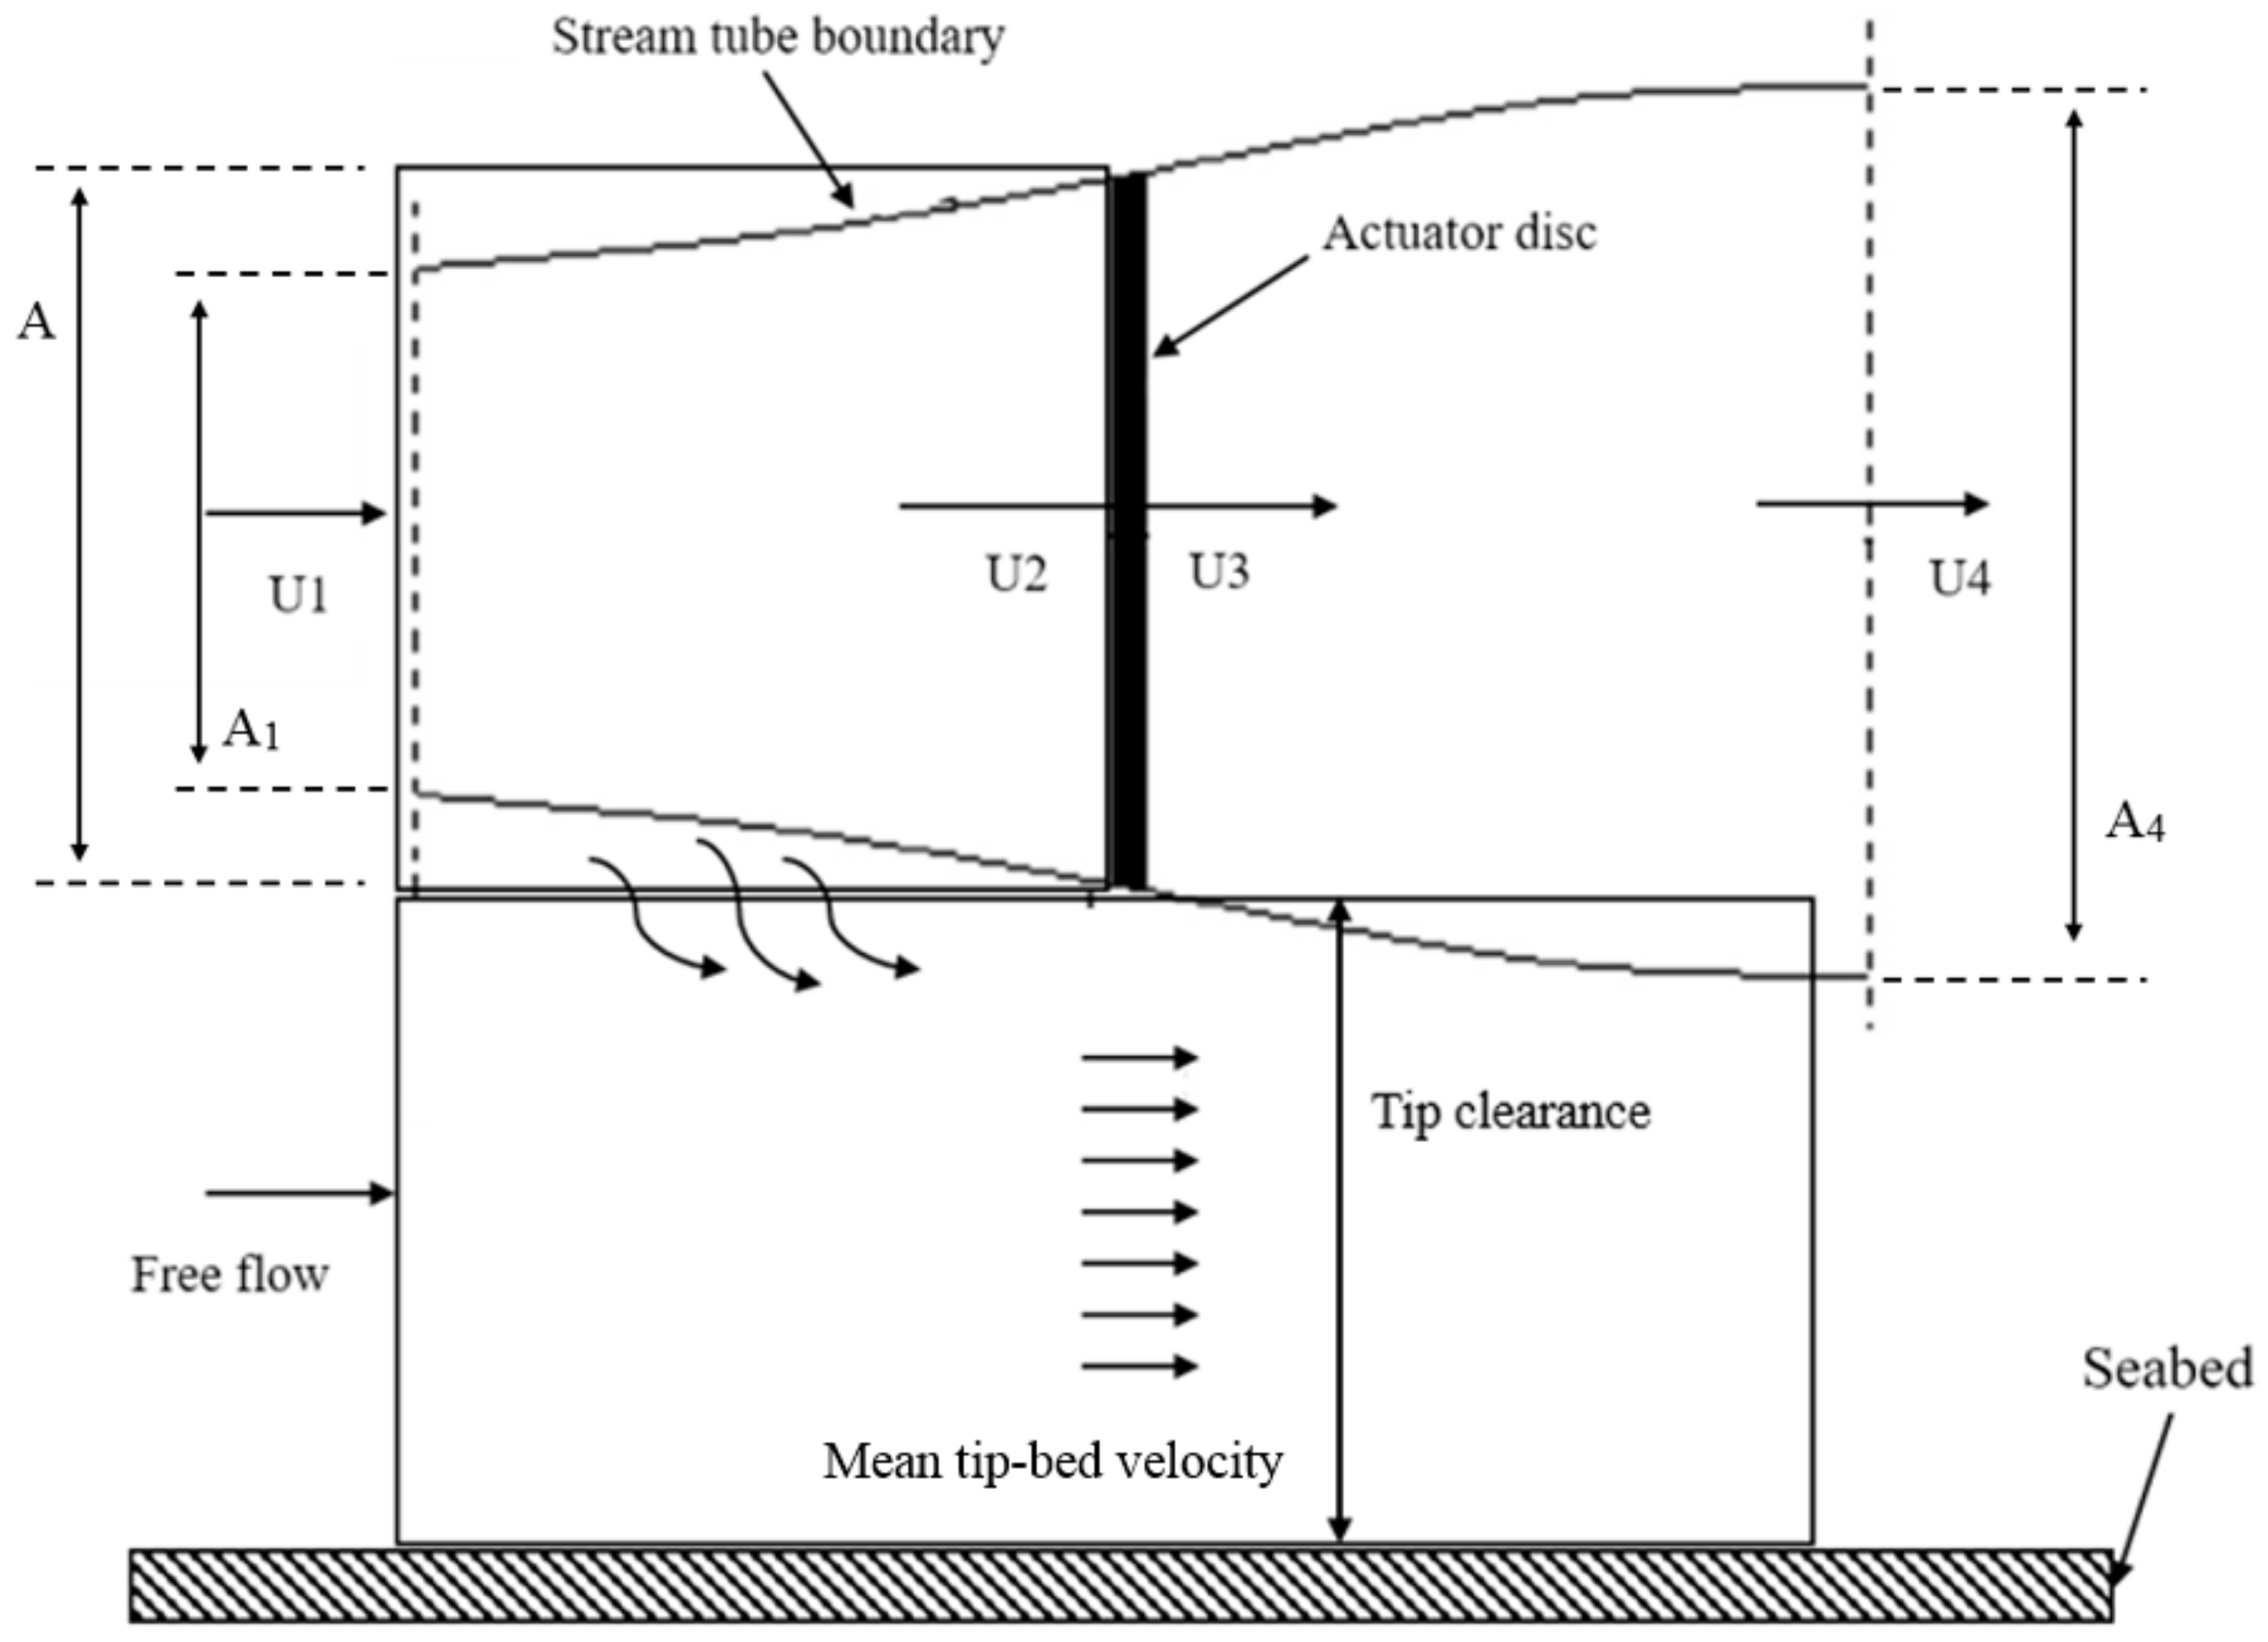
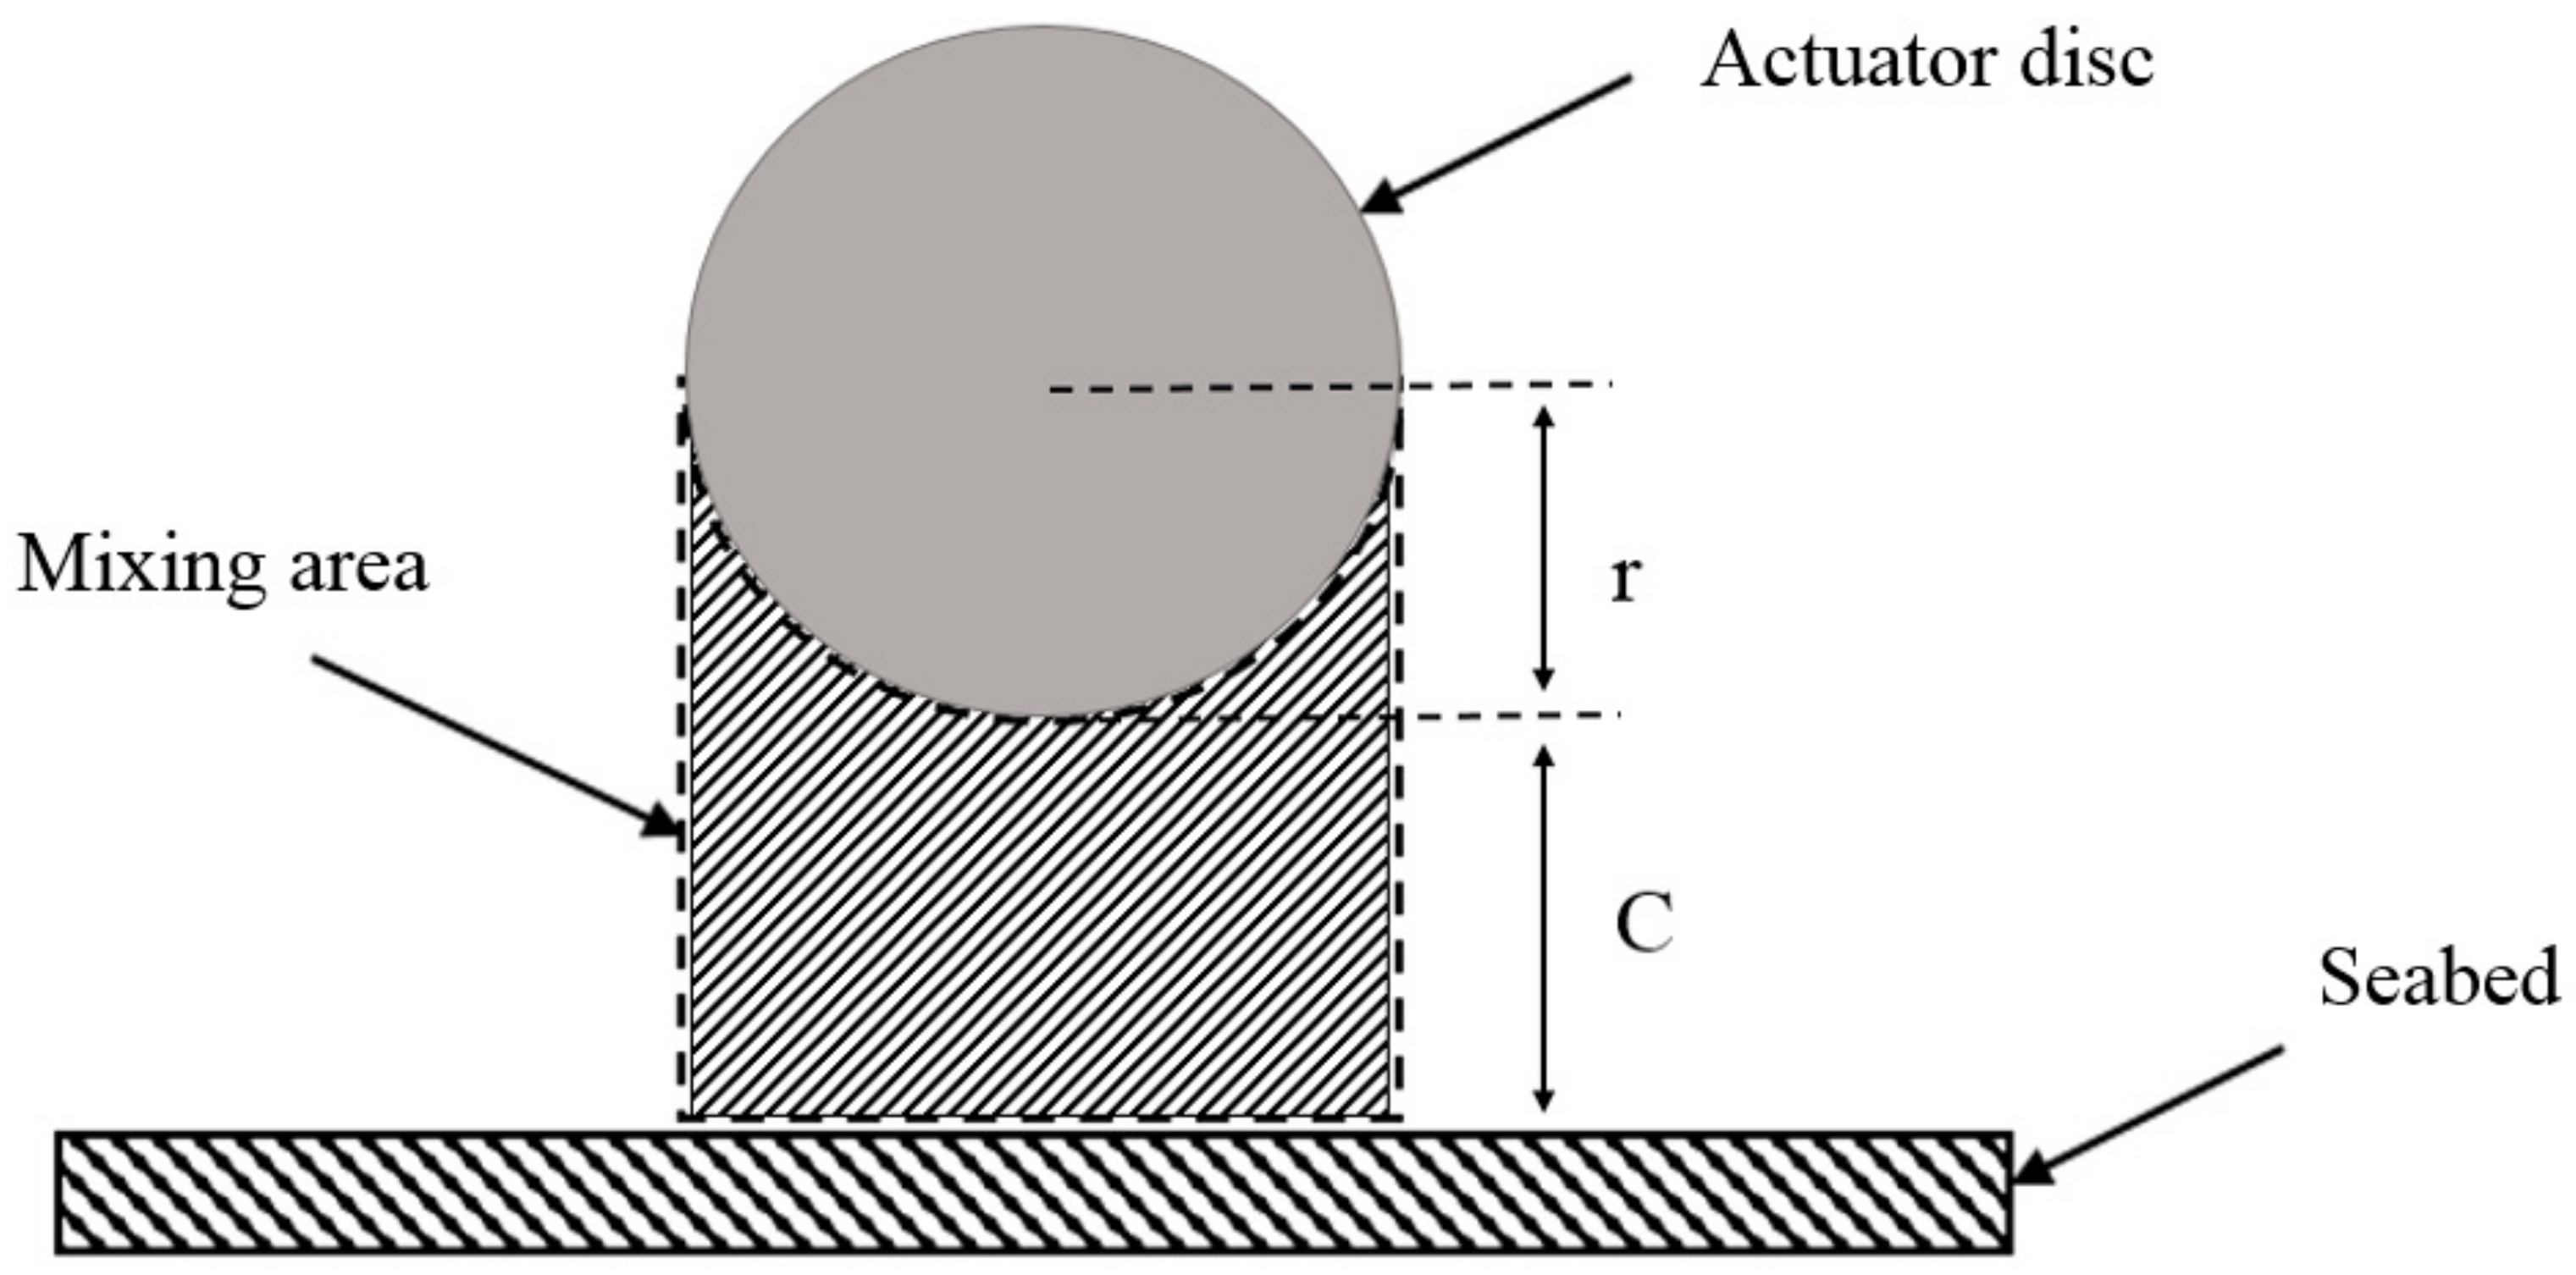
2.1. Tip-Bed Velocity Equation
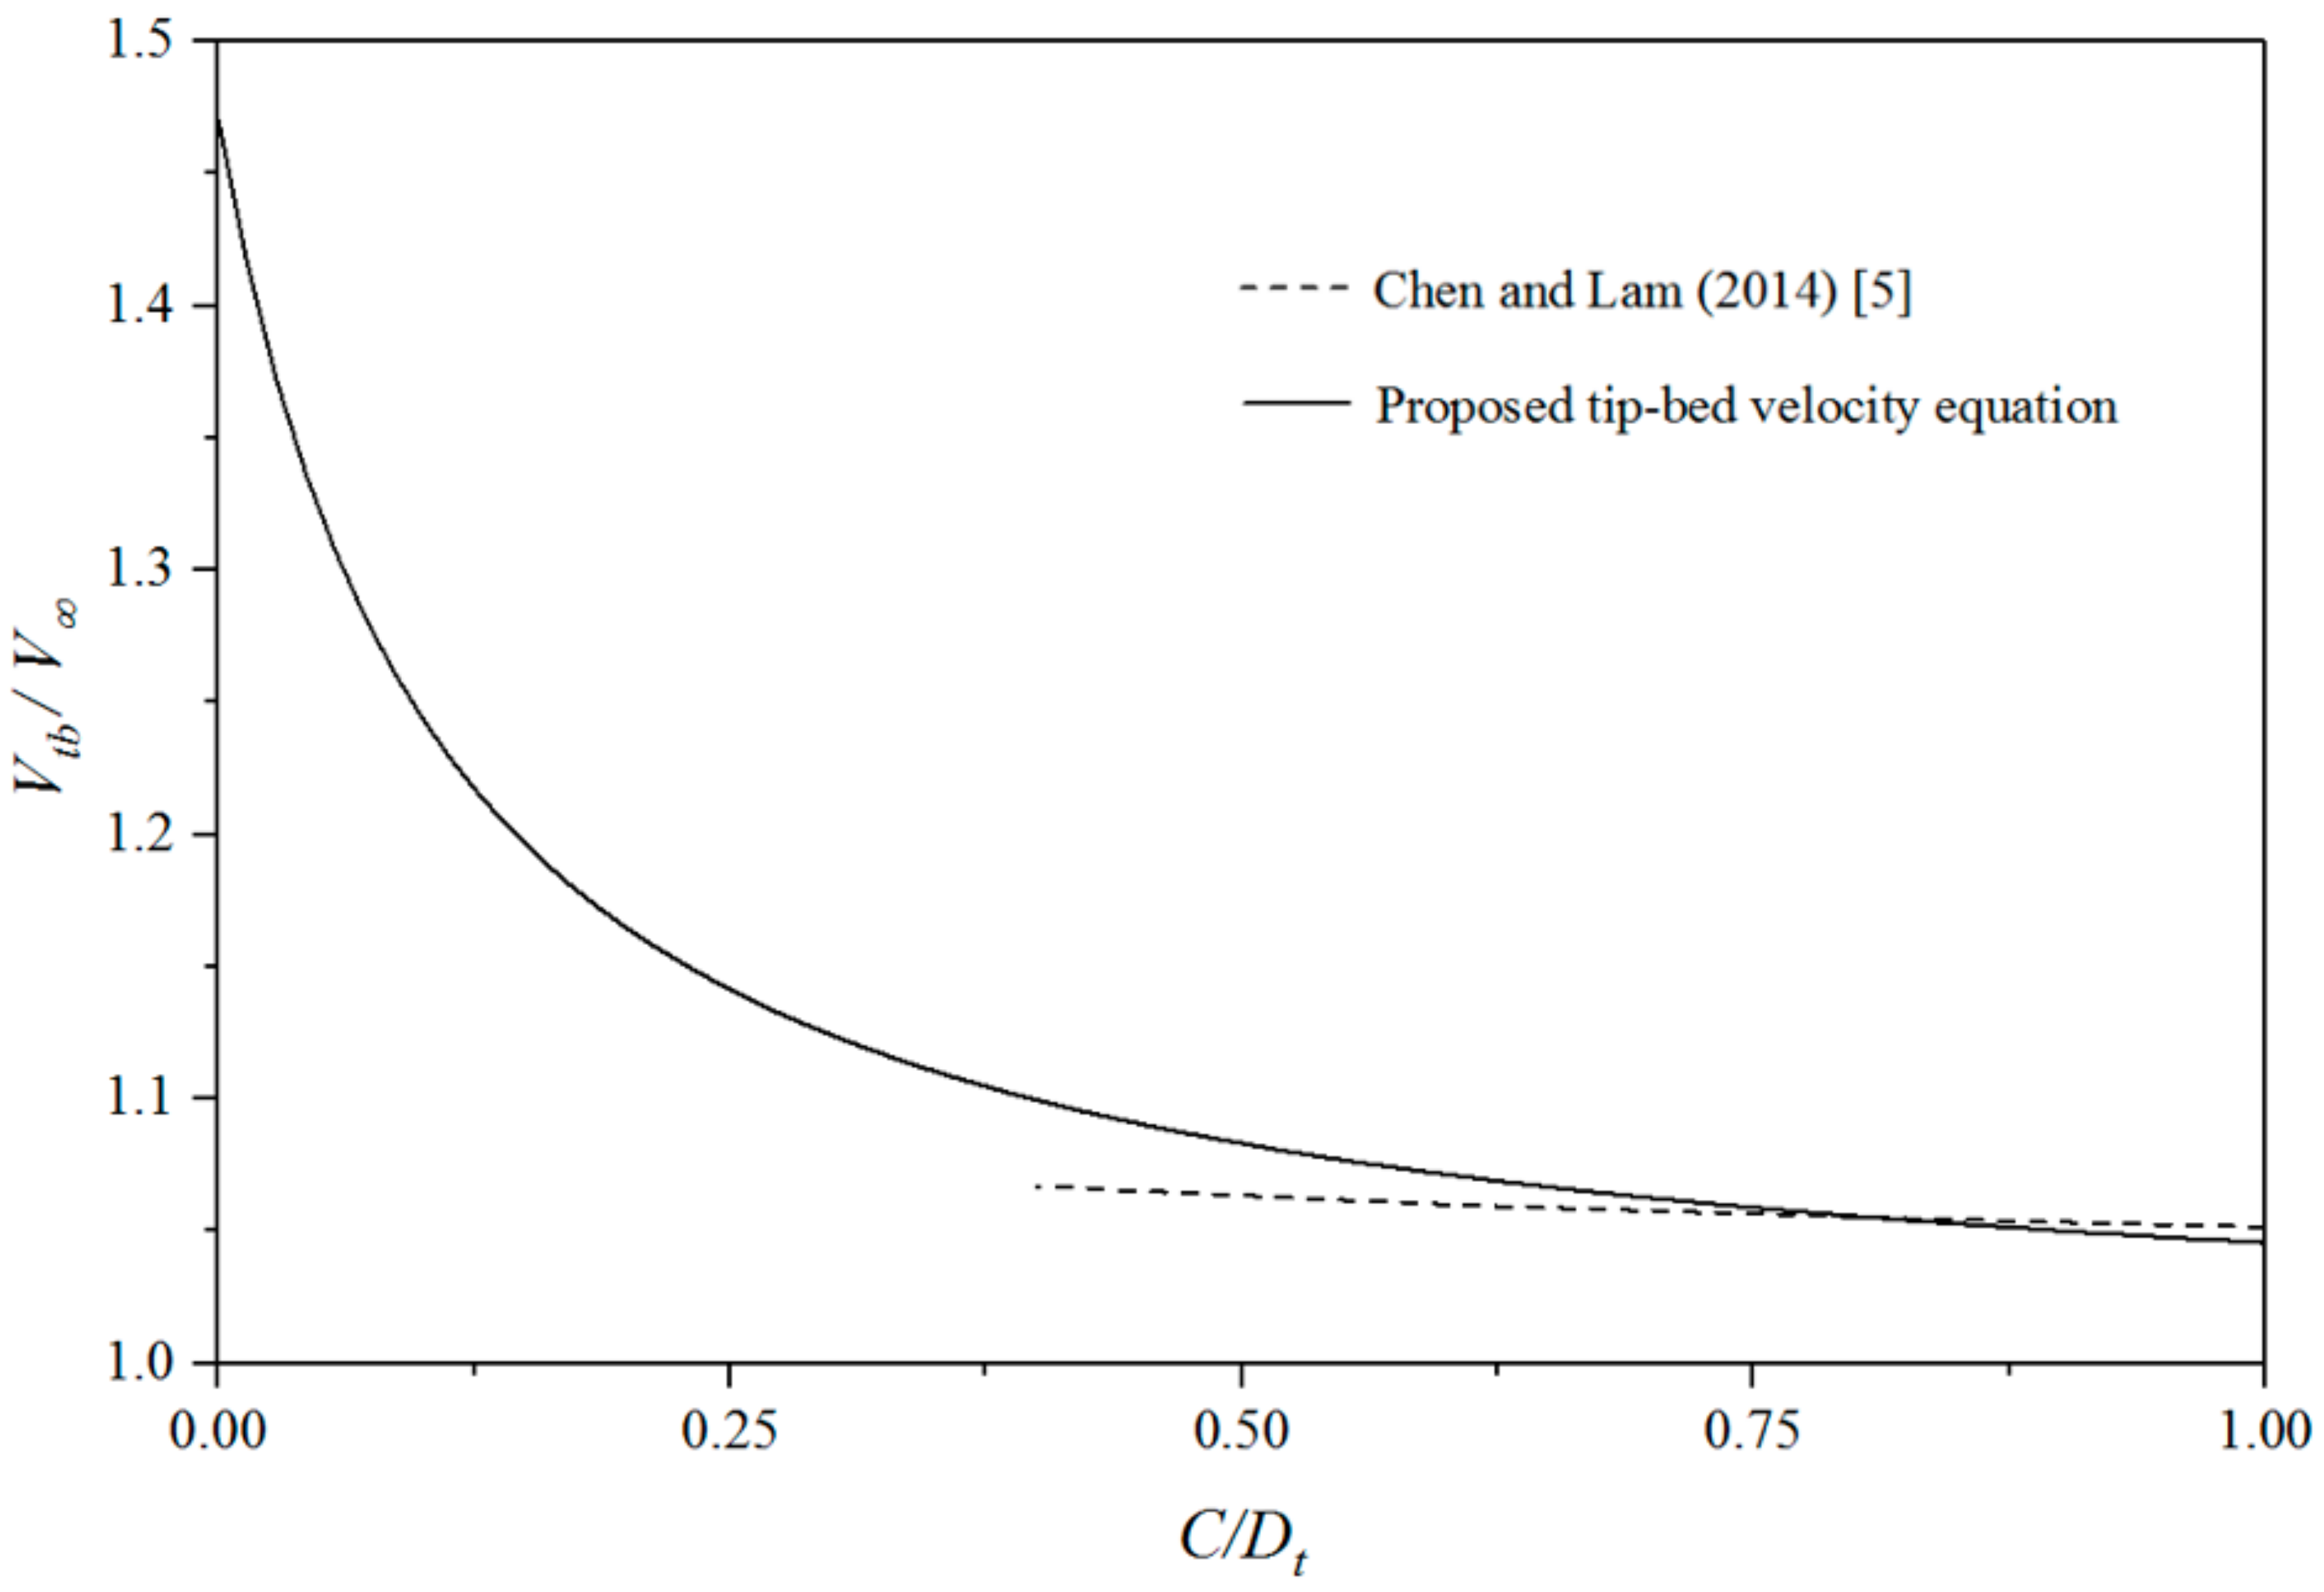
2.2. Comparison
3. Scour Experiment
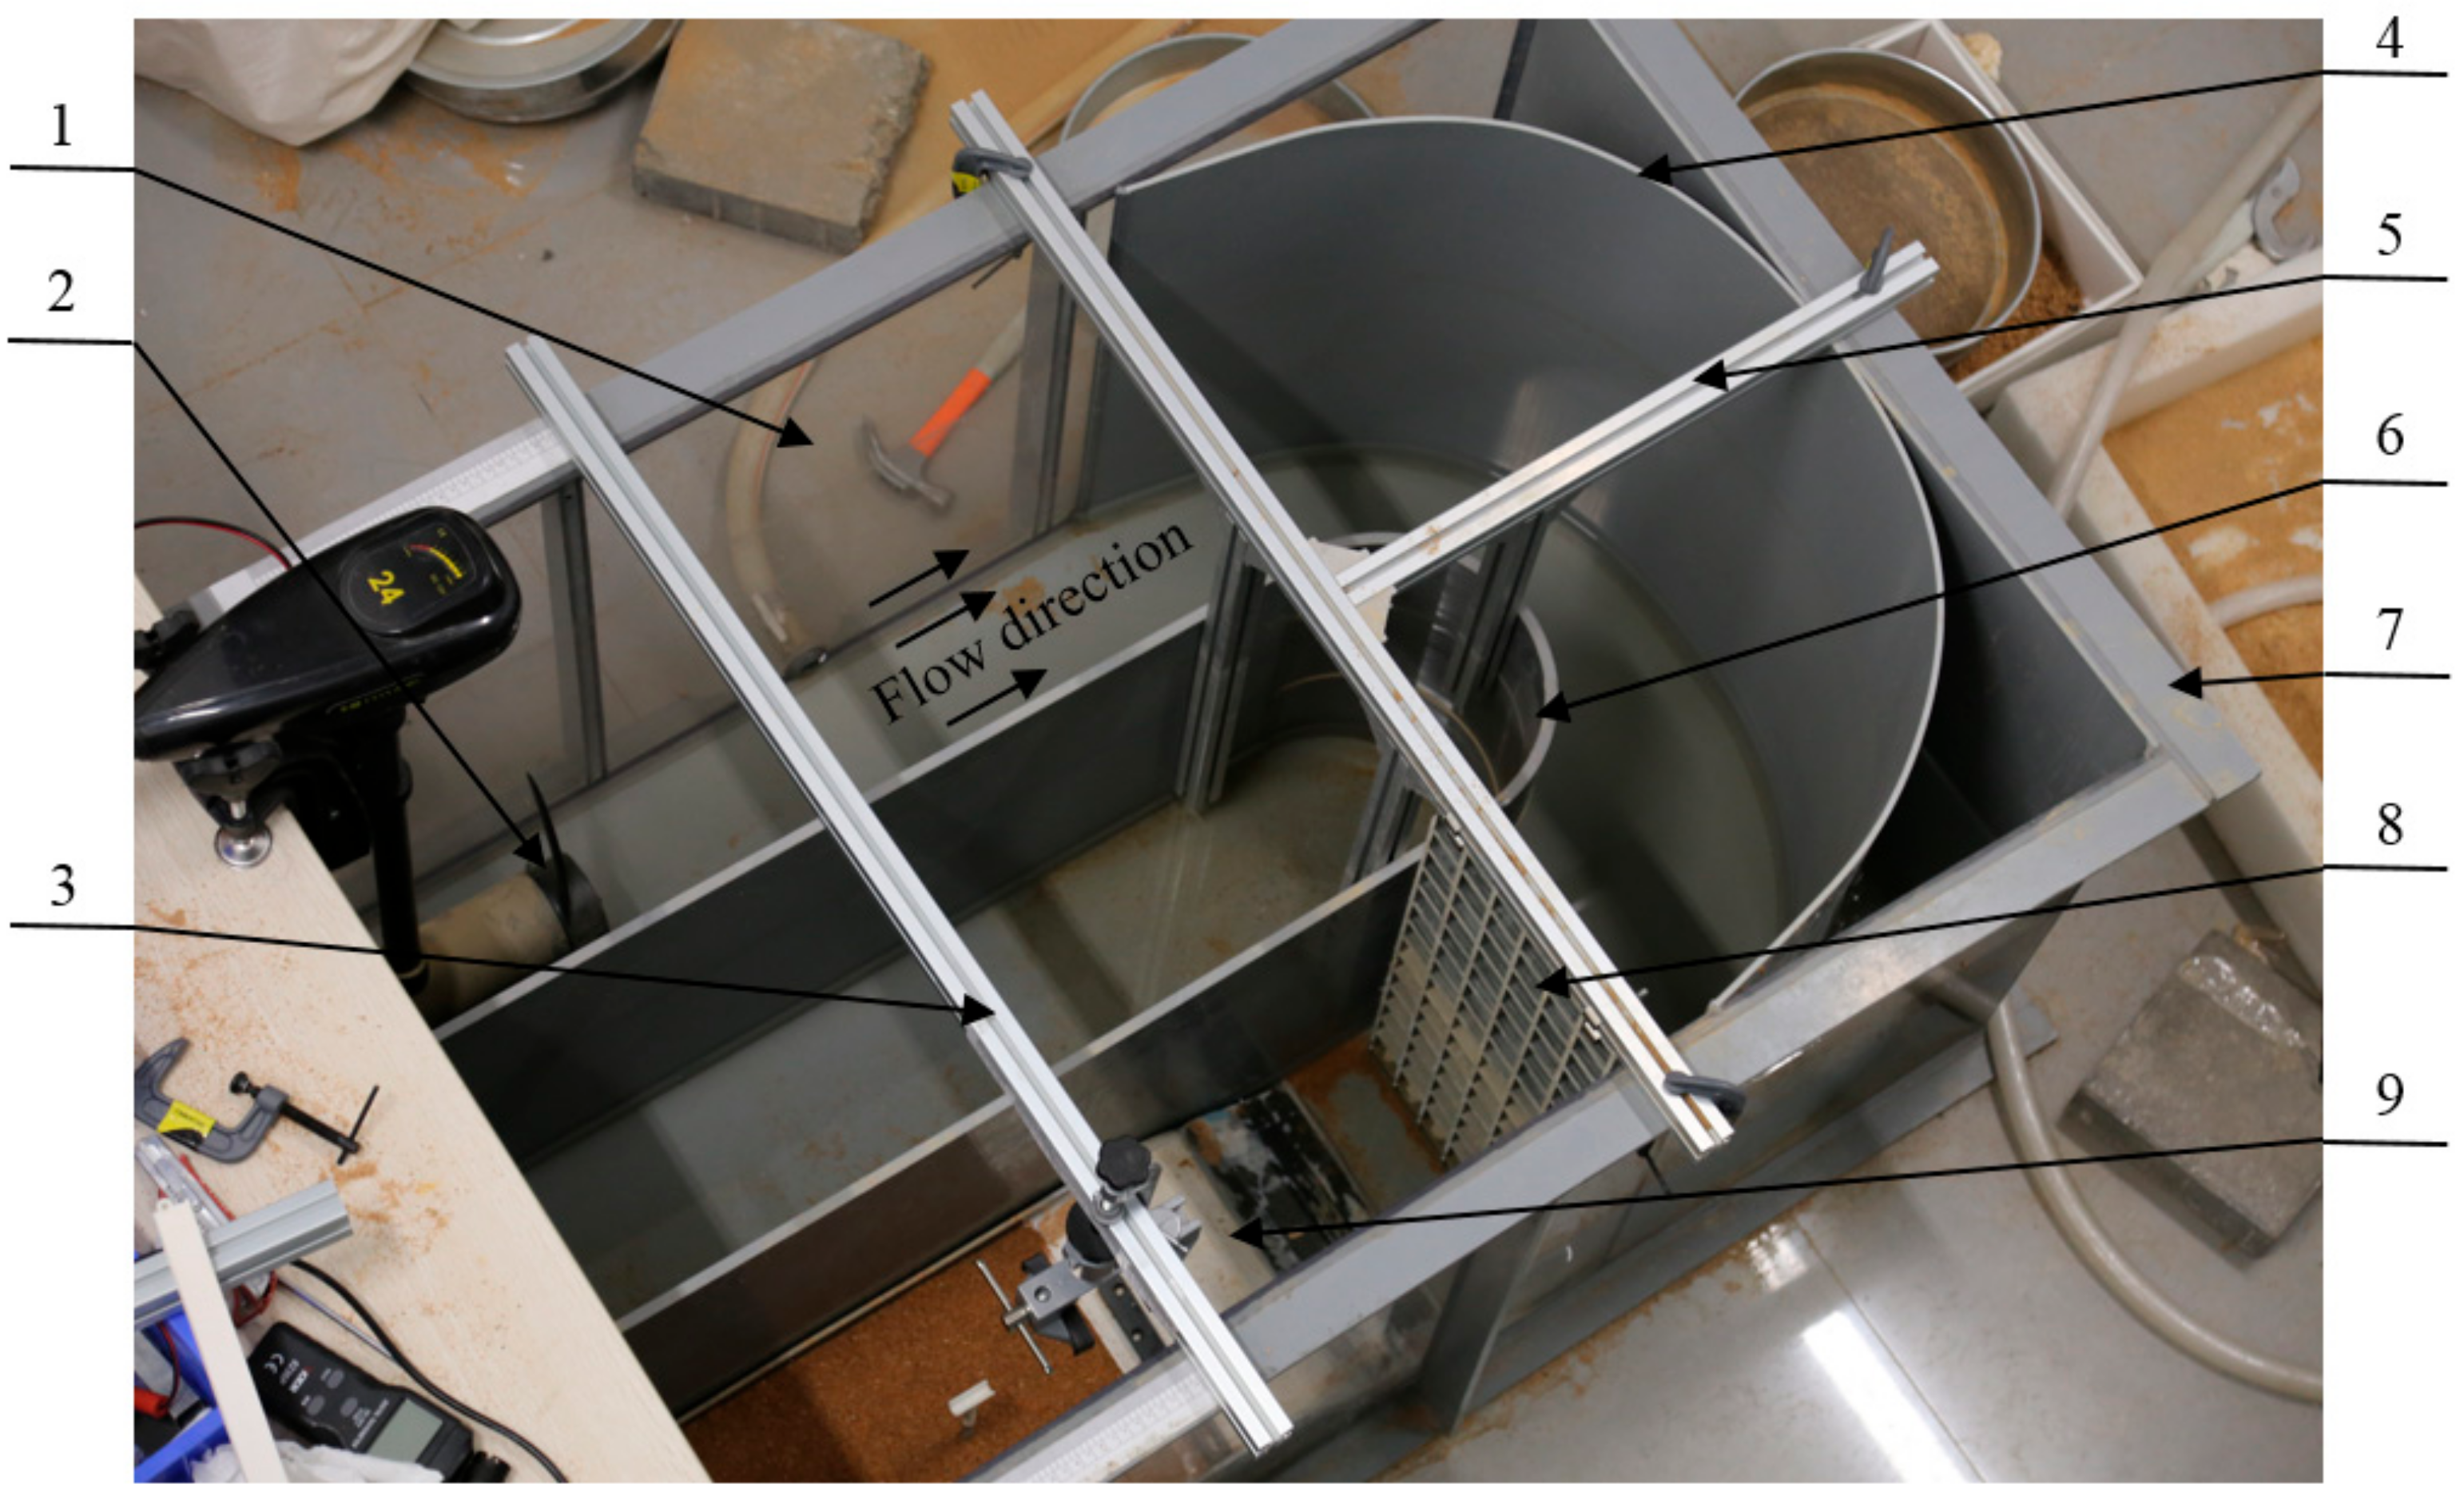
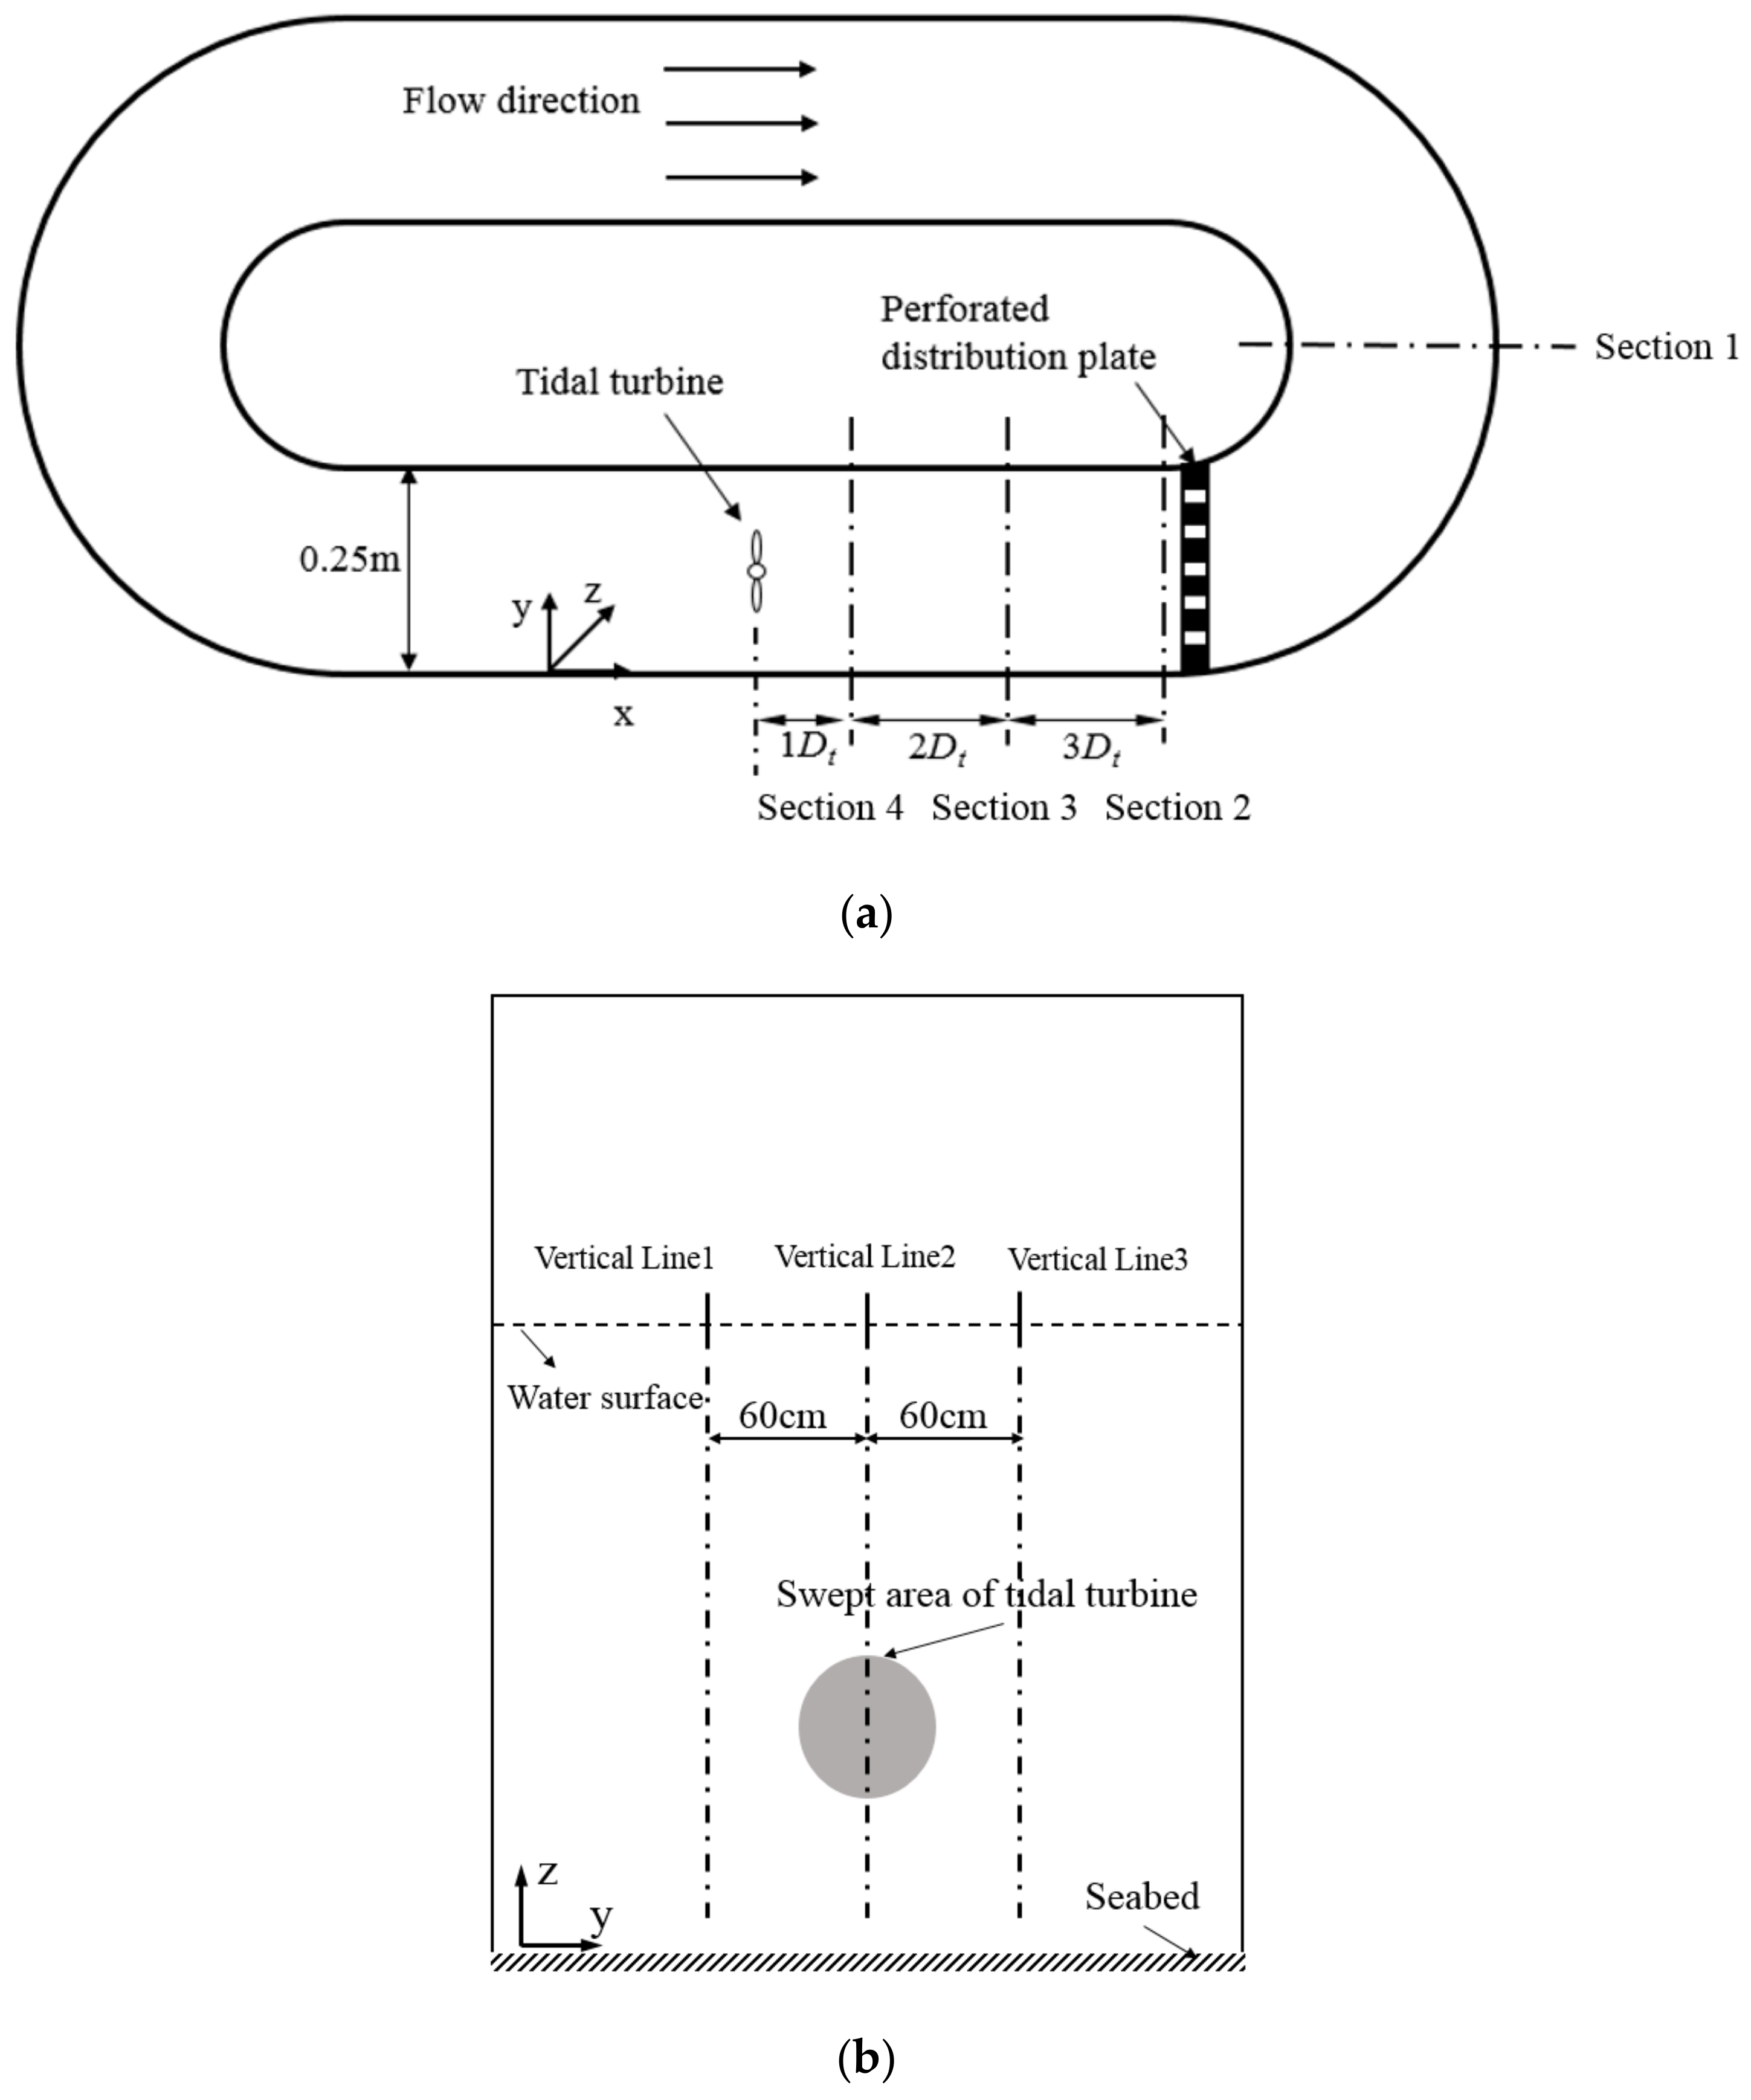
3.1. Purposed-Built Apparatus
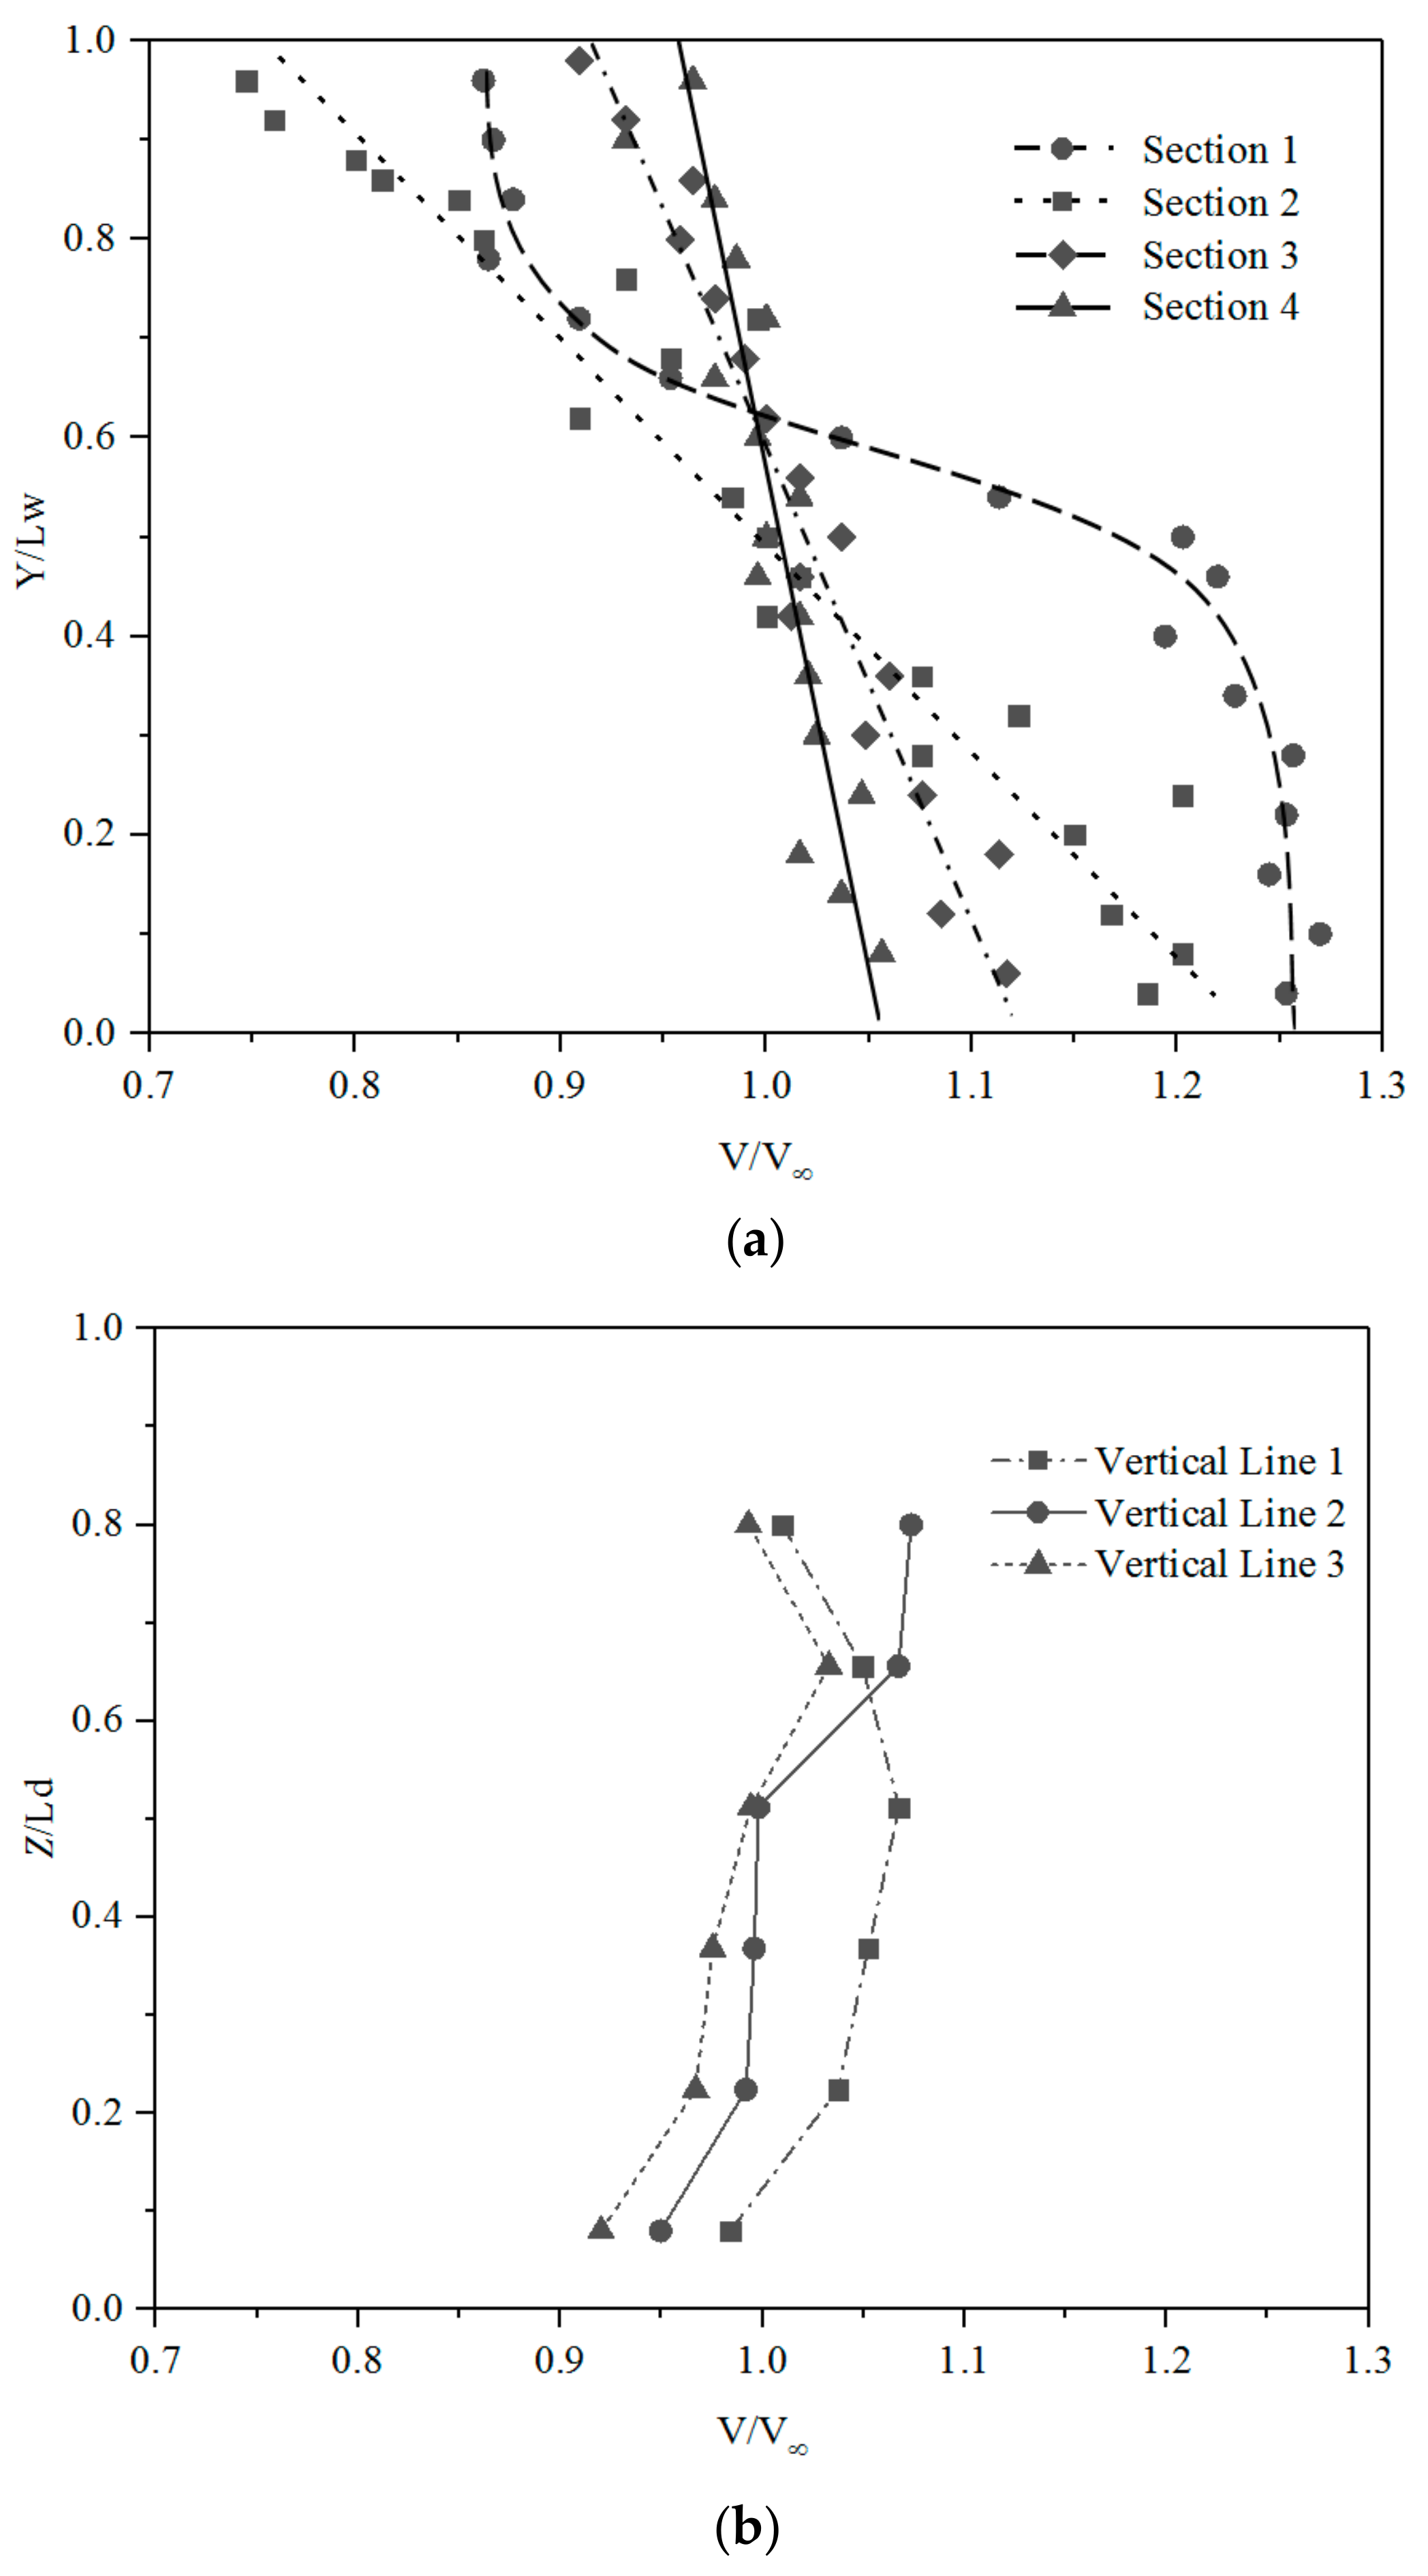
3.2. Flow Disturbance and Perturbation
4. Results and Discussion
4.1. Seabed Scour Profile
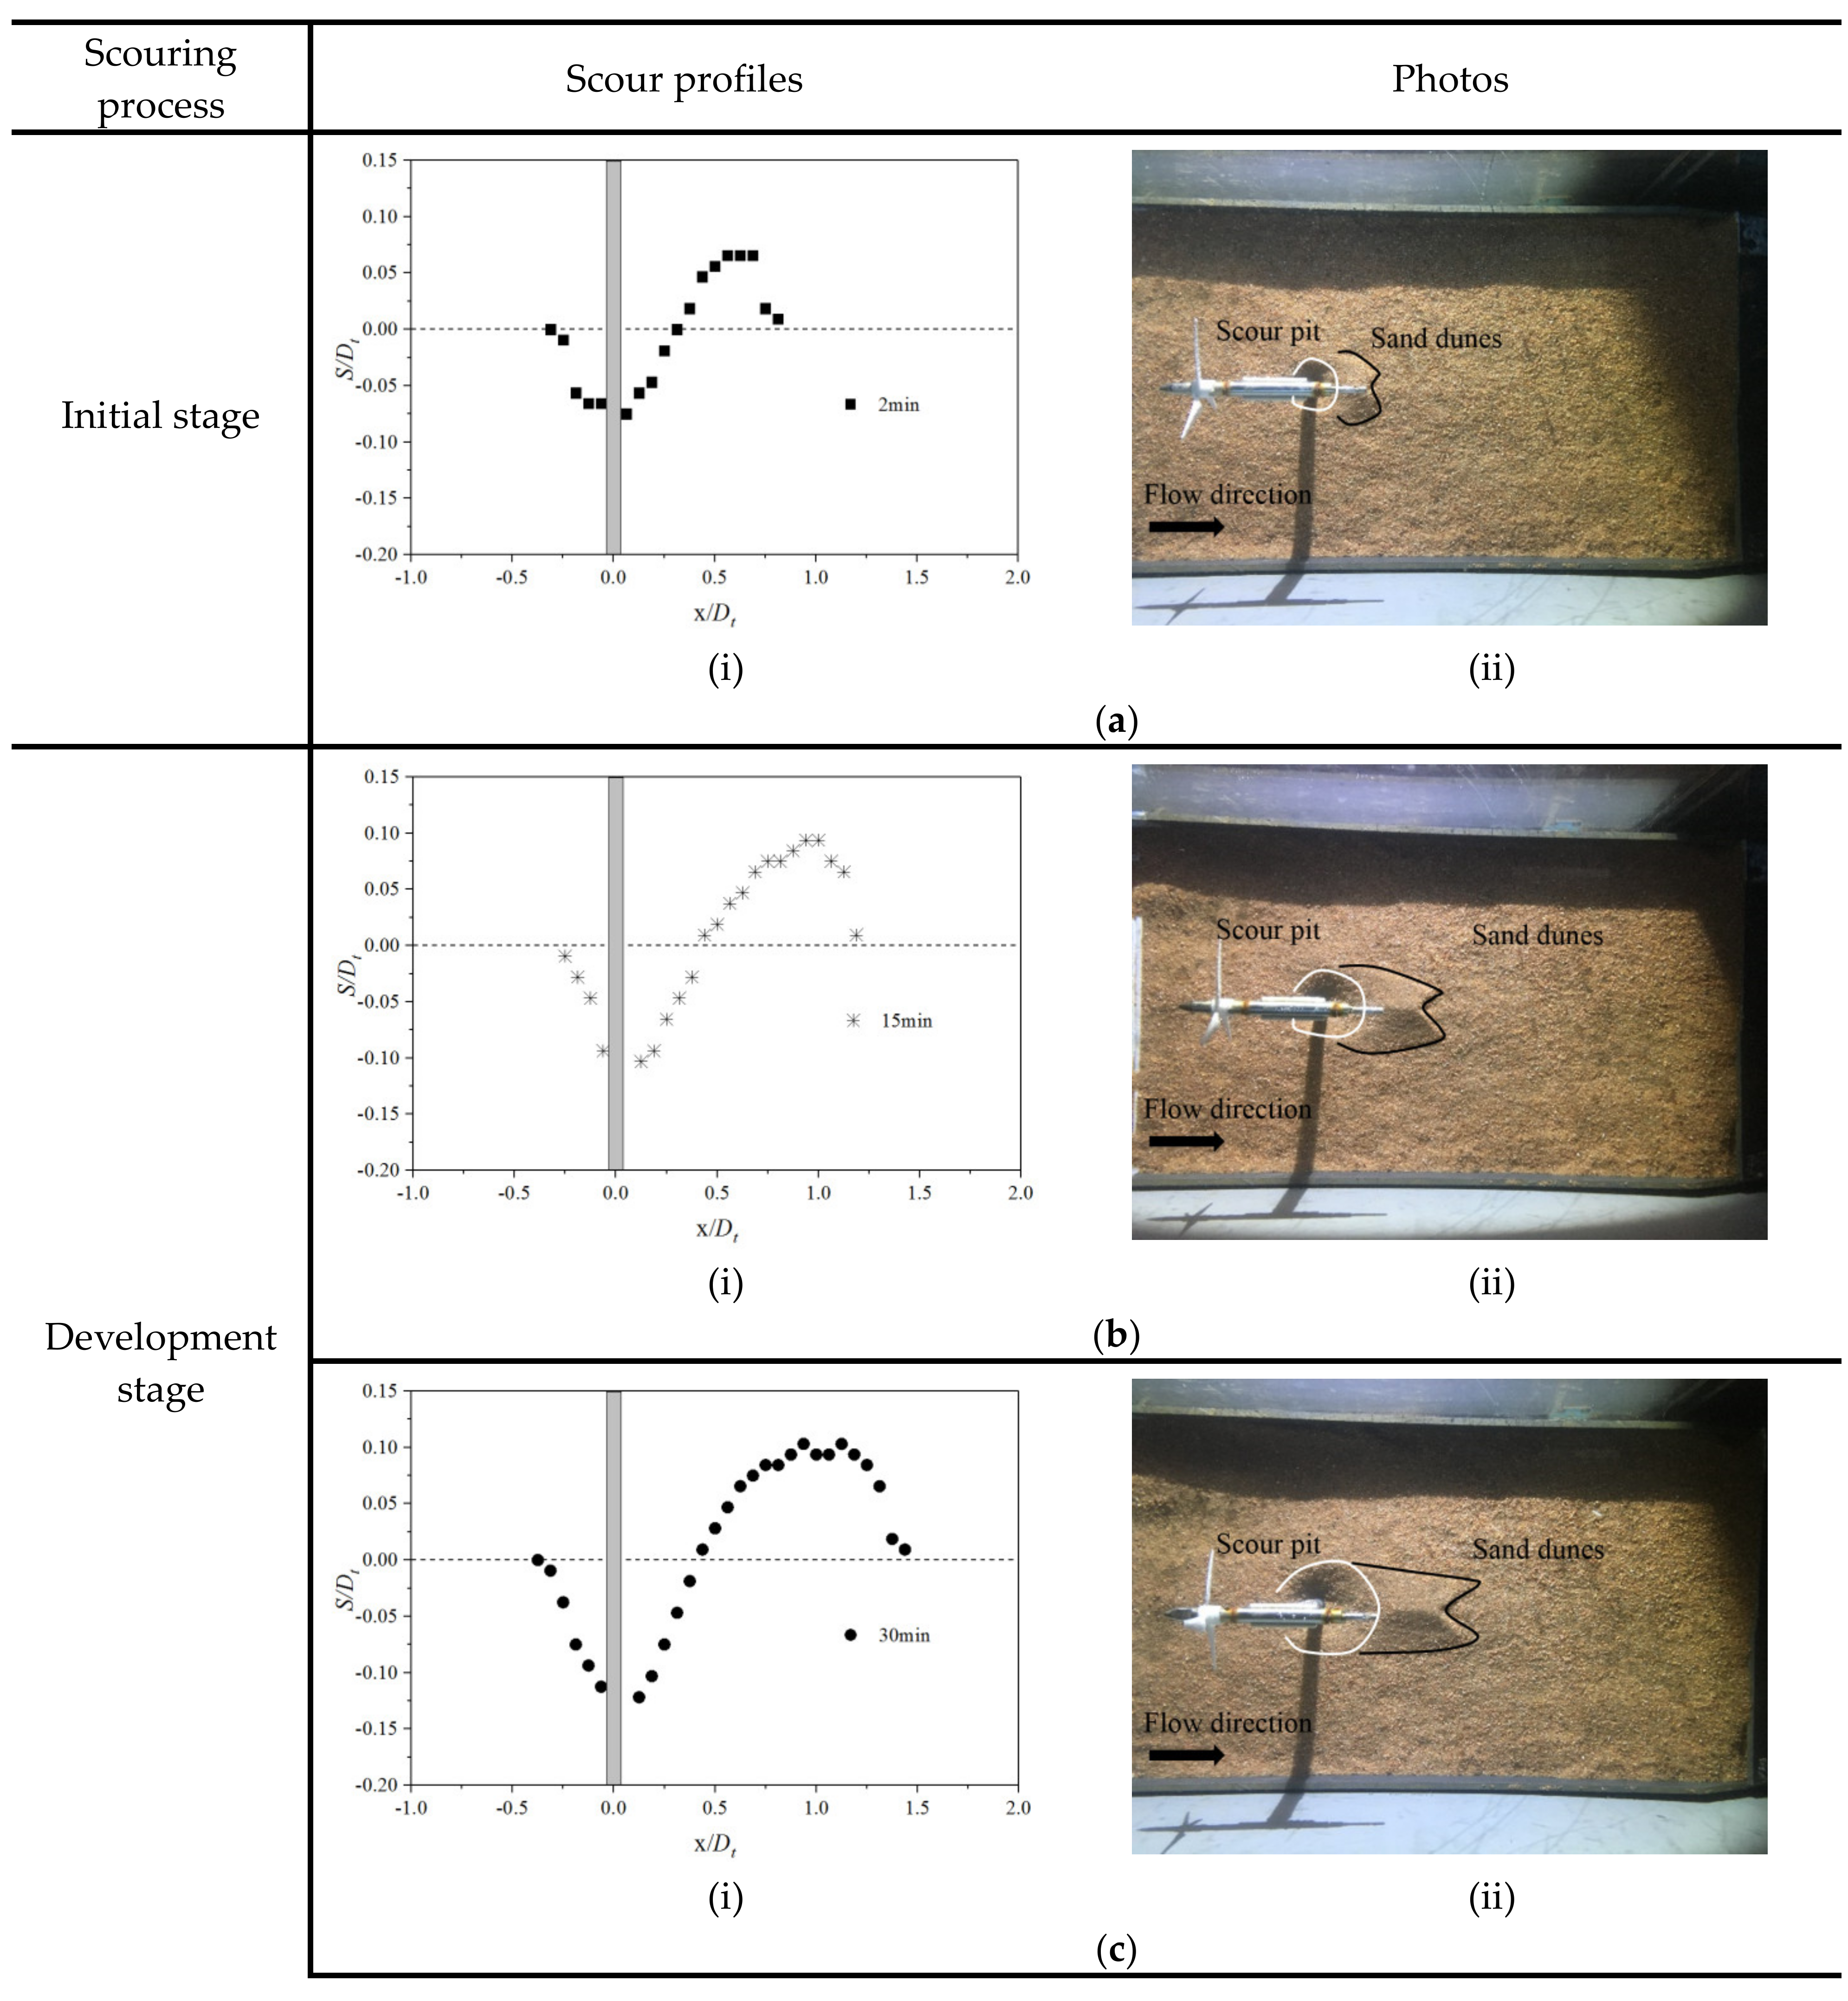
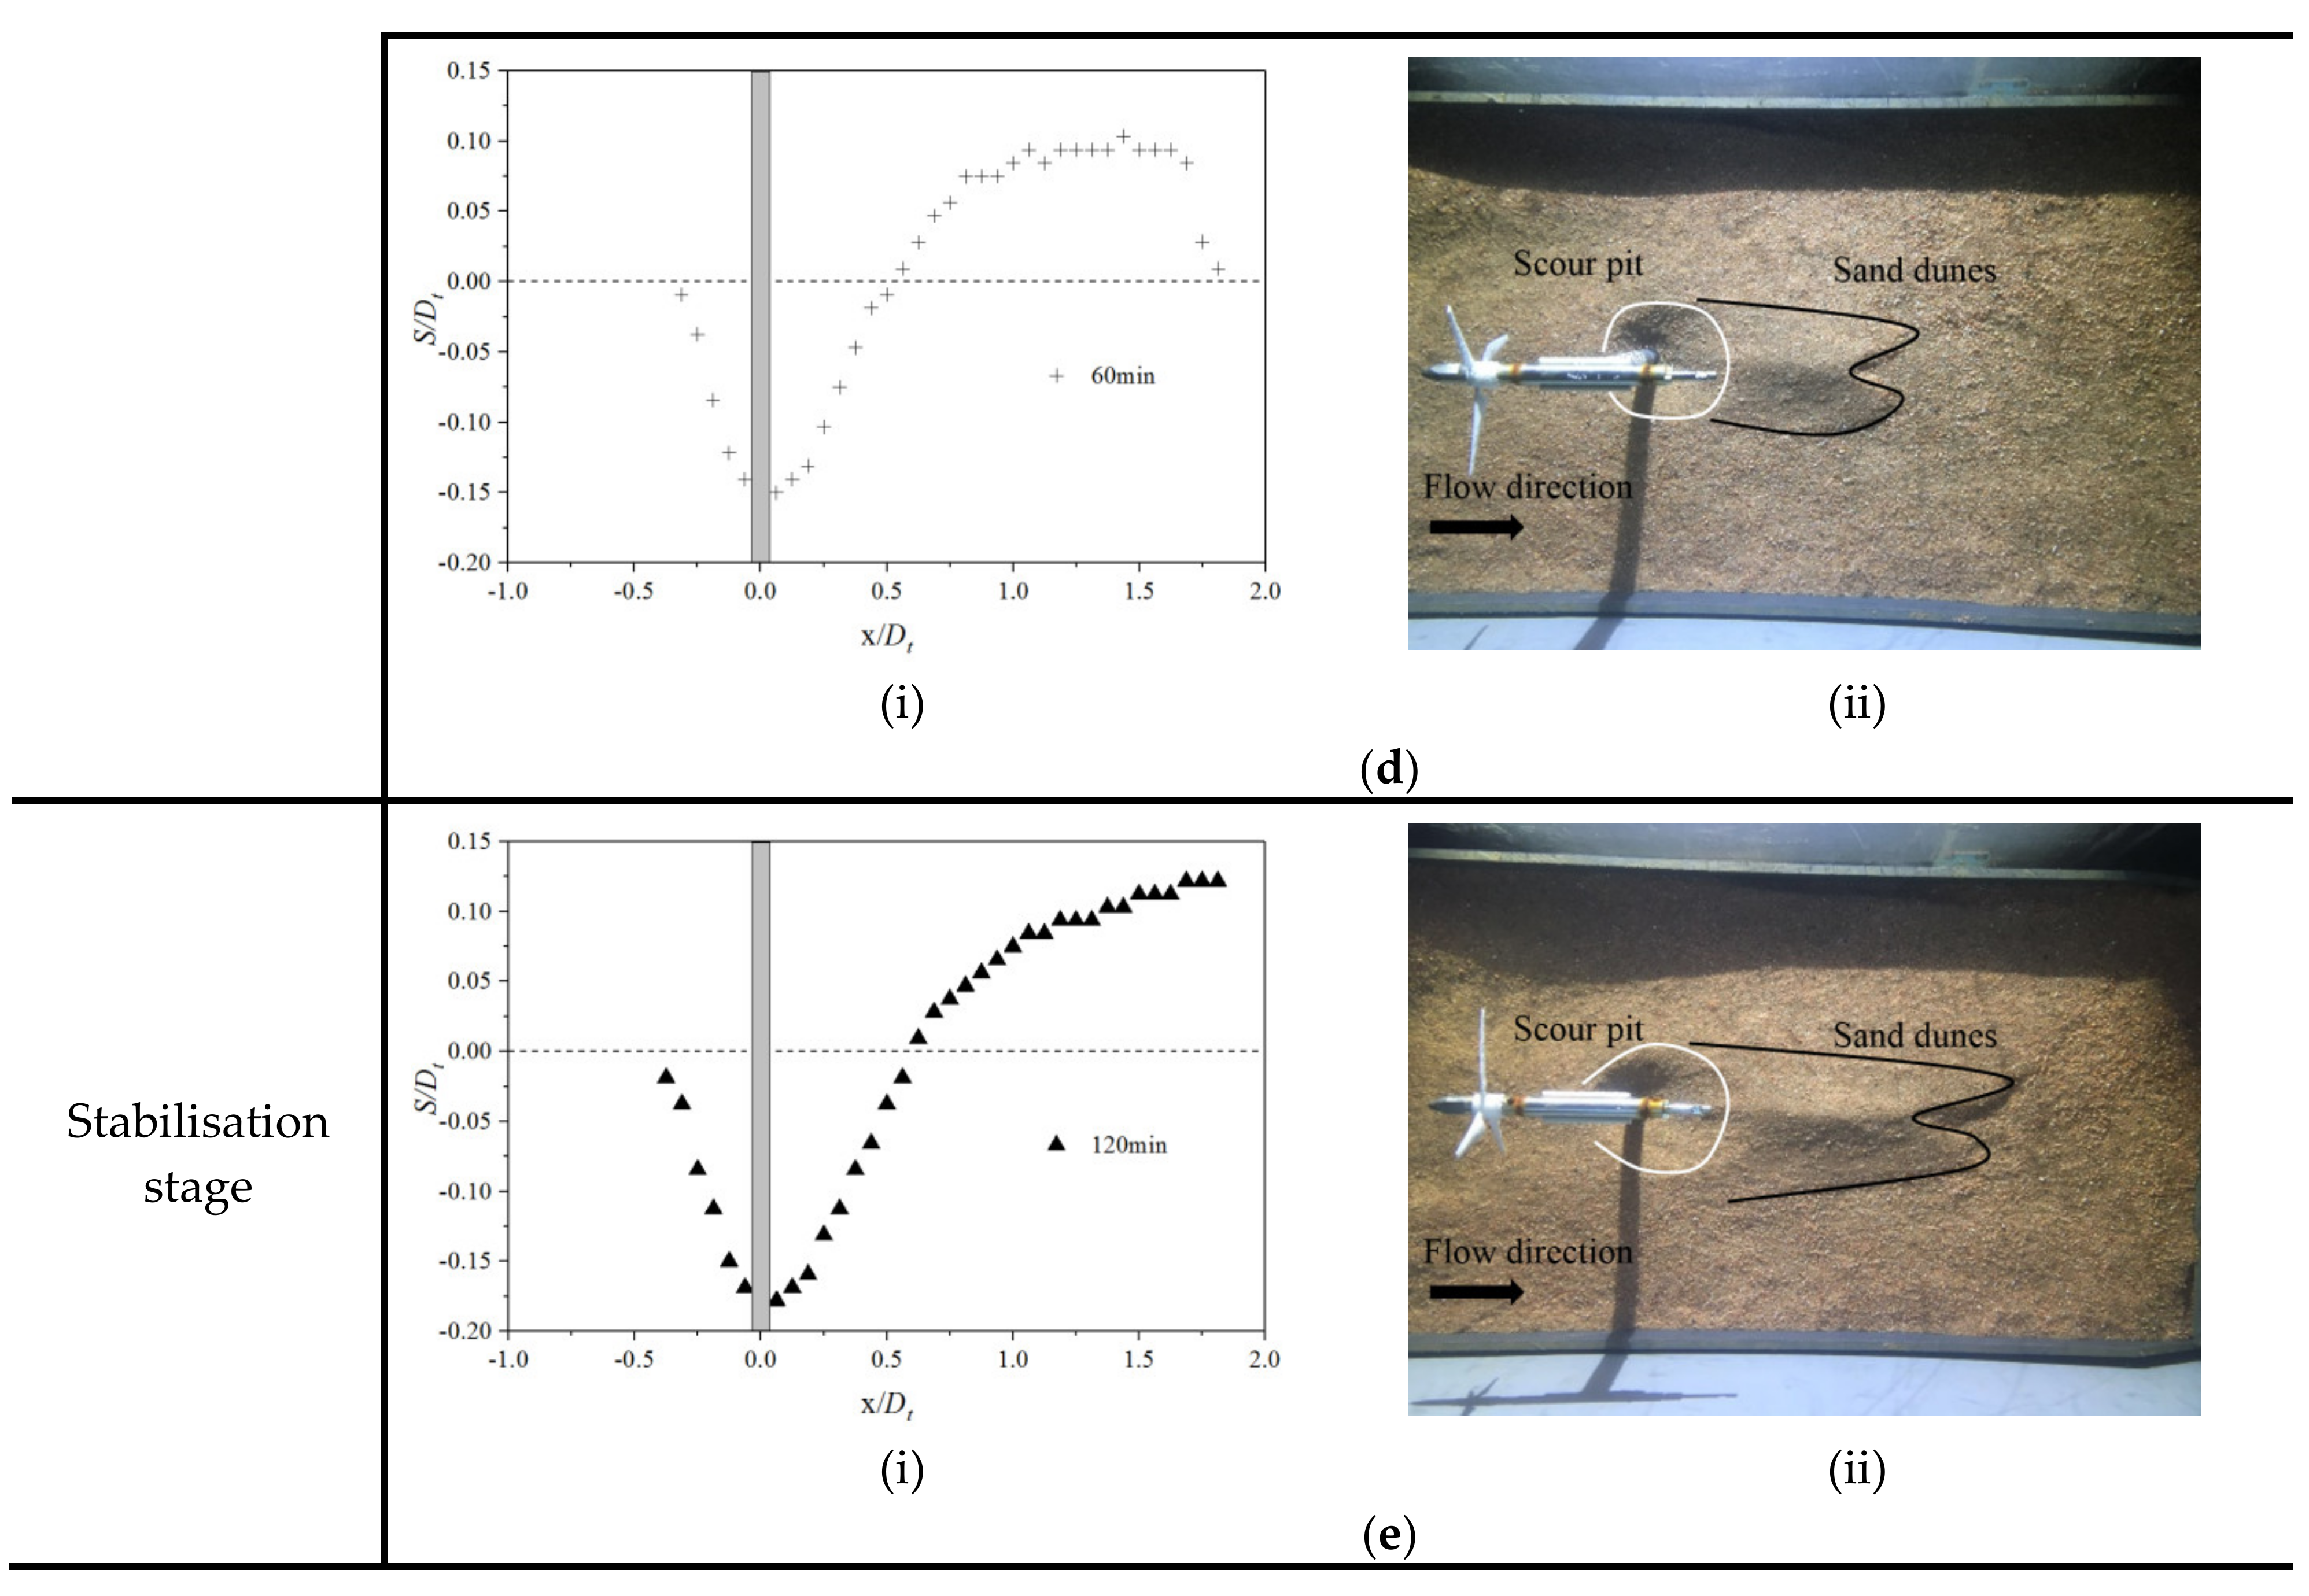
4.2. Scouring Process
5. Equation Used to Predict Maximum Scour Depth for Tidal Turbine
6. Conclusions
- (1)
- A tip-bed velocity equation is proposed to estimate the seabed scour of a tidal turbine. The derivation of the equation is based on the axial momentum theory and conservation of mass. In the calculation of a single case (Chen and Lam [5]), the proposed equation showed the variation was less than 4% for various tip clearances.
- (2)
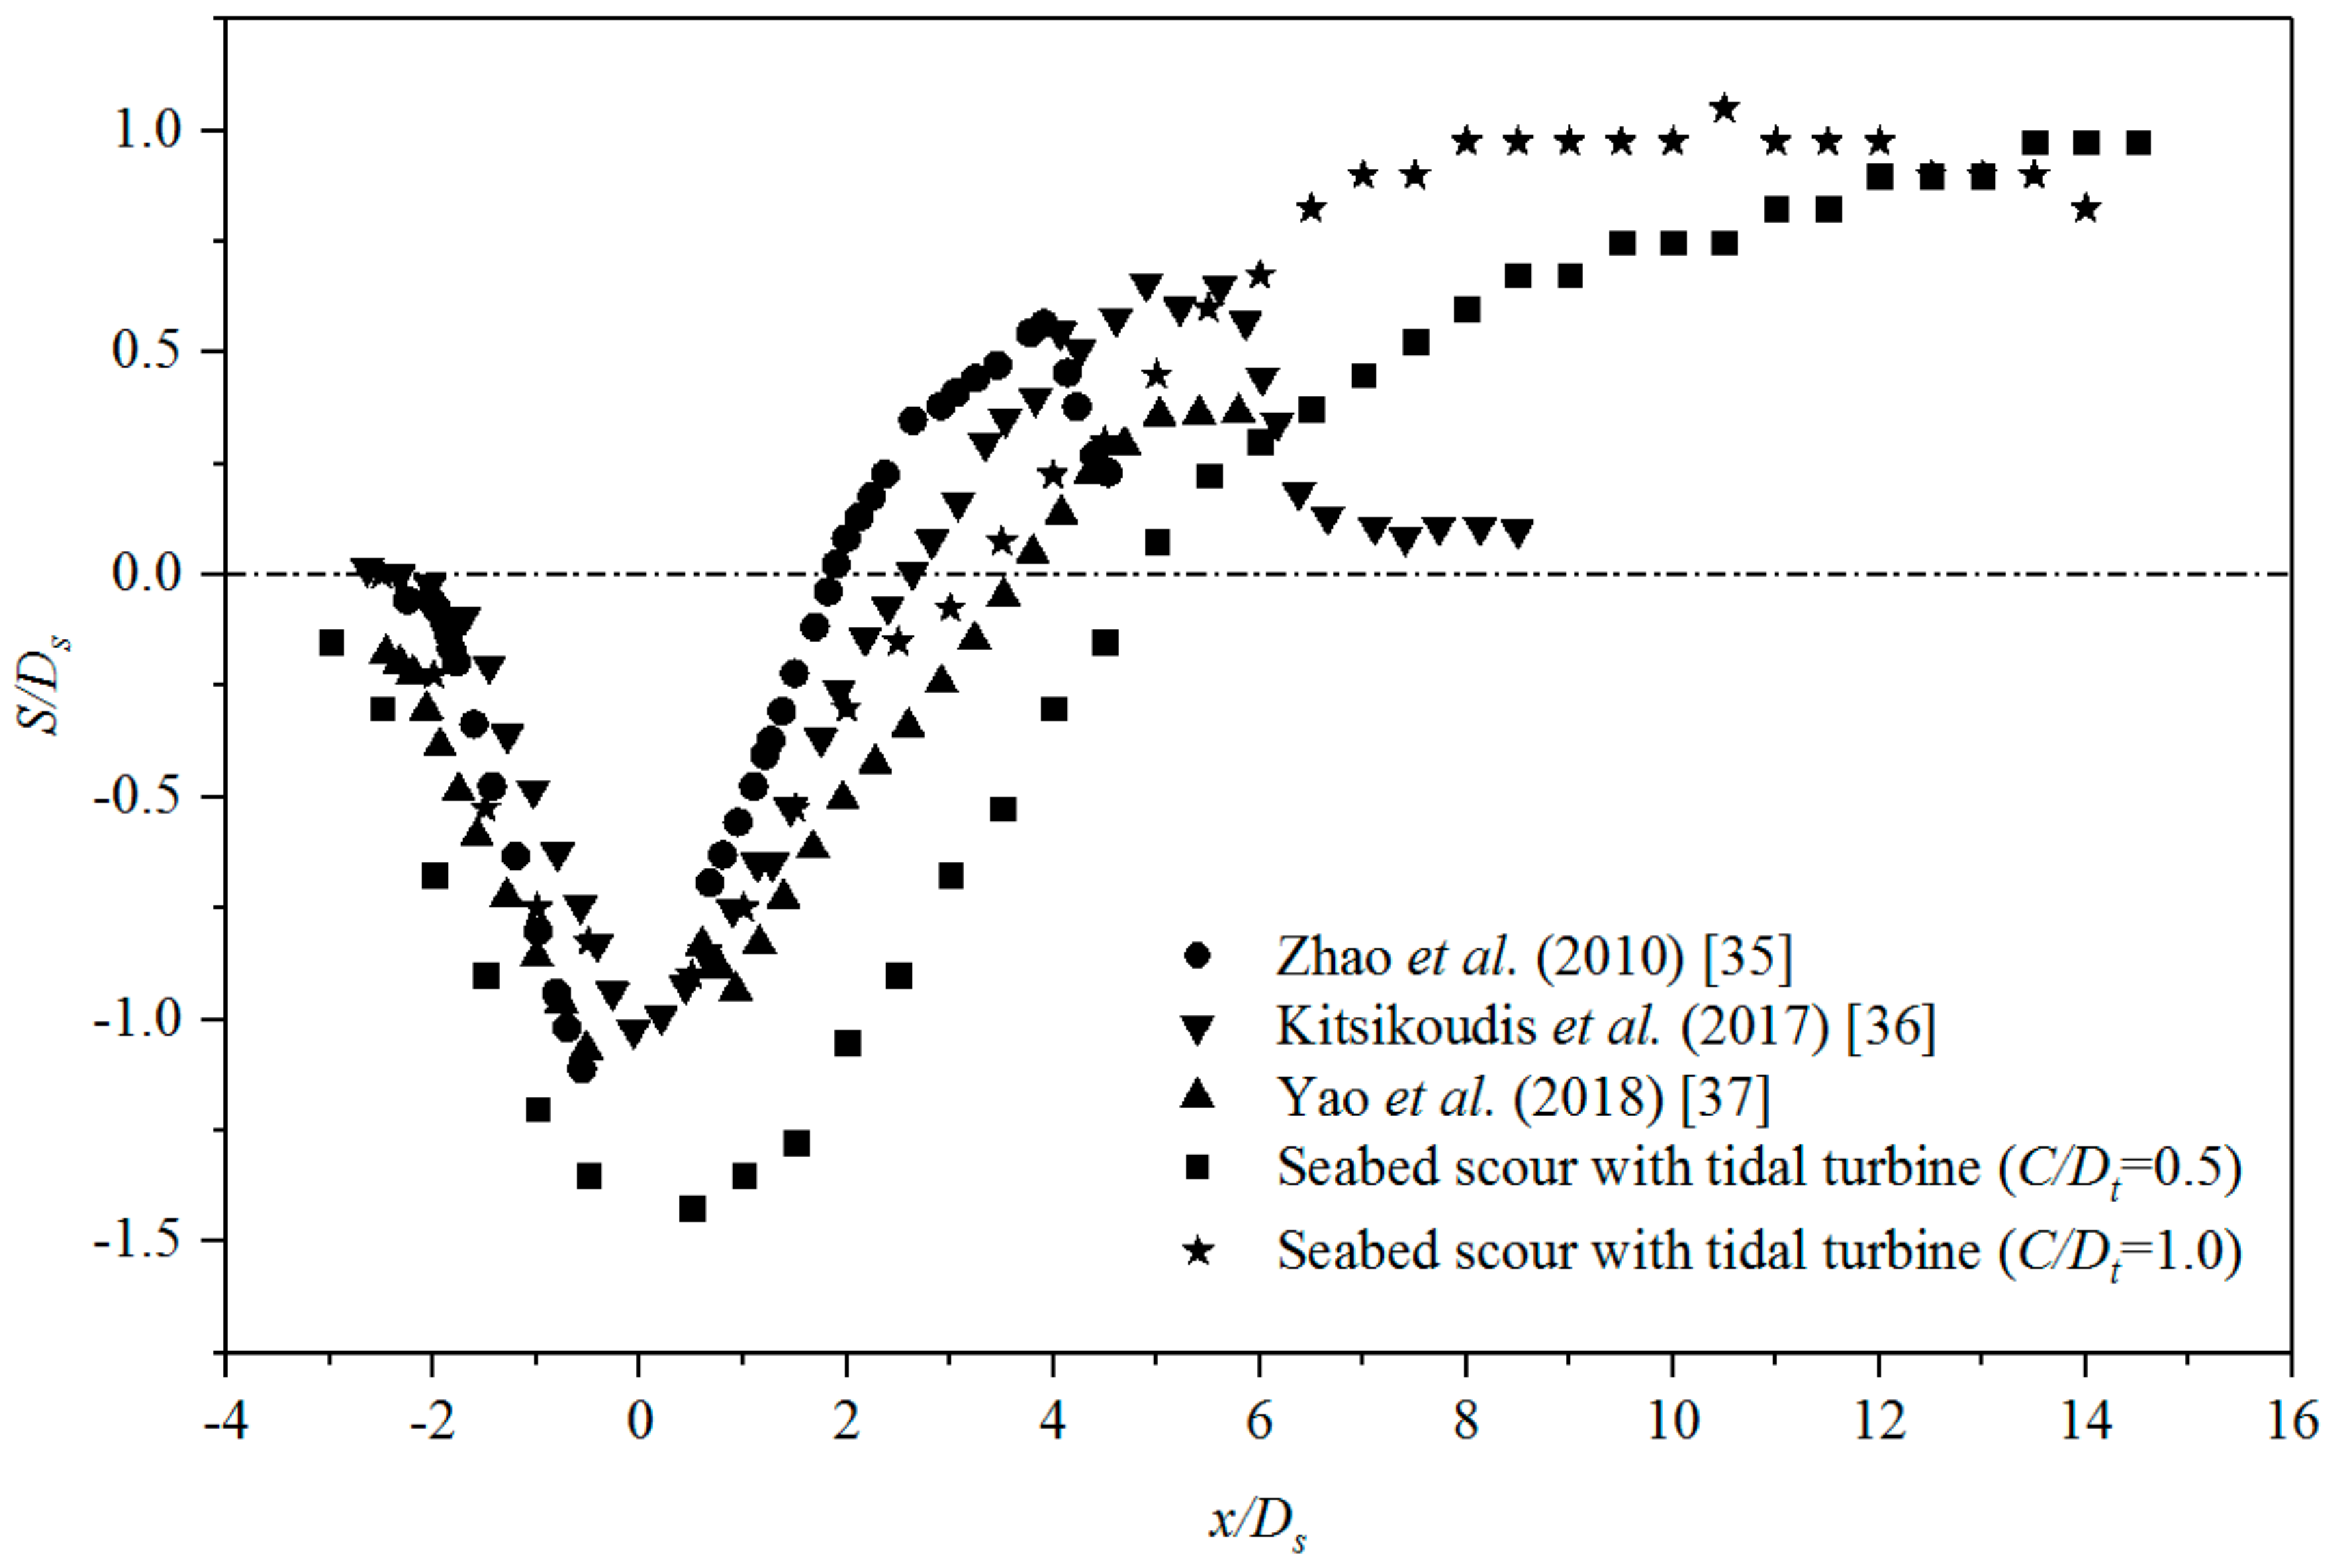
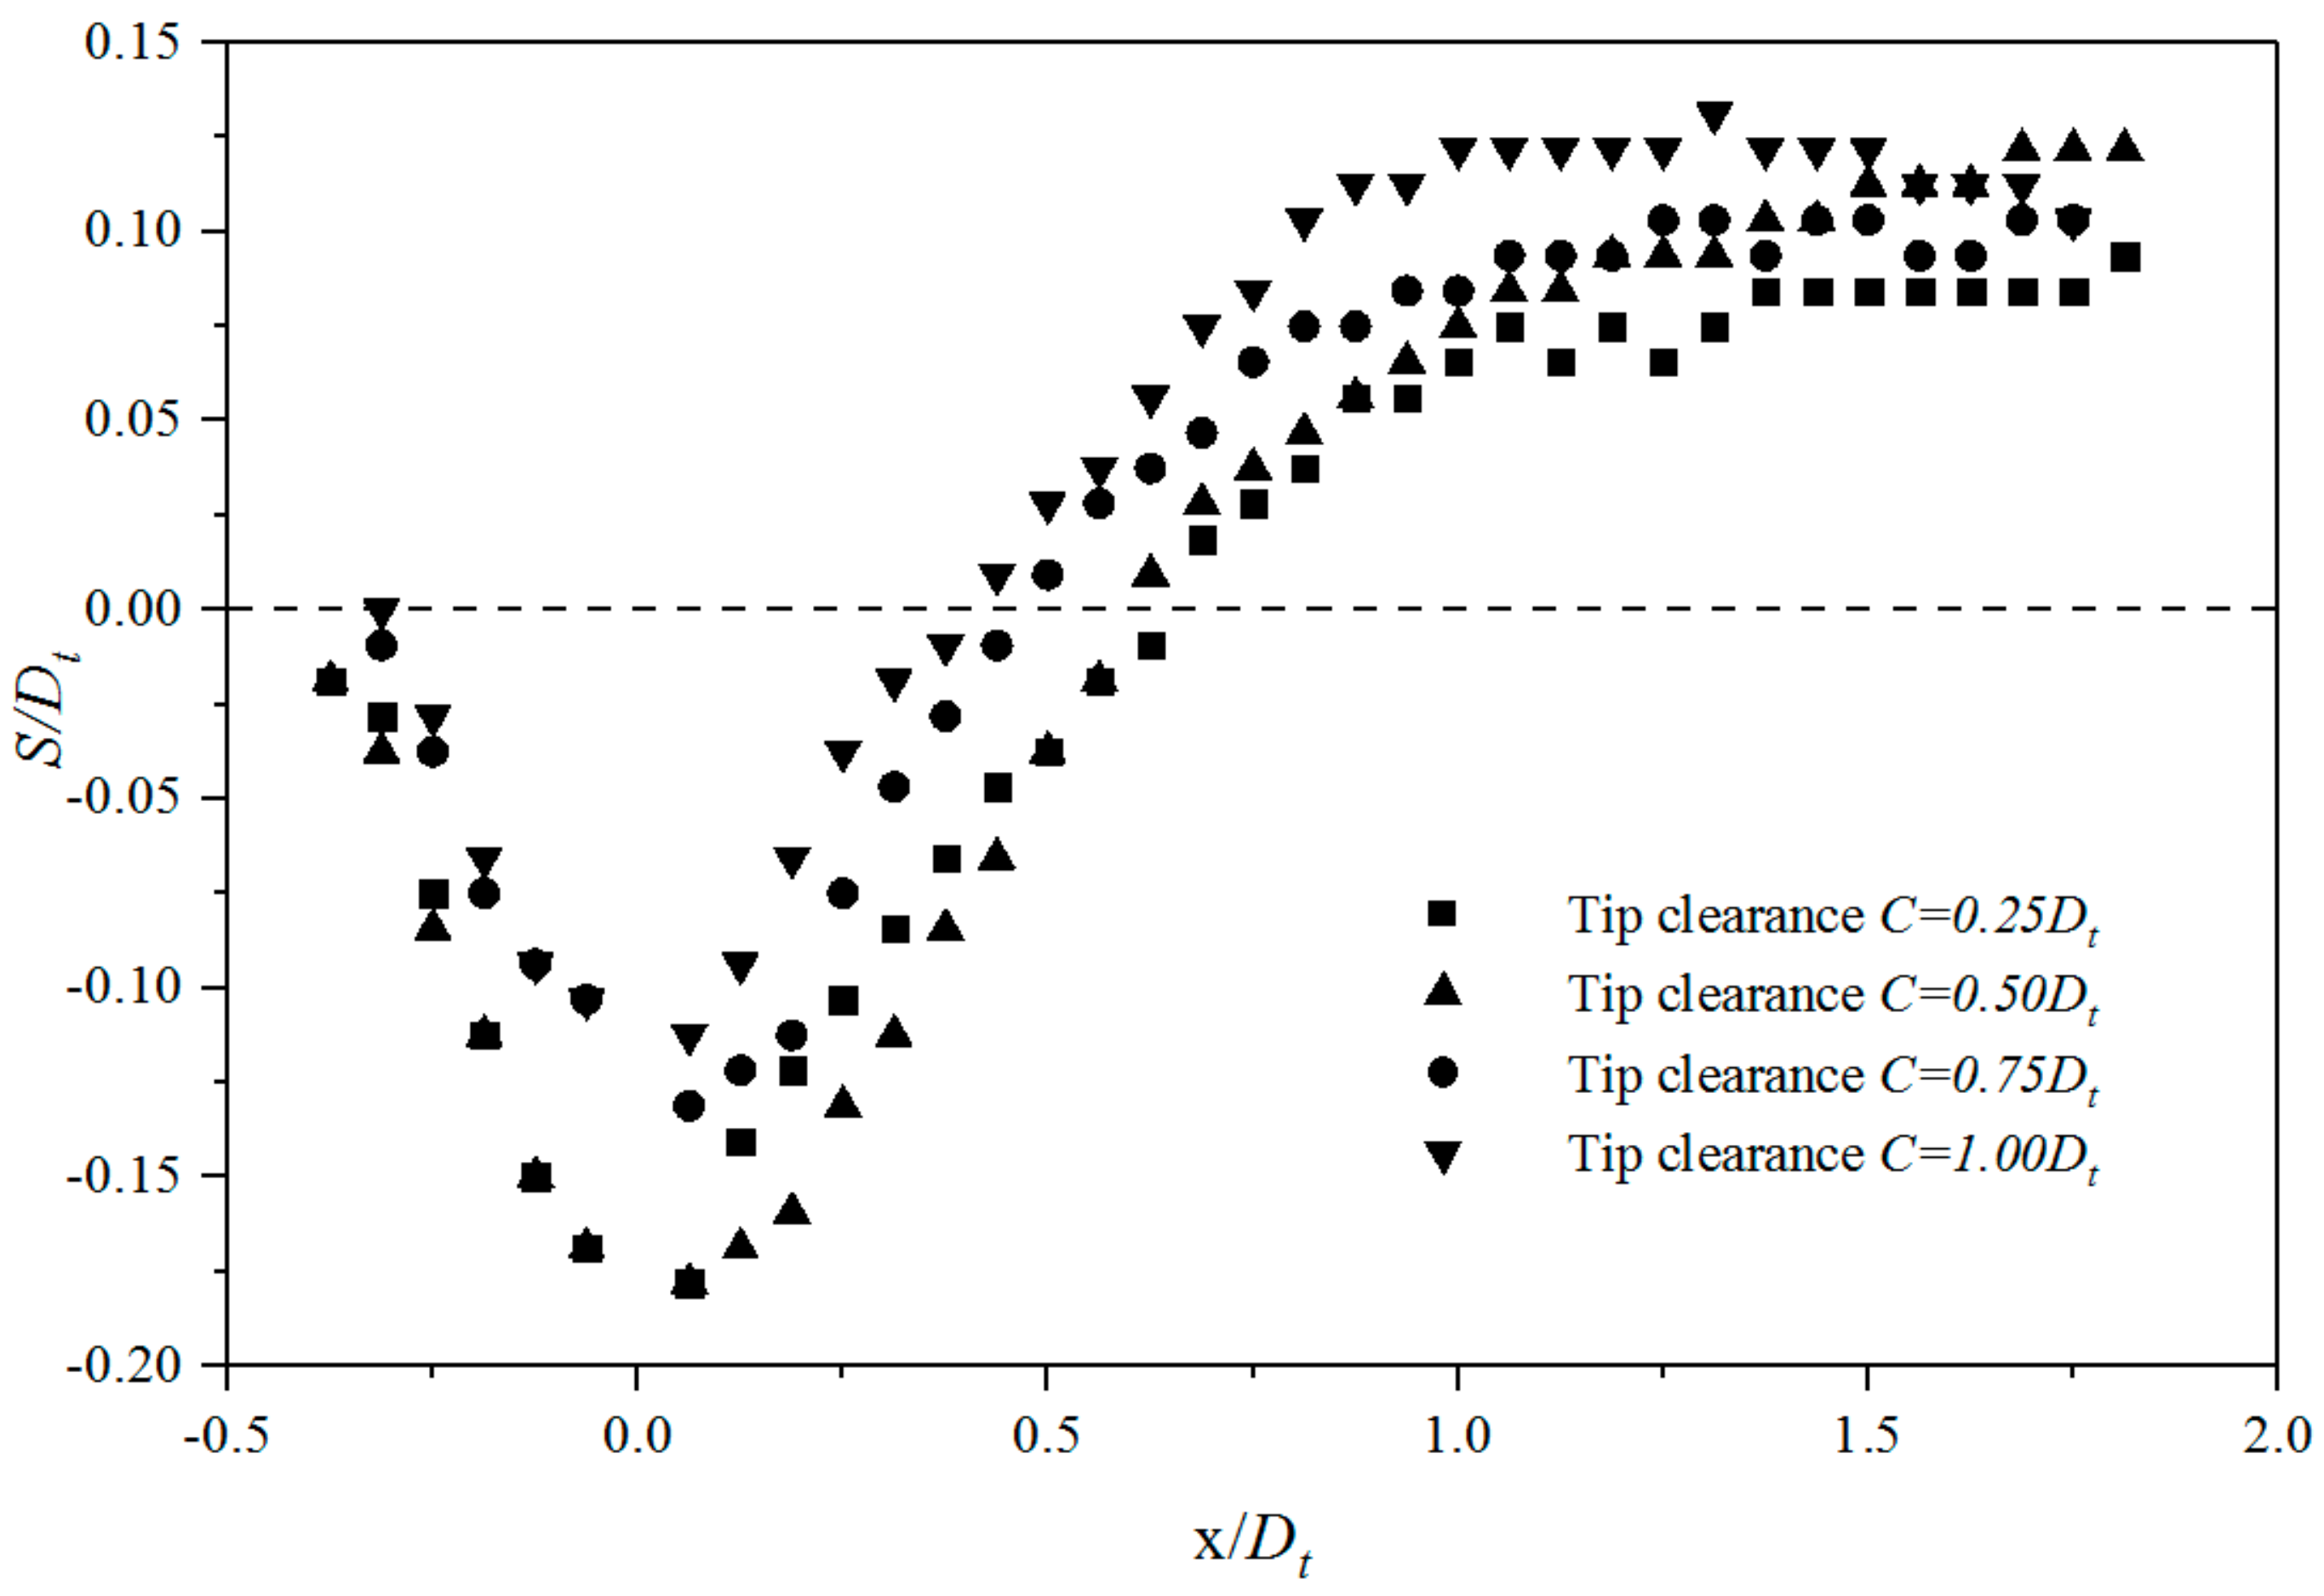
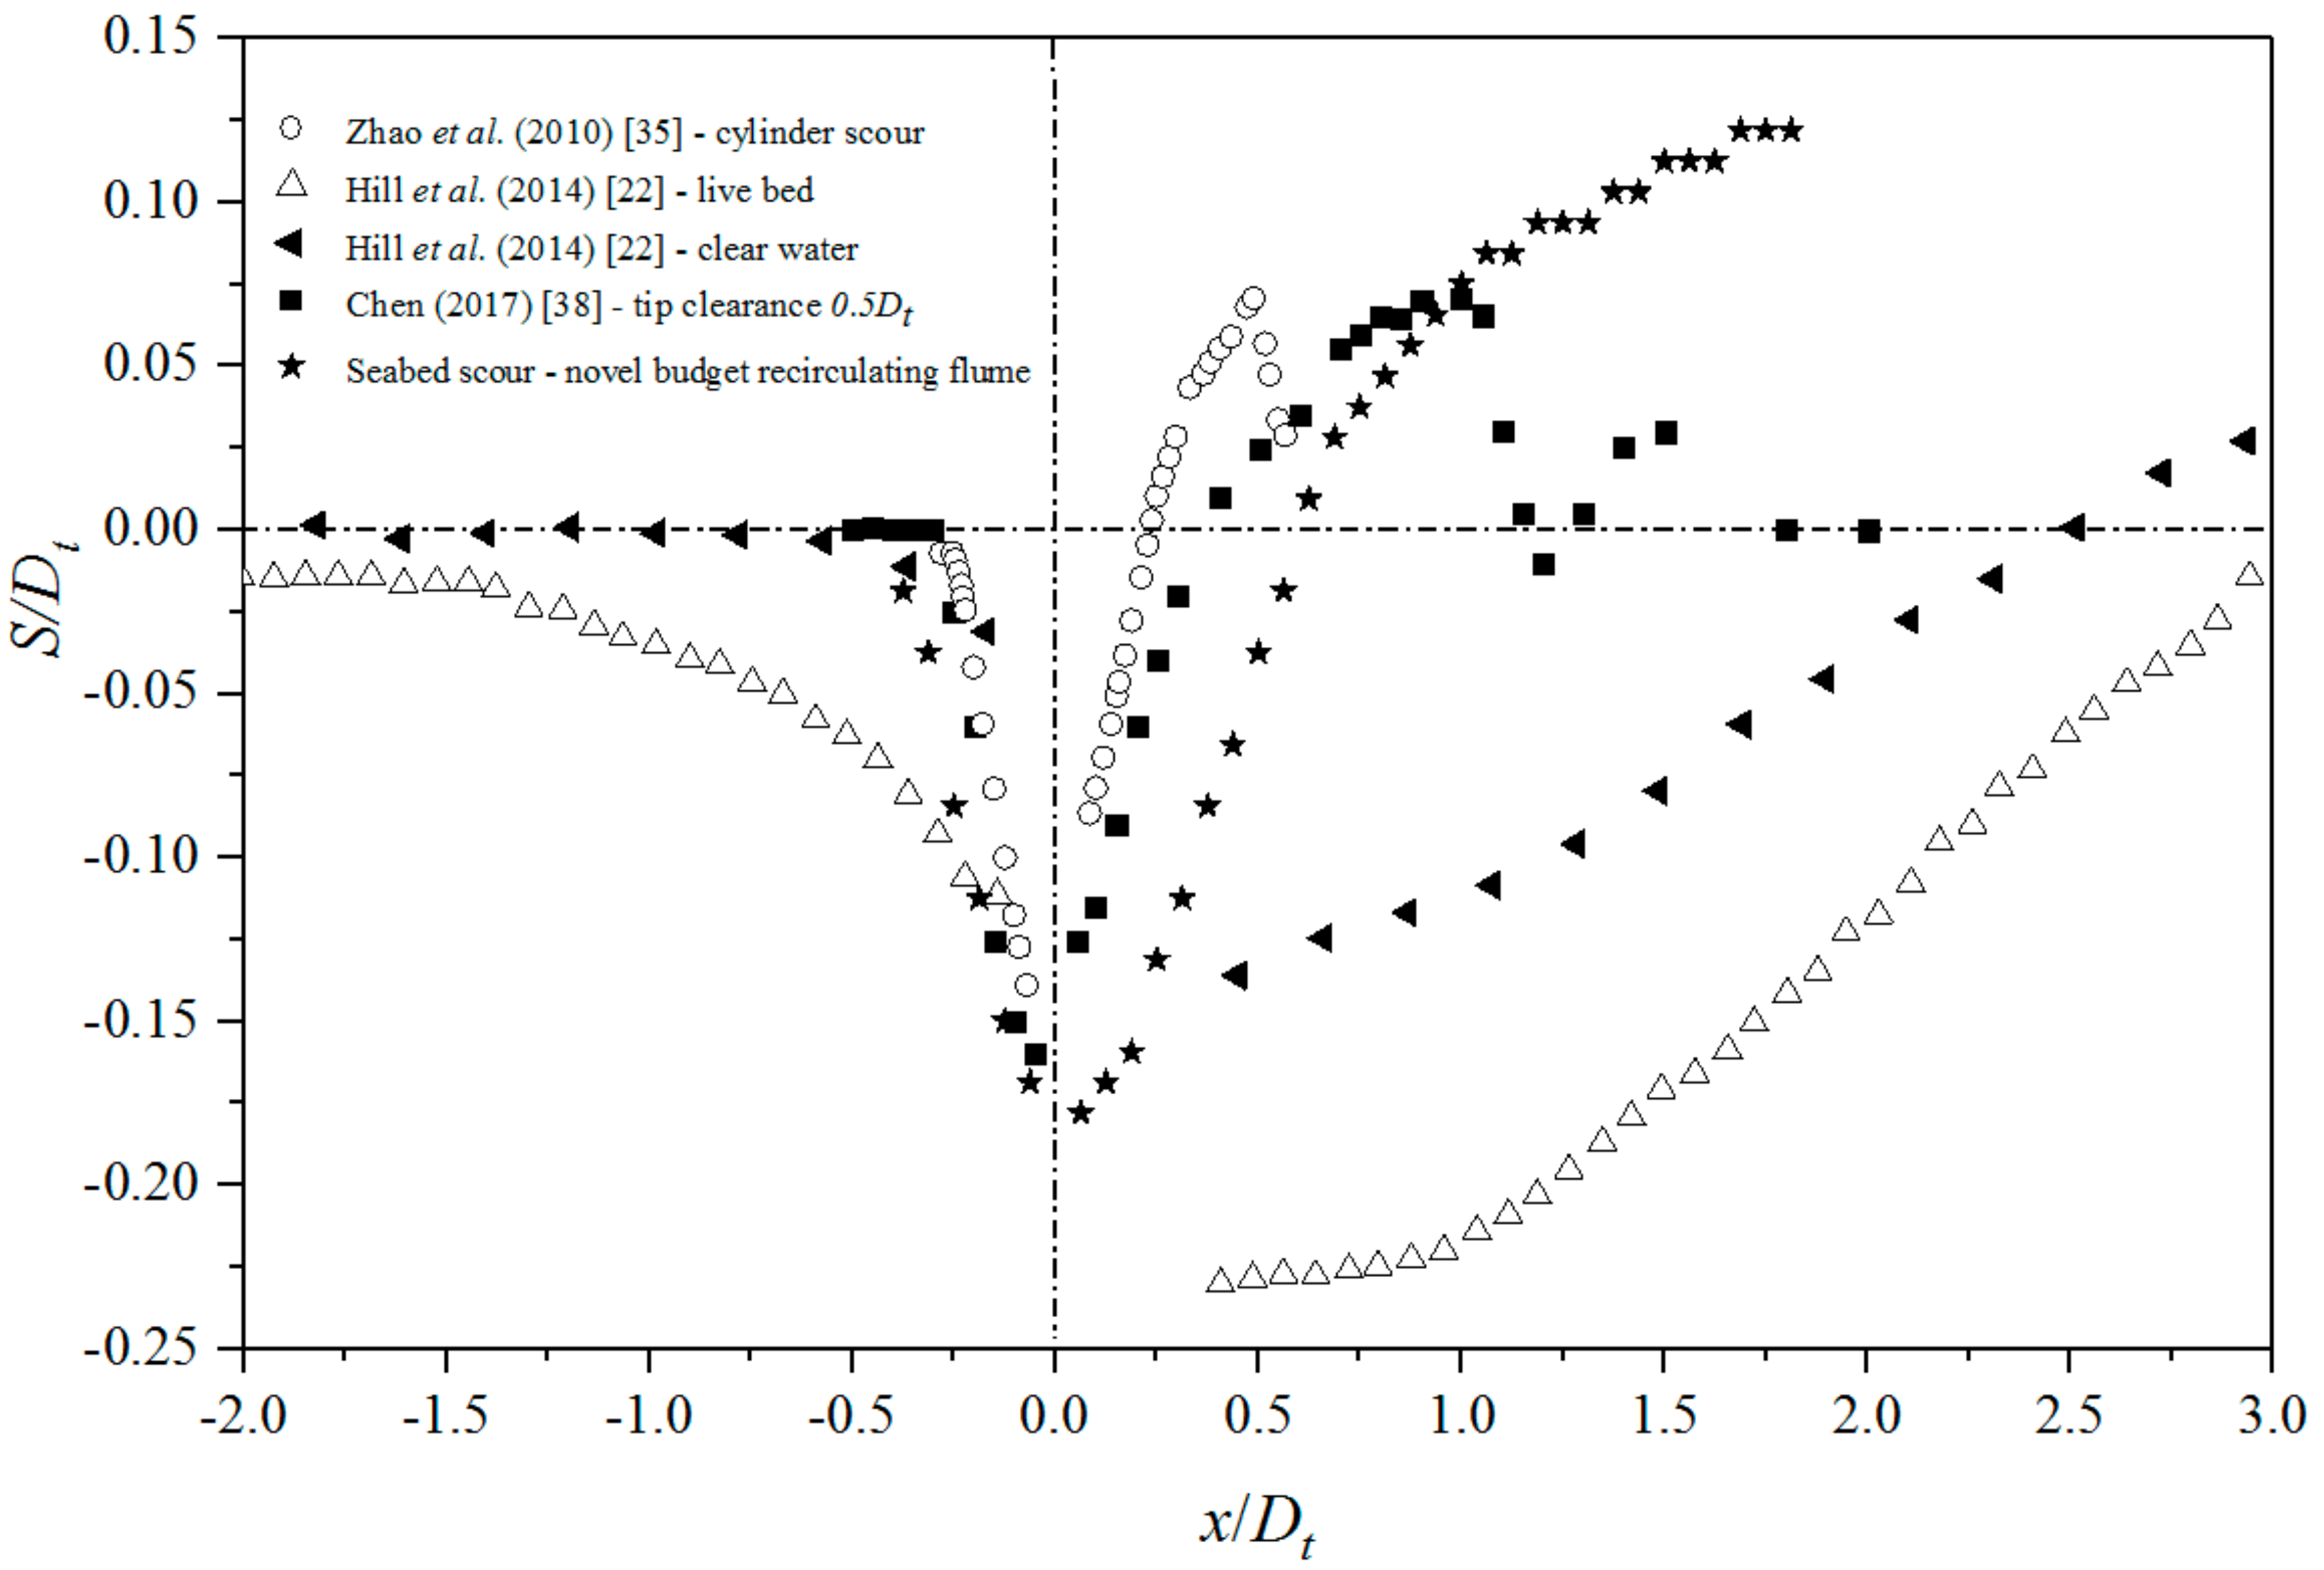
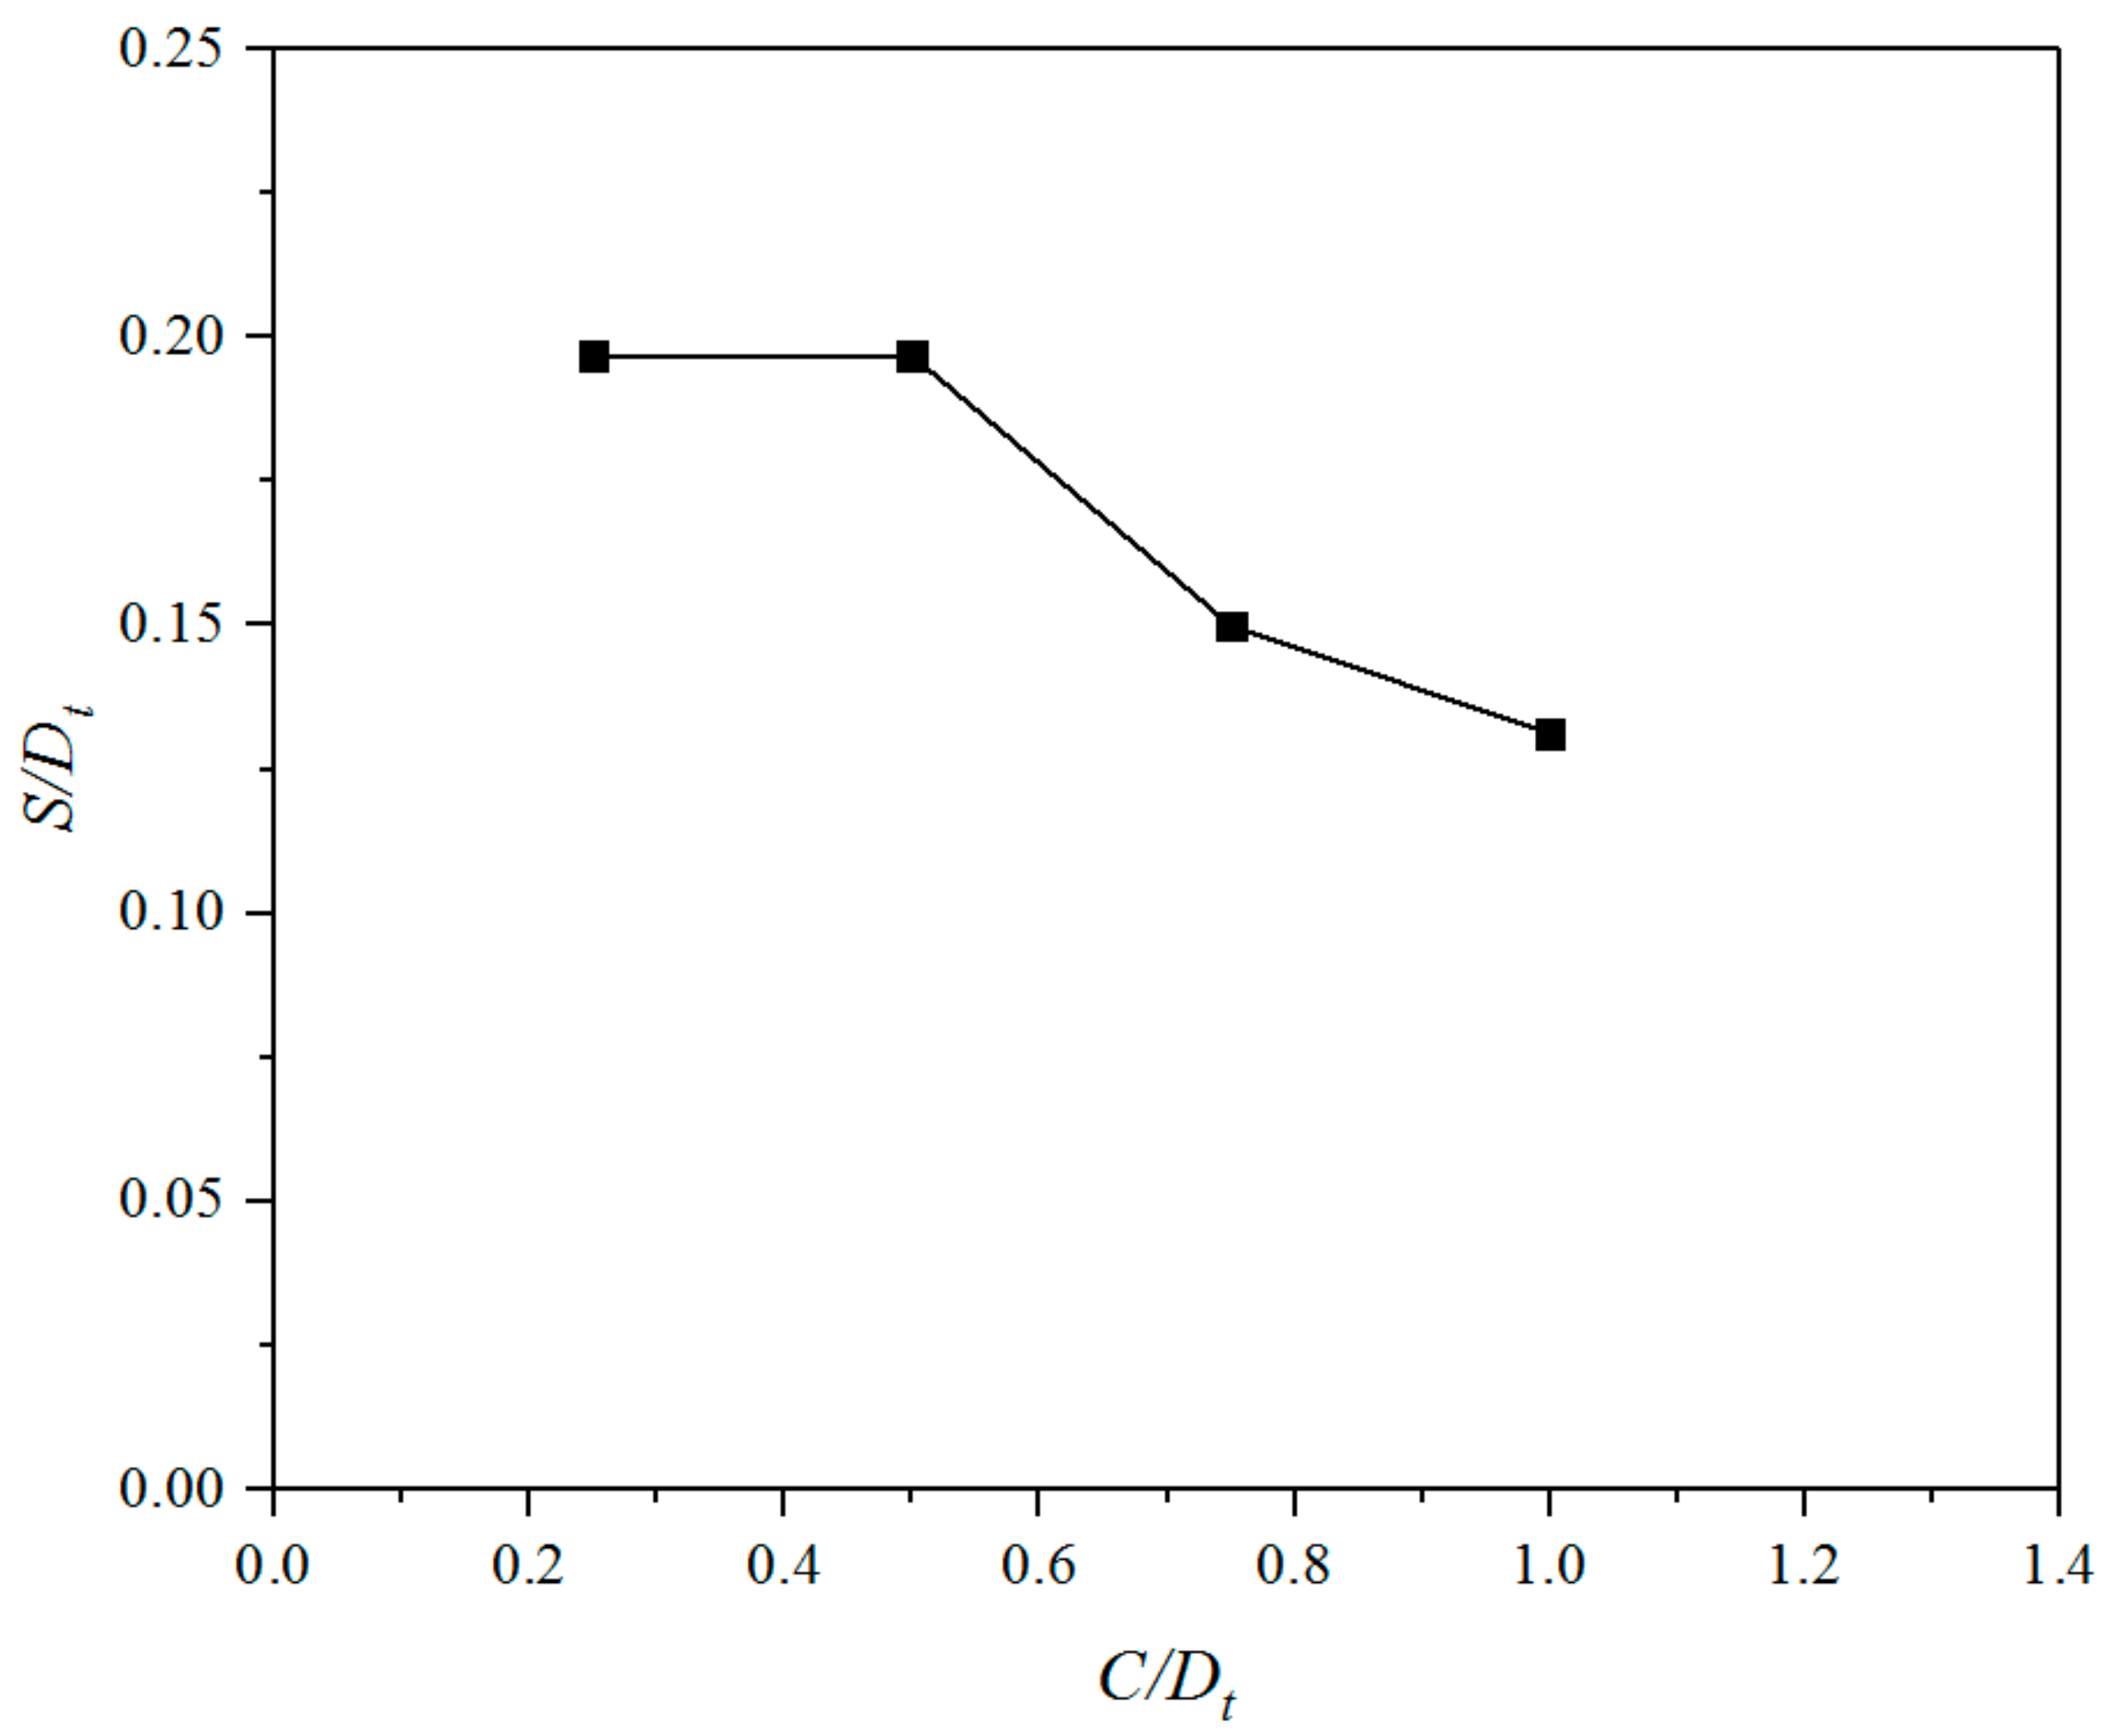
- A turbine significantly impacts its seabed scour due to shadowing effects. The influence of a turbine on scouring depends on the tip-bed clearance in between the blades and seabed. Scour depth is inversely proportional to tip clearance. The influence of a turbine is less significant when the clearance is excessively high (C > 1.00 Dt) due to less significant shadowing effects. The influence of a turbine is the same even with smaller clearance after C < 0.50 Dt due to less blocked water diverting into the narrow region.
- (3)
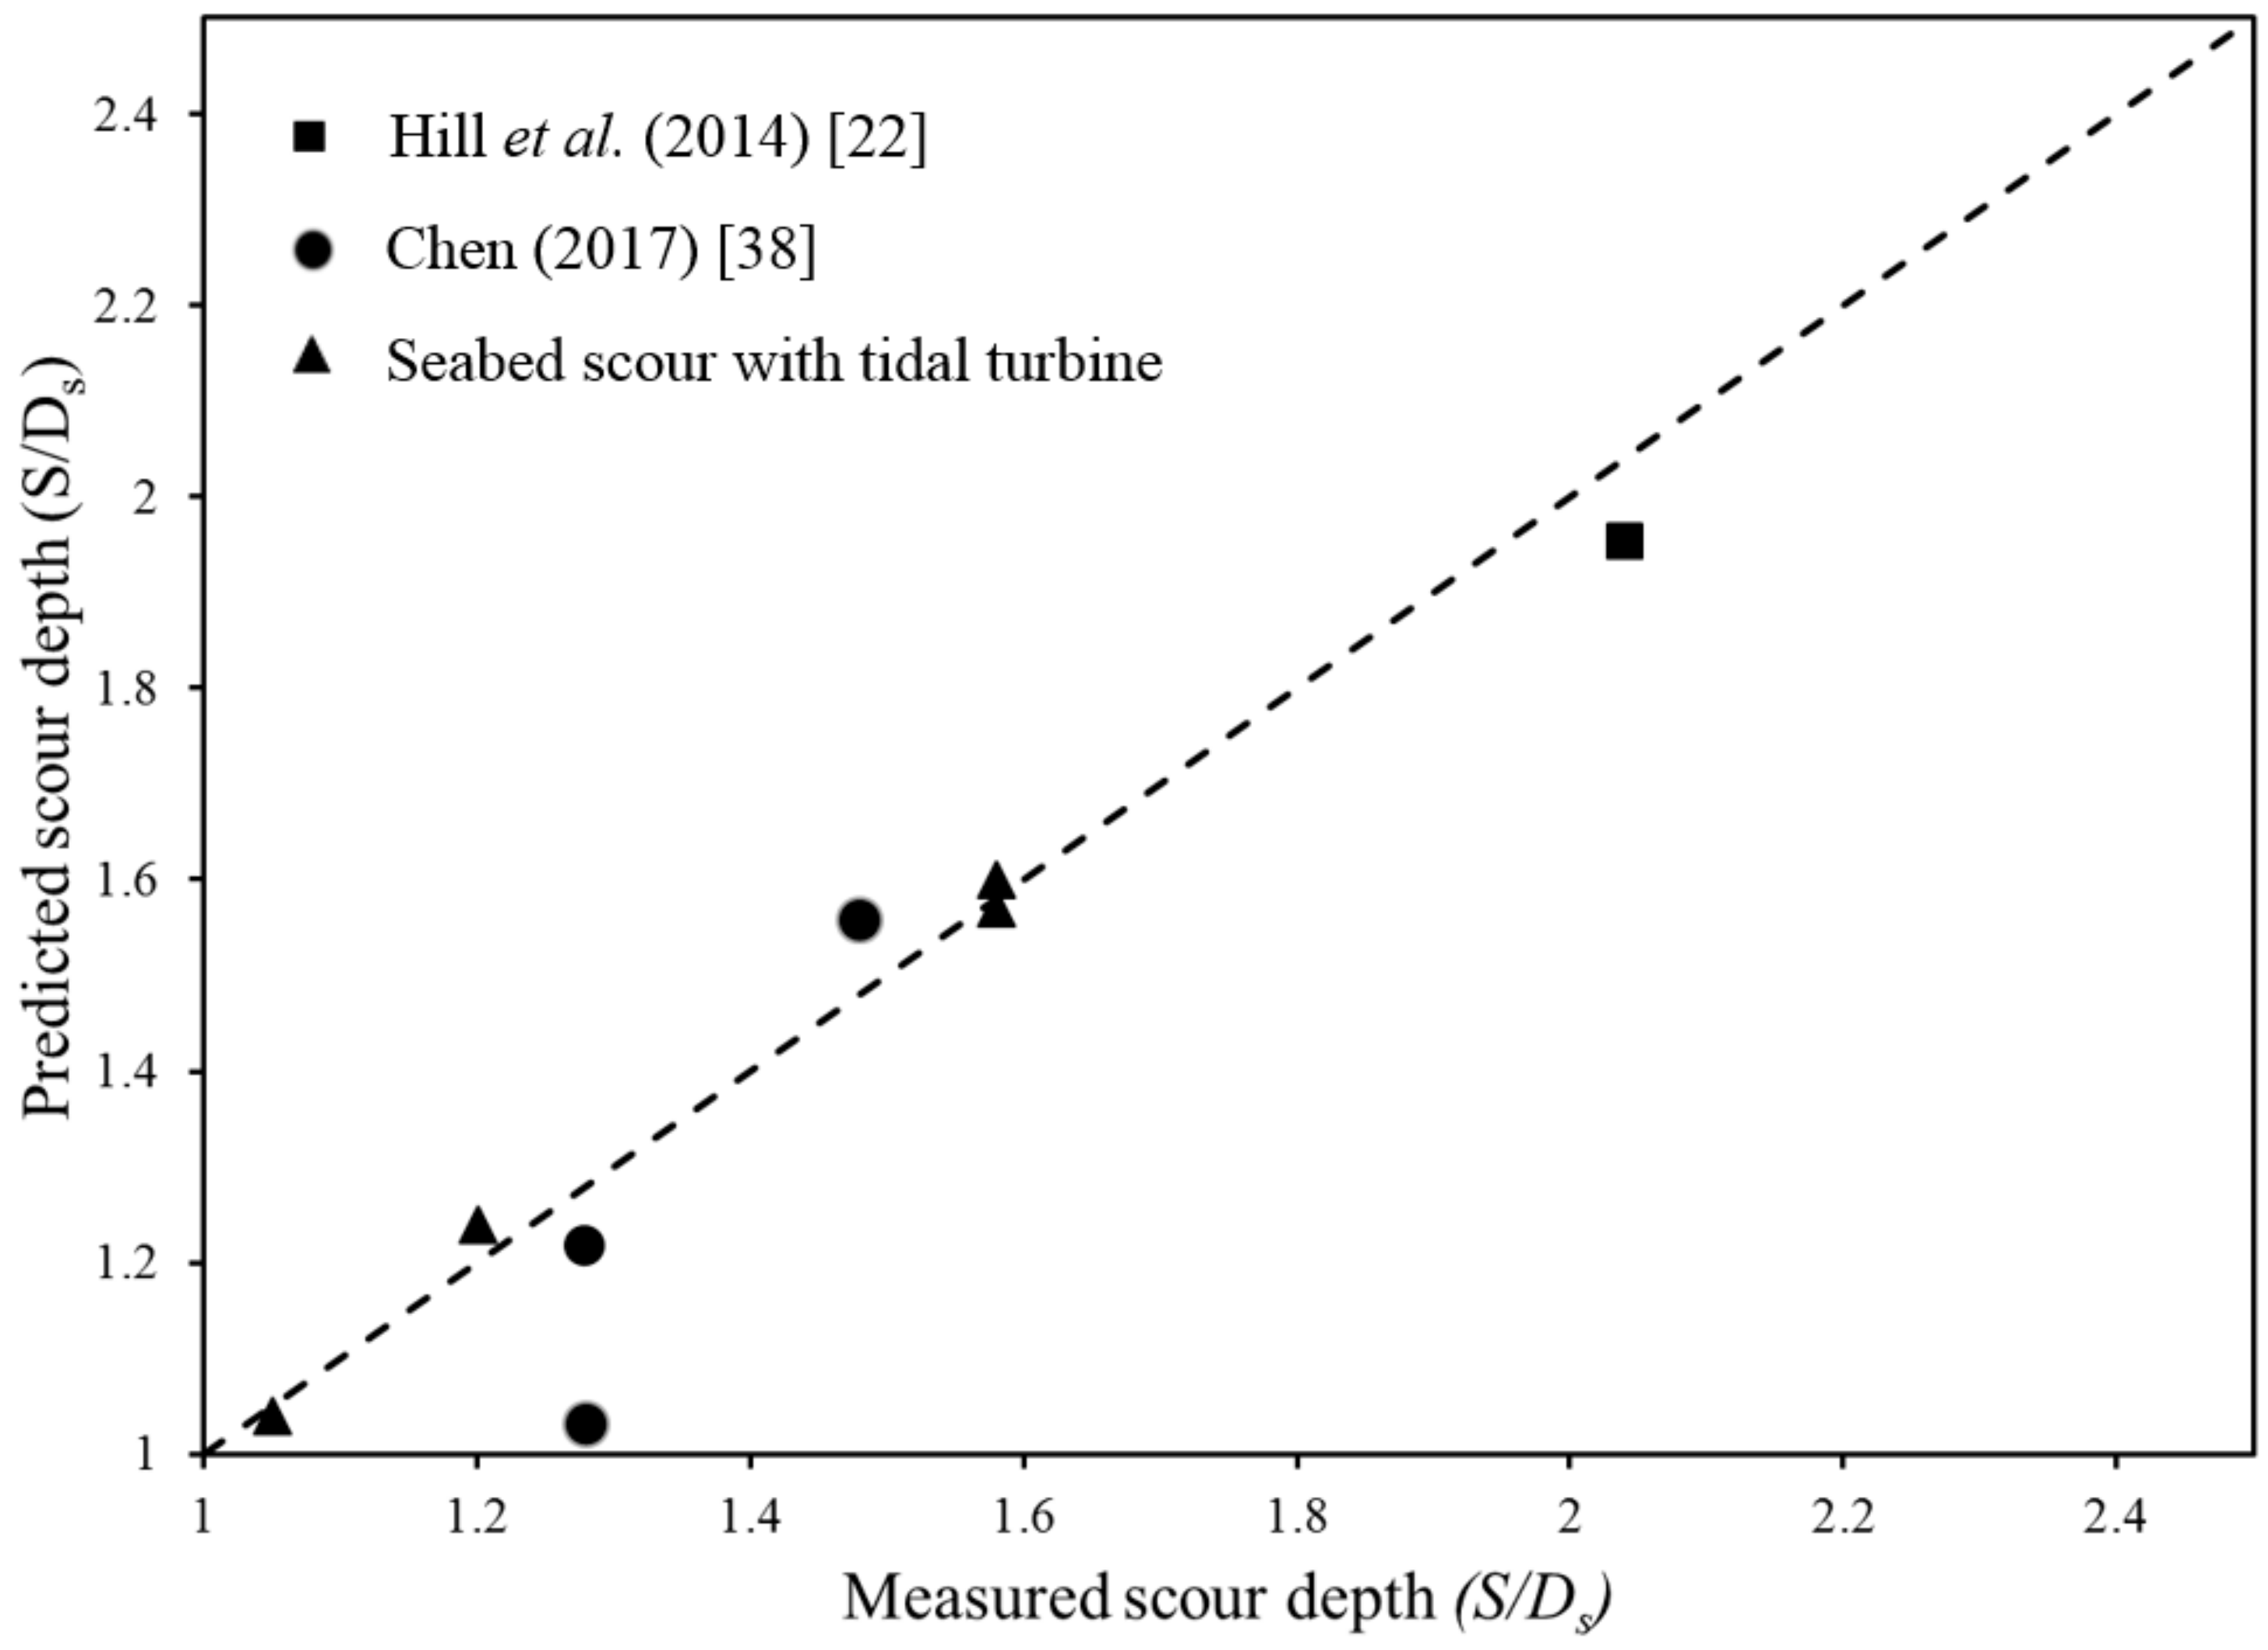
- An empirical equation is proposed to estimate the maximum tidal turbine scour depth. The turbine coefficient (Kt) is proposed to estimate the seabed scour depth of a tidal turbine with a consideration of the tip-bed velocity. The predicted data are well correlated with measured scour depth within a 5–24% error range. The correlation coefficient (R), mean absolute error (MAE), root mean squared error (RSME), and scatter index (SI) are 0.944, 0.085, 0.142, and 0.081, respectively.
- (4)
- A mass flow coefficient (Cm) is proposed in the tip-bed velocity equation to include the blockage and shadowing effects to increase the flow velocity close to the seabed. In this paper, a mass flow coefficient (Cm) of 0.25 was used based on the assumption that 25% water flows downward into the mixing area. Water can flow upward, downward, leftward, and rightward. This 0.25 coefficient assumption allows for the predictions of tidal turbine scour depth by using the combined pile scour equation and tip-bed velocity equation. The mass flow coefficient (Cm) is influenced by various factors including flow velocity, flow turbulence, turbine position, and turbine parameters. The mass flow coefficient is complicated, and future research is needed.
Author Contributions
Funding
Acknowledgments
Conflicts of Interest
Appendix A. Correction Factor for Piles or Pier Equations
| S is maximum scour depth (m). D is pile diameter (m). h is pile height (m). Ks is correction factor of pier shape. Kθ is correction factor for flow angle. Kb is correction factor for bed condition. Kd is correction factor for size of bed material. Kv is correction factor accounting for wave action. Kh is the correction factor accounting for piles that do not extend over the entire water column. | |
Nomenclature
| V0 | efflux velocity in m/s |
| V∞ | free flow velocity in m/s |
| Vtb | tip-bed velocity in m/s |
| U1–U4 | axial velocity in m/s at location 1–4 |
| P1–P4 | pressure in Pa at location 1–4 |
| T | trust acted on actuator disc in N |
| CT | thrust coefficient |
| Cm | flow mass coefficient |
| A | area of the actuator disc |
| A1 | area of water flowing through the actuator disc at location 1 |
| ρ | density of fluid in kg/m3 |
| m | quality of the flow through the turbine in kg |
| m1 | total flow quality in the area A at location 1 |
| Δm | fluid quality that has not passed through the actuator disc |
| Δm1 | downward flow mass |
| ΔP | energy change of water flow |
| C | tip clearance between turbine and seabed in m |
| r | radius of actuator disc in m |
| hf | water depth of recirculating flume in m |
| Dt | diameter of turbine in m |
| Ds | Diameter of support structure in m |
| Lw | Width of water channel in m |
| Ld | Depth of water channel in m |
| d50 | Mean sediment grain diameter in mm |
| D | pile diameter in m |
| h | pile height in m |
| S | scour depth for turbine |
| Ks | correction factor of pier shape |
| Kt | correction factor of turbine |
References
- Watchorn, M.; Trapp, T. Chapter 585—Tidal Stream Renewable Offshore Power Generation (TS-Ropg). In Proceedings of the Energy for the 21st Century World Renewable Energy Congress VI 2000, Brighton, UK, 1–7 July 2000; Elsevier: Amsterdam, The Netherlands, 2000; pp. 2664–2667. [Google Scholar] [CrossRef]
- Bonar, P.A.J.; Schnabl, A.M.; Lee, W.K.; Adcock, T.A. Assessment of the Malaysian tidal stream energy resource using an upper bound approach. J. Ocean Eng. Mar. Energy 2018, 4, 99–109. [Google Scholar] [CrossRef] [Green Version]
- Rourke, F.O.; Boyle, F.; Reynolds, A. Marine current energy devices: Current status and possible future applications in Ireland. Renew. Sustain. Energy Rev. 2010, 14, 1026–1036. [Google Scholar] [CrossRef] [Green Version]
- Chen, L.; Lam, W.H. Methods for predicting seabed scour around marine current turbine. Renew. Sustain. Energy Rev. 2014, 29, 683–692. [Google Scholar] [CrossRef]
- Chen, L.; Lam, W.H. Slipstream between marine current turbine and seabed. Energy 2014, 68, 801–810. [Google Scholar] [CrossRef]
- Sumer, B.M.; Christiansen, N.; Fredsoe, J. Time Scale of Scour around a Vertical Pile; International Society of Offshore and Polar Engineers: Mountain View, CA, USA, 1992; ISBN 1-880653-03-6. [Google Scholar]
- Neill, C.R. Roads and Transportation Association of Canada. Project Committee on Bridge Hydraulics. Guide to Bridge Hydraulics; University of Toronto Press: North York, ON, Canada, 1973; ISBN 0802019617. [Google Scholar]
- Breusers, H.N.C.; Nicollet, G.; Shen, H.W. Local scour around cylindrical piers. J. Hydraul. Res. 1977, 15, 211–252. [Google Scholar] [CrossRef]
- Sumer, B.M.; Fredsøe, J.; Christiansen, N. Scour Around Vertical Pile in Waves. J. Waterw. Port Coast. Ocean Eng. 1992, 118, 15–31. [Google Scholar] [CrossRef]
- Richardson, E.V.; Harrison, L.J.; Richardson, J.R. Evaluating Scour at Bridges; Federal Highway Administration: Washington, DC, USA, 1993. [Google Scholar]
- Albertson, M.L.; Dai, Y.B.; Jensen, R.A.; Rouse, H. Diffusion of Submerged Jets. Am. Soc. Civ. Eng. 1950, 115, 639–664. [Google Scholar] [CrossRef]
- Hamill, G.A. Characteristics of the Screw Wash of a Manoeuvring Ship and the Resultant Bed Scour. Ph.D. Thesis, Queens University of Belfast, Belfast, UK, 1987. [Google Scholar]
- Lam, W.H.; Hamill, G.A.; Robinson, D.J.; Raghunathan, S. Semi-empirical methods for determining the efflux velocity from a ship’s propeller. Appl. Ocean Res. 2012, 35, 14–24. [Google Scholar] [CrossRef]
- Jiang, J.X.; Lam, W.H.; Cui, Y.G.; Zhang, T.M.; Sun, C.; Guo, J.H.; Ma, Y.B.; Wang, S.G.; Hamill, G. Ship Twin-propeller Jet Model used to Predict the Initial Velocity and Velocity Distribution within Diffusing Jet. KSCE J. Civ. Eng. 2019, 23, 1118–1131. [Google Scholar] [CrossRef] [Green Version]
- Hamill, G.A. Scouring Action of the Propeller Jet Produced by a Slowly Manoeuvring Ship; Bulletin of the Permanent International Association of Navigation Congresses [PIANC]: Brussels, Belgium, 1988. [Google Scholar]
- Hamill, G.A.; Johnston, H.T.; Stewart, D.P. Propeller Wash Scour near Quay Walls. J. Waterw. Port Coast. Ocean Eng. 1999, 125, 170–175. [Google Scholar] [CrossRef]
- Cui, Y.G.; Lam, W.H.; Zhang, T.M.; Sun, C.; Hamill, G. Scour Induced by Single and Twin Propeller Jets. Water 2019, 11, 1097. [Google Scholar] [CrossRef]
- Lam, W.H.; Chen, L.; Hashim, R. Analytical wake model of tidal current turbine. Energy 2015, 79, 512–521. [Google Scholar] [CrossRef]
- Ma, Y.B.; Lam, W.H.; Cui, Y.G.; Zhang, T.M.; Jiang, J.X.; Sun, C.; Guo, J.H.; Wang, S.G.; Lam, S.S.; Hamill, G. Theoretical vertical-axis tidal-current-turbine wake model using axial momentum theory with CFD corrections. Appl. Ocean Res. 2018, 79, 113–122. [Google Scholar] [CrossRef] [Green Version]
- Schluntz, J.; Willden, R.H.J. The effect of blockage on tidal turbine rotor design and performance. Renew. Energy 2015, 81, 432–441. [Google Scholar] [CrossRef]
- Sun, C.; Lam, W.H.; Lam, S.S.; Dai, M.; Hamill, G. Temporal Evolution of Seabed Scour Induced by Darrieus-Type Tidal Current Turbine. Water 2019, 11, 896. [Google Scholar] [CrossRef]
- Hill, C.; Musa, M.; Chamorro, L.P.; Ellis, C.; Guala, M. Local Scour around a Model Hydrokinetic Turbine in an Erodible Channel. J. Hydraul. Eng. 2014, 140, 04014037. [Google Scholar] [CrossRef]
- Sun, C.; Lam, W.H.; Cui, Y.; Zhang, T.; Jiang, J.X.; Guo, J.H.; Ma, Y.B.; Wang, S.G.; Tan, T.H.; Chuah, J.H.; et al. Empirical model for Darrieus-type tidal current turbine induced seabed scour. Energy Convers. Manag. 2018, 171, 478–490. [Google Scholar] [CrossRef] [Green Version]
- Giles, J.; Myers, L.; Bahaj, A.; O’Nians, J.; Shelmerdine, B. Foundation-based flow acceleration structures for marine current energy converters. IET Renew. Power Gener. 2011, 5, 287–298. [Google Scholar] [CrossRef]
- Wang, S.G.; Lam, W.H.; Cui, Y.G.; Zhang, T.M.; Jiang, J.X.; Sun, C.; Guo, J.H.; Ma, Y.B.; Hamill, G. Novel energy coefficient used to predict efflux velocity of tidal current turbine. Energy 2018, 158, 730–745. [Google Scholar] [CrossRef]
- Hamill, G.A.; Mcgarvey, J.A.; Hughes DA, B. Determination of the efflux velocity from a ship’s propeller. Proc. ICE Marit. Eng. 2004, 157, 83–91. [Google Scholar] [CrossRef]
- Lam, W.H.; Chen, L. Equations used to predict the velocity distribution within a wake from a horizontal-axis tidal-current turbine. Ocean Eng. 2014, 79, 35–42. [Google Scholar] [CrossRef]
- Lam, W.H.; Guo, J.H.; Jia, S.R.; Tian, Y.F. A Horizontal Recirculating Flume for Tidal-Current-Turbine. China Patent CN106124161A, 16 November 2016. [Google Scholar]
- Bahaj, A.S.; Molland, A.F.; Chaplin, J.R.; Batten, W.M.J. Power and thrust measurements of marine current turbines under various hydrodynamic flow conditions in a cavitation tunnel and a towing tank. Renew. Energy 2007, 32, 407–426. [Google Scholar] [CrossRef]
- Myers, L.E.; Bahaj, A.S. Experimental analysis of the flow field around horizontal axis tidal turbines by use of scale mesh disk rotor simulators. Ocean Eng. 2010, 37, 218–227. [Google Scholar] [CrossRef]
- Gaurier, B.; Germain, G.; Facq, J.V.; Johnstone, C.M.; Grant, A.D.; Day, A.H.; Nixon, E.; Di Felice, F.; Costanzo, M. Tidal energy Round Robin” tests comparisons between towing tank and circulating tank results. Int. J. Mar. Energy 2015, 12, 87–109. [Google Scholar] [CrossRef]
- Rambabu, M.; Rao, S.N.; Sundar, V. Current-induced scour around a vertical pile in cohesive soil. Ocean Eng. 2003, 30, 893–920. [Google Scholar] [CrossRef]
- Whelan, J.I.; Graham, J.M.R.; Peiró, J. A free-surface and blockage correction for tidal turbines. J. Fluid Mech. 2009, 624, 281–291. [Google Scholar] [CrossRef]
- Yu, C.L. The System Design and parameter Study of Circulating Water Channel. Master Thesis, Harbin Engineering University, Harbin, China, 2009. (In Chinese). [Google Scholar]
- Zhao, M.; Cheng, L.; Zang, Z. Experimental and numerical investigation of local scour around a submerged vertical circular cylinder in steady currents. Coast. Eng. 2010, 57, 709–721. [Google Scholar] [CrossRef]
- Kitsikoudis, V.; Kirca, V.O.; Yagci, O.; Celik, M.F. Clear-water scour and flow field alteration around an inclined pile. Coast. Eng. 2017, 129, 59–73. [Google Scholar] [CrossRef]
- Yao, W.; An, H.; Draper, S.; Cheng, L.; Harris, J.M. Experimental investigation of local scour around submerged piles in steady current. Coast. Eng. 2018, 142, 27–41. [Google Scholar] [CrossRef]
- Chen, L. Wake of Horizontal Axis Tidal Current Turbine and Its Effects on Scour. Ph.D. Thesis, University of Malaya, Kuala Lumpur, Malaysia, 2017. [Google Scholar]
- Raaijmakers, T.; Rudolph, D. Time-dependent scour development under combined current and waves conditions-laboratory experiments with online monitoring technique. In Proceedings of the 4th International Conference on Scour and Erosion (ICSE-4), Tokyo, Japan, 5–7 November 2008; pp. 152–161. [Google Scholar]
- Najafzadeh, M.; Balf, M.R.; Tafarojnoruz, A. Prediction of riprap stone size under overtopping flow using data-driven models. Int. J. River Basin Manag. 2018, 16, 505–512. [Google Scholar] [CrossRef]
- Najafzadeh, M.; Shiri, J.; Rezaiebalf, M. New expression-based models to estimate scour depth at clear water conditions in rectangular channels. Mar. Georesour. Geotechnol. 2017, 36, 227–235. [Google Scholar] [CrossRef]
- Najafzadeh, M.; Barani, G.; Hessami, M.R.H. Estimation of pipeline scour due to waves by GMDH. J. Pipeline Syst. Eng. Pract. 2014, 5. [Google Scholar] [CrossRef]


| Tip Clearance (C/Dt) | Proposed Equation (Vtb/V∞) | Previous Works (Vmax/V∞) | Variation (%) |
|---|---|---|---|
| 1.0 Dt | 104.56 | 105.25 | −0.50 |
| 0.8 Dt | 105.57 | 105.53 | 0.03 |
| 0.6 Dt | 107.14 | 106.00 | 1.07 |
| 0.4 Dt | 109.96 | 106.69 | 3.06 |
| Flow Parameters | Bahaj et al. [29] | 1:10th Scaled Model |
|---|---|---|
| Rotor diameter (Dt) | 0.8 m | 0.08 m |
| Flow depth (hf) | 1.2 m | 0.25 m |
| Free flow velocity (V∞) | 0.7 m/s | 0.22 m/s |
| Depth-based Reynolds number (Rehf) | 8.4 × 10⁵ | 0.55 × 10⁵ |
| Chord-based Reynolds number (Re0.7) | 7.9 × 10⁴ | 0.25 × 10⁴ |
| Radius-based Reynolds number (Re∞) | 5.6 × 10⁵ | 0.18 × 10⁵ |
| Cylinder-based Reynolds number (ReDs) | — | 2200 |
| Froude number (Fr) | 0.25 | 0.25 |
| Tip Speed Ratio (TSR) | 5 | 5 |
| Rotational speed (RPM) | 84 rpm | 263 rpm |
| Experimental Parameters | Details |
|---|---|
| Rotor diameter (Dt) | 0.08 m |
| Hydrofoil | NACA 63-8XX |
| Number of blades (N) | 3 |
| Tip clearance (C) | 0.25 Dt, 0.50 Dt, 0.75 Dt, 1 Dt |
| Tip speed ratio (TSR) | 5 |
| Rotational speed (RPM) | 263 rpm |
| Coefficient of thrust (Ct) | 0.825 |
| Direction of rotation | Anti-clockwise |
| Support structure diameter (Ds) | 0.01 m |
| Free flow velocity (V∞) | 0.22 m/s |
| Water depth (hf) | 0.25 m |
| Water channel width (Lw) | 0.25 m |
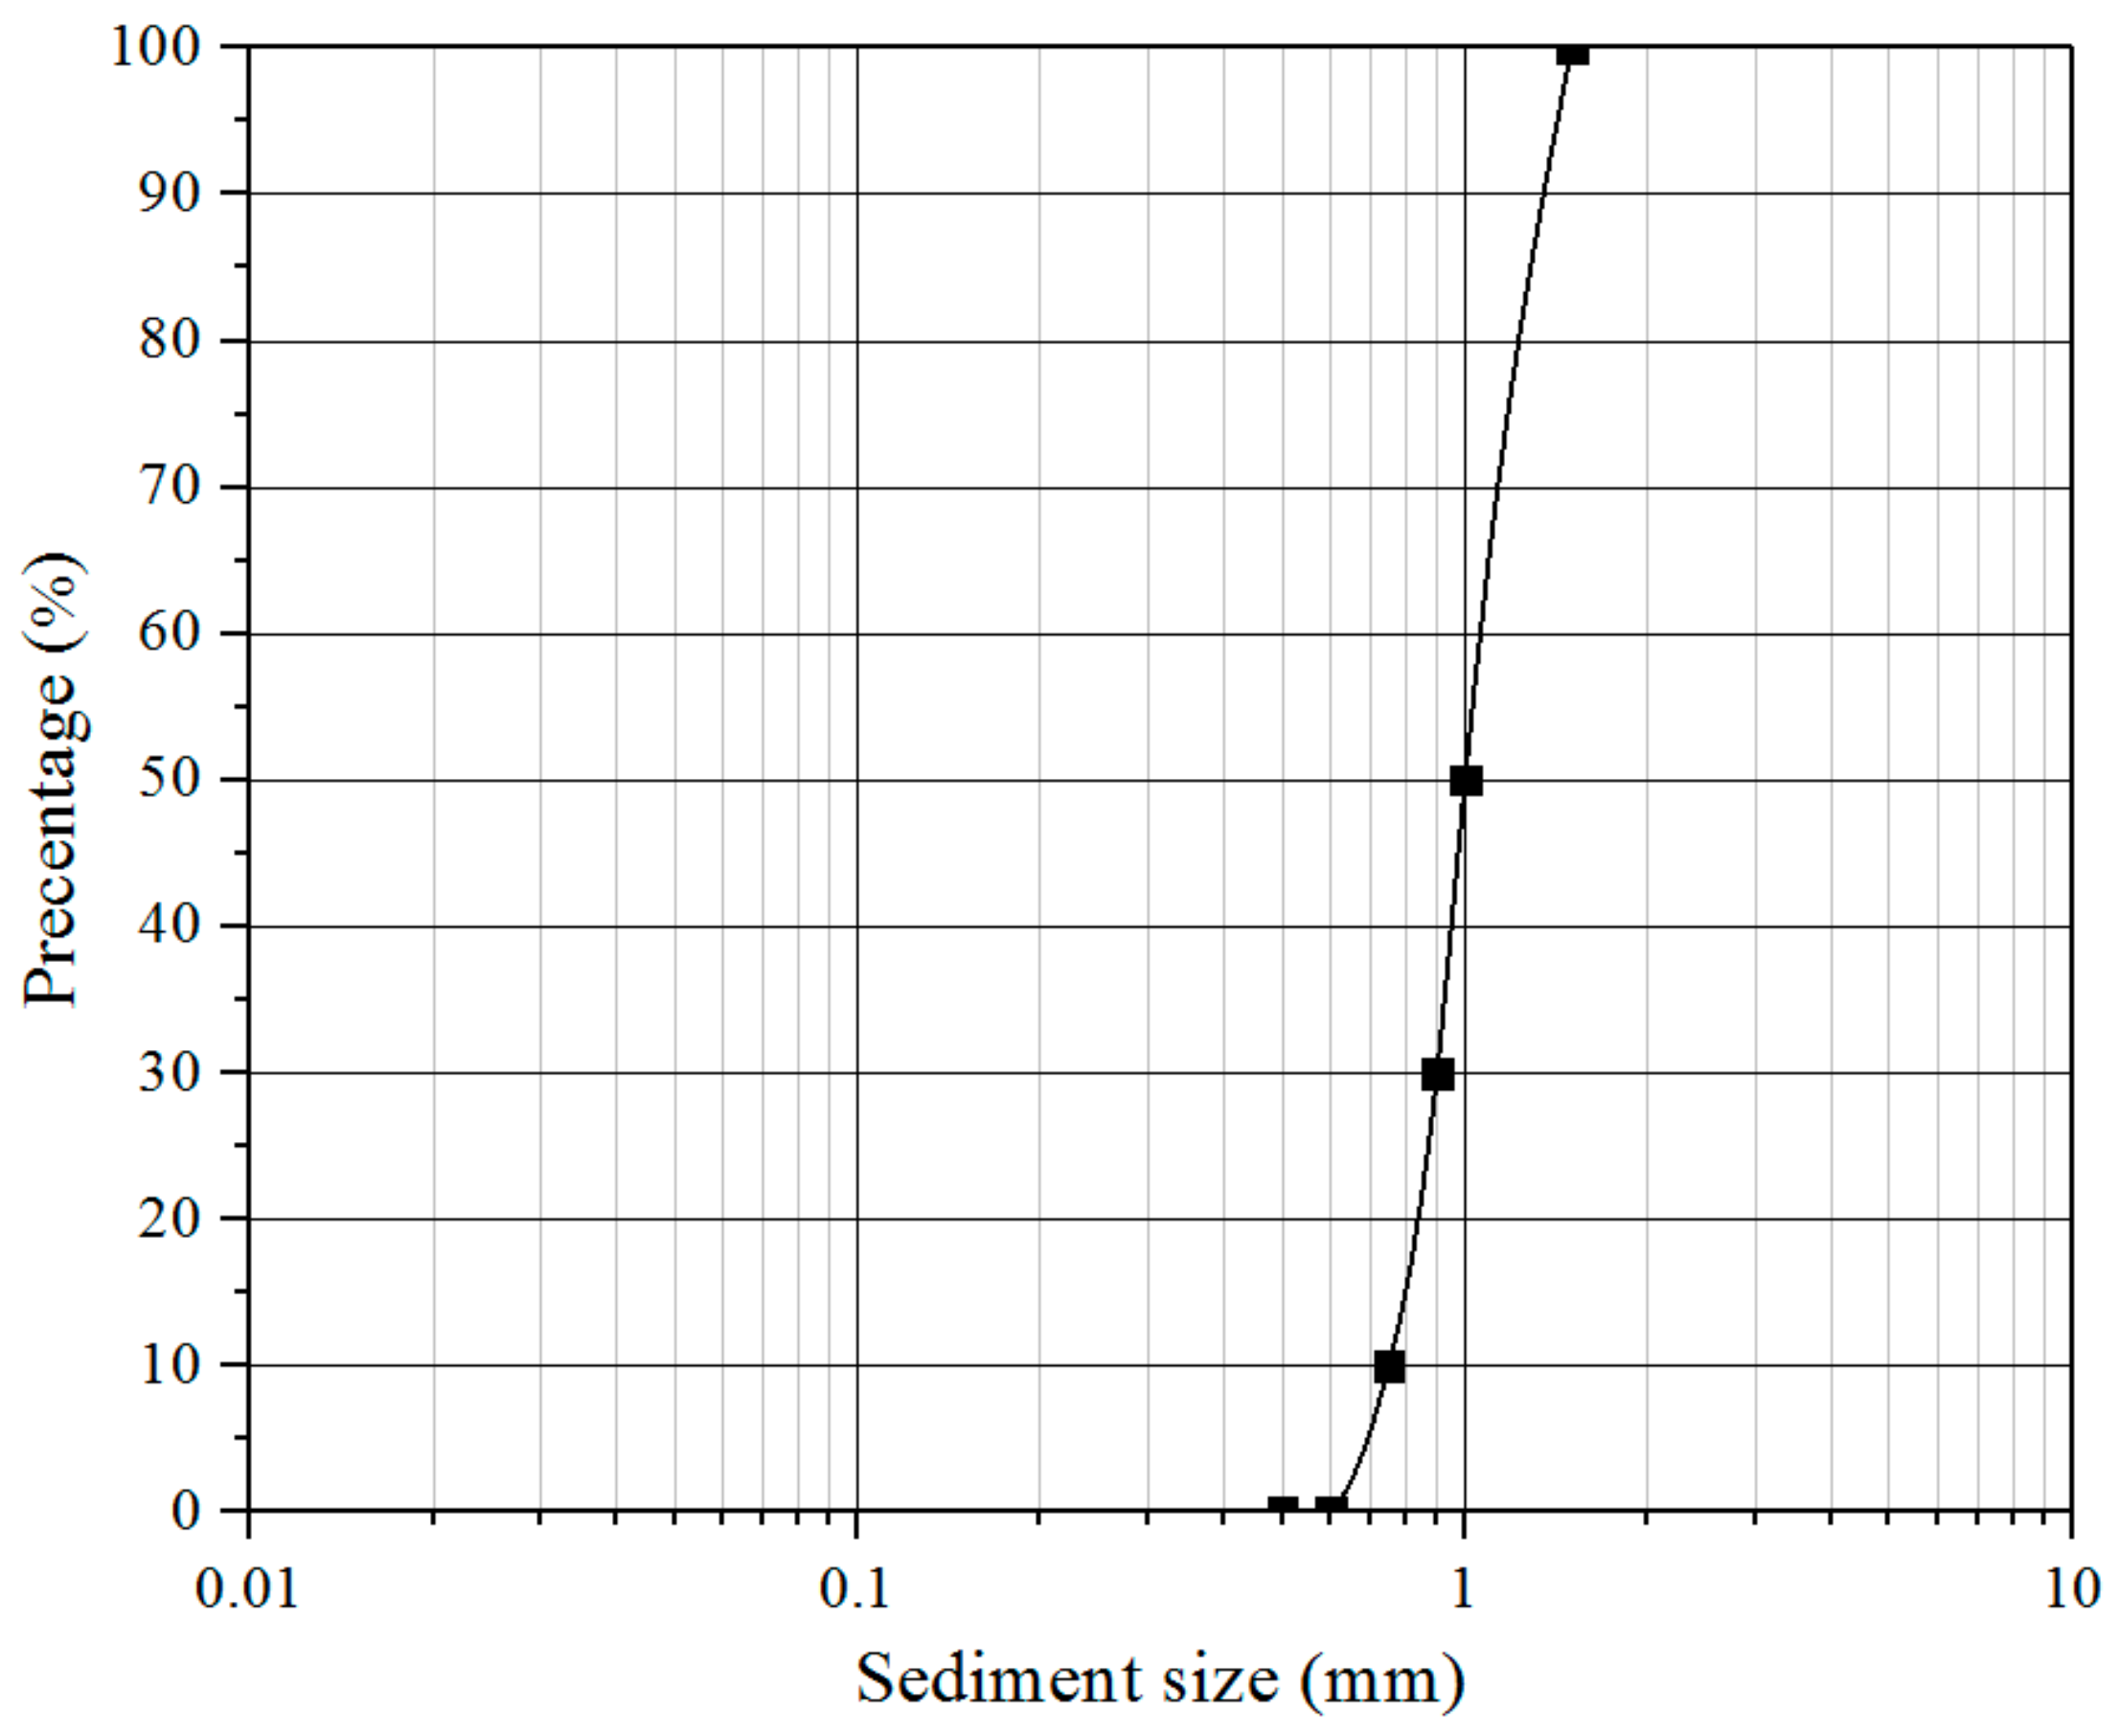
| Mean sediment grain diameter (d50) | 1.0 mm |
| Scour Parameters | Tidal Turbine Scour | Cylinder Scour | |||
|---|---|---|---|---|---|
| C/Dt = 0.5 | C/Dt = 1.0 | Zhao et al. (2010) [35] | Kitsikoudis et al. (2017) [36] | Yao et al. (2018) [37] | |
| Scour depth | 1.42 Ds | 0.9 Ds | 1.11 Ds | 1.0 Ds | 1.0 Ds |
| Length of sand pit | 7.5 Ds | 5.5 Ds | 4.06 Ds | 4.72 Ds | 5.97 Ds |
| Height of sand dunes | 0.976 Ds | 1.05 Ds | 0.56 Ds | 0.65 Ds | 0.36 Ds |
| Previous Works | Pile or Pier Scour Equation | Proposed Turbine Scour Equation |
|---|---|---|
| Neil (1973) [7] | ||
| Breusers et al. (1977) [8] | ||
| Richardson et al. (1993) [10] | ||
| Raaijmakers and Rudolph (2008) [39] |
| Clearance | Source | Predicted Scour Depth (S/Ds) | Measured Scour Depth (S/Ds) | Variation |
|---|---|---|---|---|
| 0.35 Dt | Hill et al. (2014) [22] | 1.95 | 2.04 | 4.62% |
| 0.50 Dt | Chen (2017) [38] | 1.56 | 1.48 | 5.13% |
| 0.75 Dt | Chen (2017) [38] | 1.22 | 1.28 | 4.92% |
| 1.00 Dt | Chen (2017) [38] | 1.03 | 1.28 | 24.27% |
| Equation | R | MAE | RMSE | SI |
|---|---|---|---|---|
| 0.944 | 0.085 | 0.142 | 0.081 |
© 2019 by the authors. Licensee MDPI, Basel, Switzerland. This article is an open access article distributed under the terms and conditions of the Creative Commons Attribution (CC BY) license (http://creativecommons.org/licenses/by/4.0/).
Share and Cite
Zhang, T.; Lam, W.H.; Cui, Y.; Jiang, J.; Sun, C.; Guo, J.; Ma, Y.; Wang, S.; Lam, S.S.; Hamill, G. Tip-Bed Velocity and Scour Depth of Horizontal-Axis Tidal Turbine with Consideration of Tip Clearance. Energies 2019, 12, 2450. https://doi.org/10.3390/en12122450
Zhang T, Lam WH, Cui Y, Jiang J, Sun C, Guo J, Ma Y, Wang S, Lam SS, Hamill G. Tip-Bed Velocity and Scour Depth of Horizontal-Axis Tidal Turbine with Consideration of Tip Clearance. Energies. 2019; 12(12):2450. https://doi.org/10.3390/en12122450
Chicago/Turabian StyleZhang, Tianming, Wei Haur Lam, Yonggang Cui, Jinxin Jiang, Chong Sun, Jianhua Guo, Yanbo Ma, Shuguang Wang, Su Shiung Lam, and Gerard Hamill. 2019. "Tip-Bed Velocity and Scour Depth of Horizontal-Axis Tidal Turbine with Consideration of Tip Clearance" Energies 12, no. 12: 2450. https://doi.org/10.3390/en12122450