1. Introduction
The reduction of energy consumption and the related CO
2 emissions in the building sector are the main global environmental concerns in long-term perspective for sustainable development [
1]. The building sector is the largest energy consumer in the world with approximately one third of the global final energy consumption and it is expected to grow closely with the increase of living standards [
1,
2]. This tendency is highly affected by the following key drivers that include the growth of the world population (41%), the increase in households that require energy (115%) and the increase in floor area per capita (50%) by 2050 [
2].
Regarding these global energy trends in buildings, 24% of the global final energy demand comes from the residential sub-sector while the 8% remaining comes from commercial [
2]. In addition, in developed countries, such as the European ones, the residential sector represents 41% of the final energy consumption and 40% of the total greenhouse gas (GHG) emissions [
3].
In agreement with the European Union (EU) 2030 targets [
4] in reducing the energy demand of buildings and preserving the environment through sustainable development, on one hand there are European renewable energy action plans [
5] that encourage uptake active energy saving systems, such as renewable heating technologies. On the other hand, efficient building envelopes [
6], building shape and orientation [
7] are also promoted with the same aim, such as potential passive energy saving systems by international energy directives.
Latest comprehensive literature reviews concerning both, European and global heating and cooling energy trends in buildings [
2,
8,
9] pointed out the main key drivers that affect their final thermal energy use. The foremost in the residential sector are the number of households, person per household, floor space per capita and specific energy consumption for residential heating and cooling [
2]. Only the last driver allows stakeholders (engineers, architects, building contractors, homeowners, etc.) to have a direct impact on reducing the energy demand of buildings.
The EU building stock is very heterogeneous in terms of designs, construction systems, construction periods and equipped with a large variety of different heating and cooling systems [
10,
11]. Due to these facts there is still scarce and controversial information in the open source database that contains the characteristics of European building stock and their specific final energy consumption. In addition, there is a lack of studies that provide cross-country comparisons referring to the thermal properties of building envelopes, their energy demand and their CO
2 emissions. Only one study carried out by Csoknyai et al. in 2016 [
11] encompasses a similar comparative analysis for four Eastern countries: Bulgaria, Serbia, Hungary and the Czech Republic. These authors provided the total energy need for heating of the overall residential building stock by country, as well as the energy demand for heating and domestic hot water for the different building typologies. In their study, the building typologies were sorted by seven different building classes: three types of single family houses and four types of multi-flat buildings. All of them were grouped by the year of construction period in the following manner: before 1944, between 1945 and 1989 and after 1990.
Moreover, the scarce and controversial information about the characteristics of the building stock in the EU and the lack of tools to evaluate their energy demands [
12] represent a crucial limitation to evaluate the potential applicability of new and innovative technologies such as solar energy when implemented in real case scenarios. These technologies, which basically are based on renewable energy sources for heating, cooling and domestic hot water (DHW) in buildings, cannot be compared against conventional existing systems because of the missing benchmark scenario about the building characteristics and their energy demands. Frayssinet et al. (2018) [
12] concluded in their study that there are still not entirely validated tools that are able to accurately and explicitly simulate the power demand of urban buildings at city scale.
Since space heating and domestic hot water represent the major final energy consumption by households in Europe [
2], specifically 79.2% [
13], the importance of their reduction while maintaining indoor thermal comfort are key priorities in the future building scenario for promoting energy efficiency in the residential sector [
14]. Thus, a free access data source that includes a building stock classification and allows the benchmarking in terms of energy demand for the defined building typologies and climate conditions must be created. This process should be carried out first at national and then at EU level to stablish a comparative framework in terms of quantitative values. In addition, free access data sources may help to improve the current limitations in the modelling of heat flow and the household behaviours, which are key parameters for policy makers in terms of investment decisions and energy using practices [
15].
In this context, the first objective of this paper is to provide a study about the current classification of the building stock in Europe. The scope of the study will include information on types of residential buildings for Germany, France, UK, Italy, Spain and Sweden. The study will include the specific details on their architecture, building envelope, floor space and insulation properties. The second objective of this paper consists in performing a cross-country comparison in terms of energy demand, specifically for space and water heating that are the major energy consumer systems in the residential sub-sector [
16]. The related CO
2 emissions for the different building typologies in different climate conditions are also included in this study. This work establishes a base framework to be used in future studies to evaluate the potential applicability of new and innovative renewable technologies compared to the existing ones.
2. Materials and Methods
All data used in this paper was obtained from three consecutive projects co-funded by the Intelligent Energy Europe Programme (IEE) [
17], the new EU Building Stock Observatory [
18] and the project Polices to Enforce the Transition to Nearly Zero Energy Buildings in the EU-27 (ENTRANZE) [
19]. They include all the data regarding buildings from EU projects, national statistics, EPC databases, city sustainable energy action plans and industry data. All of these projects concentrate public information regarding the residential building stock characteristics at both, national and European levels.
2.1. IEE Project DATAMINE (2006–2008)
This project aimed at improving the knowledge about the energy performance of building stocks forming a data structure for exchanging information. It intended to stimulate large-scale monitoring activities using energy performance certificates (approximately 19,000) as data source. All in all, the DATAMINE data structure is a suitable approach for the energy performance of buildings (EPBD) related data comparison and monitoring activities in the building sector on regional, national and European level, thus was successfully applied in 12 projects in 12 European countries.
2.2. IEE Project TABULA (2009–2012)
The main goal of TABULA was to make an agreed systematic approach to classify building stocks according to their energy related properties. The core of this project was based on the DATAMINE structure. Within the TABULA project, residential building typologies have been defined for 20 European countries [
20]. Each national typology consists of a classification grouping buildings according to their size, age and further technical construction parameters. Each typology is represented by a set of exemplary buildings per every national stock. This classification will also include the typical energy consumption for the given buildings, the showcase calculation of the possible energy savings and the common supply systems; regarding DHW, heating and cooling.
2.3. IEE Project EPISCOPE (2013–2016)
This project takes building typologies defined into the TABULA project as a basis for building stock monitoring activities. The main project activity was to track the energy-related refurbishment progress of certain housing stock entirely and to extend the building typologies developed in TABULA project to further countries. Including a classification scheme, showcase example buildings, building stock and supply systems statistics. In addition, three different refurbishment levels were determined to evaluate information about the actual energy consumption of the considered housing stocks.
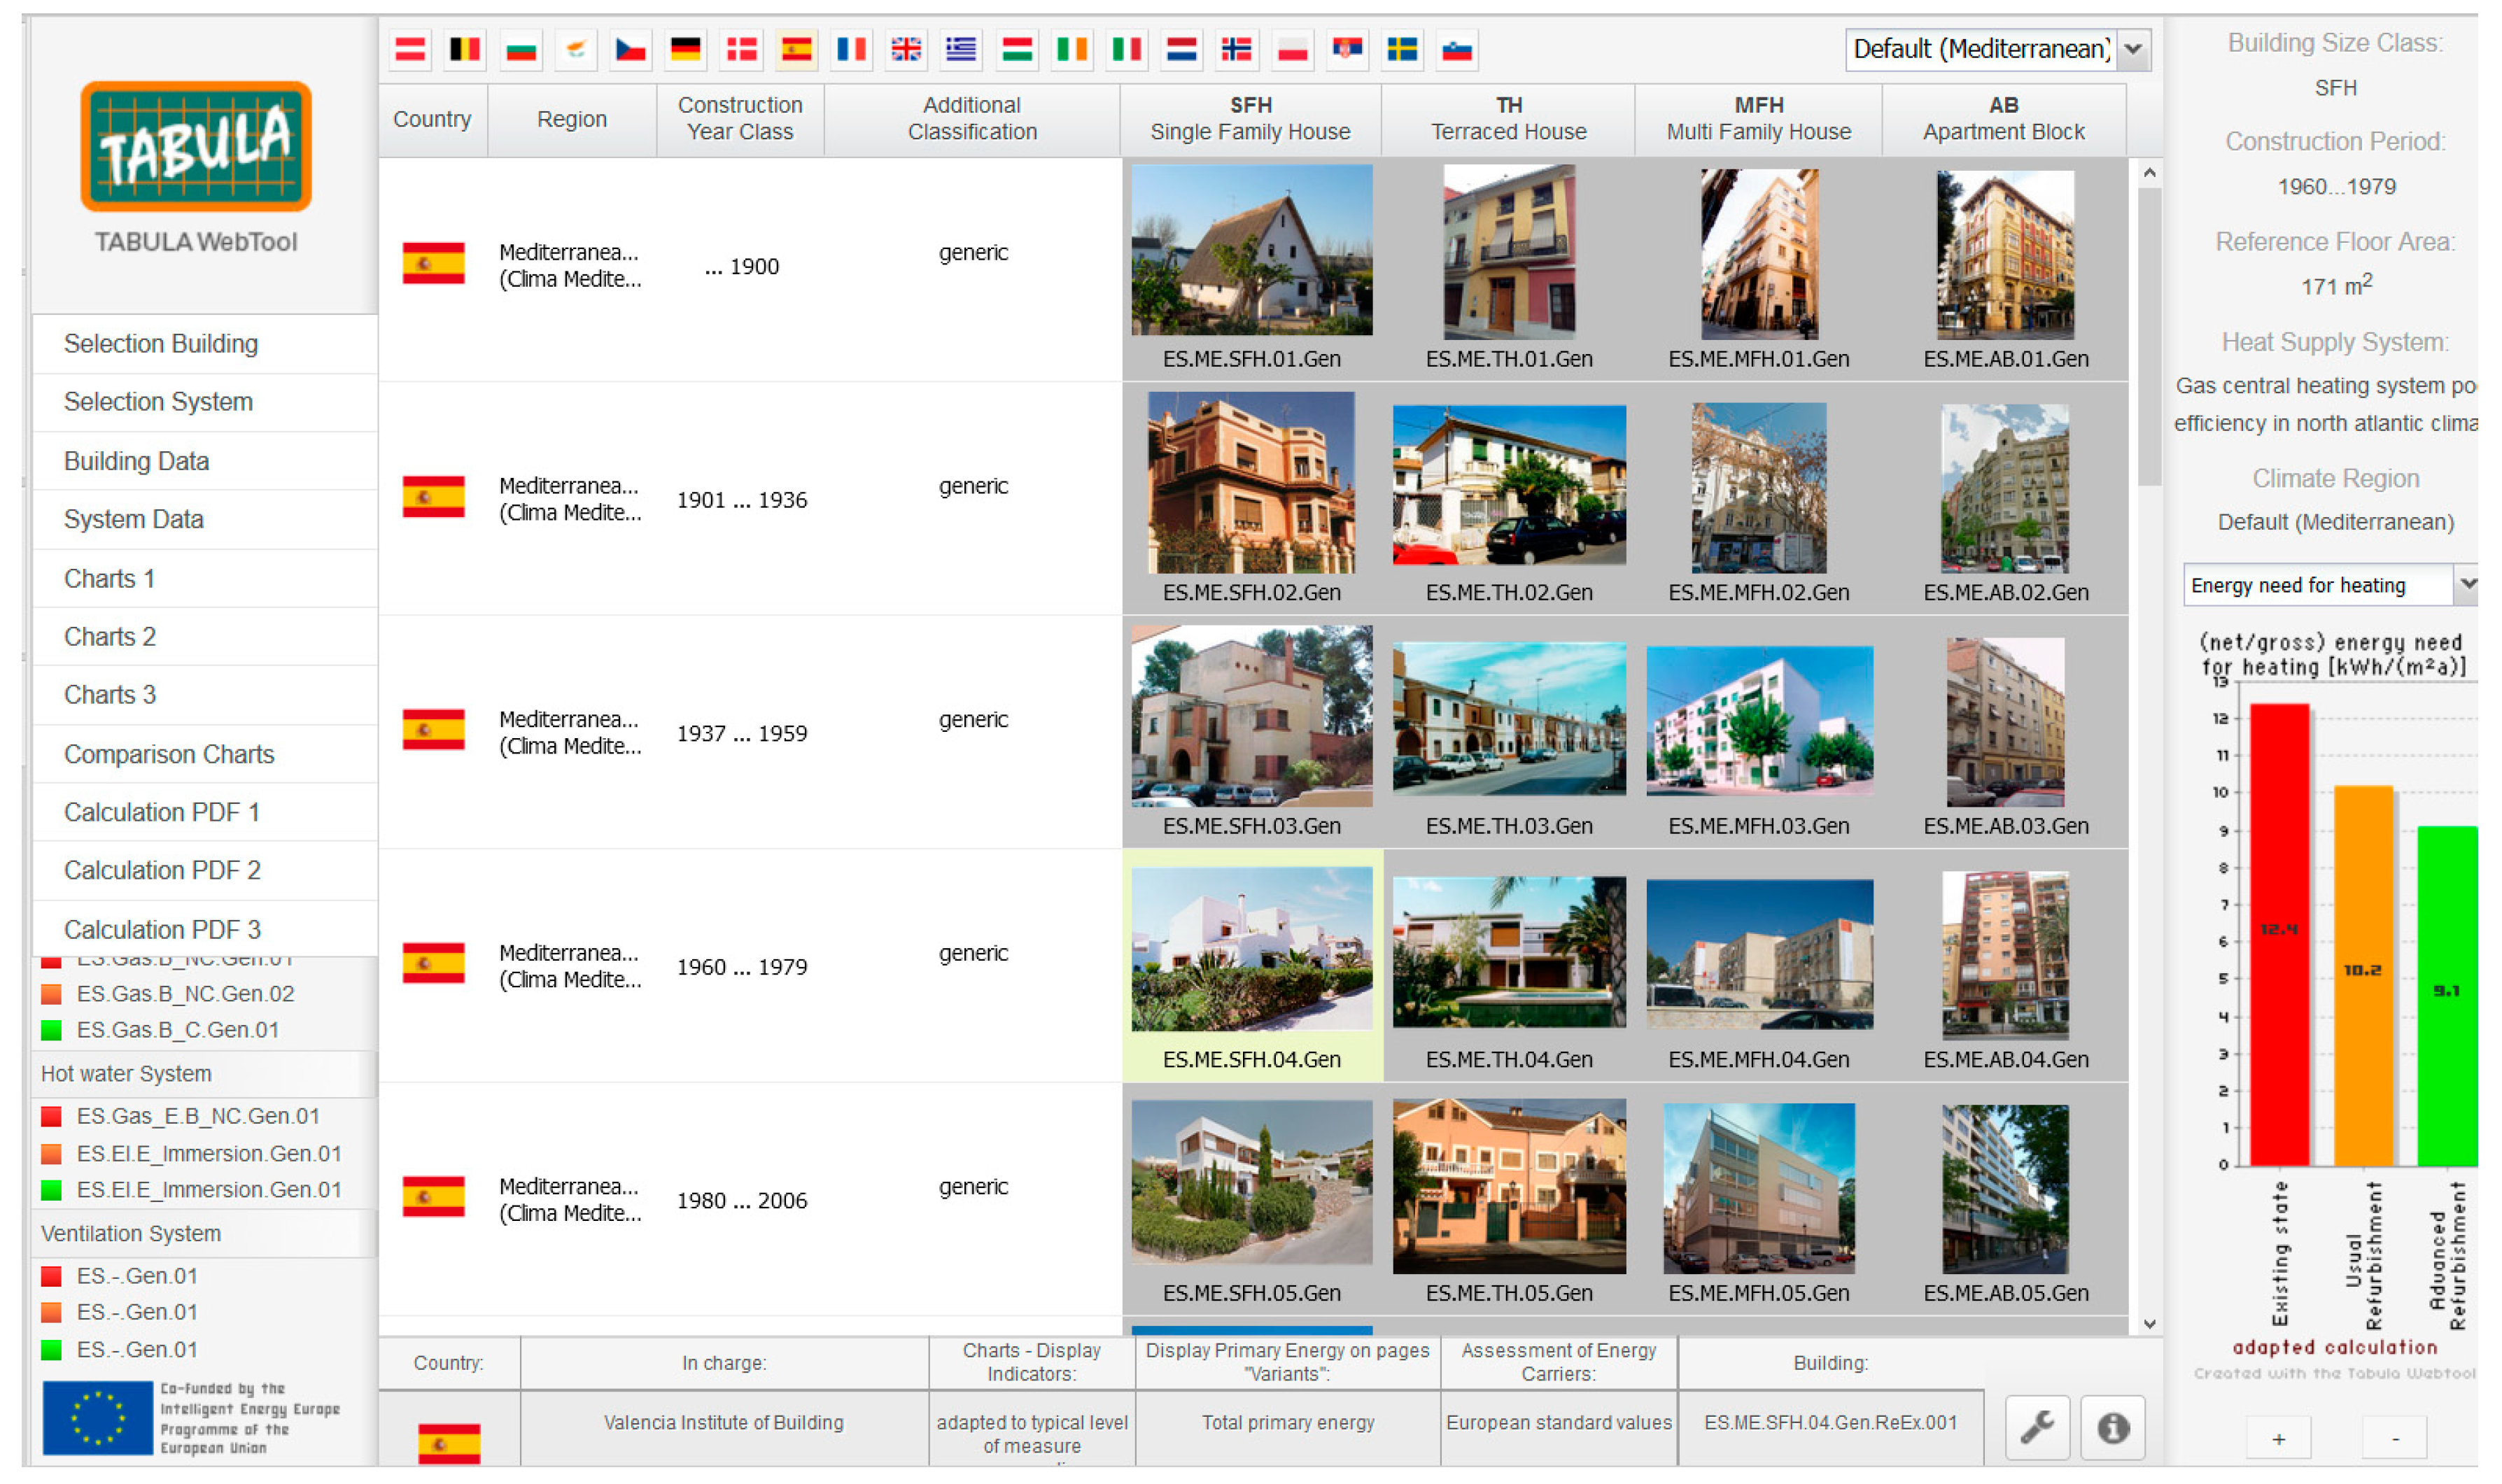
2.4. Tabula WebTool
The main outcome of the three aforementioned projects founded by the IEE was a successfully database named TABULA Web tool [
19] (
Figure 1), which was created to share valuable information with the scientific community and building experts from European countries.
The interactive tool allows to establish online calculations displaying the energy related features and the potential energy savings by implementing passive and active refurbishment measures of the exemplary buildings from all EU countries. The main provided features are the following:
The EU residential building stock organized by type of building, size and age classes.
Technical data regarding the construction characteristics of the exemplary buildings such as the visual appearance and the common construction elements (roof, walls, floors and windows) and their thermal transmittances.
Technical data regarding the common heat supply systems and their energy performance indicators.
Typical values for the energy consumption by energy carriers.
Energy saving measurements on two quality levels (usual and advanced refurbishment levels) and their impact on the energy consumption.
Complete technical information related to the EU building stock characteristics and reliable data on their energy related features are presented and evaluated in TABULA WebTool. However, the calculation method is only focused on the energy use for space heating and domestic hot water of residential buildings. Hence, cooling, air conditioning, lighting and electric appliances are still not considered in this tool but can be easily added in the future [
22].
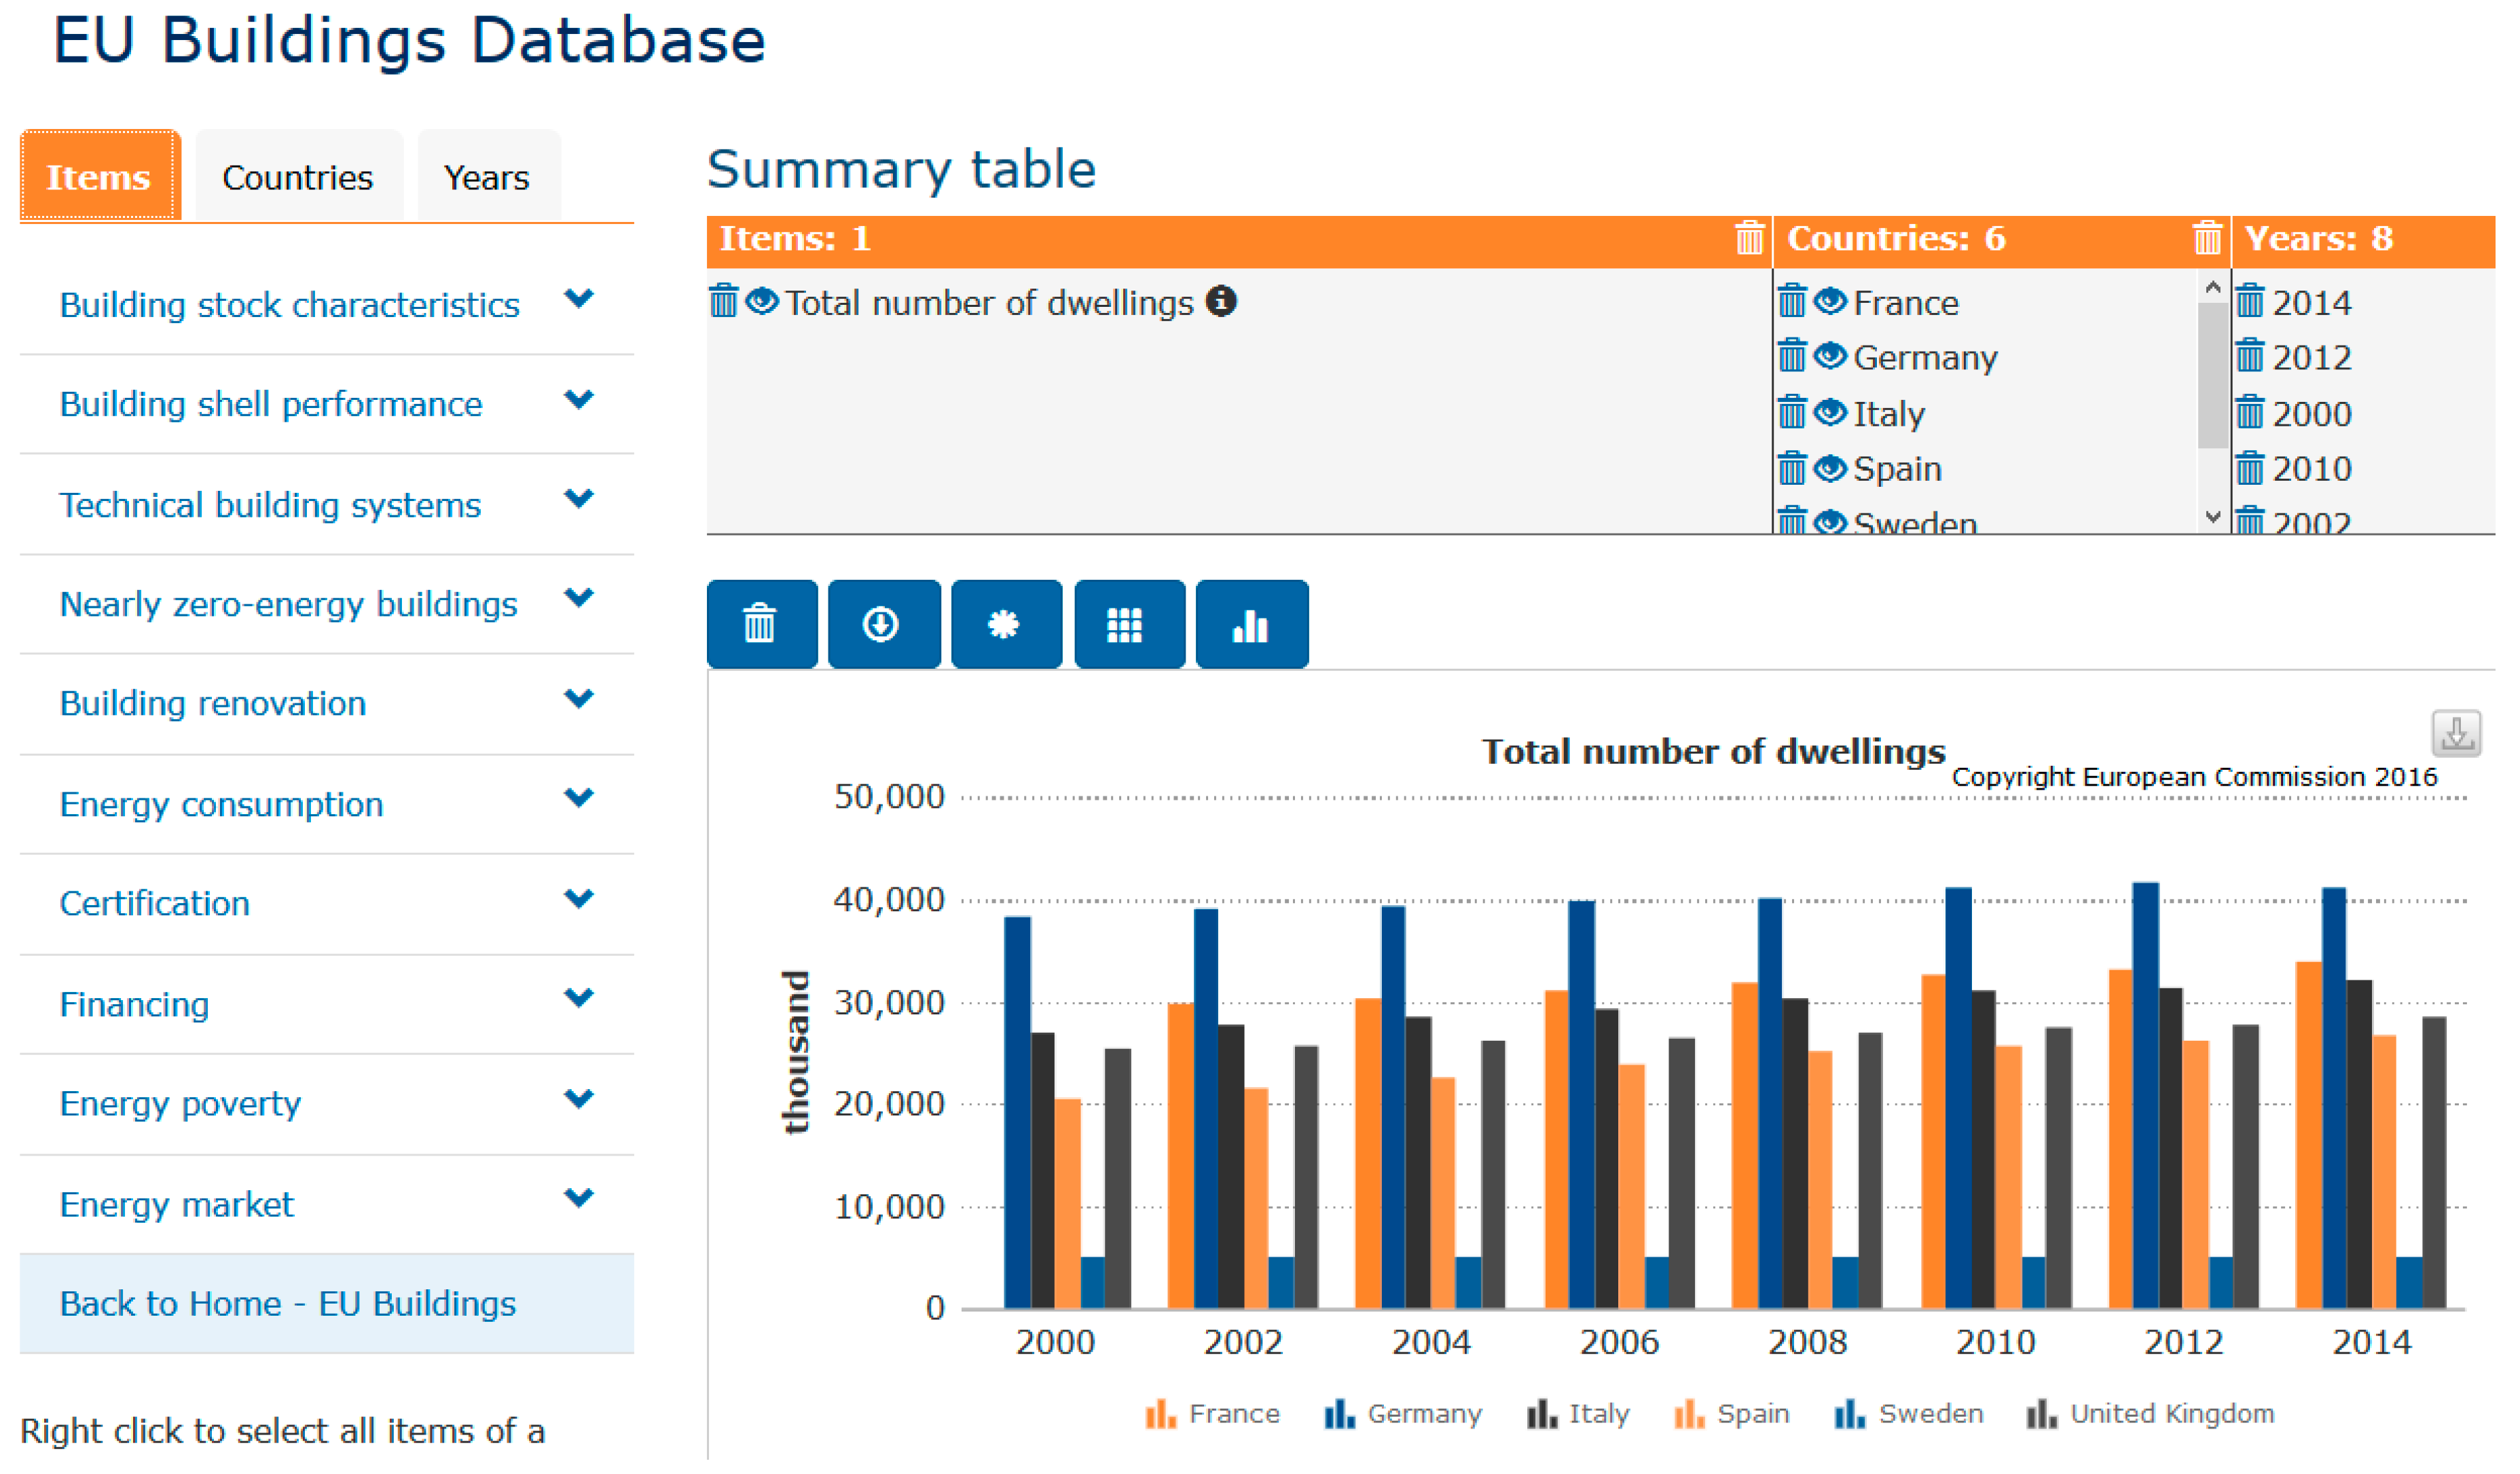
2.5. EU Building Stock Observatory
Since the Buildings Performance Institute Europe (BPIE) [
23] closed the DATA HUB for the energy performance of buildings, all data in the HUB were transferred and updated to a new interface (
Figure 2) in the European Commission webpage [
18].
This data source was developed for the European Commission by BPIE in collaboration with Ecofys, ECN, Enerdata, Seven and many national partners. Besides providing and monitoring the energy performance of the building stock characteristics in Europe, the Observatory assesses improvements in the energy efficiency levels in buildings in EU countries. Additionally, it allows numerical and visual comparisons by using the massive database and the data mapper tools available online [
18]. The new data base provides an easy comparison among many different topics (items) sorted by countries and years. Building stock characteristics, building shell performance, technical building systems, energy consumption and energy poverty, are some of them (
Figure 2). Moreover, it provides information regarding the available financing for building renovation and evaluates the energy poverty levels across the EU28.
The main advantage of this database compared to TABULA, is the organization by topics or indicators (items tab in the left menu,
Figure 2) and the comprehensive data available. Users can easily obtain an overall idea of the energy trends, number of dwellings and so forth for both residential and non-residential buildings. This database includes additional information compared to TABULA database such as the energy consumption of space cooling, cooking, lighting and water consumption. Nevertheless, the Observatory provides rough numbers that makes more difficult the comparison when approaches for specific case studies are planned. The main drawbacks are the lack of updated data (only available until 2014) and the missing information about some indicators such as energy use per building, average values about the thermal transmittance of walls, floors, roofs, windows and so forth. This information is also missing for many EU countries (e.g. UK, France, Italy, Germany, etc.). Finally, the last and more important drawback is that it is not possible to select different climate conditions within a country.
3. Classification of the Residential Building Stock in EU
Valuable technical information about the benchmark of architecture of residential buildings and their energy requirements were obtained from the previously described databases. However, a standardized classification for the different residential building typologies is still not established and the literature shows a lack of standards for a cross-country comparison.
The scope of the study includes information on type of residential buildings in the five countries that accounts for 75% of dwellings in the EU 27: Germany, France, UK, Italy and Spain [
9]. These countries are also selected because they show the highest potential to reduce the energy consumption and CO
2 emissions across the EU [
13]. Furthermore, Sweden was also analysed to compare the results of these countries against a country with very cold climate conditions.
Within this context, Sousa et al. (2017) [
15] divided the UK residential housing stock into five big groups: terraced (28%), bungalow (9%), semi-detached (26%), detached (17%) and apartments (20%). They used the traditional characterization of the building stock in UK that is organized into six age intervals: pre 1919, inter-war, post-war 1950s, industrial 1970s, modern 1980s and post 2000.
Other data sources such as the EU Buildings Database [
18] classifies the EU residential buildings into detached or semi-detached for single-family houses and only distinguishes one category for multi-family houses, without any sub-category. Moreover, Theodoridou et al. [
24] categorized the residential building stock of Greece into six different classes (A, B1, B2, C, D and E) that encompasses parameters such as the year of construction, technical, political, social and historical activities. This classification was based on the analysis of statistical data provided by the Hellenic Statistical Authority (EL. STAT.) which resulted in the division by typology and their year of construction. It highlighted the importance of age criterion since it can provide reliable information about the building materials, typology and equipment directly related to the energy performance of the building. The same authors stated in their research that similar residential building classification was performed in Germany, where eight different building types were used to represent the German stock. Similar cases were observed in Denmark, Italy and Switzerland.
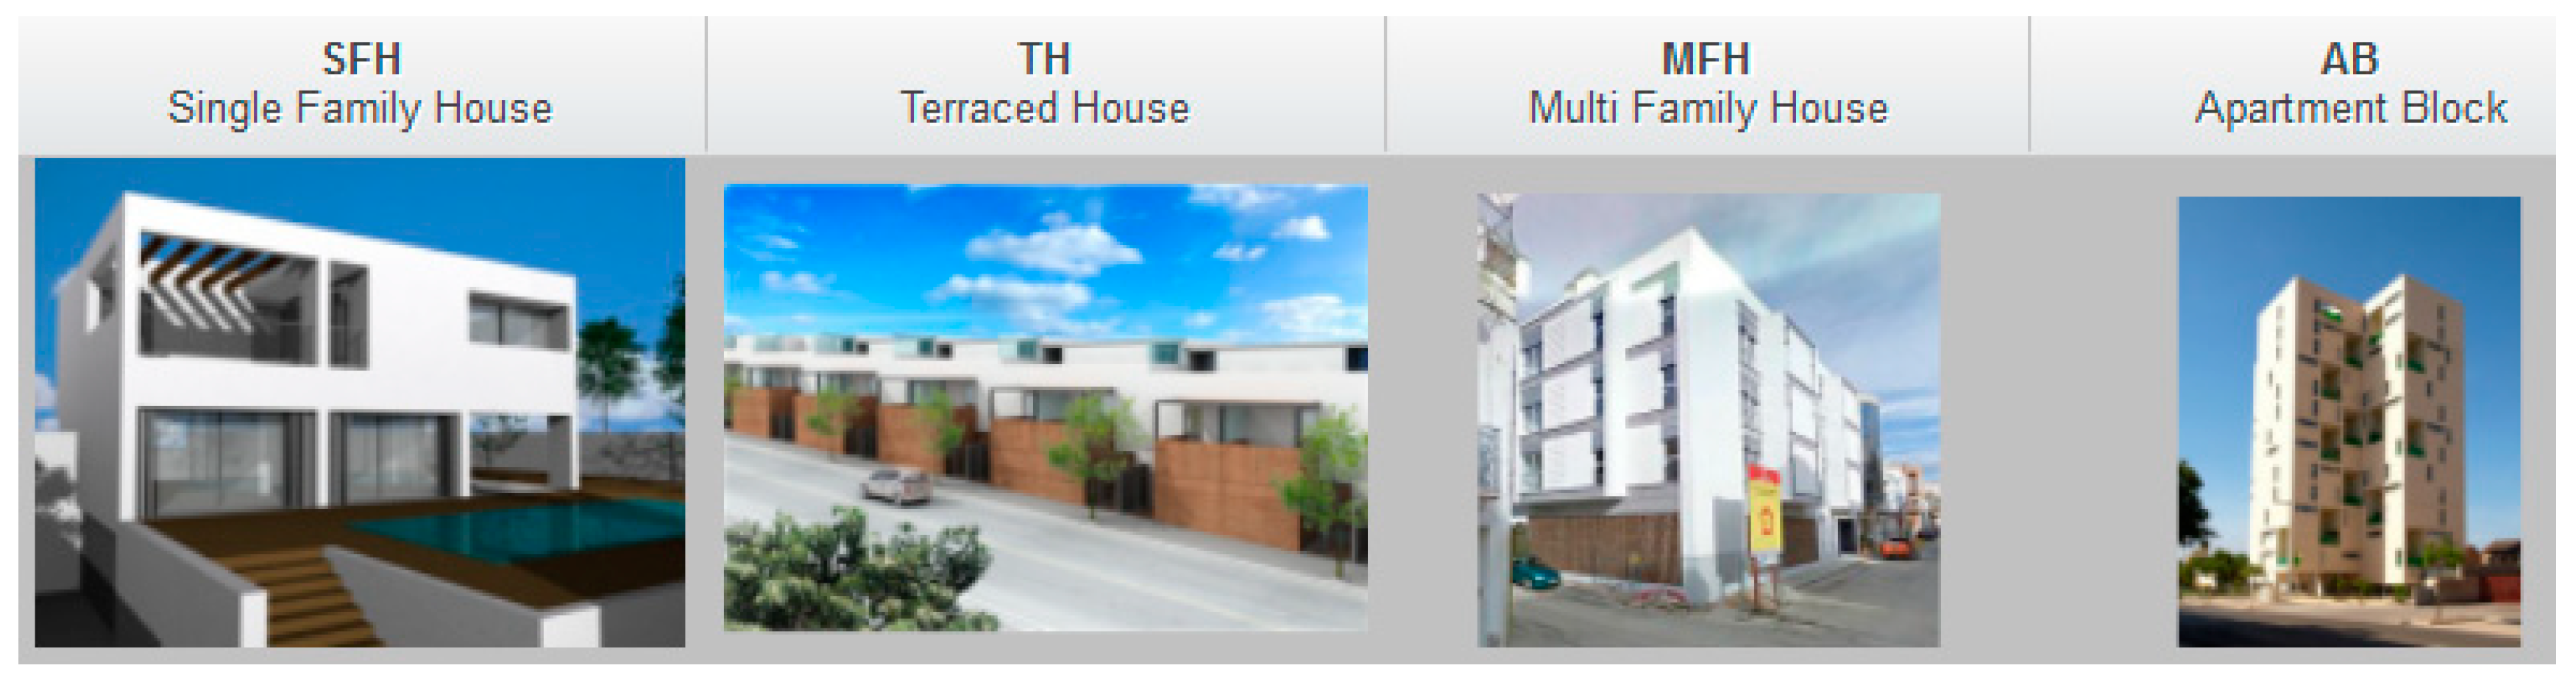
With the same aim, the project TABULA divides the EU building stock into four main typologies (
Figure 3): single family house (SFH), terraced house (TH), multifamily house (MFH) and apartment block (AB). Also, this database organizes the building stock by age and climate conditions from 20 different European countries to provide an easy cross-country comparison of building features, measurements and energy performance [
20].
Single family houses can be generally characterised as one or two floors and single flat, detached or semi-detached house, while terraced houses are defined as attached one or two floors single flat. A multi-family house is a small building typified by a limited number of apartments (2 to 5 floors and up to 20 apartments) while apartment blocks are big buildings constituted by a large number of apartments that usually are composed of more than 4 floors and 15 apartments.
The residential building classification proposed by TABULA is the most generic and reliable database because it allows the comparison of four different generic building typologies, two for single-family houses and two for multi-family houses. Additionally, each typology is subdivided in accordance with the age of construction (varies depending on the country) and two refurbishment levels. Moreover, the comprehensive building classification presented by TABULA is robust and includes the expertise of 15 EU different institutions that collaborated into the project development. They collected the information of residential buildings of 20 EU countries using the same TABULA concept. Finally, this approach was used to develop building stock models that enable the projection of the actual national building stock consumption and the energy saving potentials.
4. Main Parameters Considered for the Comparative Energy and CO2 Analysis
The main technical parameters considered in this study are the thermal transmittance in steady state of the building envelopes (W/m2·K), the floor space (m2) and the annual energy demand for heating and domestic hot water (kWh/(m2·a)), which represents the largest energy consumption in residential sector. In addition to all of the aforementioned parameters, the CO2 emissions (kg) related to these demands will be presented.
5. Results
TABULA WebTool and Building Stock Observatory present information for different age groups for each country: six in Spain, twelve in Germany, ten in France, eight in Italy and eight in UK. Therefore, an overall building classification is selected to provide a comparative analysis of the energy demand and CO2 emissions of different types of residential building. In this paper, all age classes found in the literature were grouped into three different ones, namely from 1970 to 1985, from 1986 to 2000 and from 2001 to 2016. Moreover, due to the different climates per country, the climate conditions were divided into three different classes: hot, temperate and cold. These climate conditions were selected to obtain different energy requirements for each building typology thus providing up to 143 case scenarios.
5.1. Construction Characteristics of Building Models
Notice that each building example presented in this study was based on the TABULA/EPISCOPE approach. Hence, they are the typical representative buildings that can be usually found in houses with similar age and size class.
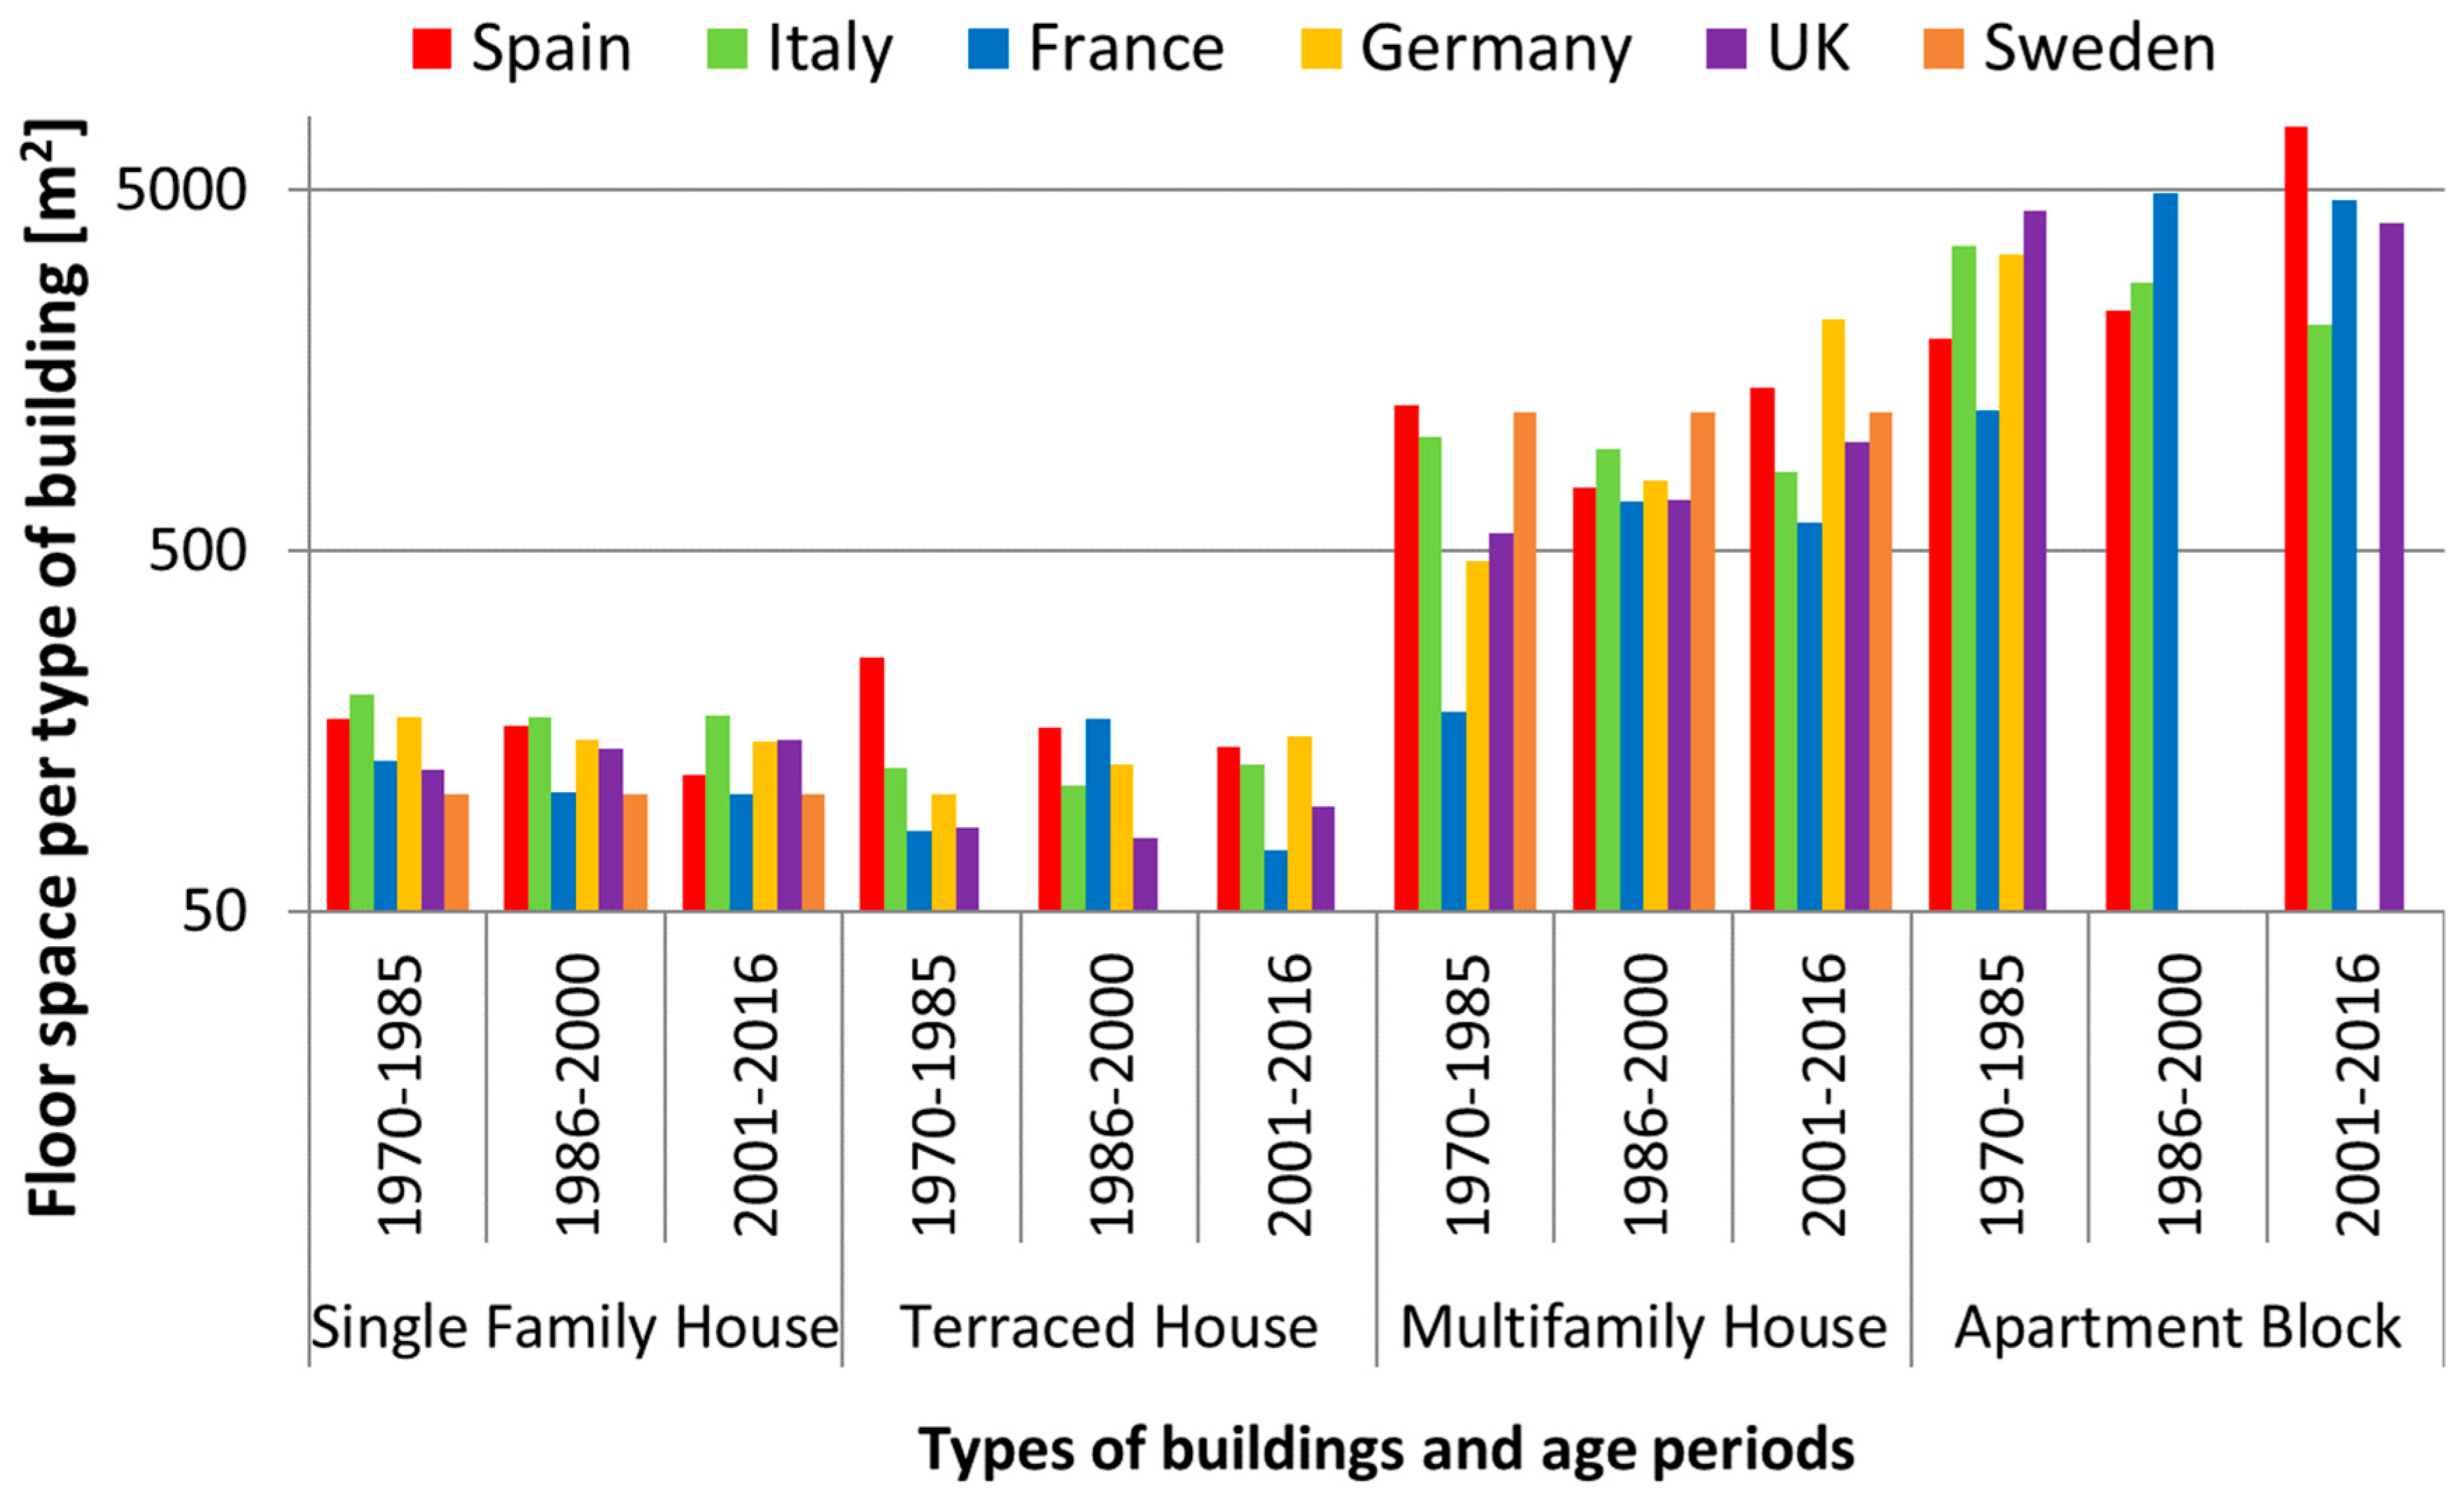
Since floor area per household (m
2) is the conditioned floor area (CFA) based on internal dimensions (measured from edges at the inside surface of external walls), its dimensions are directly correlated with the construction period, the typology of the building and the country. As it can be seen in
Figure 4, single family and terraced houses were bigger in 1970–1985 when compared with those from 2001–2016 in Spain, Germany and France. However, the opposite trend is detected on multifamily houses and apartment blocks that are becoming more popular due to the room limitations in cities, the higher price of land and the rapid growth of urban environments.
Figure 4 highlights that multifamily houses and apartment blocks have a larger CFA in comparison to single family and terraced houses, especially in new apartment blocks in Spain that have 43 times larger CFA in comparison to single family houses and 53 times more compared to terraced houses.
Table 1 shows the representative thermal transmittance values of building envelope components such as roofs, walls, floors and windows for the model buildings analysed in this paper. It provides a cross-country comparison in terms of building envelope performance and it also allows to compare them according to the type of building through the years.
On one hand, the highest thermal transmittance of these construction components can be found in UK walls (1.60 W/m2·K) and Spanish roofs (4.17 W/m2·K) for single family houses (1970–1985). A substantial reduction of the thermal transmittance on those construction systems were achieved by 2001–2016 periods, where UK walls and Spanish roofs of single family houses are 0.35 W/m2·K and 0.48 W/m2·K, respectively. These reductions can be attributed to the application of European and national energy policies towards more efficient buildings, which also had a direct impact on reducing the energy demand of buildings. On the other hand, the lowest thermal transmittance values for roofs and walls were detected in single family houses in Sweden, 0.21 W/m2·K and 0.13 W/m2·K, respectively. As expected, the coldest country have higher levels of insulation in the walls due to higher space heating demands.
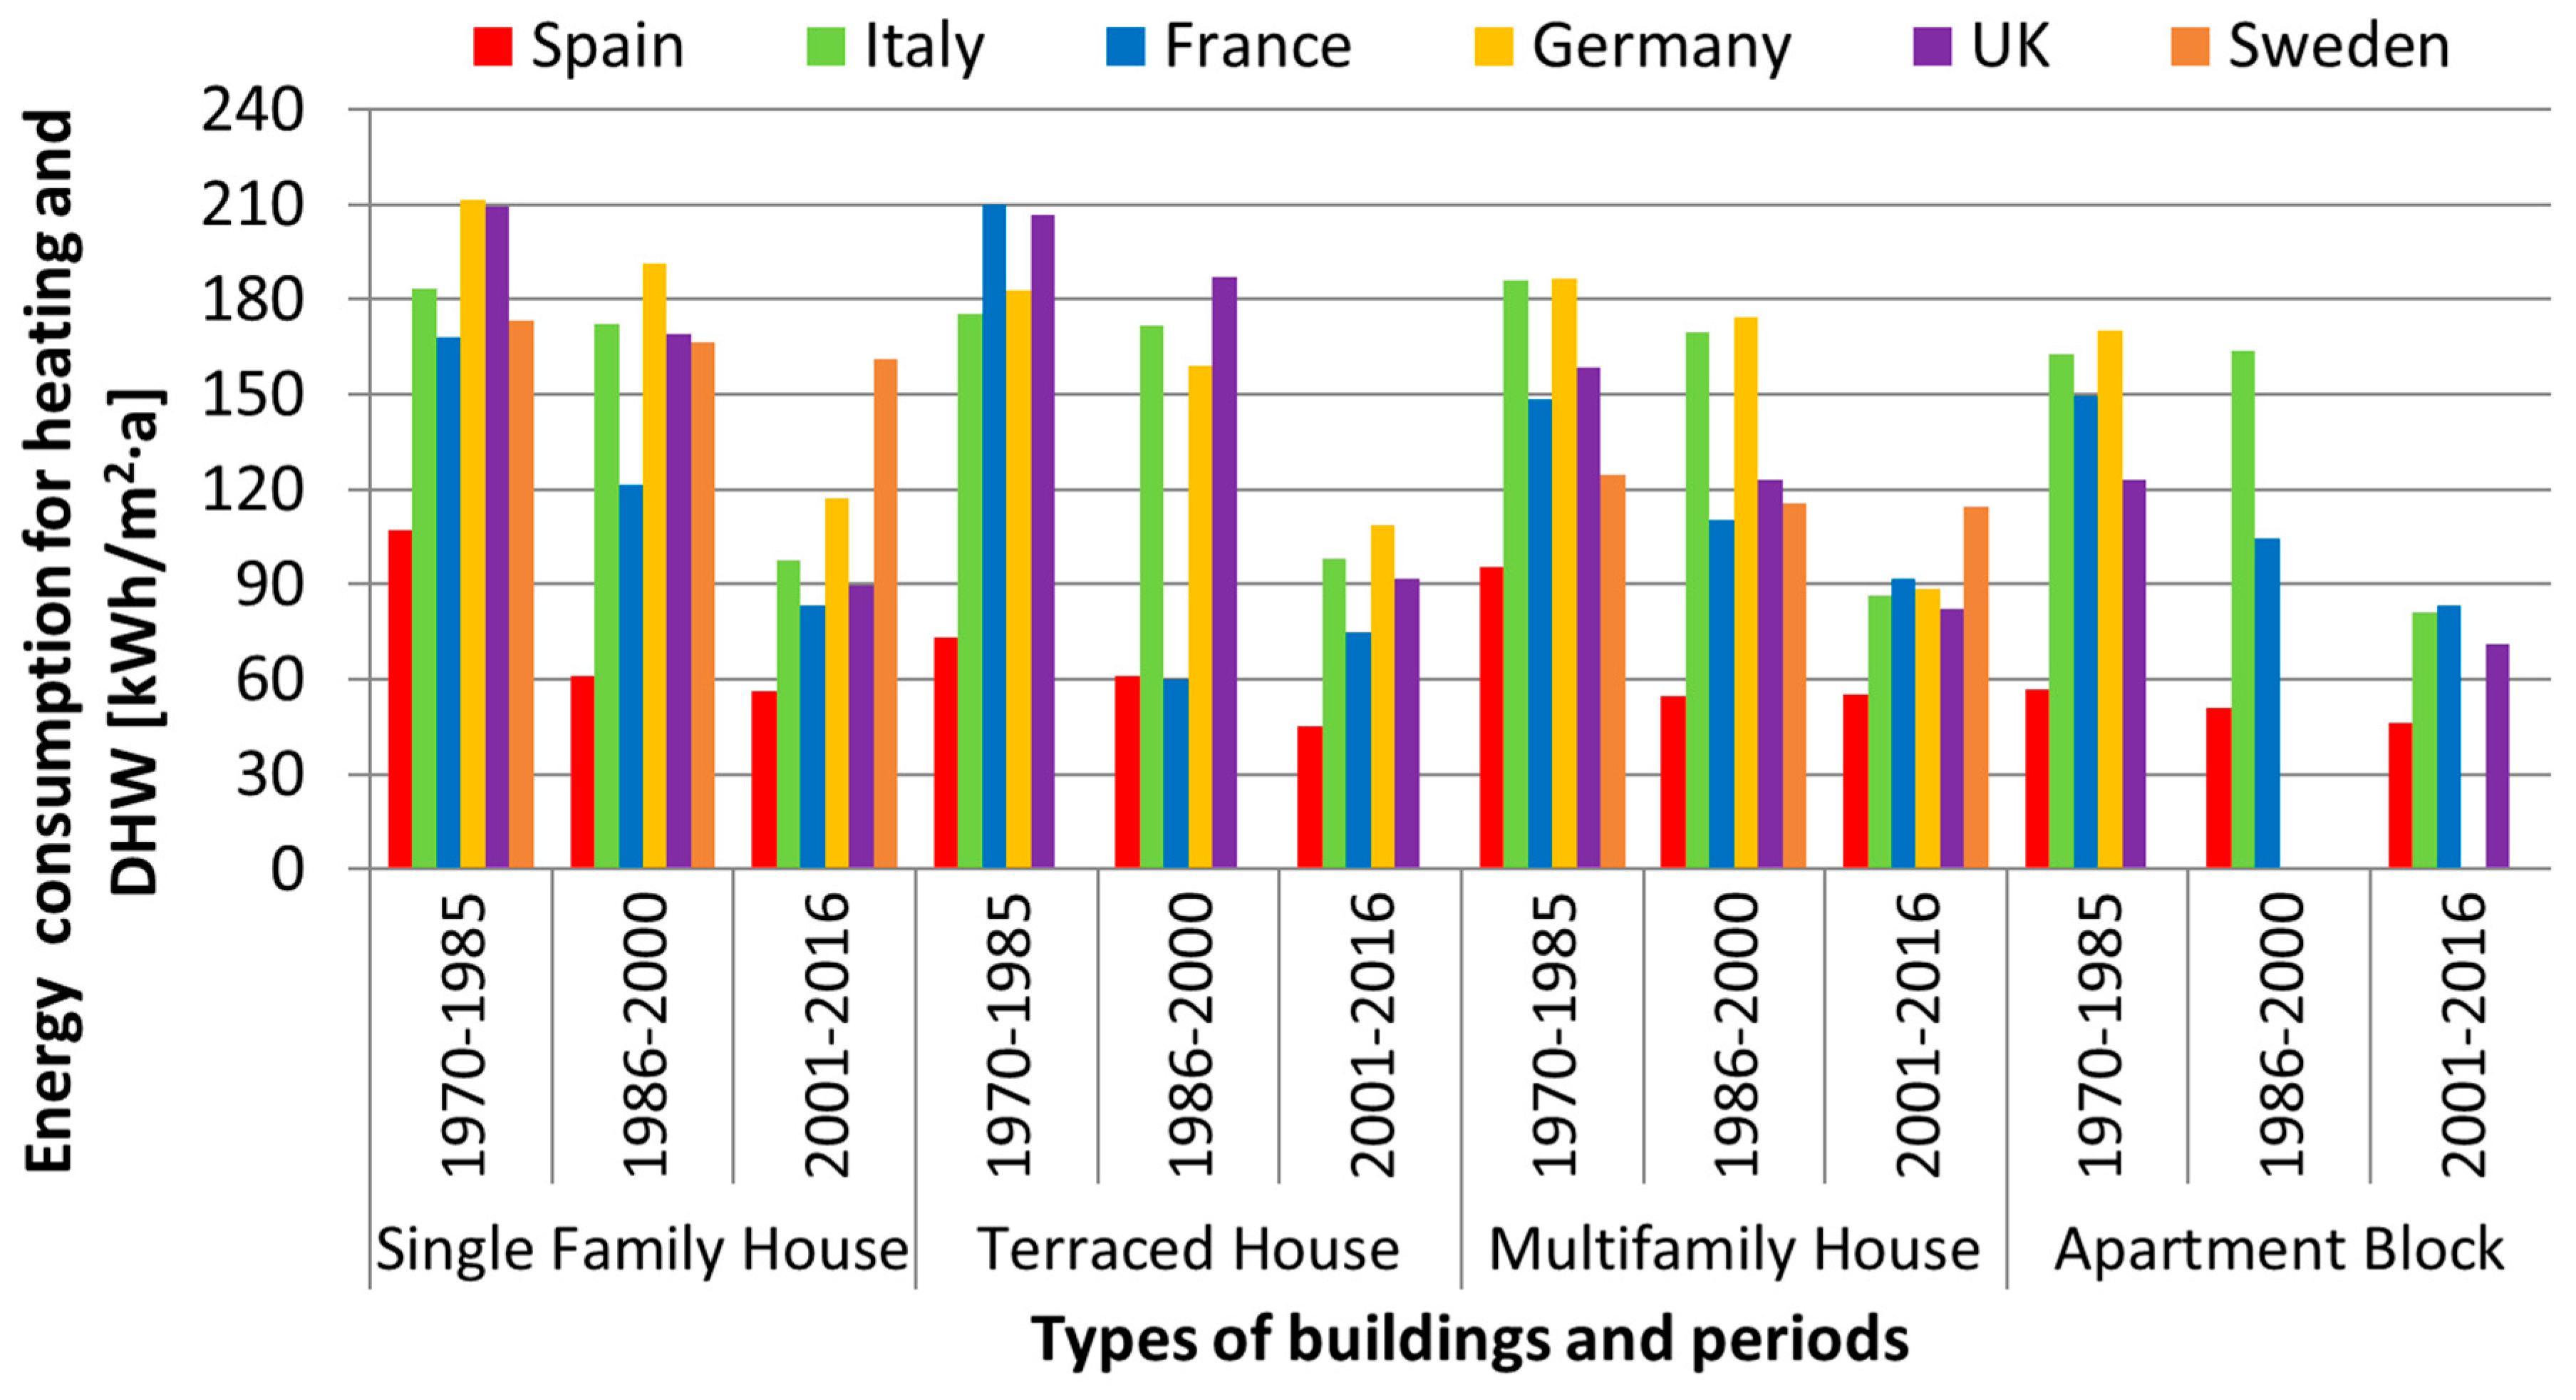
5.2. Energy Consumption for Heating and Domestic Hot Water
Up to 14 climate conditions were analysed for the different considered countries (Spain, France, Italy, UK, Germany and Sweden). The total annual energy consumed for heating and domestic hot water of different building typologies is given for hot, temperate and cold climate conditions of each analysed country (
Table 2).
In southern countries such as Spain, Italy and some regions of France, with a predominant hot Mediterranean climate conditions the domestic hot water can account for more than a half of the total energy consumption of a building. As an example, a single family house in Spain (1986–2000) consumes 48.1 kWh/(m
2·a) to cover the heating and DHW demand (
Figure 5), almost half of that energy demand comes only from DHW requirements. However, in northern countries such as Germany or Sweden, the energy consumption is higher for heating in comparison to the energy consumption for DHW. For a similar case scenario in Germany, the calculated delivered energy for heating & DHW of a single family house, from 1986 to 2000, was 209.6 kWh/(m
2·a) while only 10% of it were for DHW requirements.
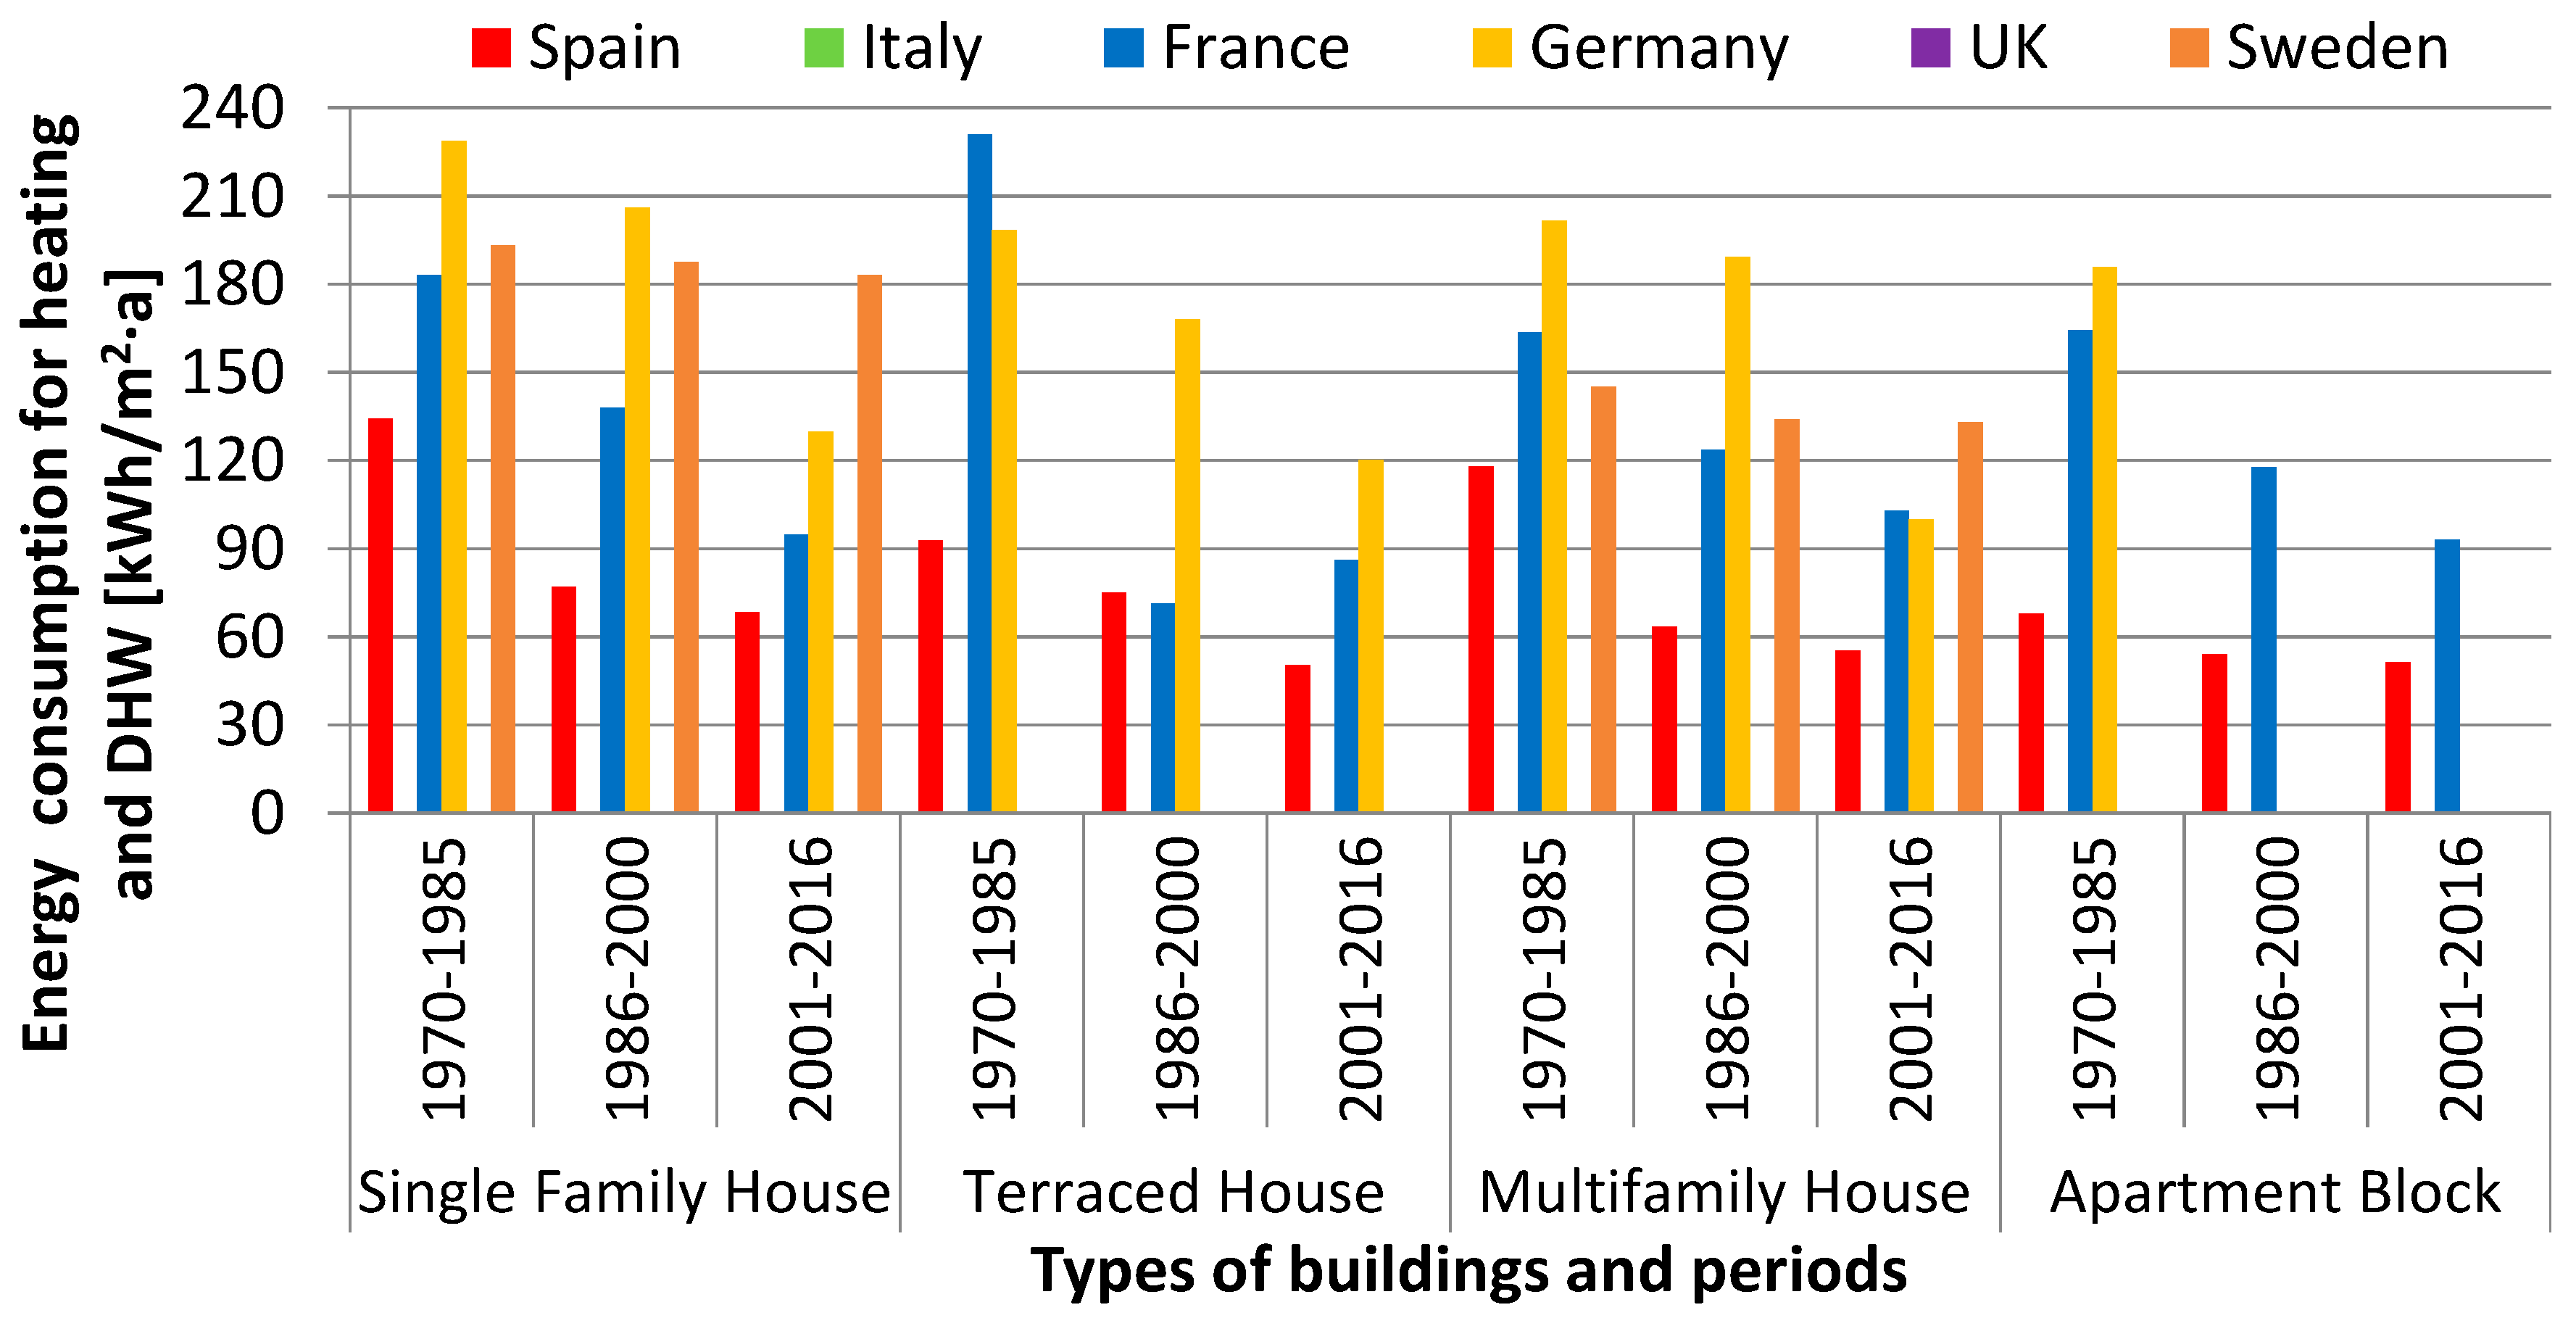
DHW consumption is less dominant when compared over the total energy consumption of a building in temperate or cold climate conditions.
Figure 6 and
Figure 7 show the energy consumption for heating and domestic hot water for these climate conditions by country.
TABULA database shows similar energy consumption for DHW in all evaluated European countries; the range goes from the lowest case scenario, 7.8 kWh/(m
2·a) in Sweden to the highest energy consumption case, 48.1 kWh/(m
2·a) in Germany [
19]. It was observed a difference of 40.3 kWh/(m
2·a) for DHW demand when different countries and climate conditions (hot, temperate and cold) were compared. However, after having analysed
Figure 5,
Figure 6 and
Figure 7, the comparison was conducted for the energy consumption for heating at the same climate conditions, the maximum difference was about 197 kWh/(m
2·a). Therefore, the energy consumption of DHW could be related to the performance of the energy equipment but especially to the human behaviour, meanwhile the energy consumption for heating is mainly attributed to the regional climate conditions and the building insulation level.
Moreover,
Figure 5,
Figure 6 and
Figure 7 show that the energy consumption for heating and DHW is lower in apartment blocks in comparison to single family houses for all the EU countries analysed. These results point out the importance of the building shape, as higher compactness in apartment blocks and multifamily houses results in less energy consumption per square meter per year for heating. These results are in agreement with those obtained in the energy benchmarking for residential buildings performed by Tereci et al. (2013) [
25] in heating dominant climates. The building shape can reduce the heating demand up to 35%. In addition, they concluded that compact multi-family houses have the lowest energy demand and CO
2 emissions while old apartments with courtyard showed the highest heating demand.
Many variations in energy consumption were observed for the same building typology when countries and building construction periods are compared. As an example, regarding the standard thermal transmittance (
Table 1) for walls of a single family house; in Germany (2001–2016) is 0.30 W/m
2·K while in Spain for the same building characteristics and period is 37.5% higher (0.48 W/m
2·K). However, a German single family house in a temperate climate demands 59% more energy (76.8 kWh/(m
2·a)) only for heating in comparison to the same building typology in Spain, that requires 31.8 kWh/(m
2·a). Thus, buildings in northern countries such as the UK, Germany and Sweden have higher heating energy demands, even though they are better insulated, in comparison to southern countries such Spain, France and Italy. This fact is directly related to the climate conditions.
Finally, as expected, the energy consumption for water and space heating of a specific building increases according to the climate conditions, being the hot climate the lowest and the cold one the highest energy requirements. So, the same building typology, requires more energy demand for heating and DHW in cold than in hot climate conditions.
5.3. Comparative Analysis of CO2 Emissions
The current state of CO
2 emissions for residential buildings is presented in this section. The analysis included the CO
2 emissions related to the energy consumption for heating and domestic hot water systems. To have a more realistic approach, the emissions due to the electricity consumption by electrical appliances and lighting per household are also considered (
Table 3). In order to calculate the CO
2 emissions as a result of the electricity consumption for non-heating purposes, the standard CO
2 emission factor for the power production was applied for each country [
26].
In addition to the electrical energy consumption for electrical appliances and lighting, the average size of dwelling (
Table 4) was established based on the project ENTRANZE [
19].
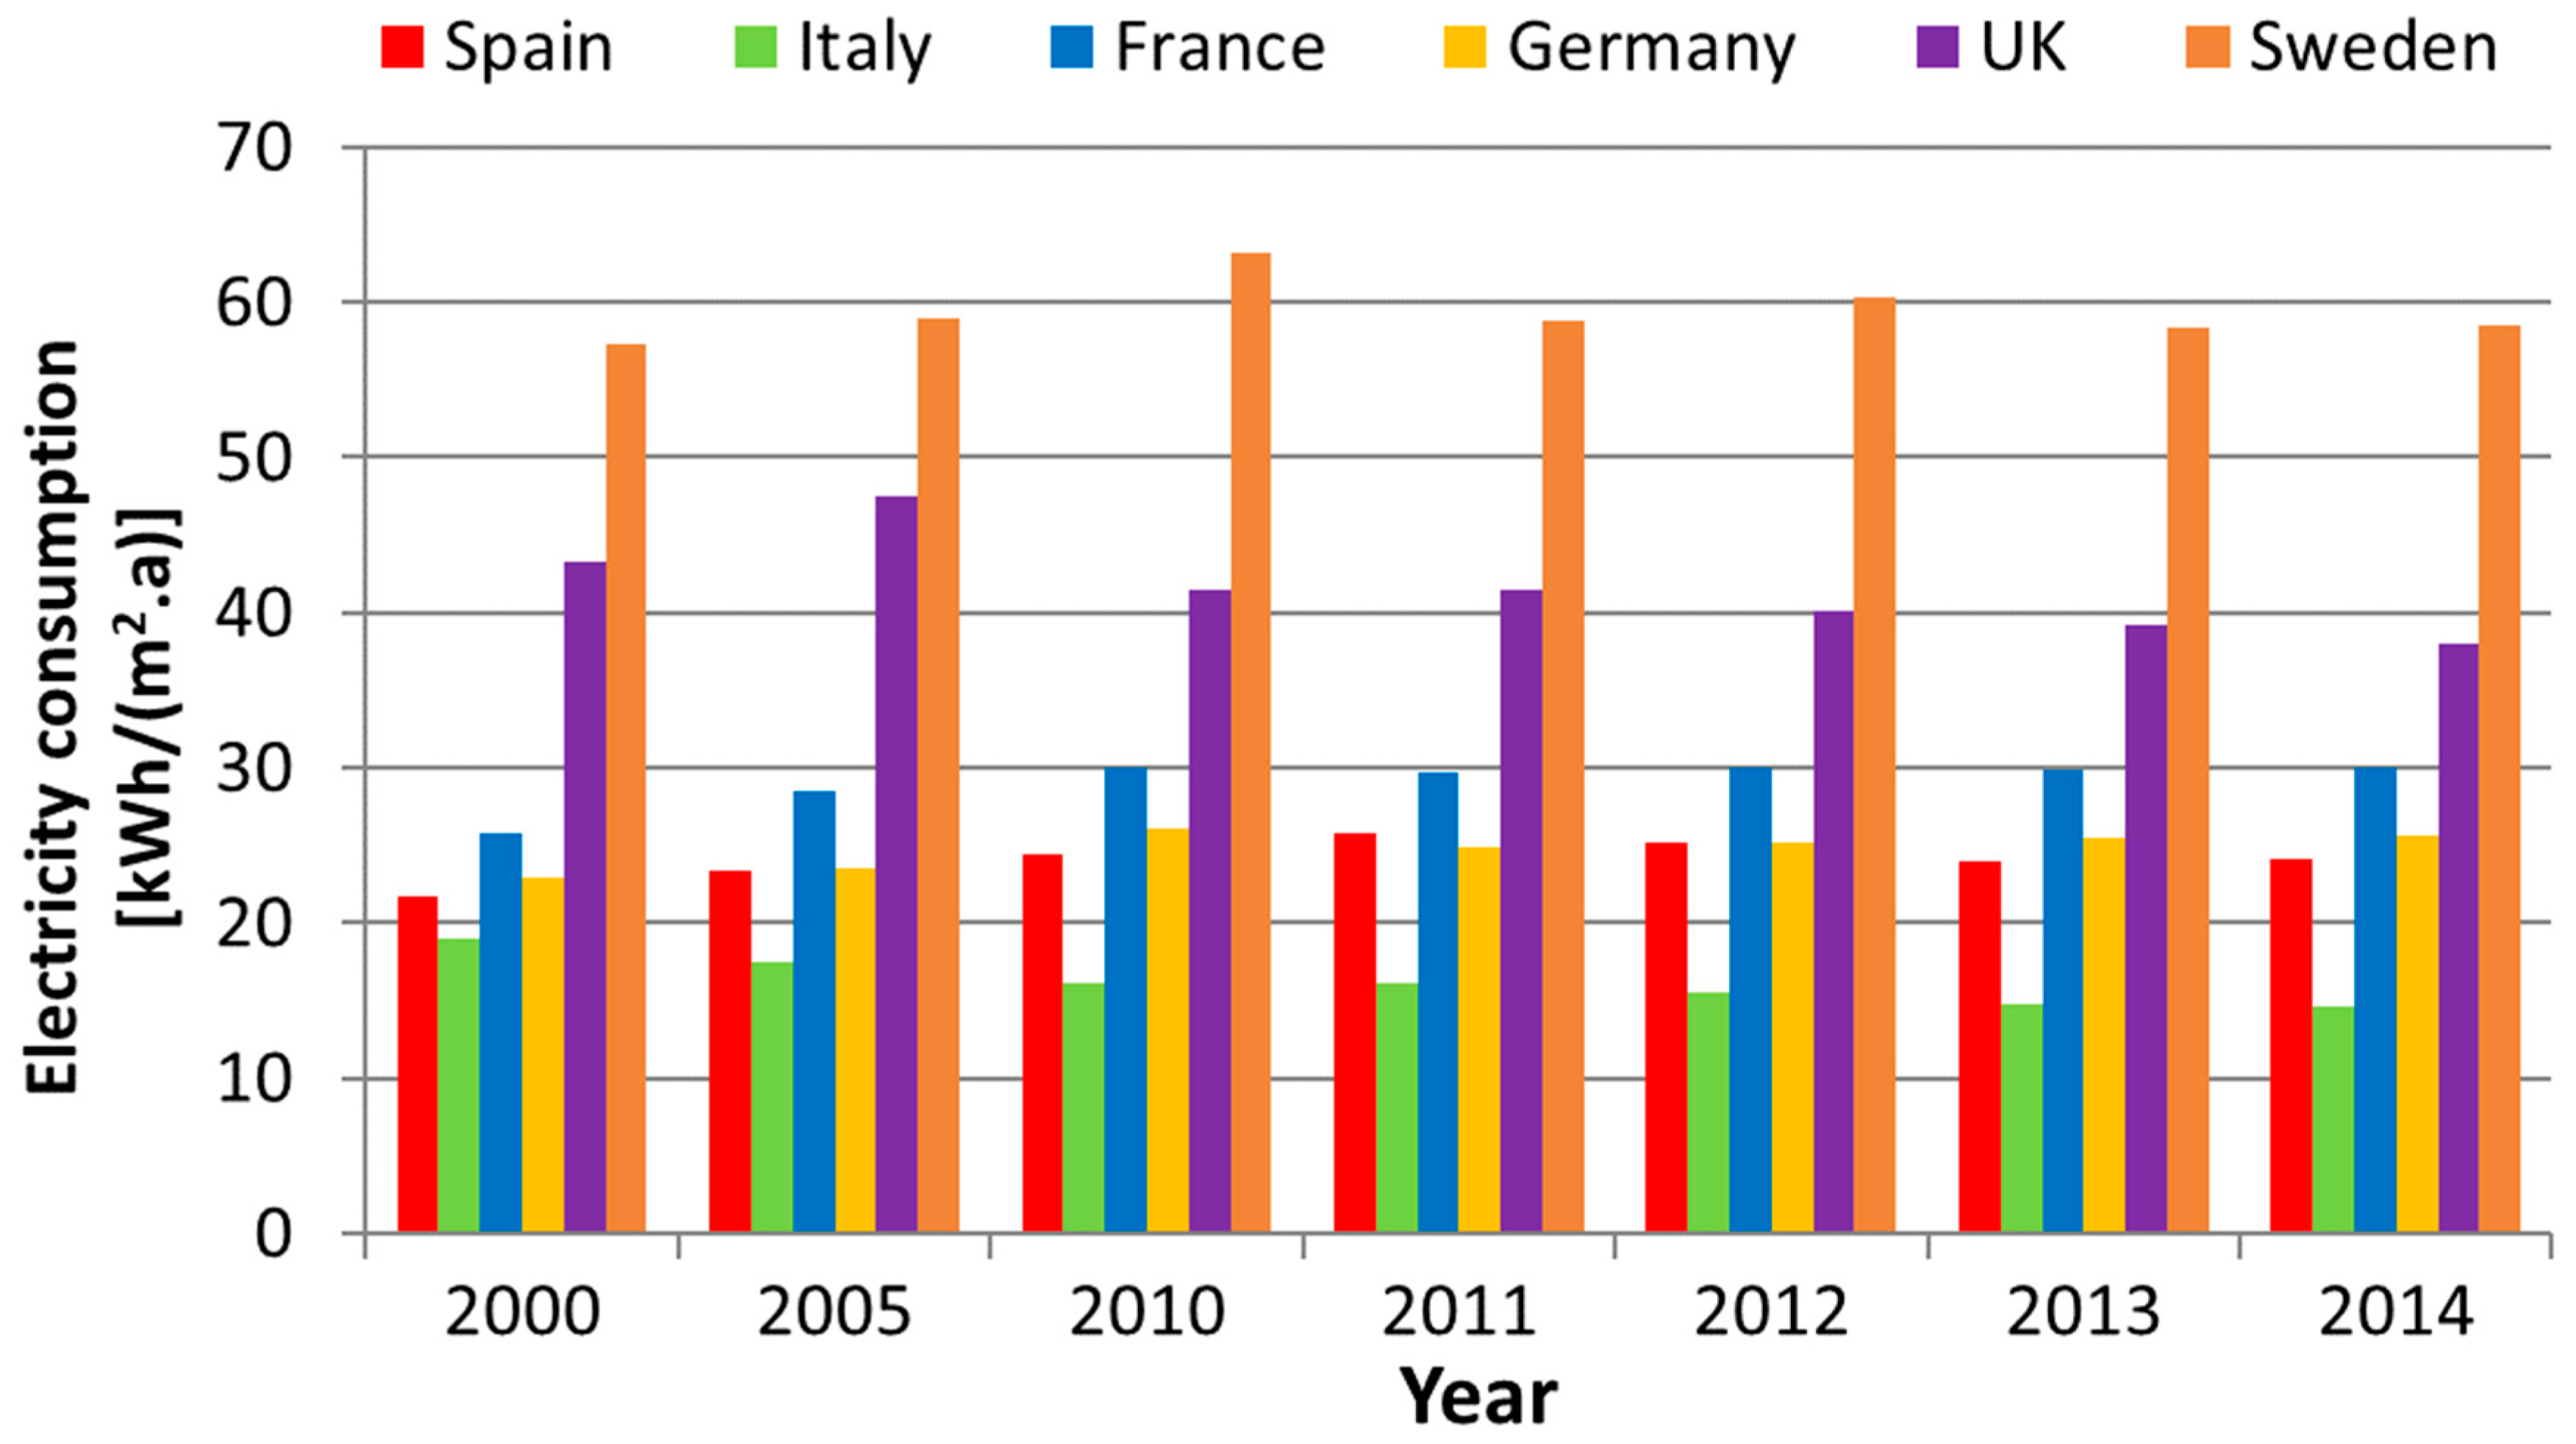
Figure 8 shows the estimated electrical energy consumption for lighting and appliances per square metre at the European model buildings studied in this paper. Sweden shows the highest electrical energy consumption levels of around 60 kWh/(m
2·a), followed by UK with the average value of 40 kWh/(m
2·a) (from 2010 to 2014). Spain, Germany and France have similar electrical consumption rates, namely over 24, 25 and 30 kWh/(m
2·a), respectively. Italy has the lower value, which decreased from 19 kWh/(m
2·a) in 2000 to 14 kWh/(m
2·a) in 2014 (
Figure 8).
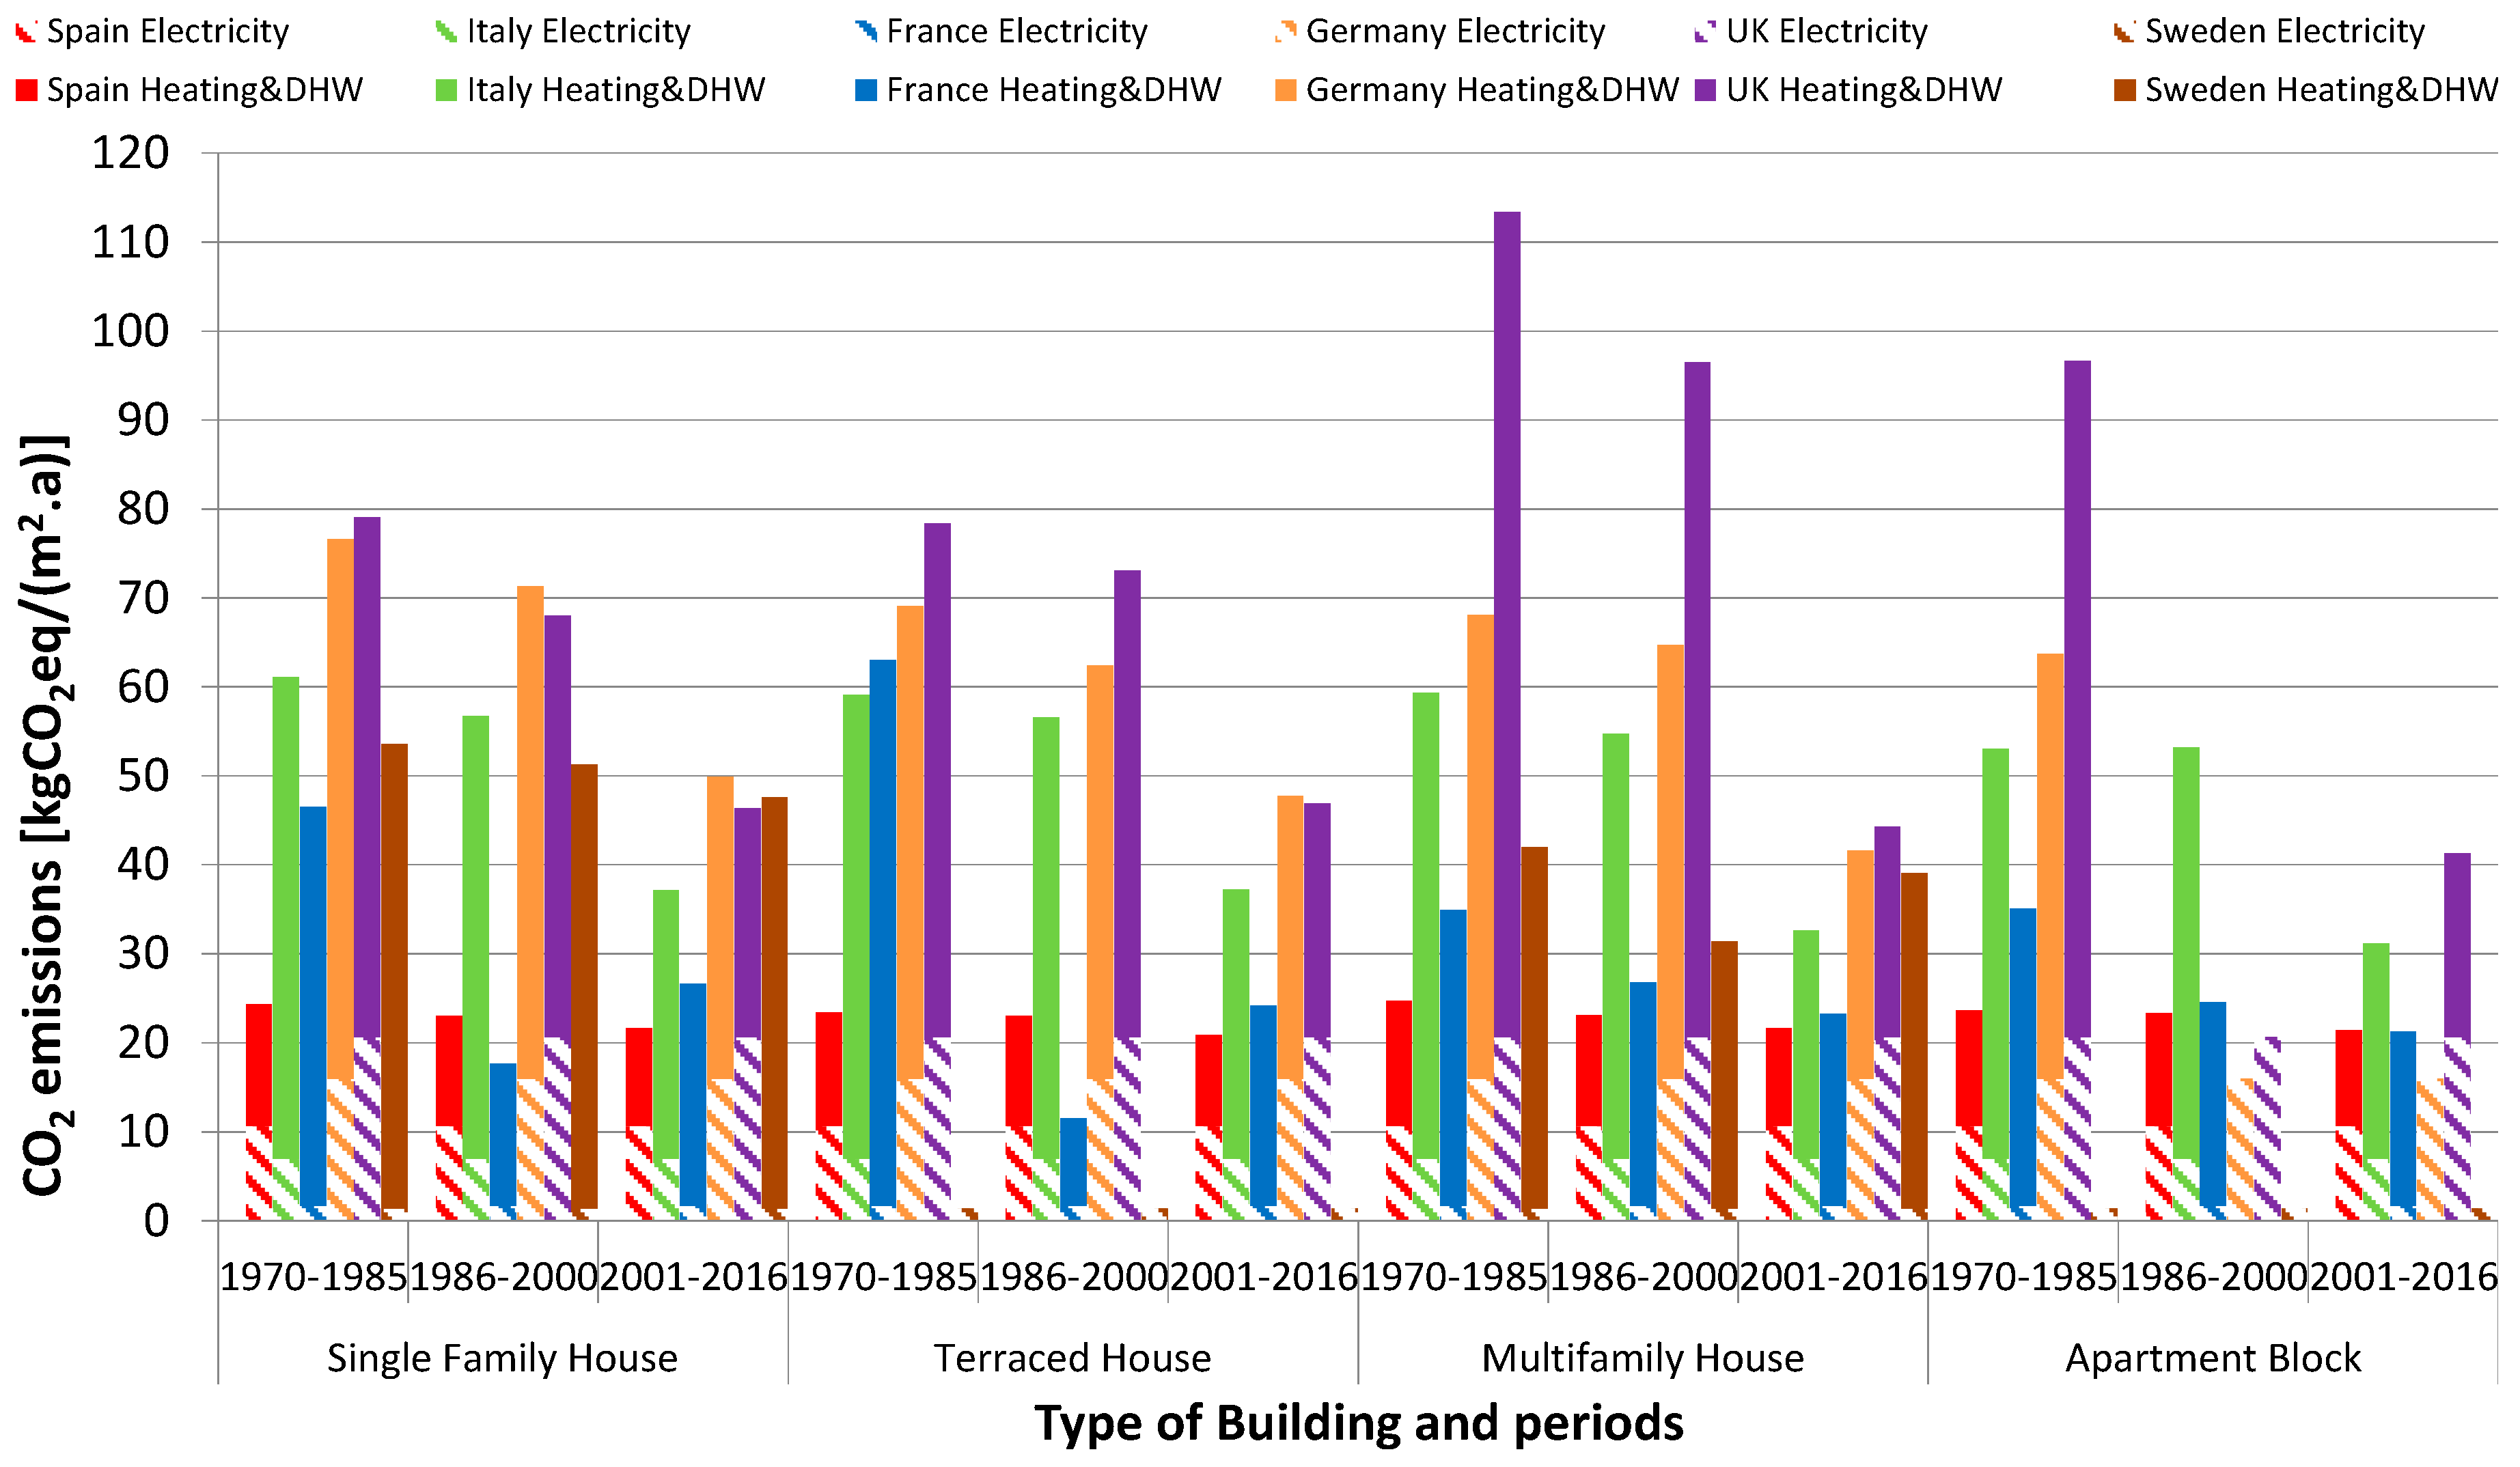
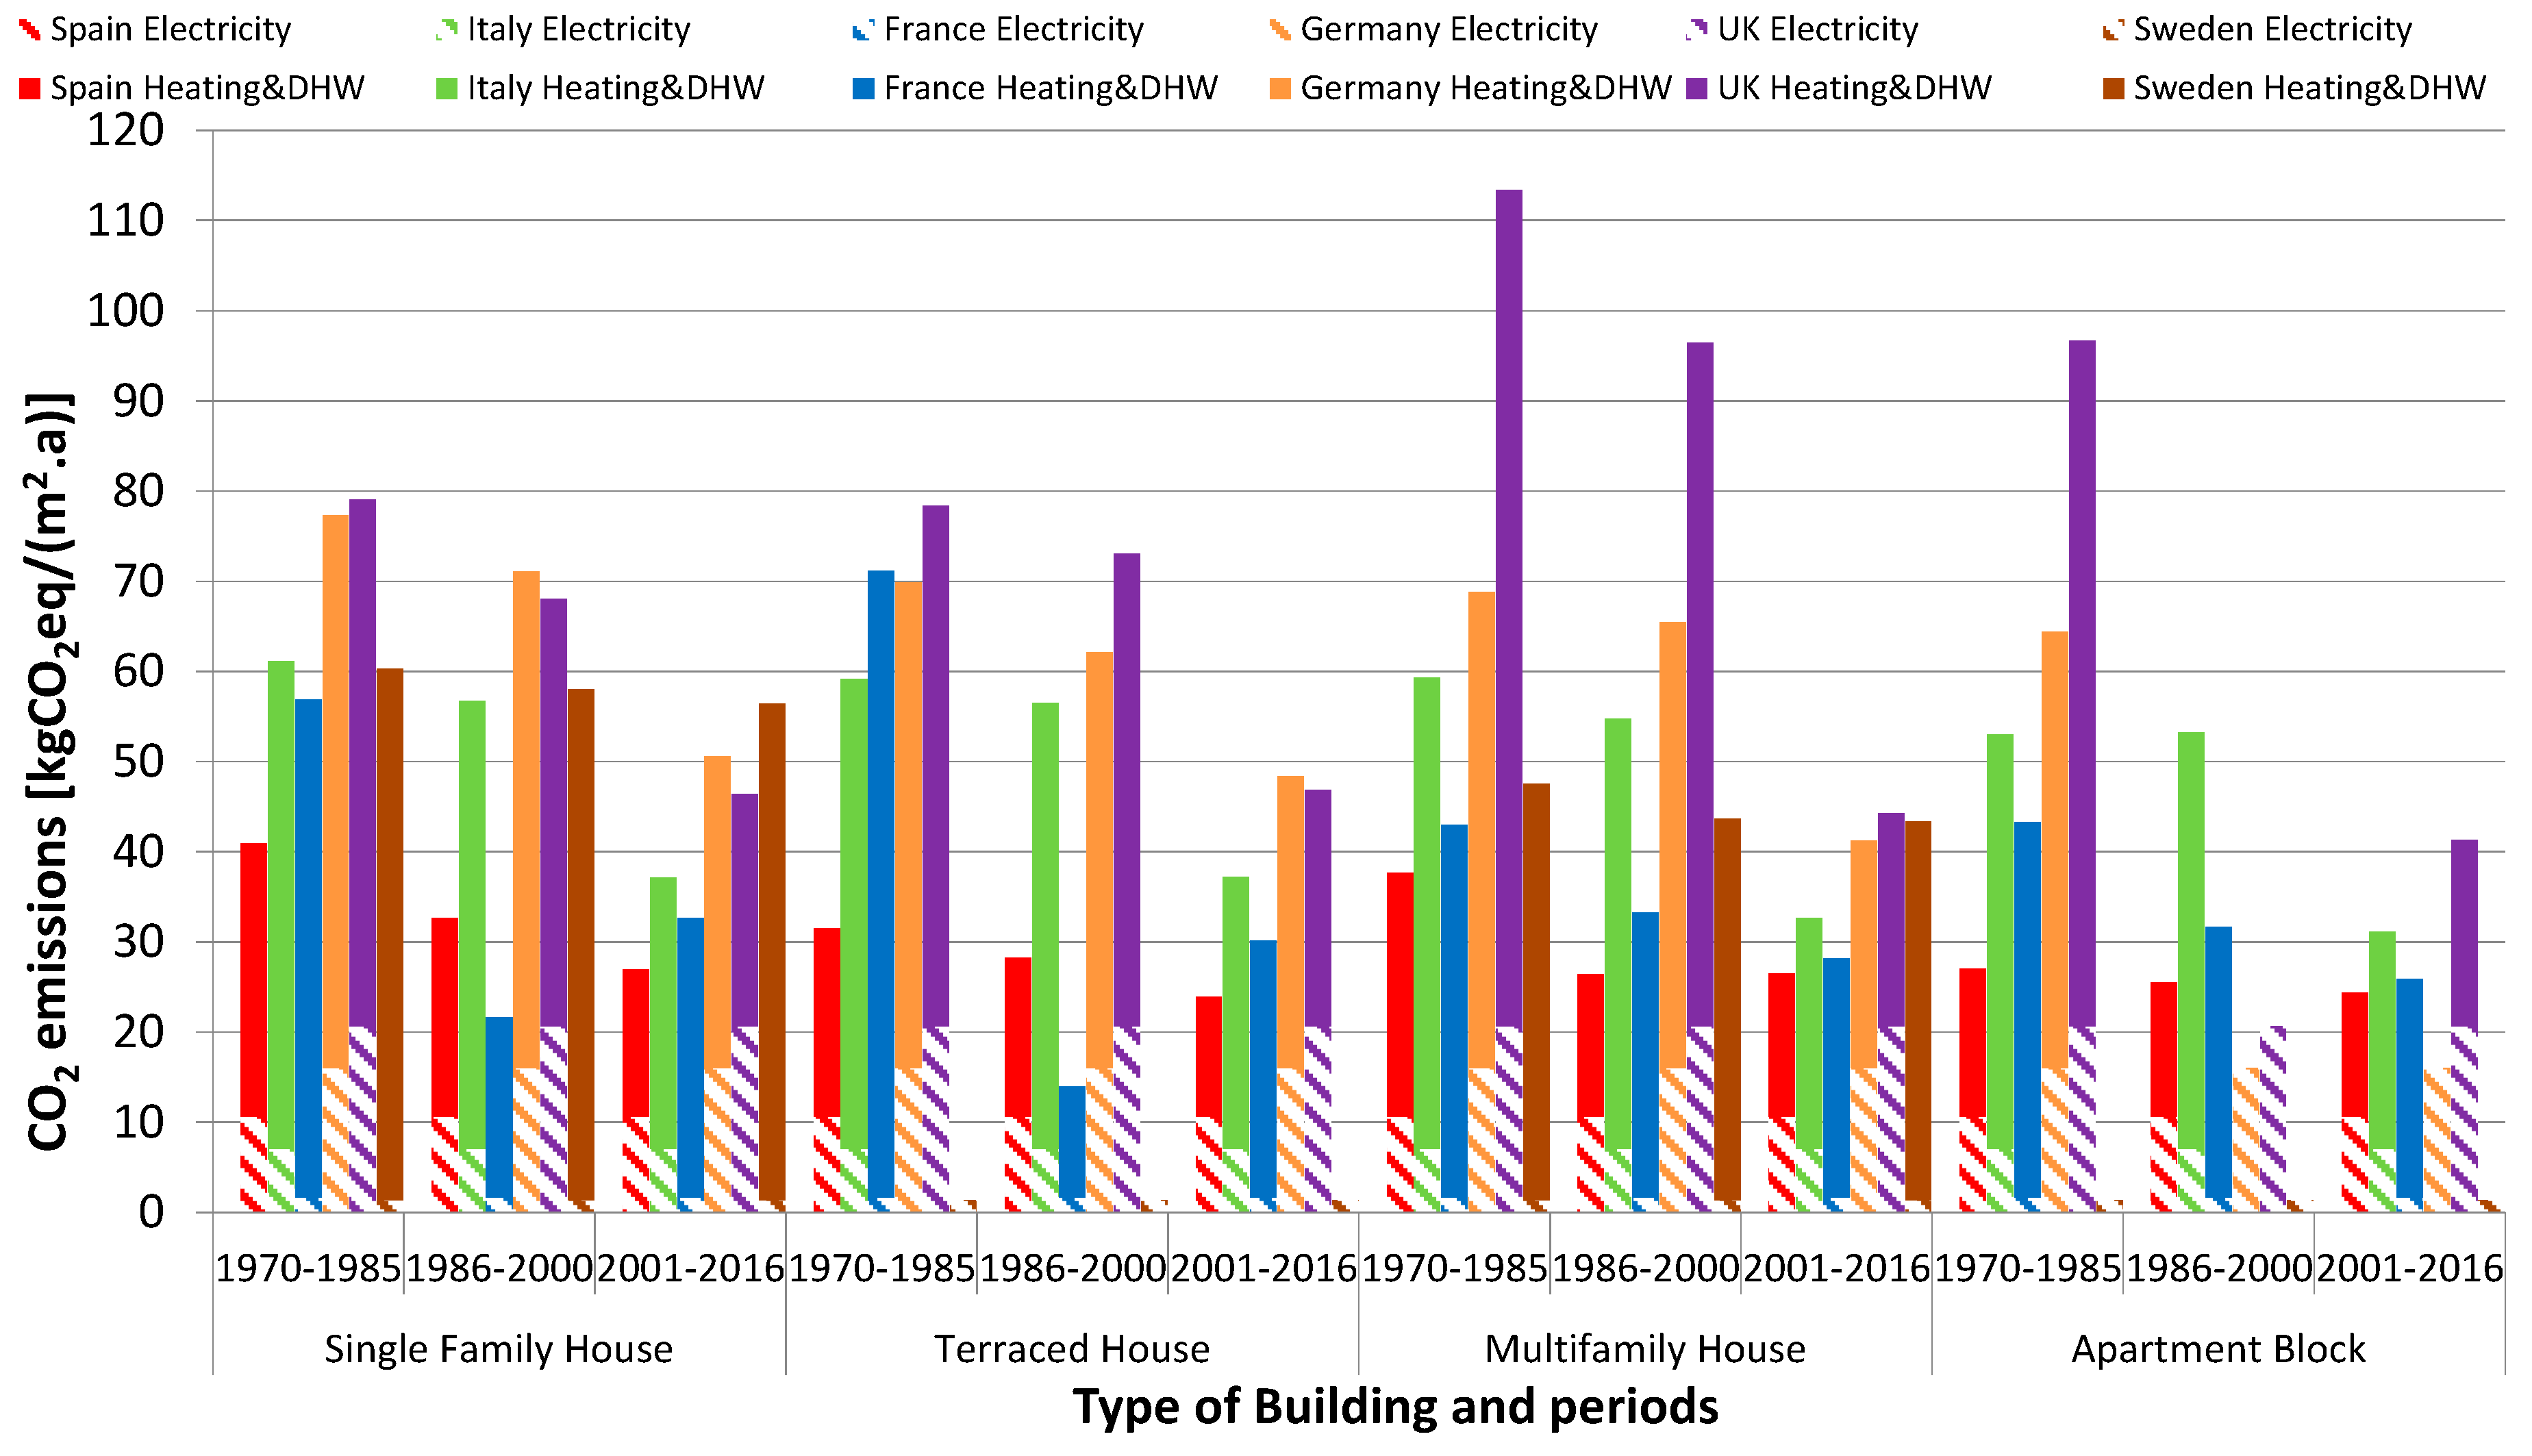
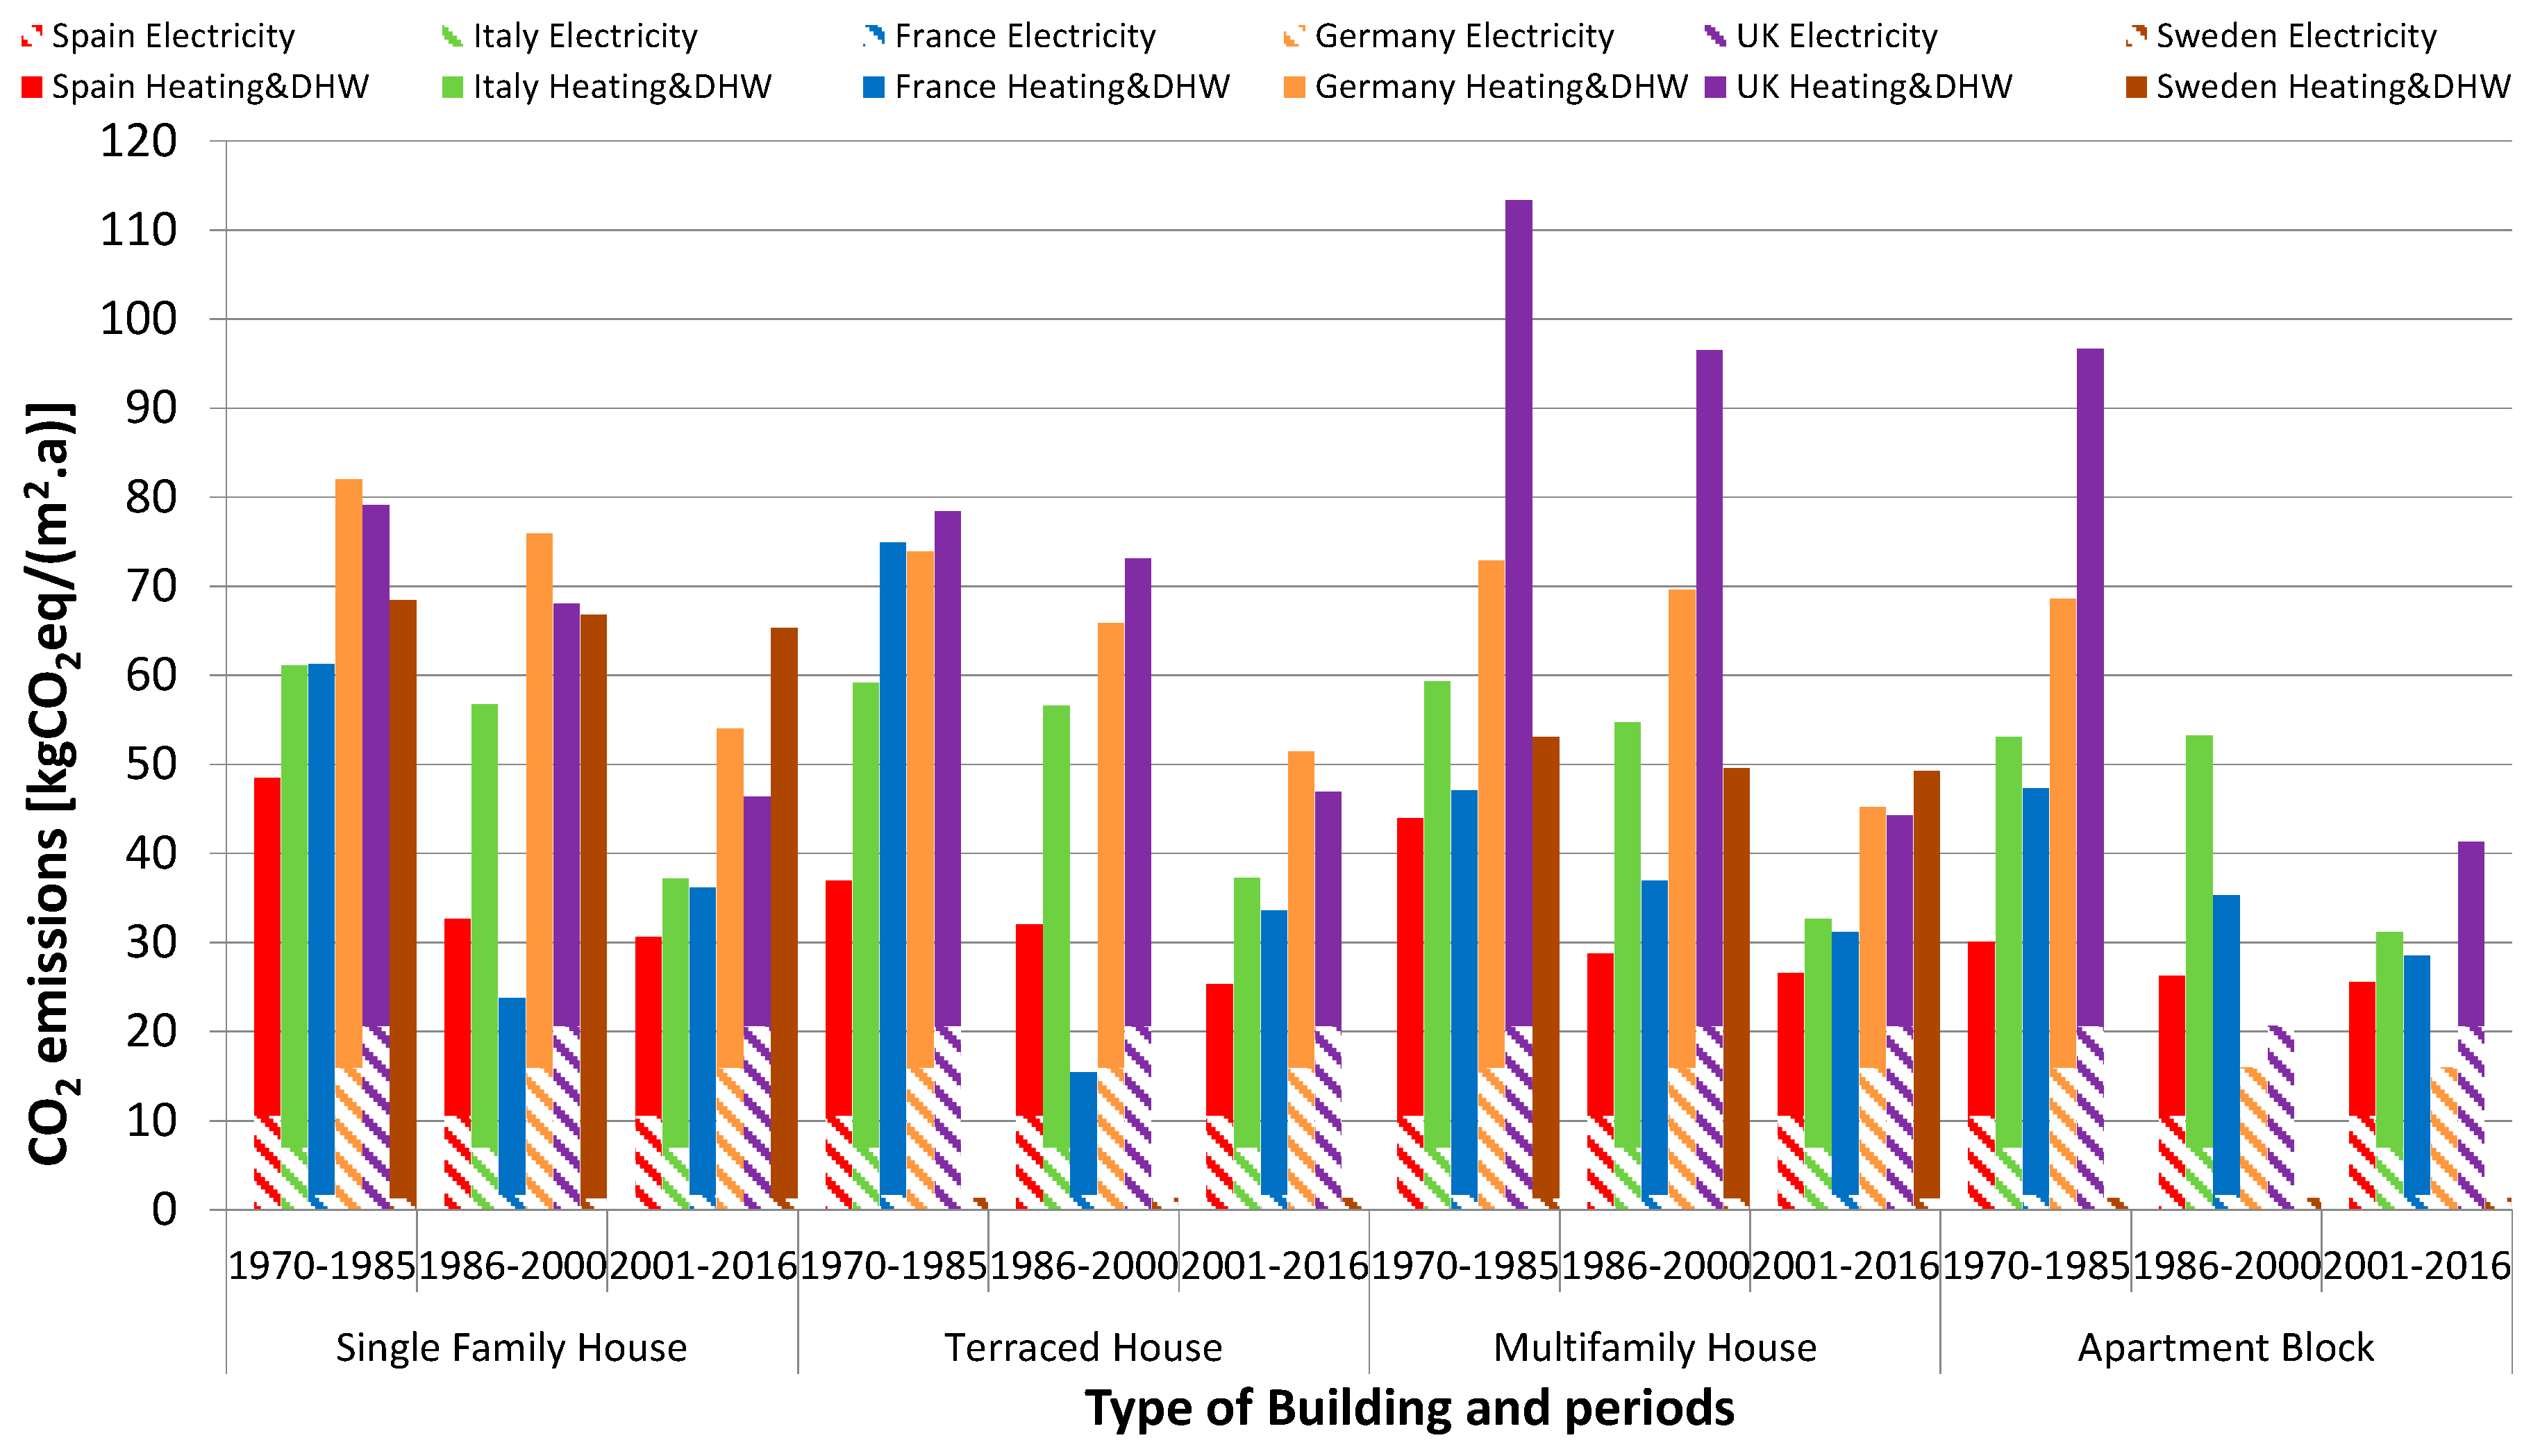
The total CO
2 emissions due to energy consumption in residential buildings under hot, temperate and cold climate conditions, which includes heating, DHW and electricity, can be seen in
Figure 9,
Figure 10 and
Figure 11. The CO
2 emissions per square metre range from 113.4 kgCO
2eq/(m
2·a) for an old British multifamily house (1970–1985) in a cold climate (
Figure 11) to 11.5 kgCO
2eq/(m
2·a) for a terraced house (1986–2000) in hot French climate conditions (
Figure 9).
When comparing results for CO
2 emissions against the energy consumption (see
Figure 5,
Figure 6 and
Figure 7 for heating and DHW and
Figure 8 for the estimation of the electrical energy consumption) the effect of the technology used to provide the heating energy can be clearly seen. Therefore, despite Sweden being a higher energy consumer than UK, Sweden emits less CO
2 than the UK (
Figure 9,
Figure 10 and
Figure 11). In Sweden, district heating based on biomass and waste supplies more than the 40% of the heat demand in buildings [
28]. For the same reason, nuclear power plants have similar effects on the electricity production. So, despite the fact that France consumes more electricity (
Figure 8) in comparison to Italy or Spain, CO
2 emissions levels in France are lower than its neighbouring countries due to a high nuclear portion in the French energy mix [
29]. Spain, Germany, Italy and UK main fuel sources for heating purposes are fossil fuels and electricity [
21] but unlike France their electricity was also mainly produced by fossil fuels at the time used for this study [
29]. Hence, their CO
2 emissions are directly related with their energy consumption. Moreover, the decrement trends observed over the years in the energy consumption in
Figure 5,
Figure 6 and
Figure 7 are also detected in the CO
2 emissions for the different building typologies in all countries (
Figure 9,
Figure 10 and
Figure 11).
Referring to the CO
2 emissions, it can be noticed that the difference between temperate and cold climate locations is not relevant in all the analysed countries except for all building typologies from 1970–1985 periods in Spain and France (
Figure 10 and
Figure 11). These buildings showed important increments of the CO
2 emissions because of the low building insulation levels in this period and the big temperature variations between cold and hot climate conditions in southern European regions (Spain, Italy and France) when compared to the same variations in northern countries such as Germany, UK and Sweden.
6. Conclusions
This study provides a comprehensive benchmarking of the energy demand and the CO2 emissions in the EU residential buildings. The study includes data from six different countries which account for three quarters of the total dwellings in Europe.
The main outcome of the study is that there is a necessity of a free access database that gathers standardized data of the building stock. So, a reliable and comparable data regarding the energy aspects in buildings can be ensured and accessed. This will allow to address the current limitation in this sector.
Nowadays, there is a controversy regarding the classification of the residential building stock. After a literature review, the most interesting building classification is the one provided by TABULAs project. It is a robust and contrasted free access data source based on three consecutive projects. However, the energy consumption for cooling, air conditioning, lighting and electric appliances are not already considered in this database. The European Building Stock Observatory is also a free access database that considered those data but presents some important drawbacks that limit the comparative analysis.
The EU building stock is very heterogeneous, and its energy demand varies depending on the following principal factors: climate conditions, insulation level and the type of building among others. The energy consumed for space and water heating of the evaluated can differ in 197.4 kWh/(m2·a). This fact shows that a proper evaluation of the energy demand in the building sector can help to assess new the installation of new and innovative technologies. The principal parameters that affect the final energy demand of all Spanish building stock within the 1970–1985 period are: first the climate conditions, second the insulation level, and, finally the building shape. However, since generally the level of insulation in Germany, Sweden and UK countries is very high, climate conditions have had less relevance on the variation of the building energy the heating requirements of a building are mainly attributed to the climate conditions, type of building and the building insulation level. While the domestic hot water demand is related to the human habits and the performance of the overall supply system.
Results lead the authors to conclude that DHW plays an important role on the total building energy demand in the hot Mediterranean climate in Spain and France. DHW consumes up to 50% of the energy consumed for the specific buildings in the period 2001–2016 of those countries. However, in cold climatic conditions, in Germany or Sweden, DHW did not reach 10% of the energy consumed.
This paper provides a reference scenario of the energy demand and CO2 emissions from different building stocks. This reference can be used in further investigations to evaluate the potential applicability of new HVAC and DHW technologies and compare them to the current ones.
Further research should focus on analysing the role of human behaviour in the final energy demand of a building, as well as the energy consumption for cooling, lighting and appliances. In addition, the energy demand of non-residential buildings is becoming increasingly important that is why future studies should focus also on this topic.

 ,
, 


