Research on Characteristics of ECVT for Power Quality Detection and Optimum Design of Its Parameter

Abstract
:1. Introduction
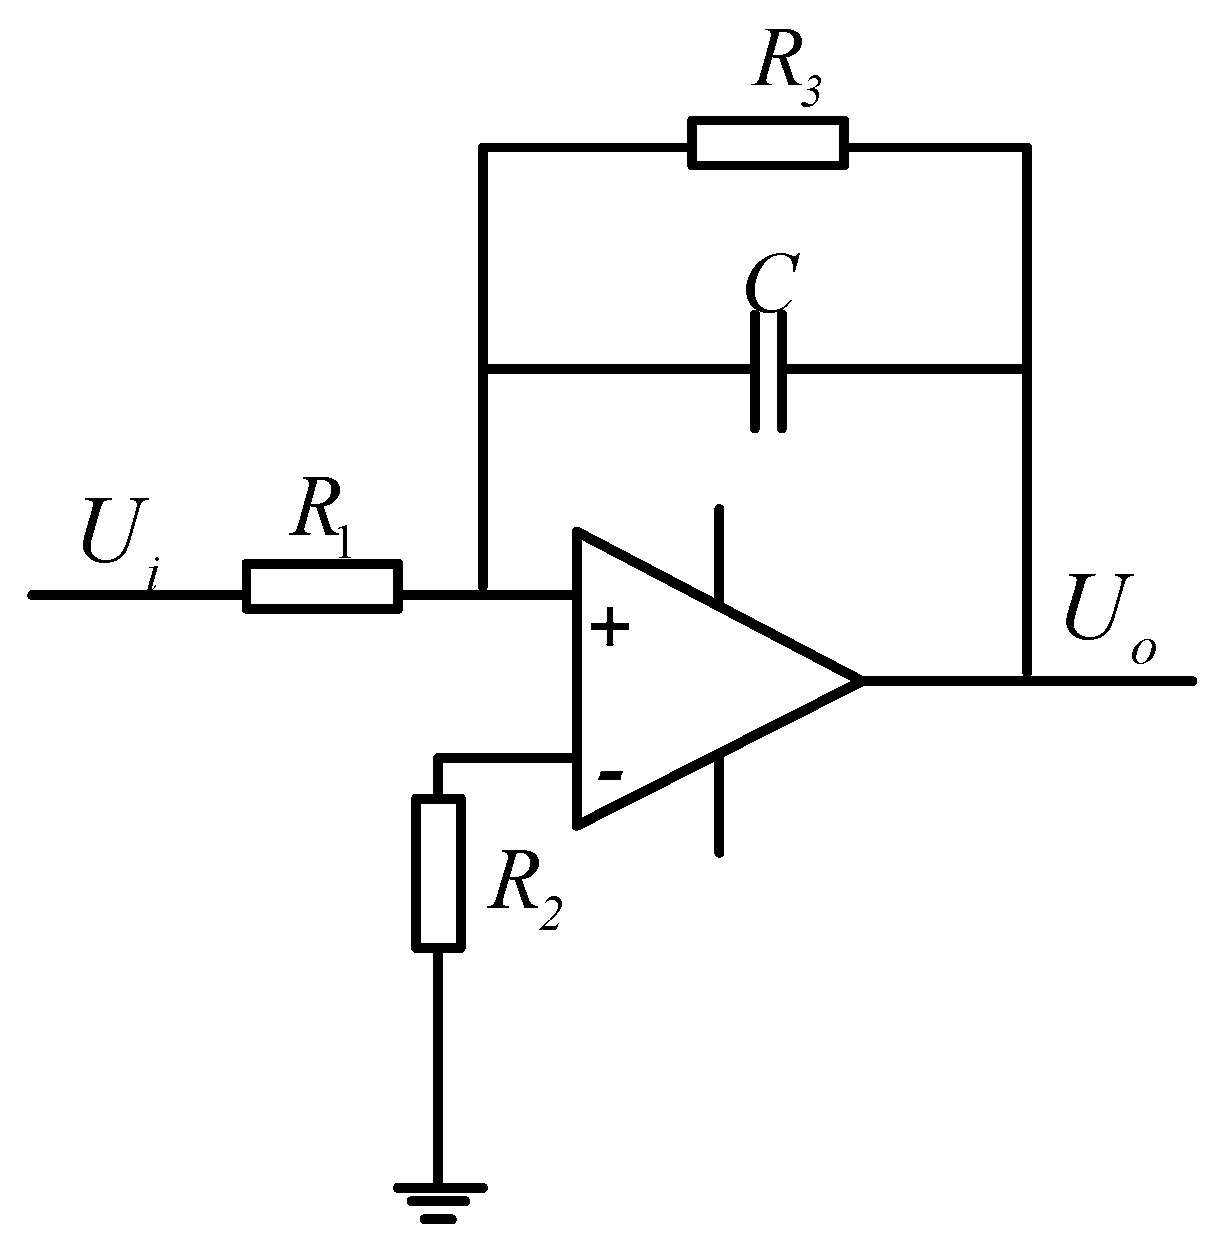
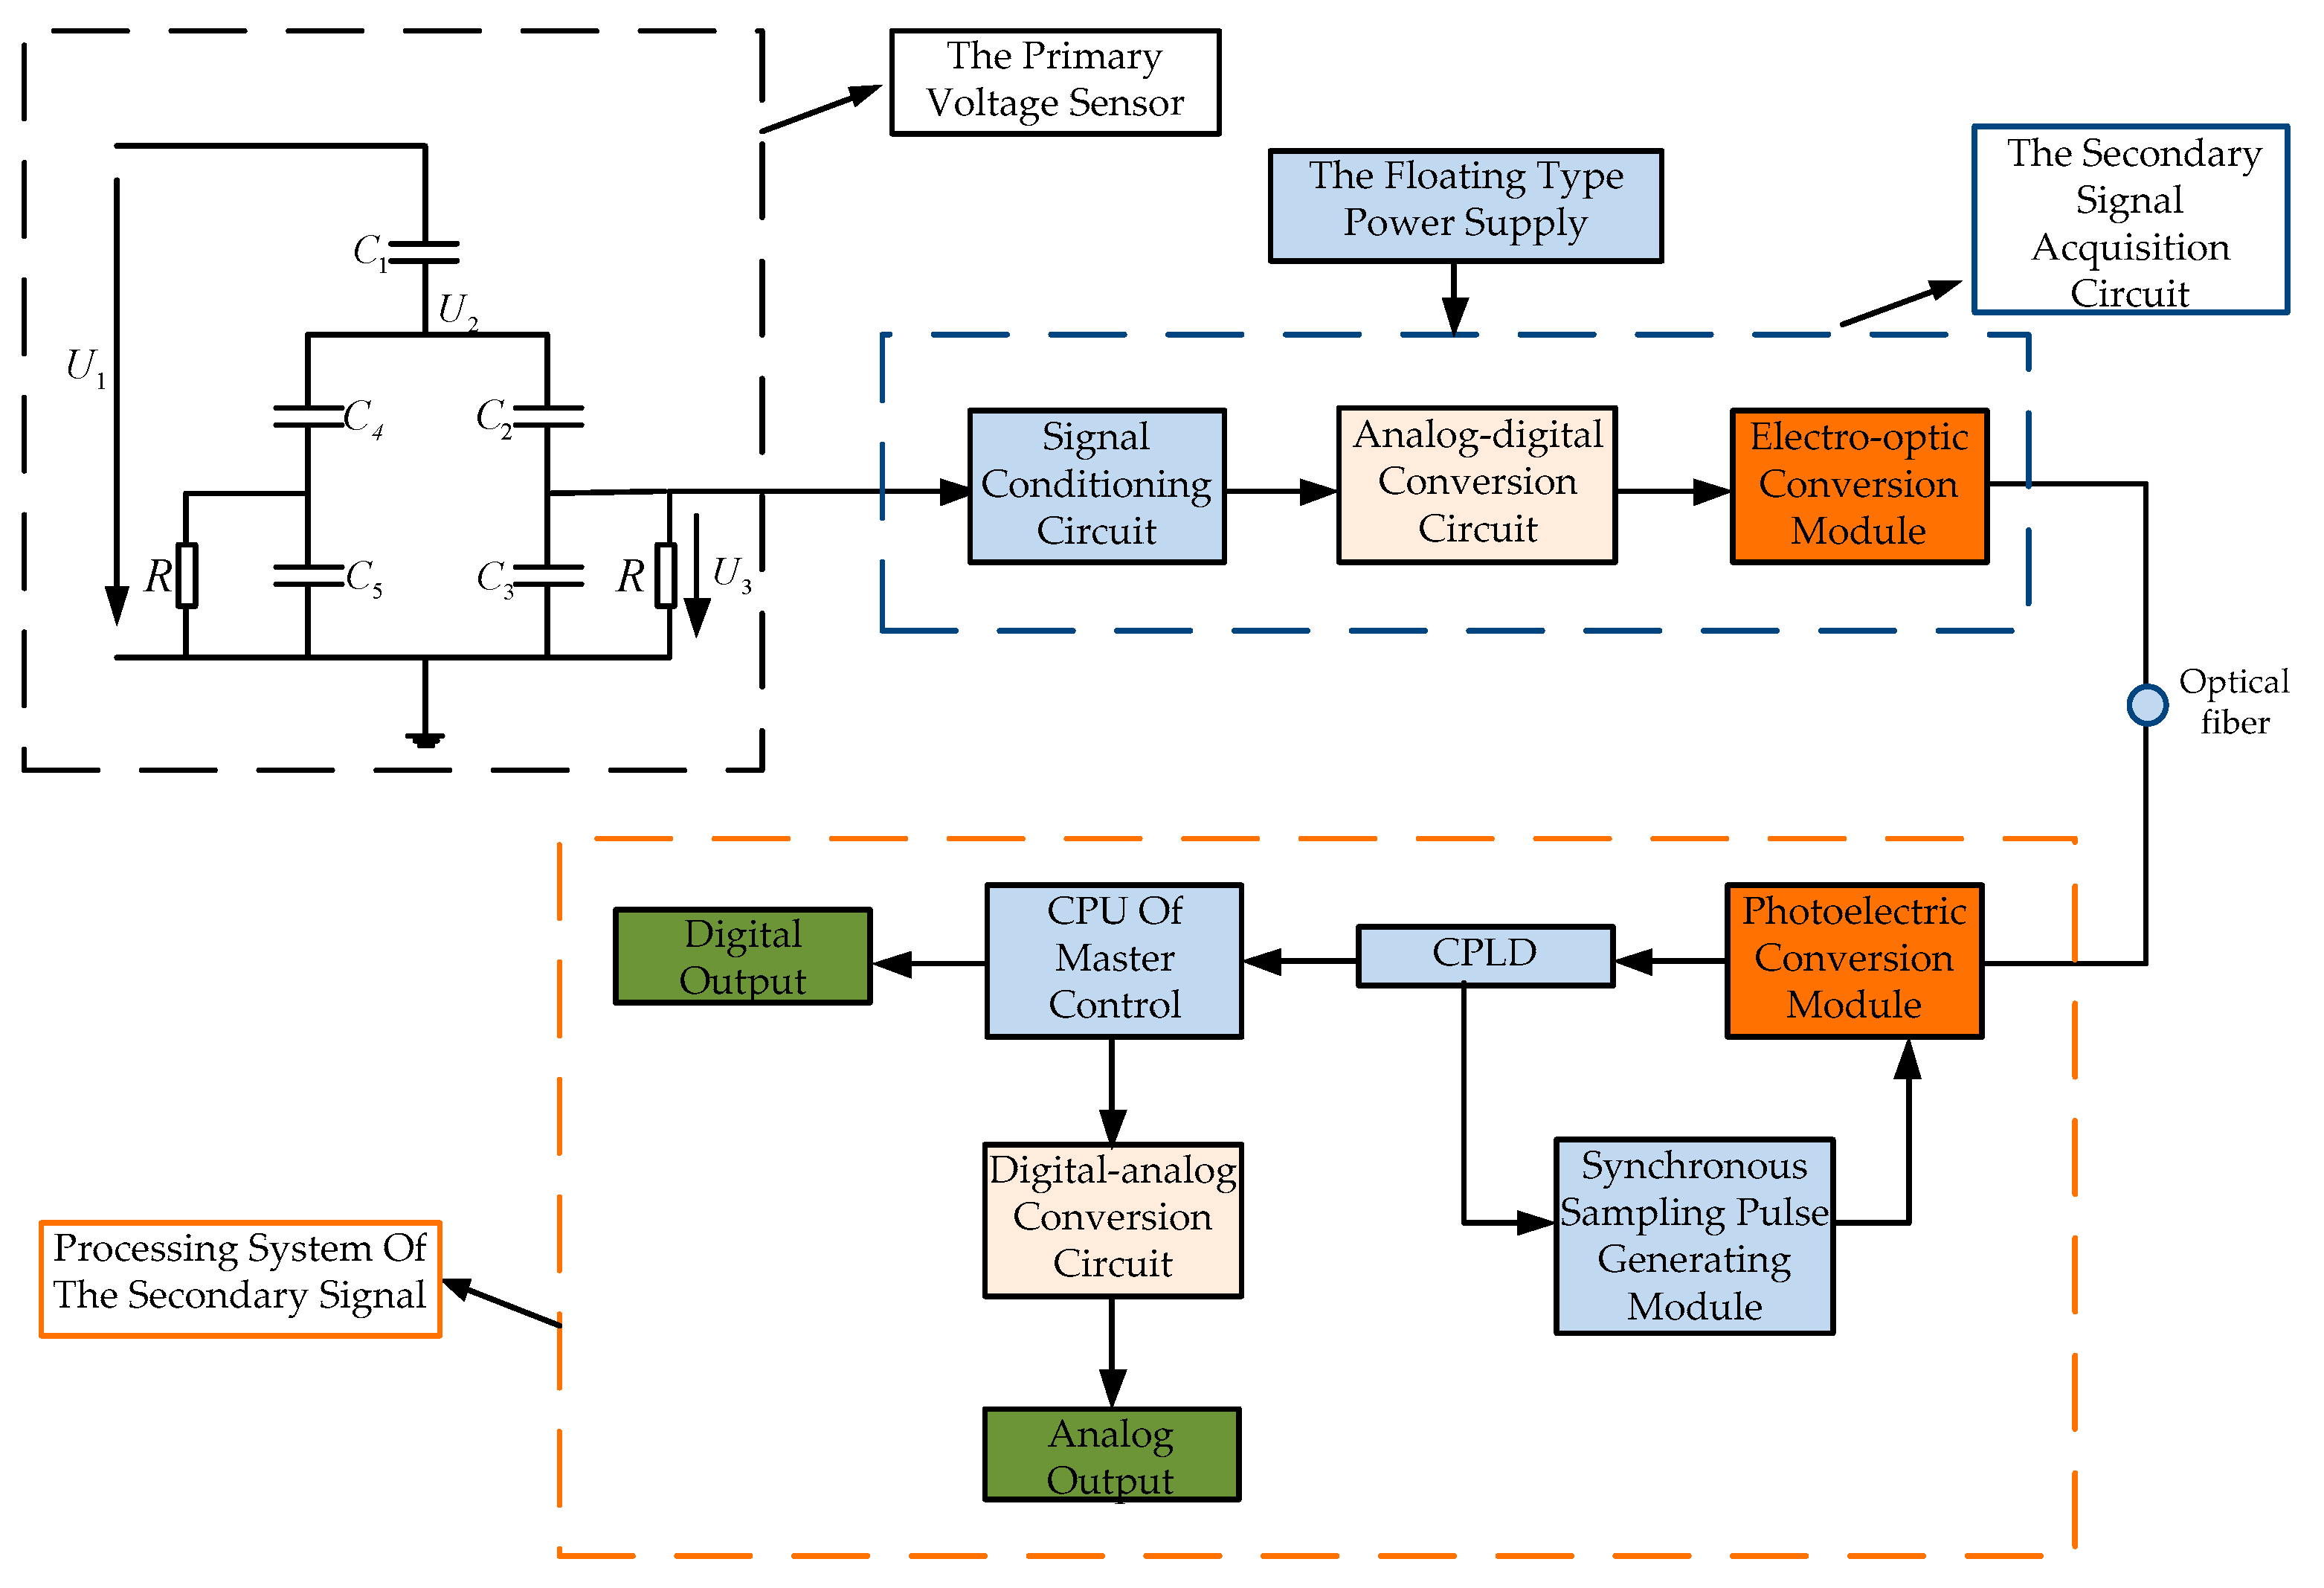
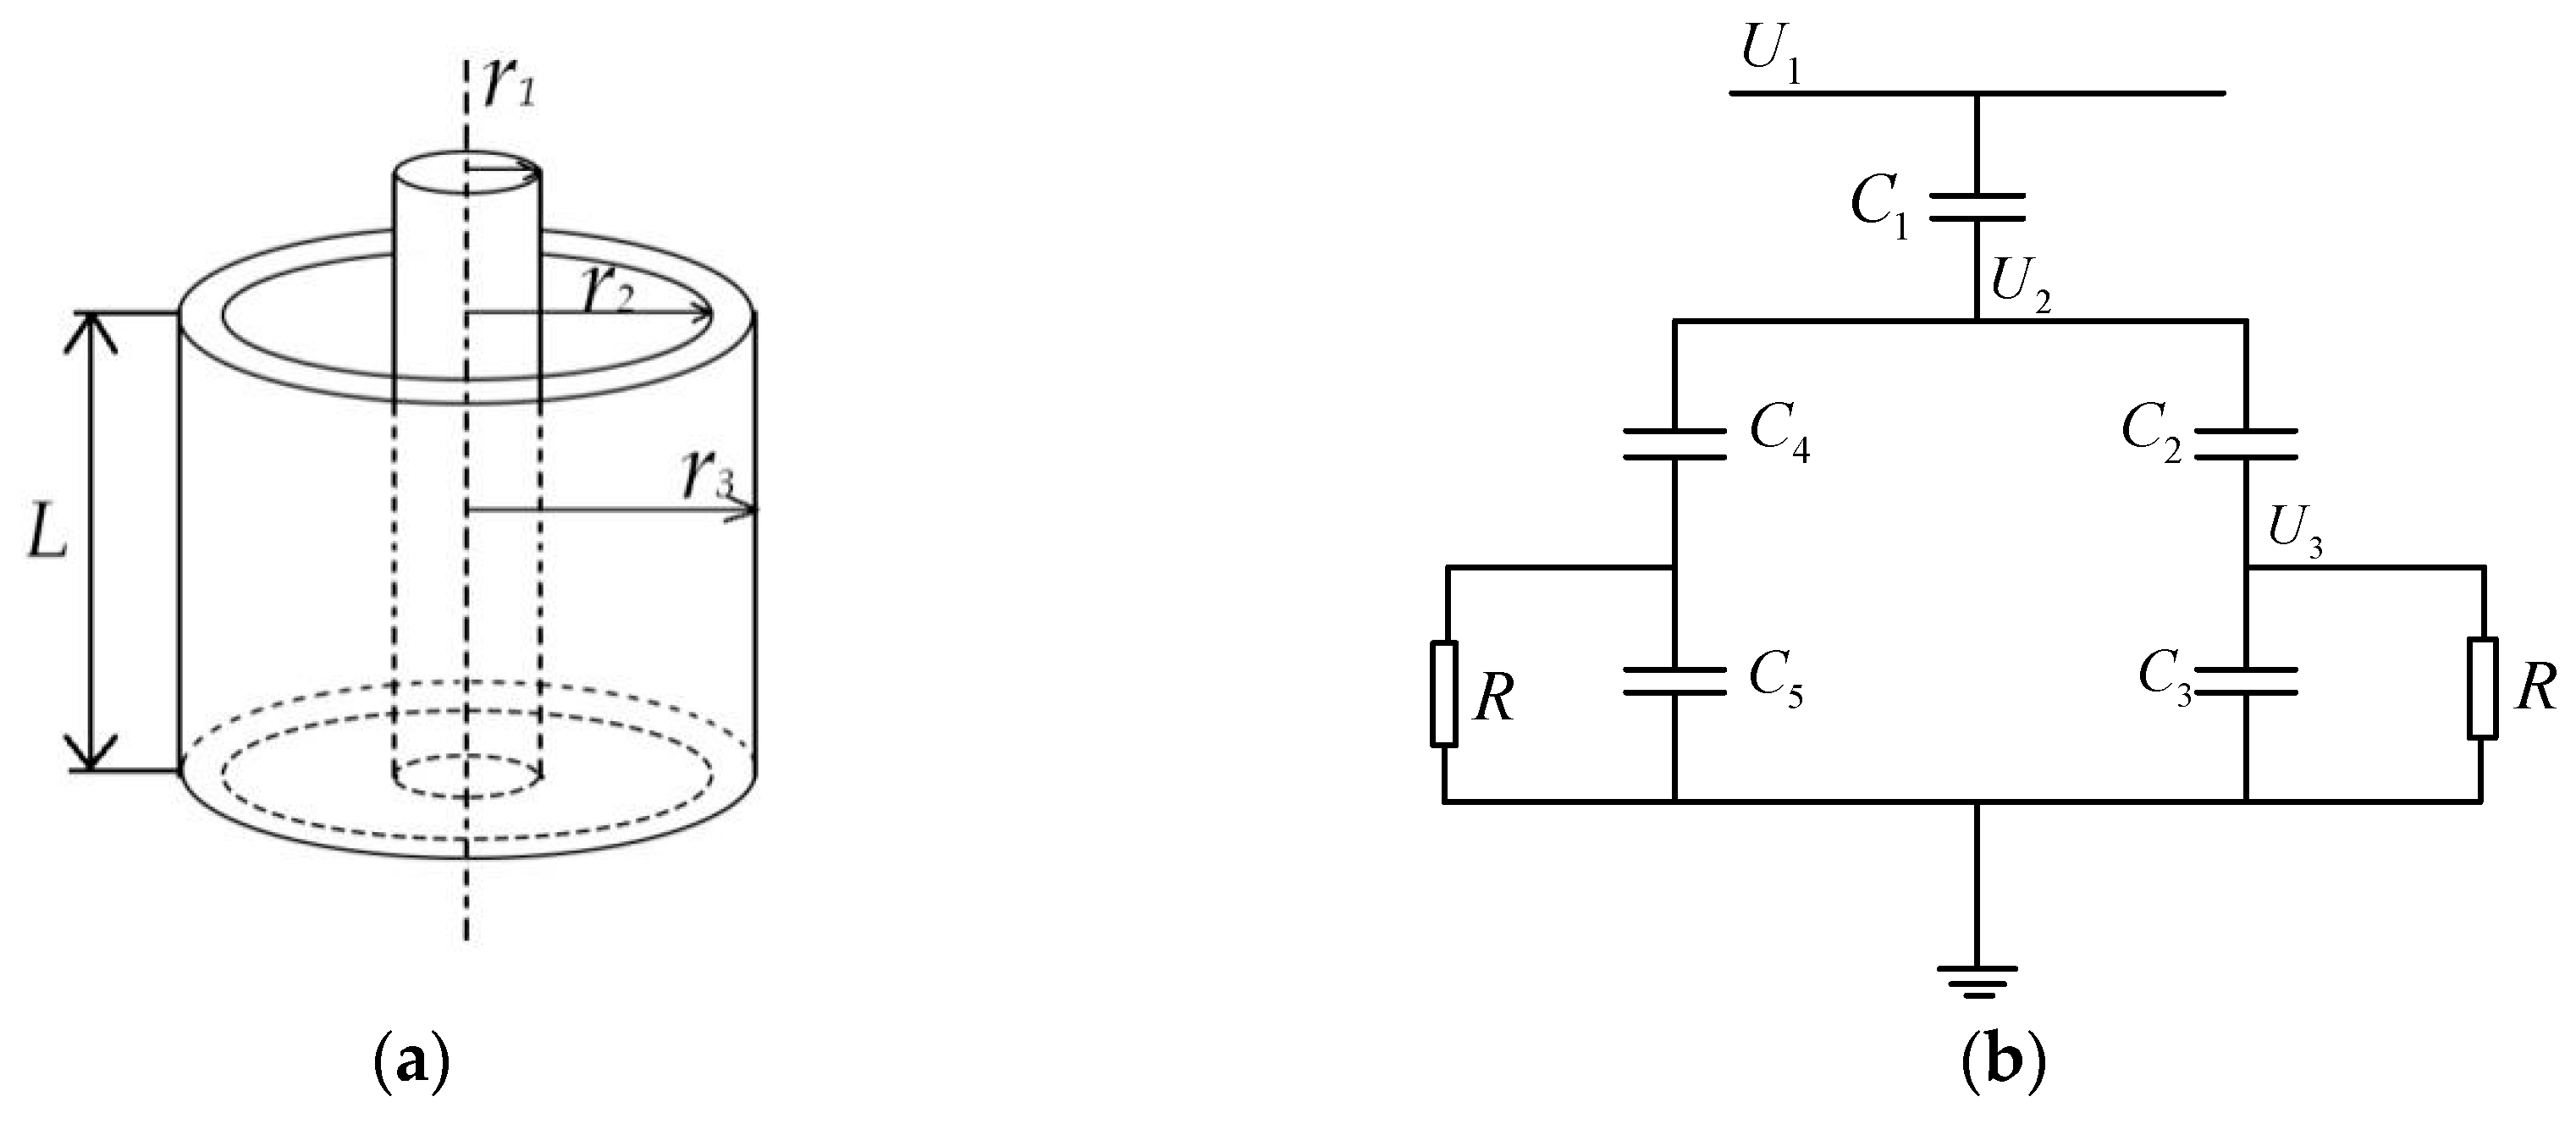
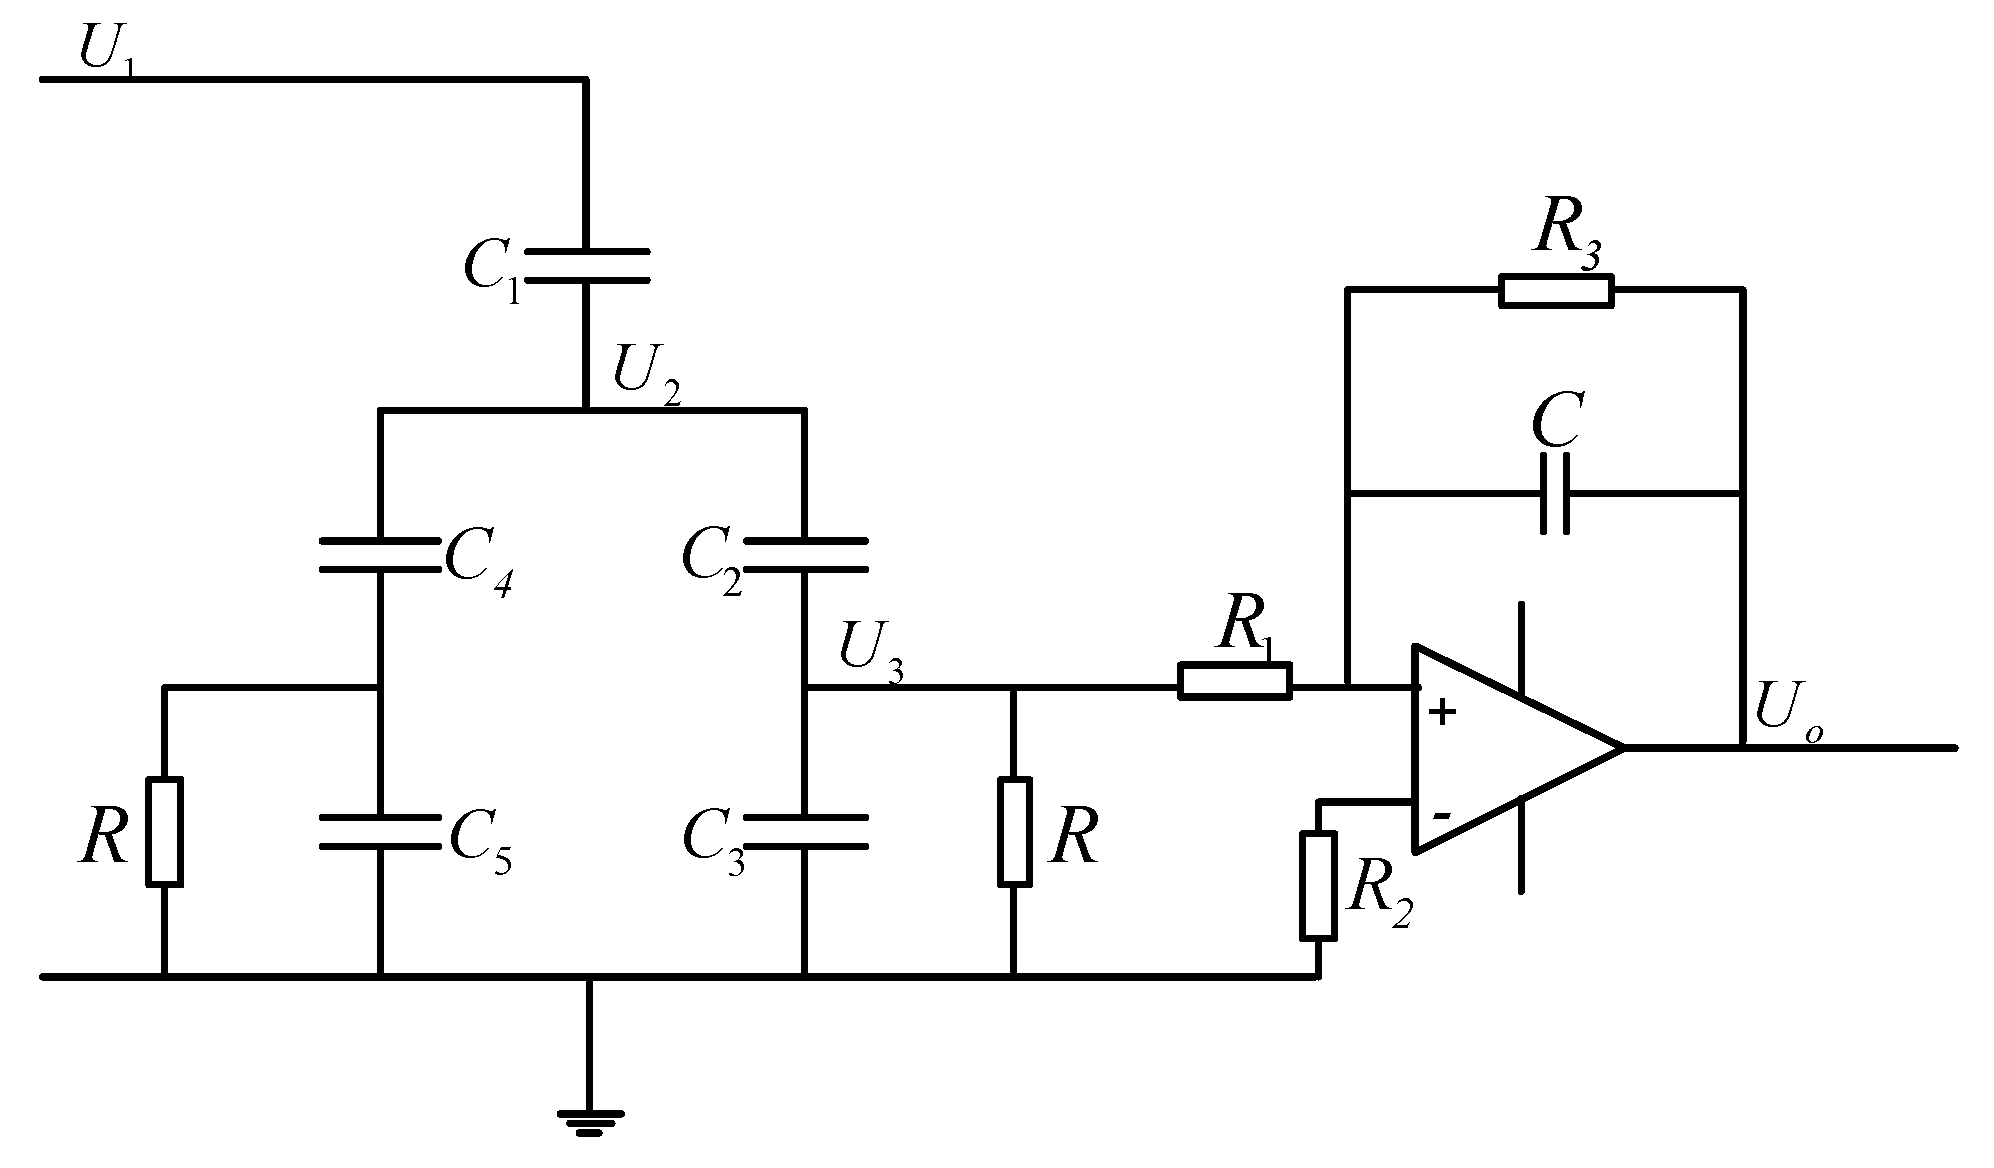
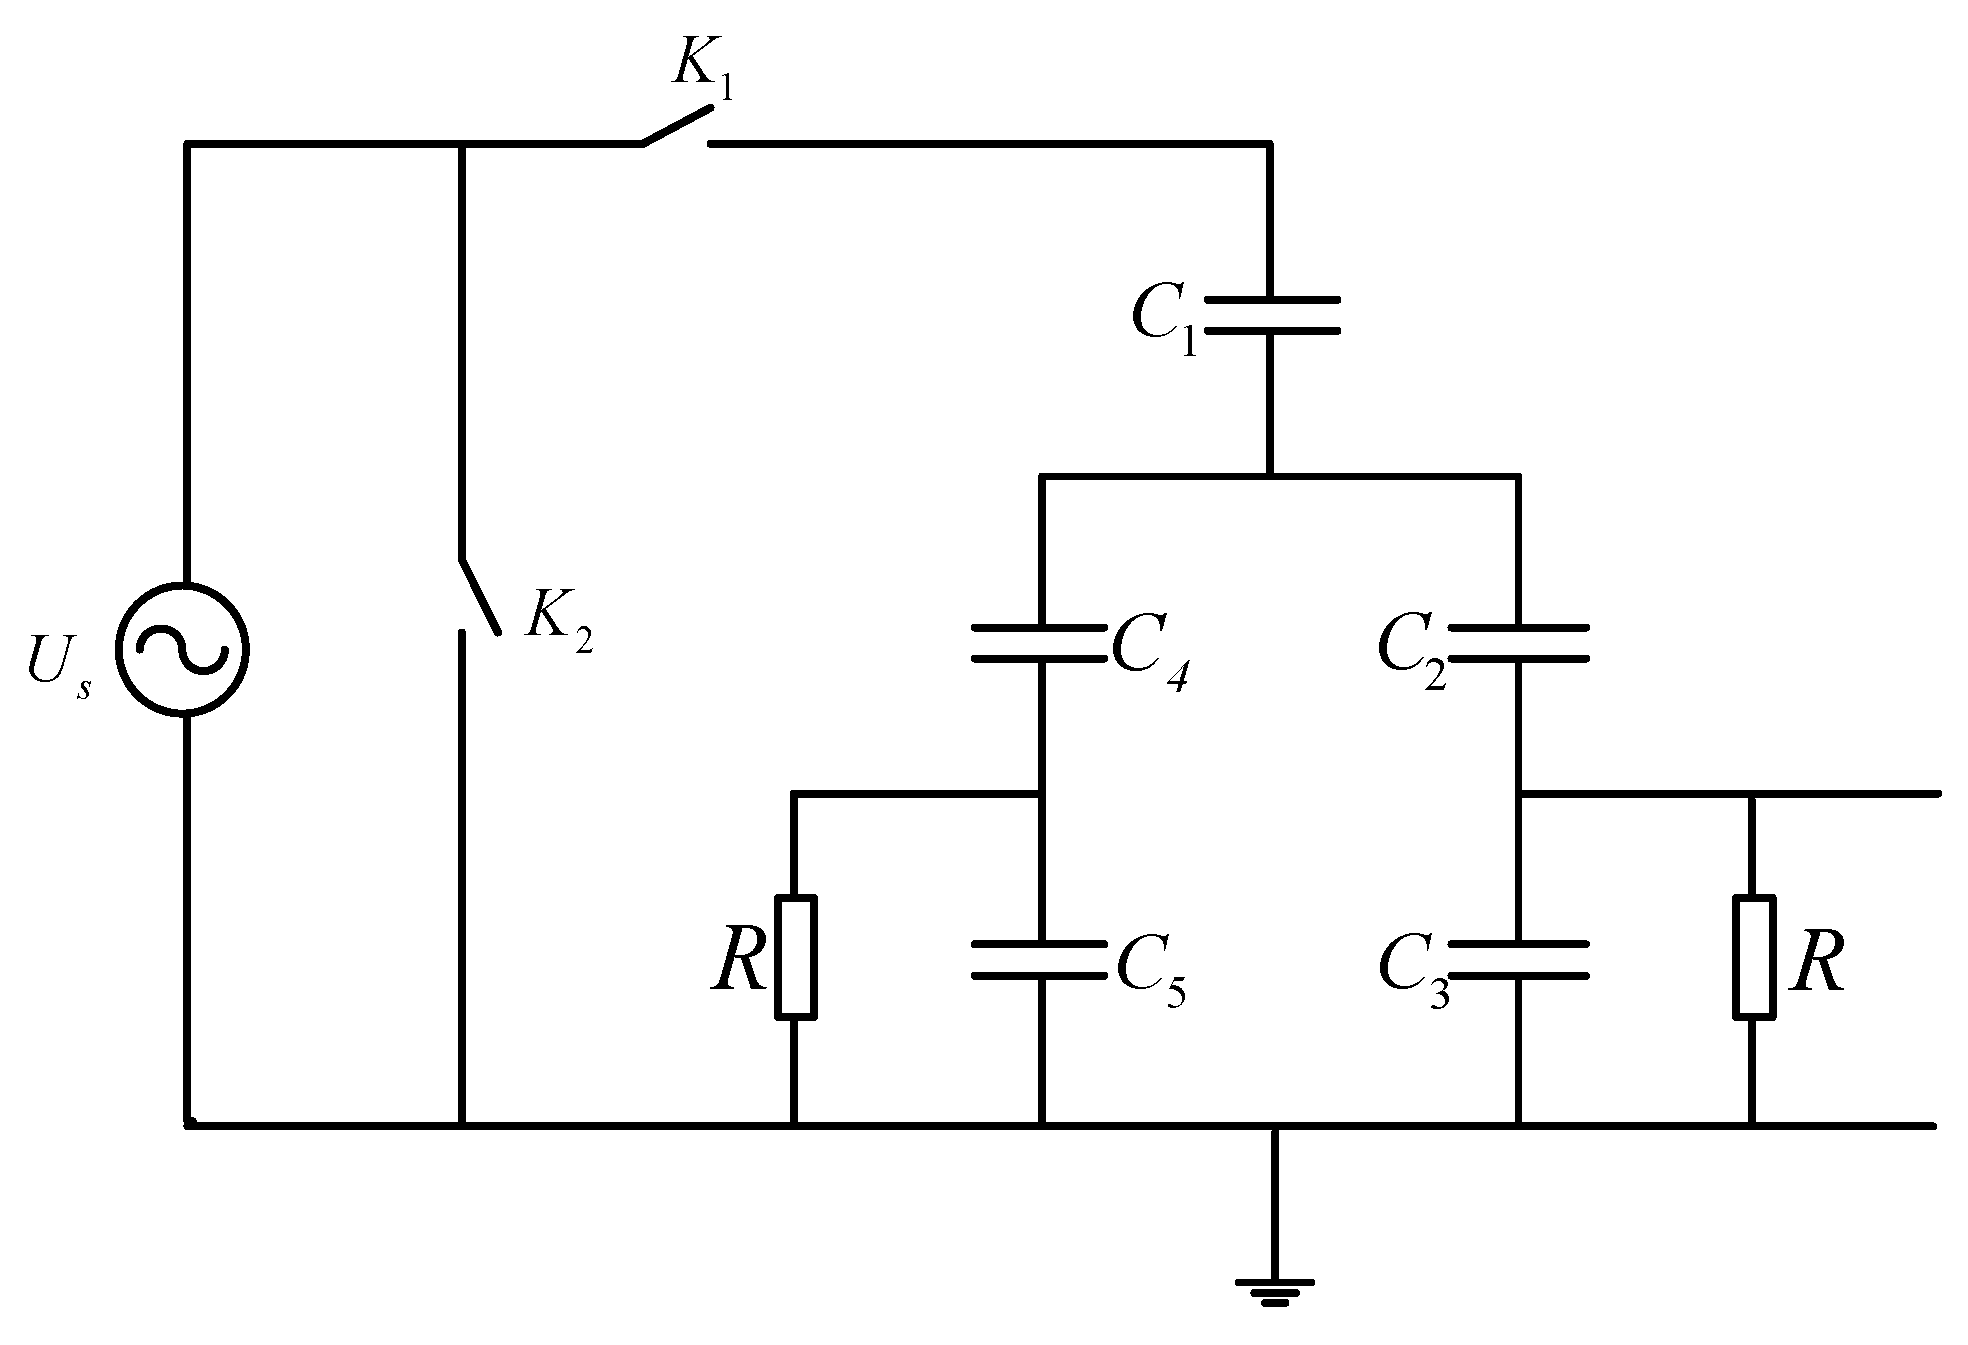
2. Models of ECVT
3. Characteristics Analysis of ECVT
3.1. Transient Characteristics Analysis of ECVT
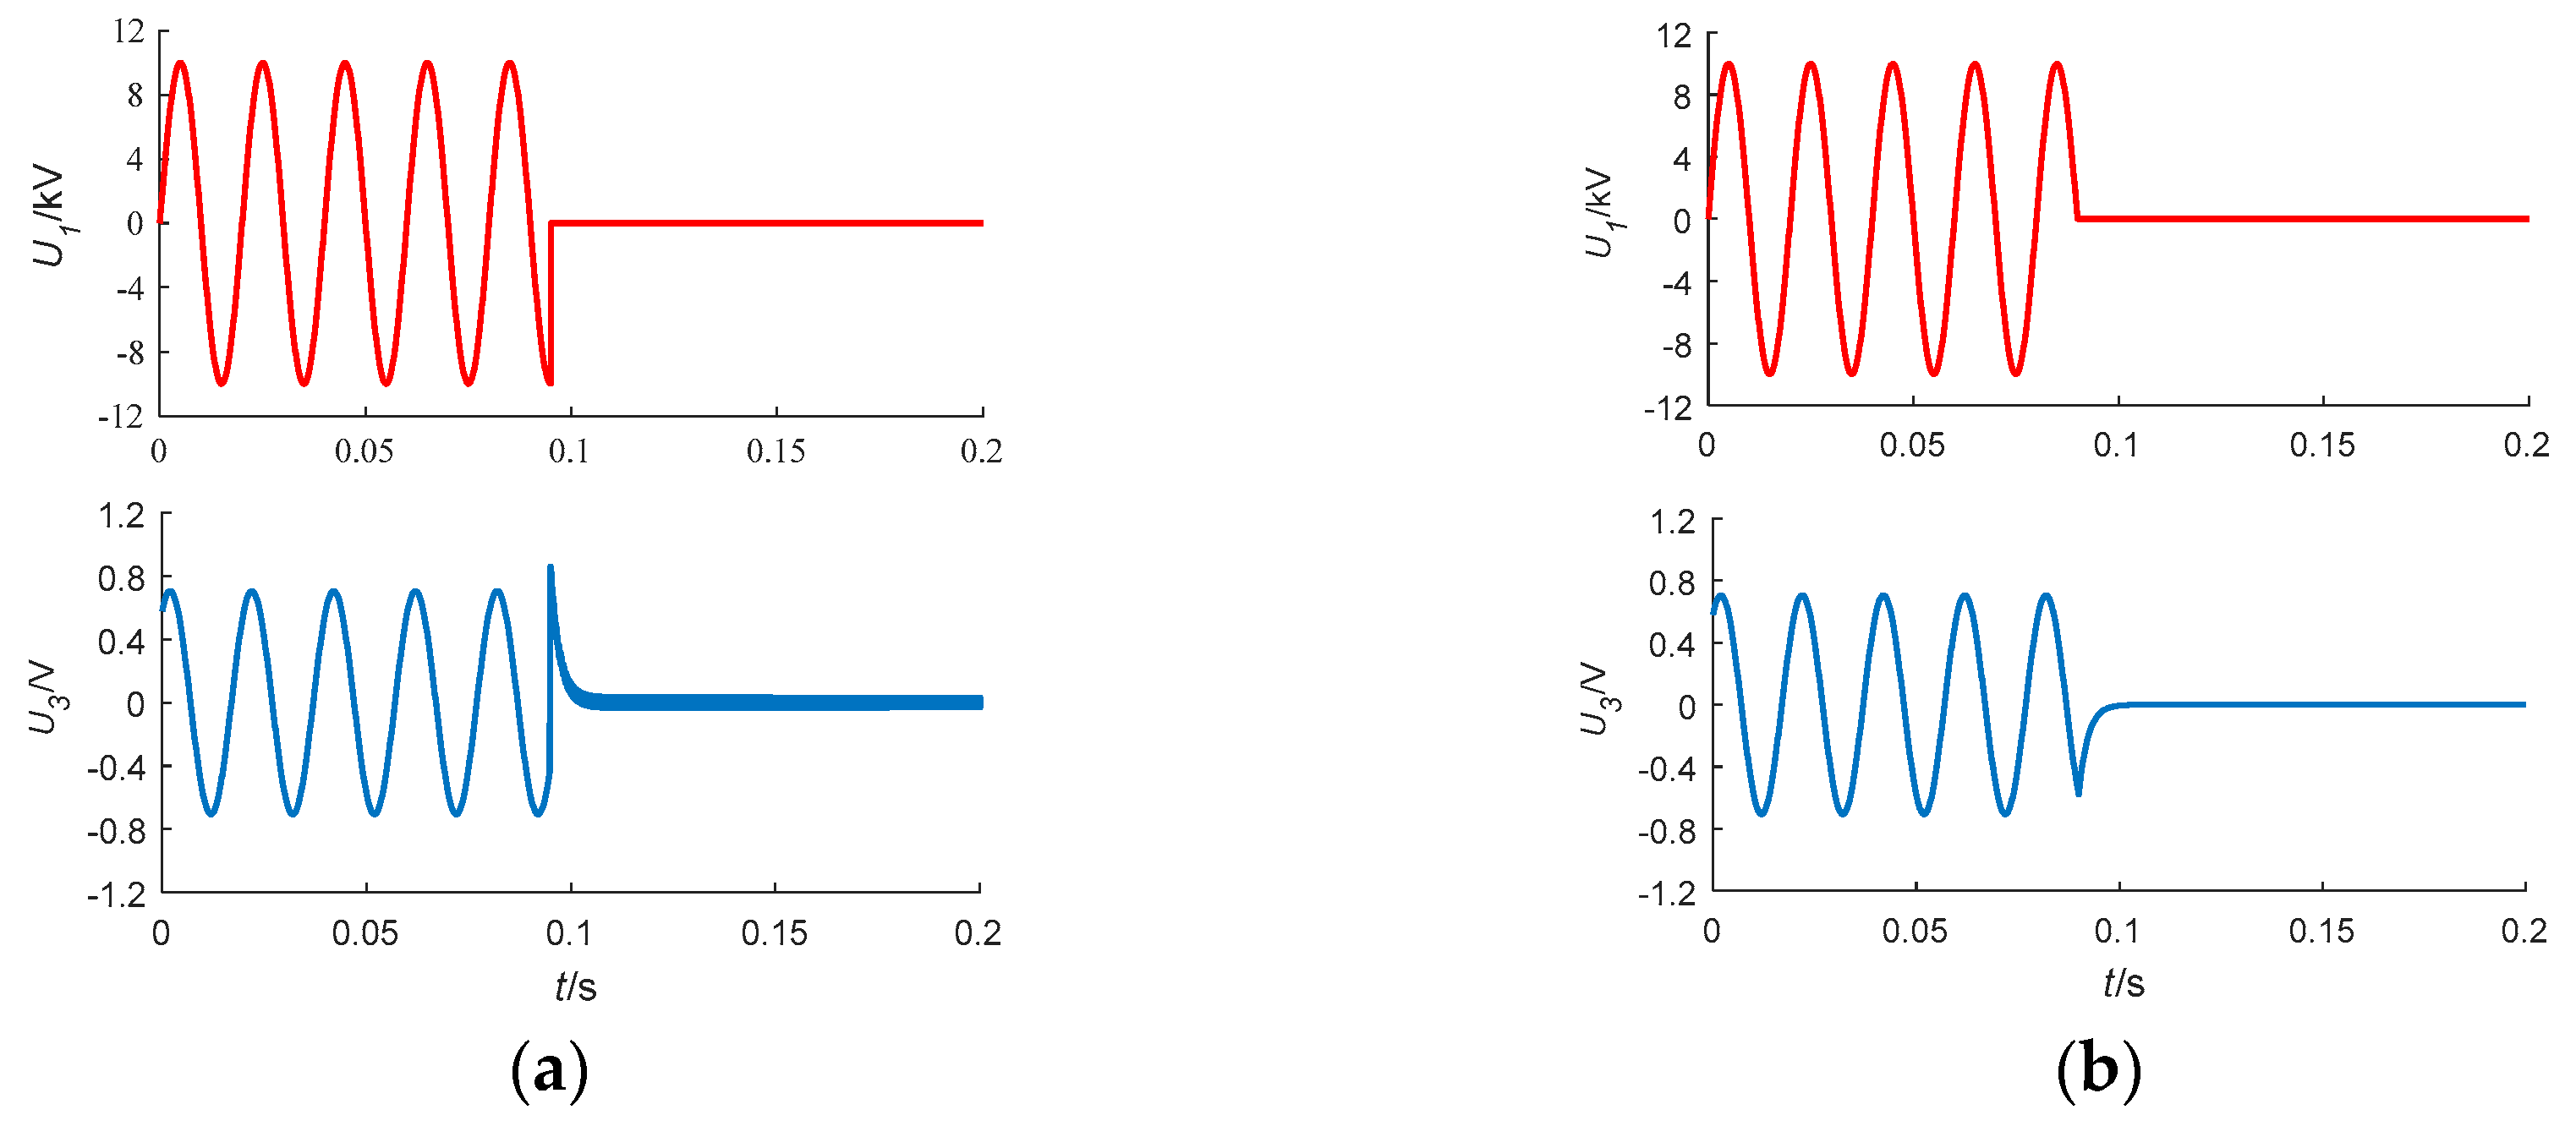
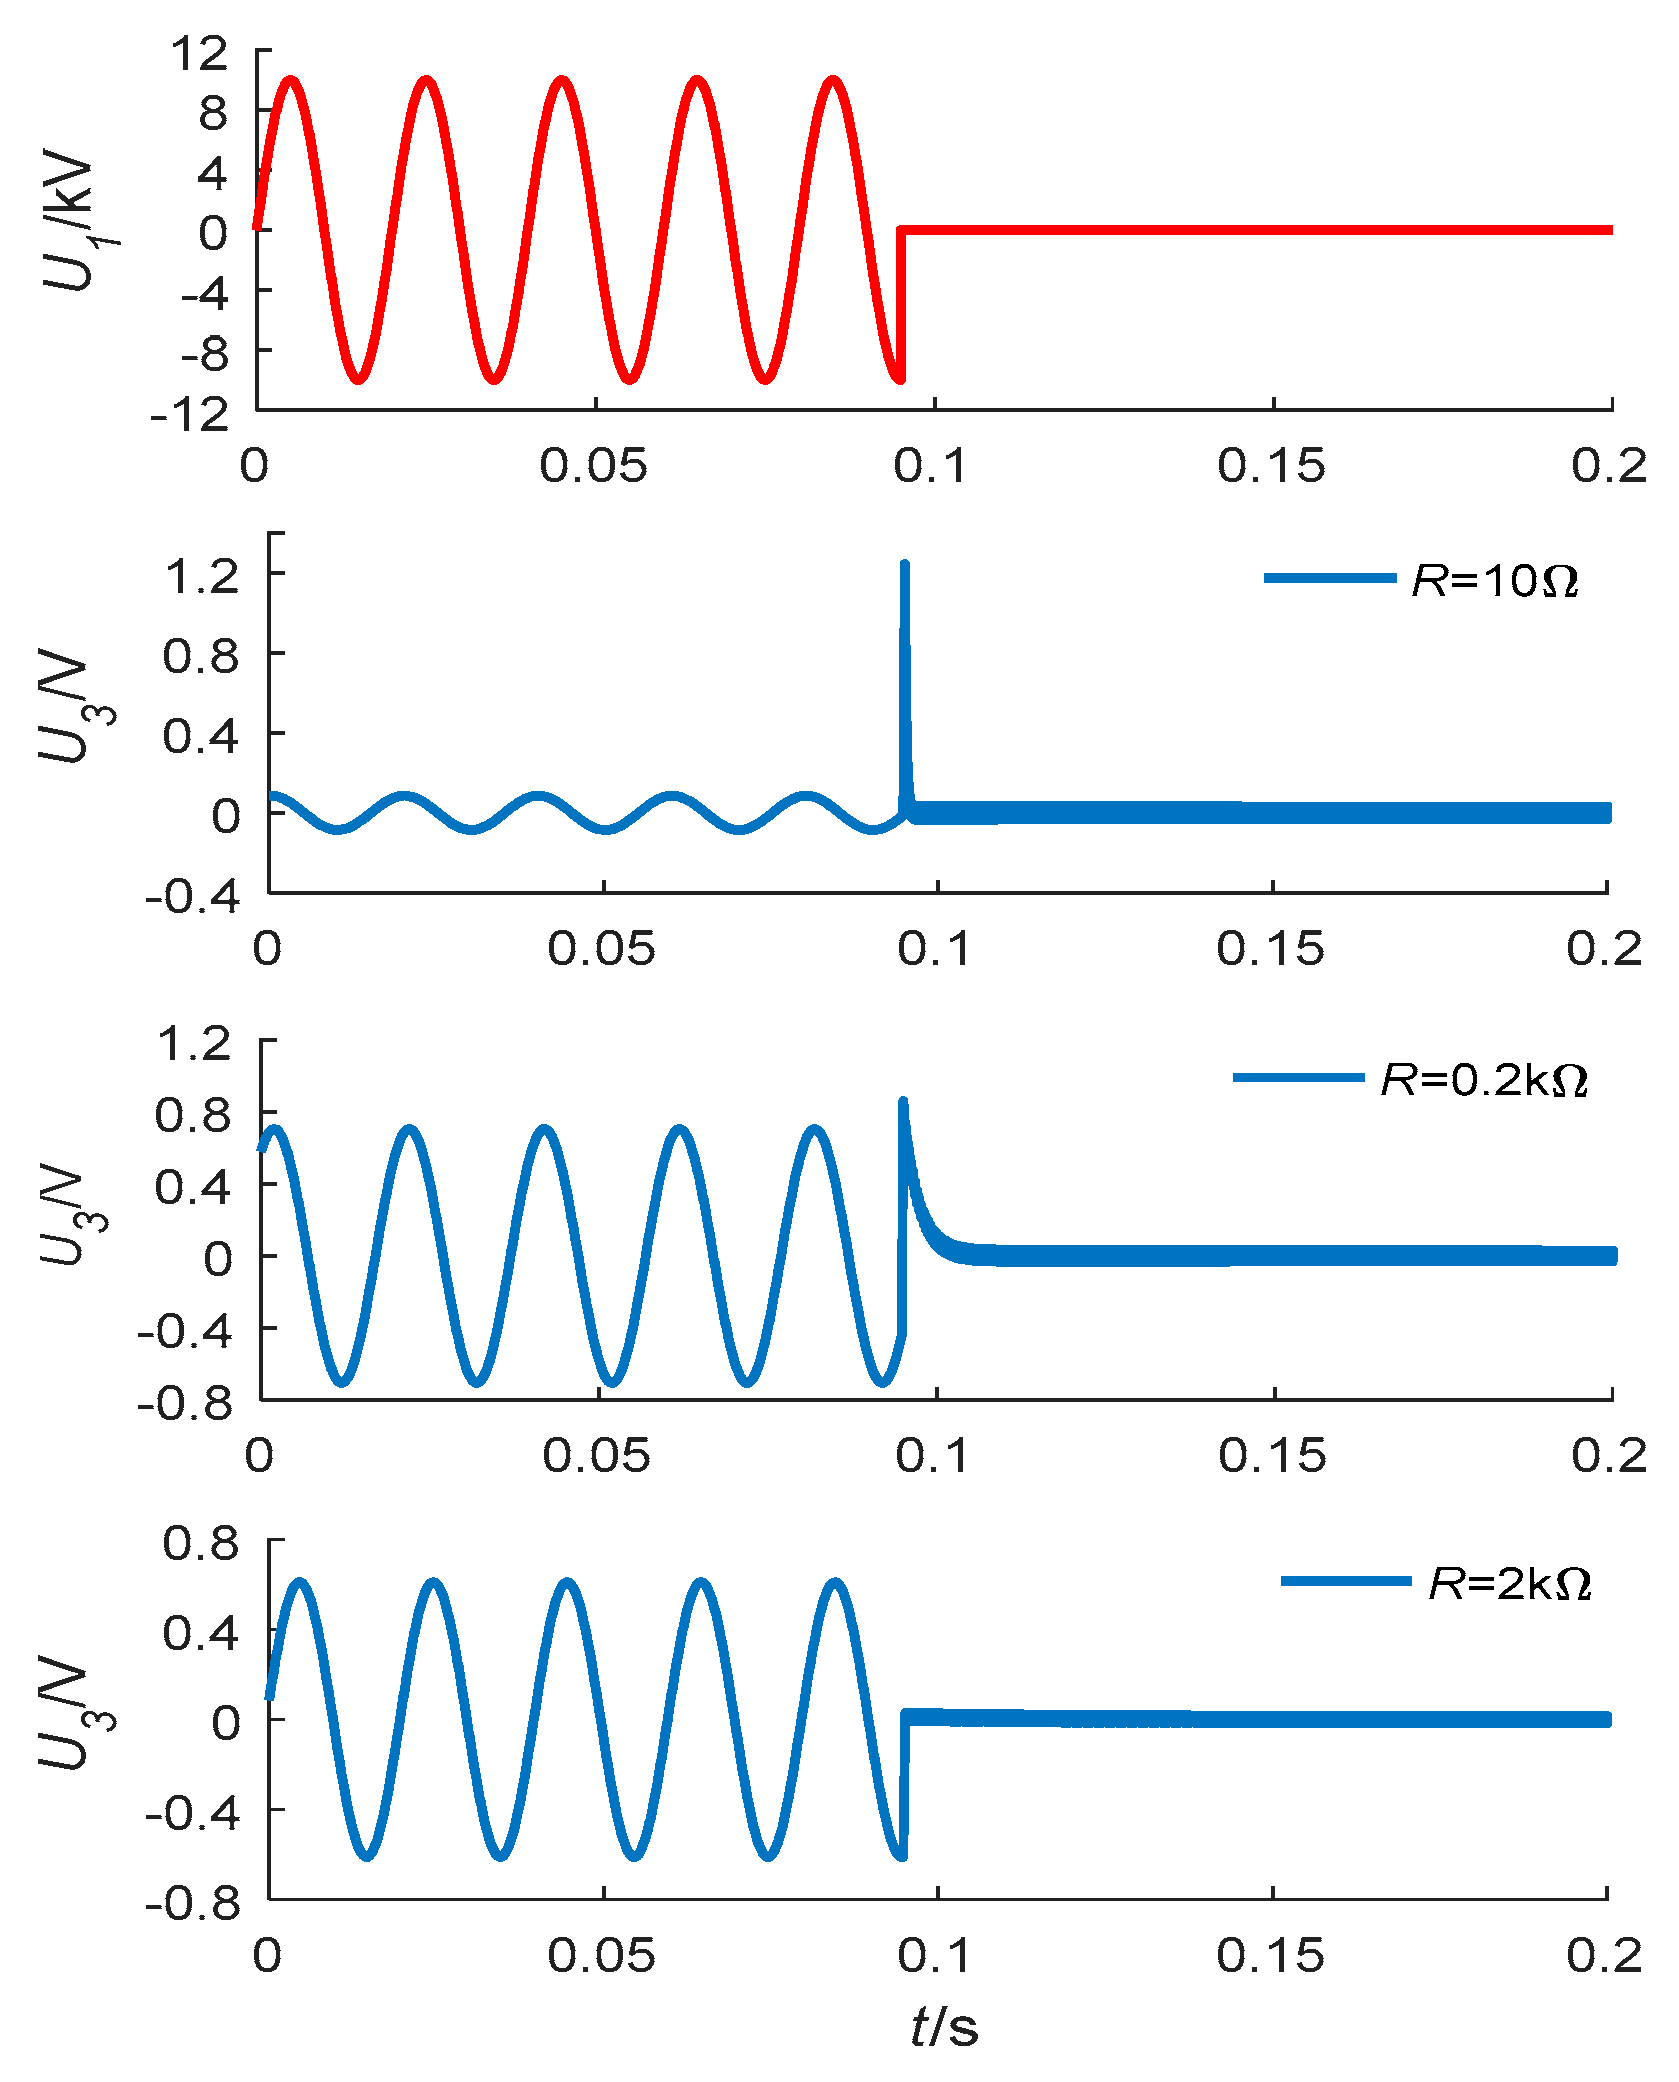
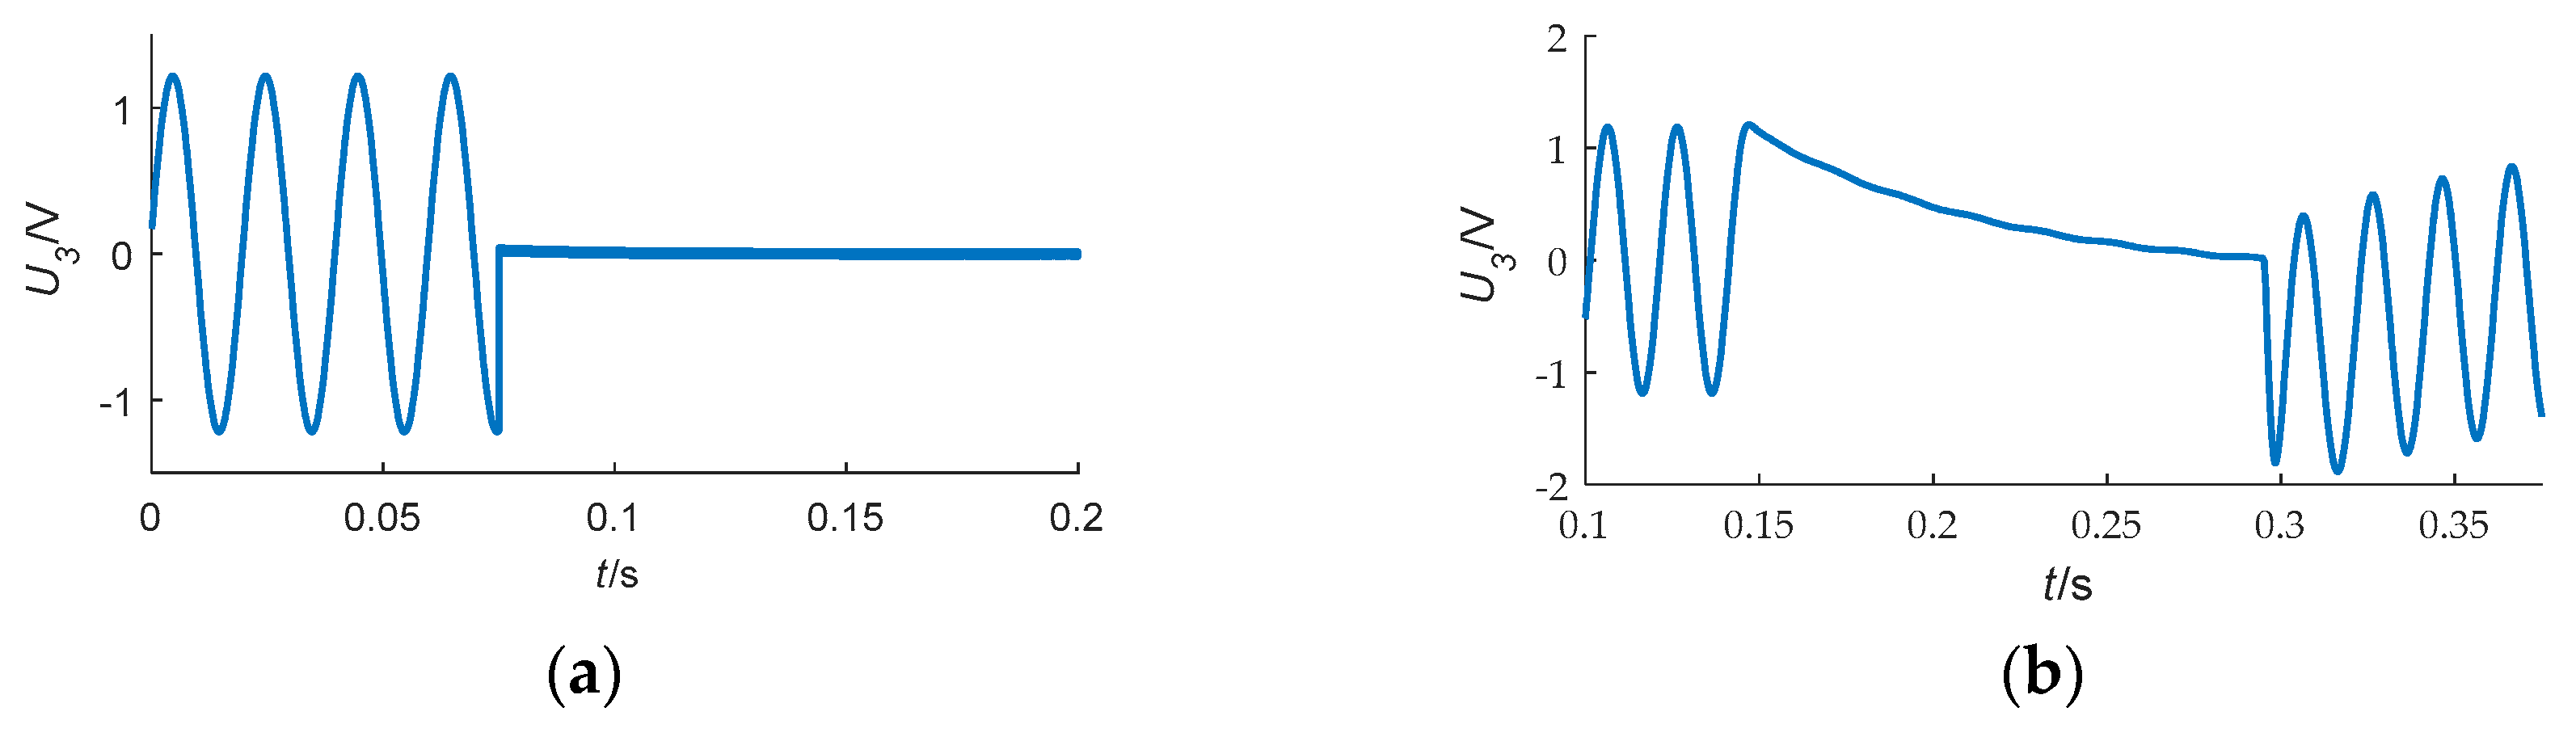
3.1.1. The Transient Process of Short Circuit
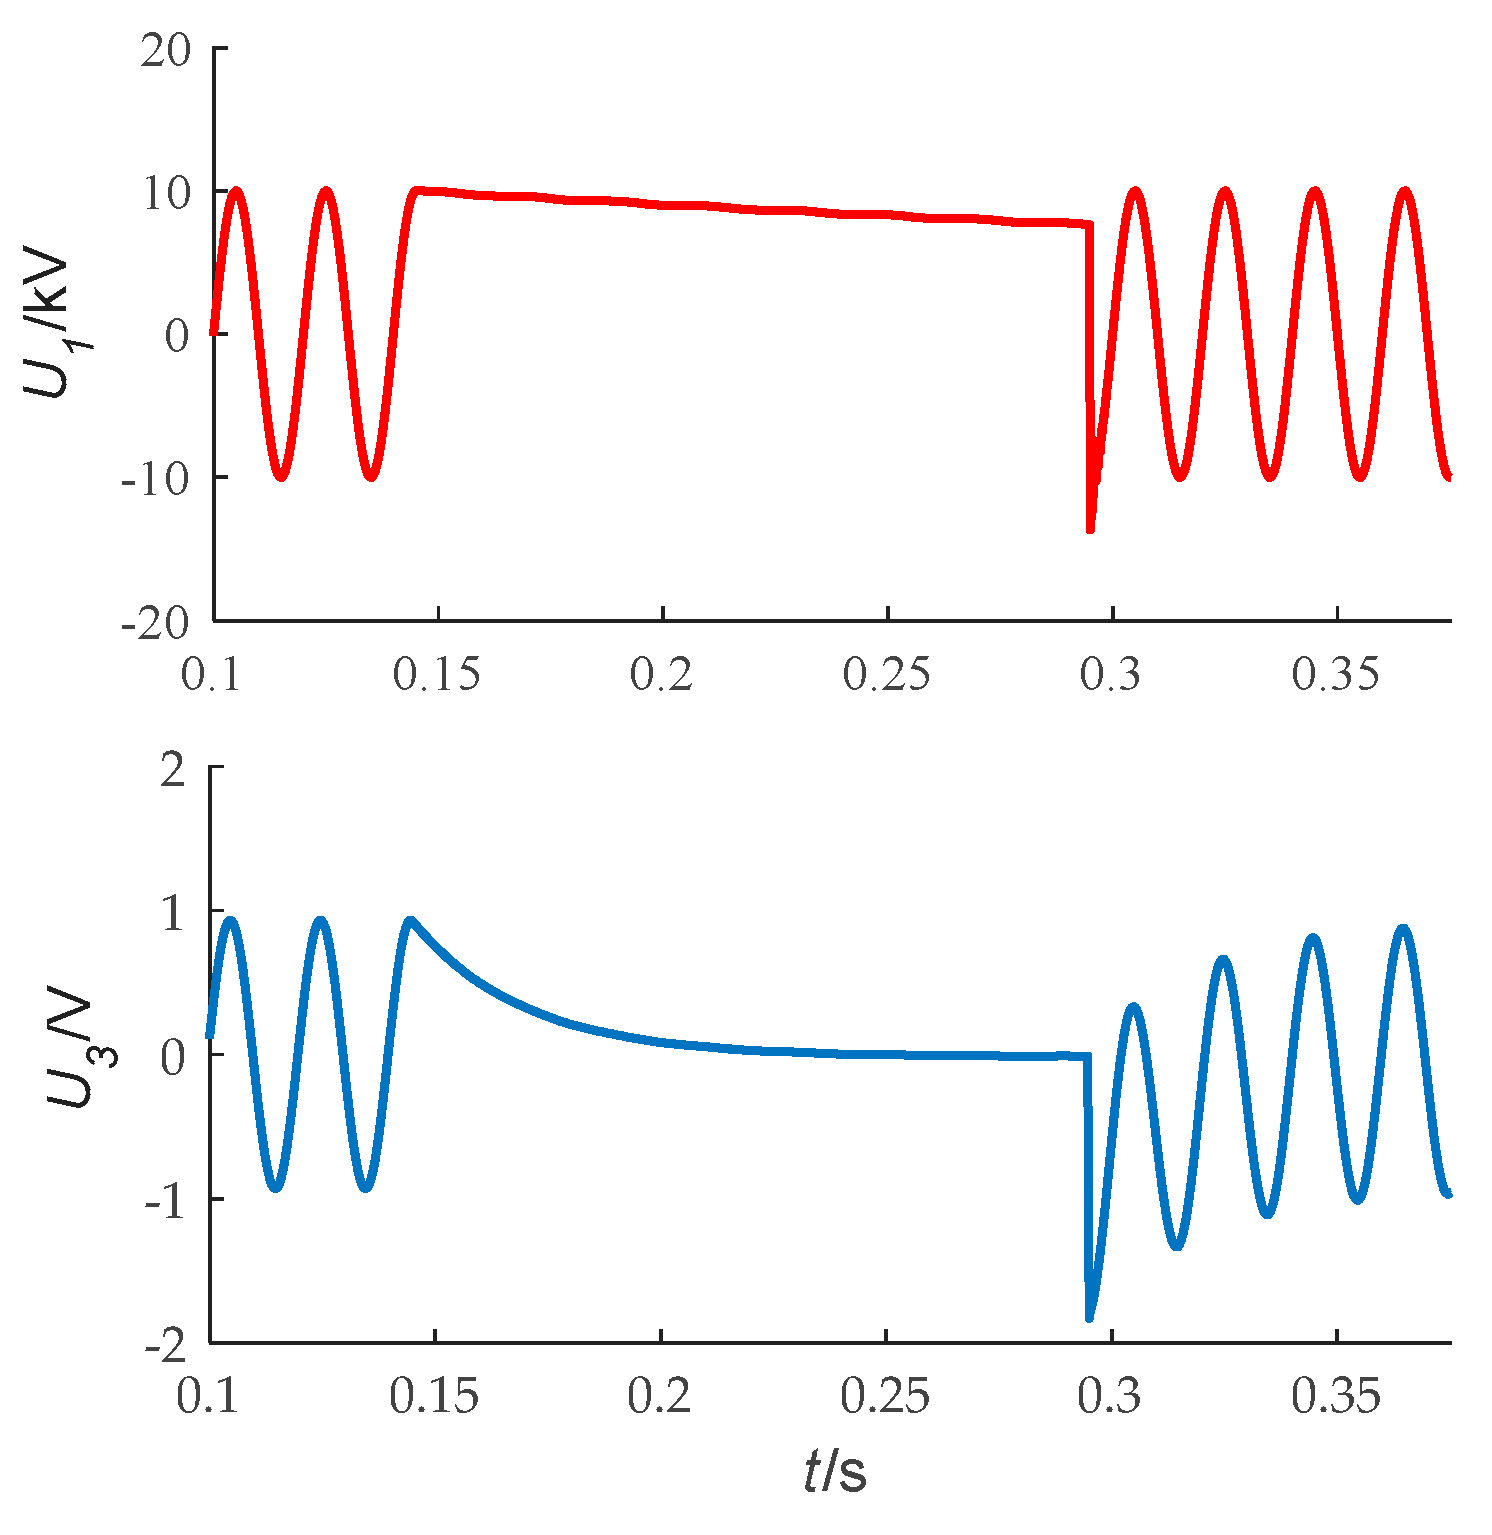
3.1.2. The Transient Process of Reclosing
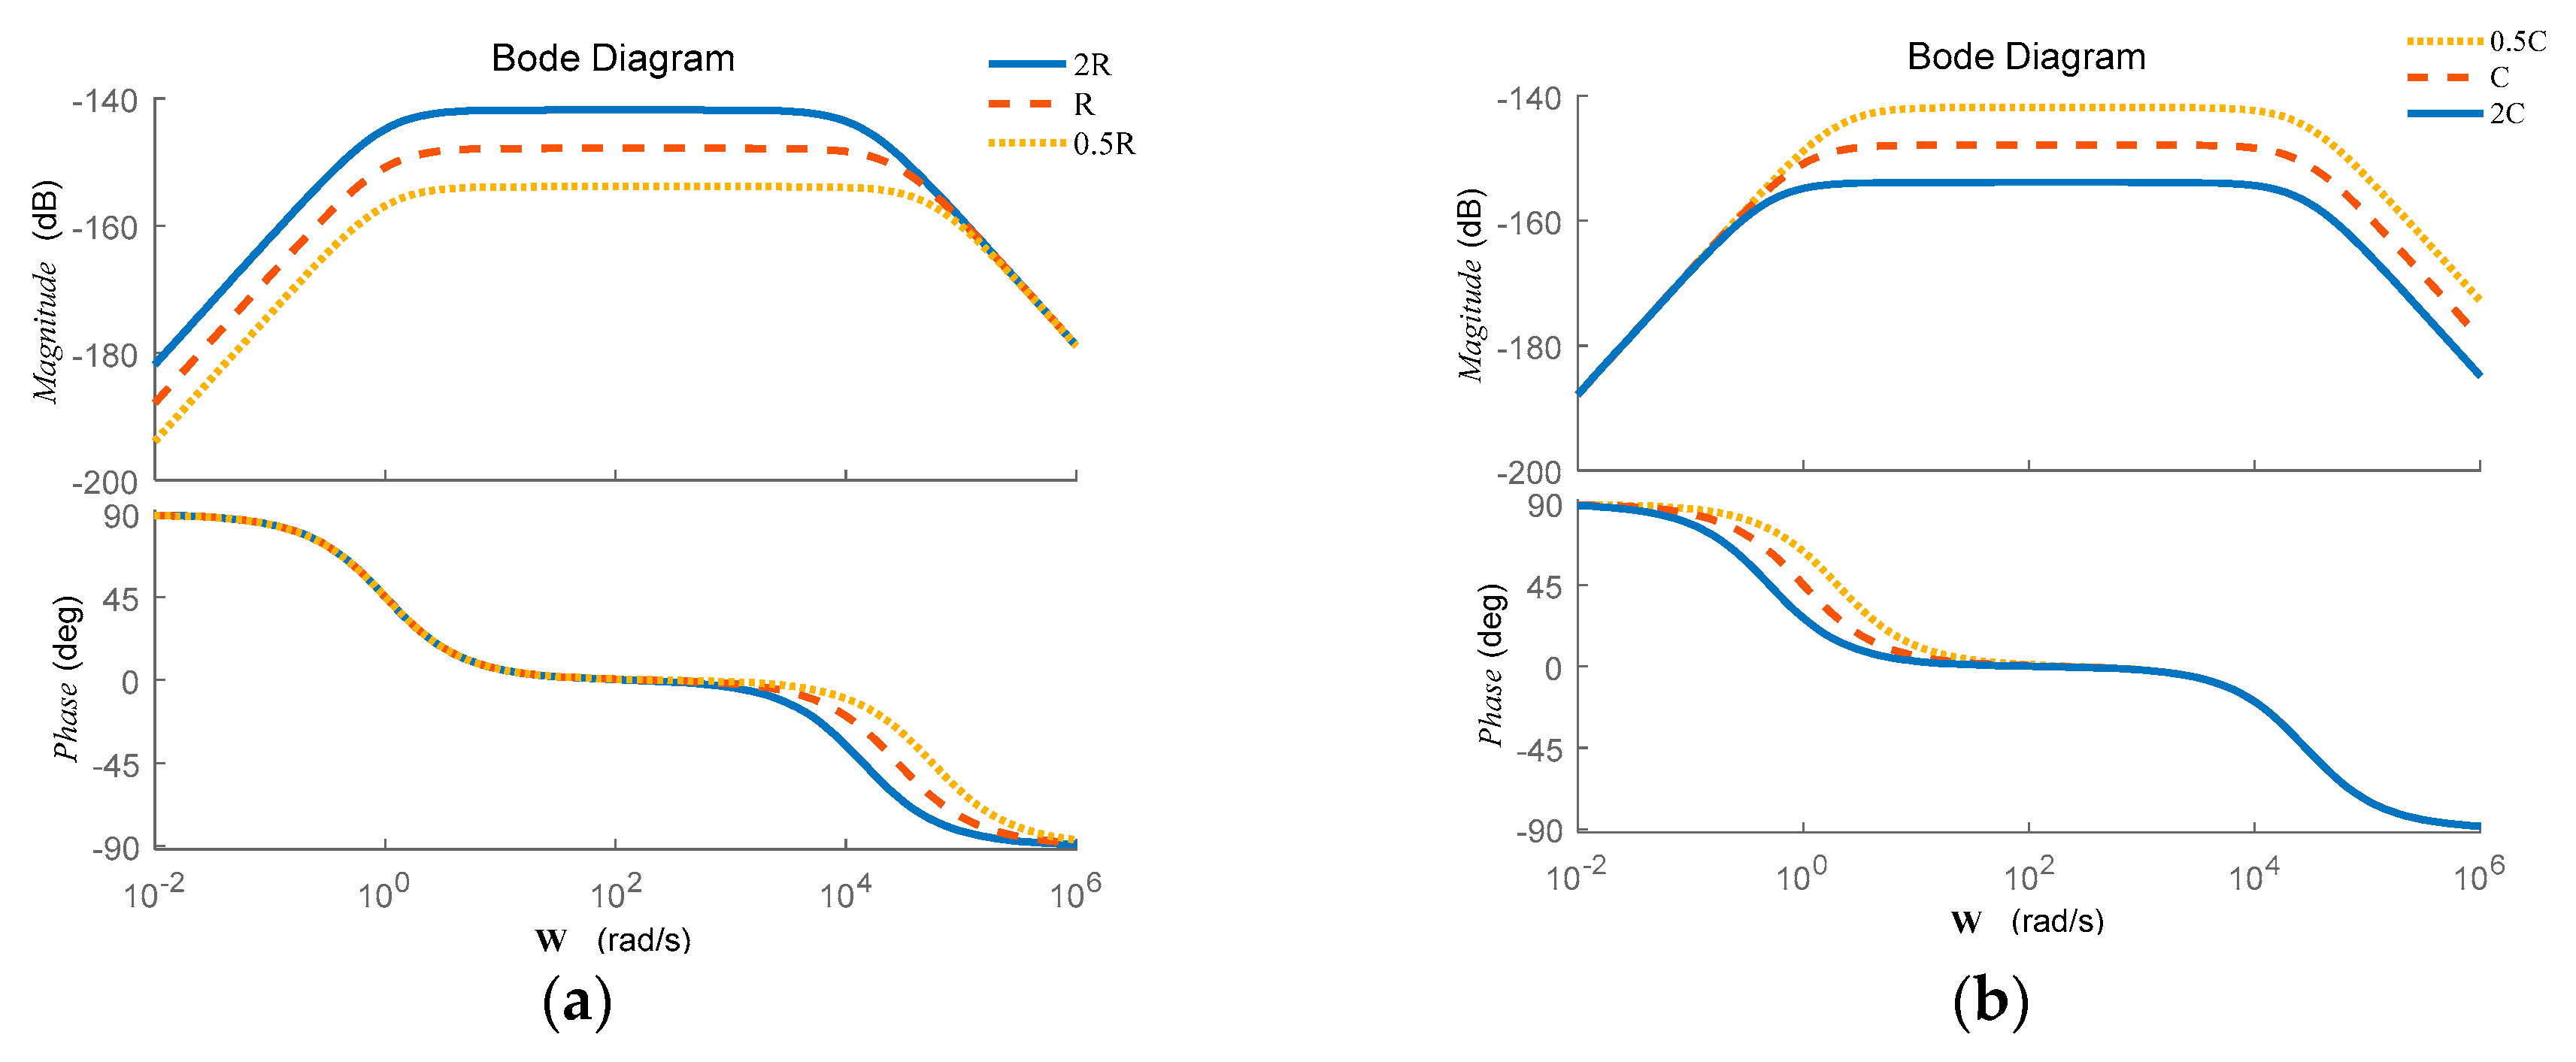
3.2. Transfer Characteristics Analysis of ECVT
4. Simulation Analysis and Optimum Design of ECVT
4.1. Simulation Analysis of Transient Characteristics
4.1.1. Short Circuit
4.1.2. Reclosing
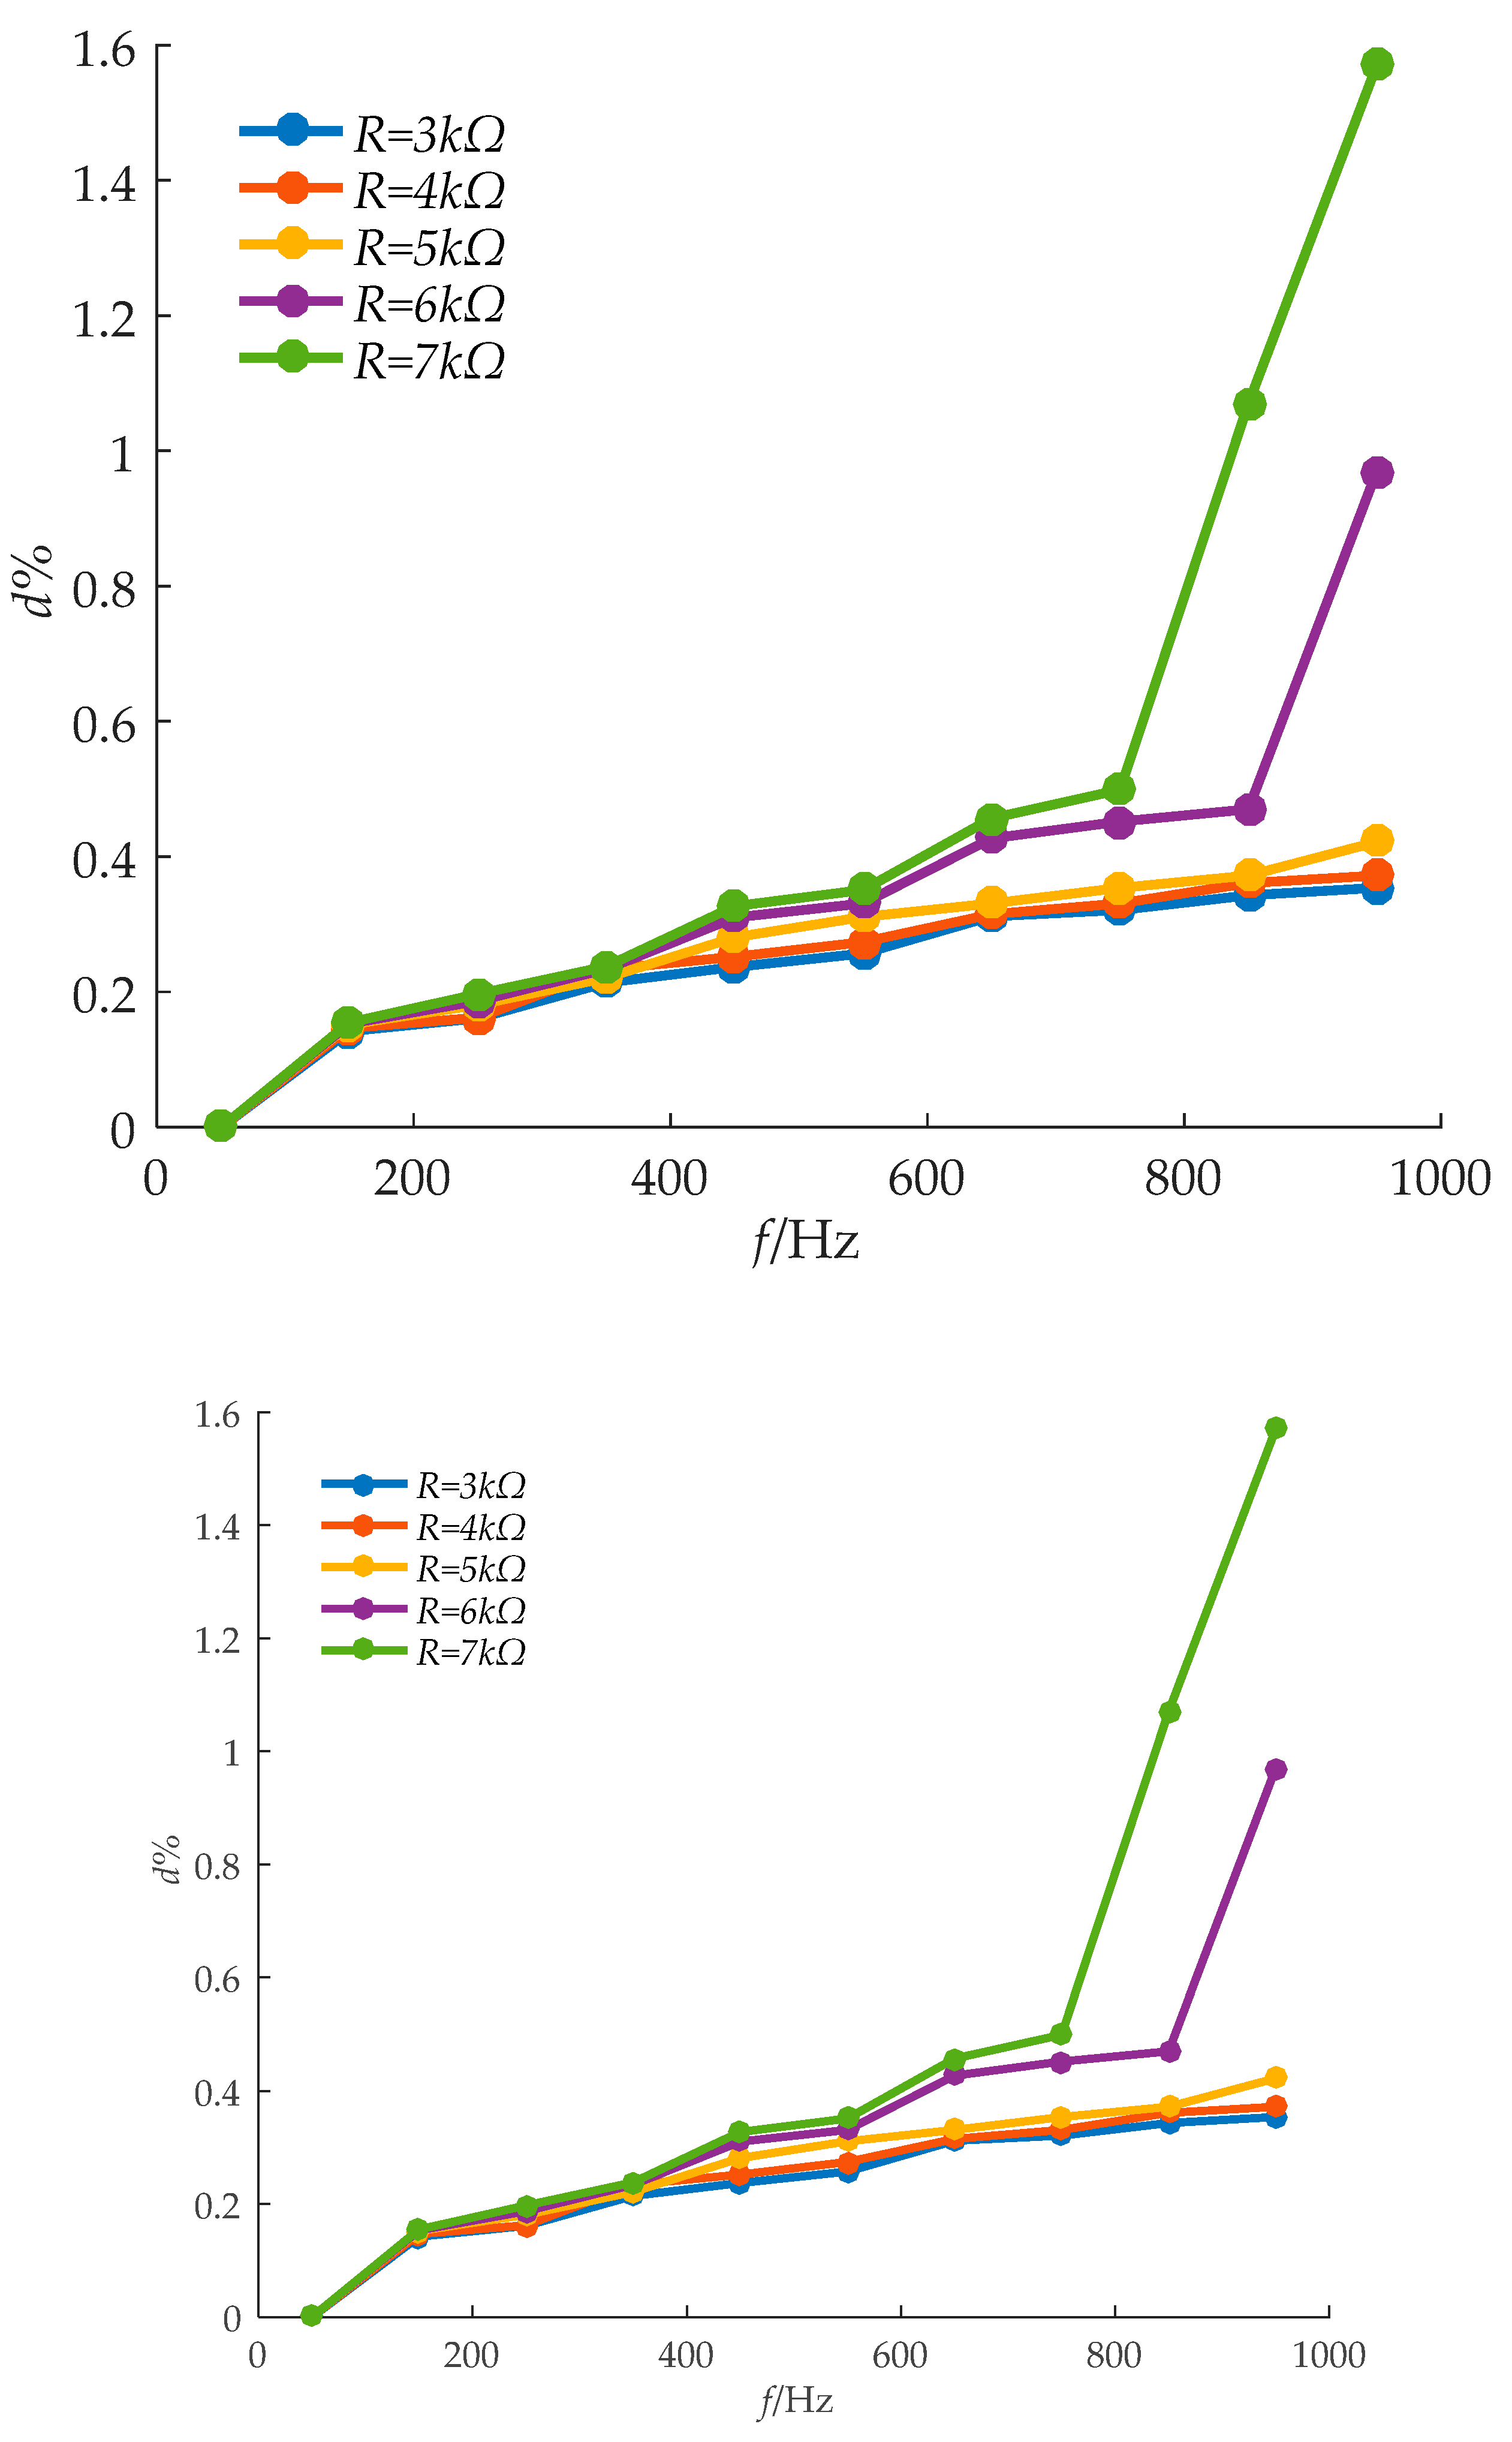
4.2. Simulation Analysis of Transfer Characteristics
5. Parameter Optimization Design of ECVT
5.1. Target Function
5.1.1. Minimize Duration of Transient Voltage Attenuation
5.1.2. Maximum Frequency Bandwidth
5.1.3. Minimize Transient Impulse Voltage
5.2. Constraint Condition
5.2.1. Transient Voltage Error
5.2.2. Harmonic Measurement Error
5.2.3. Reclosing Time Interval
5.3. Solution
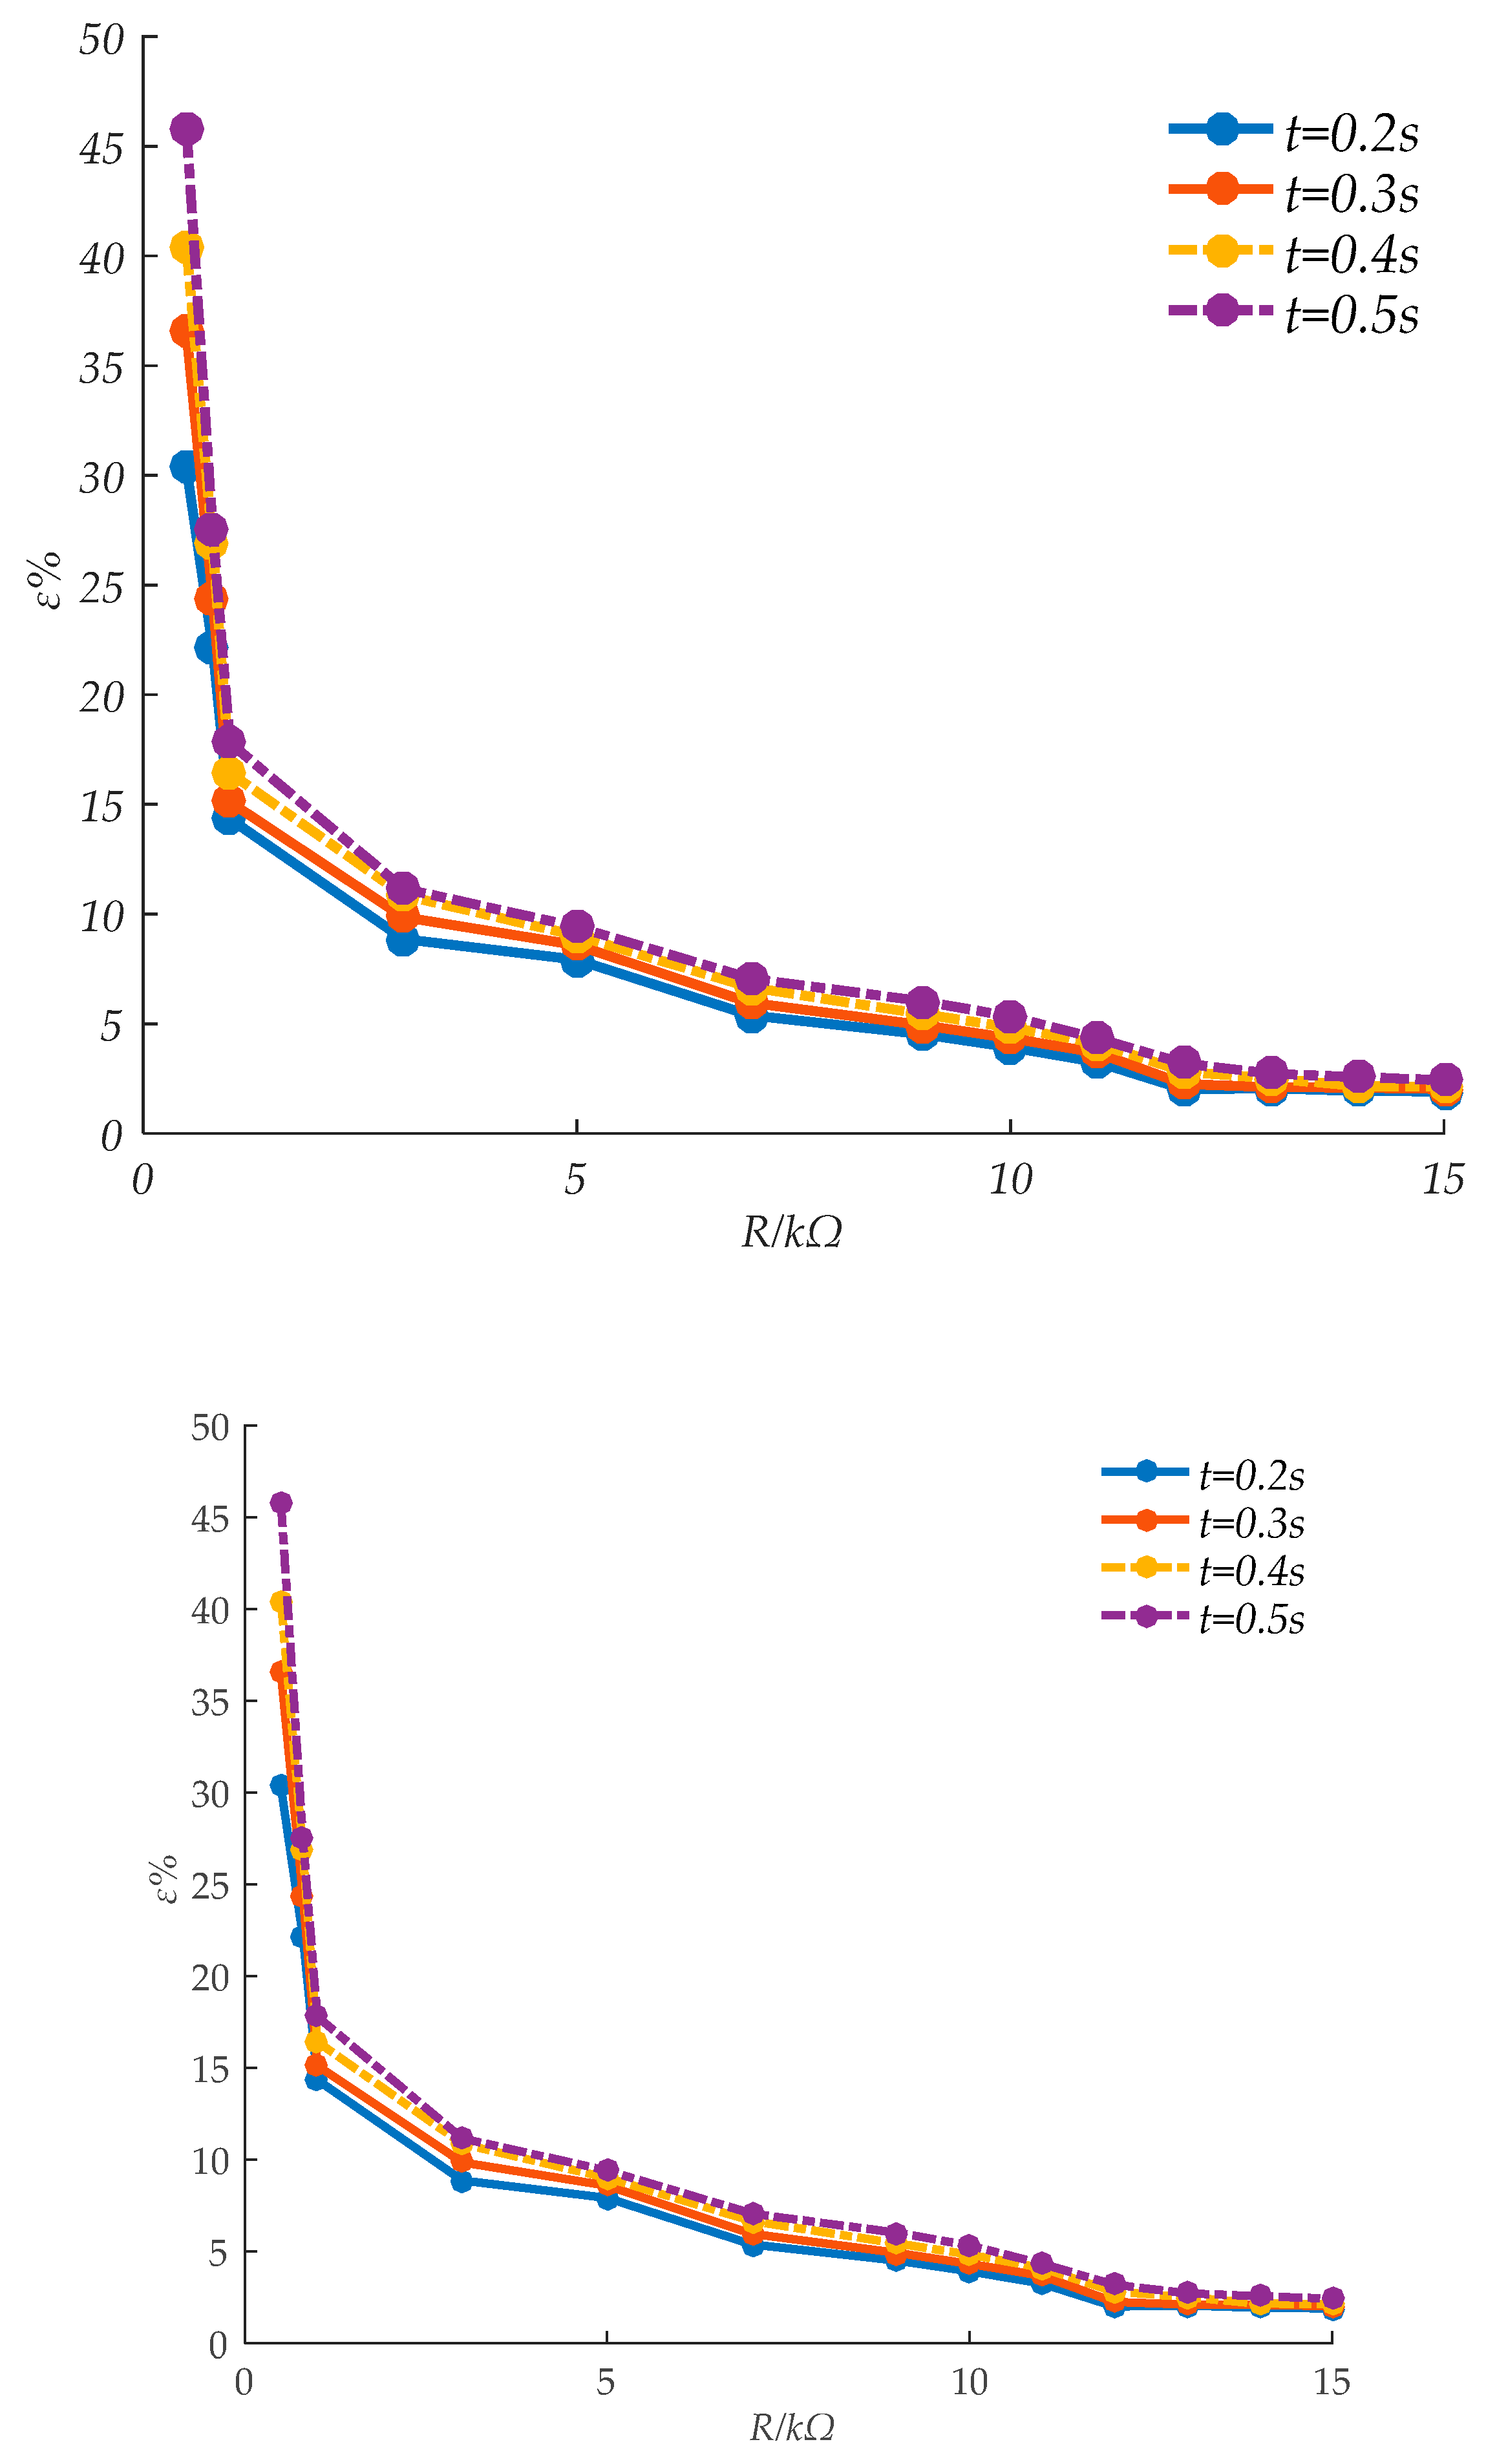
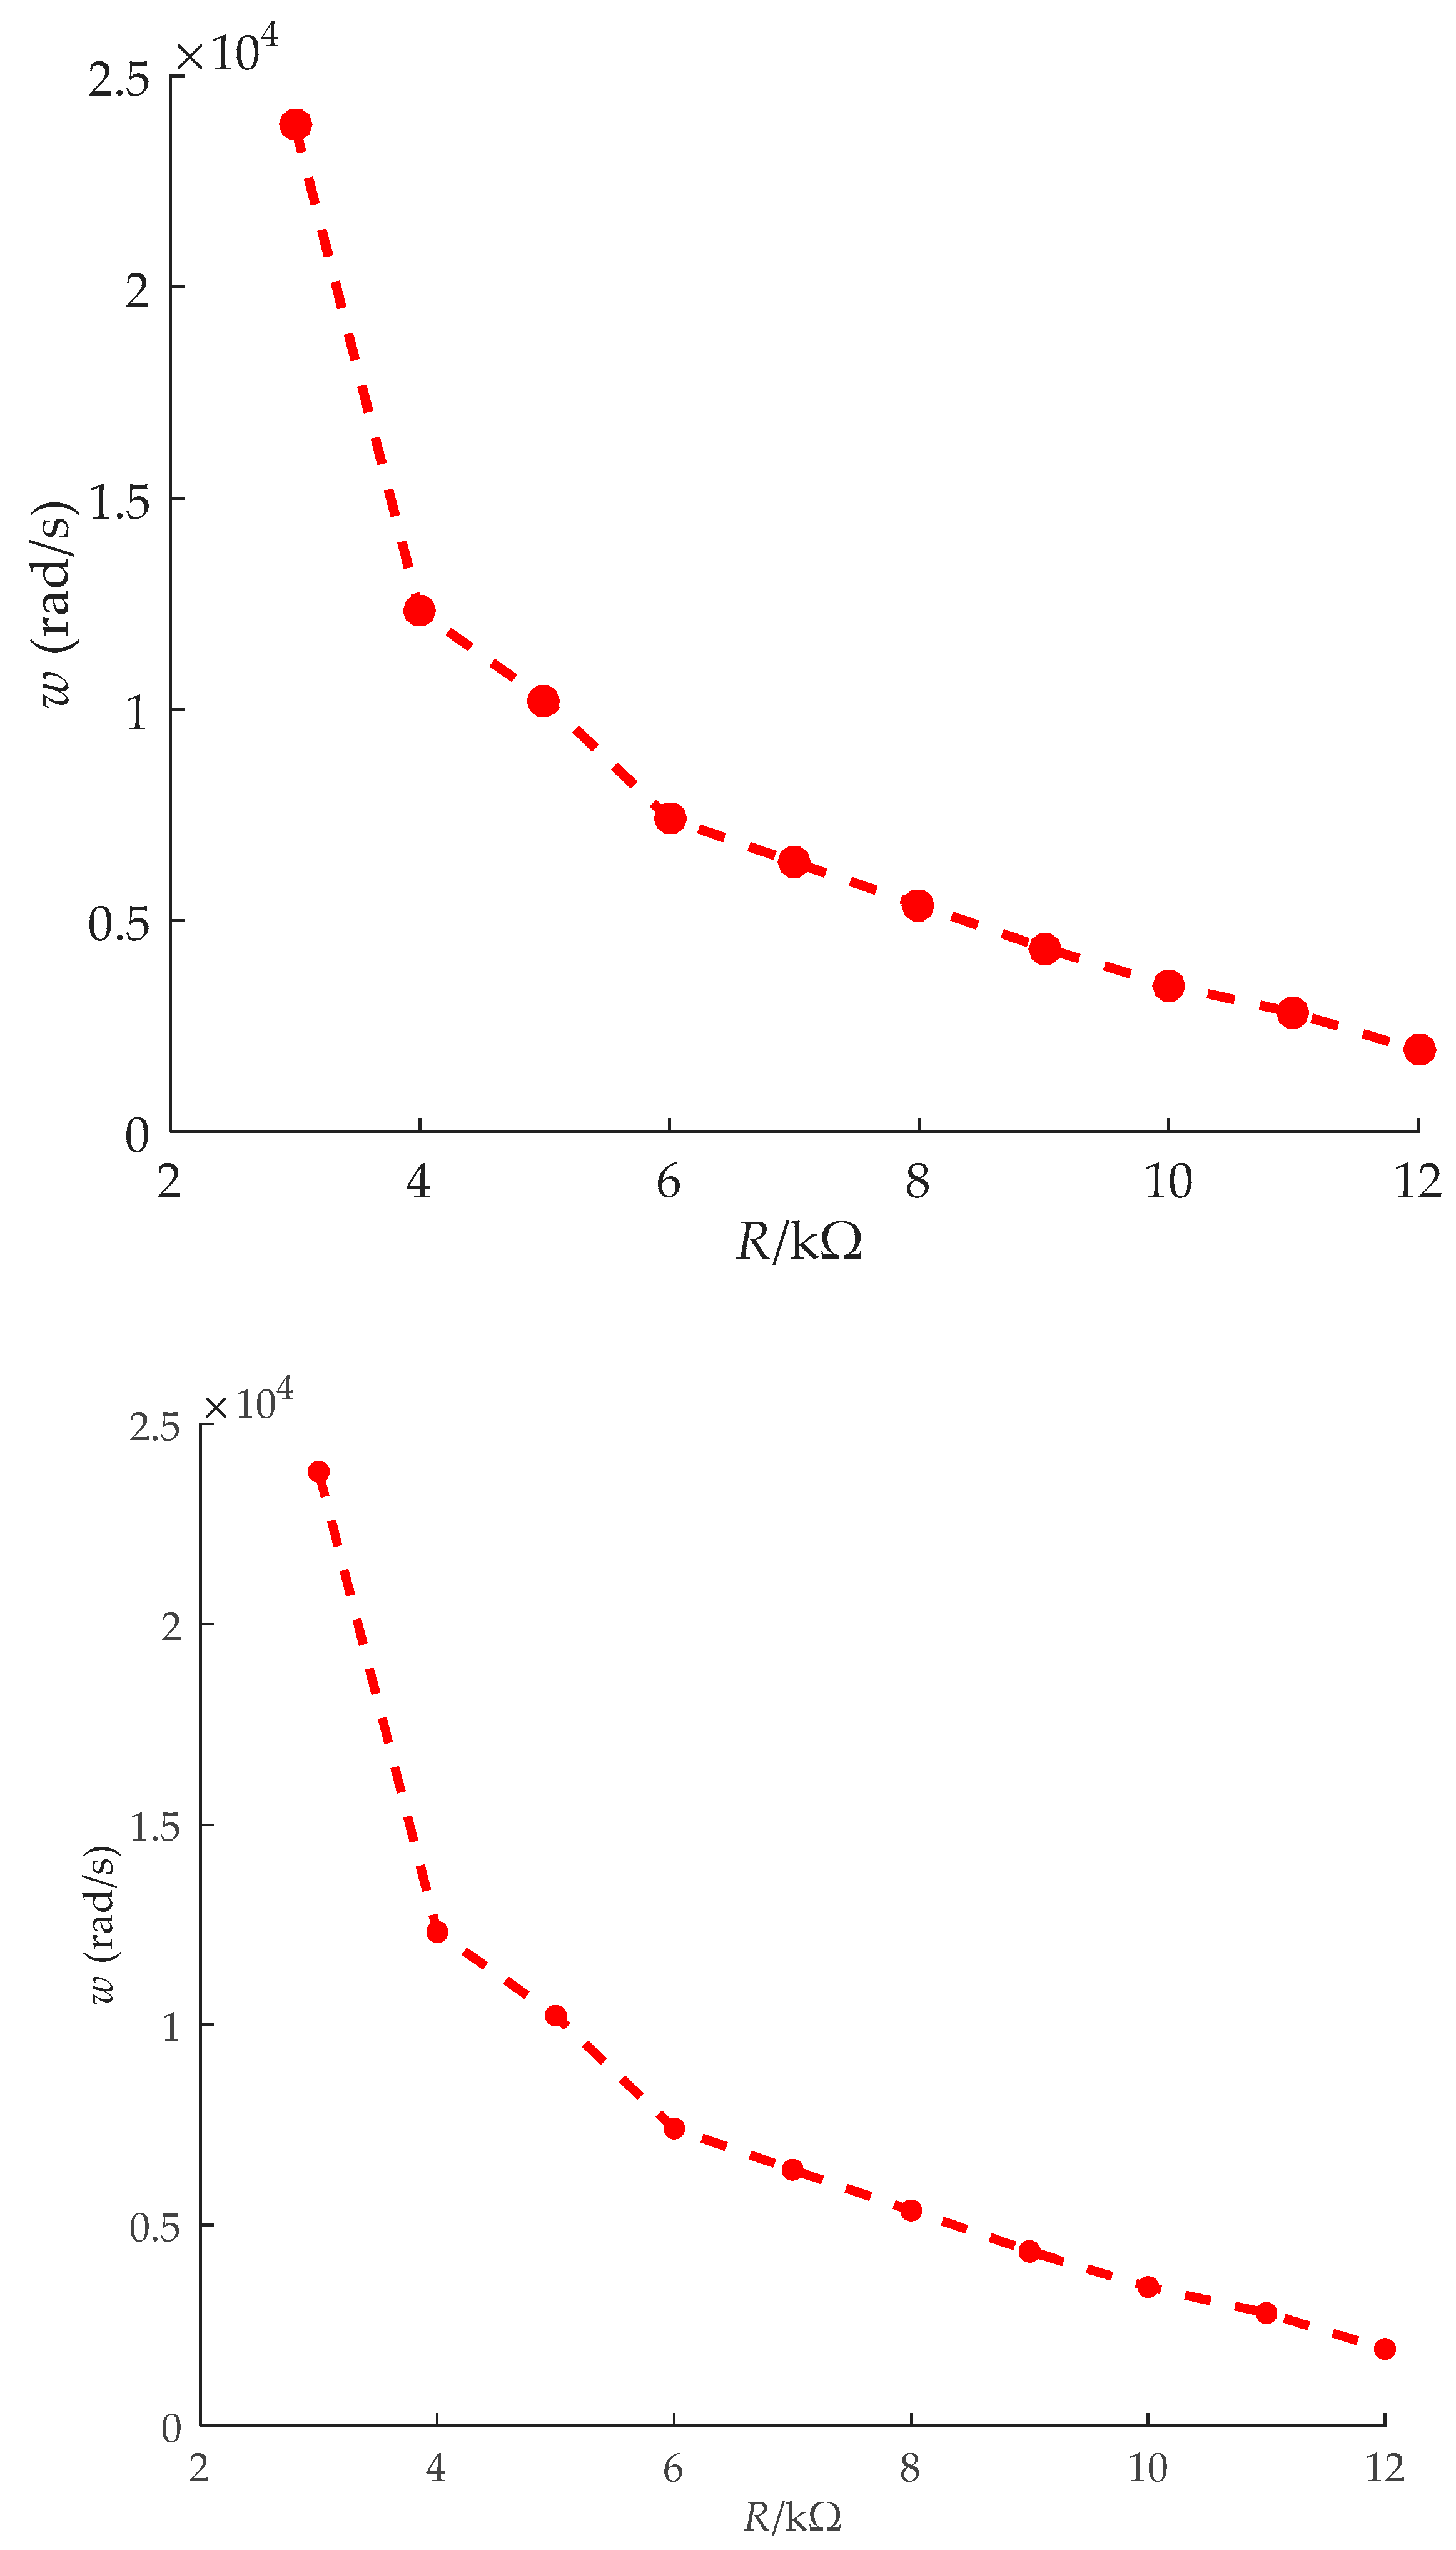
5.4. Optimization Results and Analysis
6. Discussion
7. Conclusions
Author Contributions
Funding
Conflicts of Interest
References
- Luo, A.; Xu, Q.M.; Ma, F.J.; Chen, Y.D. Overview of power quality analysis and control technology for the smart grid. J. Mod. Power Syst. Clean Energy 2016, 4, 1–9. [Google Scholar] [CrossRef] [Green Version]
- Otcenasova, A.; Bolf, A.; Altus, J.; Regula, M. The Influence of Power Quality Indices on Active Power Losses in a Local Distribution Grid. Energies 2019, 12, 1389. [Google Scholar] [CrossRef]
- Ghassemi, F.; Gale, P.; Cumming, T.; Coutts, C. Harmonic voltage measurements using CVTs. IEEE Trans. Power Deliv. 2005, 20, 443–449. [Google Scholar]
- Le, J.; Liu, Y.Z.; Li, Q.L. Harmonic measurement error test technology of capacitive voltage transformer. Autom. Electr. Power Syst. 2016, 40, 108–113. [Google Scholar]
- Duan, X.Y.; Liao, M.F.; Zou, J.Y. Electronic voltage transformers based on capacitive voltage divider. High Volt. Eng. 2003, 29, 50–59. [Google Scholar]
- Chen, R.Y.; Wang, Z.X. Abnormal Growth Analysis of Dielectric Loss Factor in Capacitor Voltage Transformer. Power Syst. Clean Energy 2012, 28, 4. [Google Scholar]
- Schmid, J.; Kunde, K. Application of non-conventional voltage and currents sensors in high voltage transmission and distribution systems. In Proceedings of the 2011 IEEE International Conference on Smart Measurements of Future Grids (SMFG) Proceedings, Bologna, Italy, 14–16 November 2011; pp. 64–68. [Google Scholar]
- Nie, Y.X.; Sun, D.T. Characteristic Analysis of Resistive-Capacitive Divider Voltage Transformer. Transformer 2007, 1, 2. [Google Scholar]
- Bertolotto, P.; Faifer, M.; Ottoboni, R. High voltage multi-purpose current and voltage electronic transformer. In Proceedings of the 2007 IEEE Instrumentation & Measurement Technology Conference (IMTC), Warsaw, Poland, 1–3 May 2007; pp. 1–5. [Google Scholar]
- Liang, Y.; Huang, X.; Chen, C. The cause of TV secondary wire abnormity and its countermeasures. Electr. Power Autom. Equip. 2001, 21, 73–74. [Google Scholar]
- Wang, J.; Guo, Z.; Zhang, G.; Wang, G.; Yu, W.; Shen, Y. Investigation and simulation of transient characteristics of electronic voltage transformer. Electr. Power Autom. Equip. 2012, 32, 62–65. [Google Scholar]
- Liu, Q.; Xu, Y.; Gao, F. Simulation research on electronic voltage transformer transient process. J. Electr. Eng. 2015, 10, 39–43. [Google Scholar]
- Xu, Z.C.; Yang, L.J.; Li, X.M. Simulation Study on Measurement Performance of Disturbance Signal of Electronic Capacitive Voltage Transformer. High Volt. Appar. 2015, 51, 91–96. [Google Scholar]
- Cataliotti, A.; Cosentino, V.; Crotti, G.; Giordano, D.; Modarres, M.; Di Cara, D.; Luiso, M. Metrological performances of voltage and current instrument transformers in harmonics measurements. In Proceedings of the 2018 IEEE International Instrumentation and Measurement Technology Conference (I2MTC), Houston, TX, USA, 14–17 May 2018; pp. 1–6. [Google Scholar]
- Yao, X.; Bin, H.; Chunnian, D. Problems of voltage transducer in harmonic measurement. In Proceedings of the 10th International Conference on Harmonics and Quality of Power Proceedings (Cat. No. 02EX630), Rio de Janeiro, Brazil, 6–9 October 2002; Volume 1, pp. 33–37. [Google Scholar]
- Pawelek, R.; Wasiak, I. Comparative measurements of voltage harmonics in transmission grid of 400 kV. In Proceedings of the 2014 16th International Conference on Harmonics and Quality of Power (ICHQP), Bucharest, Romania, 25–28 May 2014; pp. 606–610. [Google Scholar]
- Yang, L.; Zhou, D.; Xu, Z. Characteristics of electronic voltage transformers based on capacitive voltage divider. Electr. Power Autom. Equip. 2012, 32, 71–74. [Google Scholar]
- Brandolini, A.; Faifer, M.; Ottoboni, R. A simple method for the calibration of traditional and electronic measurement current and voltage transformers. IEEE Trans. Instrum. Meas. 2009, 58, 1345–1353. [Google Scholar] [CrossRef]
- Bakar, A.H.A.; Lim, C.H.; Mekhilef, S. Investigation of transient performance of capacitor voltage transformer. In Proceedings of the 2006 IEEE International Power and Energy Conference, Putra Jaya, Malaysia, 28–29 November 2006; pp. 509–515. [Google Scholar]
- Metwally, I.A. Failures, monitoring and new trends of power transformers. IEEE Potentials 2011, 30, 36–43. [Google Scholar] [CrossRef]
- Koch, M.; Prevost, T. Analysis of dielectric response measurements for condition assessment of oil-paper transformer insulation. IEEE Trans. Dielectr. Electr. Electr. 2012, 19, 1908–1915. [Google Scholar] [CrossRef]
- Liu, X.; Guo, K.Q.; Ye, G.X.; Huang, H.; Yang, F.; Chen, P. Experimental study on the impulse-voltage transmission characteristics of inductive voltage transformers. Gaodianya Jishu/High Volt. Eng. 2011, 37, 2385–2390. [Google Scholar]
- Wang, H.X.; Zhang, G.Q.; Cai, X.G. Study on error Characteristics of EVT in power system and Optimum design of EVT parameter. Guangdong Electr. Power 2011, 12, 85–91. [Google Scholar]
- Stiegler, R.; Meyer, J.; Kilter, J.; Konzelmann, S. Assessment of voltage instrument transformers accuracy for harmonic measurements in transmission systems. In Proceedings of the 2016 17th International Conference on Harmonics and Quality of Power (ICHQP), Belo Horizonte, Brazil, 16–19 October 2016; pp. 152–157. [Google Scholar]
- Feng, Y.U.; Wang, X.Q.; Chen, X.M. Influence of circuit parameters of capacitor voltage transformer on grid harmonic voltage measurements. Proc. CSEE 2014, 34, 4968–4975. [Google Scholar]
- Xiong, X.F.; He, N.; Yu, J.; HU, Z.R. Diagnosis of abrupt-changing fault of electronic instrument transformer in digital substation based on wavelet transform. Power Syst. Technol. 2010, 34, 181–185. [Google Scholar]
- Yazdani, A.; Iravani, R. Voltage-Sourced Converters in Power Systems; John Wiley & Sons: Hoboken, NJ, USA, 2010; Volume 34. [Google Scholar]
- Qing, C.; Li, H.-B.; Huang, B.-X. An innovative combined electronic instrument transformer applied in high voltage lines. Measurement 2010, 43, 960–965. [Google Scholar] [CrossRef]
- Zhang, M.M.; Zhang, C.S.; Li, C. The Simulation and Research Based on the Digital Integrator of the ECVT. Electron. Sci. Technol. 2018, 31, 17–19. [Google Scholar]
- Wang, H.B.; Zhao, Z.M. Research of electronic voltage transformer based on capacitive voltage divider. Relay 2007, 35, 46–49. [Google Scholar]
- Faifer, M.; Ottoboni, R. An electronic current transformer based on Rogowski coil. In Proceedings of the 2008 IEEE Instrumentation and Measurement Technology Conference, Victoria, BC, Canada, 12–15 May 2008; pp. 1554–1559. [Google Scholar]
- Li, W.; Yin, X.; Chen, D.; Zhang, Z.; Chen, W. The study of transient performance for electronic current transformer sensor based on Rogowski coil. In Proceedings of the 41st International Universities Power Engineering Conference, Newcastle, UK, 6–8 September 2006; Volume 1, pp. 162–165. [Google Scholar]
- Abyaneh, H.A.; Kamangar, S.S.H.; Razavi, F.; Chabanloo, R.M. A new genetic algorithm method for optimal coordination of overcurrent relays in a mixed protection scheme with distance relays. In Proceedings of the 2008 43rd International Universities Power Engineering Conference, Padova, Italy, 1–4 September 2008; pp. 1–5. [Google Scholar]
- Tan, B.H.; Allen, N.L.; Rodrigo, H. Progression of positive corona on cylindrical insulating surfaces. I. Influence of dielectric material. IEEE Trans. Dielectr. Electr. Insul. 2007, 14, 111–118. [Google Scholar] [CrossRef]
- Luo, S.; Ye, M. Research Development of Electronic Transducer. Jiangsu Electr. Eng. 2003, 22, 51–54. [Google Scholar]
- Li, T.; Du, X.P.; Liu, H.G. Discussion about self-excited method error on capacitive voltage transformer. Power Syst. Prot. Control. 2009, 37, 31–33. [Google Scholar]
- Ahn, S.P.; Kim, C.H.; Aggarwal, R.K.; Johns, A.T. An alternative approach to adaptive single pole auto-reclosing in high voltage transmission systems based on variable dead time control. IEEE Trans. Power Syst. 2001, 16, 676–686. [Google Scholar] [CrossRef]
- Ali, M.H.; Murata, T.; Tamura, J. Transient stability enhancement by fuzzy logic-controlled SMES considering coordination with optimal reclosing of circuit breakers. IEEE Trans. Power Syst. 2008, 23, 631–640. [Google Scholar] [CrossRef]
- Kamiński, M. Tsallis entropy in dual homogenization of random composites using the stochastic finite element method. Int. J. Numer. Methods Eng. 2018, 113, 834–857. [Google Scholar] [CrossRef]
- Shi, T.Y.; Wang, D.Z.; Li, Z. Multi-objective optimization design of PMECD by multiple population genetic algorithm. Trans. China Electron. Technol. Soc. 2016, 31, 262–268. [Google Scholar]
- Xiao, X.; Xu, Q.S.; Wang, Y.T. Parameter identification of interior permanent magnet synchronous motors based on genetic algorithm. Trans. China Electron. Technol. Soc. 2014, 29, 21–26. [Google Scholar]


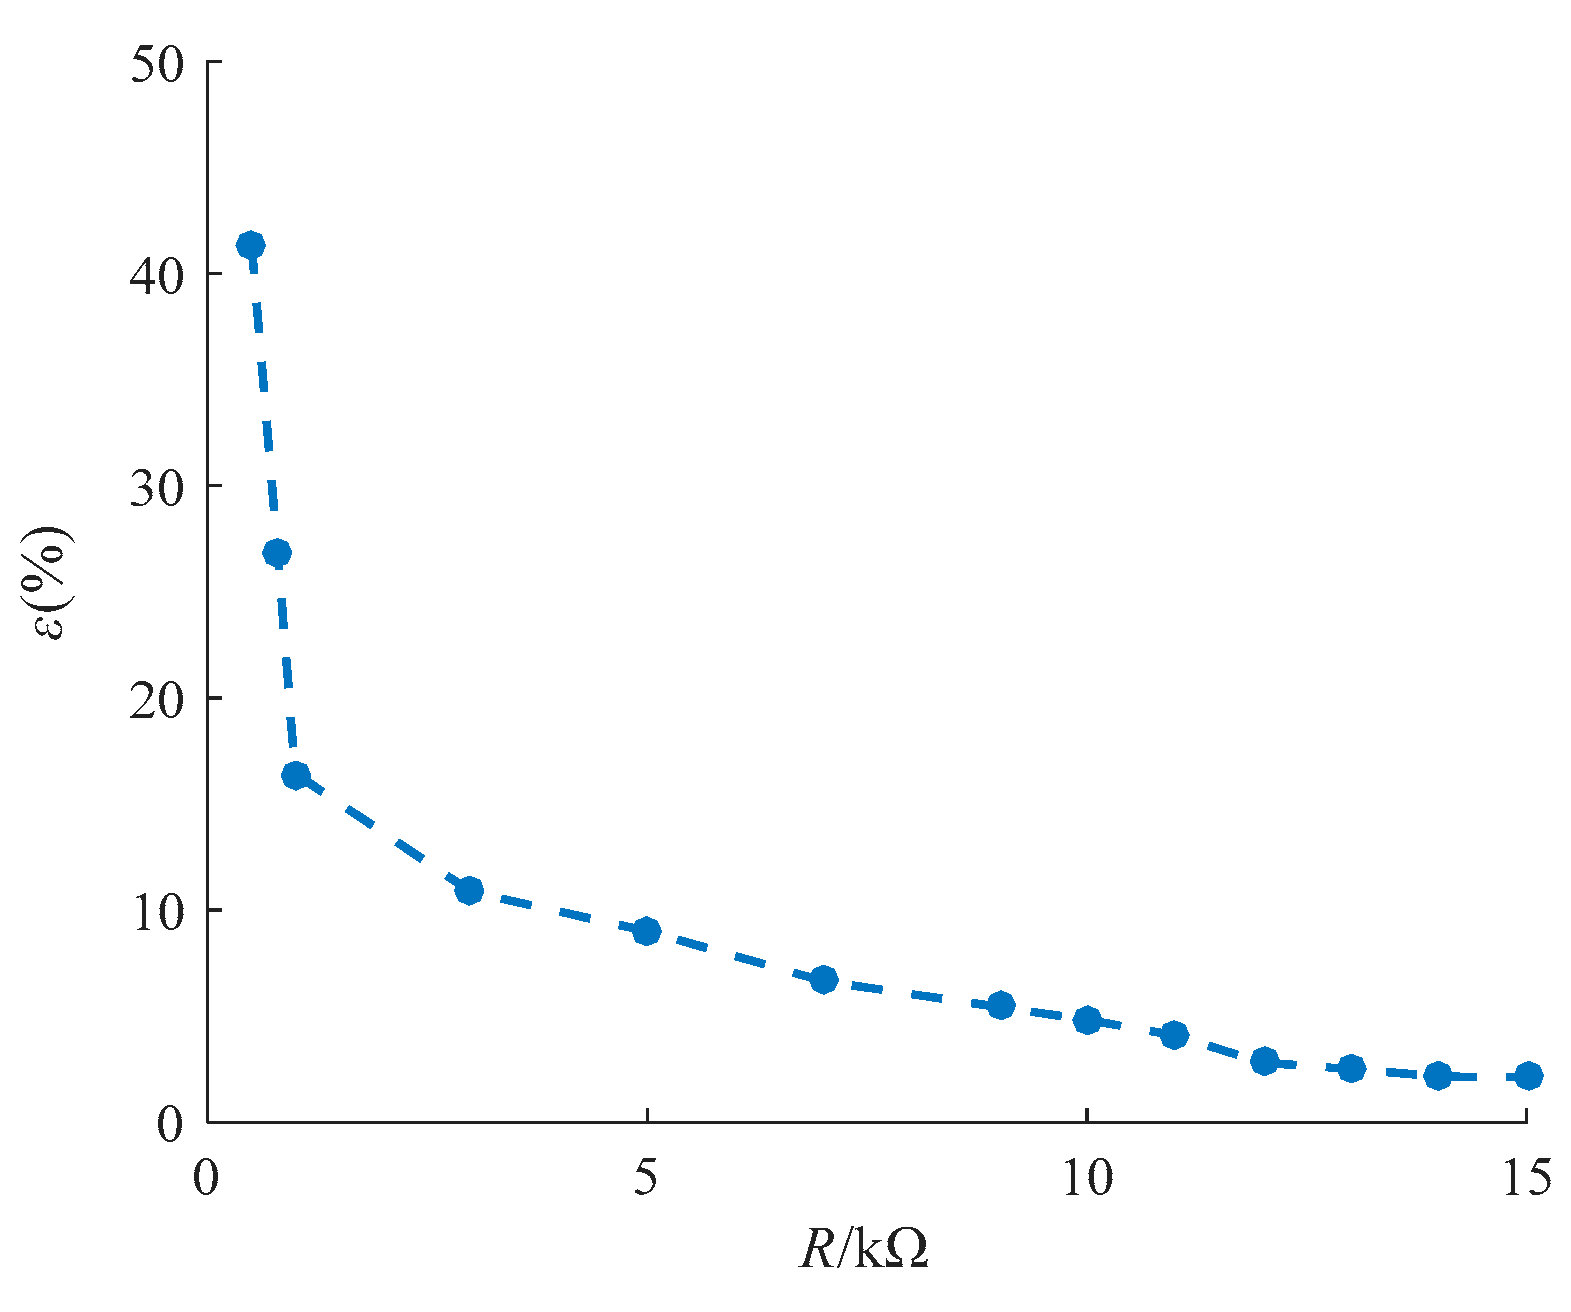
| R/(kΩ) | ε/(%) | R/(kΩ) | ε/(%) |
|---|---|---|---|
| 0.1 | 67.94 | 7 | 6.66 |
| 0.5 | 41.40 | 9 | 5.83 |
| 0.8 | 26.85 | 10 | 5.22 |
| 1 | 13.43 | 11 | 3.20 |
| 3 | 10.36 | 12 | 2.41 |
| 5 | 9.01 | 13 | 2.34 |
| Order of Harmonics | U1/[kV] | Uo/[kV] | d/[%] |
|---|---|---|---|
| 3 | 8.7406 | 0.005668 | 0.15 |
| 5 | 8.9332 | 0.005794 | 0.18 |
| 7 | 9.3123 | 0.006043 | 0.22 |
| 9 | 9.6416 | 0.00626 | 0.28 |
| 11 | 9.7925 | 0.00636 | 0.31 |
| 13 | 10.3152 | 0.006701 | 0.33 |
| 15 | 10.4322 | 0.006779 | 0.37 |
| 19 | 10.8766 | 0.007072 | 0.42 |
| Order of Harmonics | U1/[kV] | Uo/[kV] | d/[%] |
|---|---|---|---|
| 3 | 8.9401 | 0.00583 | 0.13 |
| 5 | 8.9062 | 0.005807 | 0.15 |
| 7 | 9.5228 | 0.006205 | 0.21 |
| 9 | 9.7441 | 0.006345 | 0.28 |
| 11 | 9.8915 | 0.00644 | 0.30 |
| 13 | 10.2182 | 0.00665 | 0.33 |
| 15 | 10.3312 | 0.006721 | 0.38 |
| 19 | 10.7716 | 0.007006 | 0.40 |
© 2019 by the authors. Licensee MDPI, Basel, Switzerland. This article is an open access article distributed under the terms and conditions of the Creative Commons Attribution (CC BY) license (http://creativecommons.org/licenses/by/4.0/).
Share and Cite
Liu, X.; Zeng, Y.; An, B.; Zhang, X. Research on Characteristics of ECVT for Power Quality Detection and Optimum Design of Its Parameter. Energies 2019, 12, 2416. https://doi.org/10.3390/en12122416
Liu X, Zeng Y, An B, Zhang X. Research on Characteristics of ECVT for Power Quality Detection and Optimum Design of Its Parameter. Energies. 2019; 12(12):2416. https://doi.org/10.3390/en12122416
Chicago/Turabian StyleLiu, Xingjie, Yamin Zeng, Baoping An, and Xiaolei Zhang. 2019. "Research on Characteristics of ECVT for Power Quality Detection and Optimum Design of Its Parameter" Energies 12, no. 12: 2416. https://doi.org/10.3390/en12122416
APA StyleLiu, X., Zeng, Y., An, B., & Zhang, X. (2019). Research on Characteristics of ECVT for Power Quality Detection and Optimum Design of Its Parameter. Energies, 12(12), 2416. https://doi.org/10.3390/en12122416