Article

Effectiveness of Selected Neural Network Structures Based on Axial Flux Analysis in Stator and Rotor Winding Incipient Fault Detection of Inverter-fed Induction Motors

by
Maciej Skowron
,
Marcin Wolkiewicz
,
Teresa Orlowska-Kowalska
* and
Czeslaw T. Kowalski
Department of Electrical Machines, Drives and Measurements, Wroclaw University of Science and Technology, 50-370 Wroclaw, Poland
*
Author to whom correspondence should be addressed.
Energies 2019, 12(12), 2392; https://doi.org/10.3390/en12122392
Submission received: 16 May 2019 / Revised: 10 June 2019 / Accepted: 17 June 2019 / Published: 21 June 2019
(This article belongs to the Special Issue Fault Diagnosis in Electric Motors)

Abstract

:
This paper presents a comparative study on the application of different neural network structures to early detection of electrical faults in induction motor drives. The diagnosis inference of the stator inter-turn short-circuits and broken rotor bars is based on the analysis of an axial flux of the induction motor. In order to automate the fault detection process, three different structures of neural networks were used: multi-layer perceptron, self-organizing Kohonen network and recursive Hopfield network. Tests were carried out for various levels of stator and rotor failures. In order to assess the sensitivity of the applied neural detectors, the tests were carried out for variable load conditions and for different values of the supply voltage frequency. Experimental results of the elaborated neural detectors are presented and discussed.

1. Introduction

During the operation of induction motor (IM) drive systems, various types of mechanical and electrical damages can occur, which should be detected at the earliest possible stage in order to avoid emergency shutdowns of the drive, resulting in downtime of industrial equipment and associated financial losses.
The most frequently occurring IM defects are bearing damages, which belong to the group of mechanical failures, constituting approximately 40% of all motor faults. However, electrical damages, mainly related to the motor windings, are also a serious quality and quantity problem. These failures are usually associated with short-circuits in the stator windings (about 38% of all IM faults) and damages to the rotor bars and rings in the squirrel-cage rotors (about 10%) [1]. The detection of damage to the windings of electric motors has been analyzed in many articles, and a review of the methods used can be found among others in [2].
The damage detection methods currently used in the technique can be divided into:
-
methods using diagnostic signal analysis, e.g., [3,4,5],
-
statistical methods based on signal properties, e.g., [6,7,8,9].
The statistical analysis methods use both the properties of the signal over a given time interval (average value, effective value, minimum, maximum) as well as the relationships between individual signal samples (skewness, kurtosis, crest factor, shape factor) [6,7]. It should be noted that the statistical analysis of signals methods have hitherto been used mainly for the detection of mechanical damages.
Analytical methods are characterized by a relatively long process of machine condition evaluation, however, the diagnosis time and the result of the analysis depend mainly on the knowledge of the human expert. Currently, different diagnostic methods are based on various diagnostic signals. In the case of detecting failures of the stator and rotor windings of IM, these signals are: voltages [10,11], currents [3,4], vibrations [12,13], axial flux [14,15], speed and temperature [11,16], torque [17] and also the internal signals of the control structure in the vector-controlled drive systems [18]. The selection of the diagnostic signal and the method of searching for symptoms of damage related to the signal processing algorithm used, have a direct impact on the speed of the detection process.
Stator current is the signal most often used in the diagnostics of winding failures, mainly due to the measurement simplicity. The most common methods of processing this signal to identify fault symptoms of the IM windings are: Monitoring Current Signature Analysis (MCSA) based on Fast Fourier Transform (FFT) analysis of phase currents [3], Envelope Park Vector Analysis (EPVA) based on spectral analysis of the module of the spatial current vector [4], Principal Component Analysis (PCA) method [19], Symmetric Component Analysis (SCA) method [20], Complex Wavelet Transform (CWT) [21], Discrete Wavelet Transform DWT [5], Wavelet Packet Signature Analysis (WPSA) [9], Empirical Mode Decomposition (EMD) method [22], methods based on Hilbert Transform (HT) [23] or Hilbert-Huang Transform (HHT) [24]. These methods make it possible to identify characteristic features of the signal that may indicate damage to the motor’s windings.
The faults to the IM electrical circuits can also be diagnosed using the stray (radial or axial) flux signal. The advantage of this signal is the non-invasive and simple measurement and low cost of sensors. The external stray flux signal results from changes in the electromagnetic field of the machine due to asymmetries related to motor defects [25,26,27]. The use of an axial flux in the diagnosis of electrical machines is discussed, among others, in [14,15,25,26,27,28]. Also in this work, the FFT analysis of the axial flux is used to detect early damages to stator and rotor windings of the IM.
The diagnostic process may take place with the direct participation of a human expert or with the use of artificial intelligence (AI) methods, especially neural networks (NNs) [29,30].
Systems based on AI enable the indirect use of expert knowledge in order to automate the detection process. The application of AI methods in diagnostic processes was first presented in [31]. Currently, diagnostic systems use a variety of neural structures in detection systems.
The most frequently used NN in the diagnostic systems is the feedforward Multilayer Perceptron (MLP) type neural network. Despite the many advantages of MLP networks such as ease of description and hardware implementation, they require proper selection of structure [29,32,33], learning methods [6,7], activation function [7] and network input vector [8]. When teaching MLP networks, the most common algorithms are Levenberg-Marquardt (LM) algorithm [7,8,29] and the Back-Propagation (BP) algorithm [7,32,34]. The MLP network, despite the simple structure, is characterized by a relatively long learning time. In [7] the authors presented the influence of the applied MLP network learning method on the effectiveness of the detection of electrical and mechanical damages of an IM. The possibility of using PCA analysis to reduce the number of internal connections of the MLP network has been there demonstrated. The use of Genetic Algorithms (GAs) in the process of selecting the optimal structure and the number of neurons in the hidden layers of MLP network is presented in [33]. In [32] the authors used an analytical approach to determine the number of neurons of the hidden layers of the fault detector, based on the size of the input and output vectors of the layer. The effectiveness of the MLP network is also significantly affected by the activation function used [7]. Adequate selection of input vector elements providing clear diagnostic information enables a significant reduction of the learning process while maintaining high network efficiency. In [8] the authors showed that the insertion of elements from various diagnostic signal analysis methods in the input vector allows for a significant improvement in the diagnosis effectiveness of the MLP network.
In the diagnostic processes, fault classification systems play a very important role. The main representative of NN-based data classifiers is the self-organizing Kohonen network (self-organizing map—SOM). The possibilities of using this structure in the diagnostic processes of electric machines are presented among others in [7,20,30,35,36,37,38]. The SOM advantage is a small amount of data required for the correct classification of machine states. Kohonen network can be found in many varieties. In [38] the application of kernel self-organizing map (KSOM) in the process of IM short-circuit detection is presented. The comparison of the classic SOM network with a descent gradient-based KSOM (GD-KSOM) and energy function-based KSOM (EF-KSOM) was made in this article. Like in MLP, the efficiency of the SOM network depends mainly on the structure used. In [7,36] the authors presented the influence of the number of neurons of the network’s output layer on its effectiveness. The influence of topology and applied neighborhood functions as well as neighborhood range on the effectiveness of the SOM-based detection system is presented in [7].
This article focuses on presenting the influence of the applied NN structure on the efficiency of electrical faults detection of an induction motor supplied form frequency converter under different load torque conditions. In addition to the MLP network belonging to the feedforward structure category and SOM belonging to self-organizing networks, the use of recursive Hopfield network (RHN) has been presented. This network, usually associated with its special feature, namely associative memory, is mainly used in pattern recognition [39]. However, the authors of the paper [40] presented the possibility of using RHN in the errors’ detection of servo-positioning systems. Associative memory RHN also made it possible to accurately detect damage to the fan drive system components as shown in [41]. For the most part of diagnostic applications of RHN, it can be found in the detection of electrical and electronic circuit faults. For example, in [39] the authors showed the possibility of detecting electronic system failures by using Wavelet Packet Transform (WPD) and the RHN. Therefore, in the present article, the possibility of using RHN to detect IM electrical failures has been tested (according to the authors’ knowledge—for the first time in the literature).
This article compares the effectiveness of three selected NN structures: the MLP network, the self-organizing Kohonen map (SOM) and the recursive Hopfield network (RHN) in the electrical fault detection process of the IM supplied from a frequency converter under different reference frequency and load torque values. Damage detection was carried out on the basis of non-invasive measurement of the axial flux. The tests were carried out on the real laboratory drive system, which enabled the physical modelling of the electrical faults of the motor, namely: stator inter-tur short circuits or broken rotor bars.
The novelty introduced in this article is focused on the comparison of effectiveness of different neural structures, belonging to different network types (feedforward, self-organizing, recurrent), in the same diagnostic application, which is incipient detection of electrical faults of the IM. A comparison of neural networks (NN) with different structures in such task was not shown in the literature. The most of papers present a single type of the NN applied for diagnostic purposes of some machine faults. For example, in [7,29] only different MLP structures have been analyzed. In the majority of research works also only specific faults are analyzed (stator or rotor faults, bearing faults, eccentricity, etc.), while in this paper the stator and rotor damages are analyzed separately as well as mixed faults are taken into account and the ability of selected NN structures in recognition, detection and evaluation of the failure levels is compared.
In this paper three different structures based on the same diagnostic signal and the same analysis are compared. In this case, the networks have a common “source” of damage symptoms. The aim of the article was to show how the choice of NN structure, network parameters and learning strategy (method, parameters of learning rule, number of training patterns, training time) influences the effectiveness of the diagnostic procedure as well as to present what the requirements for the diagnostic signal must be met.
The work was divided into five sections. After this introduction the next section contains an overview of the diagnostic signal and the development of the input vector of NNs. The third section presents the basic properties of the tested neural structures MLP, SOM, RHN. The main part of this article is the next section, which contains the discussion of the results of experimental research on the developed neural detectors. The article ends with a summary of the obtained results and short discussion of the future research.

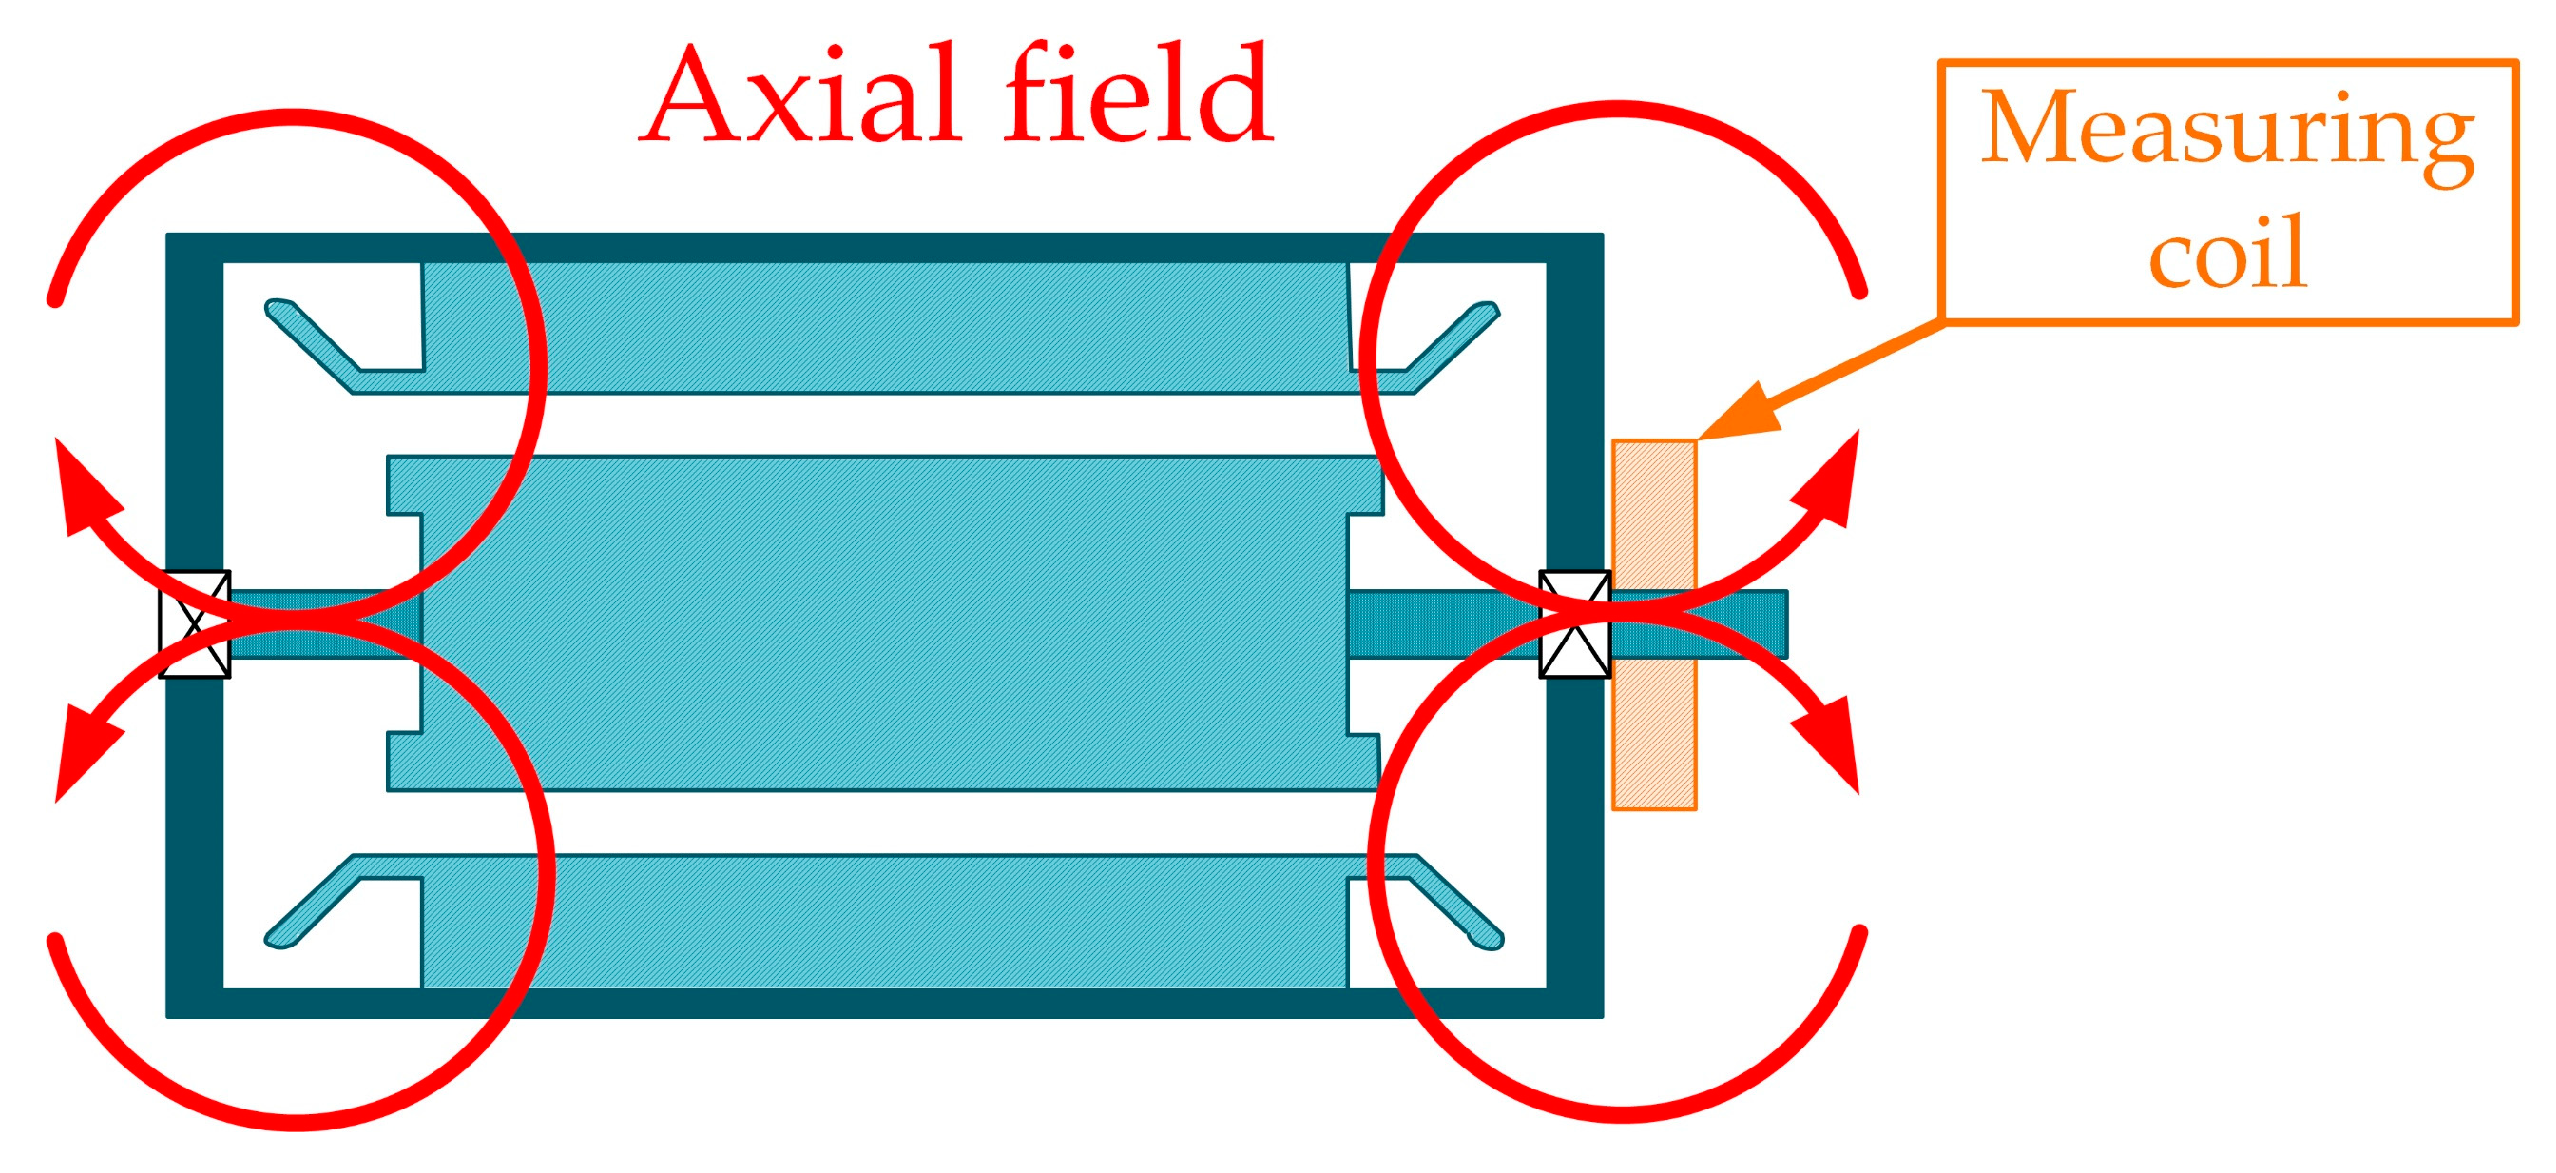
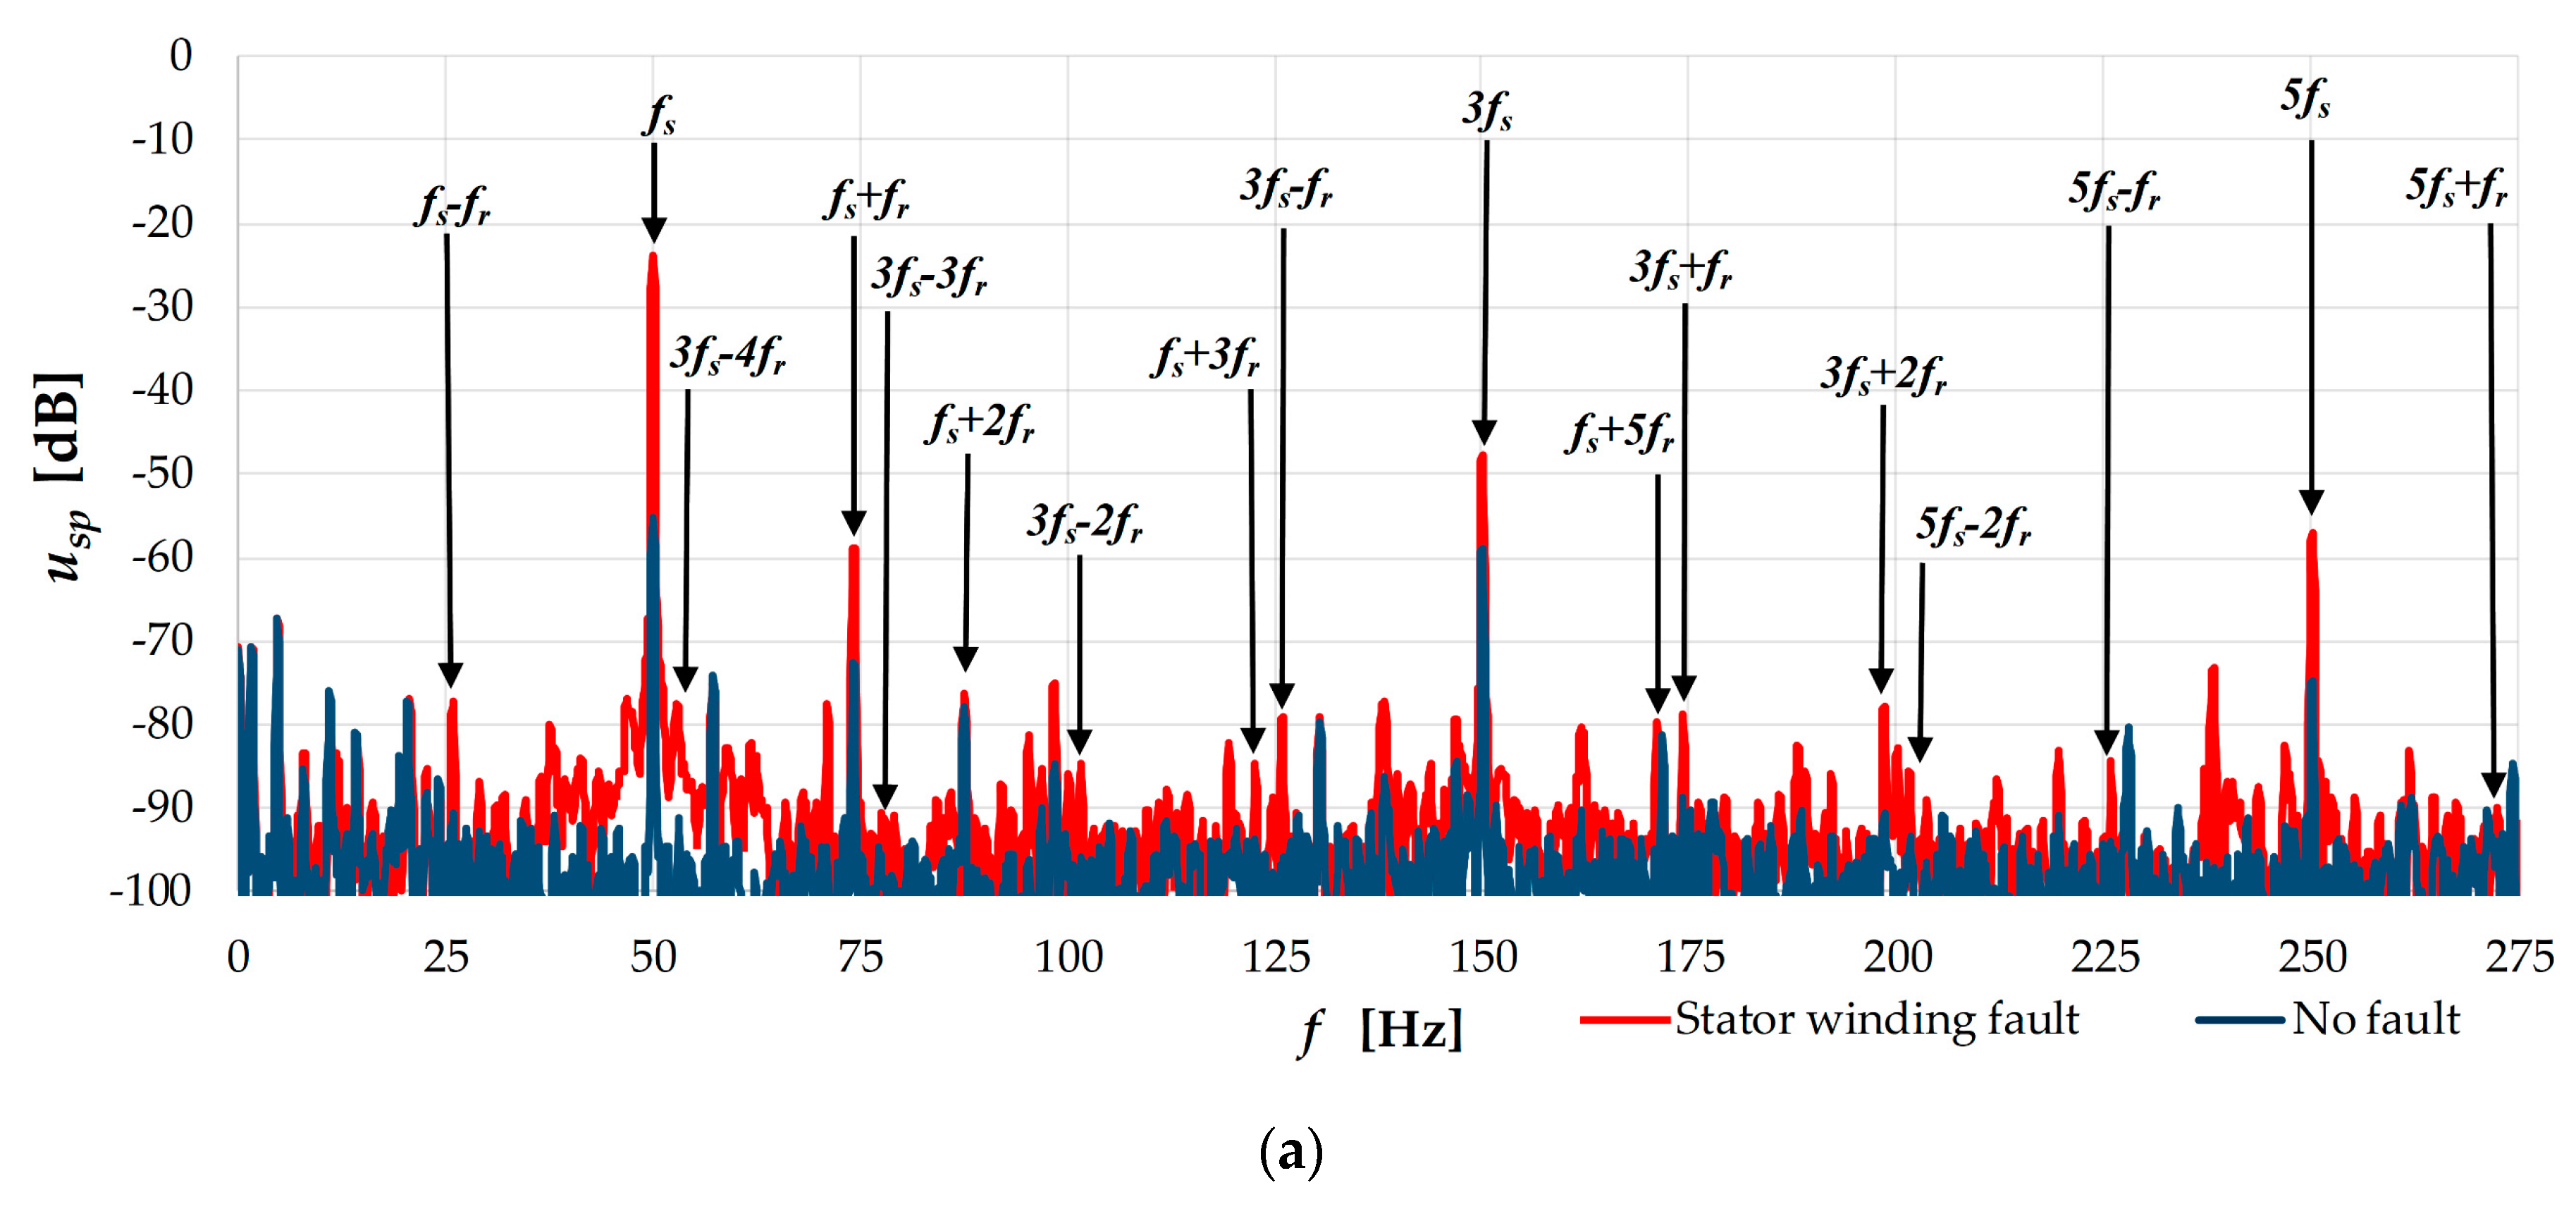
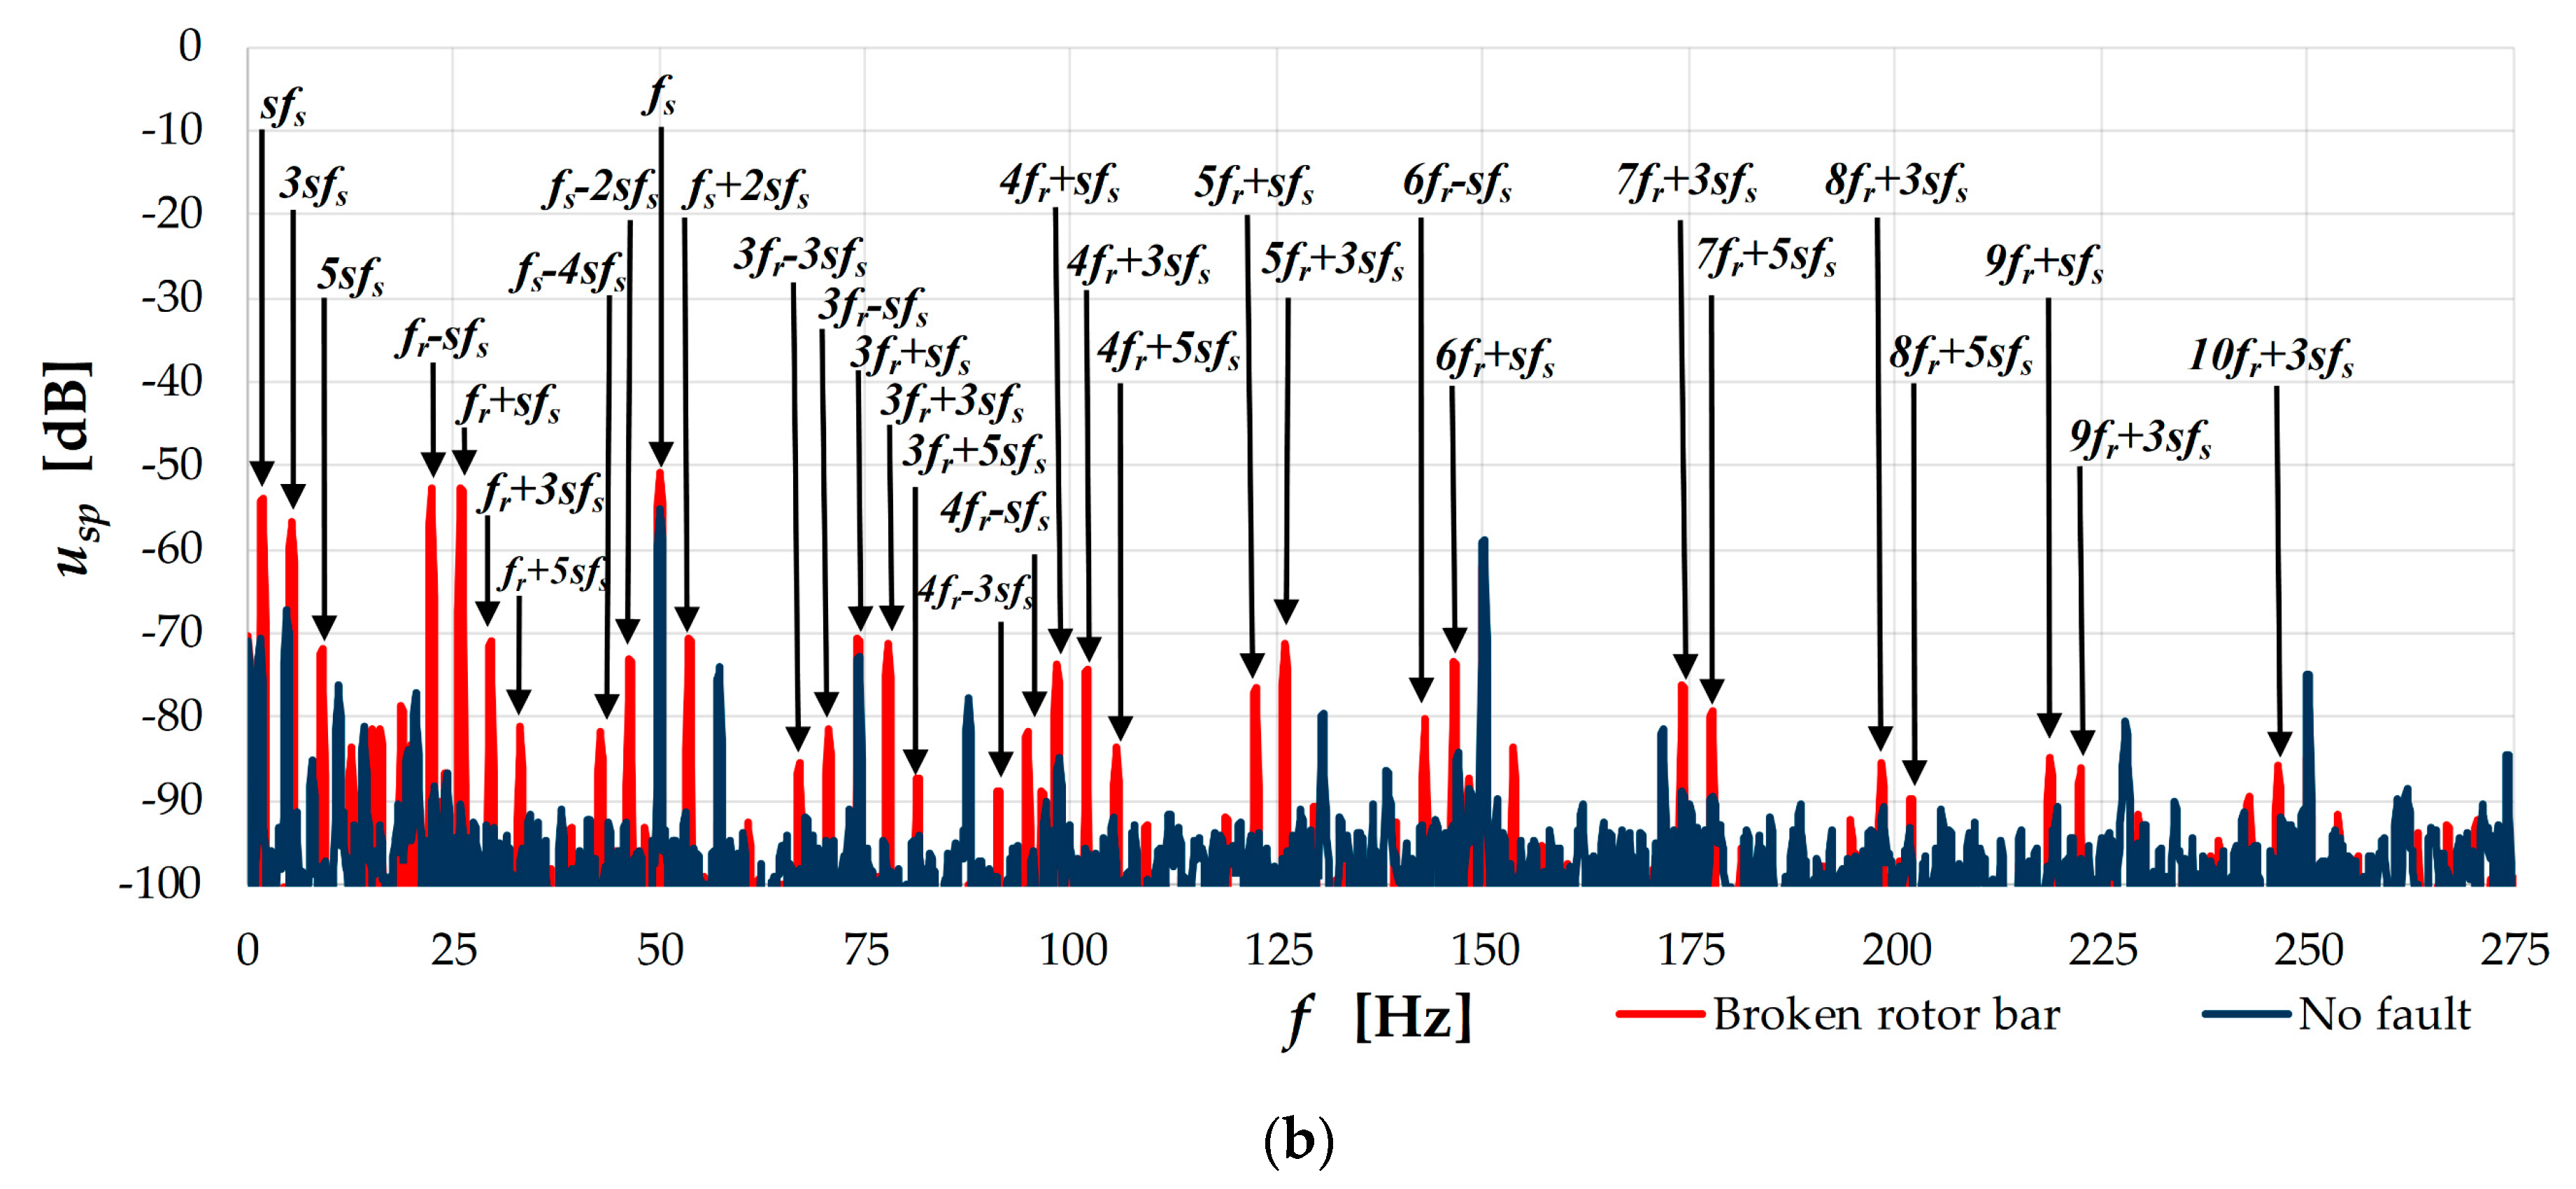
2. Symptoms of Induction Motor Circuit Faults Visible in Axial Leakage Flux

All electrical machines have certain magnetic and geometric asymmetries due to the heterogeneity of the materials used and the inaccuracy of the workmanship. These asymmetries cause differences in the currents flowing at different places of the end connections of the windings, which consequently causes the generation of the external stray flux [23] (Figure 1).
Damages to the stator or rotor winding cause an increase in the asymmetry of the windings, which results in significant changes in the stray (radial or axial) flux distribution. A voltage is induced in the stator’s shorted coil, which causes the flow of current limited only by the own impedance of the coil. This current is the source of magnetomotive force pulsations, which affect the distribution of spatial harmonics in the machine’s airgap. Spatial harmonics cannot be detected directly by measuring the stray flux. On contrary, time harmonics can be detected in this flux, which are mixed up with the spatial harmonics of the field. Since the stray and thus axial flux can be generated by the stator and rotor currents; the characteristic frequencies in it are related to the frequency fs of the supply source and the rotor frequency sfs (s—motor slip) [23,26] Thus, the harmonic content in the axial flux is directly related to the harmonic content in the stator and rotor currents.
To measure the axial flux, measuring coil is installed, in which voltage proportional to this flux is induced (Figure 1). In the event of a short-circuit, even a small number of the IM windings, there is a remarkable increase in the asymmetry of the machine, and consequently in the voltage induced in the measuring coil. As a result of damage to electrical circuits of IM, there is a noticeable increase in the value of the amplitudes of the harmonics visible in this voltage spectrum with frequencies characteristic for individual failures. The variable frequency of the characteristic harmonics allows to distinguish the rotor asymmetries from the stator failures.
In the case of short-circuits in the stator windings, these are the frequencies:
f S H = f s ( k ( 1 s ) p p ± m ) ,
where: pp—number of pole pairs, m = 1, 3, 5,…, k = 1, 2, 3,…
Damage to the rotor cage causes the generation of additional components in the spectrum of the axial flux dependent on the motor slip. The reflection of damage to the rotor cage is the increase in the amplitudes of the harmonics visible in the induced voltage spectrum, described by the following equations:
f B B 1 = f s ( 1 ± 2 k s ) ,
f B B 2 = 2 k s f s ,
f B B 3 = m f r ± k s f s ,
where fr—rotational frequency.
As can be seen from the above equations, the detection of IM electrical circuit damages is dependent on the actual operating conditions of the motor. The frequencies characteristic of the rotor cage defects depend on the actual motor slip, which may impede the learning process of the neural fault detector. Additionally, the use of FFT to analyze the axial flux signal forces the need to maintain constant motor operating conditions for the duration of the diagnostic signal measurement. The details on the diagnostic symptoms (amplitudes of characteristic harmonics), described above and used next in NN training procedures will be shown in Section 4.

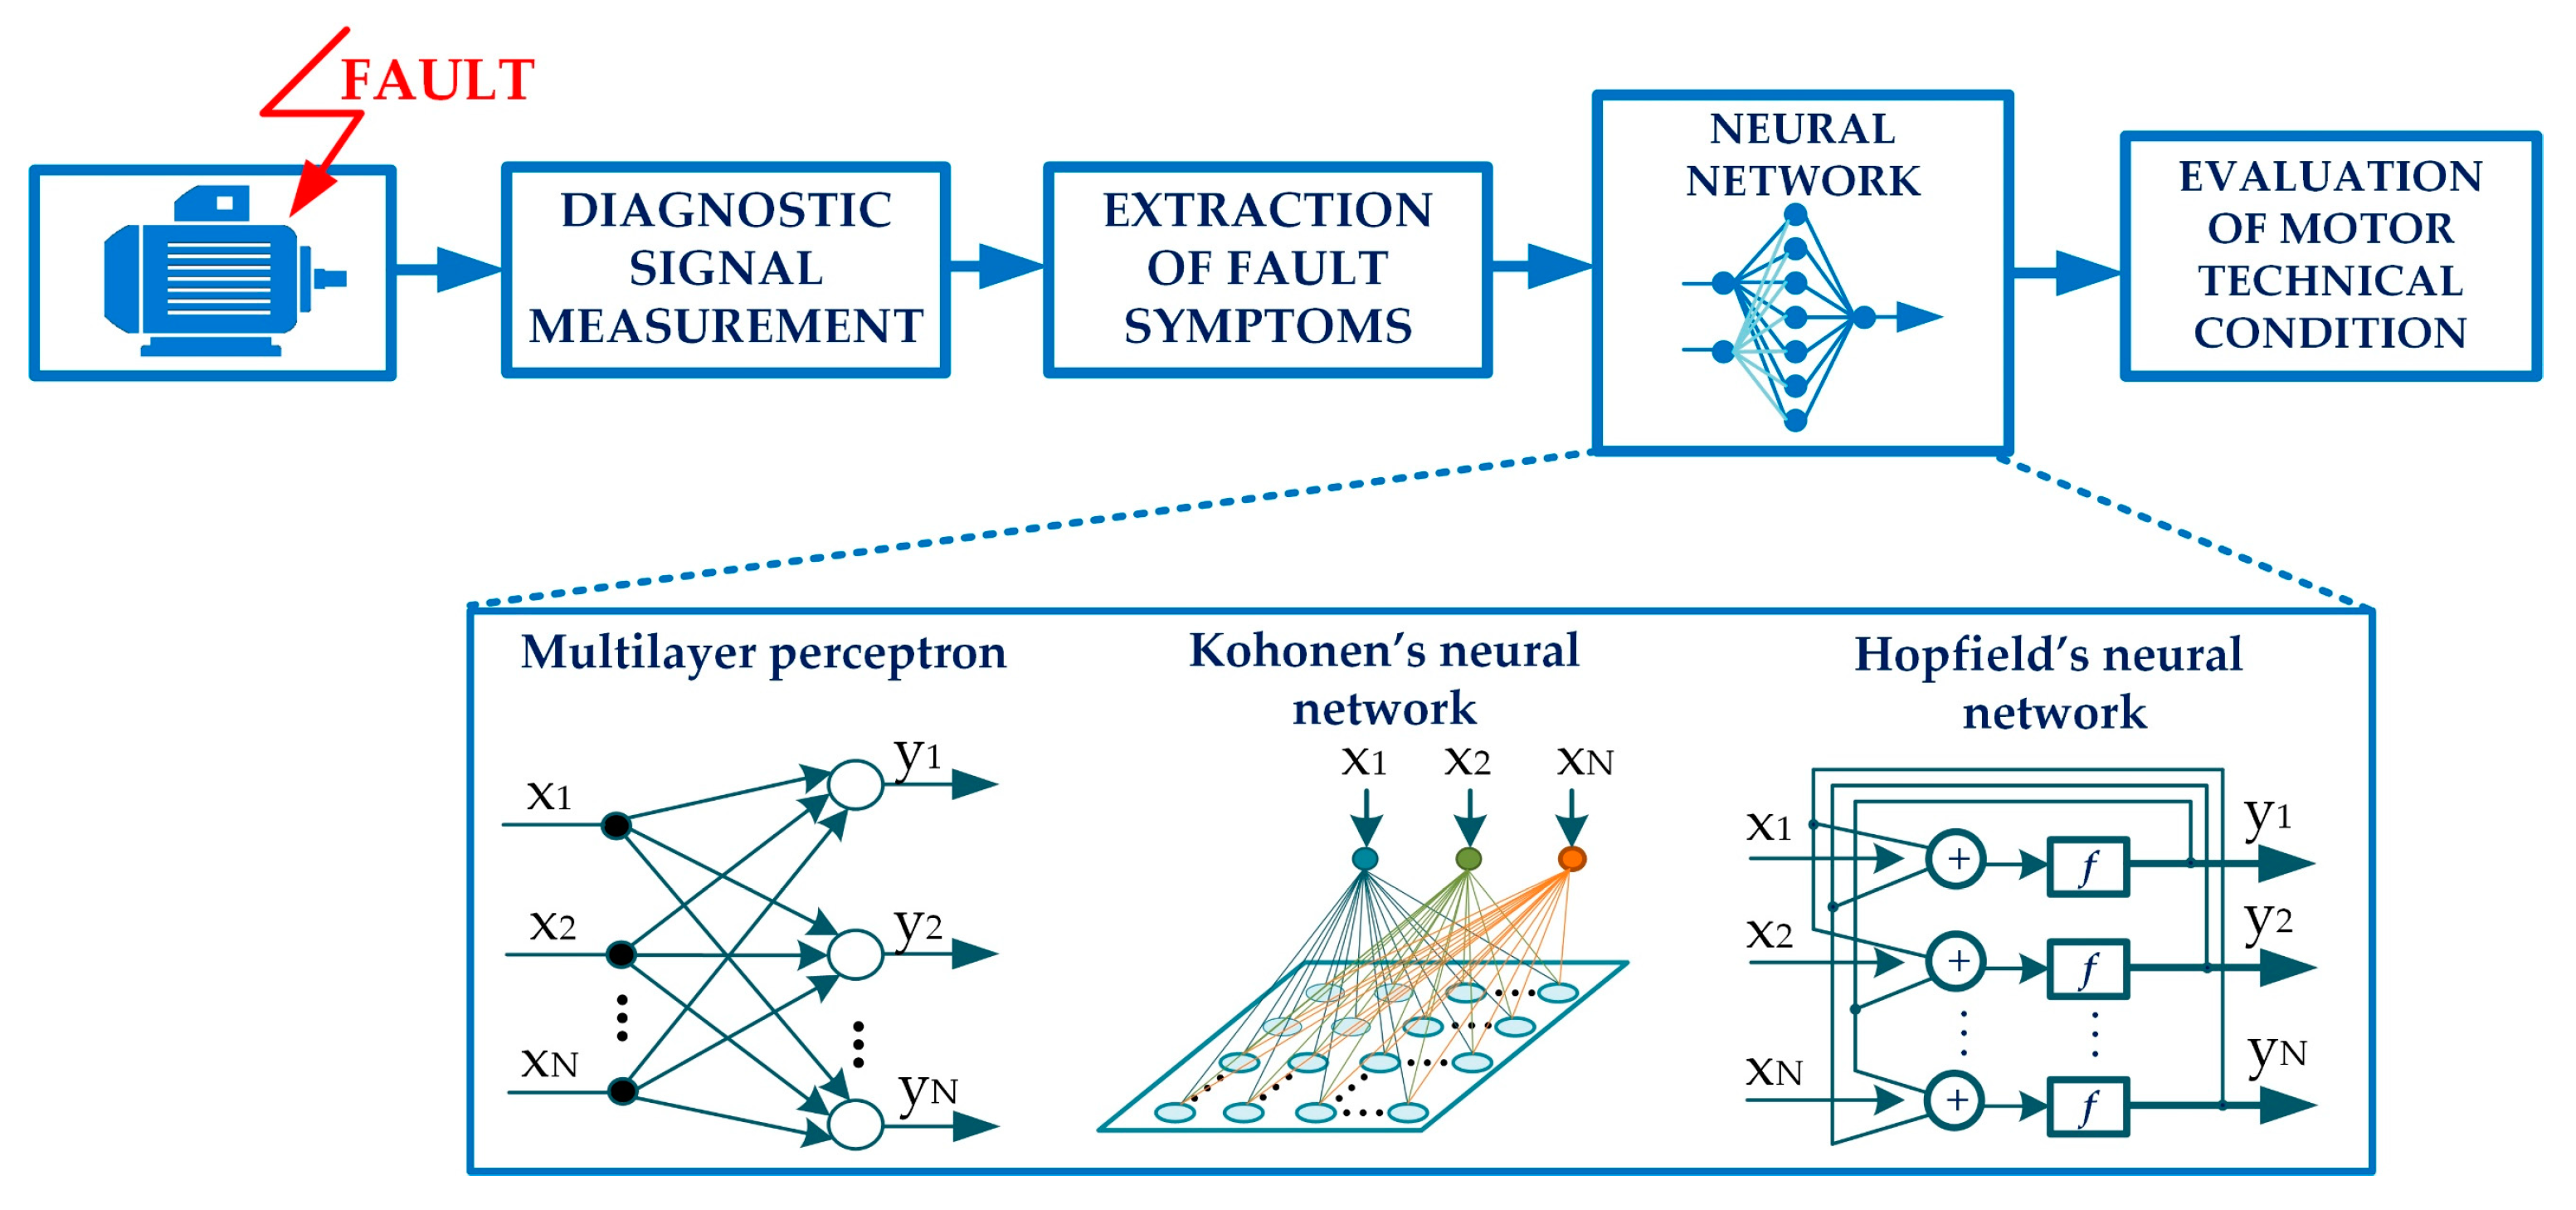
3. Application of Neural Networks in the Detection of Induction Motor Damages

3.1. General Remarks

The research presented in this article focuses on the effectiveness analysis of the neural fault detectors of IM electrical circuit damages implemented with the use of three NN types, with different structures and learning methods: multilayer perceptron—MLP, Hopfield recursive network—HRN and Kohonen self-organizing map—SOM. The process of detecting IM failures using these NNs can be represented in the form as in Figure 2.
In the fault detection process four stages can be distinguished. The first one consists in indirect measurement of the axial flux signal. Next, from the spectrum of the voltage induced in the measuring coil, fault symptoms in the form of harmonic amplitudes with frequencies characteristic for the discussed damages, are selected.
These symptoms are introduced to the input of the selected NN structure in the form of a normalized vector. The final step is the assessment of the technical condition of the IM based on the output vector of the analyzed network.

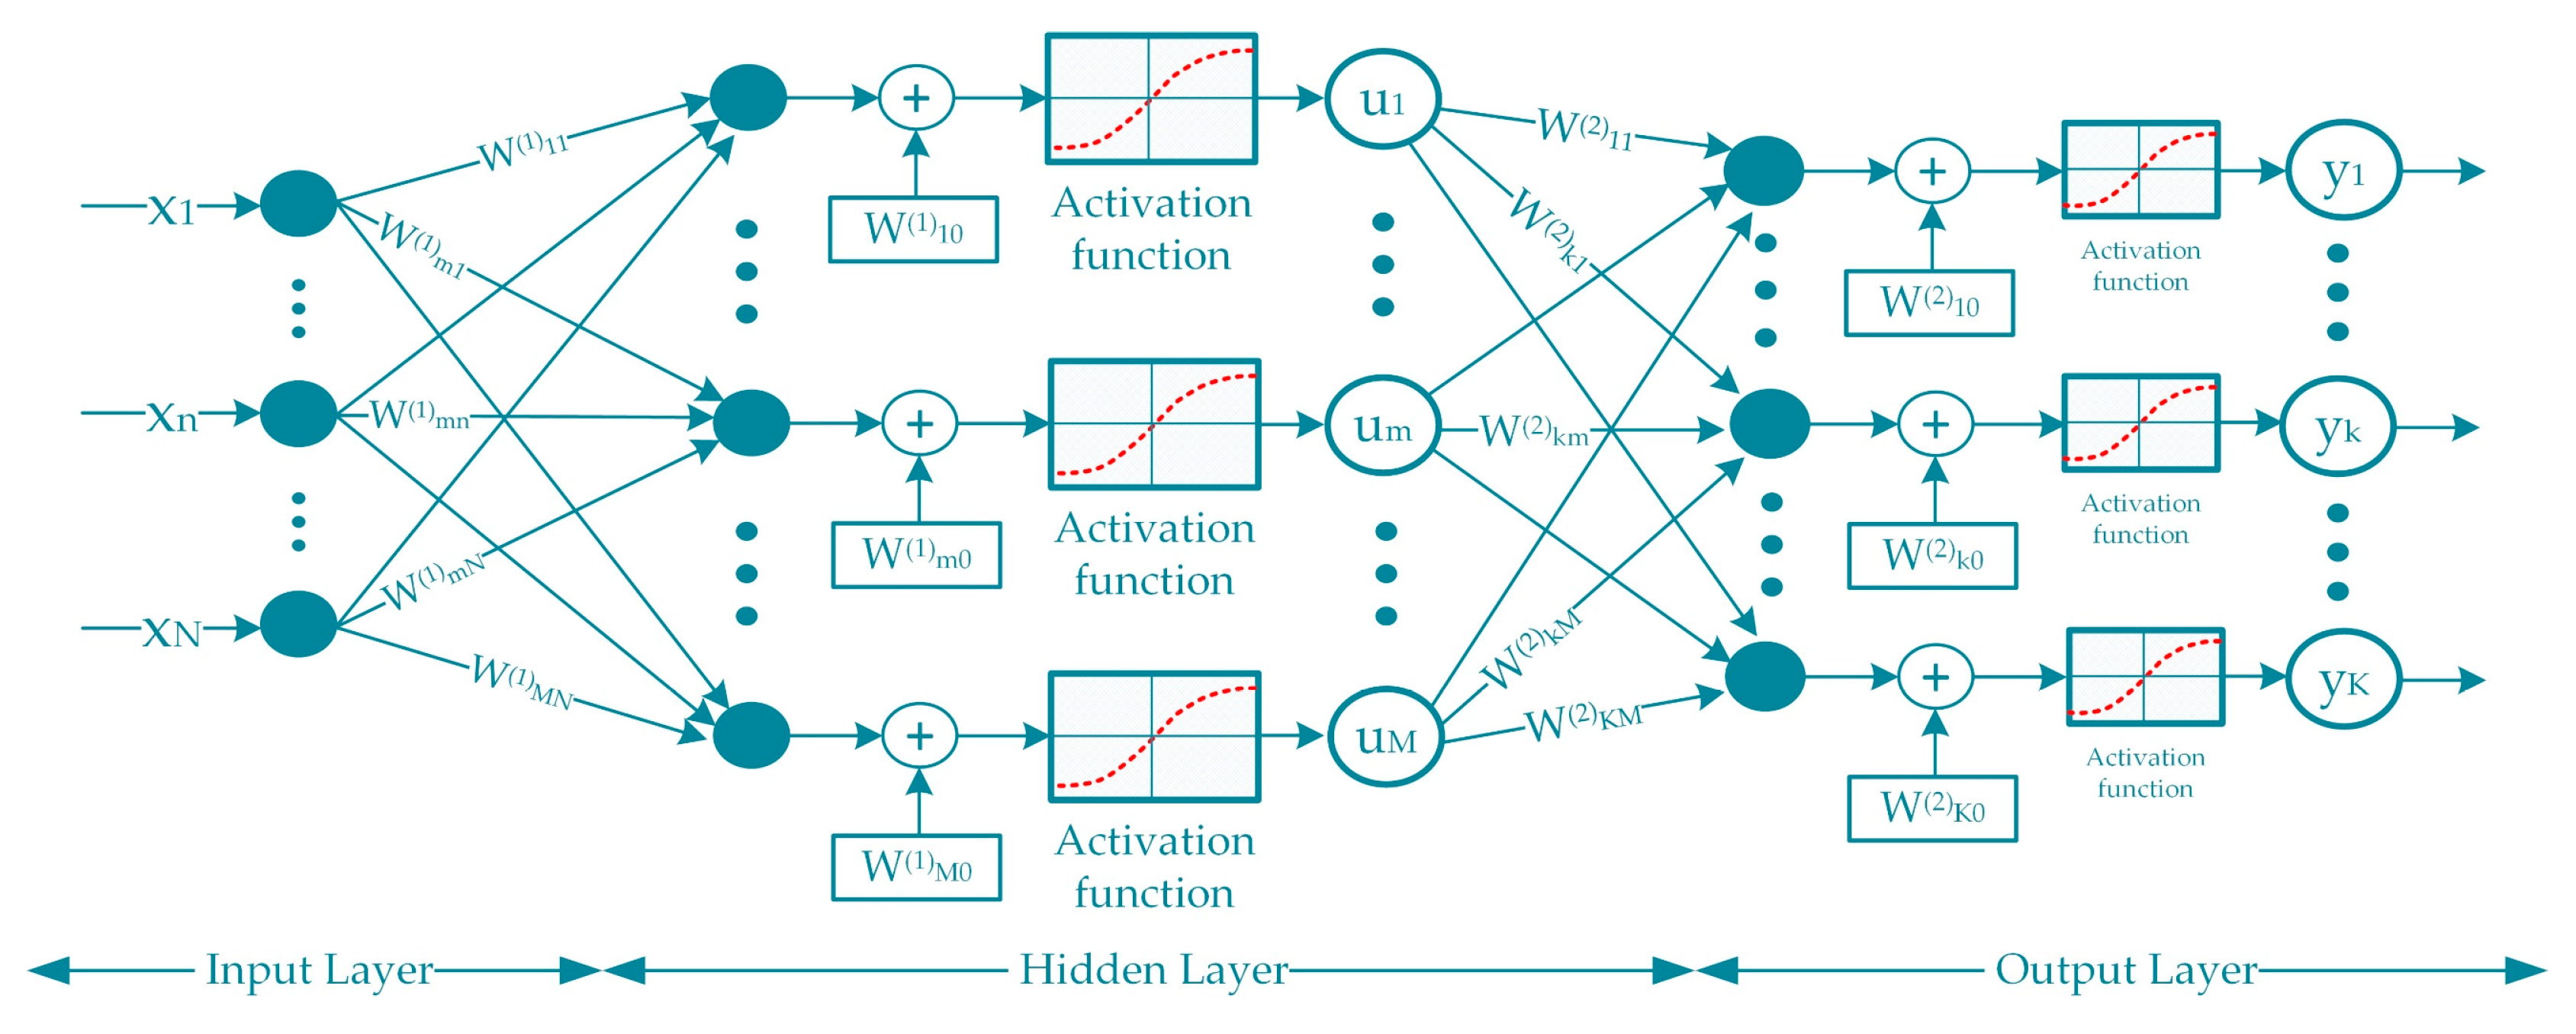
3.2. Multilayer Feedforward Network

Multilayer feedforward NN (or multilayer perceptron network—MLP) are currently the most commonly used neural structures in technique. This fact results from the simplicity of their implementation in programmable systems, as well as the mapping capabilities of any function. The MLP network acts as an approximator of the learning data, and the learning process consists in minimizing the suitable cost function [42]. The effectiveness of the network is closely related to the structure used, the teaching method and the number of neurons in particular layers. The output signal of the exemplary two-layer network, presented in Figure 3, can be described by the following equation:
y k = f ( 2 ) ( m = 1 M W k m ( 2 ) f ( 1 ) ( n = 1 N W m n ( 1 ) x n + W m 0 ( 1 ) ) + W k 0 ( 2 ) ) ,
where: xjjth input of the network, yk—output of the kth neuron, f(1,2)—activation functions of the 1st and 2nd layers, Wki—weights factors of the given layer.
Most often in the hidden layers of MLP sigmoidal activation functions are used and the Levenberg-Marquardt (LM) gradient algorithm is applied for training, thus they were also used in the research presented in this paper.

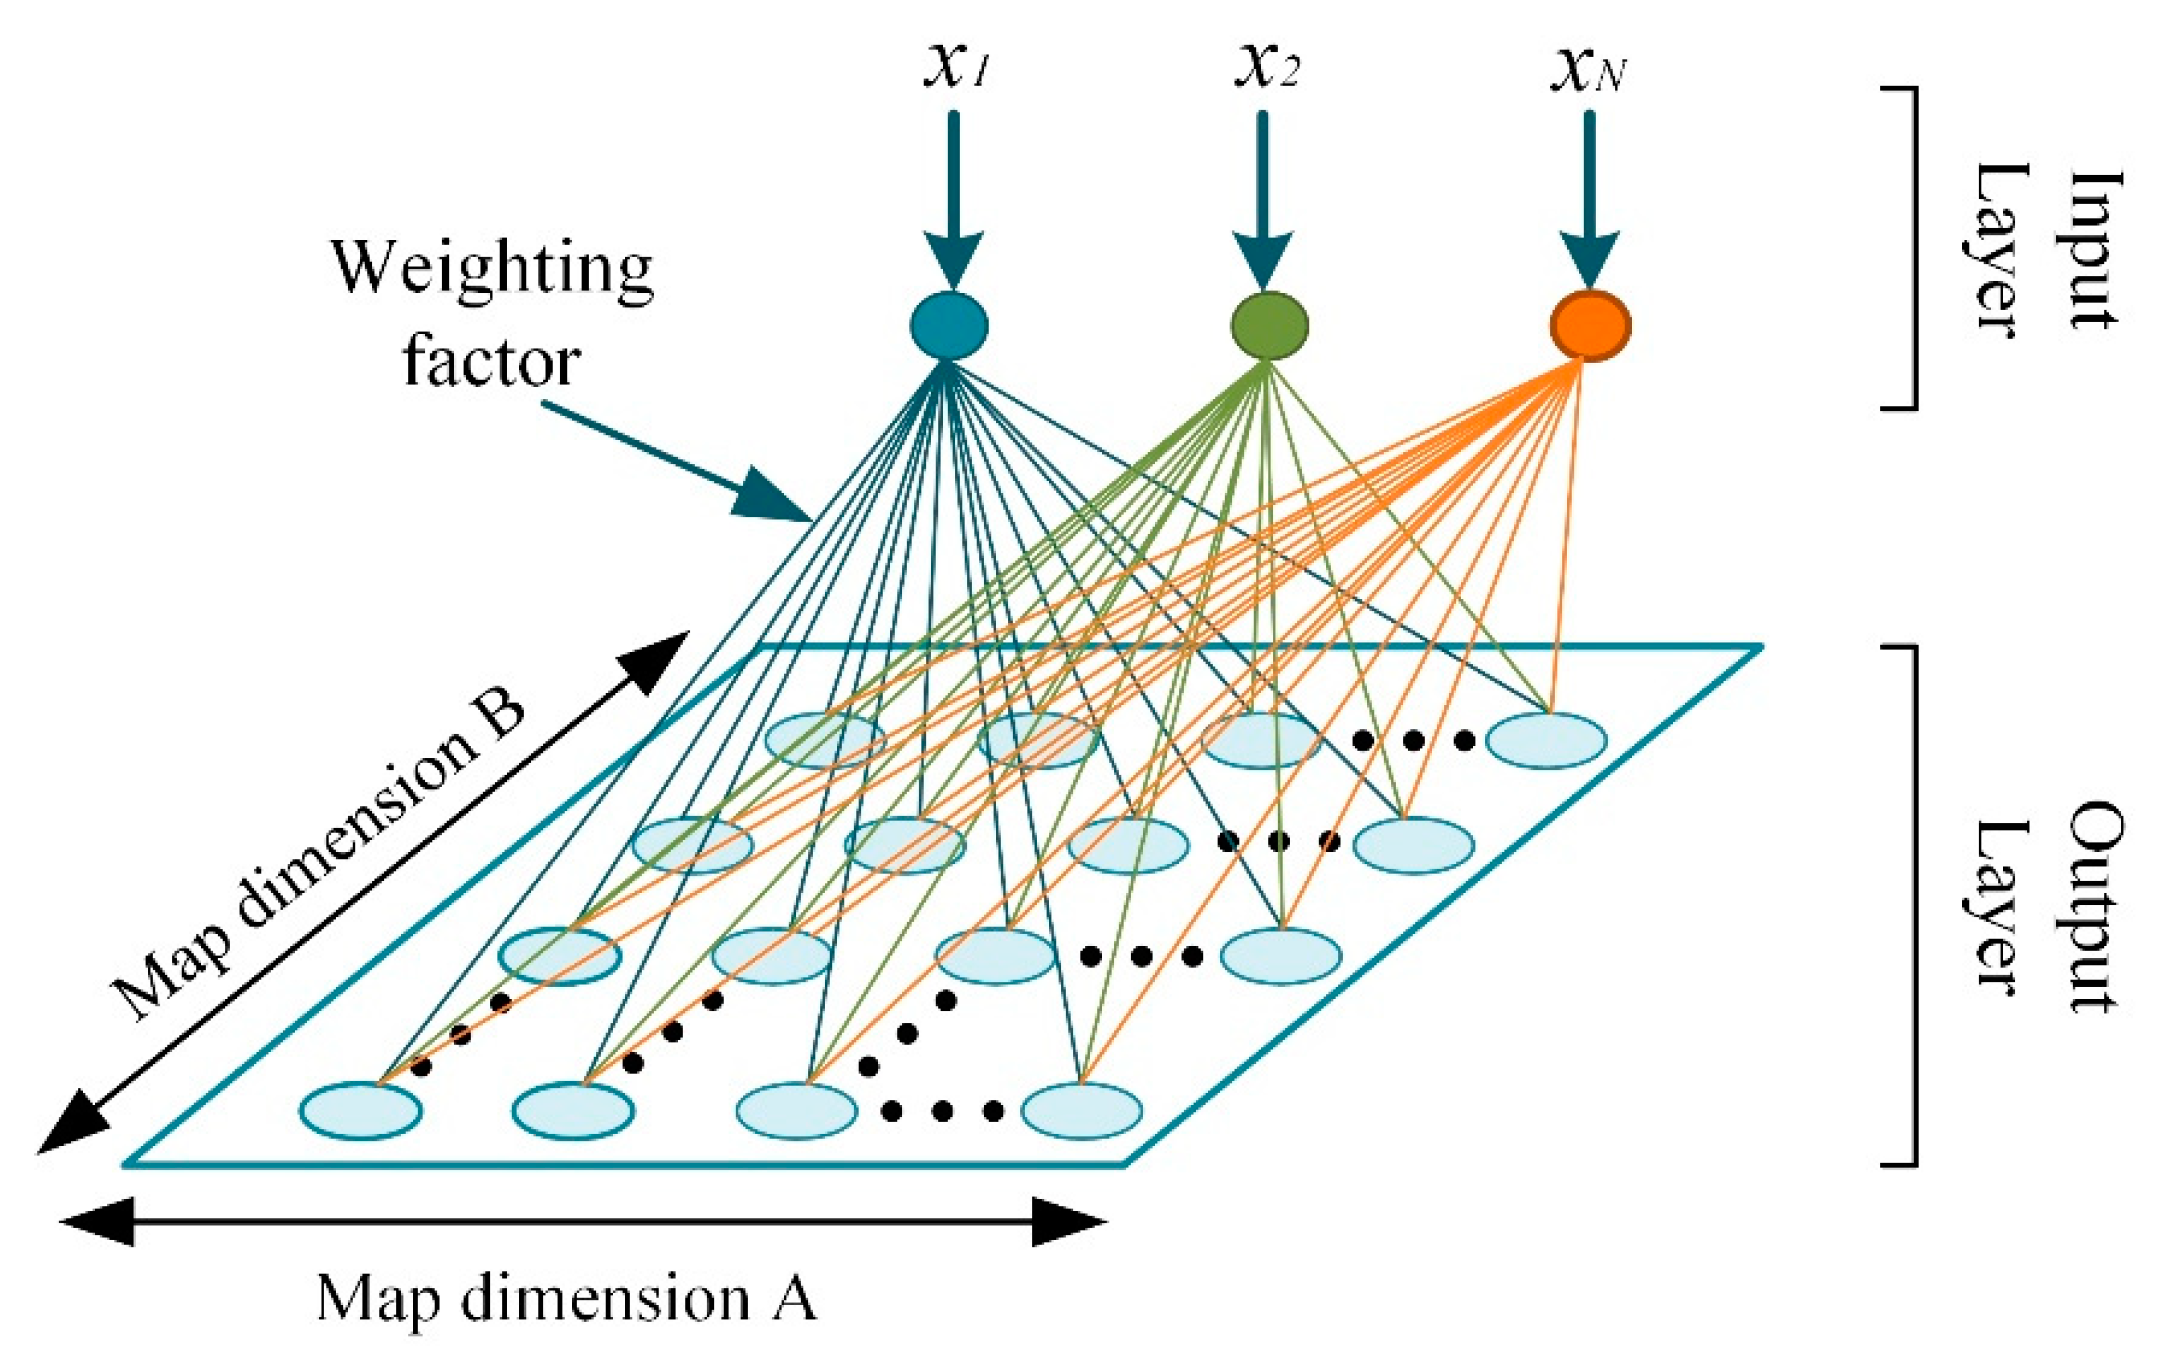
3.3. Self-Organizing Kohonen Map

The self-organizing Kohonen map (SOM) is the basic data classifier used in technique. The SOM allows to delimitate different subsets of the entire data set and to determine clusters of units with similar characteristics. This feature of self-organizing networks forms the basis for the construction of different diagnostic systems.
The SOM consists of two layers connected via weight vectors. The first is the input data vector. The second—output layer consists of neurons located in the nodes (Figure 4). Thanks to this network structure, individual output layer neurons can be represented as points on the Kohonen map.
The basic problem when designing the SOM is the selection of the optimal topology, as well as the number of neurons that allows the correct division of the map into individual areas. In the case of a large number of patterns, the number of network neurons (map size) should be correspondingly larger [42]. The network topology determines the type of connections between neighboring neurons. The most frequently defined Kohonen network topologies are rectangular and hexagonal. Appropriate selection of the network structure, the number of neurons, neighborhood coverage directly affects the ability to distinguish clusters.
During the learning process of the Kohonen network, the Euclidean measure of the distance between the presented unit and all network neurons is calculated):
d E ( x i , w m ) = x i w m .
The next step is to find a neuron whose distance to the presented unit is the smallest. The adaptation process of Kohonen’s weights can follow two strategies: the most known learning method WTA (Winner Takes All) or the WTM method (Winner Takes Most). Under the WTA learning process only the weight factors of the winner’s neuron are changed, while in the WTM method both the weight coefficients of the winner’s neuron and neighboring neurons are adapted. In this approach, applied also in this research, the neighborhood function G is used to determine the rate of change of the weight coefficients of neighboring neurons. The adaptation process of neuron weight wm is realized in the following way:
w m ( k + 1 ) = w m ( k ) + η ( k ) G ( R , d ( c , m ) ) [ x ( k ) w m ( k ) ] ,
where: R—assumed neighborhood level of SOM, d(c,m)—the distance between the victorious neuron c and the m-th neuron of the network, η—learning factor.
The SOM learning process is stopped after all data from the training set has been presented. Every neuron in the map becomes a model for its close relatives. After entering the learning data network into the input, the division of the map into individual patterns can be assessed. If the map is characterized by a group structure, it is possible to reduce the size of the map while maintaining the obtained level of effectiveness.

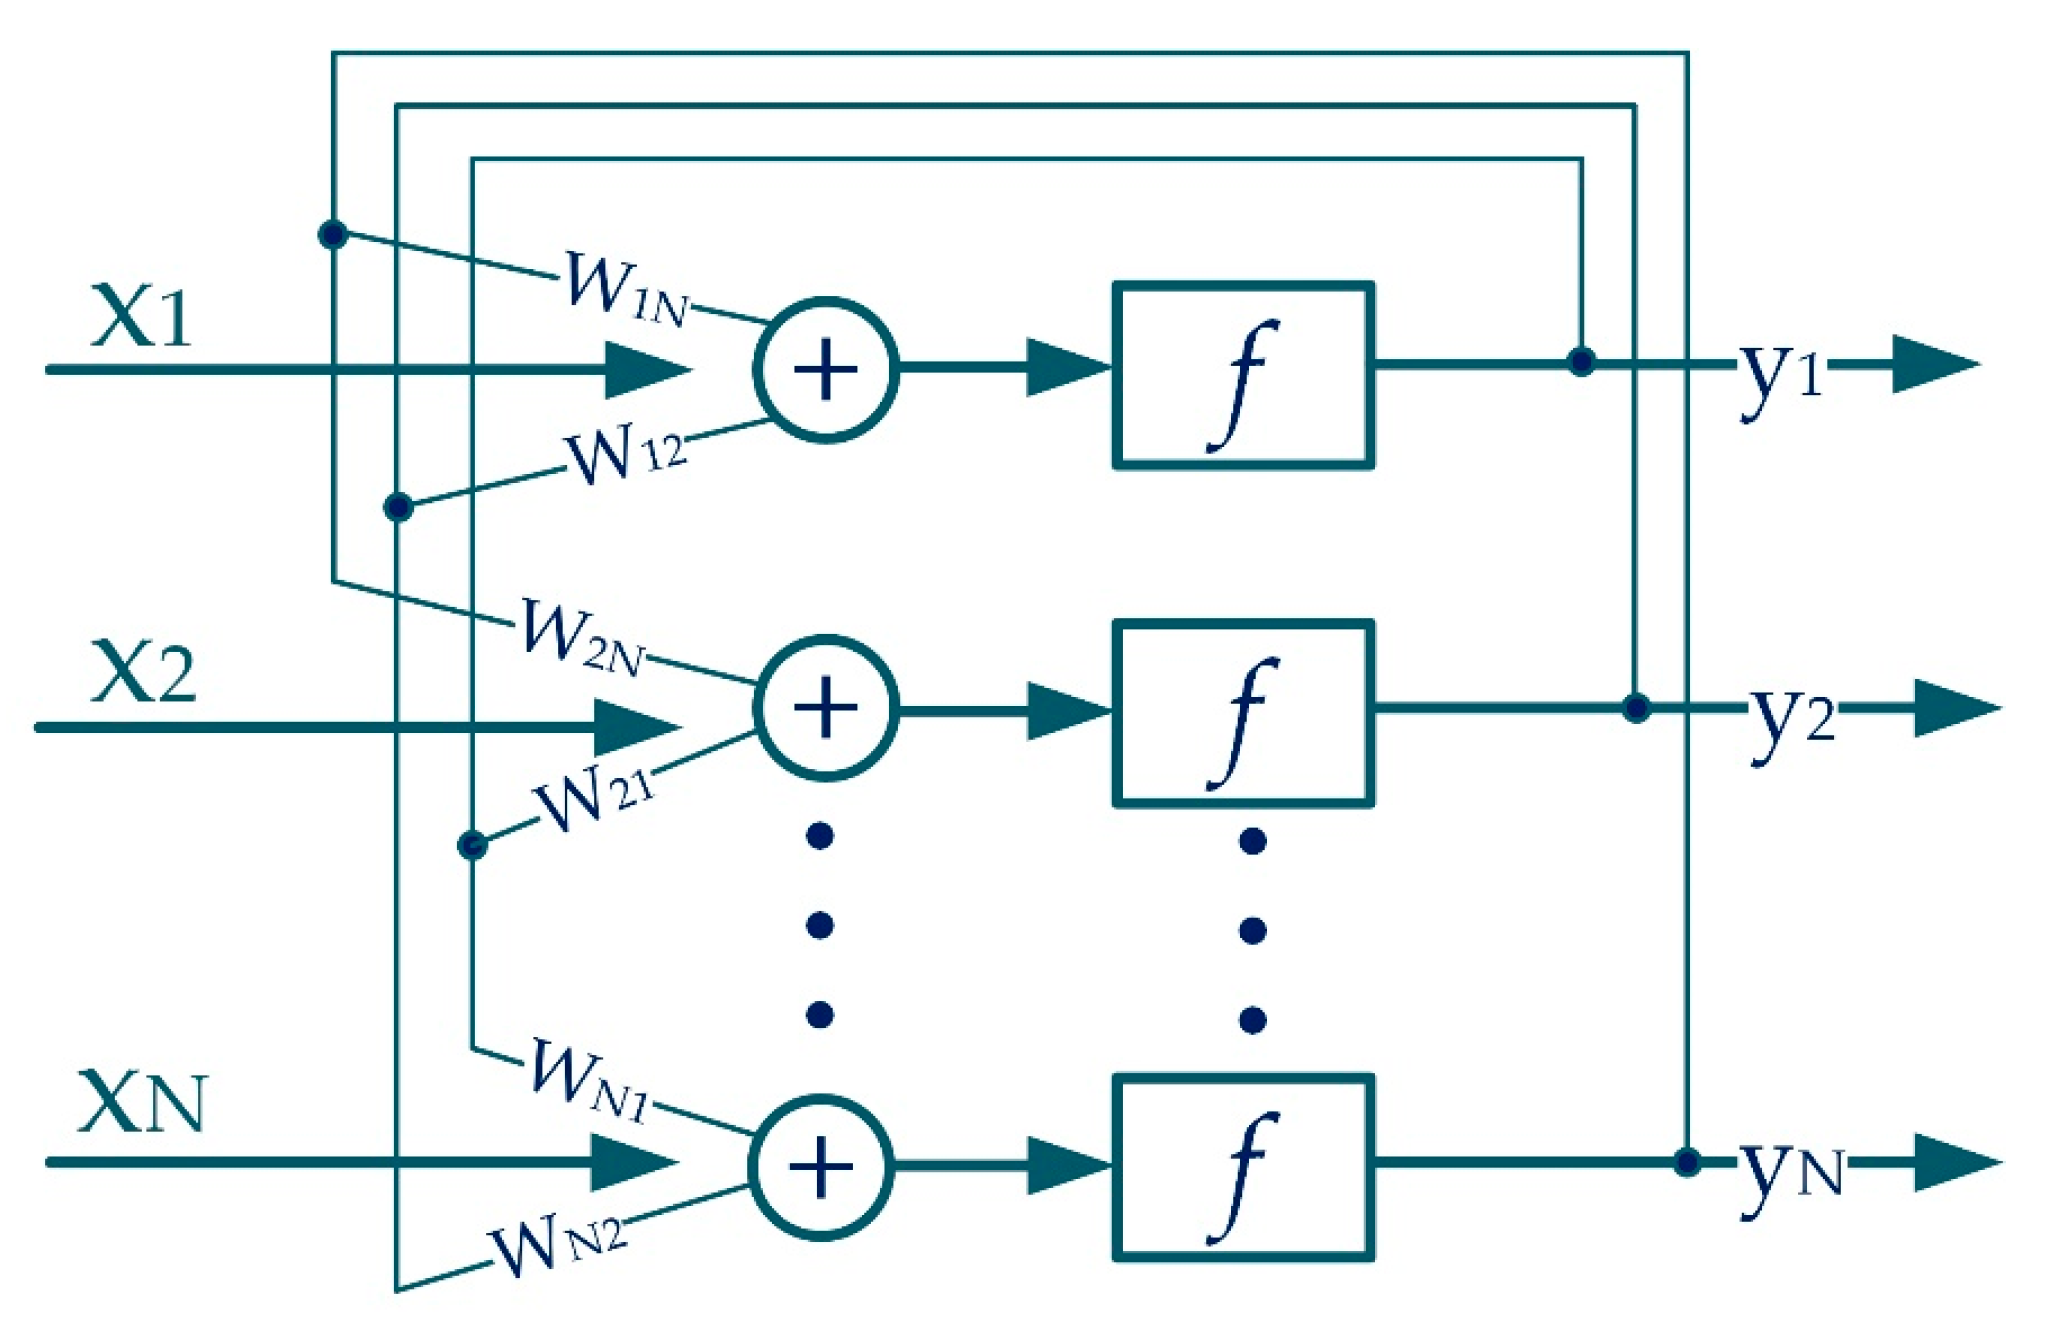
3.4. Recurrent Hopfield Network

Recurrent networks are characterized by existence of feedback between the input and the output of the network. The basic representative of such NNs is the recurrent Hopfield network (RHN), called also a self-associative memory. The RHN is distinguished by the fact that the change in the state of one neuron affects the entire network. In order to simplify the RHN structure, each neuron has a binary activation function f. In addition, there is no feedback for a given neuron with its own output, and the weights matrix are symmetrical (Figure 5).
The purpose of self-associative memory is to memorize a set of training data that will allow to generate a response equal to one of the patterns. The NN response should match the test sample with the greatest accuracy, according to the adopted distance measure. For RHN, the Hamming distance measure dH is mostly used. For binary threshold nodes the Hamming measure is defined as:
d H = i = 1 N [ x i ( 1 y 1 ) + ( 1 x i ) y i ] .
Training the Hopfield network involves the adaptation of the weighting factors of the network, which will ensure the minimization of the measure dH for a given test vector. The Hopfield network output signal for a certain sample is given by the equation:
y i ( k ) = f ( j = 1 , i 1 N W i j y j ( k 1 ) ) .
The network operates in two stages: learning and reconstruction. When learning the network, weight factors are selected based on information on the form of the base of patterns. The weight factors are to ensure the steady state of the network in a reconstruction mode. The most common method of learning the RHN is the algorithm resulting from pseudo-inversion. With the right choice of weights, each pattern given to the input should generate itself at the output. The advantage of this approach is immediate achievement of the steady state. If the training vectors are linearly independent from each other, then the adaptation of the weights follows the equation:
W = X ( X T X ) 1 X T .
The use of pseudo-inversion allows to increase the capacity of HRN. The algorithm presented in the form of Equation (10) is called the projection method. Its variation based on a gradient algorithm for minimizing the objective function is the ∆–projection method:
W ( i ) = W ( i 1 ) + 1 N α ( x ( i ) W ( i 1 ) x ( i ) ) [ x ( i ) ] T .
In contrast to the classic projection method, in this case a multiple pattern base presentation is required. The process of selection of weight coefficients is interrupted when changes in weights are less than the assumed accuracy. After completing the network training process, the replacement mode is activated. The test data vector is given to the network input, and then the network response is calculated according to the relationship (9). The iterative process is repeated until a response is established.

4. Experimental Verification of the Tested Fault Detectors

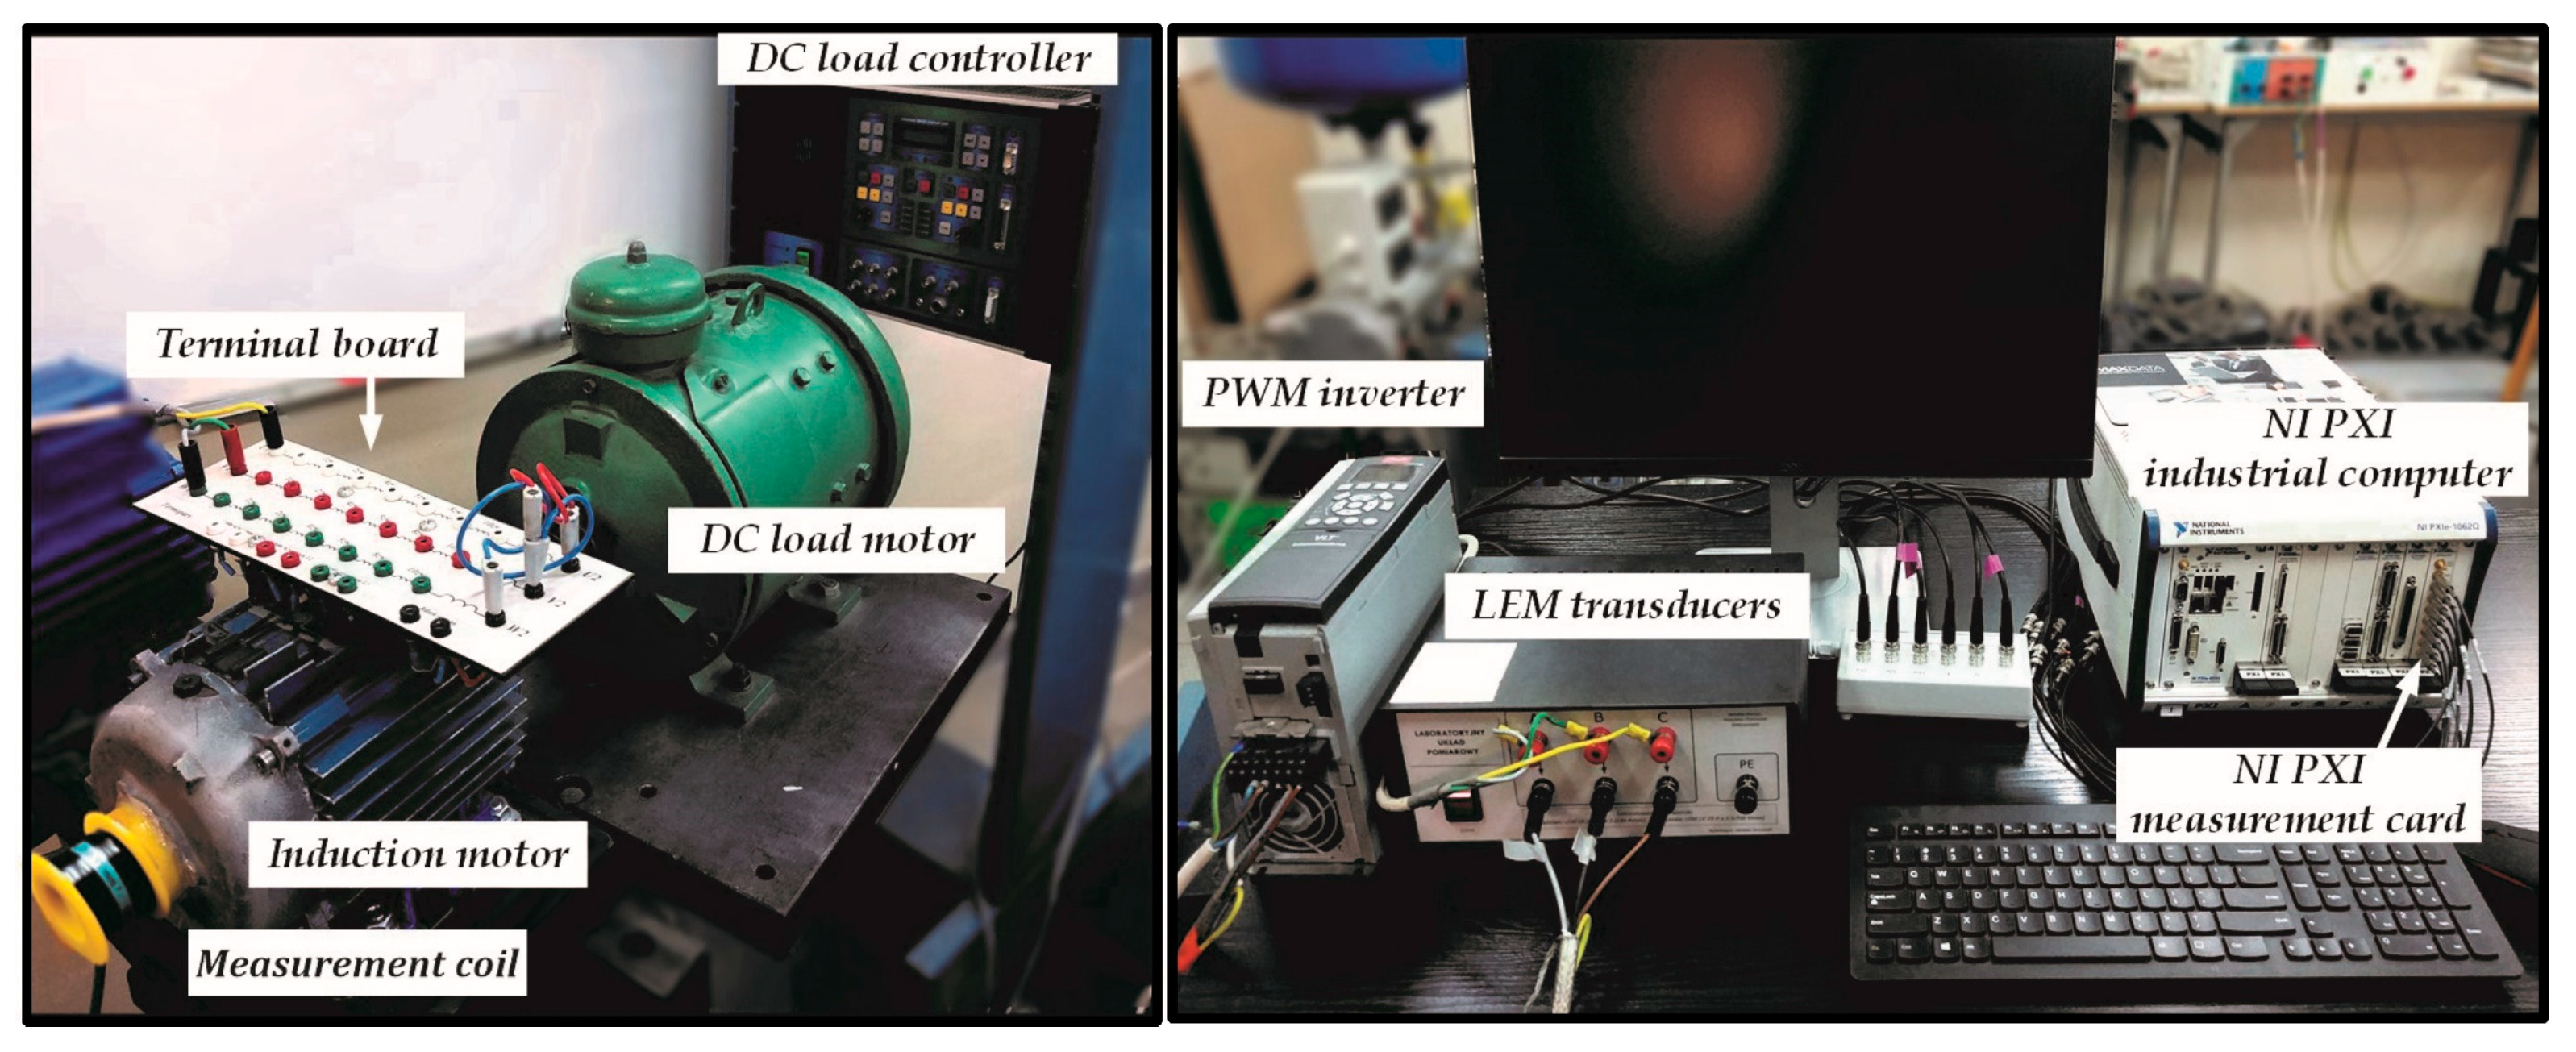
4.1. Description of the Experimental Set-Up and Conducted Tests

The experimental verification of the developed neural detectors of IM electrical circuit faults was carried out on a laboratory test-bench consisting of a 1.5 kW squirrel-cage IM (with the parameters given in Table 1, powered from a frequency converter (Figure 6).
The load torque was generated by means of a DC machine connected by a rigid shaft with the tested IM. The measuring system (coil placed in the axis of the shaft) enabled the analysis of the diagnostic signal for various machine operating conditions. The general view of the test bench is shown in Figure 6. The tested IM allowed to physically model the discussed rotor and stator defects.
The tests were carried out for various fault types as well as mixed failures:
  • 0–10 shorted turns of one stator phase,
  • 0–3 damaged rotor cage bars.
The change of the supply voltage frequency took place in the range fs = (20–50) Hz, while the adjustment of the load torque in the range TL = (0–1)TN. On the basis of the conducted tests, the symptoms of the IM rotor and stator damages were selected for the training process of all tested NNs, realized in Matlab [43]. The NN detectors have been next developed in the LabVIEW software of National Instruments (Austin, Texas, USA) using weight factor matrices obtained after training and testing procedures performed in Matlab.
Figure 7 shows the FFT of the voltage induced in the measuring coil by the axial flux. In the case of shorted turns (Figure 7a) as well as broken rotor bars (Figure 7b), a distinct increase of the components in the spectrum described by Equations (1)–(4) compared to the spectrum for the undamaged motor is observed. After the analysis of the impact of motor working conditions on the diagnostic signal, the FFT components constituting the input vector of the studied neural structures were selected.

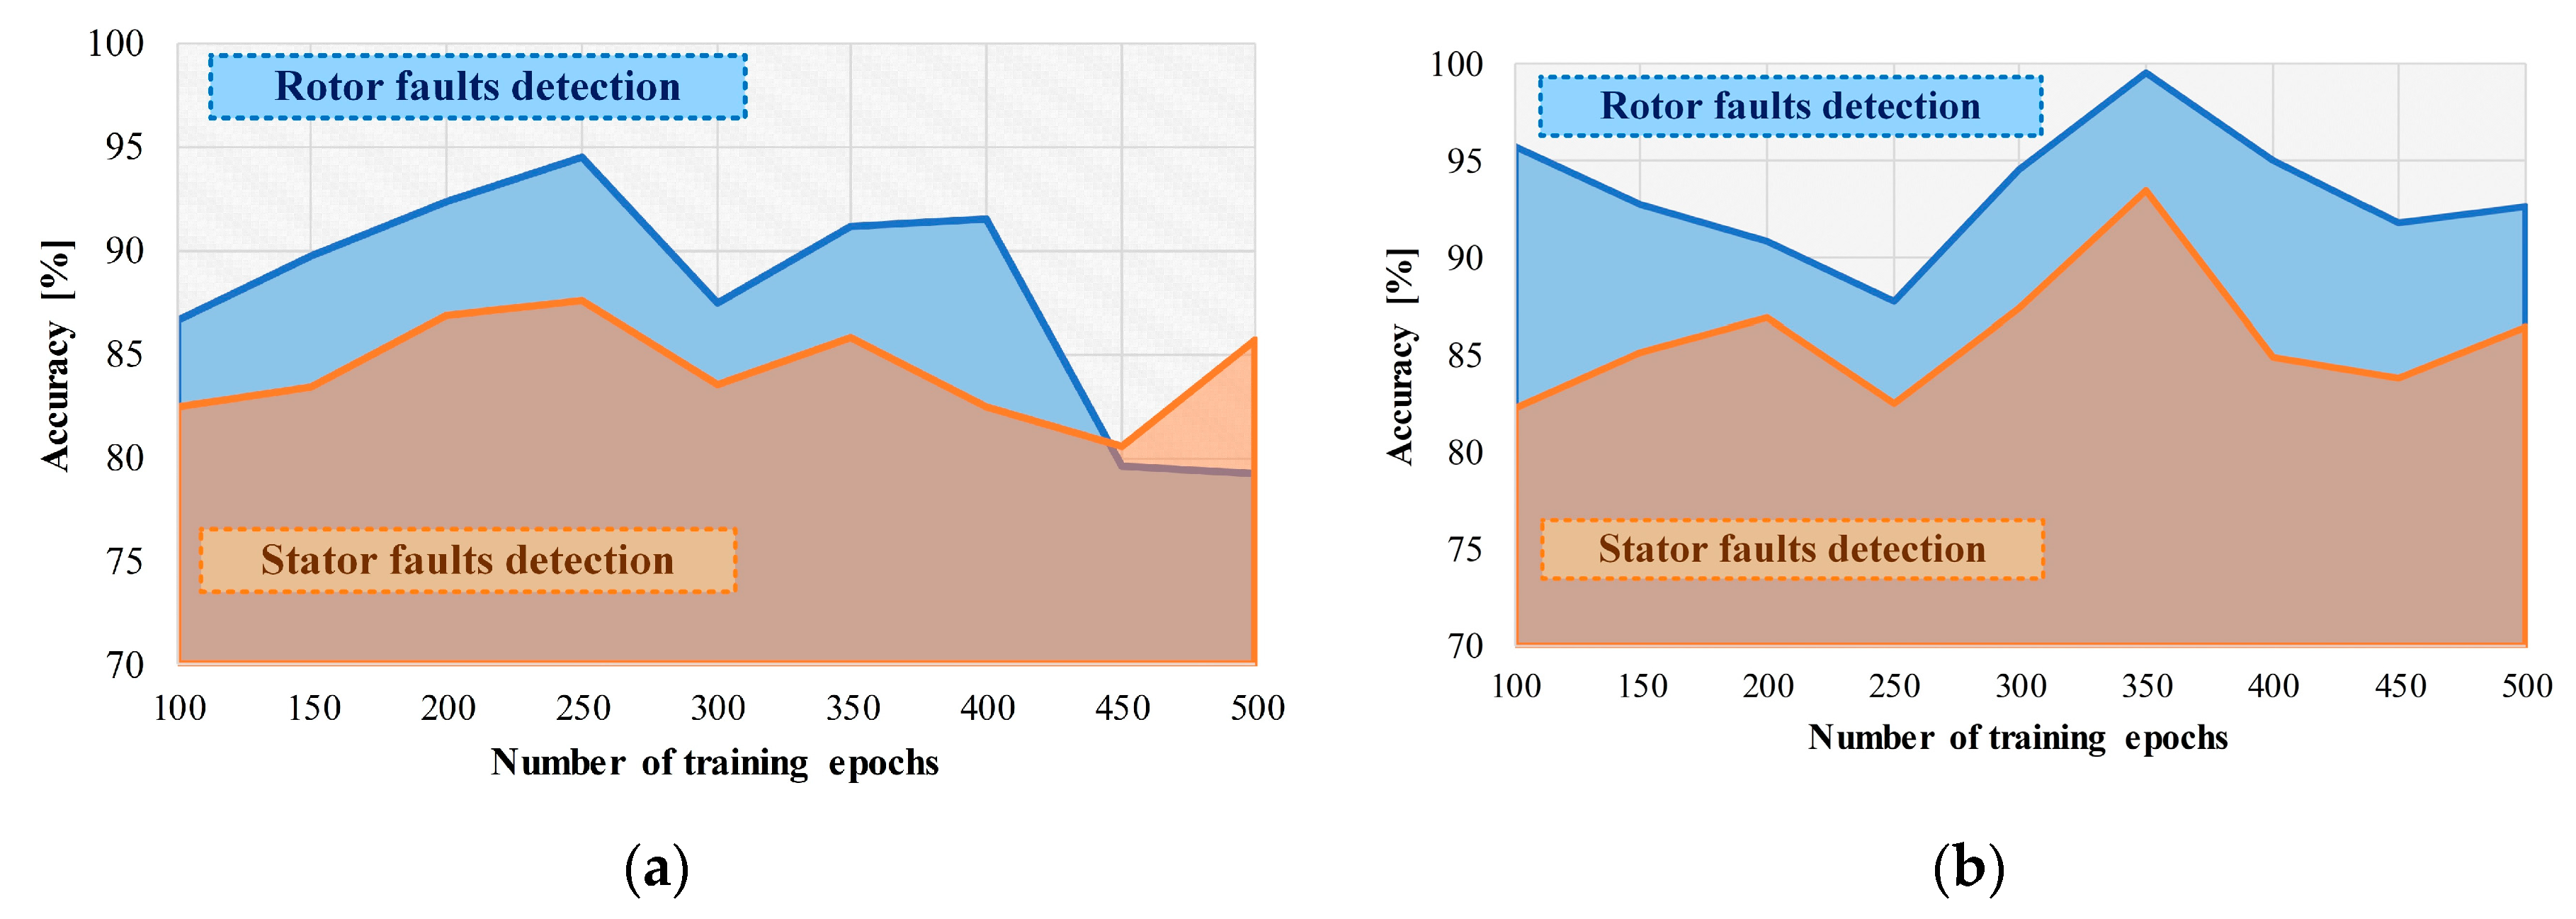
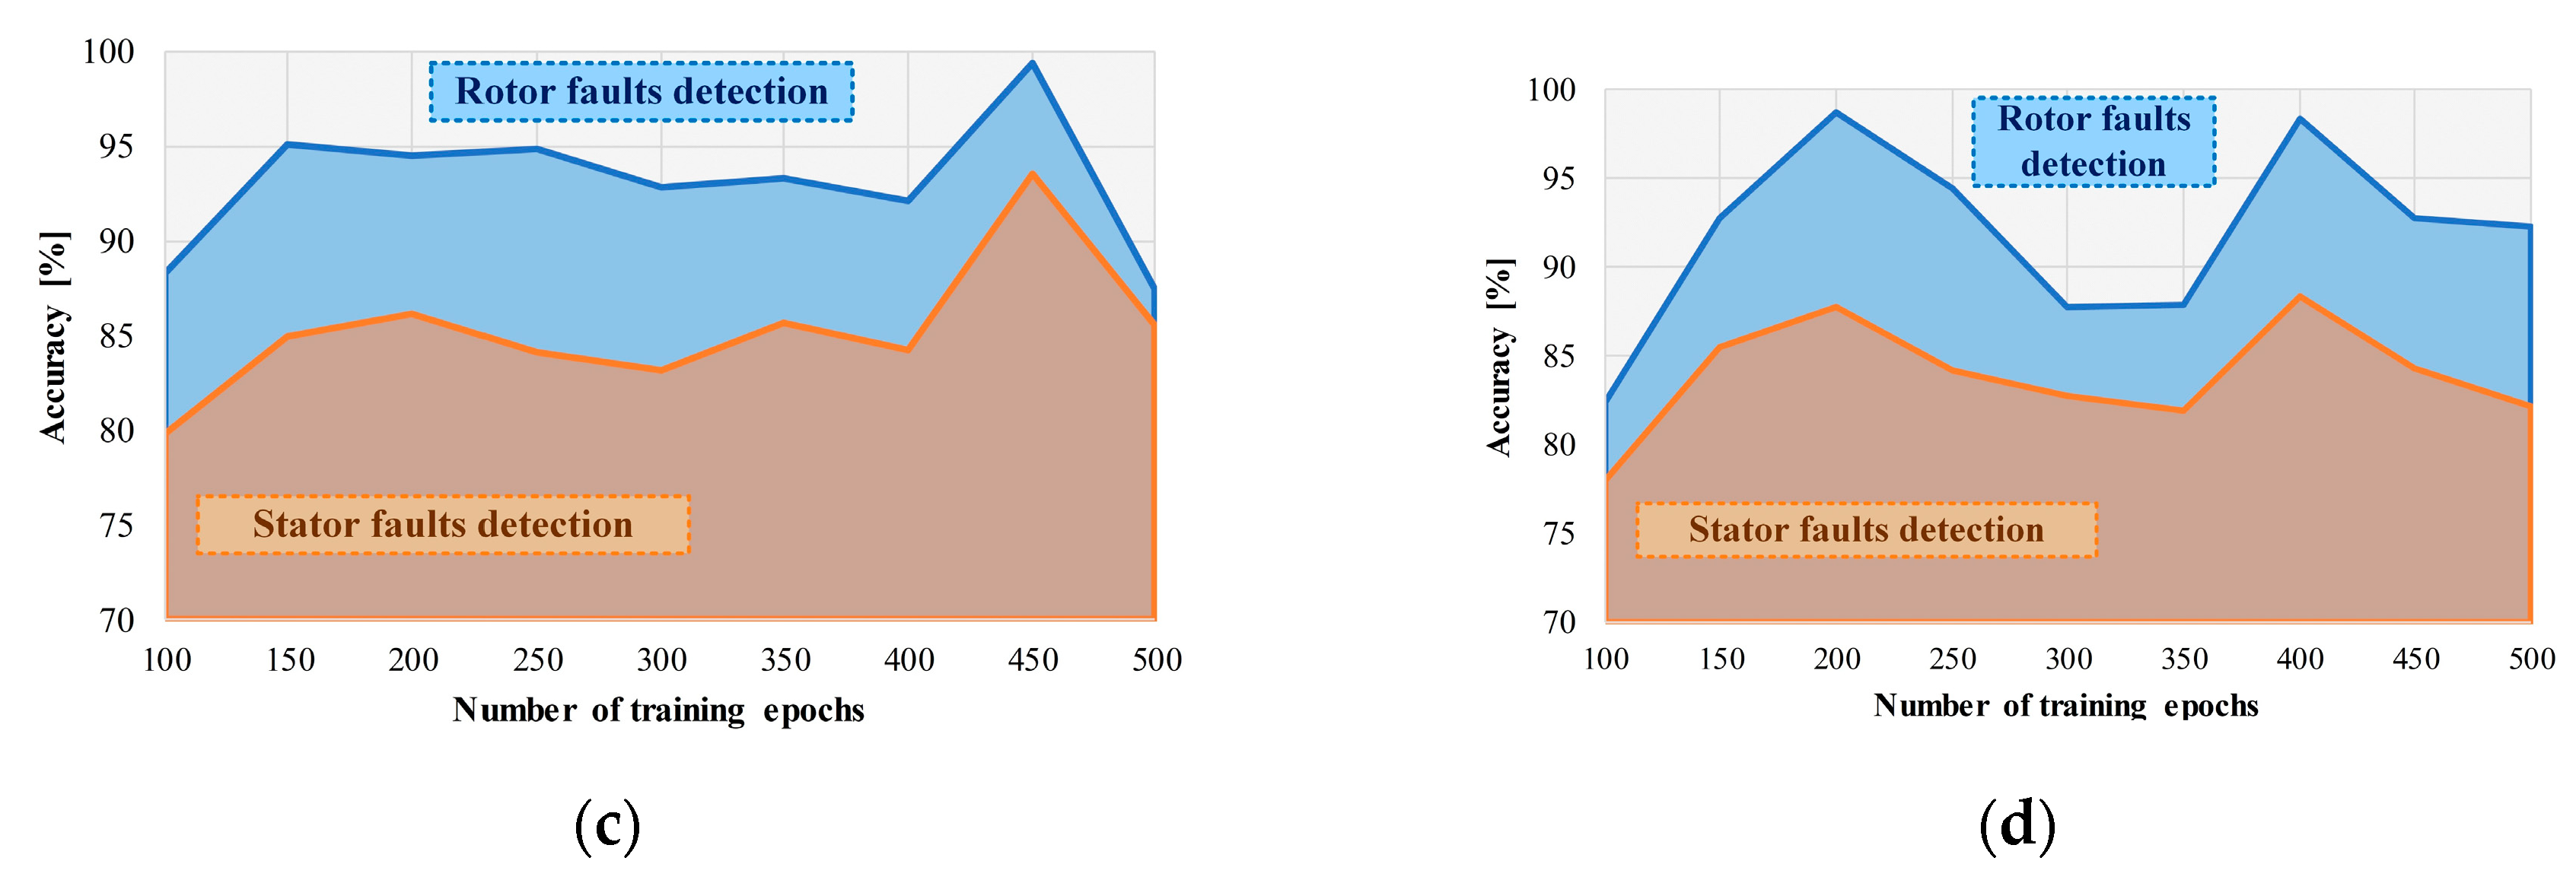
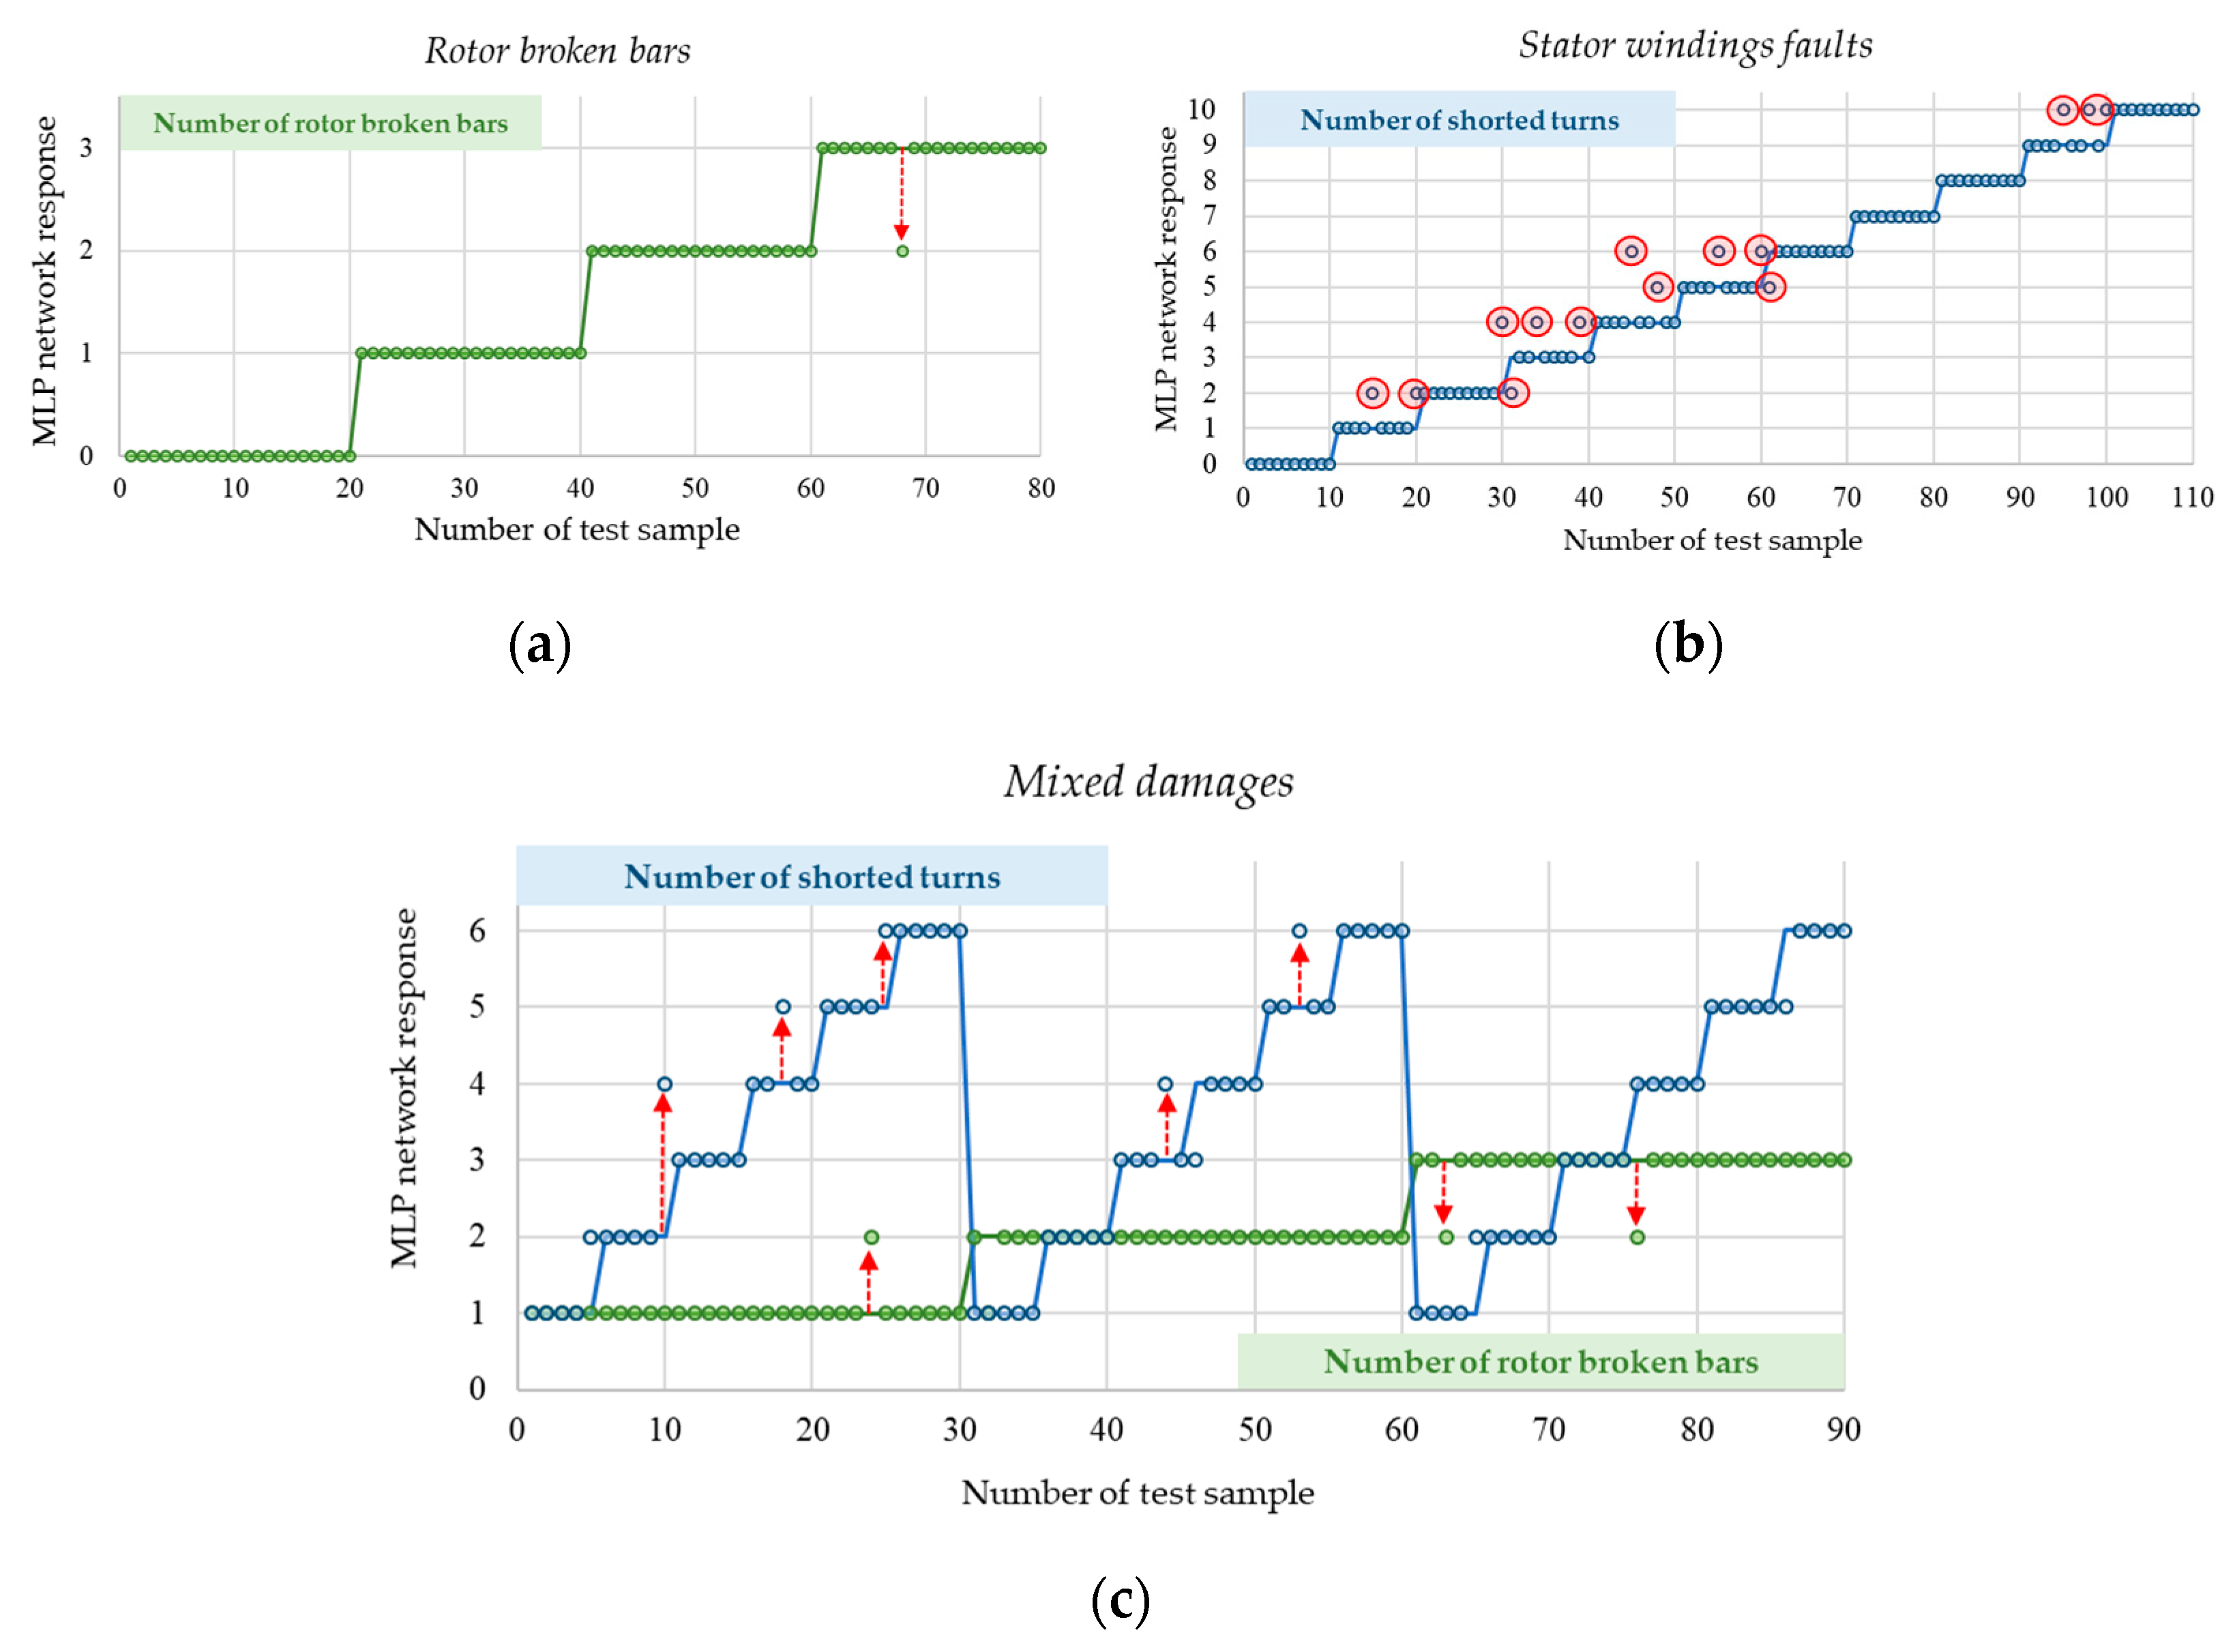
4.2. Result of the Fault Detection Using MLP Networks

The MLP network teaching vector contained information on the amplitudes of the characteristic harmonics of the axial flux spectrum with the frequencies: fs, sfs, and 3sfs only. The vector contained data from 300 measurements of the diagnostic signal carried out on the real object. The set contained measurements for variable load conditions and the frequency of the motor supply voltage. The testing vector contained 280 measurements not used in the training procedure of MLP detectors. During the development of MLP fault detectors, particular attention was paid to the effectiveness of detecting both single and mixed electrical failures. This parameter was adopted as a quality indicator of the developed fault detectors. MLP learning process was carried out in the Matlab environment. During the tests, the effectiveness of MLPs with different structures was analyzed in simulations.
Figure 8 shows the dependence of the detection efficiency of stator and rotor damage on the applied MLP structure. As can be seen in Figure 8b, the greatest effectiveness of single faults detecting was characterized by a network with three neurons in the input layer, two hidden layers with 12 and eight neurons, respectively, and two neurons in the output layer.
The analysis also shows the influence of the number of training epochs on the fault detection efficiency. The highest level of effectiveness for network structure {3-12-8-2} was obtained for 350 epochs. The use of two hidden layers allowed for a high level of detector effectiveness even in the case of simultaneous damages to the stator and rotor windings.
The results of experimental tests of the best developed MLP-based detector {3-12-8-2}, carried out on the real object, are given in (Figure 9).
The failure detection efficiency of the rotor cage bars (Figure 9a) for the analyzed network structure {3-12-8-2} was approximately 99%. It should be noted that errors made by the MLP network between undamaged and damaged condition of the motor is less than 1% of all cases. Thus, if the efficiency of the network is demonstrated by the fact that it is not possible to distinguish the degree of damage, but only the type information (damaged/undamaged), then this network has the efficiency higher than 99%. Furthermore, the combination shown in Figure 9c includes the detection of both individual failures and mixed failures.
Analyzing Figure 9b it was found that the assessment of the degree of damage to stator windings by MLP network is correct in over 88% of tests. The erroneous response of the NN occurred in the majority of cases for the damage of 5–7 shorted turns. This fact may result from similar quantitative changes in the harmonic amplitudes of the axial flux spectrum for stator winding damage in this range. It is worth noting, however, that the network has only twice provided incorrect information about the damage at its initial fault stage. Possible errors of the MLP neural detector are connected with disturbances caused by the impossibility of separating the axial field measuring coil from other field disturbances, as well as changing the amplitude of the spectrum due to changes in the load torque of the motor. A clear increase in the characteristic harmonic amplitudes is noticeable for the load torque greater than a half of its nominal value. For a motor operating under low load conditions (TL < 0.2TN), false information about the condition of the tested machine may be created. It should be noted that the fault detection of IM electrical winding faults is aimed at detecting the early possible stage of the failure. Due to the above, the distinction of the degree of damage other than the initial one is the secondary goal of the diagnostic system.

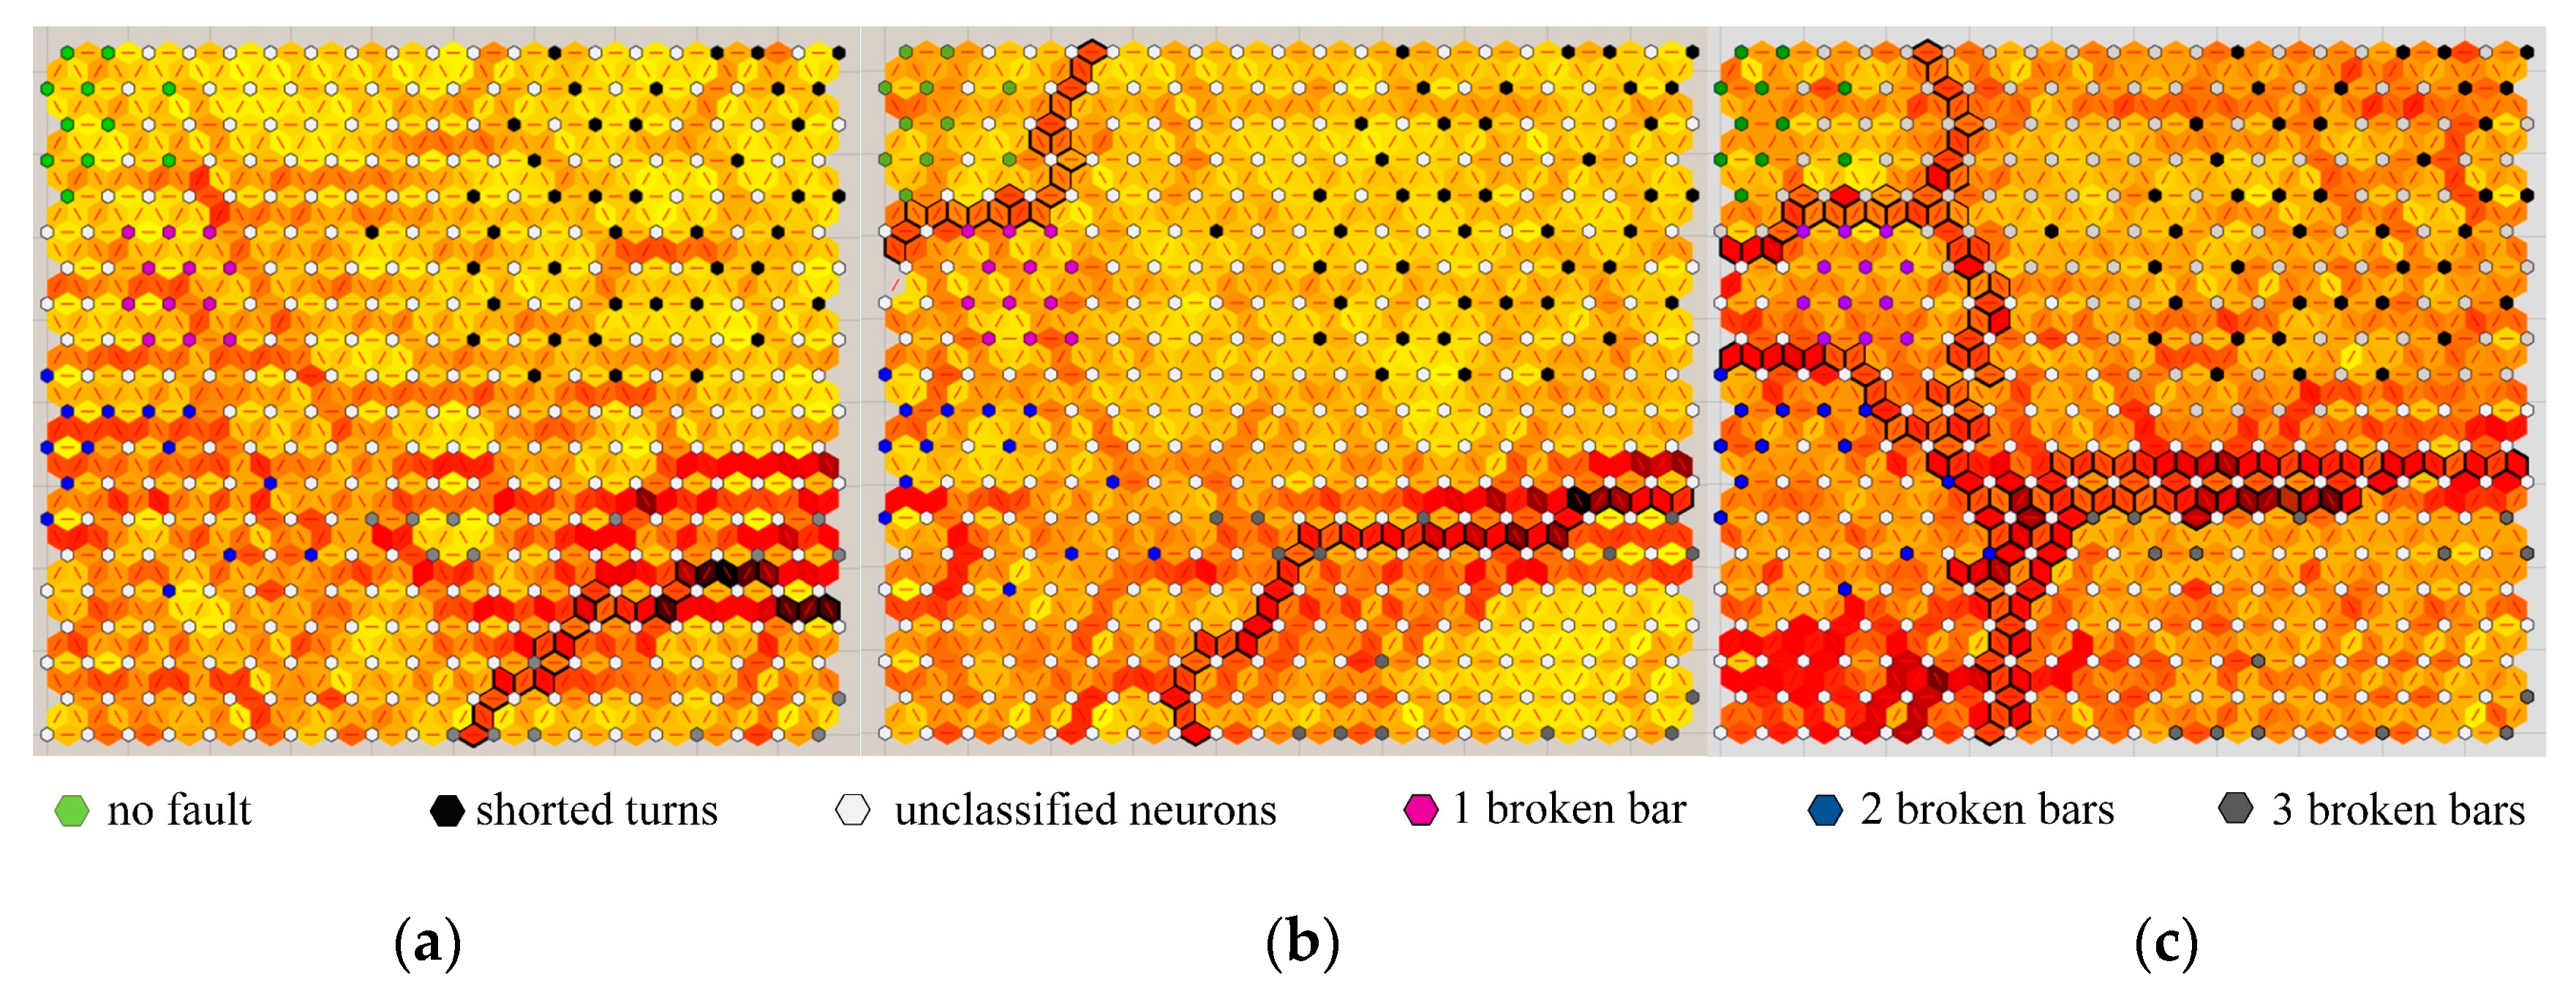
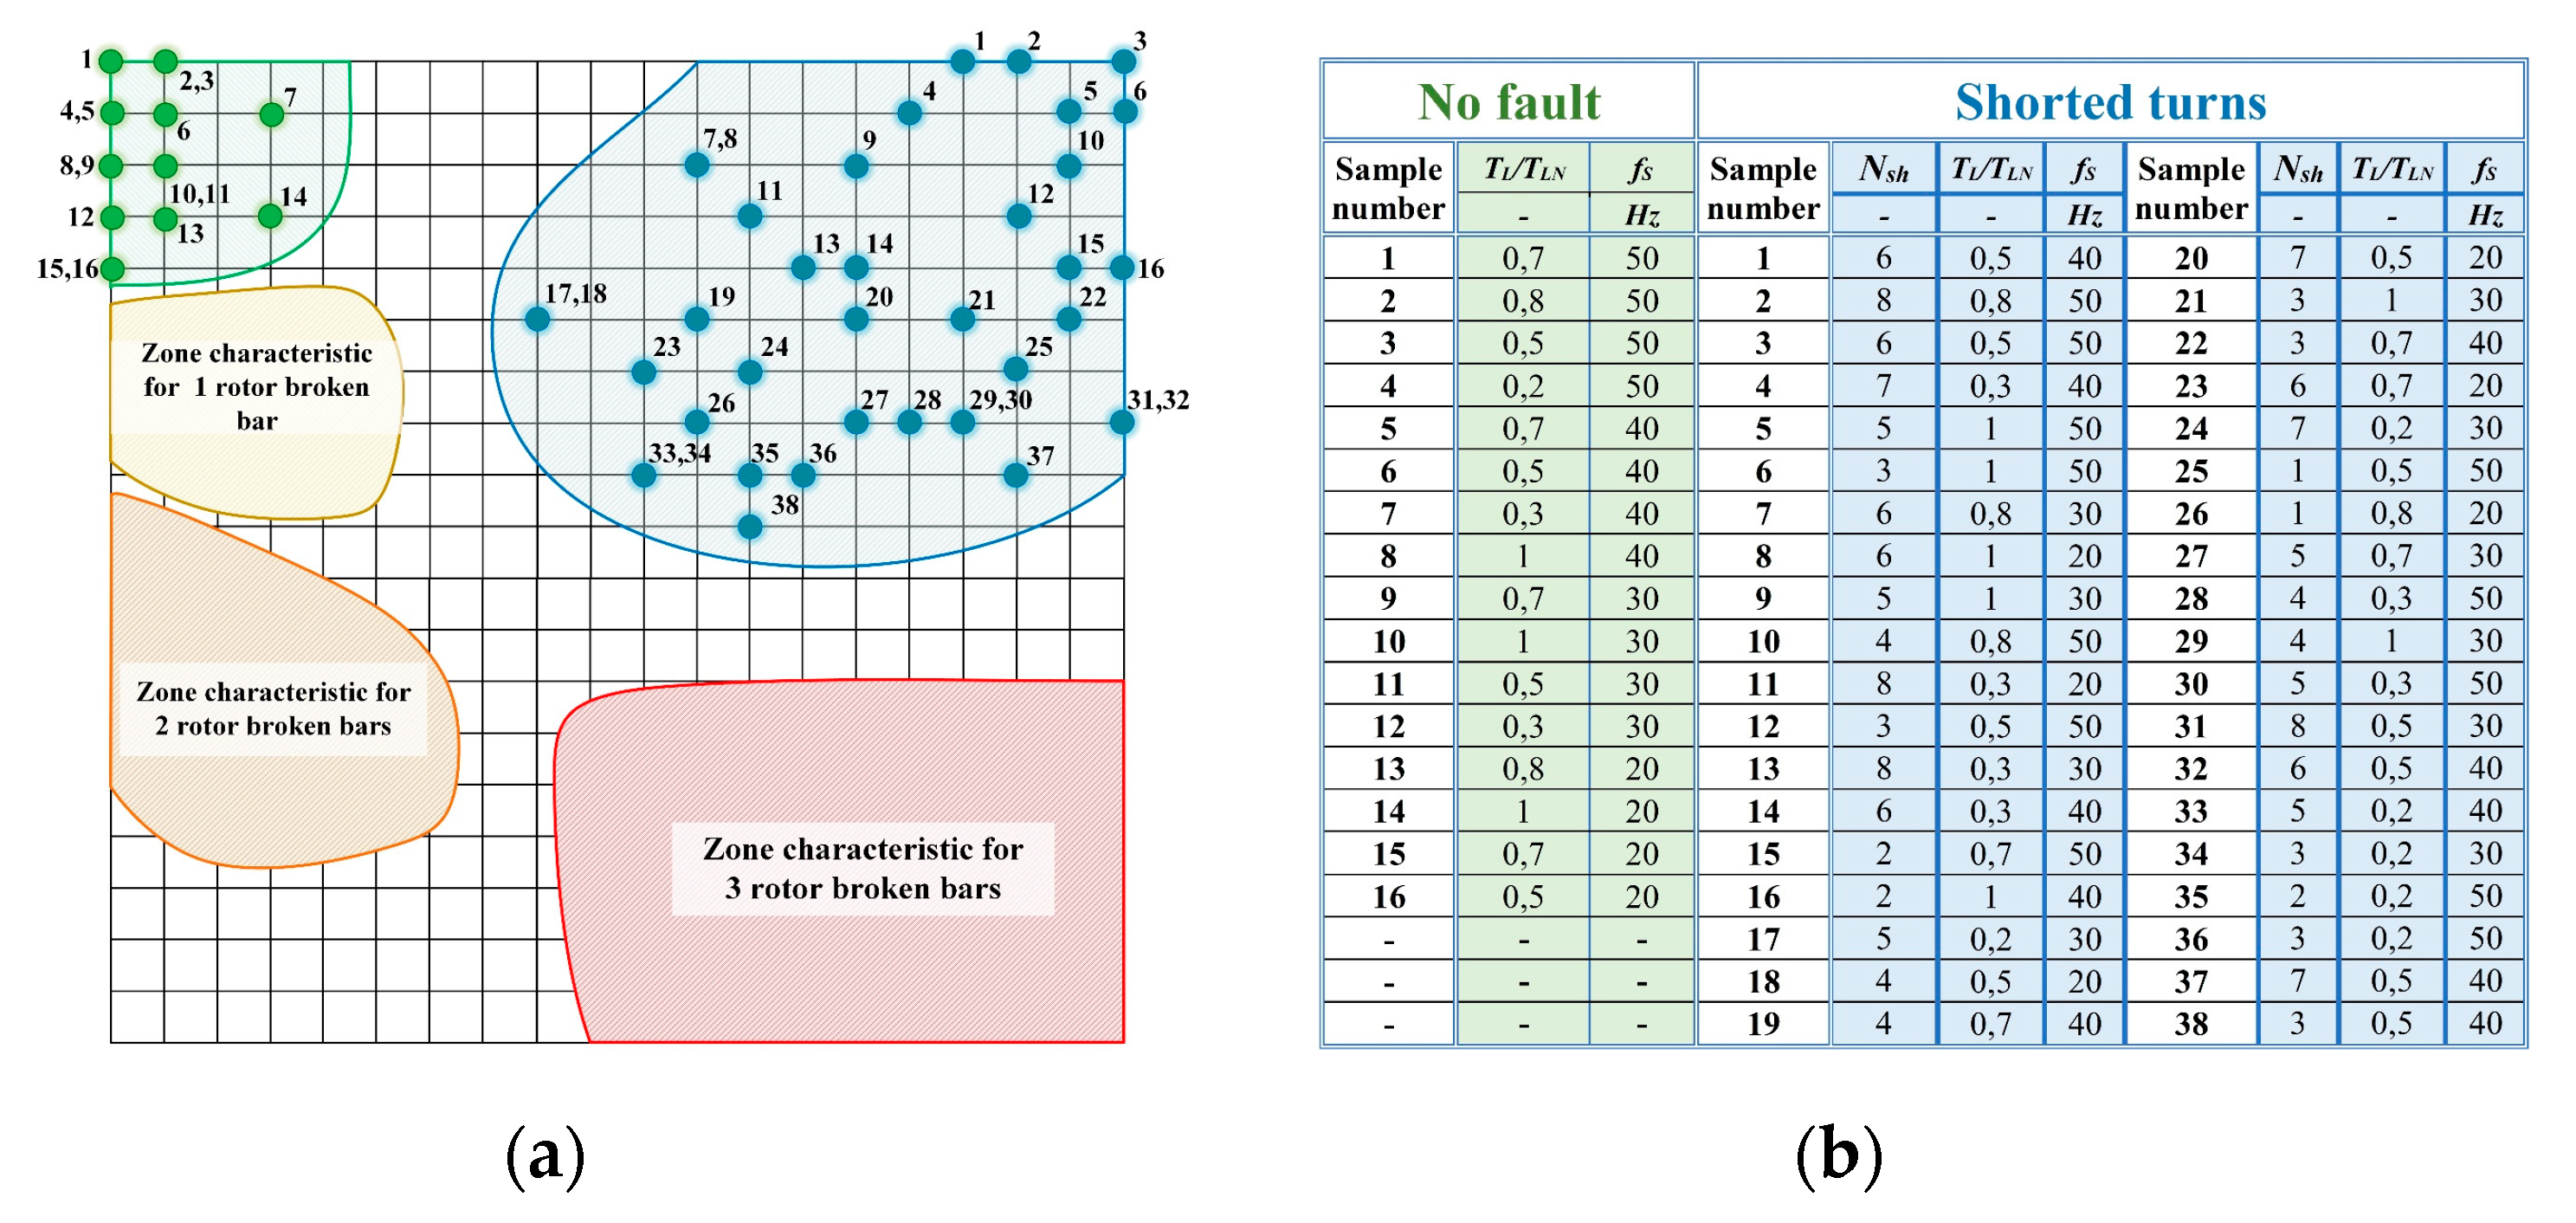
4.3. Result of the Fault Detection Using Kohonen Netoworks

It is well known, that Kohonen network is an excellent tool for the classification of damage categories. During the conducted tests on the real IM drive, the effectiveness of fault classification was checked for networks with 100 and 400 neurons. As input data vector, information on the amplitudes of the axial flux spectrum components at frequencies fs and 3sfs was used. The training data vector contained the results from 125 measurements of the diagnostic signal (25 measurements—for undamaged motor, 25 measurements—for stator inter-turn short circuits (from 1 to 10 turns), 25 measurements for each damaged rotor (with 1–3 broken bars). The tests were carried out for changeable frequency of the supply voltage and the load torque of the motor, using 110 measurements different from those used in the training process. Applying the same number of measurements for each state of the IM made it possible to obtain a uniform division of the SOMs. Thanks to the use of a similar number of patterns for individual failures in the learning process, it is possible to determine the level of damage to the rotor cage and provide an approximate value of the number of shorted turns.
In the first stage of the research, particular attention was paid to selecting the appropriate number of training epochs as well as the appropriate learning rate η. The results are presented in Figure 10 for a SOM with 400 neurons (20 × 20).
As can be seen in Figure 10, for the wrong number of training epochs (Figure 10b), only areas for extreme fault values are separated. The use of such a trained network would make it impossible to detect damage at an early stage. The use of an increased number of training epochs (Figure 10b) allowed the separation of areas characteristic for particular faults. In Figure 10c, the SOM’s area for undamaged motor is clearly separated showing no damage. Therefore, the risk of mistakes in assessing the technical condition of the tested machine was eliminated.
The selection of the network learning rate η, like the number of learning epochs, significantly affects the relationship between SOM neurons. As shown in Figure 10a,c, for the same number of training epochs, the selection of the initial value of the learning rate plays a key role. Too low a learning rate value (Figure 10a) requires an increased number of training epochs. Only then it is possible to adjust the distances between the SOM neurons in a way that ensures the separation of individual zones.
As a result of decreasing the size of the map (10 × 10; 100 neurons), the distances between the areas characteristic for individual damages are reduced, resulting in greater difficulties in distinguishing the severity of damage. Decreasing the size of the map does not affect radically the effectiveness of the detection process (see Table 2), however, a smaller number of overlapping neurons in the case of stator short-circuit analysis is noticeable for the bigger map. In connection with the above, the possibility of distinguishing “subareas” in the zone for shorted turns of the stator winding increases for bigger SOM, which results in increased effectiveness of the fault level detection. Thus, the further results are shown for the bigger map (20 × 20).
On the basis of the obtained maps with marked distances between network neurons, approximate areas characteristic for individual motor failures were determined (Figure 11 and Figure 12).
In these areas, points corresponding to active neurons for different values of the network input vector have been marked. The values of the input vector elements are related to the actual technical condition of the tested machine. Results of faults’ classification realized by the analyzed SOM with 400 neurons are presented in Figure 11 for the rotor cage failures and for the stator winding faults in Figure 12, respectively. As noted in Figure 11, when decreasing the frequency of the motor supply voltage, an increase in the activity of neurons, located on the SOM closer to the area characteristic for no damage is noticeable. This fact is related to the decrease in the amplitudes of the harmonic components of the axial flux spectrum due to the reduction of the frequency of the fundamental component of the supply voltage under speed frequency control of the IM. The increase in neuronal activity does not adversely affect the classification of the motor damage. By analyzing the SOM responses shown in Figure 11 and Figure 12, it was found that a decrease in the load value results in stimulation of the neurons located lower on the Kohonen map.
The training vector of the NN did not include measurements for simultaneous damages to the rotor and stator windings. However, the developed SOM-based fault detector makes it possible to correctly classify the damages together with the assessment of the degree of individual rotor damage.
The evaluation of the effectiveness of the neural detector of damage to the electrical circuits of the IM has been divided into two categories. The first of these was the assessment of the type of damage. In this case, attention was focused on the proper assessment of damage in terms of the place of occurrence (rotor/stator/no damage). The second indicator for evaluation the SOM effectiveness was the ability to assess the degree of individual damage. An approximate assessment of the failure detection performance based on the results obtained with the Kohonen networks is shown in the Table 2.
When analyzing the results presented in this table, a reduced value of network efficiency was noted when assessing the degree of damage to the stator windings for both analyzed SOMs. This fact results from small changes in the axial flux signal due to the increasing number of shorted turns. As with the MLP network (Figure 9b), it is difficult to distinguish between short circuits of 5, 6 and 7 turns. The Kohonen network only allows to determine the approximate value of the number of shorted turns. The correctness of the fault level assessment (number of shorted turns) in the stator windings is also strongly dependent on the frequency of the supply voltage and the load torque values. In the case of stator winding failures, measuring the axial flux while the unloaded motor is operating would eliminate the difficulties associated with the evaluation of the number of shorted turns. However, as mentioned in Section 2, idle-running of the motor precludes proper detection of damage to the rotor cage bars, as the spectral components characteristic of rotor failures depend on the current slip of the tested machine.
It is clearly seen from the analysis of Table 2, that the lower fault detection effectiveness as well as the effectiveness of the fault level classification for stator and rotor winding is worse in the case of smaller SOM (10 × 10). It results in particular from following reasons:
-
the reduced stator fault detection efficiency is caused by the fact, that zones for Nsh = 1 and Nbb = 1 are close each other at high load,
-
the decrease in the effectiveness of stator damage grading results from too many overlapping neurons in smaller SOM; in the case of a (20 × 20) map active neurons are more “spread out” on the map,
-
reduced efficiency for the detection and classification of rotor damages by SOM (10 × 10) results from small distances between the zones for Nbb = 3 and Nbb = 2.
On the basis of the above discussion, it can be stated that the Kohonen map enables correct assessment of the type of damage to the electric circuits of the IM and perfectly separates the damage of the stator and rotor windings as well as undamaged states of the motor. It should be noted that at the expense of reduced effectiveness in the case of the evaluation of the number of shorted turns in the stator winding, increased robustness of the detector to changes in the load torque and the frequency of the supply voltage was obtained.

4.4. Result of the Fault Detection Using RHN

The recurrent Hopfield network uses the similarity of the current network response to known base values. Neural network learning process was carried out for the training vector obtained on the basis of 200 measurements. Elements of the training vector were amplitudes of the axial flux spectrum at the following frequencies: fs, fs + 2fr, 3fs − 2fr, 5fs + 3fr, fs − 4sfs, sfs, 3fr + sfs, 5frsfs. Learning the Hopfield network consisted in determining the value of the weight and bias matrices. Verification of the correctness of the weights selection was carried out in accordance with the pseudo-inversion principle by providing the training vector to the input of the network.
After completing the process of selecting RHN’s weight coefficients, the network response to the base data vector was analyzed. As observed in Figure 13, the principle of pseudo-inversion has been met. Hopfield’s network with the given input vector belonging to the base of patterns, generated the same vector at the output. The pseudo-inversion principle has been preserved for both stator and rotor failures. The network responses shown in Figure 13 for the entire base of patterns confirm the correctness of the RHN learning process.
During the analysis of the damage detection effectiveness, a testing vector containing data from 100 measurements (different from the used in the RHN learning process) performed on the real object was used. In order to analyze the properties of the RHN-based fault detector, research has been conducted on the impact of the number of basic data and the network structure on its effectiveness. The results are shown in Figure 14. Analyzing the effect of the number of patterns (Figure 14a) and the number of neurons (Figure 14b) on the RHN effectiveness, it was noted that with their increase there is a significant increase in the efficiency of the Hopfield network. The use of a larger size of the training vector greatly contributes to the improvement of the detection efficiency of the IM winding failures.
The number of RHN neurons is equal to the square of the number of input signals. Therefore, increasing the number of network inputs through a larger number of fault symptoms, wider spectrum analysis or samples of diagnostic signals from previous measurements, allows to improve the operation of the Hopfield network in the diagnostic system. As observed in the research conducted on the real object, the RHN based fault detector shows a strong dependence of response on the noise level of the input values (measurement signal). This detector also does not work properly in the case of a difference in internal parameters between the machine being tested and the one used during training process.

4.5. Comparison of the Used Neural Network Structures

Table 3 shows a comparison of the applied neural structures in the process of detecting electric faults of the converter–fed IM. The properties of particular networks were evaluated both in terms of the course of the learning process, effectiveness of fault detection and implementation complexity. As can be seen in Table 3, the MLP network was characterized by the highest detection efficiency during experimental verification.
The high efficiency of MLP network in fault detection is offset by difficulties during the selection of learning parameters as well as long time of the learning process. In contrast to MLP, the RHN network was characterized by the immediate learning process and the ease of selection of the parameters. Undoubted disadvantages of the RHN network are the lack of robustness to measurement disturbances and a strong dependence of effectiveness on the base vector. Self-organizing maps can be the golden mean between ensured a high level of efficiency, easy hardware implementations and the correct selection of the learning process parameters. The disadvantage of the SOM network is the difficulty in automating the detection process as well as dependence of learning process time on the structure and size of the SOM.
Summarizing the above, it was proved by experimental tests, that:
-
the MLP network requires well-chosen signals in terms of changes due to damage (preferably linear changes);
-
the SOM was characterized by the ability to recognize patterns with a small amount of data. For the SOM, you do not have to choose the ‘ideal’ symptoms, because the individual categories will be classified anyway, while the input signals should not be associated with each other (correlations << −1);
-
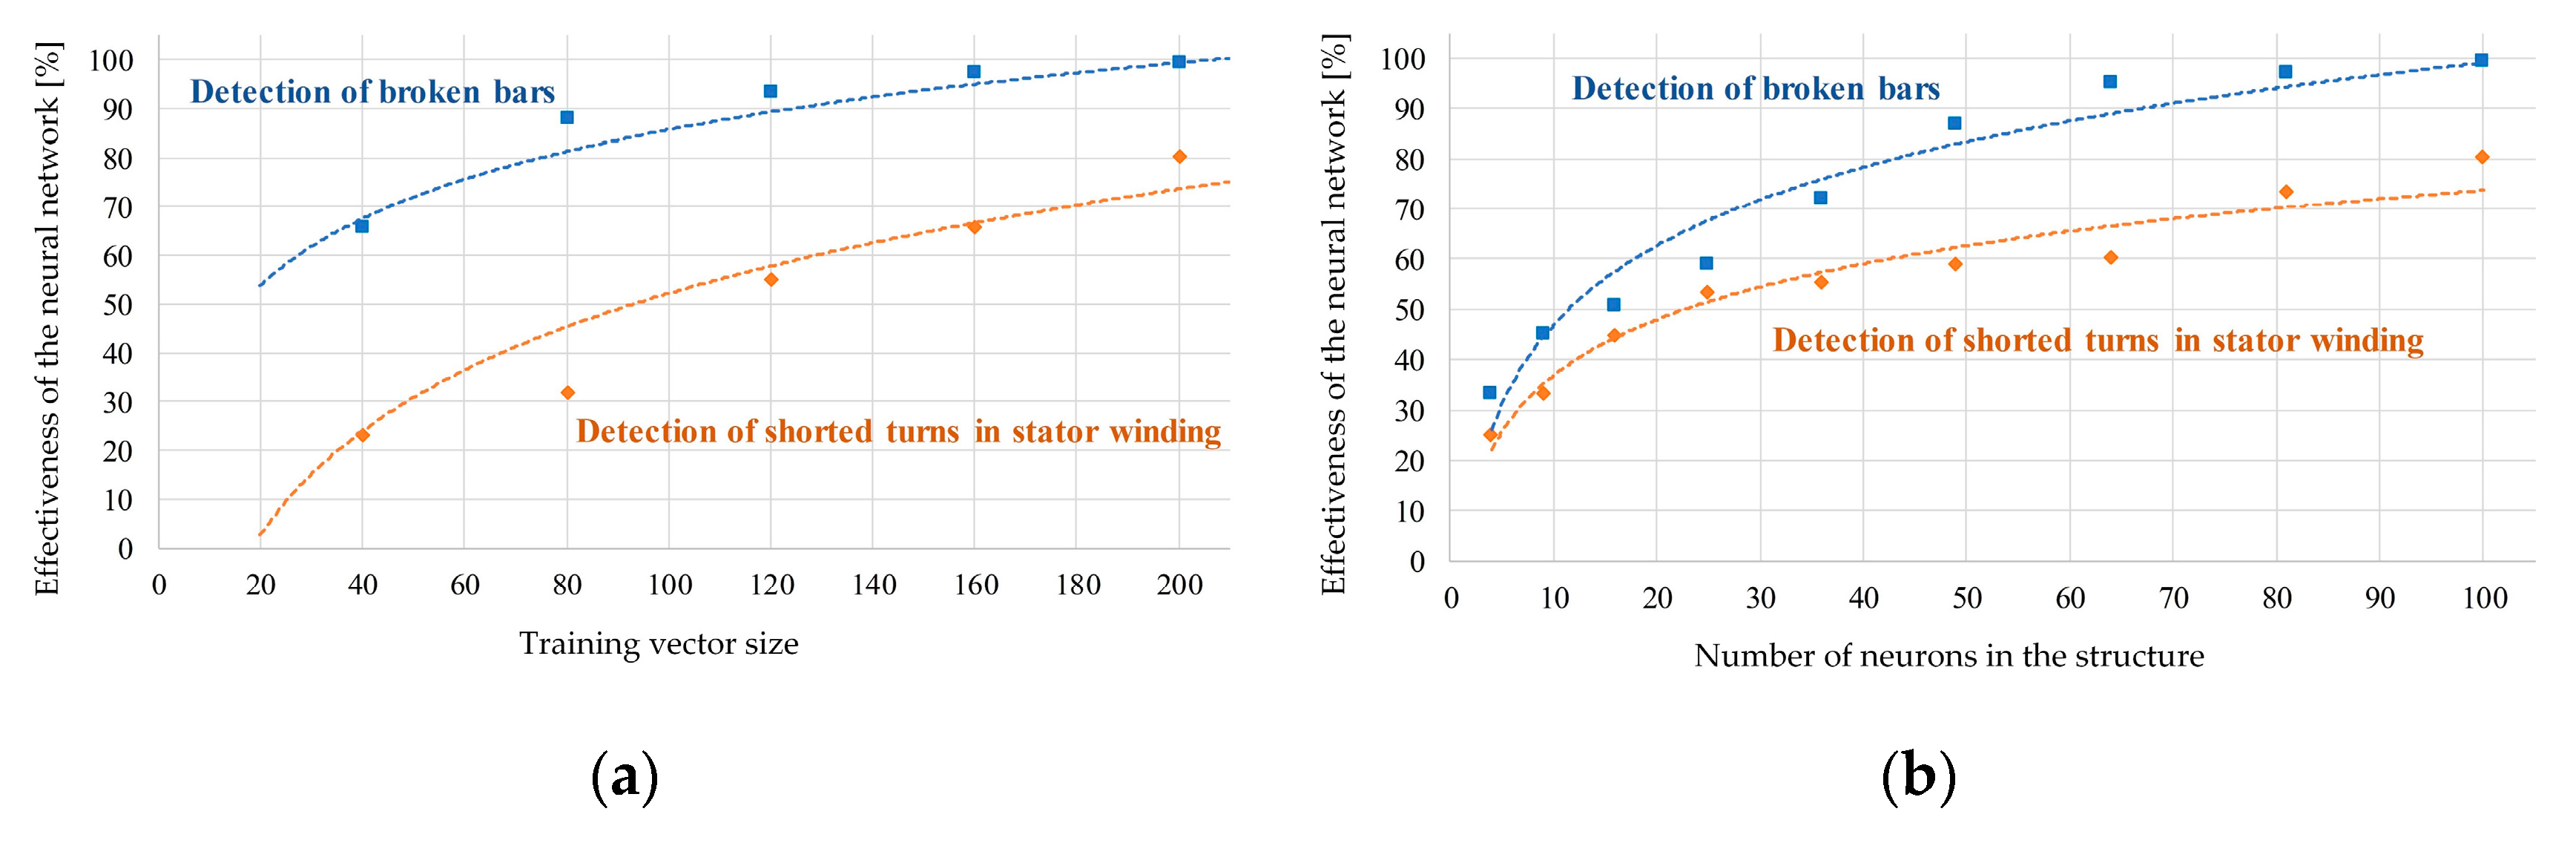
in the case of RHN, a large size of the input vector with information resistant to interference is required.
The differences between structures result in the amount of training data necessary to ensure an adequate level of effectiveness:
-
in the case of MLP, the largest database of training patterns was required due to mixed damage tested;
-
in the case of SOM it was important that each category had a similar number of learning data;
-
RHN reached about 100% effectiveness for 200 training samples, therefore there was no need to enlarge the database.
It should be noted that the SOM had the task of classifying five damage categories (5 × 25 samples) while the MLP was dealing with 11 for the stator, four for the rotor and mixed faults.

5. Conclusions

The conducted tests have demonstrated the effectiveness of the use of different neural network structures in the detection process of induction motor faults. Analyzing the spectrum of the axial flux allows obtaining sufficient information to develop neural detectors based on different NN kinds. Among the NN structures presented in the paper, the most effective is the feedforward MLP, including not only the distinguishing between damaged/undamaged state of the motor, but also the determination of the most fault levels of the stator or rotor winding. During the experimental tests, correct assessment of the degree of failure occurred in over 90% of cases. However, the MLP is not effective for the detection of rotor bar faults when load torque value is very low. Moreover, in order to detect both types of damages (stator and rotor) using one network, it is necessary to use a MLP with two hidden layers, which significantly increases the MLP learning time, which is the basic disadvantage of these networks.
The application of the Kohonen classifier in the diagnostic process allows for the preliminary assessment of the damage category of the tested machine. However, with the use of the SOM it is difficult to assess the fault degree in the case of a single failures, especially for stator winding faults (the boundaries of the SOM’s zones are not always unambiguous) and to assess mixed damages. The advantage of the developed Kohonen networks is the speed of the detection process, as well as a small number of learning data necessary to achieve the assumed effectiveness.
Among the solutions of neural detectors presented in this article, the recurrent Hopfield network was characterized by the worst properties. Despite the high level of effectiveness, the Hopfield network shows no robustness to measurement disturbances and variable parameters of the tested object. Small deviations of the measurements from the base values may cause false information of the diagnostic process. However, this network type can be applied in some hybrid solutions, in combination e.g., with SOM, which will be the further research subject of the authors.

Author Contributions

All the authors contributed equally to the concept of the paper, and proposed the methodology, M.S. and M.W. carried out the measurements and analysed the experimental data, M.S. designed and implemented the NN-based detectors, M.S. and T.O.-K. Proposed the paper organization, prepared the original draft, C.T.K. validated the obtained results, T.O.-K. Supervised the project, revised and edited the final paper.

Funding

This research was partly supported by the National Science Centre Poland under grant number 2017/27/B/ST7/00816 and by statutory funds of the Faculty of Electrical Engineering of the Wroclaw University of Science and Technology (2018–2019).

Conflicts of Interest

The authors declare no conflict of interest.

References

  1. Stone, G.C.; Boulter, E.A.; Culbert, I.; Dhirani, H. Electrical insulation for rotating machines. IEEE Press Ser. Power Eng. 2004, 21, 672. [Google Scholar]
  2. Filippetti, F.; Bellini, A.; Capolino, G. Condition monitoring and diagnosis of rotor faults in induction machines: State of art and future perspectives. In Proceedings of the 2013 IEEE Workshop on Electrical Machines Design, Control and Diagnosis, Paris, France, 11–12 March 2013. [Google Scholar]
  3. Jung, J.; Lee, J.; Kwon, B. Online Diagnosis of Induction Motors Using MCSA. IEEE Trans. Ind. Electron. 2006, 53, 1842–1852. [Google Scholar] [CrossRef]
  4. Cruz, S.M.A.; Cardoso, A.J.M. Stator winding fault diagnosis in three-phase synchronous and asynchronous motors, by the extended Park’s vector approach. IEEE Trans. Ind. Appl. 2001, 37, 1227–1233. [Google Scholar] [CrossRef]
  5. Riera-Guasp, M.; Antonino-Daviu, J.A.; Pineda-Sanchez, M.; Puche-Panadero, R.; Perez-Cruz, J. A General Approach for the Transient Detection of Slip-Dependent Fault Components Based on the Discrete Wavelet Transform. IEEE Trans. Ind. Electron. 2008, 55, 4167–4180. [Google Scholar] [CrossRef]
  6. Boukra, T.; Lebaroud, A.; Clerc, G. Statistical and Neural-Network Approaches for the Classification of Induction Machine Faults Using the Ambiguity Plane Representation. IEEE Trans. Ind. Electron. 2013, 60, 4034–4042. [Google Scholar] [CrossRef]
  7. Ghate, V.N.; Dudul, S.V. Optimal MLP neural network classifier for fault detection of three phase induction motor. Expert Syst. Appl. 2010, 37, 3468–3481. [Google Scholar] [CrossRef]
  8. Gardel, P.; Morinigo-Sotelo, D.; Duque-Perez, O.; Perez-Alonso, M.; Garcia-Escudero, L.A. Neural network broken bar detection using time domain and current spectrum data. In Proceedings of the 2012 20th International Conference on Electrical Machines, Marseille, France, 2–5 September 2012; pp. 2492–2497. [Google Scholar]
  9. Zolfaghari, S.; Noor, S.B.M.; Rezazadeh Mehrjou, M.; Marhaban, M.H.; Mariun, N. Broken Rotor Bar Fault Detection and Classification Using Wavelet Packet Signature Analysis Based on Fourier Transform and Multi-Layer Perceptron Neural Network. Appl. Sci. 2018, 8, 25. [Google Scholar] [CrossRef]
  10. Soualhi, A.; Clerc, G.; Razik, H. Detection and Diagnosis of Faults in Induction Motor Using an Improved Artificial Ant Clustering Technique. IEEE Trans. Ind. Electron. 2013, 60, 4053–4062. [Google Scholar] [CrossRef]
  11. Hamdani, S.; Mezerreg, H.; Boutikar, B.; Lahcene, N.; Touhami, O.; Ibtiouen, R. Rotor fault diagnosis in a Squirrel-Cage Induction Machine using support vector. In Proceedings of the 2012 20th International Conference on Electrical Machines, Marseille, France, 2–5 September 2012; pp. 1817–1822. [Google Scholar]
  12. Zhao, X.; Tang, X.; Zhao, J.; Zhang, Y. Fault Diagnosis of Asynchronous Induction Motor Based on BP Neural Network. In Proceedings of the 2010 International Conference on Measuring Technology and Mechatronics Automation, Changsha, China, 13–14 March 2010; pp. 236–239. [Google Scholar]
  13. Gui-li, Y.; Shi-wei, Q.; Mi, G. Motor fault diagnosis of RBF neural network based on immune genetic algorithm. In Proceedings of the 25th Chinese Control and Decision Conference (CCDC), Guiyang, China, 25–27 May 2013; pp. 1060–1065. [Google Scholar]
  14. Ewert, P. Use of axial flux in the detection of electrical faults in induction motors. In Proceedings of the International Symposium on Electrical Machines (SME), Naleczow, Poland, 18–21 June 2017; pp. 1–6. [Google Scholar]
  15. Wolkiewicz, M.; Skowron, M.; Kowalski, C.T. Electrical Fault Diagnostic System Based on the Kohonen Neural Network Classifier. In Proceedings of the 2018 International Symposium on Electrical Machines (SME), Andrychow, Poland, 10–13 June 2018; pp. 1–5. [Google Scholar]
  16. Kumar, P.S.; Xie, L.; Halick, M.S.M.; Vaiyapuri, V. Online stator end winding thermography using infrared sensor array. In Proceedings of the 2018 IEEE Applied Power Electronics Conference and Exposition (APEC), San Antonio, TX, USA, 4–8 March 2018; pp. 2454–2459. [Google Scholar]
  17. Maraaba, L.; Al-Hamouz, Z.; Abido, M. An Efficient Stator Inter-Turn Fault Diagnosis Tool for Induction Motors. Energies 2018, 11, 653. [Google Scholar] [CrossRef]
  18. Wolkiewicz, M.; Tarchała, G.; Orłowska-Kowalska, T.; Kowalski, C.T. Online Stator Interturn Short Circuits Monitoring in the DFOC Induction-Motor Drive. IEEE Trans. Ind. Electron. 2016, 63, 2517–2528. [Google Scholar] [CrossRef]
  19. Martins, J.F.; Pires, V.F.; Pires, A.J. PCA-Based On-Line Diagnosis of Induction Motor Stator Fault Feed by PWM Inverter. In Proceedings of the 2006 IEEE International Symposium on Industrial Electronics (ISIE), Montreal, QC, Canada, 9–13 July 2006; pp. 2401–2405. [Google Scholar]
  20. Skowron, M.; Wolkiewicz, M.; Orlowska-Kowalska, T.; Kowalski, C.T. Application of Self-Organizing Neural Networks to Electrical Fault Classification in Induction Motors. Appl. Sci. 2019, 9, 616. [Google Scholar] [CrossRef]
  21. Briz, F.; Degner, M.W.; Garcia, P.; Bragado, D. Broken Rotor Bar Detection in Line-Fed Induction Machines Using Complex Wavelet Analysis of Startup Transients. IEEE Trans. Ind. Appl. 2008, 44, 760–768. [Google Scholar] [CrossRef]
  22. Karvelis, P.; Tsoumas, I.P.; Georgoulas, G.; Stylios, C.D.; Antonino-Daviu, J.A.; Climente-Alarcón, V. An intelligent icons approach for rotor bar fault detection. In Proceedings of the IECON 2013–39th Annual Conference of the IEEE Industrial Electronics Society, Vienna, Austria, 10–13 November 2013; pp. 5526–5531. [Google Scholar]
  23. Puche-Panadero, R.; Pineda-Sanchez, M.; Riera-Guasp, M.; Roger-Folch, J.; Hurtado-Perez, E.; Perez-Cruz, J. Improved Resolution of the MCSA Method Via Hilbert Transform, Enabling the Diagnosis of Rotor Asymmetries at Very Low Slip. IEEE Trans. Energy Convers. 2009, 24, 52–59. [Google Scholar] [CrossRef]
  24. Antonino-Daviu, J.; Aviyente, S.; Strangas, E.G.; Riera-Guasp, M.; Roger-Folch, J.; Pérez, R.B. An EMD-based invariant feature extraction algorithm for rotor bar condition monitoring. In Proceedings of the 8th IEEE Symposium on Diagnostics for Electrical Machines, Power Electronics & Drives 2011, Bologna, Italy, 5–8 September 2011; pp. 669–675. [Google Scholar]
  25. Henao, H.; Demian, C.; Capolino, G.A. A frequency-domain detection of stator winding faults in induction machines using an external flux sensor. IEEE Trans. Ind. Electron. 2003, 39, 1272–1279. [Google Scholar] [CrossRef]
  26. Henao, H.; Capolino, A.G.; Fernandez-Cabanas, M.; Filippetti, F.; Bruzzese, C.; Strangas, E.; Hedayati-Kia, S. Trends in Fault Diagnosis for Electrical Machines: A Review of Diagnostic Techniques. IEEE Ind. Electron. Mag. 2014, 8, 31–42. [Google Scholar] [CrossRef]
  27. Ceban, A.; Pusca, R.; Romary, R. Study of Rotor Faults in Induction Motors Using External Magnetic Field Analysis. IEEE Trans. Ind. Electron. 2012, 59, 2082–2093. [Google Scholar] [CrossRef]
  28. Ramirez-Nunez, J.A.; Antonino-Daviu, J.; Climente-Alarcón, V.; Quijano-López, A.; Razik, H.; Osornio-Rios, R.A.; Romero-Troncoso, R.J. Evaluation of the Detectability of Electromechanical Faults in Induction Motors via Transient Analysis of the Stray Flux. IEEE Trans. Ind. Appl. 2018, 54, 4324–4332. [Google Scholar] [CrossRef]
  29. Hamdani, S.; Touhami, O.; Ibtiouen, R.; Fadel, M. Neural network technique for induction motor rotor faults classification-dynamic eccentricity and broken bar faults. In Proceedings of the 8th IEEE Symposium on Diagnostics for Electrical Machines, Power Electronics & Drives, Bologna, Italy, 5–8 September 2011; pp. 626–631. [Google Scholar]
  30. Kowalski, C.T.; Orlowska-Kowalska, T. Neural networks application for induction motor faults diagnosis. Math. Comput. Simul. 2003, 63, 435–448. [Google Scholar] [CrossRef]
  31. Chow, M.Y.; Yee, S.O. Methodology for on-line incipient fault detection in single-phase squirrel-cage induction motors using artificial neural networks. IEEE Trans. Energy Convers. 1991, 6, 536–545. [Google Scholar] [CrossRef]
  32. He, Q.; Du, D. Fault Diagnosis of Induction Motor using Neural Networks. In Proceedings of the 2007 International Conference on Machine Learning and Cybernetics, Hong Kong, China, 19–22 August 2007; pp. 1090–1095. [Google Scholar]
  33. Taïbi, Z.M.; Hasni, M.; Hamdani, S.; Rahmani, O.; Touhami, O.; Ibtiouen, R. Optimization of the feedforward neural network for rotor cage fault diagnosis in three-phase induction motors. In Proceedings of the 2011 IEEE International Electric Machines & Drives Conference (IEMDC), Niagara Falls, ON, Canada, 15–18 May 2011; pp. 194–199. [Google Scholar]
  34. Toma, S.; Capocchi, L.; Capolino, G. Wound-Rotor Induction Generator Inter-Turn Short-Circuits Diagnosis Using a New Digital Neural Network. IEEE Trans. Ind. Electron. 2013, 60, 4043–4052. [Google Scholar] [CrossRef]
  35. Khalfaoui, N.; Salhi, M.S.; Amiri, H. The SOM tool in mechanical fault detection over an electric asynchronous drive. In Proceedings of the 2016 4th International Conference on Control Engineering & Information Technology (CEIT), Hammamet, Tunisia, 16–18 December 2016; pp. 1–6. [Google Scholar]
  36. Sid, O.; Menaa, M.; Hamdani, S.; Touhami, O.; Ibtiouen, R. Self-organizing map approach for classification of electricals rotor faults in induction motors. In Proceedings of the 2011 2nd International Conference on Electric Power and Energy Conversion Systems (EPECS), Sharjah, United Arab Emirates, 15–17 November 2011; pp. 1–6. [Google Scholar]
  37. Kato, T.; Inoue, K.; Takahashi, T.; Kono, Y. Automatic Fault Diagnosis Method of Electrical Machinery and Apparatus by Using Kohonen’s Self-Organizing Map. In Proceedings of the 2007 Power Conversion Conference, Nagoya, Japan, 2–5 April 2007; pp. 1224–1229. [Google Scholar]
  38. Coelho, D.N.; Barreto, G.A.; Medeiros, C.M.S. Detection of short circuit faults in 3-phase converter-fed induction motors using kernel SOMs. In Proceedings of the 2017 12th International Workshop on Self-Organizing Maps and Learning Vector Quantization, Clustering and Data Visualization (WSOM), Nancy, France, 28–30 June 2017; pp. 1–7. [Google Scholar]
  39. Li, P.; Chai, Y.; Cen, M.; Qiu, Y.; Zhang, K. Multiple fault diagnosis of analog circuit using quantum Hopfield neural network. In Proceedings of the 2013 25th Chinese Control and Decision Conference (CCDC), Guiyang, China, 25–27 May 2013; pp. 4238–4243. [Google Scholar]
  40. Srinivasan, A.; Batur, C. Hopfield/ART-1 neural network-based fault detection and isolation. IEEE Trans. Neural Netw. 1994, 5, 890–899. [Google Scholar] [CrossRef]
  41. Hong, R.; Meizhu, L.; Mingfu, F. Equipment Diagnosis Method Based on Hopfield-BP Neural Networks. In Proceedings of the 2008 International Conference on Advanced Computer Theory and Engineering, Phuket, Thailand, 20–22 December 2008; pp. 170–173. [Google Scholar]
  42. Freeman, J.A.; Skapura, D.M. Neural Networks Algorithms. Applications and Programming Techniques. 1992. Available online: https://pdfs.semanticscholar.org/3847/897e4a15d1078499466087ea7885061c6465.pdf (accessed on 10 June 2019).
  43. Demuth, H.; Beale, M. Neural Network Toolbox User’s Guide ver.4. CiteSeerX 2000. Available online: http://citeseerx.ist.psu.edu/viewdoc/download?doi=10.1.1.220.1640&rep=rep1&type=pdf (accessed on 10 June 2019).
Figure 1. External stray (axial) flux in a squirrel-cage induction motor and a method of placement of an axial flux measuring coil.
Energies 12 02392 g001
Figure 2. Illustration of the IM damage detection process using axial flux measurement and different NN structures.
Energies 12 02392 g002
Figure 3. Structure of the feedforward MLP network (two-layer in this example).
Energies 12 02392 g003
Figure 4. Structure of the self-organizing Kohonen map—SOM.
Energies 12 02392 g004
Figure 5. Structure of the Recurrent Hopfield Network—RHN.
Energies 12 02392 g005
Figure 6. Real view of the experimental set-up.
Energies 12 02392 g006
Figure 7. FFT analysis of the axial flux for the nominal load torque and fs = 50 Hz: (a) stator winding fault; (b) broken rotor bars.
Energies 12 02392 g007aEnergies 12 02392 g007b
Figure 8. The influence of the MLP structure and number of teaching epochs on the fault detection efficiency: (a) structure {3-15-12-2}; (b) structure {3-12-8-2}; (c) structure {3-10-6-2}; (d) structure {3-8-4-2}.
Energies 12 02392 g008aEnergies 12 02392 g008b
Figure 9. The results of experimental tests: (a) detection of rotor damage; (b) detection of stator damage; (c) detection of mixed faults.
Energies 12 02392 g009
Figure 10. Influence of the number of training epochs and the learning rate to the SOM neighborhood distances: (a) 800 training epochs, η = 0.1; (b) 300 training epochs, η = 0.7; (c) 800 training epochs, η = 0.7.
Energies 12 02392 g010
Figure 11. Classification of the rotor cage damage of the induction motor: (a) Kohonen map (20 × 20): solid lines—IM damage categories involved in the classification, hatched areas—IM damage categories not involved in the classification; (b) specification of test data parameters; TL—load torque, TLN—rated motor torque, fs—frequency of the supply voltage.
Energies 12 02392 g011
Figure 12. Classification of the stator windings faults: (a) Kohonen map (20 × 20): solid lines—IM damage categories involved in the classification, hatched areas—IM damage categories not involved in the classification; (b) specification of test data parameters; TL—load torque, TLN—rated motor torque, fs—frequency of the supply voltage, Nsh—number of shorted turns in the stator winding.
Energies 12 02392 g012
Figure 13. RHN response to a given learning data vector.
Energies 12 02392 g013
Figure 14. Analysis of the effectiveness of the RHN based fault detector: (a) the influence of the base vector size; (b) the influence of the number of neurons.
Energies 12 02392 g014
Table 1. Rated parameters of the tested induction motor.
Name of the ParameterSymbolUnits
PowerPN1500[W]
TorqueTN10.16[Nm]
SpeednN1410[r/min]
Stator phase voltageUsN230[V]
Stator currentIsN3.5[A]
FrequencyfsN50[Hz]
Pole pairs numberpp2[-]
Number of rotor bars Nrb26[-]
Number of stator turns in each phaseNst312[-]
Table 2. Effectiveness of Kohonen network in fault detection and classification.
Shorted TurnsBroken BarsNo Fault
Kohonen map (20 × 20)Approximate effectiveness of faults detection93%95%95%
Approximate effectiveness of fault level classification70%93%95%
Kohonen map (10 × 10)Approximate effectiveness of faults detection90%92%95%
Approximate effectiveness of fault level classification65%88%95%
Table 3. Comparison of the used neural network structures.
Evaluation CategoriesMultilayer Perceptron NetworkSelf-organizing Kohonen MapRecurrent Hopfield Network
EXPERIMENTAL VERIFICATIONThe effectiveness of early detection of electrical damagesHIGHMEDIUMLOW
The effectiveness of the stator damages level assessmentHIGHMEDIUMMEDIUM
The effectiveness of the rotor damages level assessmentHIGHHIGHMEDIUM
The effectiveness of the mixed damages level assessmentHIGHLOWLOW
Resistance to interference of the diagnostic signalMEDIUMHIGHLOW
Hardware implementationsEASYEASYDIFFICULT
Interpretation of the neural network responseEASYDIFFICULTEASY
LEARNING PROCESSRequired size of the learning vectorLARGESMALLLARGE
Selection of the components of input vectorDIFFICULTEASYDIFFICULT
Selection of the neural network structureHARDEASYEASY
Selection of the neural network learning parametersHARDEASYEASY
Learning process timeLONGMEDIUMSHORT

