Article

Consumers’ Attitudes to Support Green Energy: A Case Study in Shanghai

1
Department of Mechanical Engineering, Aalto University, 02150 Espoo, Finland
2
Department of Civil and Structural Engineering, The University of Sheffield, Sheffield S1 3JD, UK
3
Department of Built Environment, Aalto University, 02150 Espoo, Finland
4
Key Laboratory of Efficient Utilization of Low and Medium Grade Energy (Tianjin University), Ministry of Education of China, Tianjin 300350, China
*
Author to whom correspondence should be addressed.
Energies 2019, 12(12), 2379; https://doi.org/10.3390/en12122379
Submission received: 28 April 2019 / Revised: 13 June 2019 / Accepted: 14 June 2019 / Published: 20 June 2019
(This article belongs to the Section B: Energy and Environment)

Abstract

:
Residents’ willingness to use green energy products is a major concern for different stakeholders and policymakers due to the reformed Chinese electricity market since 2015. This study focused on the Chinese consumer’s willingness to opt and pay for environmentally-friendly electricity sources in Shanghai’s residential sector. A questionnaire survey was used to find out the influence of gender, age, education, awareness and income level on consumers’ attitudes to alter their energy sources to green ones. The results indicated that income level and awareness are significant barriers in the usage of green energy products. Increasing the respondent’s awareness about the issues of non-green energy products convinced 97% of them to change their electricity sources completely or partly, in line with their monthly income. This clearly shows that clarifying the benefits of green energy products is a key tool to achieve a green environment in China.

1. Introduction

1.1. Literature Review

As global issues, such as climate change [1], restriction of energy sources and environmental impacts are affecting human life; conducting research on these is becoming increasingly topical. Sustainable development can help to alleviate these issues under consideration. However, sustainability is challenged by increasing energy consumption and environmental sustainability can never be achieved without clean energy sources, that is, sources of renewable electricity. That’s why policymakers and regulators are nowadays attempting to increase the use of renewable energy. For example, REN21 [2] is the global renewable energy policy multi-stakeholder network to promote renewable energy consumptions by providing a communication platform to exchange knowledge and awareness, policy development and joint action towards a rapid global transition to use renewable energy. European countries have a range of collective and individual targets under different policy processes. According to the Kyoto Protocol, 34 European countries (called EEA: European Economic Area), must achieve legally binding greenhouse gas emissions (GHG) limitation and emission reduction targets for the first and second commitment periods, 2008 to 2012 and 2013 to 2020, respectively. Reducing energy consumption, improving energy efficiency and increasing consumption of renewable energy sources are the main visions to achieve these aims [3]. Apart from global and regional policies regarding renewable energy, it is important to increase individuals’ awareness regarding energy usage and its impacts/sources. As Hast et al. [4] stated customers can choose their electricity supplier according to their preferences in the Western countries while in countries such as China, they cannot usually contribute to this.
China, as the largest energy consumer in the world, is facing pressure from environmental impacts including Global Warming (GW) and Air Pollution (AP) and thus is moving towards sustainable development [5,6]. Liu et al. [7] examined the rural social acceptance of renewable energy deployment in the east of China (the case study is the Shandong region) via a questionnaire survey. They showed that rural residents are generally supportive of renewable energy development. Shanghai region, as the fastest-growing and the most populated city in China [8], plays a significant role in these impacts. Also, Dhakal presented that carbon emissions had increased by five times from 1985 to 2006 [9] in Shanghai and nowadays, it is ranked as one of the highest CO2 emission cities in China [10].
Zhao et al. [11] evaluated the effects of renewable electricity policies on renewable electricity generation by studying data from 122 countries between 1980 and 2010. They found that renewable electricity policies play an important role in promoting renewable electricity generation. They emphasized that only investment incentives and Feed-In Tariff (FIT) are effective in developing and promoting all types of renewable energy sources for the generation of green/clean energy. Various schemes, such as FIT policy are being used in different countries to support green energy usage. For instance, Zsiborács et al. [12] examined the feasibility of using five different photovoltaic (PV) modules configurations under FIT regulations in Hungary. According to their results, the payback periods in all the studied economic-technical cases were below 10 years. Also, FIT policy of renewable energies has been implemented in China since 2005. With the development of renewable energy in China, as an important factor, FIT is also constantly developing and improving [13].
In some countries to promote the use of green energy, demand for green electricity needs to be increased before increasing the number of sources for electricity supply [14,15,16]. Sun et al. [17] and Gliedt and Hoicka [18] studied the existing barriers to green energy in China and they suggested some policies to tackle them: suitable laws and appropriate systems, strong manufacturing support, raising public awareness and reducing these barriers in order to enhance consumers’ Willingness To Pay (WTP) for green energy. Bird et al. [19] reviewed the marketing of green energy, electricity produced from renewable energy sources, in several countries (e.g., Australia, Canada, Japan, Finland, Germany, Sweden) to estimate the consumer demand of electricity generation from renewable energy sources. They explained some key topics and findings of their review: that is, (1) customer education, (2) price of energy, (3) impact of green energy marketing, (4) certification and labelling and (5) government support, among other things.
In the recent years a significant amount of research has been devoted the WTP for green electricity in different places [14,20,21,22,23,24,25,26,27]. Hast et al. [4] analysed the questionnaire’s answers from the Shanghai region in China by the generalized linear regression model. They found that the WTP is influenced by income, building type, accessibility of renewable energy sources and possibility to choose the water heating and cooling systems.
With the increasing pressure of ecological issues and environmental deterioration in China, consumers and environmental policymakers have increasingly concerned about individuals’ responsibility for environmental issues over the past few decades [28]. Therefore, the government is providing education about sustainability to promote social consensus. The government has also started to implement some sustainable policies for consumers to make environmentally friendly decisions, such as the national unified certificate label of green products [29]. In addition, many universities in China, such as North China Electric Power University and Huazhong University of Science and Technology have set up a school of clean and renewable energy and set up the related university courses, to raise awareness subjective knowledge through education [30]. However, due to the government hierarchy system (top-down governance), public participation in environmental protection has not been fully developed [31]. Accordingly, increasing the citizens’ awareness of renewable energy sources and systems is significantly demanded [32].
The structure of the electricity market in China has changed since the middle of 2015. The last structure from 2002 to 2015 consisted of three parts, including power generation, grid company (power transmission, power distribution and power sale) and the consumer. The new structure consists of four parts, including power generation, grid company (power transmission and power distribution), retail company and the consumer. Furthermore, the WTP for green energy by consumers, who are the main stakeholders, should be increased in order to balance between social awareness, acceptance of such energy sources and economic justification. The high WTP of green energy regarding coming electricity market changes requires a competitive and active demand side; thus, the WTP is a necessary topic to be studied.
According to China’s new electricity market plan, the assessment of the residents’ WTP of Green Energy Product (GEP), electricity or heating generated by renewable energy sources and systems and its barriers have not been studied before. In line with literature reviews and energy consumption targets for 2020 and 2050 in China and the world, the questionnaire was defined by several questions in different categories and shared in Shanghai region to clarify what the WTP for the GEPs is, how it can be enhanced and show the factors that are affecting different people’s willingness to buy, wholly or partly, the GEPs.

1.2. China’s Electricity Market Strategies

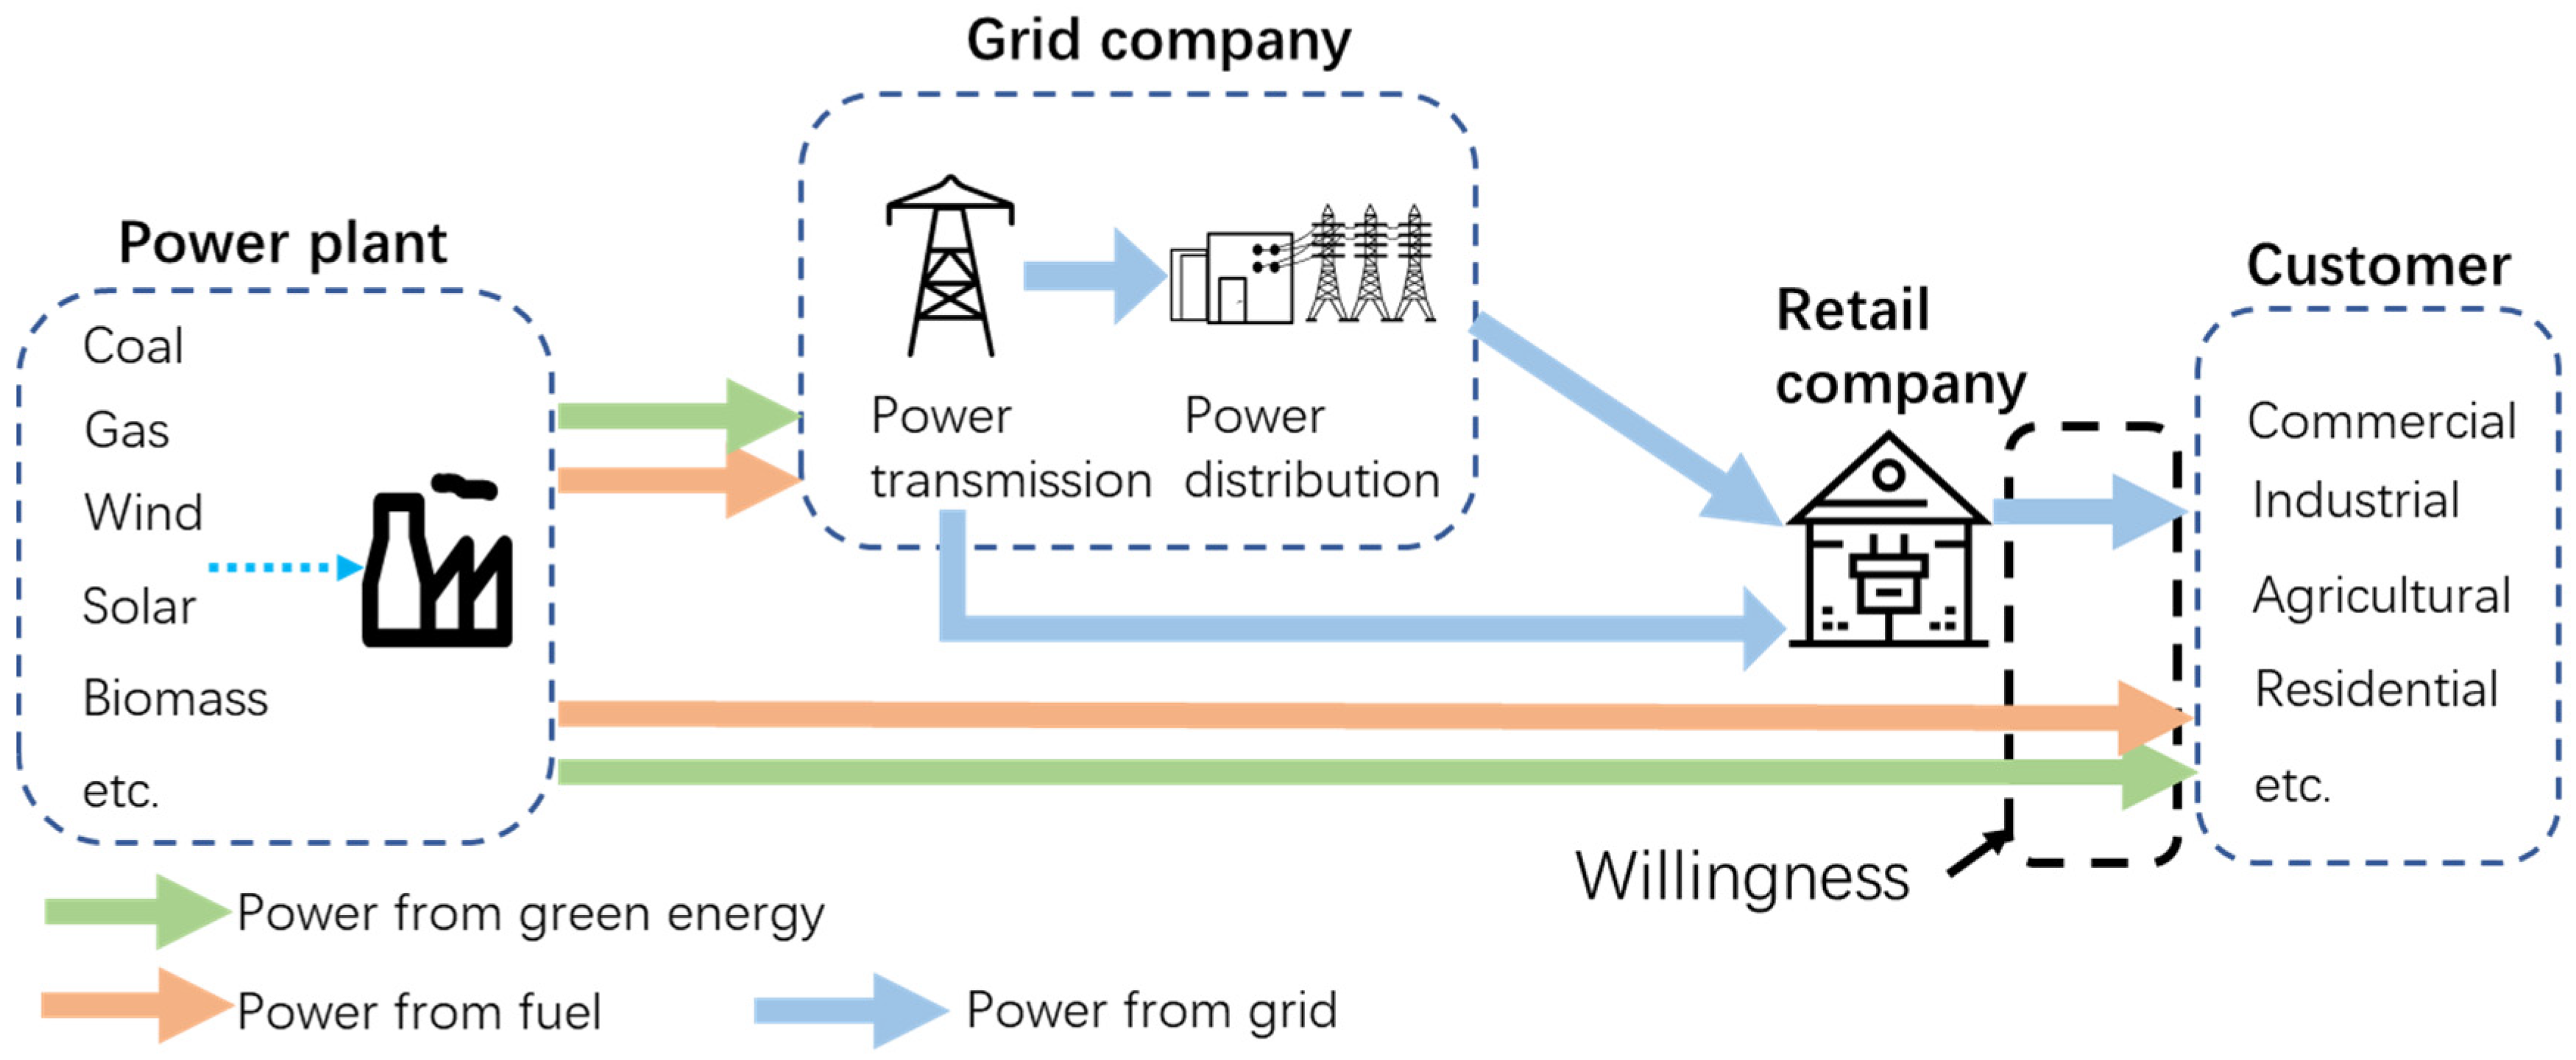
Various countries around the world, including China, are reforming their electricity market to achieve sustainable development. Experience shows that those market reforms characterized by FIT-based competitive biddings and the open-access of transmission grids have become mainstream practices of reformation and development efforts. Since issuing the “Electricity Power System Reform Program” by the State Council of the People’s Republic of China in 2002, China had been undergoing the power system reform for 13 years. Until 2015, China’s power industry had realized a separation of power plants from the electric grids with FIT-based competitive bidding [33]. Figure 1 depicts a simplified diagram in China’s electricity market and shows that customers had only one alternative to purchase electricity and the electricity price was dependent on layers of additional value and national pricing strategies for different end users.
In this case, the retail price of electricity was determined through a synergy scheme of the provincial and central government. The specific price was adjusted depending on the economical level, resource endowment, even season and so forth. The FIT from various power plants to the power grid was determined through competitive bidding. Although the power generation was open to the market, transmission, distribution and electricity market was still bundled together with a monopoly of electricity sale. Such obstacles still seriously restricted, including (a) the further development of the electric power industry was needed, (b) the planned market was still the major electricity trading mechanism, (c) the lack of marketization resulted in defective mechanisms of electricity prices with a confused increment of subsidy, tax and so forth., (d) the market could not play a decisive role in the deployment of power resources and (e) the development of green energy was significantly limited [35].
In order to solve these problems, in May 2013, the State Council approved a proposal entitled “The Guideline of Major Tasks to Deepen Economic Structure Reform in 2013.” In this document, “promotion of direct electricity purchase for big users” and “reform demonstration projects of electricity marketing” were first proposed [36]. These strategies broke the electric grid monopoly and allowed end users to access the electricity market. Furthermore, in March 2015, the central government issued an important reforming policy entitled “Some Suggestions for Further Deepening Power System Reform” [37]. The policy highlights the key problems involved in the existing electricity market, such as the deficiency of trading mechanisms and the mismatch between trading partners. The proposal clearly presents an orderly reform on electricity prices, an improvement to the marketization and a steady advancement of electricity sales reformation. The proposed reform seeks to establish a reasonable and effective power market system so that the market may play a decisive role in the deployment of power resources and may save more energy [38]. Since the middle of 2015, two important measures of policy adjustments in the reform are (1) active promotion of effective connections of power generation from green/renewable energy sources to grids; (2) separation of electricity sales from a distribution with a market-decision pricing mechanism, as shown in Figure 2. This Figure shows that after China’s power policy reform, customers have more choices to purchase electricity, even directly from power plants. They may choose to use the GEPs according to their personal willingness, as well. Because of these alternatives, this research has a more practical significance of how the consumers’ WTP to the GEPs may increase.
The opening of the electricity sales is widely considered as the biggest benefit of this reform. Along with its opening, social capital enters into the electricity sales market, thereby forming the competition. In which, electricity sales companies, as the main traders in the market, purchase electricity in bulk and in the long-term and spot markets from the generators. These companies, as retailers, then sell electricity to small and medium-sized end users. The core competitive advantages of electricity sale companies in the market are from power resource and customer resource. Therefore, it is quite important to understand the relationship between supplies from various power sources, especially the GEPs, to demands, such as the willingness of retail customers. This can be achieved only through a close relationship with users and identifying their expectations from companies to provide better quality services, enhance their competitive in the market and gain substantial profits. In addition, the users’ attitudes toward green energy and related technologies would play a crucial role in promoting the share of green energy in the total supply. Thus, a deep understanding of the user’s willingness toward the GEPs is necessary for both the electricity sales companies and policymakers. This is also the reason this paper was conducted.

2. Materials and Methods

Reflecting the available renewable energy sources in China and the energy consumption targets for 2020 and 2050 in China and the world, a questionnaire was designed with the aim to investigate Chinese consumers’ WTP for the GEPs. The questionnaire frame of [14] was used in this study and it was developed to answer these research aims. In order to achieve these research aims and in accordance with the potential of renewable energy sources in Shanghai province, the questionnaire, presented in the Appendix A, was consisted of different categories, including (1) background, (2) awareness, (3) attitudes, (4) technologies and resources, (5) barriers and behaviours. The questionnaire was responded through different Social Media, email and post from different genders, ages, educations, building types and income levels [39]. The questionnaire was mainly classified in four divisions: (1) responding to a few general open questions to find out respondents’ overviews of different energy sources, green energy products, willingness to change their system and so forth; (2) responding to the main questionnaire; (3) sharing some information and awareness regarding this subject with respondents; and (4) responding again to the previous open questions and some other questions. Overall, the number of valid filled questionnaires was 232 who mostly responded online. With one IP address or user account, the survey could be answered only once; thus, it can be assumed in the analysis that the observations were also independent of each other.
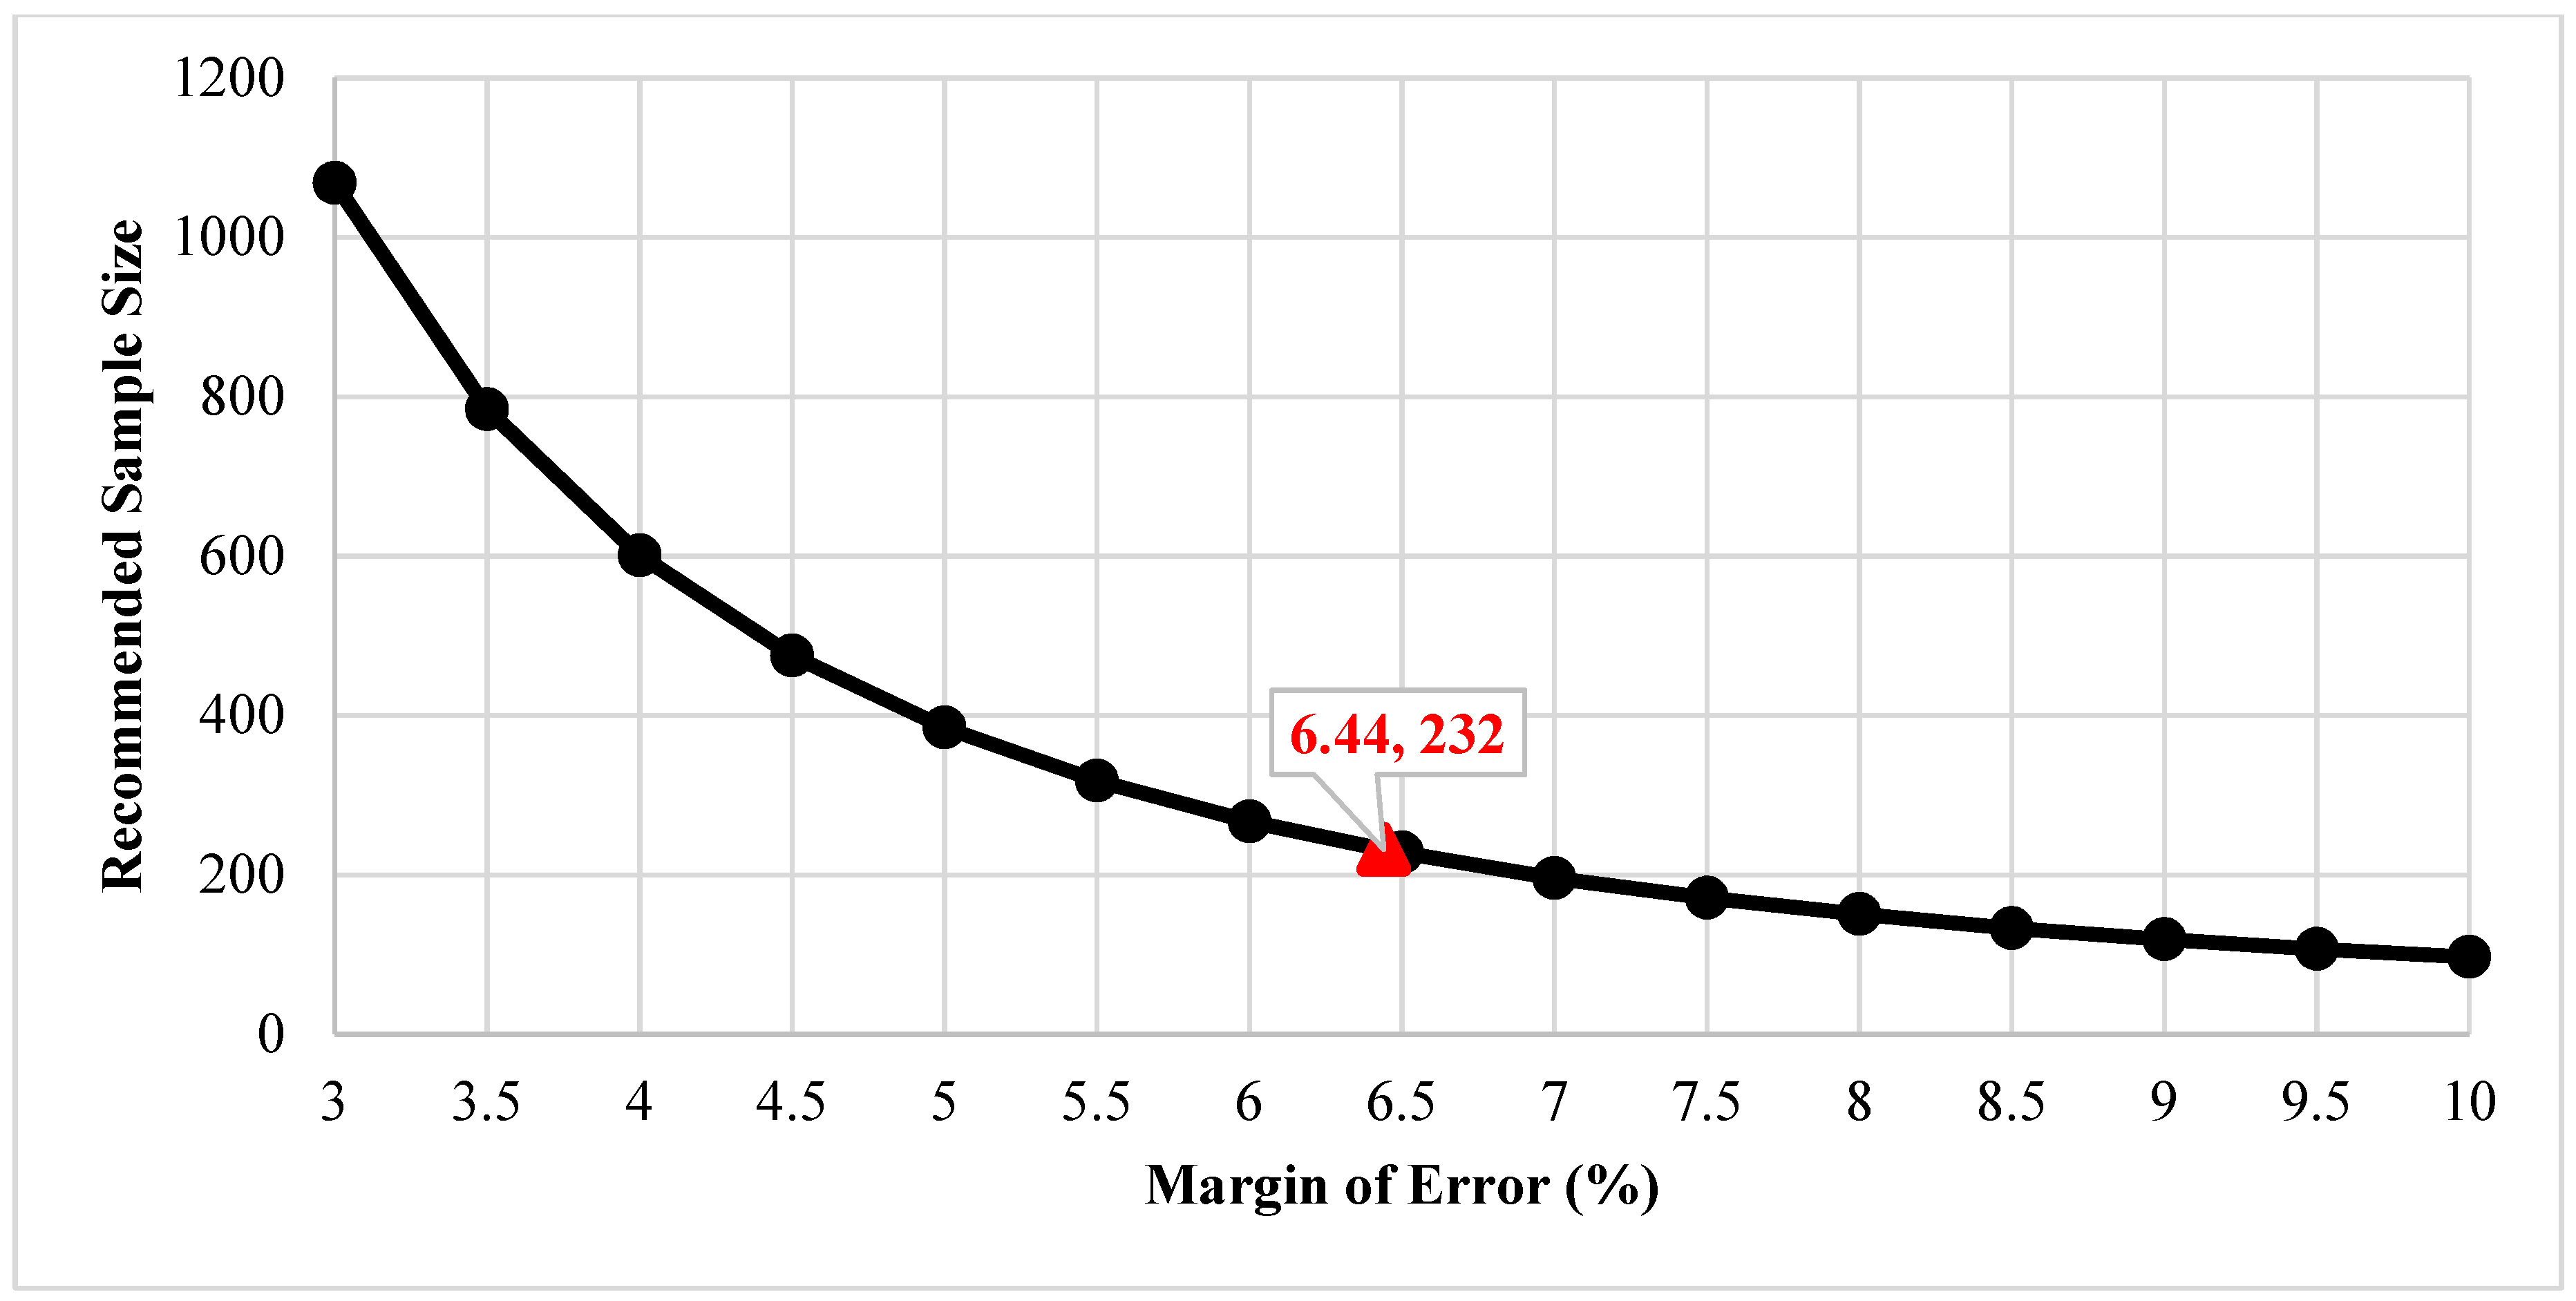
To be conservative and find a sample size that is statistically significant and large enough to yield more accurate results, this study followed the recommended sampling size guidance and methods in References [40,41]. Figure 3 shows the recommended sample sizes versus a different margin of errors [40,41]. The studied sample size of 232 with a 95% confidence level and 6.4% margin of error is statistically significant to approximately represent that population behaviour. The sample probably does not accurately represent the whole population and all residents but it may be proportionally allocated into each district of Shanghai region.
A number of topics of the GEPs have been assessed on the basis of the respondents’ input: for example, background, awareness, possibility of using the GEPs, possibility of developing it and the consumer’s WTP. Also, the government would intervene in the rural power market to achieve sustainable and low-carbon development because residents of rural areas have less willingness to purchase the GEPs due to their low income. Thus, the designed research method is feasible to the objective of study for the current status of China’s power market.

2.1. Background

To find out about the consumer’s role in the GEPs, background information on the consumer is needed. Each part of this information represents a piece in a puzzle to clarify the respondent’s awareness of the subject. To find out about the consumer’s considerations when buying or using various types of energy systems and sources, the background section collected related information. The respondent’s gender and age status were established first, as these may have considerable influence on their responses. This is followed by the respondent’s education level, which could indicate a potential awareness the respondent may have about the GEPs. Occupation (Occ) and income were considered as two important pieces of the respondent’s personality. In order to estimate the energy consumption of the respondent’s building, a number of family members, building type and population area (urban or rural) completed this personality puzzle. This information helped to analyse and understand the respondent’s experiences and the personalities involved.

2.2. Awareness

This part was aimed to discover the respondents’ awareness of the GEPs. The first step of the awareness evaluation sought information on their current electricity sources (e.g., thermal power, including coal, gas, hydropower and wind power). Then they were asked about their familiarity with the GEPs. The influences of labelling, certification and other parameters as challenges to green energy advantages were also questioned and assessed. The potential for green energy consumption in the surveyed region was pursued. The awareness part of the questionnaire tried to figure out the level of information possessed and enhance their basic knowledge and awareness of the GEPs by explaining the fundamental definition of each one.

2.3. Attitudes

In order to find out the respondent’s willingness or unwillingness to pay for the GEPs, the attitude part was developed. This part was designed to introduce the environmental impacts of electricity generated by fossil fuels and outline the advantages of green energy. To clarify the environmental impacts of electricity generated by fossil fuel, some well-known impacts (e.g., GW, AP, acid rain and GHG emissions) were pointed out; also, the awareness and attitude of the respondent were inquired about. Then, the environmental advantages of using the GEPs were described in the questionnaire, that is, no AP, no acid rain and no GHG emissions produced. This information was given to help the respondents to distinguish between the advantages and the disadvantages of electricity generated by fossil fuels and green energy sources, respectively. As a result, the respondent’s concern for the environment could be discovered.

2.4. Technology

With the growth of China’s economic development, its electricity demand is increasing. Moreover, China as the second biggest producer of pollution in the world plays an important role in the GW and AP. In addition, more than 70% of the electricity in the surveyed region is being generated by thermal, hydro and nuclear powers [42], which shows that the current generated electricity is not yet conducible to a green environment. In order to reduce GW, mitigate AP, protect from environmental pollution and enhance the quality of human life, the GEPs usage should be increased [43]. Thus, this part was aimed to enhance the respondent’s technical knowledge and awareness about the plans of renewable energy sources in China. Specifically, it included a short introduction to each technology, the current situation for renewable energy sources and the future plans for each technology presented in References [44,45,46]. To help the process, some available sources for green energy were presented. These included solar power, wind power, hydropower, tidal power and geothermal power, as recommended by Ming et al. [47] in accordance with renewable energy sources in this region.
Availability of energy resources is stated as the exploitable, proven and the readiness of technologies for exploitation reserves [48]. According to Wang et al. study [48] about China’s energy resources, the availability of green energy powers is higher than coal, petroleum, natural gas and nuclear powers, respectively, 130%, 230%, 240% and 210%. This information states that renewable energy sources have great potential to generate electricity in China. The potential of hydropower, wind power and solar power in Shanghai region were estimated [49,50] 2–10 GW, 2–10 GW and 2200–3000 h/year (sunshine duration). The convergence of this information in the respondent’s mind gave an idea about the likelihood of the use of renewable energy sources: for example, by 2050, China’s renewable energy use can reach 43% of the total energy demand [51].

2.4.1. Solar Energy

Solar energy available on the earth is just a minute segment of the energy of the sun, an ample source of clean and nearly free energy [52]. Direct electricity generation from solar energy is devoid of GHG emissions. Thus, such technology is considered as environmentally-friendly. In many parts of China, total annual solar radiation is higher than 1389 kWh/m2 and annual sunshine hours amount to more than 2000. Also, two-thirds of the area of China is rich in solar energy sources. Theoretically, potential sources add up to 1.7 trillion tons of coal equivalent each year [5,53].
1. Residential solar heating
Compared to other green energy technologies, solar heating is the most widely applied technology in the residential market in China due to the low cost. Such affordable GEP has already been easily accepted by China’s market since the end of the last century so that an average growth rate reaches 30% per year. Until 2013, the installed capacity in operation in China amounted to 262.3 GW, as reported [54]. Over 374 million m2 solar collectors have been operated in mainland China accounted for 70% of the global solar collector area. The mainstream usage of solar heating in China is water heater utilized for showering, washing and so forth. As the bottom price of the mature product is in a range of 1800–2500 Yuan, the solar water heater is easy to be accepted by both urban and rural residents. Although its heating supply is highly dependent on the unsteady solar radiation and even 100% from backup electric heater during the cloudy day, a low operation cost with a basic heating function is the main driving factor for the customer.
2. Residential photovoltaics
Until 2014, the capacity of solar PV modules in China was increased to 32.9 GW. The research efforts on various solar PV modules during the last decade led to remarkable progress in the efficiency improvement, for example, the test efficiency of single crystal Silicon cells has already been above 25%. Meanwhile, solar PV modules become a popular option for high-income customers in China for their villa buildings due to being cost effective. The main obstacles of the customer’s willingness were administrative approval of grid access and relatively high cost without a subsidy. In order to activate the trade market, some solutions were demonstrated in China, for example, state grid is now open to the residential PV project for a bi-directional connection. Moreover, some subsidy policies and suggestions were issued by China state council and Finance Ministry [55] in the past three years. As a response, the local government of China introduced a range of stimulus plans. Based on reference [56], Shanghai finance bureau offers a five-year incentive program to PV distribution energy system with a special subsidy to residential buildings. The subsidy, which is 0.4 Yuan per kWh, would dramatically shorten the payback time of the residential solar PV project to seven years.

2.4.2. Wind Power

Wind energy is recognized as one of the cleanest energy sources. Besides, it is one of the affordable renewable energy sources to produce electricity [57]. Wind energy is accessible in more than 75% of China and China Environmental Science Press made a theoretical estimation of electricity generated by wind power as being between 700–1200 GW [58]. Also, wind power density in Shanghai region is between 100–150 W/m2 (more than 50 W/m2 in the whole of China) [59,60].

2.4.3. Hydropower

Hydroelectricity is generated by hydropower and produces less CO2 emission and pollution during operation in comparison with fossil fuel sources [43]. In comparison with other renewable energy sources and traditional sources (e.g., fossil fuel), hydropower has some advantages, such as its wide availability, efficient energy conversion, low operation cost, long period of life, independence of water price and potential to improve the living conditions of surrounding areas [61,62]. In China, the rate of annual increase of installed hydropower appliances reached 11% from 2003 to 2009 [63]. Moreover, the total electricity generated by hydropower is planned to reach up to 270 GW in 2020 [63].

2.4.4. Tidal Power

Tidal energy is produced by surging waters during the rise and fall of tides on the sea or ocean. The kinetic energy of tides can then be converted into electricity. The operation principle is similar to that of hydroelectric power. Tidal power is considered as a clean, green and sustainable energy source [64]. More than 80% of China’s tidal energy sources are in Fujian and Zhejiang in the South China Sea, which is close to Shanghai [64]. China’s National Development and Reform Commission set a target of 100 MW of tidal power stations (plants) to be built by 2020 [65,66].

2.5. Barriers and Behaviours

Following the balancing of the respondent’s information by background, awareness, attitude and technology, this part of the questionnaire was devoted to possible barriers that the respondents might have against the WTP for the GEPs. It included some questions related to cost, technical points, operation, follow-up services and availability of renewable energy sources. Each of these topics was analysed in detail:
Cost: Analysis of how much a respondent was prepared to pay.
Technology: Definitions of different technologies of the GEPs to clarify their reliability for a respondent.
Operation: Illustration of how and how much energy is produced.
Services: Explanation of how electricity generated by renewable energy sources can create several jobs in renewable power plants (e.g., wind power, solar power, hydropower, tidal power and geothermal power) [67]. Also, after sales services for renewable energy sources are similar to those of the earlier sources (e.g., fossil fuels) [67].
Availability: Presentation of the availability of renewable energy sources in China and in the area surveyed to show the maximum potential of electricity generation by these sources.
This part considered what motivates a respondent to purchase from various electricity sources (cost, environmental friendliness and global energy savings?). Then, a respondent’s WTP for the GEPs was assessed to find out what the effect and rank of each barrier would be.

2.6. Open Question

The open question part provided three main discussion topics: (1) renewable energy as an inexhaustible and environmentally-friendly source, (2) motivations behind purchasing the GEPs and (3) development by manufacturers and the government in the production process of the GEPs. These results are latent in the results of background, awareness, attitude and technology (see Section 3.1.1, Section 3.1.2, Section 3.1.3,Section 3.1.4 and Section 3.1.5), as well.

3. Results and Discussion

There are two main approaches which can help to achieve a green environment: the first of these consists of technical aspects of suppliers and the GEPs and the second one is the consumers’ WTP. The WTP for the GEPs was examined in this study among randomly selected consumers (end users) in Shanghai region. To examine these results, two methods, including qualitative survey and statistical analysis were studied.

3.1. Qualitative Survey Analysis

Because some parts of the results were unquantifiable information, the qualitative survey analysis was considered to assess them. The question list has five categories to cover all the issues which may affect the WTP and their results are presented as follows,

3.1.1. Background

Of the respondents, 58% were female and the rest 42% were male. The respondents’ ages ranged from 20 to older than 50 years old. The respective percentages for the respondents within the ranges of 20–30 years, 30–40 years, 40–50 years and older than 50 years were 39%, 38%, 21% and 2%. The respondents’ education encompassed a wide spectrum: from high school to doctorate levels. The education levels of randomly selected respondents were 5.2%, 25%, 28%, 22.8% and 19%, corresponding to high school graduation, junior college, bachelor, master and doctoral levels, respectively. Of the respondents, 95% were educated and 98% were less than 50 years of age. The results of this respondent group can be useful for analysis because their education levels were different, and their age allowed them to make decisions about using the GEPs.
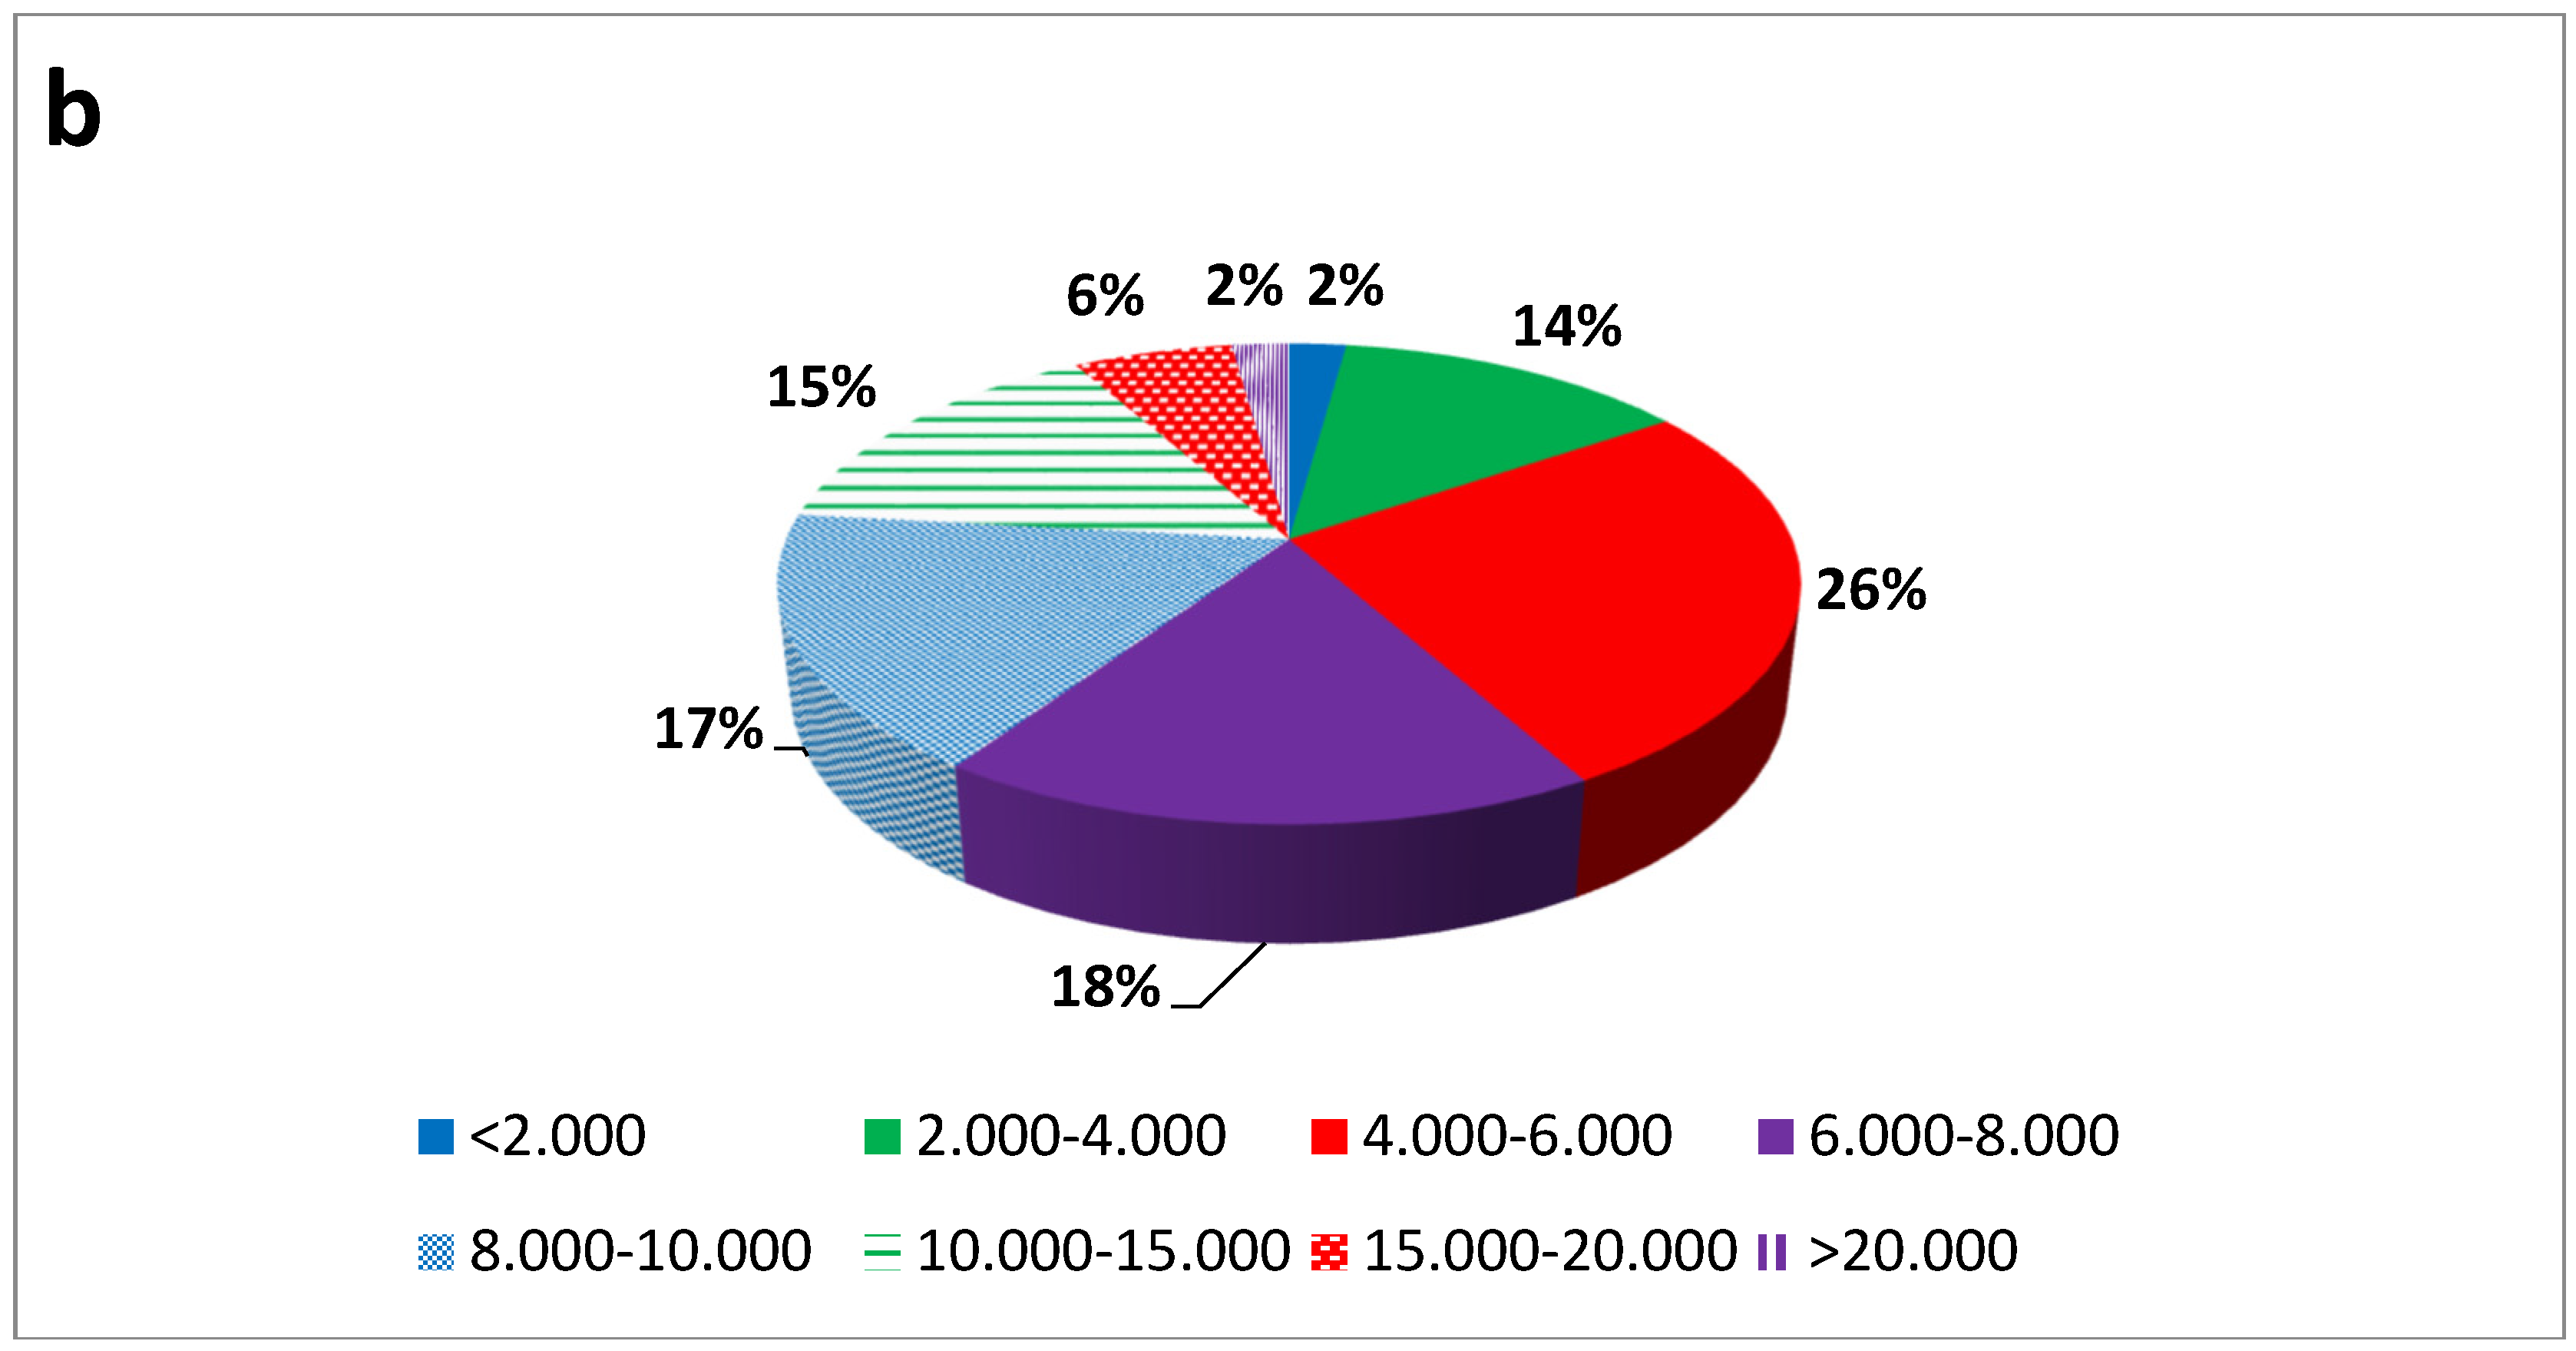
Occ and income of the respondents are shown in Figure 4a,b. The stability of the respondent’s Occ and income was 98%, meaning that for a long time their Occs and incomes have remained the same or are constant. The Occ categories indicate that the majority of the respondents knew or had the potential to learn about the GEPs. Of the respondents, 76.3% earned between 4.000 and 15.000 Yuan; thus, these people could buy the GEPs even when more expensive than electricity generated by fossil fuel, which is commonly used.
Moreover, based on their Occs (e.g., sales engineer, marketing, technician and teacher), 90% believed that they should be up-to-date. Besides, 52% of respondents were aware of the green energy concepts without any clarifications.
The type and location of buildings for residents are considered as the last pieces of the puzzle of the respondent’s personality. As buildings consume most of the electricity used in the world [68], such information (type and location of buildings) helped the respondents to find their role in using electricity and selecting electricity sources in the environment. Of the respondents, 91.4% lived in apartments with 4–10 floors and the rest 3.2%, 3.3% and 2.1% in detached houses, townhouses and dormitories, respectively. Fewer than 1.5% of the buildings were in the rural area, 82.3% were located in an urban area and 16.4% in suburbs. The background information assisted analysis to discover the personality attributes of the respondent. The information could be important for planners in promoting the GEPs.

3.1.2. Awareness

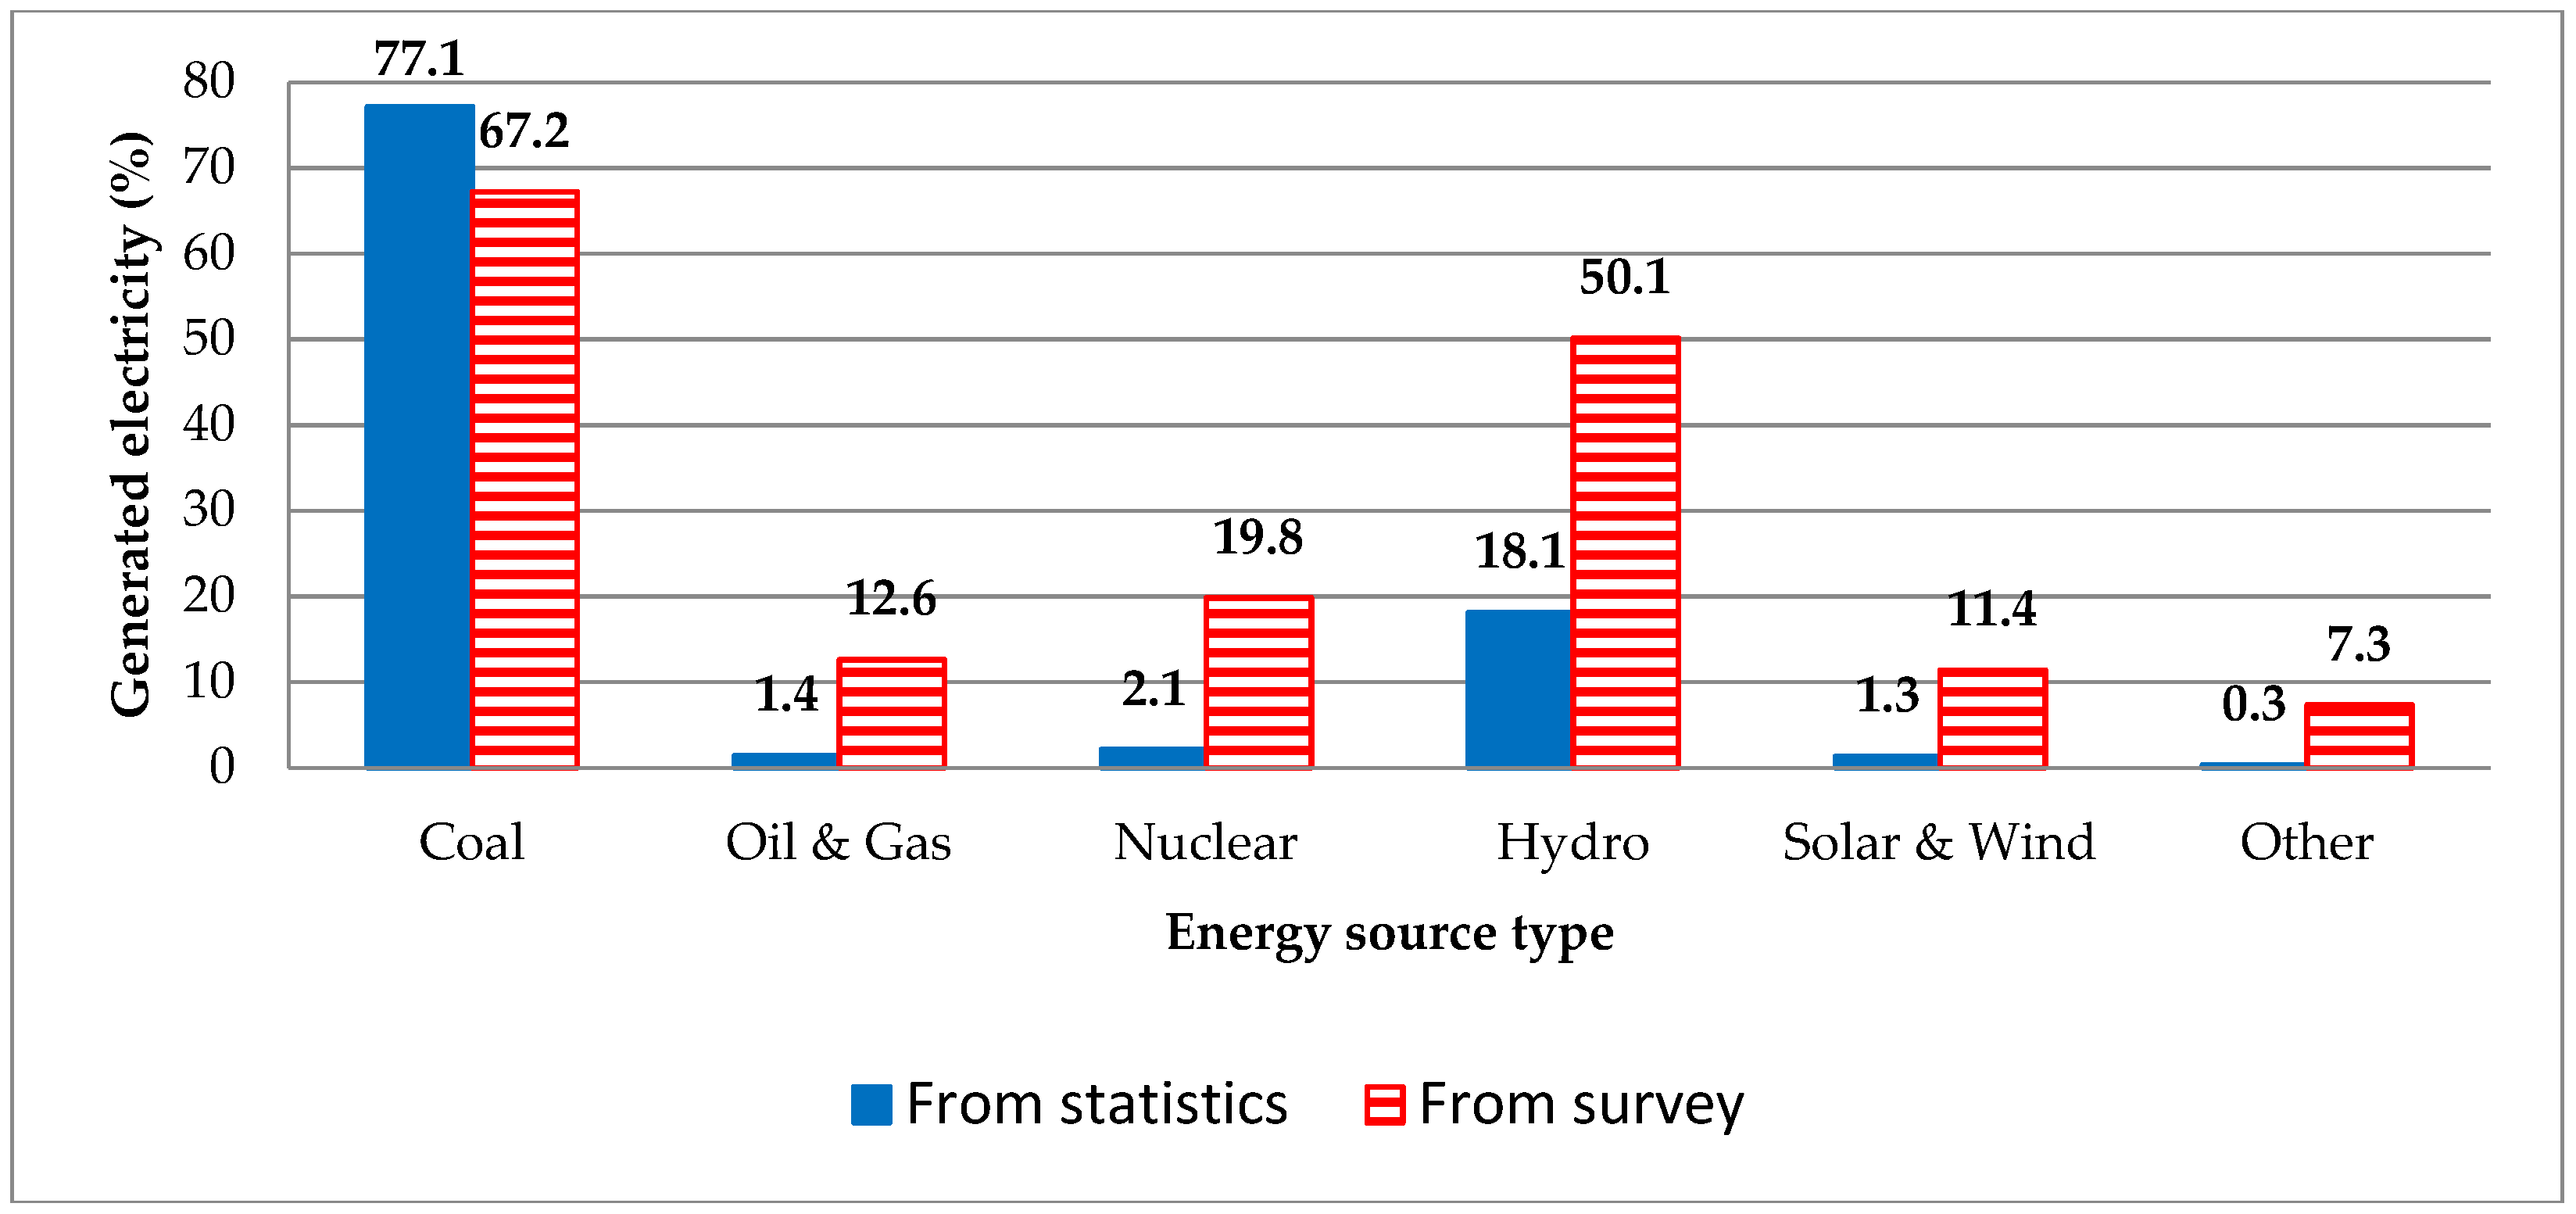
For the initial assessment of the respondents, they were questioned about their current electricity sources in the surveyed region to clarify their knowledge and awareness about those sources. The multi-choice question allowed the respondent to respond with more than one answer. To evaluate the respondents’ awareness, Figure 5 compares their responses to the real data on generated electricity in this region [69].
The respondents stated that the greatest portion of the electricity used is generated by thermal (coal and peat) and hydropower sources and the rest of it is generated mainly by oil, gas, nuclear, solar, wind, biomass, tidal and geothermal power sources. However, this was a multi-choice question which cannot rank the energy sources for electricity. Figure 5 shows that the respondents knew about the traditional power sources (e.g., coal and hydro) and their lack of knowledge and awareness about renewable energy sources (e.g., solar, wind and nuclear) was completely comprehended.
The assessment of the respondents’ awareness by figuring out the consumers’ WTP can be used to help and motivate consumers to buy the GEPs despite possible economic problems they may have. The results of the multi-choice question (Figure 6) illustrate that most of the respondents were familiar with hydro, wind, solar, biomass, tidal and geothermal power; nevertheless, the detailed principle of each source was explained to them by the description in the questionnaire (as the option for each question).
Moreover, the respondents required information about the environmental impacts of fossil fuel and about the advantages of renewable energy sources. More than 90% of them knew about the impacts of AP, water pollution, GHG effect, GW and CO2 emission. However, they did not seem to know that some of these impacts are driven by fossil fuels and other common electricity sources and that this problem can be solved, partially or wholly, by the GEPs.
The negative aspect in the respondents’ awareness was a lack of information about some parameters, for example, environmental friendliness and CO2 emission’ mitigation, labelling and certification schemes. Table 1 shows the results concerning labels and certificates: only 36.8% of them believed the current information for labelling and certification of electricity sources is very or moderately good and 63.2% believed the current information is not well enough.
This information, including familiarity with electricity sources, accessibility of using renewable energy sources as well as an assessment of current label and standard levels, helped the respondents to evaluate the usage potential of the GEPs. Their opinion about it was elucidated in the question and the results are shown in Table 2. Most of them (72%) believed that the surveyed region has the potential to use the GEPs.
Based on the qualitative survey method: the WTP for the GEPs can be improved by invoking the environmental benefits for that source. They believed that the current information on the topic is insufficient, suggesting that it would be desirable to improve the information about the costs of different ways to generate electricity, different certifications and labels, different electricity sources and their environmental impacts. Such information could help the consumer to overcome their past behaviour patterns.
The awareness part shows the consumers’ lack of information concerning the use of the GEPs by the consumer. This can be corrected by labelling and certifying and by providing some information about the advantages of green energy. Also, the energy sources, both fossil fuels and green sources should be presented in detail to the consumers in order to help them in their selection of the GEPs.

3.1.3. Attitudes

According to Jalas [70], the situation of the consumers’ WTP for the GEPs is often emphasized and focused on environmental impacts. One of the important and interesting results of this study is related to attitudes: it was found that 99% of respondents were worried about environmental pollution, GW and CO2 emission due to the use of electricity generated by fossil fuel sources. To inform respondents about environmental impacts, the most significant ones [47] of these were introduced. The categorized impacts included (1) Water and Soil Erosion (WSE), (2) AP, (3) Sulphur Dioxide Emissions (SDE), (4) Soot Emissions (SE), (5) Industrial Dust Discharged (IDD), (6) Greenhouse Effect (GE) and (7) GW. The responded people’s opinions were arranged along with these categories in Figure 7 obtained via a multi-choice question to assess their knowledge and awareness of environmental impacts due to fossil fuel sources.
The problematic issue is that the respondents needed the information to become aware of each impact. As a consequence of this, the classified information of each environmental impact was presented. The impacts ranked according to their opinion resemble those of the official document [47], in which AP, GE and GW were figured out as the top environmental risks. The results in Figure 7 show that the people were conscious of some environmental impacts and risks due to the use of fossil fuel sources. The Figure’s results are in agreement with Wang et al. study of environmental impacts [48]. The problem was that they did not know their role in this setting.

3.1.4. Technology and Resources

The respondents’ opinion about the accessibility of renewable energy sources was assessed. Before responding survey, they were hesitant to buy the GEPs because they did not know what they should expect once changing to and using the GEPs. For example, some of the respondents believed that the performance of electrical appliances may be different once using various energy sources and also had no idea about how to obtain their electricity demand from the GEPs. Such information and awareness could make a difference in the WTP or in the behaviour of people in general. Therefore, behavioural change in the WTP can be simply accomplished by increasing the information of the details of the used technology. The respondents believed that accessibility of electricity sources is 97%, 81%, 75%, 22.4%, 8.6% and 8.6% to solar power, wind power, hydropower, biomass, heat pump and combined heat and power technologies, respectively. These results confirm the similarity of the respondents’ opinions with the perception of China’s Renewable Energy Sector about the accessibility of renewable energy sources [42,69]. Because they had been provided with detailed information about each technology. Thus, they show that the WTP can be increased if the consumers are informed about the advantages of these technologies.
Other problematic area affecting energy consumption and environmental impacts are in the different sectors [71,72,73]. The building sector contributes up to 30% of global annual GHG emissions through the use of fossil fuels and consumes up to 40% of all energy [74]. In making indoor thermal comfort in buildings [75,76,77,78,79,80] heating and cooling systems based on various technologies play the main role. Thus, the user’s input in choosing a heating and cooling system should be analysed in order to control environmental impacts, energy saving and GW issues. Gauged from the responses, the heating and cooling system is designed or installed in 38%, 28%, 17%, 10% and 7% of cases by a long-term tenant, place owner, construction company, designer and intermediary company, respectively. Moreover, 75% of the respondents preferred to choose it by themselves. As 66% of responded people were able to decide the type of heating and cooling distribution system, it can be concluded that the consumer behaviour in choosing the heating and cooling system type in the building is important.
As the final assessment of the technology section, the most important reasons to choose a certain technology were examined. The given reasons include saving energy (86%), energy cost (72.5%), technological reliability (67.5%) and environmentally-friendly option (61%). This information shows that the control of energy consumption to save in energy costs is the most important factor.

3.1.5. Barriers

The barrier part aggregates the previous results in order to determine how the WTP can be improved. Before responding to the survey, fewer than half of the respondents (40%) were aware of the renewable energy sources and the rest were informed during the questionnaire survey by additional information for each question. The detailed descriptions of each question helped the respondents to become more aware of the details of the GEPs. Price, technology type, operation and limited manufacturer (accessibility) were suggested as barriers to the GEPs. The role of each of these factors in their opinion was 62%, 59%, 58% and 40%, respectively. In consequence, the energy cost was ranked as the highest and therefore the most important barrier. An important respondent’s personality parameter affecting the response concerning the WTP for the GEPs was personal income. Thus, balancing the WTP for the GEPs and income need to be analysed. Based on the above, it can be concluded that the policy of managing the electricity price motivates people to buy it. Table 3 illustrates the income’s role.
Of the respondents, 71% were eager to change their electricity sources to the GEPs. Nevertheless, this was aligned with their income and they preferred to change only a part of their electricity sources to renewable ones. The option preferred by 26% of respondents was to completely change their current electricity source to the GEPs. For 97% of them who preferred to change it partly or wholly, the income was higher than 8000 Yuan per month, which highlights the role of people’s income in relation to electricity price. Therefore, one important factor in the WTP for the GEPs is the economic situation of respondents. The monthly income of most of the responded people (60%) was lower than 8000 Yuan and the average income (4500 Yuan) [81]. However, once the respondents had been notified about the benefits of such energy sources, they were eager to buy their energy from those sources. Before responding to the survey, the respondents were unenthusiastic about changing their electricity sources to green ones for economic reasons. However, after responding to the survey, they became enthusiastic about changing their energy sources completely or partly, in accordance with their income. This result means that the perceived benefits of the GEPs are very important for making decisions about electricity sources and if the financial barrier (the price of the GEPs or their income) can be overcome, the WTP may be increased.
The accessible information about the GEPs was found to be effective in increasing the WTP. To the questions about the sufficiency and accessibility of renewable energy sources, they answered that effective ways to increase the WTP are communication by email on the internet and web pages (90%) as well as news on TV (87%); also, some other ways such as advertisements (26%) and books (15%) were regarded as effective methods. More than half of the respondents (55%) believed that the current sources are enough. Those willing to use the GEPs completely or partly, that is, the rest of the respondents believed that more information is needed to convince consumers about the advantages of the GEPs.
From qualitative analysis point-of-view, the economic situation of people and the GEPs and lack of knowledge and awareness about the GEPs were found as the major issues affecting the WTP for the GEPs. Besides the main achievements of this study, some research perspectives were raised during the interview process, as follows:
  • Willing to be pro-environmental in diverse ways.
  • Flexible FITs for the GEPs based on consumers’ information.
  • Share energy (electricity, heating and etc.) with other householders.
  • Mobile the GEPs, for example, a small scale of mobile PV modules.

3.2. Statistical Analysis

With the 95% confidence level and a 6.4% margin of errors in the sample size, a statistical analysis was studied. In the sample group, participants in some categories (i.e., age, income and education level) had less than five respondents. Therefore, in statistical analysis, these categories were transformed into groups as follows. Age was divided into three categories: young (20–30 y/o) young-middle aged (30–40 y/o) and middle-aged (40<). Income levels were transformed into four groups: low-income level (<2000–4000), lower-middle income level (4000–8000), upper-middle income level (8000–15,000) and high-income level (15,000–20,000). For education, those up to junior college degree were classified as less educated, while those who had a bachelor’s or master’s degree were put asunder and postgraduate degree and the last group were the highly educated ones who had a doctoral degree. Then, the Chi-Square Test was performed to assess how gender, age, income range and education relate to the WTP. P-value (calculated probability) chosen for the statistical analysis was 0.05 (95% confidence).
The results indicate that there was statistically significant association between the income level and WTP (X(6) = 19.7, p = 0.034) and a near statistically significant association between the education level and WTP (X(4) = 8.1, p = 0.087). However, there was no statistically significant association between the gender and WTP (X(2) = 0.511, p = 0.775) and no statistically significant association between the age and WTP (X(4) = 4.9, p = 0.303).
Follow-up post hoc tests were performed to find where the significance difference occurs based on adjusted standardized residuals. P values for each of the Chi-square values were found and then were compared to the adjusted Bonferroni corrected p values. The results indicate that the most significant difference was within lower-middle (4000–8000) and upper-middle (8000–15,000) income levels.
As also can be seen from the Chi-square test results education level is near significant. A higher number of participants might have resulted in more accurate statistical analysis, that is, in the slightly non-significant interaction effect between the education and WTP. Therefore, increasing awareness and concern for the environmental impacts might leads toward more participation in the WTP for the GEPs.
The results of this study may compare with previous studies. For example, Ozaki [82] concluded that based on the 103 respondents in the UK, uncertainty about the quality of the GEPs and lack of accurate information are the main barriers for consumers to buy the GEPs. Also, Yuan et al. [83] studied the social acceptance of solar energy technologies in the Shandong province of China with almost 100 million population based on 1271 respondents. They found that the most common reasons for not the WTP for solar PV modules were the economic reason and low level of application which they interpret to indicate a lack of awareness of solar PV modules among respondents. The present study is in agreement with previous findings by the qualitative method and statistical analysis. In addition, it investigates more influence parameters and visions of how the WTP may be increased.

4. Conclusions

China is facing an enormous challenge by reforming the electric power market since the middle of 2015. Thus, the residents’ willingness to pay (WTP) and use green energy products (GEPs) would become an important factor for policymakers, industrial and scholar communities.
According to the questionnaire survey, qualitative method and statistical analysis were performed for 232 respondents in Shanghai region to find out what factors, including gender, age, education and income level are significant in the WTP for the GEPs. The 232 respondents with a 95% confidence level represent about 6% margin of errors. The results reflected the opinions and attitudes of mainly young and educated people. Thus, there would probably be good potential for a voluntary shift towards the GEPs among this population, especially if the government supports this with tax exemptions or other financial support mechanisms.
The results showed that the main factor that significantly affects the consumer’s WTP for the GEPs was the income level. Respondents with a medium to a higher level of income were more likely to be willing to pay more for the GEPs. Such an interview provided some additional insight into how the respondents actually think about energy conservation and the technical problems they might face. This indicated how lack of information may affect respondents’ mind and relevant knowledge and awareness can convince people to convert their sources of energy into new ones.
Moreover, increasing respondents’ awareness of the GEPs increased the WTP for the GEPs and convinced 97% of them to use the GEPs completely or partly, in line with their monthly income. The results also stated that more than 70% of the respondents were interested in buying the GEPs but that they did not have enough knowledge and awareness about the matter. The results of the survey also indicated that clear and transparent information about the potential of the GEPs and about their environmental benefits would be needed to support voluntary choices for the use of the GEPs and increase the WTP.
Thus, this research recommends that people’s knowledge and awareness about the GEPs may be increased by clarifying the benefits of the GEPs and balancing its costs in line with the average income to attract consumers and to achieve a high WTP for the GEPs. Also, it may be noted that the future development of green energy use in China cannot be drawn from this study on consumers’ attitudes in Shanghai but the results provide valuable suggestions on how the consumer demand of the GEPs could be increased.

Author Contributions

Conceptualization: B.V. and A.H.; Analysis: B.V., A.H. and S.B.; Methodology: B.V., A.H. and S.B.; Statistical Analysis: S.B.; Data Collection: Z.L. and S.D.; Supervision: S.S.; Writing, Review and Editing: B.V., A.H. and S.B.

Funding

This work was funded by Tekes, the Finnish Funding Agency for Innovation.

Acknowledgments

The first, second and fifth authors are thankful for the financial support from Tekes, the Finnish Funding Agency for Innovation. The fourth and sixth authors are thankful for financial support by the National High-Technology Research and Development Program of China under Grant number 2015AA050403. The authors would also like to thank Zhou Xiang from Tongji University in China, Cao Guangyu from NTNU: Norwegian University of Science and Technology, and Shengyuan Zhong and Shilin Zhu from Tianjin University for their collaborations in this research.

Conflicts of Interest

The authors declare no conflict of interest.

Appendix A

Section A: Background information:
What is your gender?
How old are you?
What is your education level?
What is your occupation?
How stable is your work?
How much can you earn monthly? (in Yuan)
In what kind of building are you living? How much area does it have?
How many people live in your household?
Where is the place of your residence?
Section B: Knowledge:
How is the electricity produced in your household? (multi-choice)
Do you know what renewable energy sources are? (multi-choice)
How well do you know green product labels? (With labelling and certification schemes, some parameters like environmentally friendly, price, and products marketed can be clearly defined)
What do you think about the potential of renewable energy in your town/city?
Section C: Attitudes:
Are you worried about environmental pollution or global warming?
What environmental problems will we have without green energy?
Would you prefer locally produced green energy? (e.g. solar photovoltaic panels, biomass, etc.)
Section D: Technology:
Which green energy products do you think are accessible?
Who has made the decision about the water heating and cooling system in your household?
Can you decide about the water heating and cooling system for your place?
What is the important factor in choosing the water heating and cooling system?
Section F: Barriers & behaviour:
Which factors do you feel are barriers to buy green energy?
Have you heard of green energy before?
Which green energy technologies are you interested in and why?
Will you buy green energy? (green energy may be more expensive than ordinary electricity)
Would you buy your own renewable electricity system?
What could motivate you to buy green energy?
How do you obtain information?
Is there enough information available to convince you to buy green energy?
Section G: Open questions:
What kind of renewable energy policy does your town apply?
How can a renewable energy policy motivate consumer to buy green energy?
In your opinion, how can householders be motivated towards the green energy?
How can consumers trust that green energy is more environmentally friendly?
How do you think green energy differs from “ordinary” electricity?
What additional advantages can be obtained by green energy products?
How government can motivate consumers to buy green energy?
How do you take environmental issues into account in your daily life?

References

  1. Chen, H.; Huang, Y.; Shen, H.; Chen, Y.; Ru, M.; Chen, Y.; Lin, N.; Su, S.; Zhuo, S.; Zhong, Q.; et al. Modeling temporal variations in global residential energy consumption and pollutant emissions. Appl. Energy 2015, 184, 820–829. [Google Scholar] [CrossRef]
  2. REN21: Global Renewable Energy Policy Multi-Stakeholder Network. Available online: http://www.ren21.net/ (accessed on 4 June 2019).
  3. Mitigating Climate Change—Greenhouse Gas Emissions. Available online: https://www.eea.europa.eu/soer-2015/countries-comparison/climate-change-mitigation (accessed on 4 June 2019).
  4. Hast, A.; Alimohammadisagvand, B.; Syri, S. Consumer attitudes towards renewable energy in China—The case of Shanghai. Sustain. Cities Soc. 2015, 17, 69–79. [Google Scholar] [CrossRef]
  5. Xingang, Z.; Jieyu, W.; Xiaomeng, L.; Pingkuo, L. China’s wind, biomass and solar power generation: What the situation tells us? Renew. Sustain. Energy Rev. 2012, 16, 6173–6182. [Google Scholar] [CrossRef]
  6. Hao, Y.; Liao, H.; Wei, Y.-M. Is China’s carbon reduction target allocation reasonable? An analysis based on carbon intensity convergence. Appl. Energy 2015, 142, 229–239. [Google Scholar] [CrossRef]
  7. Liu, W.; Wang, C.; Mol, A.P.J. Rural public acceptance of renewable energy deployment: The case of Shandong in China. Appl. Energy 2013, 102, 1187–1196. [Google Scholar] [CrossRef]
  8. Shanghai, China. Available online: http://www.shanghai.gov.cn/shanghai/node27118/ (accessed on 28 August 2015).
  9. Dhakal, S. Urban energy use and carbon emissions from cities in China and policy implications. Energy Policy 2009, 37, 4208–4219. [Google Scholar] [CrossRef]
  10. China Statistical Yearbook Compiled by National Bureau of Statistics of China. Available online: http://www.stats.gov.cn/tjsj/ndsj/2014/indexeh.htm (accessed on 28 August 2015).
  11. Zhao, Y.; Tang, K.K.; Wang, L. Do renewable electricity policies promote renewable electricity generation? Evidence from panel data. Energy Policy 2013, 62, 887–897. [Google Scholar] [CrossRef]
  12. Zsiborács, H.; Hegedűsné Baranyai, N.; Csányi, S.; Vincze, A.; Pintér, G. Economic Analysis of Grid-Connected PV System Regulations: A Hungarian Case Study. Electronics 2019, 8, 149. [Google Scholar] [CrossRef]
  13. Wang, F.; Wang, L. Research on Renewable Energy Policies and Pricing Mechanisms. IOP Conf. Ser. Earth Environ. Sci. 2018, 186, 012068. [Google Scholar] [CrossRef]
  14. Salmela, S.; Varho, V. Consumers in the green electricity market in Finland. Energy Policy 2006, 34, 3669–3683. [Google Scholar] [CrossRef]
  15. Hast, A.; Syri, S.; Jokiniemi, J.; Huuskonen, M.; Cross, S. Review of green electricity products in the United Kingdom, Germany and Finland. Renew. Sustain. Energy Rev. 2015, 42, 1370–1384. [Google Scholar] [CrossRef]
  16. Baležentis, T.; Štreimikienė, D. Sustainability in the Electricity Sector through Advanced Technologies: Energy Mix Transition and Smart Grid Technology in China. Energies 2019, 12, 1142. [Google Scholar] [CrossRef]
  17. Sun, X.; Feng, Y. Analysis of Barriers and Strategies for China’s Green Power Market. Energy Procedia 2012, 17, 1401–1407. [Google Scholar] [CrossRef]
  18. Gliedt, T.; Hoicka, C.E. Energy upgrades as financial or strategic investment? Energy Star property owners and managers improving building energy performance. Appl. Energy 2015, 147, 430–443. [Google Scholar]
  19. Bird, L.; Wüstenhagen, R.; Aabakken, J. A review of international green power markets: Recent experience, trends, and market drivers. Renew. Sustain. Energy Rev. 2002, 6, 513–536. [Google Scholar] [CrossRef]
  20. Chan, K.-Y.; Oerlemans, L.A.G.; Volschenk, J. On the construct validity of measures of willingness to pay for green electricity: Evidence from a South African case. Appl. Energy 2015, 160, 321–328. [Google Scholar] [CrossRef]
  21. Nomura, N.; Akai, M. Willingness to pay for green electricity in Japan as estimated through contingent valuation method. Appl. Energy 2004, 78, 453–463. [Google Scholar] [CrossRef]
  22. Hast, A.; McDermott, L.; Syri, S.; Järvel;, M.; Huuskonen, M.; Alimohammadisagvand, B.; Cross, S.; Syrjämäki, E. Consumer Demand of Renewable Energy Services—Case Studies on Finland, Germany, Great Britain, USA and China; Aalto University Publication; Aalto University: Espoo, Finland, 2014; ISBN 978-952-60-5743-9. [Google Scholar]
  23. Kim, J.; Kim, J. Korean public’s perceptions on supply security of fossil fuels: A contingent valuation analysis. Appl. Energy 2015, 137, 301–309. [Google Scholar] [CrossRef]
  24. Kraeusel, J.; Möst, D. Carbon Capture and Storage on its way to large-scale deployment: Social acceptance and willingness to pay in Germany. Energy Policy 2012, 49, 642–651. [Google Scholar] [CrossRef]
  25. Alimohammadisagvand, B.; Hast, A.; Syri, S.; Cao, G. Chinese consumer attitudes and barriers towards green energy. In Proceedings of the International Sustainable Built Environment Conference, Doha, Qatar, 28–29 January 2014. [Google Scholar]
  26. Zorić, J.; Hrovatin, N. Household willingness to pay for green electricity in Slovenia. Energy Policy 2012, 47, 180–187. [Google Scholar] [CrossRef]
  27. Ozbafli, A.; Jenkins, G.P. The willingness to pay by households for improved reliability of electricity service in North Cyprus. Energy Policy 2015, 87, 359–369. [Google Scholar] [CrossRef]
  28. Simões, F. Consumer Behavior and Sustainable Development in China: The Role of Behavioral Sciences in Environmental Policymaking. Sustainability 2016, 8, 897. [Google Scholar] [CrossRef]
  29. Guanghua, S.; Wanda, G.; Ruoqi, L. Identification and analysis on influential factors of payment for green product environment premium. J. Arid Land Resour. Environ. 2018, 6. Available online: http://en.cnki.com.cn/Article_en/CJFDTotal-GHZH201806002.htm (accessed on 4 June 2019).
  30. Liu, Y.; Hong, Z.; Zhu, J.; Yan, J.; Qi, J.; Liu, P. Promoting green residential buildings: Residents’ environmental attitude, subjective knowledge, and social trust matter. Energy Policy 2018, 112, 152–161. [Google Scholar] [CrossRef]
  31. Zhang, L.; Fukuda, H.; Liu, Z. Households’ willingness to pay for green roof for mitigating heat island effects in Beijing (China). Build. Environ. 2019, 150, 13–20. [Google Scholar] [CrossRef]
  32. Zhang, L.; Chen, L.; Wu, Z.; Zhang, S.; Song, H. Investigating Young Consumers’ Purchasing Intention of Green Housing in China. Sustainability 2018, 10, 1044. [Google Scholar] [CrossRef]
  33. Liu, W. Design of Competition Power Market Based on the Unbundling of Retail and Distribution; North China Electric Power University: Beijing, China, 2015. [Google Scholar]
  34. Energy Research Institute. China State Grid Economic and Technological Research Institute Co., Ltd. Annual Report. Available online: http://www.chinasperi.sgcc.com.cn/ (accessed on 26 December 2015).
  35. Bai, Y.; Zhong, H.; Xie, L.; Xia, Q.; Chen, Q. Institutional Design of Chinese Retail Electricity Market Reform and Related Suggestions. Autom. Electr. Power Syst. 2015, 39, 1–7. [Google Scholar]
  36. China State Council. An Announcement on Approval of “The Guideline of Major Tasks to Deepen Economic Structure Reform in 2013”; National Development and Reform Commission: Beijing, China, 2013.
  37. China State Council Central Committee of the Communist Party of China. Some Suggestions for Further Deepening Power System Reform; China State Council Central Committee of the Communist Party of China: Beijing, China, 2015. [Google Scholar]
  38. Li, K.; Lin, B. Impact of energy conservation policies on the green productivity in China’s manufacturing sector: Evidence from a three-stage DEA model. Appl. Energy 2016, 168, 351–363. [Google Scholar] [CrossRef]
  39. Zhou, Y.; Liu, Y. Does population have a larger impact on carbon dioxide emissions than income? Evidence from a cross-regional panel analysis in China. Appl. Energy 2016, 180, 800–809. [Google Scholar] [CrossRef]
  40. Cochran, W.G. Sampling Techniques, Wiley Series in Probability and Mathematical Statistics; 2nd ed.; Wiley: New York, NY, USA, 1963; ISBN 978-0-471-16238-4. [Google Scholar]
  41. Ryan, T.P. Sample Size Determination and Power; Wiley: Hoboken, NJ, USA, 2013; ISBN 978-1-118-43760-5. [Google Scholar]
  42. Shanghai Municipal People’s Government Shanghai Electric Power Development “Twelfth Five Year Plan”. Available online: http://www.shanghai.gov.cn/shanghai/node2314/node25307/node25455/node25459/u21ai569504.html (accessed on 1 June 2014).
  43. Raadal, H.L.; Gagnon, L.; Modahl, I.S.; Hanssen, O.J. Life cycle greenhouse gas (GHG) emissions from the generation of wind and hydro power. Renew. Sustain. Energy Rev. 2011, 15, 3417–3422. [Google Scholar] [CrossRef]
  44. Zhang, S.; Bauer, N.; Luderer, G.; Kriegler, E. Role of technologies in energy-related CO2 mitigation in China within a climate-protection world: A scenarios analysis using REMIND. Appl. Energy 2014, 115, 445–455. [Google Scholar] [CrossRef]
  45. Sun, X.; Zhang, B.; Tang, X.; McLellan, B.; Höök, M. Sustainable Energy Transitions in China: Renewable Options and Impacts on the Electricity System. Energies 2016, 9, 980. [Google Scholar] [CrossRef]
  46. He, M.; Liu, P.; Ma, L.; Chong, C.; Li, X.; Song, S.; Li, Z.; Ni, W. A Systems Analysis of the Development Status and Trends of Rural Household Energy in China. Energies 2018, 11, 1741. [Google Scholar] [CrossRef]
  47. Ming, Z.; Song, X.; Mingjuan, M.; Xiaoli, Z. New energy bases and sustainable development in China: A review. Renew. Sustain. Energy Rev. 2013, 20, 169–185. [Google Scholar] [CrossRef]
  48. Wang, B.; Kocaoglu, D.F.; Daim, T.U.; Yang, J. A decision model for energy resource selection in China. Energy Policy 2010, 38, 7130–7141. [Google Scholar] [CrossRef]
  49. Wang, B.; Ke, R.-Y.; Yuan, X.-C.; Wei, Y.-M. China’s regional assessment of renewable energy vulnerability to climate change. Renew. Sustain. Energy Rev. 2014, 40, 185–195. [Google Scholar] [CrossRef]
  50. Yang, M.; Patiño-Echeverri, D.; Yang, F. Wind power generation in China: Understanding the mismatch between capacity and generation. Renewable Energy 2012, 41, 145–151. [Google Scholar] [CrossRef]
  51. Science Press. Chinese Academy of Engineering Medium-and-Long-Term (2030, 2050) Energy Development Strategy Study of China’s Energy; Science Press: Beijing, China, 2011; ISBN 978-7-03-029944-4. [Google Scholar]
  52. Khatib, T.; Mohamed, A.; Sopian, K. A review of solar energy modeling techniques. Renew. Sustain. Energy Rev. 2012, 16, 2864–2869. [Google Scholar] [CrossRef]
  53. Sun, Y.; Wang, F.; Wang, B.; Chen, Q.; Engerer, N.A.; Mi, Z. Correlation Feature Selection and Mutual Information Theory Based Quantitative Research on Meteorological Impact Factors of Module Temperature for Solar Photovoltaic Systems. Energies 2016, 10, 7. [Google Scholar] [CrossRef]
  54. Mauthner, F.; Weiss, W.; Spörk-Dur, M. Solar Heat Worldwide, Markets and Contribution to the Energy Supply. Available online: http://www.iea-shc.org/data/sites/1/publications/Solar-Heat-Worldwide-2015.pdf (accessed on 26 December 2015).
  55. China State Council Several Options on Healthy Development Promotion of Solar Photovatic Industry. Available online: http://www.gov.cn/xxgk/pub/govpublic/mrlm/201307/t20130715_66188.html (accessed on 26 December 2015).
  56. Shanghai Finance Bureau Shanghai Municipal Development and Reform Commission. Notice on Issue of “Support Policy on Development Funding of Renewable Energy and New Energy in Shanghai”; Shanghai Finance Bureau Shanghai Municipal Development and Reform Commission: Shanghai, China, 2014.
  57. Tabassum-Abbasi;Premalatha, M.; Abbasi, T.; Abbasi, S.A. Wind energy: Increasing deployment, rising environmental concerns. Renew. Sustain. Energy Rev. 2014, 31, 270–288. [Google Scholar] [CrossRef]
  58. Li, J.; Gao, H.; Shi, J.; Ma, L.; Qing, L. China Wind Power. Available online: http://cwera.cma.gov.cn/cn/ (accessed on 27 May 2014).
  59. Global Wind Report GWEC’s Global Wind Report-Annual Market Update. Available online: http://www.gwec.net/publications/global-wind-report-2/global-wind-report-2013/ (accessed on 25 August 2014).
  60. Wang, Q. Effective policies for renewable energy—The example of China’s wind power—Lessons for China’s photovoltaic power. Renew. Sustain. Energy Rev. 2010, 14, 702–712. [Google Scholar] [CrossRef]
  61. Kaldellis, J.K. Critical evaluation of the hydropower applications in Greece. Renew. Sustain. Energy Rev. 2008, 12, 218–234. [Google Scholar] [CrossRef]
  62. Yüksel, I. Hydropower for sustainable water and energy development. Renew. Sustain. Energy Rev. 2010, 14, 462–469. [Google Scholar] [CrossRef]
  63. Liu, J.; Zuo, J.; Sun, Z.; Zillante, G.; Chen, X. Sustainability in hydropower development—A case study. Renew. Sustain. Energy Rev. 2013, 19, 230–237. [Google Scholar] [CrossRef]
  64. Wang, S.; Yuan, P.; Li, D.; Jiao, Y. An overview of ocean renewable energy in China. Renew. Sustain. Energy Rev. 2011, 15, 91–111. [Google Scholar] [CrossRef]
  65. National Development and Reform Commission (NDRC). The National Eleventh Five-Year Plan for Renewable Energy Development; National Development and Reform Commission (NDRC): Beijing, China, 2007.
  66. National Development and Reform Commission (NDRC). Medium and Long-Term Development Plan for Renewable Energy in China; National Development and Reform Commission (NDRC): Beijing, China, 2007.
  67. van der Zwaan, B.; Cameron, L.; Kober, T. Potential for renewable energy jobs in the Middle East. Energy Policy 2013, 60, 296–304. [Google Scholar] [CrossRef]
  68. Intergovernmental Panel on Climate Change. Climate Change; Synthesis Report; Cambridge University Press: Cambridge, UK, 2007. [Google Scholar]
  69. International Labour Organization. Solidiance China’s Renewable Energy Sector: An Overview of Key Growth Sectors; International Labour Organization: Beijing, China, 2013. [Google Scholar]
  70. Jalas, M. Kuluttajat Ympäristöjohtamisen Kohteina ja Osapuolina (Consumers as Targets and Partners of Environmental Management); Ympäristö ja Liiketoiminta, Heiskanen, E., Eds.; Gaudeamus: Helsinki, Finland, 2004; pp. 211–226. [Google Scholar]
  71. Bozorg Chenani, S.; Vaaja, M.T.; Kurkela, M.; Kosonen, I.; Luttinen, T. Target detection distances under different road lighting intensities. Eur. Transp. Res. Rev. 2017, 9, 17. [Google Scholar] [CrossRef] [Green Version]
  72. Bozorg, S.; Tetri, E.; Kosonen, I.; Luttinen, T. The Effect of Dimmed Road Lighting and Car Headlights on Visibility in Varying Road Surface Conditions. LEUKOS 2018, 14, 1–15. [Google Scholar] [CrossRef]
  73. Bozorg Chenani, S.; Räsänen, R.-S.; Tetri, E. Advancement in Road Lighting. Light Eng. 2018, 26, 99–109. [Google Scholar]
  74. Price, L.; Levine, M.D.; Zhou, N.; Fridley, D.; Aden, N.; Lu, H.; McNeil, M.; Zheng, N.; Qin, Y.; Yowargana, P. Assessment of China’s energy-saving and emission-reduction accomplishments and opportunities during the 11th Five Year Plan. Energy Policy 2011, 39, 2165–2178. [Google Scholar] [CrossRef]
  75. Alimohammadisagvand, B.; Alam, S.; Ali, M.; Degefa, M.; Jokisalo, J.; Siren, K. Influence of energy demand response actions on thermal comfort and energy cost in electrically heated residential houses. Indoor Built Environ. 2015, 26, 298–316. [Google Scholar] [CrossRef]
  76. Alimohammadisagvand, B.; Jokisalo, J.; Kilpeläinen, S.; Ali, M.; Sirén, K. Cost-optimal thermal energy storage system for a residential building with heat pump heating and demand response control. Appl. Energy 2016, 174, 275–287. [Google Scholar] [CrossRef]
  77. Alimohammadisagvand, B.; Jokisalo, J.; Sirén, K. The potential of predictive control in minimizing the electricity cost in a heat-pump heated residential house. In Proceedings of the 3rd IBPSA-England Conference BSO 2016, Great North Museum, Newcastle, UK, 12–14 September 2016; Available online: http://www.ibpsa.org/proceedings/BSO2016/p1049.pdf (accessed on 19 June 2019).
  78. Arabzadeh, V.; Alimohammadisagvand, B.; Jokisalo, J.; Siren, K. A novel cost-optimizing demand response control for a heat pump heated residential building. Build. Simul. 2017, 11, 533–547. [Google Scholar] [CrossRef]
  79. Alimohammadisagvand, B.; Jokisalo, J.; Sirén, K. Comparison of four rule-based demand response control algorithms in an electrically and heat pump-heated residential building. Appl. Energy 2018, 209, 167–179. [Google Scholar] [CrossRef] [Green Version]
  80. Alimohammadisagvand, B. Influence of Demand Response Actions on Thermal Comfort and Electricity Cost for Residential Houses. Doctoral Dissertation, Aalto University, Helsinki, Finland, 2018. [Google Scholar]
  81. China Average Yearly Wages China Average Yearly Wages (1952–2014). Available online: http://www.tradingeconomics.com/china/wages (accessed on 26 August 2014).
  82. Ozaki, R. Adopting sustainable innovation: What makes consumers sign up to green electricity? Bus. Strat. Env. 2011, 20, 1–17. [Google Scholar] [CrossRef]
  83. Yuan, X.; Zuo, J.; Ma, C. Social acceptance of solar energy technologies in China—End users’ perspective. Energy Policy 2011, 39, 1031–1036. [Google Scholar] [CrossRef]
Figure 1. The simplified diagram of a pricing scheme in China’s electricity market from 2002–2015 [34].
Energies 12 02379 g001
Figure 2. The simplified diagram of a pricing scheme in China’s electricity market after the reform in 2015 [33,35].
Energies 12 02379 g002
Figure 3. Recommended sample sizes versus a different margin of errors with a 95% confidence level.
Energies 12 02379 g003
Figure 4. Occupation (a) and income (b) of the respondents.
Energies 12 02379 g004aEnergies 12 02379 g004b
Figure 5. Generated electricity by different sources in the surveyed region: consumer perceptions versus the regional statistics.
Energies 12 02379 g005
Figure 6. Respondents’ familiarity with electricity sources.
Energies 12 02379 g006
Figure 7. Respondents’ opinion about the environmental impacts of fossil fuel sources.
Energies 12 02379 g007
Table 1. Awareness level about labelling and standards of the green energy product (GEPs) in the surveyed region.
Awareness LevelVery WellModerately WellQuite WellNot at All
The ratio of respondents’ opinion in the surveyed region (%)4332835
Table 2. Respondents’ opinion regarding the usage of green/renewable energy sources in the surveyed region.
Usage of GEPs’ LevelVery PromisingModerately PromisingQuite PromisingNot at All
The ratio of respondents’ opinion in the surveyed region (%)1854253
Table 3. The willingness to change electricity sources of respondents according to their income.
Willing to Change Electricity Source LevelThe Ratio of Respondents’ Opinion in the Surveyed Region (%)
Willing to change electricity source (completely)26
Willing to change electricity source in accordance with income (partly)71
Not willing to change3