Assessment of Offshore Wave Energy Potential in the Croatian Part of the Adriatic Sea and Comparison with Wind Energy Potential


Faculty of Mechanical Engineering and Naval Architecture, University of Zagreb, Ivana Lučića 5, 10000 Zagreb, Croatia
*
Author to whom correspondence should be addressed.
Energies 2019, 12(12), 2357; https://doi.org/10.3390/en12122357
Submission received: 16 May 2019
/
Revised: 4 June 2019
/
Accepted: 15 June 2019
/
Published: 19 June 2019
(This article belongs to the Section A3: Wind, Wave and Tidal Energy)
Abstract
:The European Union is a leading patron for the introduction of renewable energy, having set a target that renewable sources will represent at least 27% of total energy consumption by the year 2030. Presently, the most significant Croatian renewable resource is hydropower, which is presently at its peak and will not develop further because of limited hydro resources. Therefore, the share of electricity generation from onshore wind farms in Croatia during in recent years has grown significantly. However, as the Croatian government has already made most of the concessions for possible locations of wind farms, the aim of the present study is to evaluate a different renewable energy resource, wave energy. An assessment of the offshore wave energy potential in the Croatian part of the Adriatic Sea is performed using data taken from WorldWaves atlas (WWA). WWA is based on satellite measurements, validated against buoy measurements and reanalysed by numerical wave modelling. This assessment was done for seven locations, and mean yearly energy is calculated for two offshore wave energy converters. Capacity factors were calculated for annual as well as for seasonal levels, and it was concluded that the bulk of the energy would be generated in autumn and winter. The most probable extreme significant wave height was determined at the investigated locations as well. Furthermore, the offshore wind energy potential was evaluated and compared to the wave energy potential.
1. Introduction
A significant increase in Greenhouse Gas (GHG) emissions occurred at the beginning of the Industrial Revolution; this is caused by human activities. Various destructive changes to the environment were noticed which are caused directly by GHG emission increases. Nowadays, when the atmospheric concentration of carbon dioxide has already exceeded the limit of 400 ppm, and since the demand for energy increases, the urgency for sustainable energy sources is even more highlighted. Most GHG emissions occur because of the combustion of carbon-based fuels, and therefore, the search for clean energy is continuously growing. A tremendous and essentially infinite energy source can be found in the world’s seas, particularly in waves, temperature and salinity differences, and in tidal streams. Marine energy could play an important role in the generation of electricity in the long term, based on current demand levels, providing around 15‒20% of electrical energy [1]. Recently, the most promising marine energy source is wave energy, because of easy predictability and availability around the world [2]. The future of wave energy harvesting relies upon further technological advancements of Wave Energy Converters (WEC), national policies and the number of large companies involved in this industry [3]. An important issue regarding the development of wave harvesting is resource mapping at the national level [4]. Therefore, the assessment of wave energy resources, including temporal and spatial variability, is crucial for the selection of potential locations of wave farms [5,6], and can be divided into the characterisation of offshore and nearshore wave energy potentials [7]. A substantial amount of research has been carried out in order to assess the wave energy potential in various places. National wave energy resources were estimated for Australia [8] and Peru [9] at different depths. The annual wave energy resource for Australia varies from 1796 to 2730 TWh, while for Peru from 259 to 341 TWh, depending on the depth. In the case of Peru, the annual wave energy resource is about two times lower than the annual wind energy resource, and more than ten times higher than geothermal energy resource. Aboobacker [10] has estimated the wave energy resource of the Bay of Bengal at 19 locations; the highest obtained mean wave power was determined to be approximately 15 kW/m. A techno-economic analysis of the wave energy potential in the Philippines was performed in [11]. The authors determined a mean annual wave power in the range from 10 to 20 kW/m depending on the location. Lucero et al. [12] have assessed the nearshore wave energy potential along the central coast of Chile. The authors found that the median wave power ranges from 27 to 38 kW/m with high seasonal dependency. Contestabile et al. [13] have investigated the wave energy potential along the southern coast of Brazil. The authors estimated average wave power ranges from 8 kW/m to 14.5 kW/m at 20 m water depth. Furthermore, the authors recommended multifunctional structures, which would have both protection breakwater as well as wave harvesting capabilities. Sierra et al. [14] evaluated the wave energy potential along the western coast of Morocco. The authors found that mean wave power there varies from 7.83 to 29.94 kW/m, and that the annual energy varies from 6.90 to 15.64 GWh for Wave Dragon WEC and from 0.45 to 0.97 GWh for Pelamis WEC. The wave energy potential for Cape Verde is assessed in [15]. The obtained wave power is greater than 7 kW/m, but it depends strongly on the season, i.e., wave power in the summer is half the amount than in winter.
There is also a significant number of studies on the assessment of wave energy in areas with lower wave energy densities. Areas with wave powers lower than 2 kW/m are, for example: the Red Sea, Caspian Sea, Weifang Sea and Persian Gulf [16,17,18,19]. Wang et al. [20] have assessed the wave energy potential in Bohai sea, obtaining a mean wave power of up to 3.5 kW/m. In addition, the wave power in the Mediterranean Sea is also lower in comparison with that of open oceanic regions; it was assessed that the gross theoretical wave power resource for the Mediterranean Sea was about 37 GW, which represents 0.1% of global gross theoretical wave power resources [21]. The wave climate was analysed in several areas of the Mediterranean Sea in [22]. In this study, the authors determined the most energetic areas as well as the areas where the highest extreme values are expected. Analysing 31 locations, mostly along the coast of the Mediterranean Sea, the authors found that mean wave power varied from 1.8 to 15.1 kW/m. Besio et al. [23] assessed the wave energy potential utilising numerical simulations over a 35-year period. The authors found that the most energetic area in the Mediterranean Sea is the area in between Sardinia, Corsica, the Balearic Islands and the Northern coast of Algeria, with mean wave power around 10 kW/m. Furthermore, the authors concluded that there is a significant variability of wave power according to the month. Similar studies are performed in [24,25], and even though the length of hindcasted periods within the performed studies are different, the results regarding the spatial distribution and local magnitudes of mean wave power are almost the same. Thus, the highest values of mean wave power are obtained in the same area as those obtained in [23]. The lowest values of the mean wave power were obtained in the Adriatic Sea, i.e., below 2 kW/m. Franzitta et al. [26] analysed the renewable energy potential of the Maltese islands, focusing on the wave energy. The authors showed a significant seasonal variability in mean wave power, with the highest wave power being present in the winter, and concluded that this seasonal variability could be compensated for when combined with seasonal variability in solar energy. Evaluation and characterisation of wave energy resources for the Libyan Sea are performed in [27]. Even though the calculated wave powers are lower than those in open oceanic regions, the low variations of wave height and wave energy periods yield better predictability. Furthermore, lower extreme values in this region, when compared to those in open oceanic regions, lead to the reduction of installation and maintenance costs. A preliminary investigation of the wave energy potential around the Italian coast, i.e., the Adriatic, Ionian, Tyrrhenian and Ligurian Seas, is shown in [28]. The authors concluded that a location near Alghero could be suitable for further analysis of wave energy harvesting. Bozzi et al. [29] also performed a feasibility study of the energy harvesting in the Italian seas, and analysed the capacity factors of three WECs. The authors found that the investigated WECs would remain idle for the majority of the year, and concluded that these WECs were oversized. Therefore, the authors investigated smaller rated WECs at two locations and found that downscaled devices have significantly higher capacity factors. Downscaled devices could be beneficial for wave energy harvesting around Crete as well, since these would be adapted for lower energetic sea areas [30].
Within this study, the determination of the wave energy potential in the Croatian part of the Adriatic Sea is performed. A detail analysis of offshore wave energy potential is done for seven locations in the central and northern Adriatic. Since the same location can have significantly different power production capabilities if different WECs are applied [31,32], within this study, two WECs were tested—i.e., Pelamis and Aqua Buoy—which are both considered offshore devices. Furthermore, the most probable extreme significant wave height was determined at the investigated locations, which is of significance for the design loads of offshore structures [27]. A comparison of the wave and wind energy potential for these seven locations within the Adriatic Sea is provided. Thus, the benefits and concerns regarding these two renewable energy resources are presented and analysed.
2. Materials and Methods
2.1. Offshore Wave Energy Potential
The wave data used for the assessment of the wave energy potential is taken from the WorldWaves atlas (WWA), which is a high-resolution interactive wind and wave atlas. The WWA depends generally on satellite measurements, which were validated against buoy measurements and reanalysed by numerical wave modelling [33]. Satellite altimeter data at full resolution was obtained based from the Geosat, TOPEX, Topex/Poseidon, Jason, EnviSat, Geosat Follow-On, Jason-2 and Jason-1s satellites; this data covers the period from July 1992 to January 2016. Every time a satellite passes, wave height is measured about each 6 km along the tracks, while wind speed is approximated using a parametric model. The obtained data is validated against buoy measurements. In order to obtain adequately high temporal resolution and systematic and high-resolution data, measurements are combined with third-generation wave model WAM for deep sea waves. WAM is run every day by the European Centre for Medium-Range Weather Forecasts (ECMWF), and this numerical model is calibrated with satellite measurements. For the Adriatic Sea, the WWA database comprises a data for 39 uniformly distributed locations, as shown in Figure 1. For every location, ten wave parameters and two wind parameters are provided at six-hour intervals, i.e., four times per day; see Table A1 (in Appendix A). Thus, every location has a total of 34,460 data outputs. In this study, seven locations within the Croatian part of the Adriatic Sea were selected for assessments of offshore wave energy potential, as shown in Figure 1.
It should be noted that the mean wave period presented in Table A1 is the wave energy period defined as follows [2,13]:
where is the n-th order spectral moment.
This represents the period of a sinusoidal wave which has the same energy as an actual sea-state. Significant wave height can be obtained as follows [2,13]:
It should be noted that for some data outputs, there are occasional missing data, i.e., not all WWA wave and wind parameters are given; see Table 1. The missing data was randomly distributed and did not cause distortions to occur in the analysis, i.e., missing season, etc. It should be noted that data logs which have missing data were excluded prior to processing and analysing the wave statistics, as done in [34].
The offshore wave climate at any location consists of different wave fields, which include both swells and wind waves. The offshore wave power per unit of wave front length can be estimated directly from hindcast wave data as follows [2,13]:
where is the sea water density and is the gravitational acceleration.
Equation (3) is derived for deep water. Namely, the wave power per unit of wave front length is obtained as a product of the averaged energy density and the group velocity. The averaged energy density per unit horizontal area can be calculated as follows:
For deep water, the group velocity which represents an energy transport velocity is equal to
In order to calculate the annual energy potential at certain locations, wave scatter diagrams should be generated. Wave scatter diagrams represent a matrix which divide all sea states into classes. Thus, all data outputs should be organised and divided into classes of and . Two wave scatter diagrams were made for each location. Both wave scatter diagrams have classes with 0.5 m increments; the difference among these two diagrams is in classes. Namely, one has classes with 0.5 s increments and the other with 1 s increments. Thus, every class includes the number of occurrences of that sea state class over a period of 24 years. Furthermore, for each sea state, occurrence is calculated based on the number of the hours per year. It should be noted that each class represents a certain energy bin. As the energy output of certain WECs is dependent on the wave energy distribution among the sea states, estimations of annual electrical energy can be calculated as follows [31]:
where is the electric power for a certain energy bin. The values of are presented in the power matrices of certain WECs.
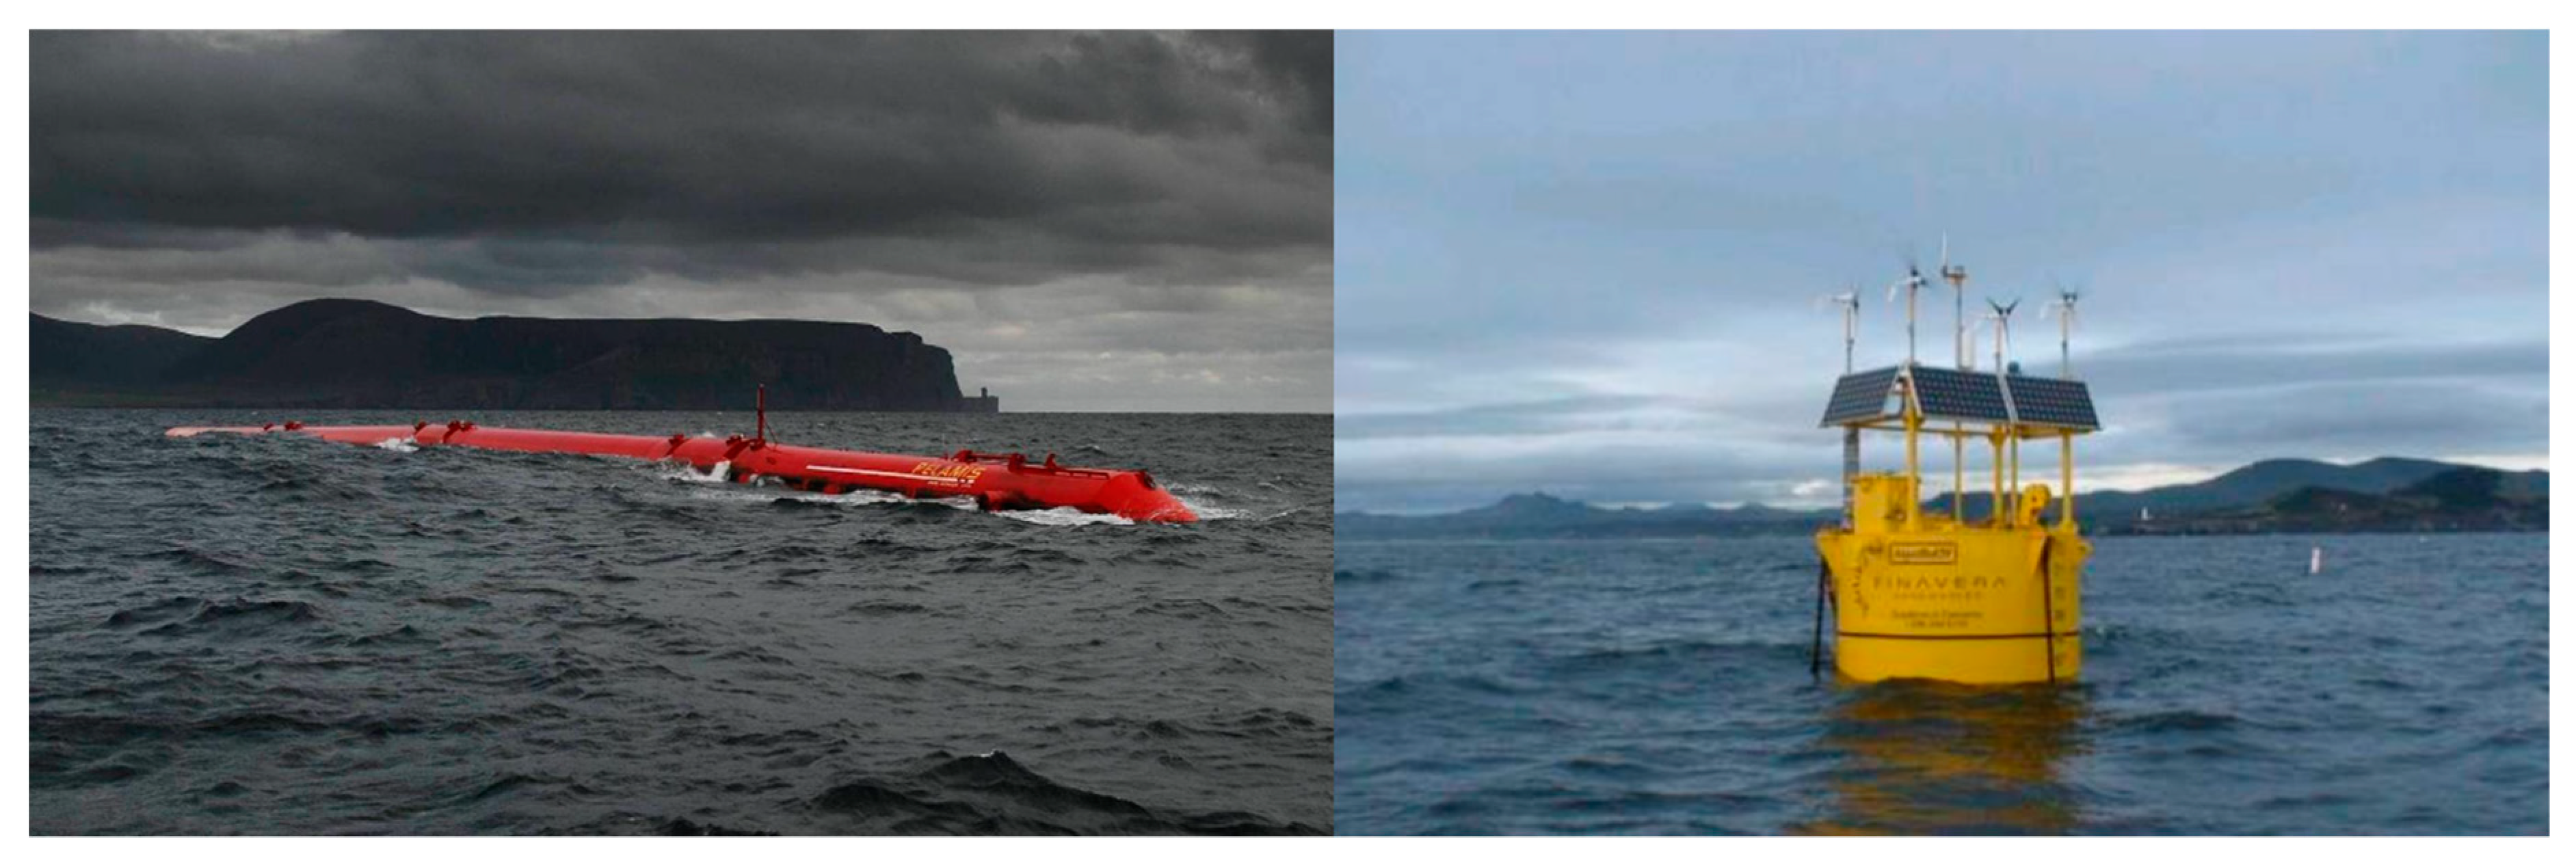
Within this study, two offshore WEC were considered: Pelamis and Aqua Buoy; see Figure 2. Considering the power matrices of different WECs, the authors concluded that Aqua buoy and Pelamis would be the most suitable locations to carry out investigations.
Pelamis is an offshore device that has a length of 150 m and a tube diameter of 4.63 m; it consists of four tubular sections which move relative to each other. These sections are connected by three hinges which convert the motion of the tubular sections. The mooring system for Pelamis consists of a three-point slack mooring configuration which allows it to turn into the wave direction within its mooring constraints. The rated power of Pelamis is 750 kW. Aqua Buoy is an offshore device that has buoy diameter of 6 m and a length of 30 m. It is a free-floating, heaving point absorber, which reacts against a submersed reaction tube. The mooring system for Aqua Buoy consists of three slack mooring configurations. The rated power of Aqua Buoy is 250 kW [35]. The power matrices for the two WECs are shown in Table A2 and Table A3 (Appendix A). The values in the first column and row therein are the mean values of certain classes.
Once the annual wave energy is obtained, i.e., , the average electric power is calculated as follows:
where is the number of hours in one year, i.e., 8760 h.
WEC performance is usually defined through the capacity factor, which is defined as follows [36]:
where is the rated power of certain WECs.
Besides the determination of the wave energy potential at certain locations, another important examination should be performed, i.e., the calculation of extreme sea states [22]. Thus, the long-term performance of WECs is dependent on the occurrence of extreme sea states at a given location. Therefore, a structural reliability assessment should include the determination of the most probable extreme significant wave height which will occur at the location where the WEC is installed over a certain return period, i.e., during the lifetime of the WEC [37]. Within this paper, the 3-parameter Weibull probability density function (PDF) is used as a marginal PDF of :
where is the shape, is the scale and is the location parameter. These parameters are obtained from the data outputs using the least squares method, as explained in [34,38].
Cumulative distribution function (CDF) for the 3-parameter Weibull PDF can be obtained as follows:
Once the 3-parameter Weibull PDF is fitted for a certain location, which is PDF for a random variable , the probability of exceeding certain in a particular return period (RP) can be obtained as follows [34,38]:
where is the duration of uninterrupted observation and is the number of samples, i.e., the total sum of output data as given in the wave scatter diagrams.
The value of a certain significant wave height being exceeded in specific RP can be obtained as follows [34,38]:
It should be noted that should be at least 20% of RP [27]. Since, for this study is 23.5 years, can be calculated for RP for up to 117.5 years.
2.2. Offshore Wind Energy Potential
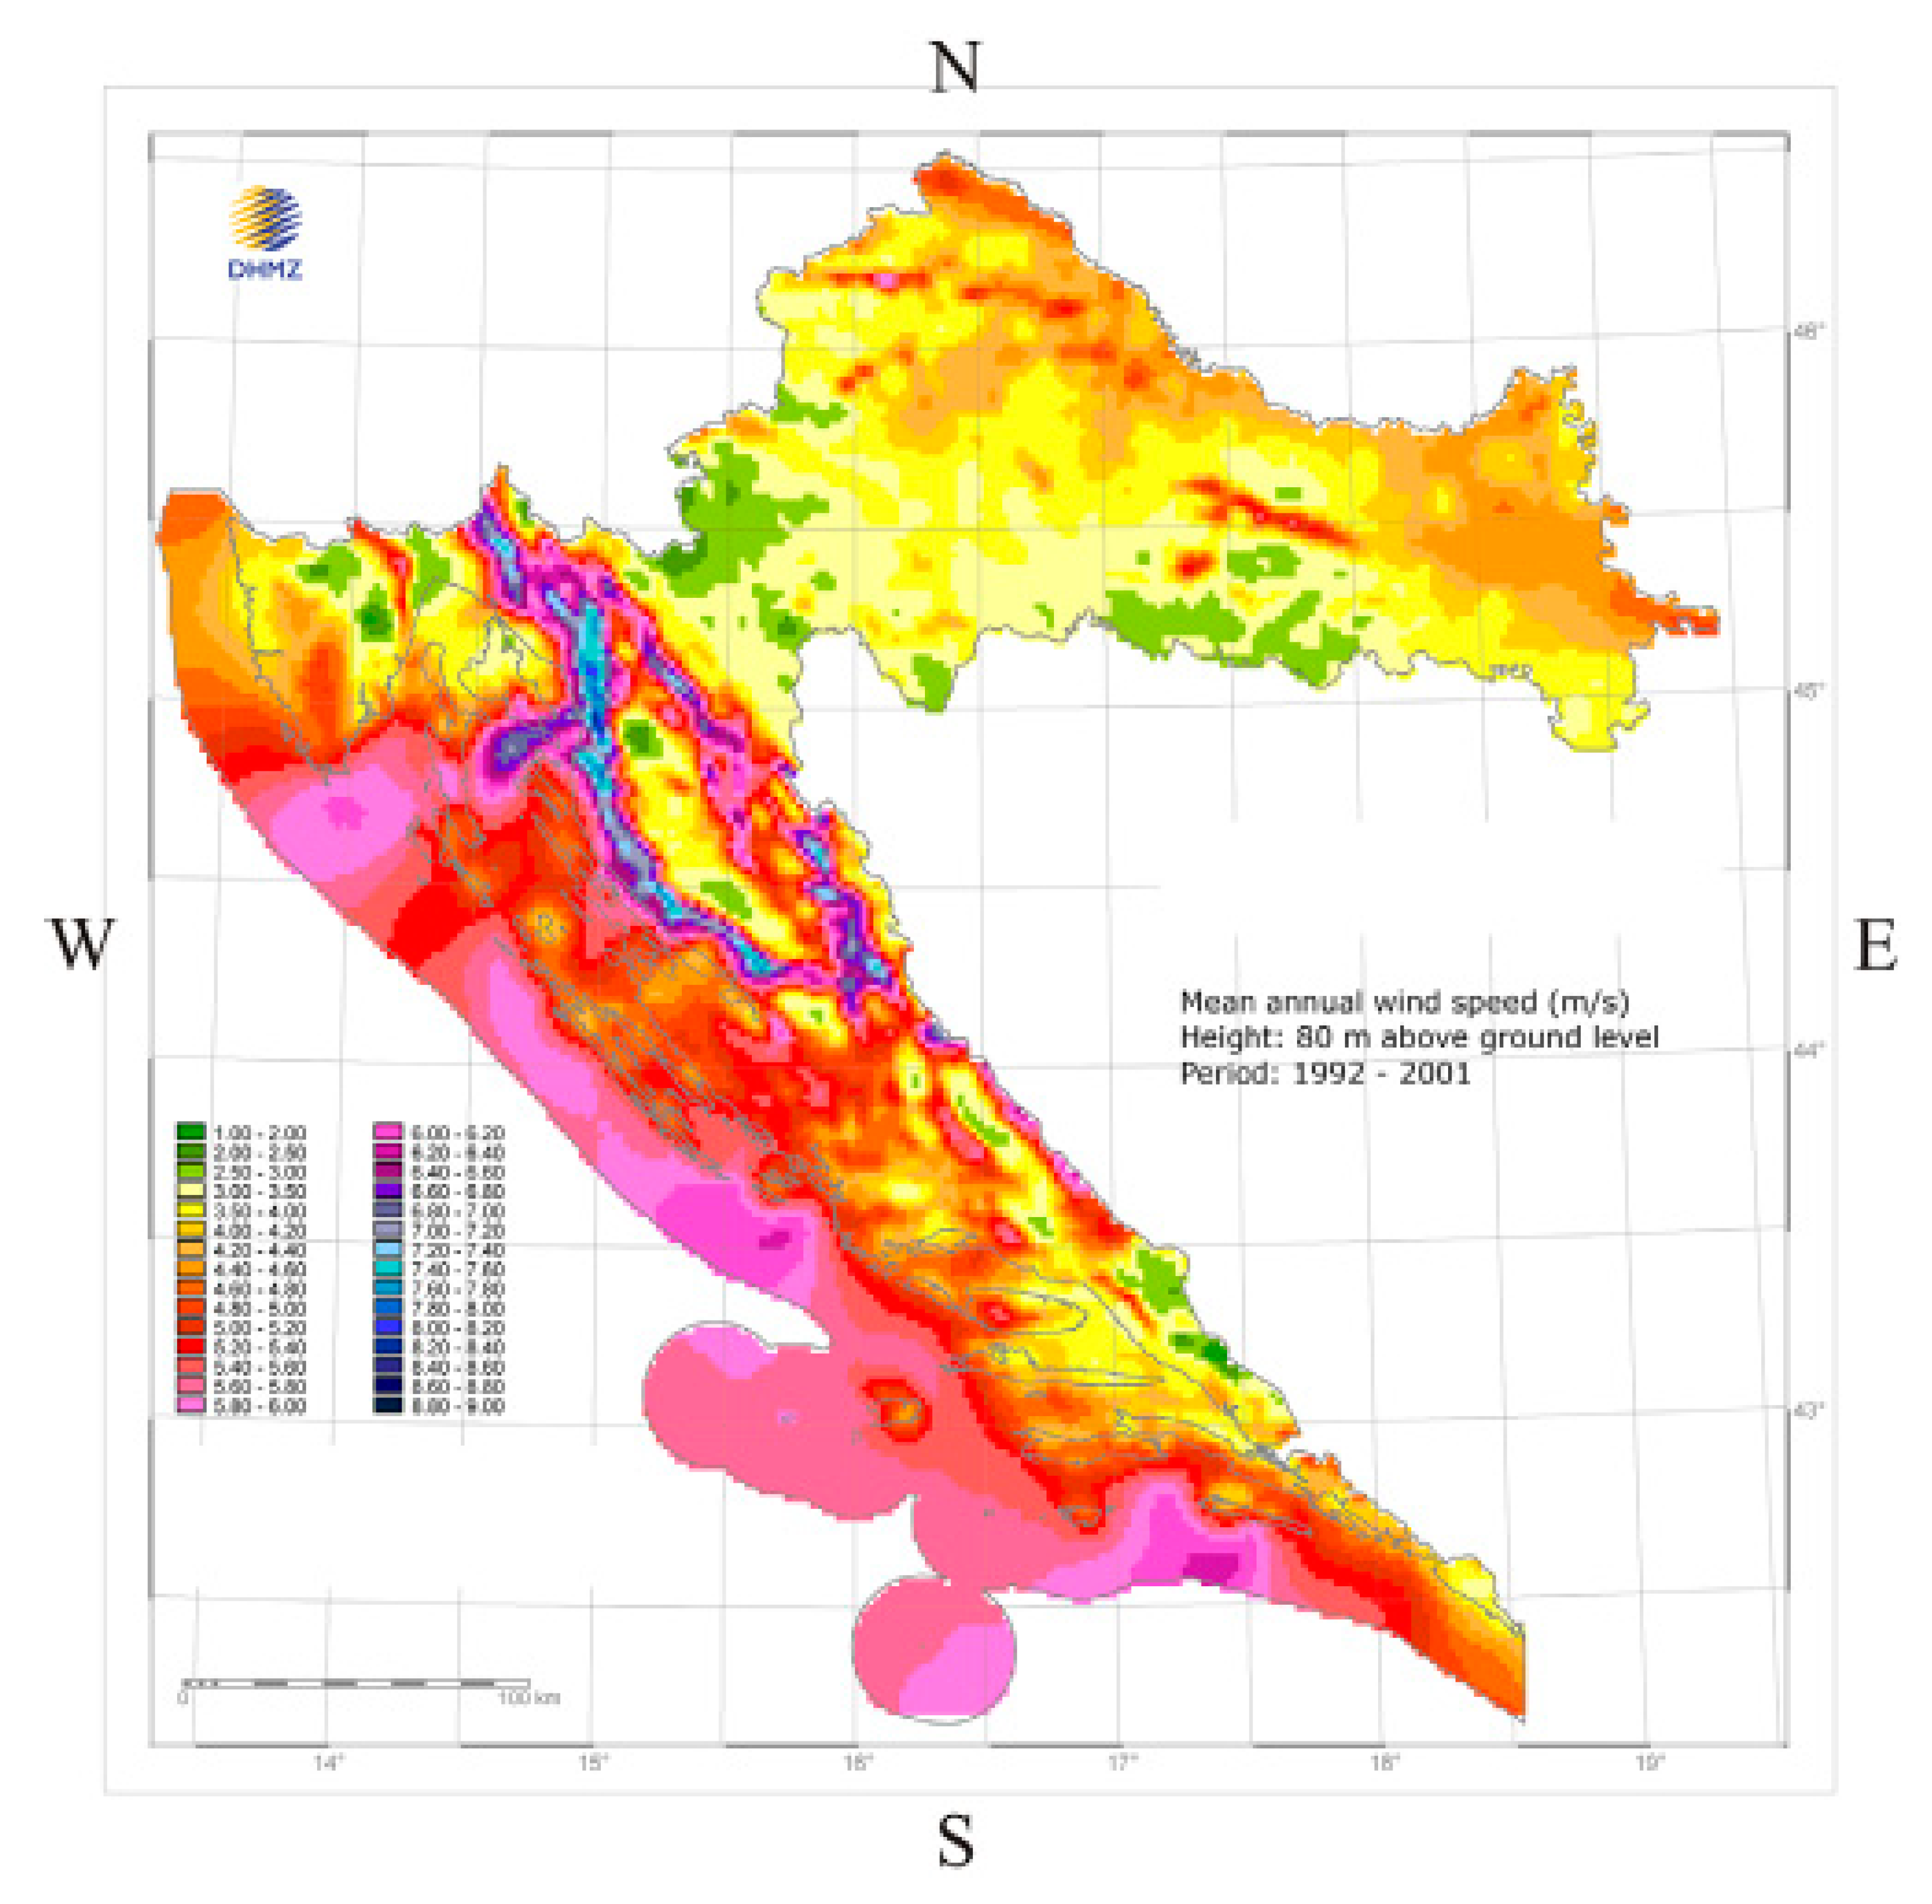
Even though the primal goal of this study was to investigate the wave energy potential in the Adriatic Sea, offshore wind energy potential for seven selected locations was also assessed, in order to make comparison between the two renewable energy resources. The wind energy potential estimation is based on the computational atmosphere model ALADIN (Aire Limitée Adaptation Dynamique développement InterNational). ALADIN is used for the prediction of heavy precipitation, intensive convection and strong winds, but also for research purposes [39]. Within this paper, an average wind speed at 80 m height is estimated according to ALADIN [40] for a one-year period in a square area, as done in [39]; see Figure 3. Within this study, a wind turbine, the HQ 2000/WT 93, with a diameter of 93.2 m, is used for the assessment of the wind potential [41].
The average electrical power produced by one offshore wind turbine can then be determined as follows [39]:
where is the area of wind turbine rotor, is the air density and is the power coefficient, i.e., 0.4.
Offshore wind turbines have some benefits over land wind turbines because of a nearly flat sea surface. Thus, almost constant average wind velocity at hub height is present, as well as weak atmospheric turbulence. Therefore, these turbines have higher operating efficiencies and lower structural fatigue. It should be noted that the lower operating is 5 m/s [39].
3. Results and Discussion
3.1. Offshore Wave Energy Potential
Data outputs for the aforementioned locations in the Adriatic Sea are used for the creation of wave roses, wave power diagrams, and for the characterisation of the yearly energy. Also, a statistical analysis of the waves is performed. The obtained results, regarding mean values and standard deviations for both and , are shown in Table 2. The results are shown for annual and seasonal levels. The mean values of wave power are also shown.
As shown in Table 2, the annual mean wave power for the seven analysed locations ranges from 1.959 kW/m to 2.784 kW/m. The highest annual value of was obtained for L6, located to the south-east of the island of Lastovo; almost the same annual value of was obtained at location L5, located to the south-west of the island of Lastovo. Furthermore, only a slightly lower annual was obtained at locations L4 and L7, located to the west of the island of Svetac and south of the island of Mljet. Locations L1 and L3, located to the west of the island of Susak and south-west of the island of Žirje had an annual value of near 2 kW/m, while location L2, located to the west of the island of Dugi otok had slightly higher annual . Mean annual values of range from 0.746 m to 0.879 m, while standard deviations of at the analysed locations ranged from 0.560 to 0.630 m. Mean annual values of ranged from 3.586 to 4.182 s, while ranged from 0.932 to 1.502 s. It should be noted that the highest values of for all locations were obtained in the winter, with the highest being obtained for L6, i.e., 4.351 kW/m. Slightly lower values of were noted in the autumn, while in the spring, the was more than half that in the winter for all locations. The lowest values of were obtained in the summer time, when values were mostly below 1 kW/m. For all the investigated locations, relatively high standard deviations were obtained compared to mean values. The predictability of the annual electrical energy, which can be determined from Equation (6), is not affected by higher values of standard deviations, as each sea state is divided into classes.
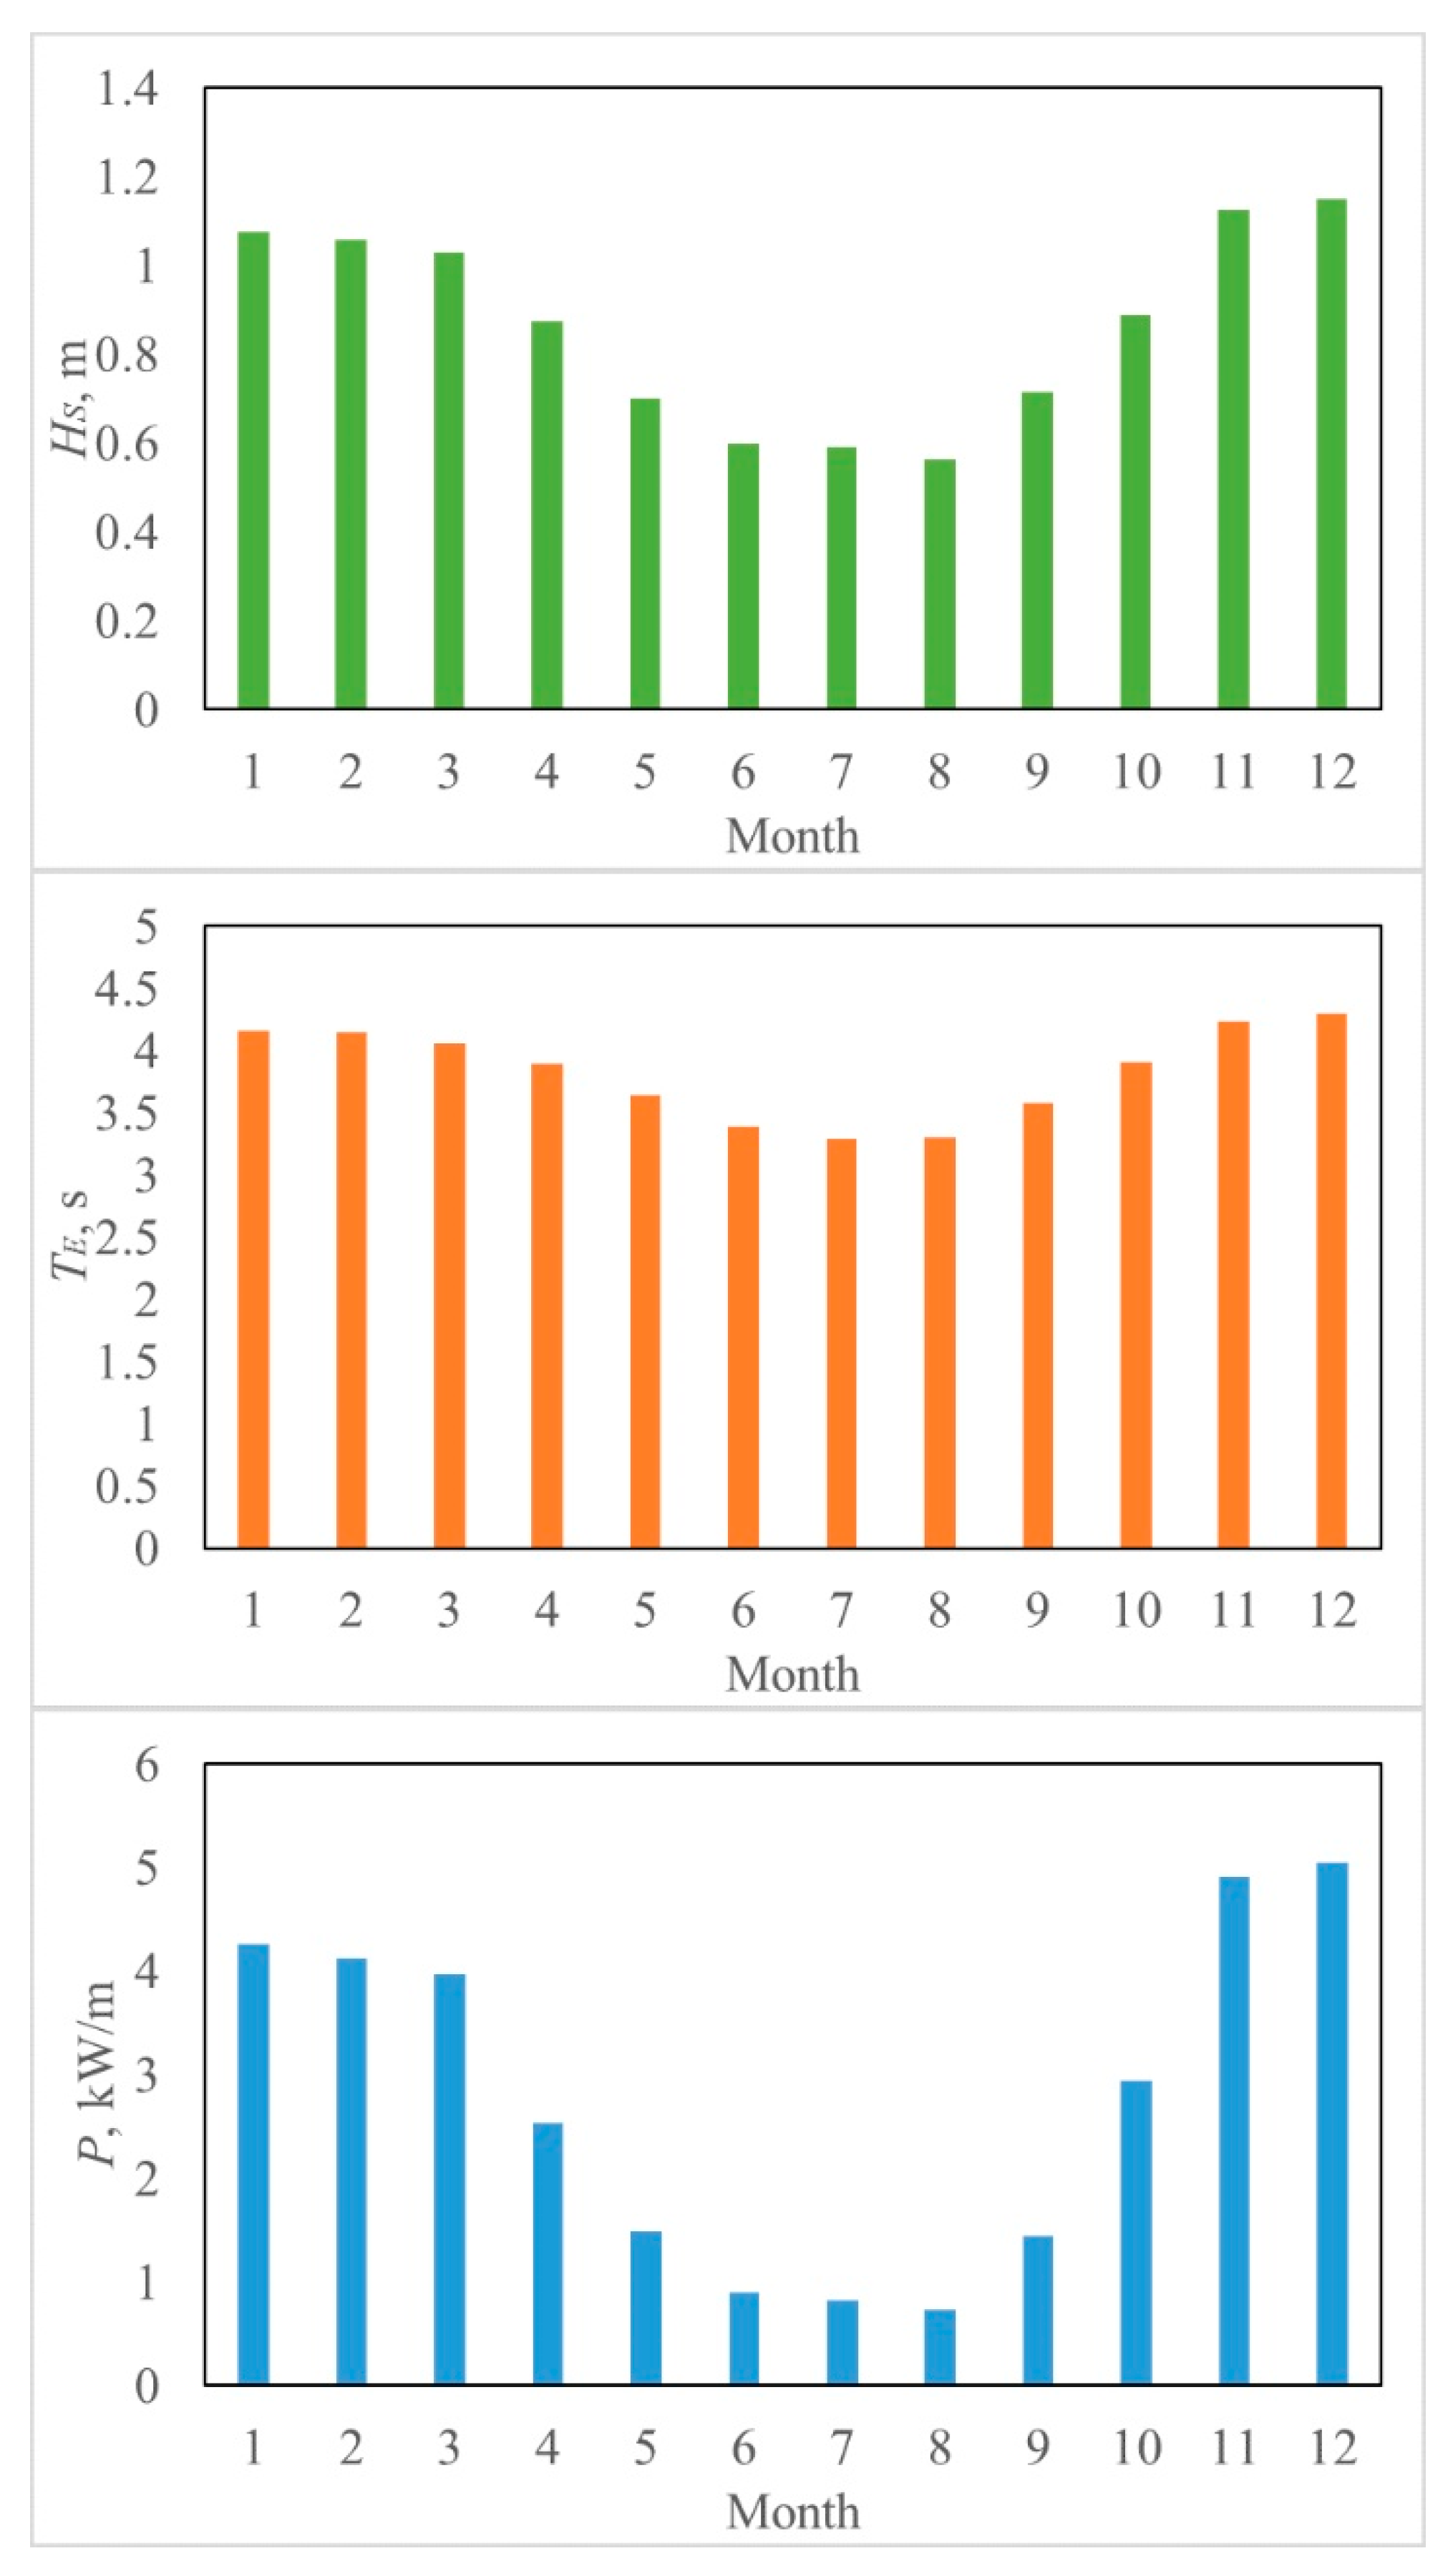
The monthly mean values of , and were calculated for all locations. At locations L5 and L6 in January, February, March, November and December, was equal to or above 4 kW/m, while for L7, similar results were obtained, except for March, where slightly lower was obtained. Generally, during those months at all analysed locations, had a higher value than for other months. Only locations L5, L6 and L7 had values above 5 kW/m in December, with the highest being obtained at location L7, i.e., 5.068 kW/m. In Figure 4, the monthly mean values of , and at location L6 are shown. It can be seen from this figure that varies more than , thus causing the variation of .
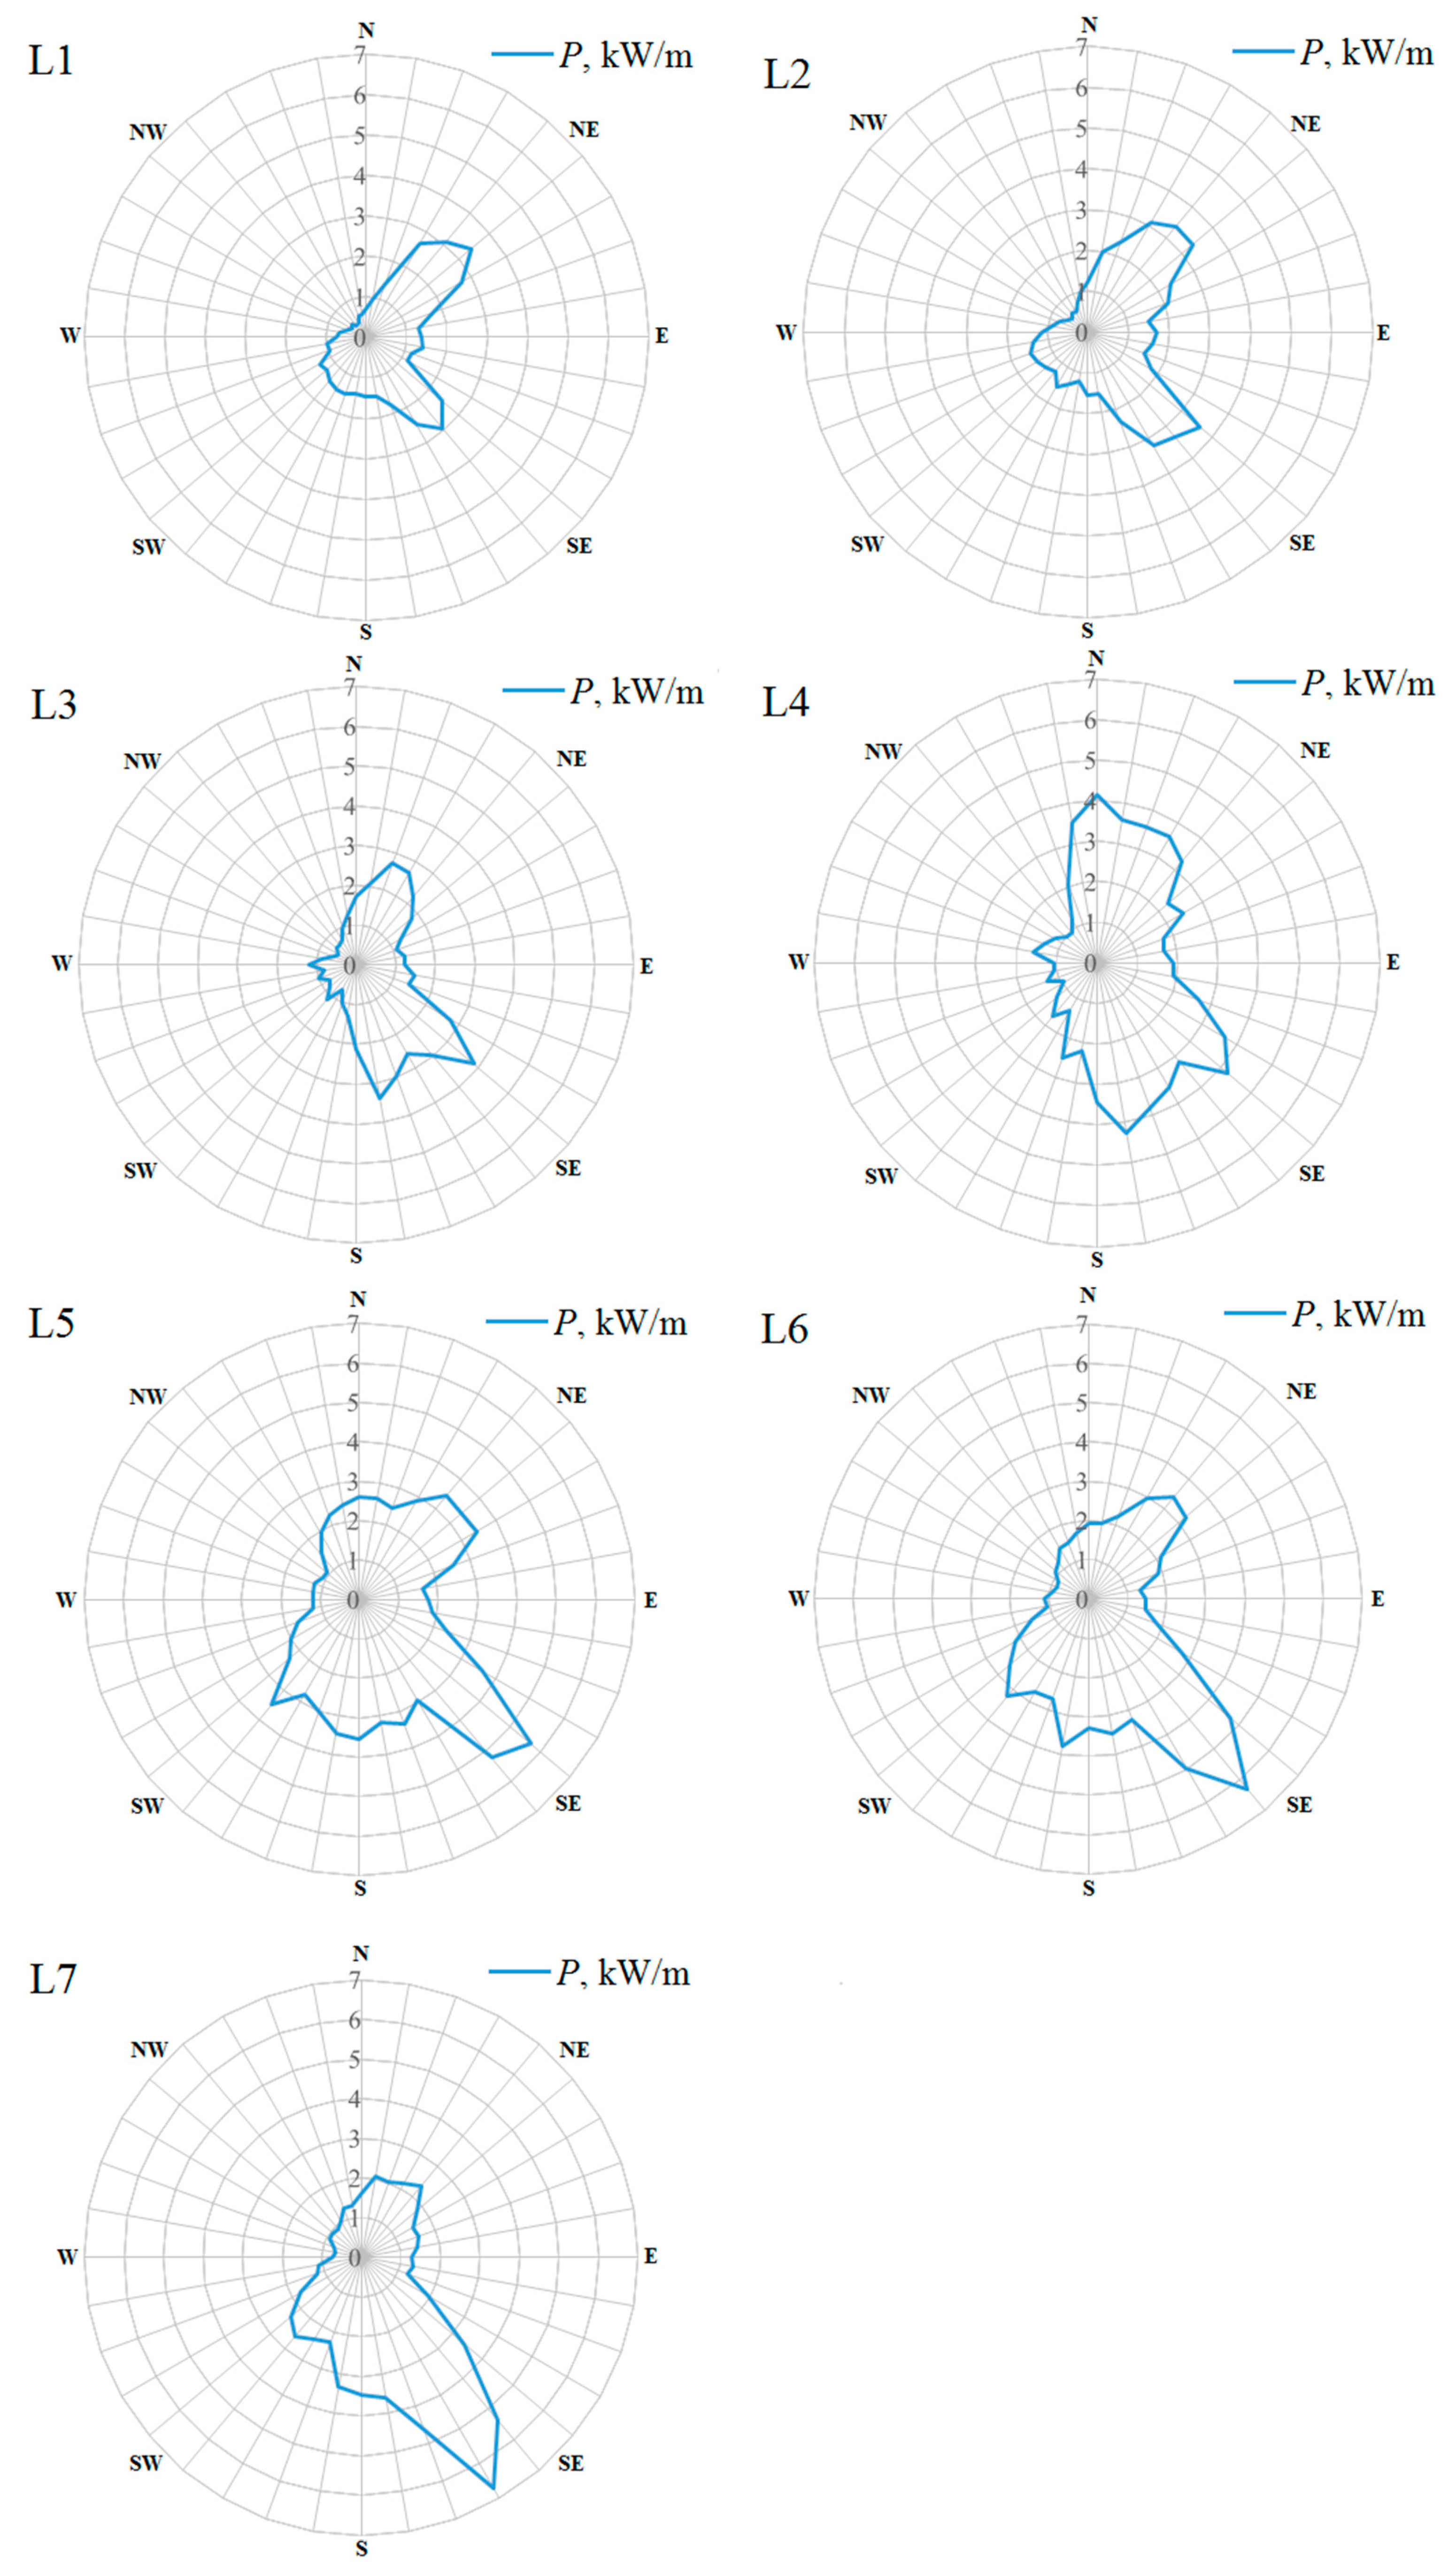
Furthermore, wave rose diagrams were made for all the investigated locations; see Figure 5. In order to make those diagrams, data outputs were sorted into classes of mean wave angles with . As shown in Figure 5, the bulk of wave power for most locations resulted from south-easterly (SE) waves, especially for L5, L6 and L7. However, for L1 and L2, the bulk of the wave power was provided by north-easterly (NE) waves. It should be noted that dominant winds which cause wind waves in the Adriatic Sea are “jugo” (SE) and “bura” (NE). These winds can reach storm conditions and induce extreme wave occurrences. At location L4, the bulk of the wave power was produced by northerly, south-easterly and southerly waves. Thus, it can be considered that this location has wave power which is supplied with the largest wave angle distribution. Significantly higher wave power is present at locations L5, L6 and L7 due to south-easterly waves, compared to the wave power present due to north-easterly waves at L1 and L2. Within this study, the bivariate distribution of wave energy production is investigated, i.e., the production of electrical energy depends solely on the significant wave height, energy period and certain sea state occurrences. However, for the implementation of WEC at certain locations, the direction and spreading of waves are very important factors as well. In other words, wave energy production depends on the directionality of the resource as well. Thus, depending on the wave direction, in order to enhance the electricity production, WEC should be directed optimally. Therefore, it would be beneficial to include operational characteristics which are able to optimise the production of the electrical energy [27].
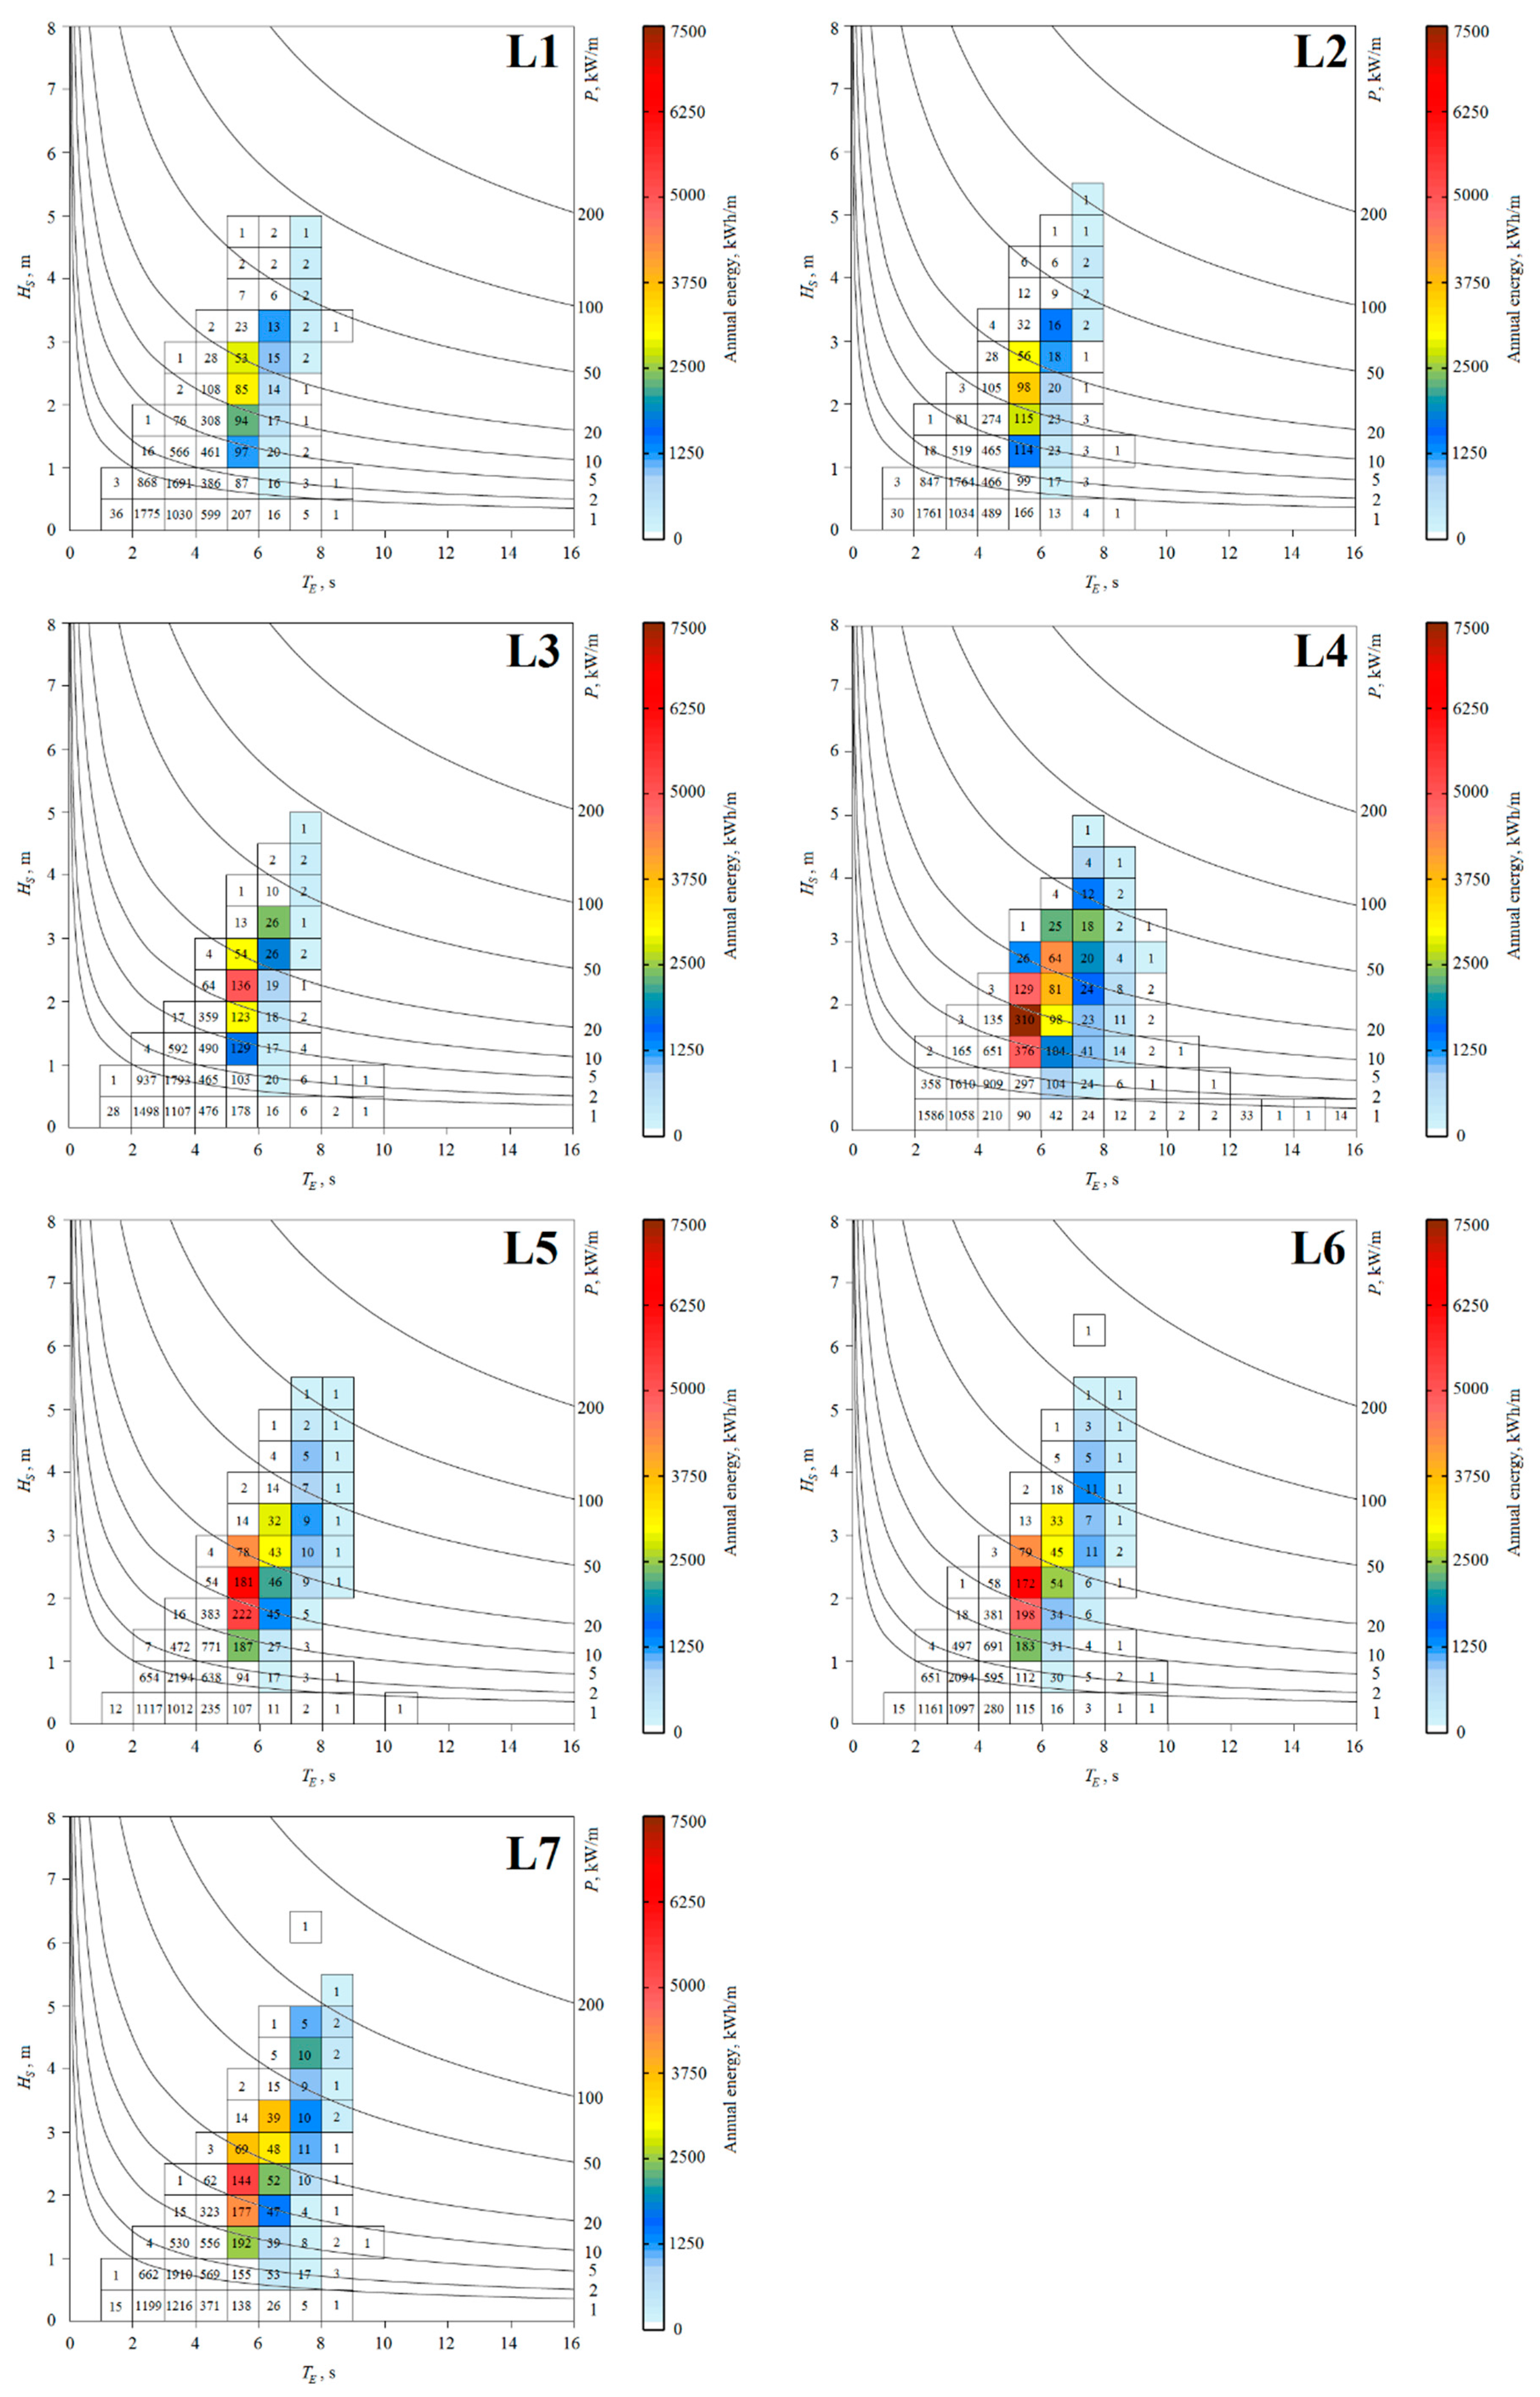
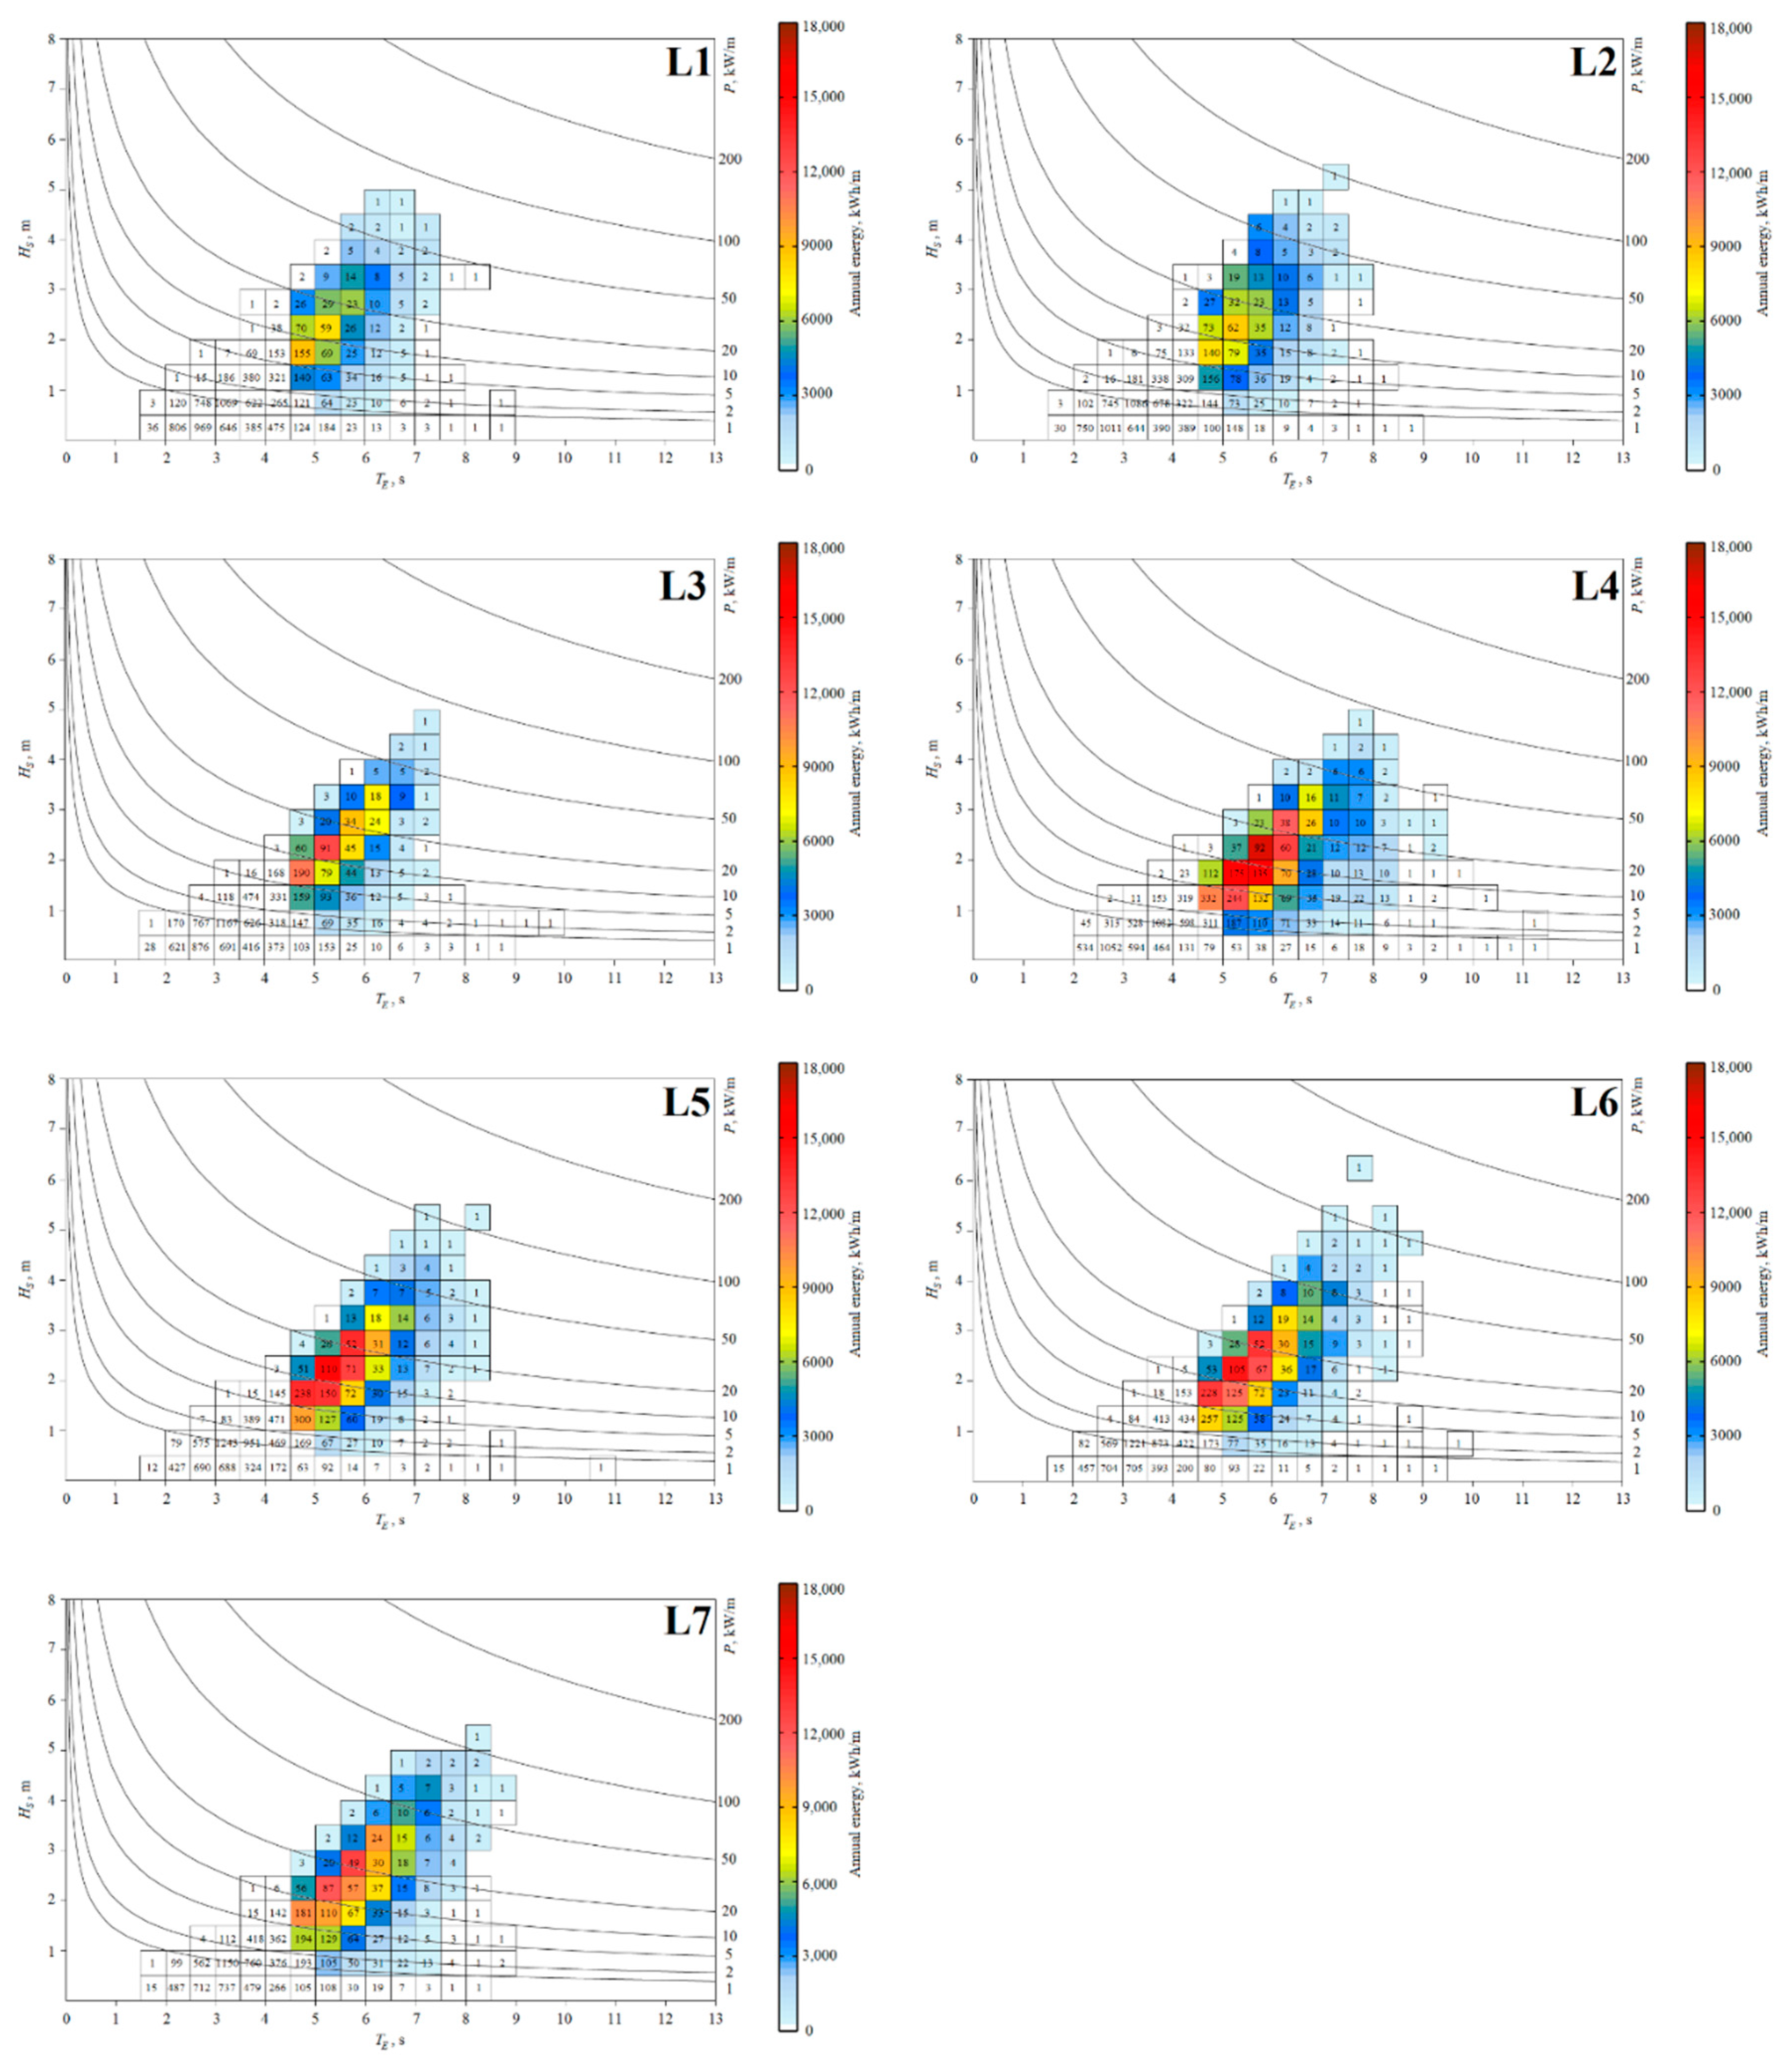
Characterisation of mean yearly wave energy was obtained for seven locations in the Croatian part of the Adriatic Sea and for two offshore WECs; see Table 3 and Figure 6 and Figure 7. Within Figure 6 and Figure 7, the number inside each bin signifies the number of hours during one year of a certain sea state. The mean annual energy per meter is represented with the colour of each bin; furthermore, the lines shown in those figures represent wave power isolines.
Even though the highest mean wave power was obtained at location L6, the highest mean yearly wave energy for both Aqua Buoy and Pelamis was obtained at location L4. This can be attributed to a more favourable wave scatter diagram for L4 than for other locations. Obviously, at location L4, sea states which produce more electricity occur more often than at location L6; i.e., at L4, sea states with higher occur more frequently, thus producing more electricity, as in higher classes power output () is higher. At L4, the mean yearly wave energy for Aqua Buoy was thus 49.24 MWh, and for Pelamis, 229.06 MWh. Locations L4, L5 and L6 have almost the same for both WECs, while a significantly lower was obtained at locations L1, L2 and L3. When compared to the obtained along the Portuguese nearshore [31], location L4 had around six times lower for Aqua Buoy and approximately four times lower for Pelamis, while the along the Atlantic coast of Morocco was approximately two to four times higher for Pelamis [14].
As shown in Figure 6, the maximum energy for Aqua Buoy was concentrated in the bins with = 1.5–2 m and = 5–6 s at location L4, while for other locations this maximum was concentrated in the bins with = 2–2.5 m and = 5–6 s. From Figure 7, it can be seen that the maximum energy for Pelamis was concentrated in the bin with = 2–2.5 m and = 5–5.5 s at locations L2–L6, in the bin with = 1.5–2 m and = 4.5–5 s for L1, in the bin with = 2–2.5 m and = 5.5–6 s for L4 and in the bin with = 2.5–3 m and = 5.5–6 s for L7.
Capacity factors were calculated for annual and seasonal levels, as shown in Table 4. This parameter takes into account the fraction of time in which WEC operates at full capacity. As shown in Table 4, low Cf were obtained for both WECs. Higher Cf were obtained for Pelamis, thus showing that it would be more suitable for the wave climate present in the Croatian part of the Adriatic Sea. The higher Cf obtained for Pelamis can be attributed to its power matrix, i.e., Pelamis can produce electrical energy for lower , which is present in the Croatian part of the Adriatic Sea. The highest annual Cf was obtained for Pelamis at L4: 3.49%. From Table 4, it can be seen that significant seasonal variability occurs at each investigated location. Thus, in the summer, the Cf of Aqua buoy was below 0.5%, while that of Pelamis was below 0.8%. On the other hand, for the autumn/winter, the Cf of Aqua buoy was below 3.81% and that of Pelamis was below 5.73%. It can be concluded that the bulk of the energy would be generated in the autumn and winter.
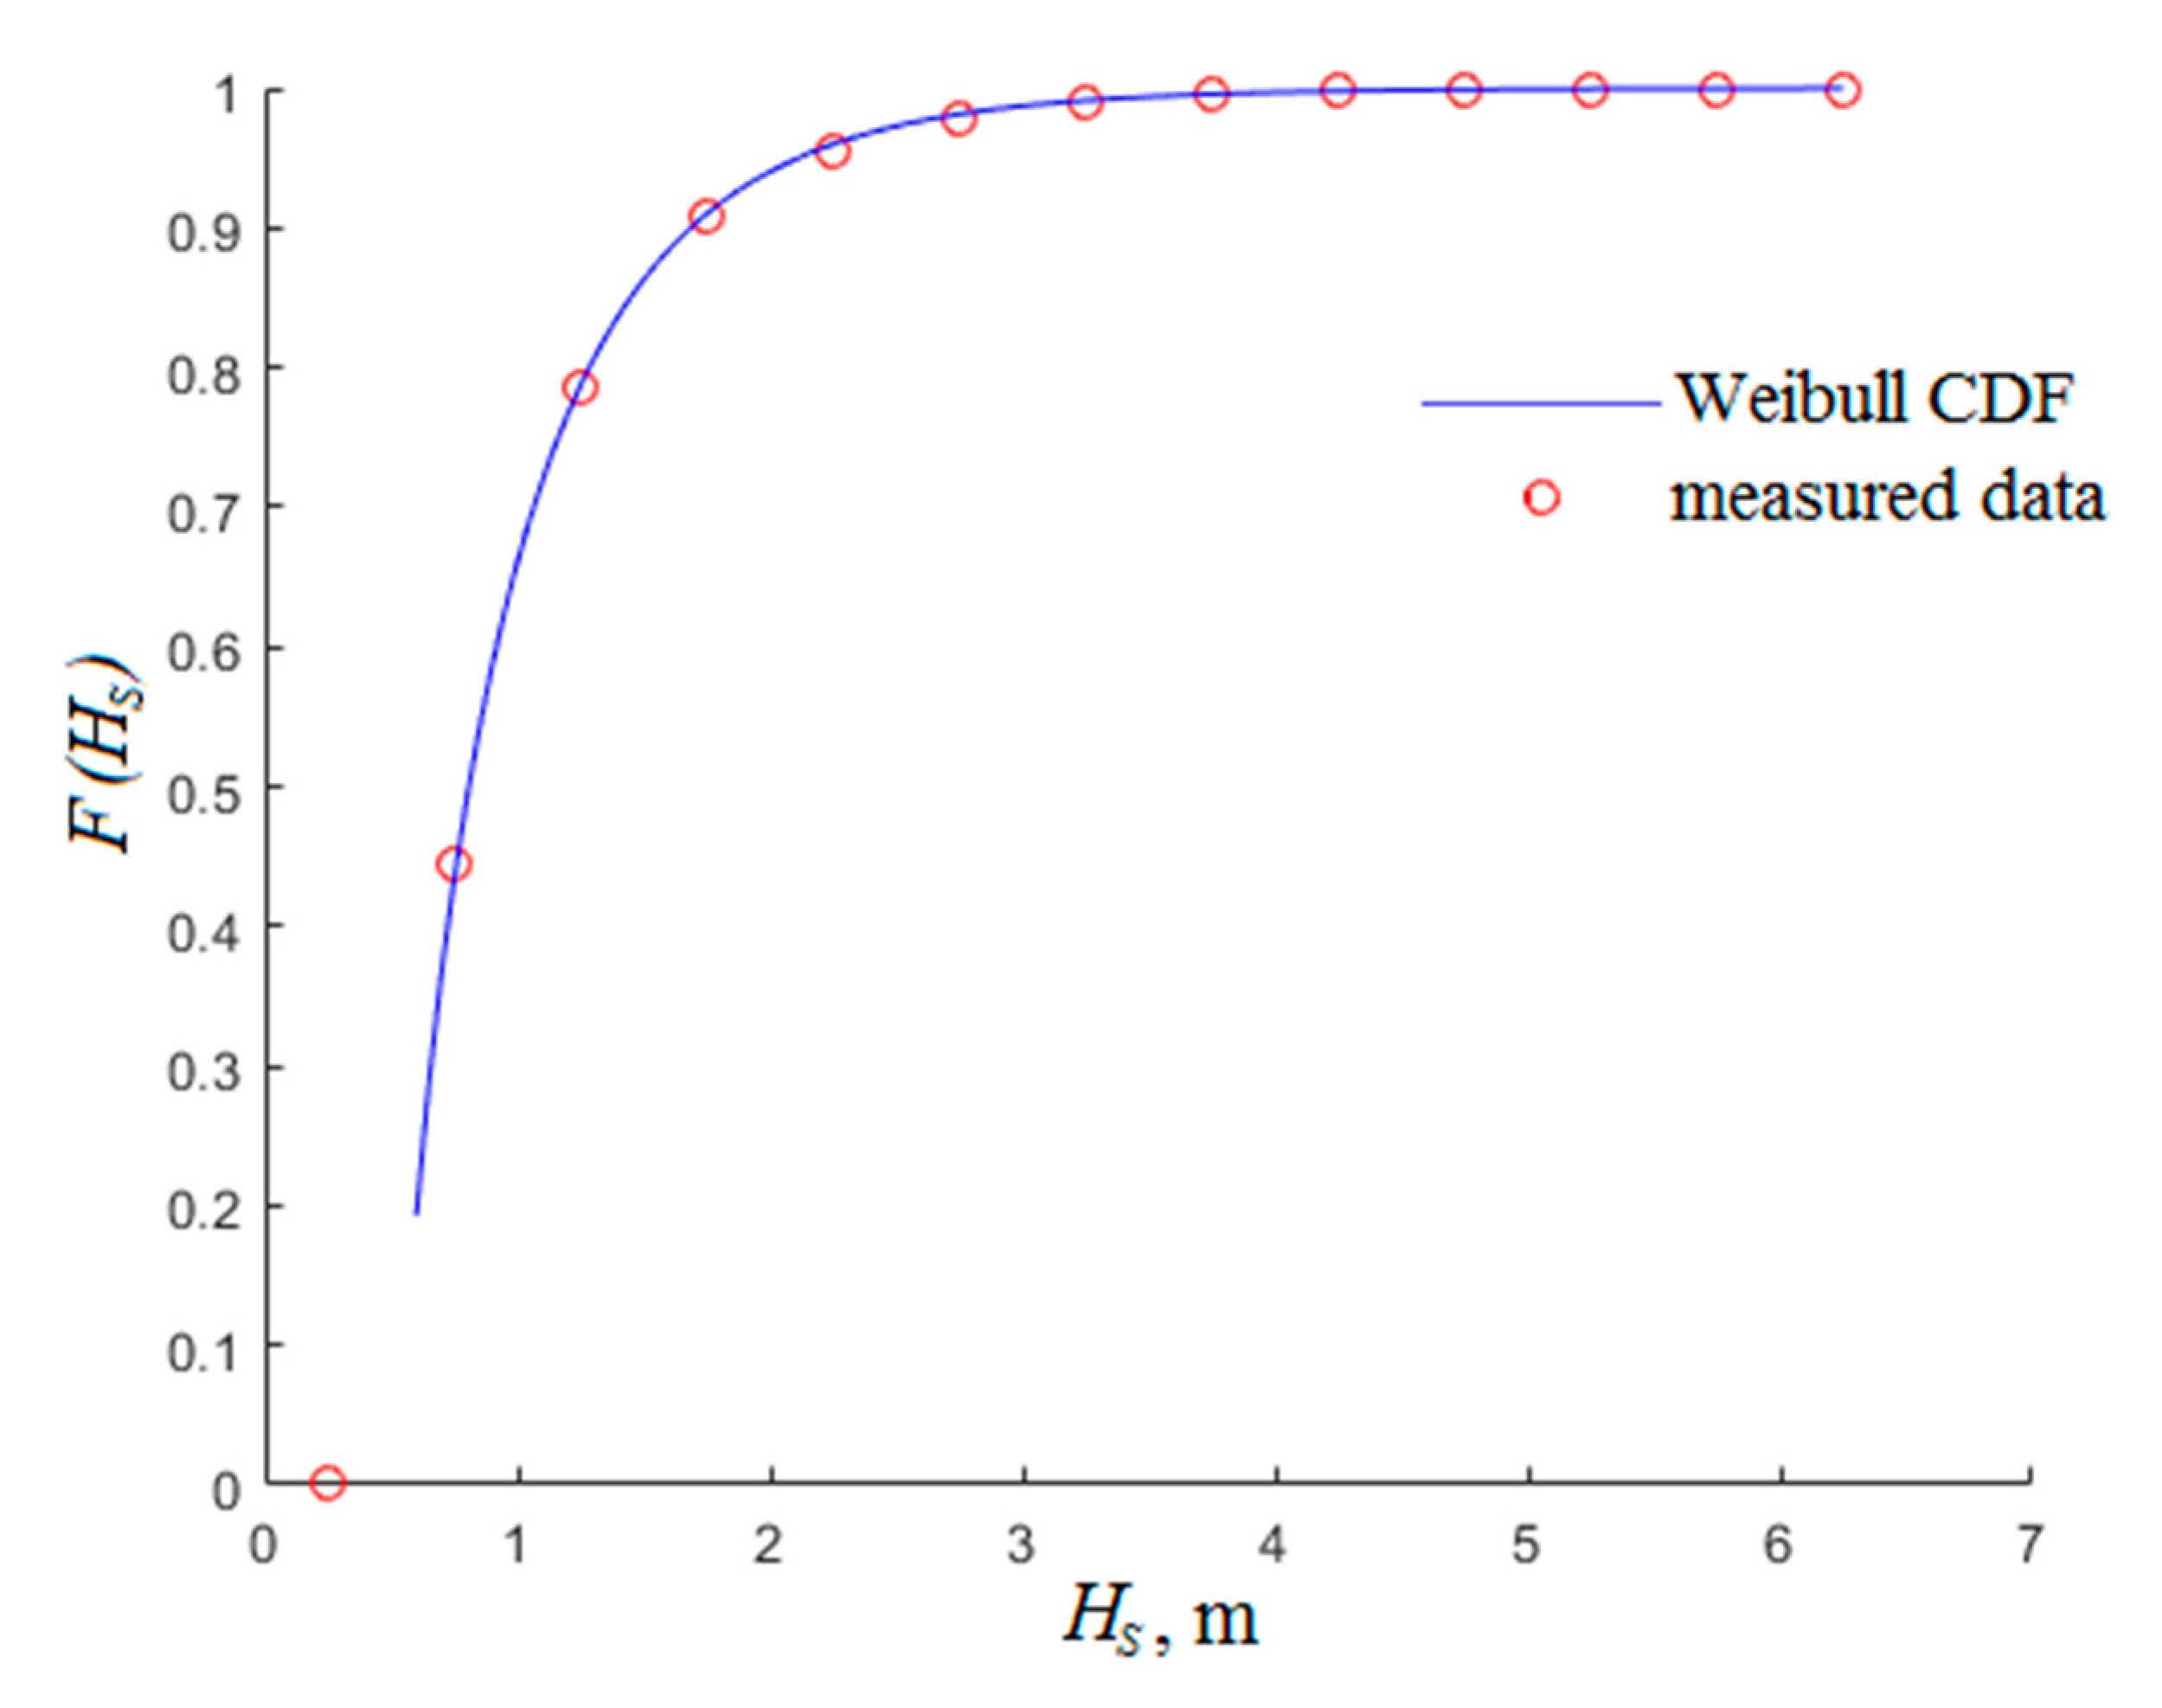
Beside the assessment of wave energy potential in the Croatian part of the Adriatic Sea, an extreme value analysis was performed for the following return periods: 1, 5, 10, 20, 50 and 100 years. Therefore, the 3-parameter Weibull PDF was derived for each investigated location in order to represent PDF for . The obtained Weibull parameters are shown in Table 5 for each location.
A comparison between measured data and the obtained 3-parameter Weibull CDF for L5 is shown in Figure 8. It should be noted that Weibull CDF cannot be fitted for classes which have mean value of class () lower than . Thus, Weibull CDF was not fitted to the lowest class, which has a of 0.25 m. As shown in Figure 8, the 3-parameter Weibull CDF credibly describes measured data, and therefore, can be used for extreme value analyses. The obtained extreme values of at the investigated locations are shown in Table 6.
The obtained extreme values for RP = 20 years were compared with the measured data. Namely, since waves were measured for 23.5 years, the maximum value of at certain location is shown in Table 6 as well. As shown in Table 6, the obtained extreme values of show satisfactory agreement with the measured values. However, for a more reliable comparison, the obtained extreme values should be compared with in situ measurements using buoys at those locations. Based on the obtained extreme values, it can be concluded that the most severe conditions occurred at L7, with a of 8.038 m. Even though L4 has the most favourable wave energy potential, the obtained extreme values at this location were second lowest of all the investigated locations. Thus, the obtained at L4 was 6.934 m, while the was 6.557 m. Therefore, considering that WECs are usually designed for the return period of 20 to 40 years, the potential infrastructure costs in terms of the structural reliability could be lower [30].
3.2. Offshore Wind Energy Potential
In order to investigate the feasibility of harvesting wave energy in the Croatian part of the Adriatic Sea, the offshore wind energy potential was assessed. The obtained results are presented in Table 7.
As shown in Table 7, the annual wind energy is one order of magnitude larger than the annual wave energy in the Croatian part of the Adriatic Sea. Furthermore, the cost of offshore wind energy per MWh is lower than the cost of offshore wave energy per MWh [42]. Thus, it can be concluded that at present, wave harvesting in the Croatian part of the Adriatic Sea is not economically justifiable. One of the reasons for this can be attributed to the limited fetch length which prevents full development of the sea. Thus, even though the strong winds over the Adriatic Sea can reach storm conditions, the sea will not develop fully as it would in non-limited fetch areas. Therefore, waves have lower energy, i.e., lower wave energy periods. Namely, the mean annual values of at the investigated locations are in the range from 3.5 to 4.2 s. For example, the mean annual along the shore of Santa Catarina in Brazil, where the fetch length is not limited [13], is approximately 9.5 s. This leads to significantly higher wave energy potential. Also, since the Adriatic Sea is a semi-enclosed sea, swells are quite low. For that reason, the wave height is mainly due to wind, and as mentioned, due to limited fetch, the sea cannot be fully developed.
4. Conclusions
The offshore wave energy potential was assessed at seven locations in the Croatian part of the Adriatic Sea utilising satellite measurement data. This data was used for the creation of wave roses, wave power diagrams and for the characterisation of the yearly energy. The mean yearly wave energy was calculated for two offshore WECs, i.e., Aqua Buoy and Pelamis. Furthermore, an extreme value analysis was performed utilising statistical analyses of waves. Among the investigated locations, L4 appeared to be the best for wave harvesting, even though the highest mean wave power was obtained at location L6. This is attributed to the more energetic sea states at location L4 compared to L6. What is more, the extreme value analysis showed that L4 had second lowest extreme values of , which is important for structural reliability. The bulk of the wave power at locations L3, L5, L6 and L7 comes from south-easterly waves, at locations L1 and L2 from north-easterly waves, and at location L4 from northerly, south-easterly and southerly waves. Seasonal variability of the wave power at all locations is highlighted with the highest wave power present in the winter, and only slightly lower wave power present in the autumn. However, in the spring, wave power is less than half that of the winter, and in the summer, it is even lower. The mean yearly wave energy for Aqua Buoy at L4 was approximately 50 MWh, while that of Pelamis was approximately 230 MWh. Locations L5, L6 and L7 had a of around 37 MWh for Aqua Buoy and around 200 MWh for Pelamis. Locations L1, L2 and L3 had a significantly lower : for Aqua Buoy below 20.5 MWh and for Pelamis below 125 MWh. In order to evaluate the WEC performance, capacity factors were estimated for annual and seasonal levels. Low capacity factors were obtained for both the investigated WECs, and the higher capacity factors were obtained for Pelamis. Significant variation regarding seasonal performance was noticed, e.g., the autumn and winter capacity factors were higher than in the spring and summer. It should be noted that within this study, Aqua buoy, which has diameter of 6 m and a draught of 30 m, as well as Pelamis, which has a length of 150 m and a diameter of 4.63 m, were investigated. Since low capacity factors were obtained, it would be beneficial to investigate the performance of smaller rated devices at the investigated locations. Thus, the investigated WECs should be down-scaled, and the associated power matrix could be determined using Froude similarity, which is commonly done in physical modellings of WECs [29]. Down-scaled WECs would have higher capacity factors, as their idle period would be reduced, and therefore more suitable and favorable for the application. Smaller WECs could produce electricity at lower sea states, which are dominant in the Croatian part of the Adriatic Sea. Therefore, the investigation of the application of smaller WECs in the Croatian part of the Adriatic Sea and the determination of the optimum scale for these locations will form the basis for future work.
The obtained at the investigated locations were compared with the mean yearly wind energy; it was shown that wind energy is one order of magnitude higher than wave energy. This was attributed to the strong winds present in the Adriatic Sea, which, due to limited fetch, cannot fully develop in the sea. Also, since the Adriatic Sea is a semi-enclosed sea, swells are quite low. Therefore, waves in the Croatian part of the Adriatic Sea have small wave energy periods. It should be noted that wave energy harvesting is still at the early stages of development, and therefore, a potential solution for the acceleration of its development is the combination of two different energy resources. Thus, wind-wave farming could compensate for wind variability and allow continuous energy harvesting to occur.
Author Contributions
The research team works in a collaborative manner and all the authors have contributed in all the sections of the present manuscript.
Funding
This research received no external funding.
Acknowledgments
This study has been supported by the Croatian Science Foundation under project 8658. The WorldWaves data used in the paper is supplied by Fugro OCEANOR AS.
Conflicts of Interest
The authors declare no conflict of interest.
Appendix A

Table A1.
WWA wave and wind parameters.
| Significant wave height | , m |
| Mean wave direction | , ° |
| Peak period of 1D spectra | , s |
| Mean wave period/Energy period | , s |
| Significant wave height of wind waves | , m |
| Mean direction of wind waves | , ° |
| Mean period of wind waves | , s |
| Significant wave height of primary swell | , m |
| Mean direction of primary swell | , ° |
| Mean period of primary swell | , s |
| Wind speed at 10 m height | , m/s |
| Wind direction at 10 m height | , ° |
Table A2.
Power matrix for WEC Aqua Buoy [31].
Table A2.
Power matrix for WEC Aqua Buoy [31].
| 5.5 | 6.5 | 7.5 | 8.5 | 9.5 | 10.5 | 11.5 | 12.5 | 13.5 | 14.5 | 15.5 | 16.5 | |
| 0.75 | 0 | 8 | 11 | 12 | 11 | 10 | 8 | 7 | 0 | 0 | 0 | 0 |
| 1.25 | 13 | 17 | 25 | 27 | 26 | 23 | 19 | 15 | 12 | 12 | 12 | 7 |
| 1.75 | 24 | 30 | 44 | 49 | 47 | 41 | 34 | 28 | 23 | 23 | 23 | 12 |
| 2.25 | 37 | 47 | 69 | 77 | 73 | 64 | 54 | 43 | 36 | 36 | 36 | 19 |
| 2.75 | 54 | 68 | 99 | 111 | 106 | 92 | 77 | 63 | 51 | 51 | 51 | 27 |
| 3.25 | 0 | 93 | 135 | 152 | 144 | 126 | 105 | 86 | 70 | 70 | 70 | 38 |
| 3.75 | 0 | 0 | 122 | 176 | 198 | 188 | 164 | 137 | 112 | 91 | 91 | 49 |
| 4.25 | 0 | 0 | 223 | 250 | 239 | 208 | 173 | 142 | 115 | 115 | 115 | 62 |
| 4.75 | 0 | 0 | 250 | 250 | 250 | 250 | 214 | 175 | 142 | 142 | 142 | 77 |
| 5.25 | 0 | 0 | 250 | 250 | 250 | 250 | 250 | 211 | 172 | 172 | 172 | 92 |
Table A3.
Power matrix for WEC Pelamis [31].
Table A3.
Power matrix for WEC Pelamis [31].
| 4.75 | 5.25 | 5.75 | 6.25 | 6.75 | 7.25 | 7.75 | 8.25 | 8.75 | 9.25 | 9.75 | 10.25 | 10.75 | 11.25 | 11.75 | 12.25 | 12.75 | |
| 0.75 | 0 | 22 | 29 | 34 | 37 | 38 | 38 | 37 | 35 | 32 | 29 | 26 | 23 | 21 | 0 | 0 | 0 |
| 1.25 | 32 | 50 | 65 | 76 | 83 | 86 | 86 | 83 | 78 | 72 | 65 | 59 | 53 | 47 | 42 | 37 | 33 |
| 1.75 | 57 | 88 | 115 | 136 | 148 | 153 | 152 | 147 | 138 | 127 | 116 | 104 | 93 | 83 | 74 | 66 | 59 |
| 2.25 | 89 | 138 | 180 | 212 | 231 | 238 | 238 | 230 | 216 | 199 | 181 | 163 | 146 | 130 | 116 | 103 | 92 |
| 2.75 | 129 | 198 | 260 | 305 | 332 | 340 | 332 | 315 | 292 | 266 | 240 | 219 | 210 | 188 | 167 | 149 | 132 |
| 3.25 | 0 | 270 | 354 | 415 | 438 | 440 | 424 | 404 | 377 | 362 | 326 | 292 | 260 | 230 | 215 | 202 | 180 |
| 3.75 | 0 | 0 | 462 | 502 | 540 | 546 | 530 | 499 | 475 | 429 | 384 | 366 | 339 | 301 | 267 | 237 | 213 |
| 4.25 | 0 | 0 | 544 | 635 | 642 | 648 | 628 | 590 | 562 | 528 | 473 | 432 | 382 | 356 | 338 | 300 | 266 |
| 4.75 | 0 | 0 | 0 | 739 | 726 | 731 | 707 | 687 | 670 | 607 | 557 | 521 | 472 | 417 | 369 | 348 | 328 |
| 5.25 | 0 | 0 | 0 | 750 | 750 | 750 | 750 | 750 | 737 | 667 | 658 | 586 | 530 | 496 | 446 | 395 | 355 |
| 5.75 | 0 | 0 | 0 | 0 | 750 | 750 | 750 | 750 | 750 | 750 | 711 | 633 | 619 | 558 | 512 | 470 | 415 |
| 6.25 | 0 | 0 | 0 | 0 | 750 | 750 | 750 | 750 | 750 | 750 | 750 | 743 | 658 | 621 | 579 | 512 | 481 |
| 6.75 | 0 | 0 | 0 | 0 | 0 | 750 | 750 | 750 | 750 | 750 | 750 | 750 | 750 | 676 | 613 | 584 | 525 |
| 7.25 | 0 | 0 | 0 | 0 | 0 | 0 | 750 | 750 | 750 | 750 | 750 | 750 | 750 | 750 | 686 | 622 | 593 |
| 7.75 | 0 | 0 | 0 | 0 | 0 | 0 | 0 | 750 | 750 | 750 | 750 | 750 | 750 | 750 | 750 | 690 | 625 |
References
- Leeney, R.H.; Greaves, D.; Conley, D.; O’Hagan, A.M. Environmental Impact Assessments for wave energy developments–Learning from existing activities and informing future research priorities. Ocean Coast. Manag. 2014, 99, 14–22. [Google Scholar] [CrossRef]
- Monteforte, M.; Re, C.L.; Ferreri, G.B. Wave energy assessment in Sicily (Italy). Renew. Energy 2015, 78, 276–287. [Google Scholar] [CrossRef]
- Lehmann, M.; Karimpour, F.; Goudey, C.A.; Jacobson, P.T.; Alam, M.R. Ocean wave energy in the United States: Current status and future perspectives. Renew. Sustain. Energy Rev. 2017, 74, 1300–1313. [Google Scholar] [CrossRef]
- Kompor, W.; Ekkawatpanit, C.; Kositgittiwong, D. Assessment of ocean wave energy resource potential in Thailand. Ocean Coast. Manag. 2018, 160, 64–74. [Google Scholar] [CrossRef]
- Liang, B.; Shao, Z.; Wu, G.; Shao, M.; Sun, J. New equations of wave energy assessment accounting for the water depth. Appl. Energy 2017, 188, 130–139. [Google Scholar] [CrossRef]
- Franzitta, V.; Curto, D. Sustainability of the renewable energy extraction close to the Mediterranean Islands. Energies 2017, 10, 283. [Google Scholar] [CrossRef]
- Bento, A.R.; Martinho, P.; Soares, C.G. Wave energy assessement for Northern Spain from a 33-year hindcast. Renew. Energy 2018, 127, 322–333. [Google Scholar] [CrossRef]
- Hemer, M.A.; Zieger, S.; Durrant, T.; O’Grady, J.; Hoeke, R.K.; McInnes, K.L.; Rosebrock, U. A revised assessment of Australia’s national wave energy resource. Renew. Energy 2017, 114, 85–107. [Google Scholar] [CrossRef]
- López, M.; Veigas, M.; Iglesias, G. On the wave energy resource of Peru. Energy Convers. Manag. 2015, 90, 34–40. [Google Scholar] [CrossRef]
- Aboobacker, V.M. Wave energy resource assessment for eastern Bay of Bengal and Malacca Strait. Renew. Energy 2017, 114, 72–84. [Google Scholar] [CrossRef]
- Quitoras, M.R.D.; Abundo, M.L.S.; Danao, L.A.M. A techno-economic assessment of wave energy resources in the Philippines. Renew. Sustain. Energy Rev. 2018, 88, 68–81. [Google Scholar] [CrossRef]
- Lucero, F.; Catalán, P.A.; Ossandón, Á.; Beyá, J.; Puelma, A.; Zamorano, L. Wave energy assessment in the central-south coast of Chile. Renew. Energy 2017, 114, 120–131. [Google Scholar] [CrossRef]
- Contestabile, P.; Ferrante, V.; Vicinanza, D. Wave energy resource along the coast of Santa Catarina (Brazil). Energies 2015, 8, 14219–14243. [Google Scholar] [CrossRef]
- Sierra, J.P.; Martín, C.; Mösso, C.; Mestres, M.; Jebbad, R. Wave energy potential along the Atlantic coast of Morocco. Renew. Energy 2016, 96, 20–32. [Google Scholar] [CrossRef]
- Bernardino, M.; Rusu, L.; Soares, C.G. Evaluation of the wave energy resources in the Cape Verde Islands. Renew. Energy 2017, 101, 316–326. [Google Scholar] [CrossRef]
- Aboobacker, V.M.; Shanas, P.R.; Alsaafani, M.A.; Albarakati, A.M. Wave energy resource assessment for Red Sea. Renew. Energy 2017, 114, 46–58. [Google Scholar] [CrossRef]
- Alamian, R.; Shafaghat, R.; Hosseini, S.S.; Zainali, A. Wave energy potential along the southern coast of the Caspian Sea. Int. J. Mar. Energy 2017, 19, 221–234. [Google Scholar] [CrossRef]
- Wang, Z.; Dong, S.; Dong, X.; Zhang, X. Assessment of wind energy and wave energy resources in Weifang sea area. Int. J. Hydrogen Energy 2016, 41, 15805–15811. [Google Scholar] [CrossRef]
- Kamranzad, B.; Etemad-Shahidi, A.; Chegini, V. Developing an optimum hotspot identifier for wave energy extracting in the northern Persian Gulf. Renew. Energy 2017, 114, 59–71. [Google Scholar] [CrossRef]
- Wang, Z.; Dong, S.; Li, X.; Soares, C.G. Assessments of wave energy in the Bohai Sea, China. Renew. Energy 2016, 90, 145–156. [Google Scholar] [CrossRef]
- Mørk, G.; Barstow, S.; Kabuth, A.; Pontes, M.T. Assessing the global wave energy potential. In Proceedings of the 29th International Conference on Ocean, Offshore and Arctic Engineering, Shanghai, China, 6–11 June 2010; p. 20473. [Google Scholar]
- Arena, F.; Laface, V.; Malara, G.; Romolo, A.; Viviano, A.; Fiamma, V.; Sannino, G.; Carillo, A. Wave climate analysis for the design of wave energy harvesters in the Mediterranean Sea. Renew. Energy 2015, 77, 125–141. [Google Scholar] [CrossRef]
- Besio, G.; Mentaschi, L.; Mazzino, A. Wave energy resource assessment in the Mediterranean Sea on the basis of a 35-year hindcast. Energy 2016, 94, 50–63. [Google Scholar] [CrossRef]
- Vannucchi, V.; Cappietti, L. Wave energy assessment and performance estimation of state of the art wave energy converters in Italian hotspots. Sustainability 2016, 8, 1300. [Google Scholar] [CrossRef]
- Liberti, L.; Carillo, A.; Sannino, G. Wave energy resource assessment in the Mediterranean, the Italian perspective. Renew. Energy 2013, 50, 938–949. [Google Scholar] [CrossRef]
- Franzitta, V.; Curto, D.; Milone, D.; Rao, D. Assessment of renewable sources for the energy consumption in Malta in the Mediterranean Sea. Energies 2016, 9, 1034. [Google Scholar] [CrossRef]
- Lavidas, G.; Venugopal, V. Wave energy resource evaluation and characterisation for the Libyan Sea. Int. J. Mar. Energy 2017, 18, 1–14. [Google Scholar] [CrossRef] [Green Version]
- Vicinanza, D.; Cappietti, L.; Contestabile, P. Assessment of wave energy around Italy. In Proceedings of the 8th European Wave and Tidal Energy Conference, Uppsala, Sweden, 7–10 September 2009; pp. 256–262. [Google Scholar]
- Bozzi, S.; Archetti, R.; Passoni, G. Wave electricity production in Italian offshore: A preliminary investigation. Renew. Energy 2014, 62, 407–416. [Google Scholar] [CrossRef]
- Lavidas, G.; Venugopal, V. Energy Production Benefits by Wind and Wave Energies for the Autonomous System of Crete. Energies 2018, 11, 2741. [Google Scholar] [CrossRef]
- Silva, D.; Rusu, E.; Soares, C.G. Evaluation of various technologies for wave energy conversion in the Portuguese nearshore. Energies 2013, 6, 1344–1364. [Google Scholar] [CrossRef]
- Rusu, E. Evaluation of the wave energy conversion efficiency in various coastal environments. Energies 2014, 7, 4002–4018. [Google Scholar] [CrossRef]
- Barstow, S.; Mork, G.; Lonseth, L.; Schjolberg, P.; Machado, U.; Athanassoulis, G.; Belibassakis, K.; Gerostathis, T.; Stefanakos, C.; Spaan, G. WORLDWAVES: Fusion of data from many sources in a user-friendly software package for timely calculation of wave statistics in global coastal waters. In Proceedings of the 13th International Offshore and Polar Conference and Exhibition, ISOPE2003, Honolulu, HI, USA, 25–30 May 2003; pp. 136–143. [Google Scholar]
- Katalinić, M.; Parunov, J. Wave statistics in the Adriatic Sea based on 24 years of satellite measurements. Ocean Eng. 2018, 158, 378–388. [Google Scholar] [CrossRef]
- Analysis of Cost Reduction Opportunities in the Wave Energy Industry. Available online: http://www.esru.strath.ac.uk/EandE/Web_sites/14-15/Wave_Energy/point-absorber.html (accessed on 16 May 2019).
- Guillou, N.; Chapalain, G. Annual and seasonal variabilities in the performances of wave energy converters. Energy 2018, 165, 812–823. [Google Scholar] [CrossRef] [Green Version]
- Li, W.; Isberg, J.; Waters, R.; Engström, J.; Svensson, O.; Leijon, M. Statistical analysis of wave climate data using mixed distributions and extreme wave prediction. Energies 2016, 9, 396. [Google Scholar] [CrossRef]
- Farkas, A.; Parunov, J.; Katalinic, M. Wave statistics for the middle Adriatic Sea. J. Marit. Transp. Sci. 2016, 52, 33–47. [Google Scholar] [CrossRef]
- Hadžić, N.; Kozmar, H.; Tomić, M. Offshore renewable energy in the Adriatic Sea with respect to the Croatian 2020 energy strategy. Renew. Sustain. Energy Rev. 2014, 40, 597–607. [Google Scholar] [CrossRef]
- Državni Hidrometerološki Zavod. Available online: www.meteo.hr (accessed on 16 May 2019).
- NWE Sales, Windmill Sales and Engineering. Available online: http://www.nwesales.fi/windpower/ (accessed on 29 May 2019).
- Astariz, S.; Iglesias, G. The economics of wave energy: A review. Renew. Sustain. Energy Rev. 2015, 45, 397–408. [Google Scholar] [CrossRef]
Figure 1.
Offshore grid points provided in WWA for the Adriatic Sea. Source: Oceanor.
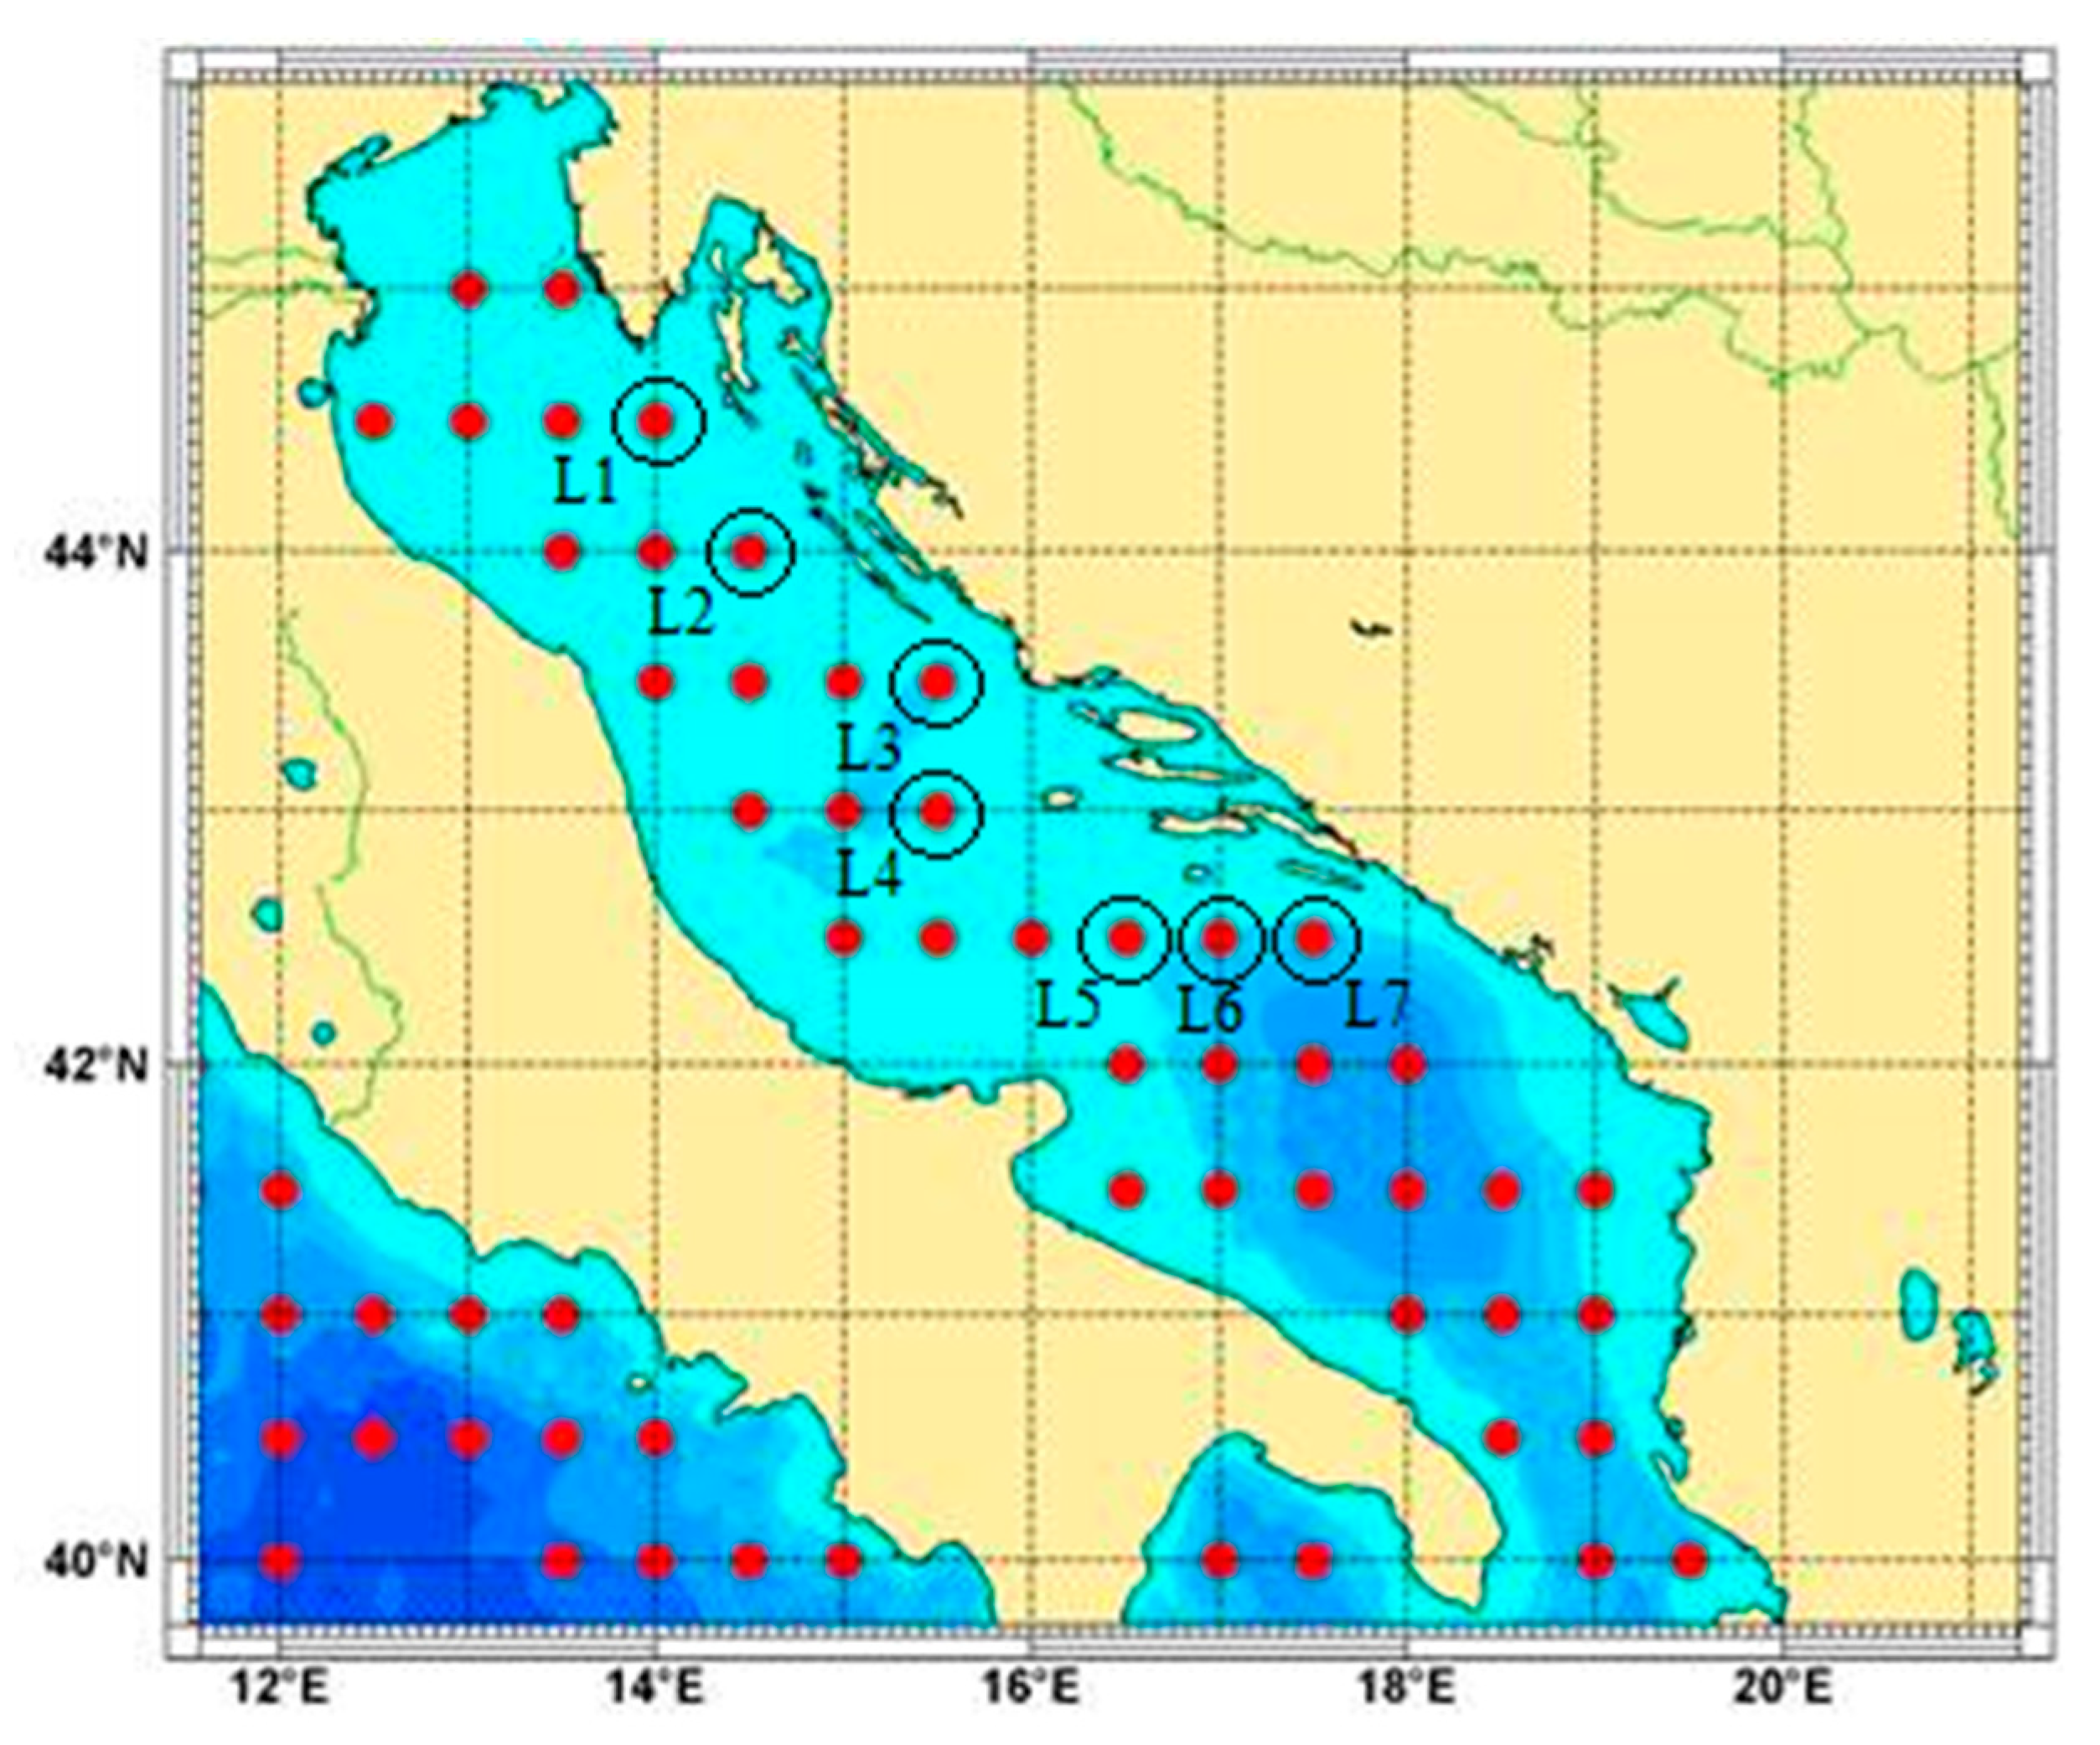
Figure 2.
The two WECs considered in this study: Pelamis (Left) and Aqua Buoy (Right) [35].
Figure 2.
The two WECs considered in this study: Pelamis (Left) and Aqua Buoy (Right) [35].

Figure 3.
The average wind speed at 80 m height [40].
Figure 3.
The average wind speed at 80 m height [40].

Figure 4.
The monthly mean value of (top), (middle) and (bottom) for L6.

Figure 5.
Wave roses for wave power at investigated locations.

Figure 6.
Characterisation of the annual wave energy at the investigated locations using the Aqua Buoy.
Figure 6.
Characterisation of the annual wave energy at the investigated locations using the Aqua Buoy.

Figure 7.
Characterisation of the annual wave energy at the investigated locations using the Pelamis.
Figure 7.
Characterisation of the annual wave energy at the investigated locations using the Pelamis.

Figure 8.
Comparison between measured data and the 3-parameter Weibull CDF.

Table 1.
Selected locations in the Adriatic Sea.
| Location | Latitude | Longitude | Number of Data Outputs |
|---|---|---|---|
| L1 | 44.5° N | 14.0° E | 33,033 |
| L2 | 44.0° N | 14.5° E | 33,364 |
| L3 | 43.5° N | 15.5° E | 33,438 |
| L4 | 43.0° N | 15.5° E | 34,021 |
| L5 | 42.5° N | 16.5° E | 33,913 |
| L6 | 42.5° N | 17.0° E | 33,857 |
| L7 | 42.5° N | 17.5° E | 33,775 |
Table 2.
Wave climate parameters.
| Location | L1 | L2 | ||||||||
| Annual | Summer | Autumn | Winter | Spring | Annual | Summer | Autumn | Winter | Spring | |
| , m | 0.746 | 0.549 | 0.892 | 0.897 | 0.642 | 0.768 | 0.547 | 0.916 | 0.935 | 0.669 |
| , m | 0.575 | 0.375 | 0.654 | 0.664 | 0.461 | 0.595 | 0.363 | 0.684 | 0.68 | 0.494 |
| , s | 3.586 | 3.315 | 3.791 | 3.744 | 3.486 | 3.607 | 3.282 | 3.829 | 3.794 | 3.522 |
| , s | 0.932 | 0.844 | 1.017 | 1.009 | 0.900 | 0.978 | 0.822 | 1.041 | 1.009 | 0.922 |
| , kW/m | 1.959 | 0.818 | 2.821 | 2.859 | 1.303 | 2.133 | 0.798 | 3.105 | 3.126 | 1.486 |
| Location | L3 | L4 | ||||||||
| Annual | Summer | Autumn | Winter | Spring | Annual | Summer | Autumn | Winter | Spring | |
| , m | 0.764 | 0.550 | 0.892 | 0.925 | 0.689 | 0.809 | 0.581 | 0.937 | 1.000 | 0.725 |
| , m | 0.560 | 0.338 | 0.639 | 0.635 | 0.485 | 0.585 | 0.364 | 0.652 | 0.669 | 0.508 |
| , s | 3.647 | 3.291 | 3.870 | 3.861 | 3.567 | 4.182 | 3.687 | 4.473 | 4.531 | 4.053 |
| , s | 0.988 | 0.819 | 1.062 | 1.014 | 0.921 | 1.502 | 1.472 | 1.444 | 1.464 | 1.470 |
| , kW/m | 2.030 | 0.751 | 2.882 | 2.966 | 1.524 | 2.657 | 1.010 | 3.647 | 4.046 | 1.973 |
| Location | L5 | L6 | ||||||||
| Annual | Summer | Autumn | Winter | Spring | Annual | Summer | Autumn | Winter | Spring | |
| , m | 0.879 | 0.630 | 1.020 | 1.088 | 0.786 | 0.866 | 0.611 | 1.013 | 1.074 | 0.771 |
| , m | 0.611 | 0.354 | 0.689 | 0.704 | 0.515 | 0.623 | 0.345 | 0.713 | 0.724 | 0.516 |
| , s | 3.832 | 3.395 | 4.074 | 4.157 | 3.714 | 3.830 | 3.372 | 4.083 | 4.153 | 3.721 |
| , s | 1.023 | 0.774 | 1.087 | 1.076 | 0.941 | 1.046 | 0.775 | 1.117 | 1.099 | 0.968 |
| , kW/m | 2.782 | 1.007 | 3.851 | 4.320 | 1.994 | 2.784 | 0.937 | 3.936 | 4.351 | 1.951 |
| Location | L7 | |||||||||
| Annual | Summer | Autumn | Winter | Spring | ||||||
| , m | 0.840 | 0.587 | 0.985 | 1.042 | 0.754 | |||||
| , m | 0.630 | 0.336 | 0.724 | 0.744 | 0.518 | |||||
| , s | 3.848 | 3.372 | 4.112 | 4.175 | 3.746 | |||||
| , s | 1.097 | 0.798 | 1.179 | 1.163 | 1.015 | |||||
| , kW/m | 2.685 | 0.862 | 3.891 | 4.333 | 1.913 | |||||
Table 3.
The mean yearly wave energy.
| Location | Aqua Buoy | Pelamis | ||
|---|---|---|---|---|
| , MWh | , kW | , MWh | , kW | |
| L1 | 14.945 | 1.706 | 104.204 | 11.895 |
| L2 | 17.469 | 1.994 | 124.254 | 14.184 |
| L3 | 20.387 | 2.327 | 122.143 | 13.943 |
| L4 | 49.240 | 5.621 | 229.055 | 26.148 |
| L5 | 35.417 | 4.043 | 194.336 | 22.184 |
| L6 | 35.845 | 4.092 | 196.117 | 22.388 |
| L7 | 37.623 | 4.295 | 197.536 | 22.550 |
Table 4.
Capacity factors.
| Cf, % | ||||||||||
|---|---|---|---|---|---|---|---|---|---|---|
| WEC | Aqua Buoy | Pelamis | ||||||||
| Location | Annual | Summer | Autumn | Winter | Spring | Annual | Summer | Autumn | Winter | Spring |
| L1 | 0.68 | 0.10 | 1.16 | 1.02 | 0.43 | 1.59 | 0.27 | 2.59 | 2.58 | 0.86 |
| L2 | 0.80 | 0.13 | 1.32 | 1.23 | 0.51 | 1.89 | 0.29 | 3.09 | 3.04 | 1.11 |
| L3 | 0.93 | 0.08 | 1.58 | 1.48 | 0.58 | 1.86 | 0.21 | 3.02 | 3.04 | 1.17 |
| L4 | 2.25 | 0.41 | 3.37 | 3.81 | 1.46 | 3.49 | 0.79 | 5.10 | 5.73 | 2.40 |
| L5 | 1.62 | 0.19 | 2.52 | 2.87 | 0.93 | 2.96 | 0.45 | 4.49 | 5.14 | 1.81 |
| L6 | 1.64 | 0.18 | 2.54 | 2.93 | 0.93 | 2.99 | 0.38 | 4.65 | 5.18 | 1.78 |
| L7 | 1.72 | 0.17 | 2.66 | 3.09 | 0.98 | 3.01 | 0.36 | 4.70 | 5.20 | 1.82 |
Table 5.
Weibull parameters.
| Location | |||
|---|---|---|---|
| L1 | 0.926 | 0.464 | 0.534 |
| L2 | 0.935 | 0.494 | 0.527 |
| L3 | 0.971 | 0.486 | 0.542 |
| L4 | 0.986 | 0.518 | 0.548 |
| L5 | 1.000 | 0.576 | 0.557 |
| L6 | 0.982 | 0.571 | 0.554 |
| L7 | 0.943 | 0.542 | 0.549 |
Table 6.
The obtained extreme values of .
| Location/RP | , m | , m | , m | , m | , m | , m | , m |
|---|---|---|---|---|---|---|---|
| L1 | 4.493 | 5.445 | 5.860 | 6.277 | 6.832 | 7.254 | 6.190 |
| L2 | 4.660 | 5.643 | 6.071 | 6.500 | 7.072 | 7.506 | 6.720 |
| L3 | 4.298 | 5.154 | 5.525 | 5.896 | 6.388 | 6.761 | 5.890 |
| L4 | 4.434 | 5.306 | 5.682 | 6.058 | 6.557 | 6.934 | 5.170 |
| L5 | 4.758 | 5.687 | 6.087 | 6.486 | 7.015 | 7.415 | 6.050 |
| L6 | 4.867 | 5.839 | 6.258 | 6.678 | 7.234 | 7.656 | 6.330 |
| L7 | 5.003 | 6.053 | 6.509 | 6.967 | 7.575 | 8.038 | 6.220 |
Table 7.
Offshore wind energy potential.
| Location | , GWh | , kW |
|---|---|---|
| L1 | 3.256 | 371.640 |
| L2 | 2.946 | 336.271 |
| L3 | 3.586 | 409.406 |
| L4 | 2.656 | 303.220 |
| L5 | 2.656 | 303.220 |
| L6 | 2.946 | 336.271 |
| L7 | 3.586 | 409.406 |
© 2019 by the authors. Licensee MDPI, Basel, Switzerland. This article is an open access article distributed under the terms and conditions of the Creative Commons Attribution (CC BY) license (http://creativecommons.org/licenses/by/4.0/).
Share and Cite
MDPI and ACS Style
Farkas, A.; Degiuli, N.; Martić, I. Assessment of Offshore Wave Energy Potential in the Croatian Part of the Adriatic Sea and Comparison with Wind Energy Potential. Energies 2019, 12, 2357. https://doi.org/10.3390/en12122357
AMA Style
Farkas A, Degiuli N, Martić I. Assessment of Offshore Wave Energy Potential in the Croatian Part of the Adriatic Sea and Comparison with Wind Energy Potential. Energies. 2019; 12(12):2357. https://doi.org/10.3390/en12122357
Chicago/Turabian StyleFarkas, Andrea, Nastia Degiuli, and Ivana Martić. 2019. "Assessment of Offshore Wave Energy Potential in the Croatian Part of the Adriatic Sea and Comparison with Wind Energy Potential" Energies 12, no. 12: 2357. https://doi.org/10.3390/en12122357
Note that from the first issue of 2016, this journal uses article numbers instead of page numbers. See further details here.