Article

DC Flashover Dynamic Model of Post Insulator under Non-Uniform Pollution between Windward and Leeward Sides

1
State Key Laboratory of Power Transmission Equipment & System Security and New Technology, Chongqing University, Chongqing 400044, China
2
Nanjing Institute of Technology, Nanjing 210000, China
*
Author to whom correspondence should be addressed.
Energies 2019, 12(12), 2345; https://doi.org/10.3390/en12122345
Submission received: 24 May 2019 / Revised: 14 June 2019 / Accepted: 16 June 2019 / Published: 19 June 2019
(This article belongs to the Special Issue High Voltage Engineering and Applications)

Abstract

:
Experience shows that under unidirectional wind or certain terrain, the surface of post insulators is non-uniformly polluted between windward and leeward sides, which affects the flashover characteristics. In this paper, a formulation of residual pollution layer resistance was proposed under this non-uniformity and a typical post insulator was taken as an example to analyze and calculate its residual resistance. The theoretical resistance was verified by numerical simulations using COMSOL Multiphysics. The proposed resistance formulation was then implemented in a DC flashover dynamic model to determine the flashover voltage (Ucal), which was validated by artificial flashover tests. Then the factors affecting DC flashover voltage were analyzed. Research results indicate that: the residual resistance formulation agrees well with simulation results, especially when the arc length exceeds 70% of the leakage distance. The good concordance between theoretical and experimental flashover voltages with most relative error within ±10%, validates the flashover model and its residual resistance formulation. Ucal gets impaired under this non-uniformity. The degree of reduction is related to salt deposit density ratio (m) of windward to leeward side and leeward side area proportion (k).

1. Introduction

Post insulators, which are widely used in substations and converter stations, play an important role in electrical insulation and mechanical support in AC and DC transmission systems. Natural contamination characteristics indicate that there exists non-uniform pollution distribution on the insulator surface, which behaves in three types: non-uniformity between top and bottom surfaces, along the insulator length, and the transverse direction [1]. After long-term operation, the contamination on the leeward side of insulators is more serious than the windward side, due to wind direction and rainfall angle on the site, resulting in an easily-identified boundary between them [2,3,4], as shown in Figure 1. The contamination at the insulator surface is wetted partially or totally in the conditions of light rain, dew, or fog, which lowers the electrical characteristics of insulators [5,6].
At present, the main research on contaminated insulators includes contamination characteristics and flashover model. Plenty of studies have been conducted through pollution tests, simulations and mathematical models. For example, literature [7,8] present two different techniques, a multi model partitioning filter (MMPF) and an artificial neural network (ANN), and use the real contamination data for MMPF modeling and the ANN training. Research results indicate that both techniques can predict accurately the ESDD (equivalent salt deposit density) of suspension insulators in different conditions of wind velocity, ambient temperature, rainfall, and so on.
In the aspect of flashover model which this paper focuses on, much research has been conducted [9,10,11,12,13]. In literature [9], the insulator was partitioned into triangular elements and the finite element method was adopted to determine potential distribution, pollution layer resistance, and flashover voltage. Literature [10] presented a refinement of residual resistance formulation applied to insulator open model taking into consideration the non-uniformity of current density, where the correction factor was determined by numerical simulations. The flashover dynamic model based on the corrected formulation shows good accuracy compared with experimental results. In literature [11], a 2D model of the insulator surface was established and the residual resistance and the leakage current were obtained with the finite element software. Then the resistance and current were applied in a numerical model to predict flashover voltage. In literature [12], The residual resistance was evaluated under different radii and positions of arc root by building 3D model in COMSOL Multiphysics. The simulation results demonstrate that the relationship between the residual resistance and arc length is nonlinear. Literature [13] proposed a flashover model where the pollution layer was equivalent to a rectangle. The arc was modeled by its root which was considered as an equipotential surface. However, the above research mainly focuses on the residual pollution layer resistance and flashover models under uniform contamination, and there are few studies on non-uniform pollution between windward and leeward sides.
The existing research on non-uniformity between windward and leeward sides is principally aimed to study the flashover characteristics by artificial flashover tests and test samples are mostly line suspension insulators. The related research results [14,15,16,17] reveal that, under this non-uniformity, the flashover voltage of suspension insulators decreases compared with uniform pollution. In literature [14], DC flashover tests using 7-unit suspension insulator string were carried out under this non-uniformity. Research results indicate that a reduction in the ratio W/L from 1/1 to 1/15 gave a median 35% ± 4% decrease in flashover strength, where W/L is ratio of the salt deposit density (SDD) on the windward side to that on the leeward side. Similar conclusions can be found in reference [15]. AC flashover tests were presented in literature [1,16] under this non-uniformity and what makes a difference is that there is a slighter decrease of flashover voltage than DC. Literature [17] studied flashover characteristics when insulators were polluted non-uniformly along circumference (similar to non-uniform pollution between windward and leeward sides), and preliminarily analyzed the relationship between flashover voltage and area of heavy contaminated area. However, post insulator is distinguished from suspension insulator by its geometrical structure. At present, few studies on flashover model of post insulator under non-uniform pollution between windward and leeward sides have been carried out and its flashover characteristics are still unclear in this case.
In this paper, taking a typical post insulator as the sample, the influence of this non-uniformity on DC pollution flashover characteristics was presented systematically through calculating the residual pollution layer resistance, resistance simulation validation, calculating flashover voltage by the DC flashover dynamic model and carrying out artificial flashover validation tests. Based on previous work [10,12,14,15], the contribution of this paper is to propose a non-uniform residual resistance formulation by calculating in different regions, which takes into account the arc root radius, salt deposit density ratio (m) of windward to leeward side and leeward side area proportion (k). The DC flashover dynamic model, which considers time-varying arc root radius and leakage current, is validated by experimental results under different m and k. Finally, the DC flashover characteristics of post insulator are analyzed. The research results provide experimental data and theoretical support for further revealing the electrical characteristics of post insulator and improving the external insulation selection.

2. Analysis of Residual Pollution Layer Resistance for Pollution Flashover Dynamic Model

For insulators of any shape, the discharge process under uniform pollution can be analyzed using a series model of partial arc and residual pollution layer according to the Obenaus circuit model [12,18], as shown in Figure 2.
When the partial arc is generated, with the electrode voltage drop ignored, the circuit model of Figure 2 is described in DC by the following equation:
U = U a r c + U p = A x I n + I · R ( x )
where U is the applied voltage (V); I is the leakage current (A); x is the arc length (cm); R(x) is the residual pollution layer resistance ( Ω ); A and n are arc constant.
As R(x) is related to the arc root radius which is determined by the leakage current I, besides, x and I influence each other at any time, therefore, the discharge process is dynamic. Based on Obenaus circuit model, flashover dynamic model can be established to obtain flashover voltage and the key of dynamic model is to find analytic expression of the R(x). So, the formulation of residual pollution layer resistance will be discussed first before establishing the model in the following.

2.1. Residual Pollution Layer Resistance under Uniform Pollution

With respect to the studies on residual resistance, Obenaus [18] explained that the residual resistance in series with pollution layer decreases as the arc propagates; Neumarker and Alston [12,18] assumed that the resistance per unit length of the pollution layer is constant; Open model, proposed by Rumeli [10,11], is to spread the insulator surface to a 2D equivalent surface. However, it is applied only to a uniform current distribution; Wilkins [19] proposed a new formulation where the pollution layer is equivalent to a rectangle and the constriction of current lines at the arc root is taken into account, which improves the expression of residual resistance. However, according to the study in literature [13,20], Wilkins formula cannot be applied to insulators with complex geometric shapes or non-uniform pollution.
The geometry of post insulator is complex, which cannot be simply expanded into a rectangle or equivalent to a cylinder to calculate its resistance. Considering current density distribution at surface is not uniform due to current lines constriction at the arc root, when partial arc is established, rectangular resistance model cannot reflect the non-uniformity. Therefore, it is assumed that a single dominant arc contacts in series with a residual pollution layer through the circular arc root. With thermal effects of partial arc and pollution layer ignored, the residual pollution layer resistance can be expressed as the resistance between two circular electrodes with different radii at the insulator surface, as shown in Figure 3. The two circular electrodes represent the arc root and the middle rod of post insulator, where r0 is the arc root radius; r1 is the rod radius, and the conductivity of the medium between two electrodes is pollution layer conductivity.
The resistance between two circular electrodes on an infinite conductive plane can be expressed as follow [21,22]:
R = 1 2 π σ e cosh 1 | D 2 r 1 2 r 0 2 2 r 1 r 0 |
where σ e is the surface pollution layer conductivity at the critical flashover moment, called effective surface conductivity, S; D = L x + r 1 , L is insulator leakage distance, cm.
σ s is the surface pollution layer conductivity before a partial arc is generated. In previous studies, the relationship between σ e and σ s can be expressed as [22]
σ e 1.25 σ s
The arc root radius is established to be [19]:
r 0 = I 1.45 π
where I is leakage current, A.
Meanwhile, the actual arc root radius is much smaller than that of post insulator rod, i.e., r 0 r 1 , therefore, D 2 r 1 2 r 0 2 D 2 r 1 2 , and D 2 r 1 2 = ( L x + r 1 ) 2 r 1 2 > 0 .
Basing on Equations (3) and (4), Equation (2) can be simplified to:
R = 1 2.5 π σ s cosh 1 ( ( L x + r 1 ) 2 r 1 2 2 r 1 I / 1.45 π )
Then the identical transformation of cosh 1 θ = ln ( θ + θ 2 1 ) is applied to Equation (5) and the residual pollution layer resistance can be expressed as follow:
R ( x , I ) = 1 2.5 π σ s ln ( ( L x + r 1 ) 2 r 1 2 2 r 1 r 0 + ( ( L x + r 1 ) 2 r 1 2 2 r 1 r 0 ) 2 1 )
where surface conductivity of pollution layer σ s is given in literature [23] by following relation:
σ s = ( 369.05 × SDD + 0.42 ) × 10 6   S
SDD is the salt deposit density of the whole insulator surface, mg/cm2.

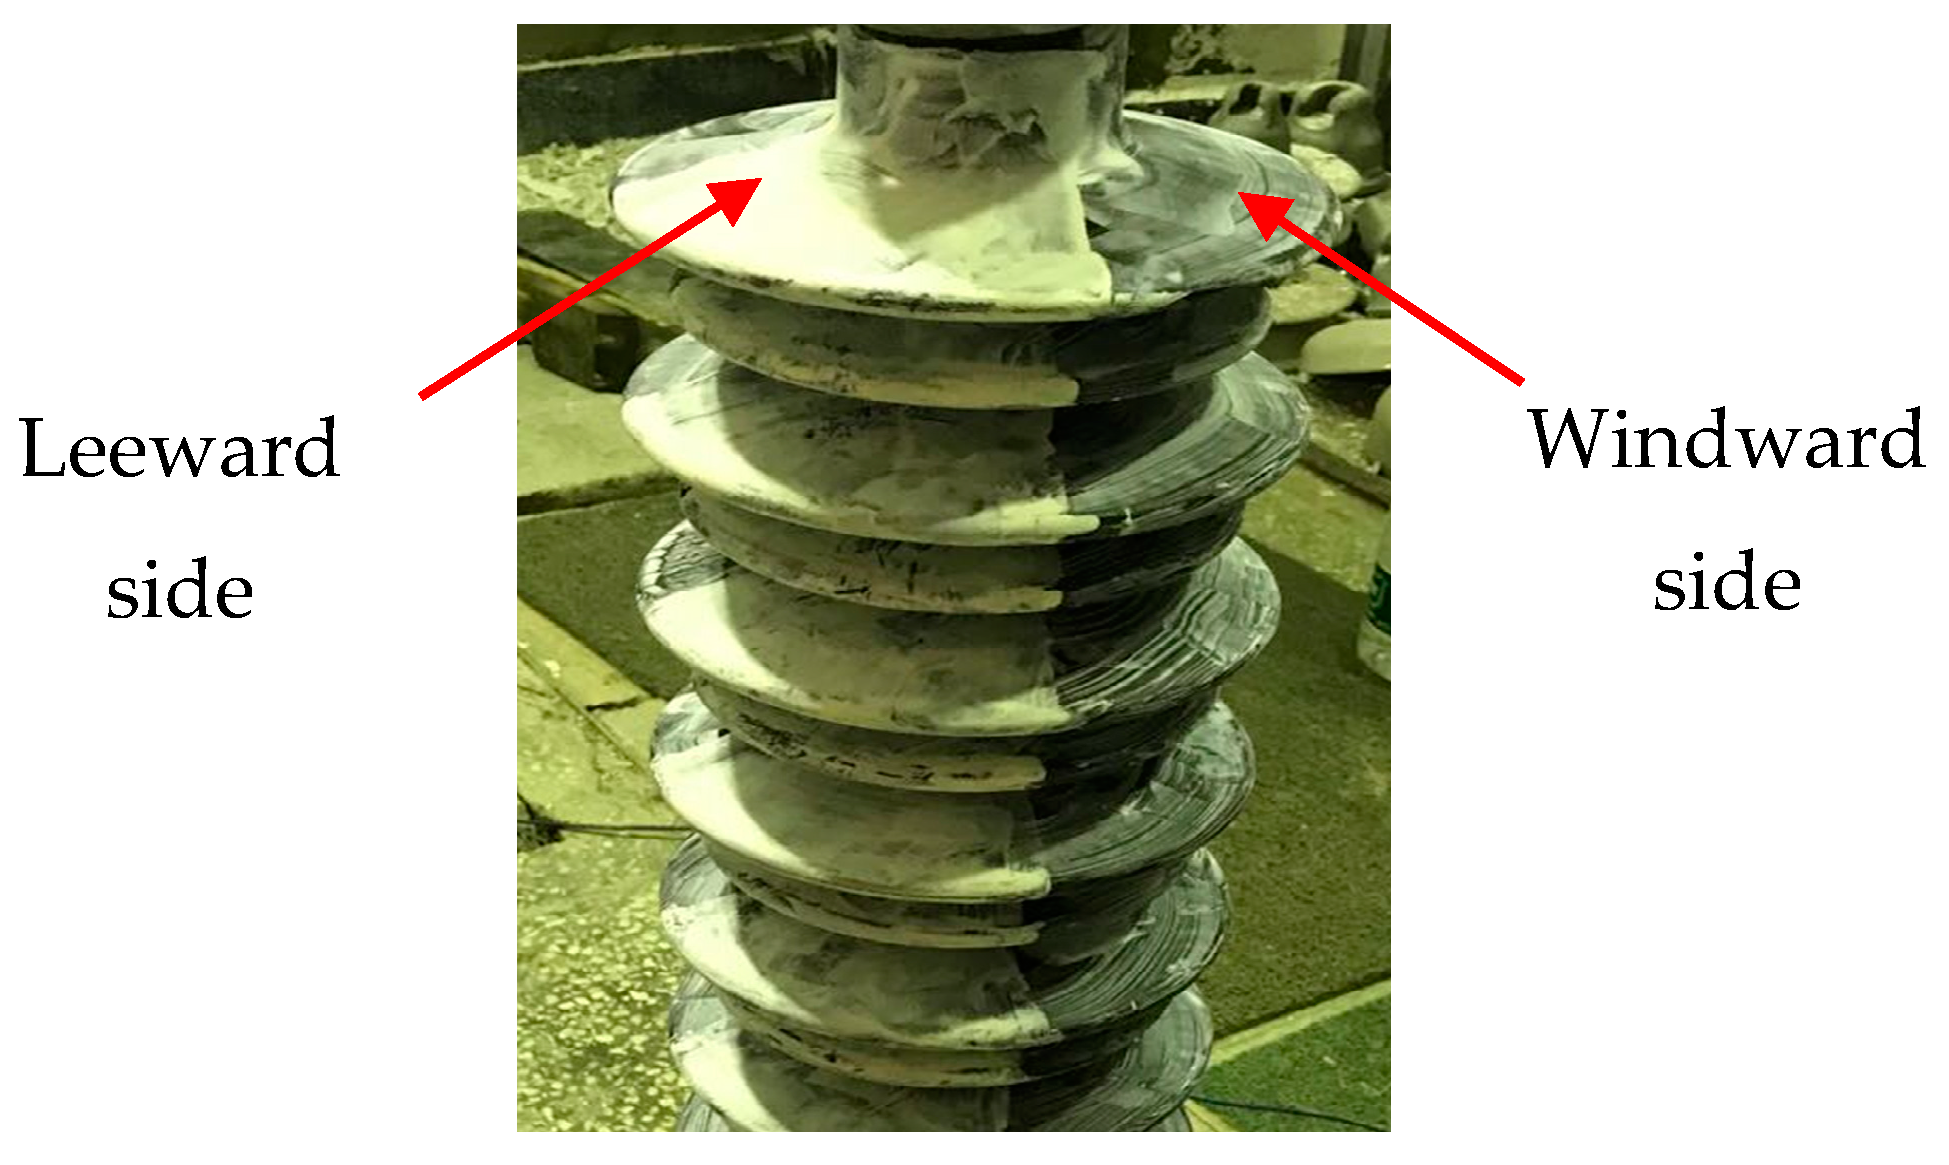
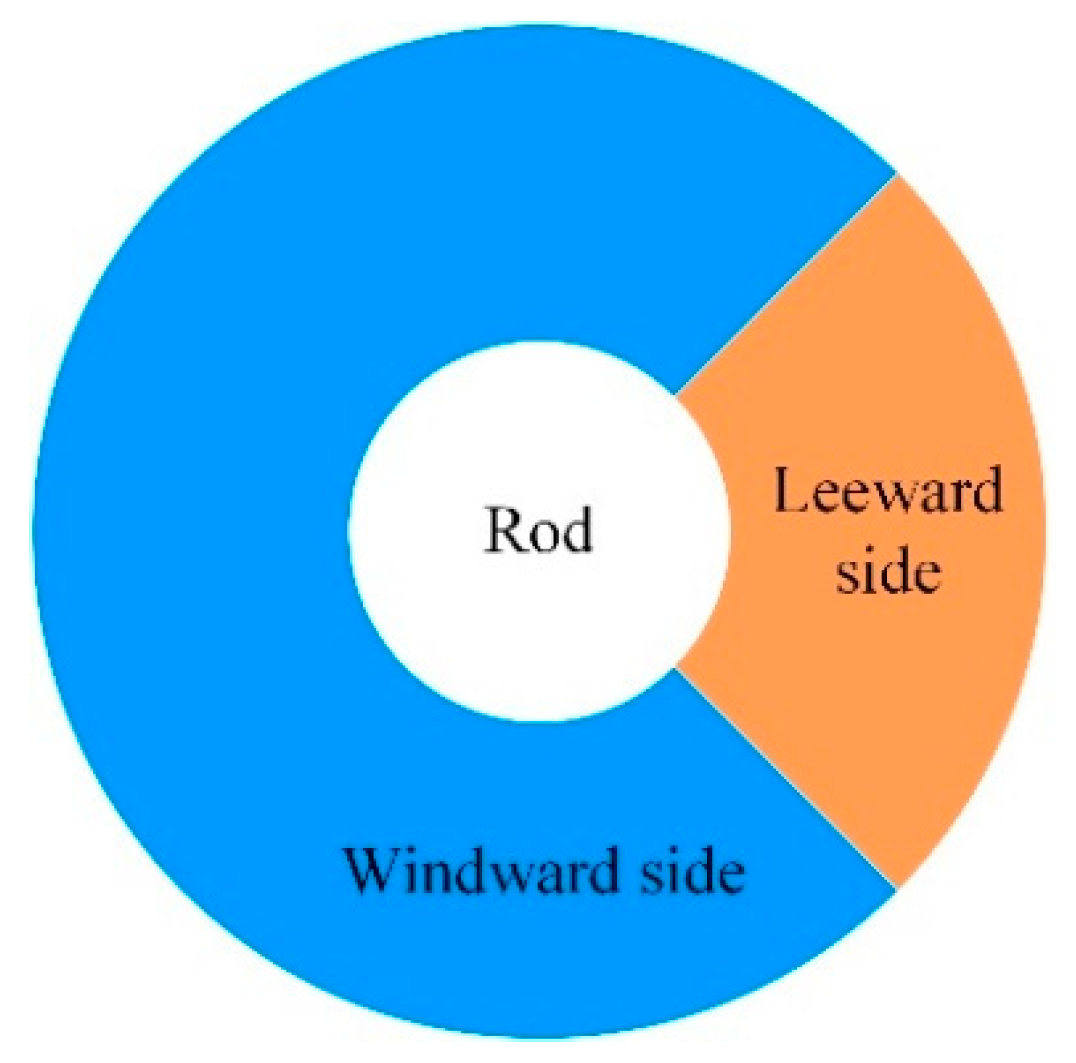
2.2. Residual Pollution Layer Resistance under Non-Uniform Pollution between Windward and Leeward Sides

In the case of non-uniform pollution between windward and leeward sides, the actual contamination at insulator surface can be approximated to two fan-shaped areas with different pollution degree, as shown in Figure 4. Assuming that the salt deposit densities of the windward and leeward sides are SDDW and SDDL respectively and the average salt deposit density is SDD, the relation is as follows
{ SDD = SDD W · S W + SDD L · S L S W + S L k = S L S W + S L , m = SDD W SDD L
where SW and SL are the surface area of windward and leeward sides, respectively, m is salt deposit density ratio of windward to leeward side which is less than 1 and k is the ratio of leeward side area to the whole area.
According to the statistical data of the natural contamination site, it was found that m of post insulator is between 0.17 and 0.76 and k is between 20% and 50%. Therefore, in order to study quantitatively the influence of different non-uniform pollution distribution on DC flashover characteristics, in the following model calculation and experimental validation, the value of m is taken as 1/8, 1/5, 1/3, and 1/1; the value of k is set to 25%, 35%, and 45% and SDD is set to 0.05, 0.10, and 0.15 mg/cm2. Under different combinations of SDD, m and k, flashover voltage is calculated and verified by tests.
σ W and σ L are the surface conductivity of windward and leeward sides, respectively. When the pollution layer is at the same temperature and saturated enough, the surface conductivity of pollution layer is proportional to the corresponding SDD [15,23]. Therefore, Equation (8) can be equivalently transformed in the following form:
{ σ W S W + σ L S L = σ s S k = S L S W + S L , m = σ W σ L
where σ s is the surface pollution layer conductivity under uniform pollution; the relationship between σ W and σ L can be established from Equation (9):
σ W = m σ L = m σ m ( 1 k ) + k
Under non-uniform pollution between windward and leeward sides, partial arc is always first generated at the leeward side, where the pollution degree is heavier, and propagates along its leakage distance. The surface conductivity is proportional to the thickness of pollution layer [24], therefore, the pollution layer resistance can be regarded as an overlap below and above of two conductive pollution layers with unequal areas, as shown in Figure 5. The surface conductivity should be ( m 1 1 ) σ W and σ W , respectively.
R1 and R2 are defined as the resistances of lower and upper conductive layer respectively, then the total residual pollution layer resistance Rnon can be obtained by parallel calculation of R1 and R2:
R n o n = R 1 R 2 R 1 + R 2
where R1 can be calculated by Equation (6):
R 1 ( x , I ) = 1 2.5 π σ w ln ( ( L x + r 1 ) 2 r 1 2 2 r 1 r 0 + ( ( L x + r 1 ) 2 r 1 2 2 r 1 r 0 ) 2 1 )
The area of upper pollution layer, where the current line density is relatively uniform compared with the lower one, generally accounts for only 20% to 50% of the total area. Therefore, it is approximated as a rectangular conductive thin layer, as shown in Figure 6.
The length of the rectangle is Lx, the width is a = k · 2 π r 1 , and the residual resistance of a narrow rectangular pollution layer can be calculated using the Wilkins formula [19]:
R 2 ( x , I ) = 1 2.5 π ( m 1 1 ) σ W [ 2 π ( L x ) T · 2 π r 1 + ln T · 2 π r 1 2 π r 0 ] = 1 2.5 π ( m 1 1 ) σ W [ L x k r 1 + ln k r 1 r 0 ]
Substituting Equations (12) and (13) into Equation (11), the analytic expression of Rnon(x, I) can be obtained:
R n o n ( x , I ) = [ k + m ( 1 k ) ] f 1 ( x , I ) f 2 ( x , I ) 2.5 π σ s · [ ( 1 m ) f 1 ( x , I ) + m f 2 ( x , I ) ]
where,
f 1 ( x , I ) = ln ( ( L x + r 1 ) 2 r 1 2 2 r 1 r 0 + ( ( L x + r 1 ) 2 r 1 2 2 r 1 r 0 ) 2 1 )
f 2 ( x , I ) = L x k r 1 + ln k r 1 r 0
Since the geometrical structure of each shed group is the same, one shed group with leakage distance L = 30.69 cm and rod radius r1 = 6 cm, is taken as an example. When SDD is 0.15 mg/cm2, R(x, I) is calculated respectively under two conditions of uniform pollution (m = 1:1) and non-uniform pollution (m = 1:3, k = 25%). Residual resistance is a function not only of x but also of I. Based on previous studies [15,25] on DC leakage current under uniform pollution, we can estimate approximatively the leakage current under non-uniform pollution. In literature [25], the value of I is between 0 and 0.44 A when SDD is between 0.06 and 0.25 mg/cm2; according to our previous flashover tests on uniform pollution of this type of post insulator, when SDD ranges from 0.05 to 0.15 mg/sm2, I is between 0 and 0.86 A. By substituting above current range into Equation (4), r0 is between 0 and 0.43 cm corresponding to SDD = 0.15 mg/cm2. In order to study the influence of arc root radius on R(x, I), two typical arc root radii, r0 = 0.1 and 0.3 cm, are taken. Substituting m, k, L, r1, and r0 into Equations (6) and (14), the relationship between R(x, I) and x is shown in Figure 7.
It can be obtained from Figure 7 that:
(1) R(x, I) decreases nonlinearly with the increase of x under both uniform and non-uniform pollution. The nonlinearity under uniform pollution is heavier than non-uniform pollution between windward and leeward sides. When x reaches the leakage distance, R(x, I) drops close to zero.
(2) With the increase of x, the decreasing trend of R(x, I) tends to be sharper. For example, for uniform pollution with r0 = 0.3 cm, when x exceeds about 70% of the leakage distance (about 22 cm), R(x, I) significantly decreases, which is consistent with the phenomenon that critical flashover generally occurs when arc length reaches 60%–80% of the leakage distance [15].
(3) Under certain x and r0, R(x, I) of uniformly polluted surface is larger than that of non-uniform pollution. The decrease of residual pollution layer resistance may result in the difference of flashover voltage when windward and leeward surfaces are non-uniformly polluted.
(4) Under certain pollution condition and x, when r0 is lower, R(x, I) becomes larger. The increasing amplitude of R(x, I) decreases with the increase of x.

2.3. Comparative Results of Residual Pollution Layer Resistance

In order to verify the resistance formulation (14), the finite element model (FEM) is adopted for numerical simulation, considering that it is difficult to measure residual pollution layer resistance at the insulator surface during the development of arc on existing technical conditions. FEM techniques are widely applied to the modeling insulator to analyze surface potential distribution and pollution layer resistance [9,10,11,12,13]. In literature [10,11,12], 2D or 3D FEM models are established using COMSOL Multiphysics, a commercial finite element software, to simulate and calculate the residual pollution layer resistance. The results are in good agreement with the theoretical values.
Based on the actual geometry size of the post insulator, this paper applies COMSOL Multiphysics, taking a group of large and small sheds as an example, to establish 3D model of surface pollution layer. Assuming that the shape of arc root is circular [10,13], two typical arc root radii are adopted to simulate and calculate the residual resistance for different arc root positions along the leakage distance. Then the numerical values are compared with the theoretical values.
The parameters and structural diagram of the sample are shown in Table 1, where L1 is the extended length of the large shed; L2 is the extended length of the small shed; H1 is the vertical distance between two large sheds; H2 is the vertical distance between the large shed and small shed; D is the diameter of the insulator; H is the insulation height.
Figure 8 is a 2D cross-section diagram of the pollution layer. The thickness d of pollution layer is mainly related to NSDD (non-soluble deposit density) [26]. By gathering the wetted enough pollution layer and measuring its weight, the thickness d of the pollution layer can be obtained approximately. Our experimental results show d has an approximate relationship with SDD and NSDD in the following form:
d = [ 1.33 × ( SDD + NSDD ) + 4.19 ] × 10 3 cm
In the 3D pollution layer model with thickness d, the volume conductivity σ V can be expressed as follow [10]:
σ V = σ S / d
For example, when insulator surface is uniformly polluted, SDD = 0.15 mg/cm2 and NSDD = 0.9 mg/cm2, d = 5.6 × 10⁻² mm. σ S = 55.78 × 10 6 S and σ V = 0.996 S/m, which can be calculated by Equations (7) and (18). Similarly, basing on Equations (7), (8), (17) and (18), σ V of windward and leeward surfaces can be calculated under different non-uniform pollution distributions.
The increase of arc length is achieved by changing the position of the arc root along the leakage distance, so as to obtain the residual pollution layer resistance of different arc lengths. Using the current physical field of COMSOL Multiphysics, the potential boundary condition is adopted by setting arc root as an equipotential surface, applying a certain DC voltage (the value of the applied voltage has no effect on the resistance calculation) at the arc root, and grounding the upper end of pollution layer at the rod. The governing equations of the constant electric field are as follows:
J = σ V E    E = V    J = 0
where J is volume current density, A/m2; E is electric field intensity, V/m; V is potential, V.
The conductive layers are discretized in finite elements. According to the simulation results with different mesh sizes, the influence of FEM mesh size is not significant when the mesh quality is good because the numerical results become stable gradually. Figure 9 shows an example of the numerical results of current density and potential distribution when SDD = 0.15 mg/cm2, NSDD = 0.9 mg/cm2, m = 1:3, k = 25%, and r0 = 0.3 cm. The color difference in the figure indicates the voltage drop, and the red arrow indicates the current density. It can be obtained from Figure 9 that after arc is generated at insulator surface, the current density distribution is quite non-uniform due to the constriction of the current lines around the arc root. The current density decreases rapidly in the diffusion process to the windward surface. Similarly, the potential distribution is also uneven, and the voltage drop mainly occurs at the leeward side.
Then the leakage current I is calculated by integrating the current density at the grounding electrode. The applied DC voltage is known, therefore, the resistance between the arc root and the grounding electrode, that is, the residual pollution layer resistance, can be obtained. Figure 10 shows the comparison between the numerical resistance values and analytical calculation by Equation (14) under the above condition.
As can be obtained from Figure 10:
(1) When the arc length is between 21 cm and 30 cm, that is, the arc root is located on the upper surface of the large shed, the analytical calculation of R(x) gives results in very good agreement with numerical values by COMSOL with a discrepancy lower than 6%.
(2) The discrepancy increases when the arc length ranges from 13 cm to 16 cm, that is, the arc root is located near the rod, which may be caused by the complex geometric shape near the rod of the post insulator.
(3) The analytical results obtained by the resistance formulation (14) are very close to the numerical values when the arc length exceeds about 70% of the leakage distance, where the critical flashover generally occurs [15]. The good accordance of this distance indicates that the proposed resistance formulation works well and ensures the accurate calculation of flashover voltage.
Therefore, adopting the proposed residual resistance formulation is reliable. Based on these, the pollution flashover voltage of the post insulator can be derived.

3. DC Flashover Dynamic Model and Experimental Validation

3.1. DC Pollution Flashover Dynamic Model

The flashover dynamic model of the insulator can reflect the flashover phenomenon more exactly than the static model due to taking into account instantaneous variation of the discharge parameters. Based on Obenaus model, a DC flashover dynamic mathematical model is developed in this paper. Since it is very complicated to include all these discharge parameters in this model, several simplifying assumptions are made: a single dominant arc is propagated along the leakage distance of leeward side and the temperature and humidity effects on pollution layer and arc are ignored.
The flashover model is established based on Figure 2, and its circuit equation can be expressed as (1). As x and I are time-varying and influence each other at any time, to accurately calculate flashover voltage (Ucal), it is necessary to recalculate I by Equation (1) at each new position of arc root [10,12,13].
The circuit Equation (1) can be rewritten as:
I = U A x I n R ( x )
Since (20) is a non-linear equation about current I, it is difficult to obtain its analytical solution. So it can be solved numerically by the secant method [10], and Equation (20) can be rewritten to be a function of I:
f ( I ) = I U A x I n R n o n ( x )
Its iteration format can be expressed as:
I i + 1 = I i I i I i 1 f ( I i ) f ( I i 1 ) f ( I i )
By setting two initial values I0 and I1, which are close to the guessed analytical solution, as well as the error limit, the iteration can be started to obtain the numerical solution of I meeting the given error limit.
Hampton criterion [27] points out that the propagation of the arc should require:
E p > E a r c
where Ep is the voltage gradient of the residual pollution layer; Earc is the arc voltage gradient. At each iteration step, Ep and Earc can be calculated as follows:
{ E p = U p L x = I · R ( x , I ) L x E a r c = U a r c x = A I n
Under a certain applied voltage, if the criterion (23) is met, the arc is propagated along insulator leakage distance, otherwise, the arc extinguishes, or the applied voltage needs to be increased
In the literature [18], the arc propagation velocity is defined as:
v = μ E a r c
where the mobility μ = 25   cm 2 / ( V · s ) [10]. At the place of pollution flashover tests, n value is 0.52 and A is 129 for a negative DC arc [28].
The flow chart of the DC pollution flashover dynamic model is illustrated in Figure 11. Firstly, the insulator geometrical parameters (L, r1), arc constants (n, A), non-uniform pollution degree (m, k) and values for iteration are input. At time t = 0, the initial applied voltage Umin is set to 2 kV and the initial arc length xmin is set to 1% of the total leakage distance L [10,18]. Two approximate values which start the iterative calculation of I, are Ii=0 = 0.03 A, Ii=1 = 0.05 A. The voltage increment dU = 50 V and time increment dt = 0.1 us at each step. Secondly, the arc root radius r0 and residual pollution layer resistance Rnon (x, I) at this time can be calculated using above initial values. Then the leakage current I is obtained by substituting r0 and Rnon(x, I) into Equations (21) and (22). Thirdly, Ep and Earc are calculated respectively using Equation (24). On the premise that the x is less than the total leakage distance L, Hampton criterion is verified by judging whether Ep >Earc. If the propagation criterion is not satisfied, the applied voltage increases by dU. If the propagation criterion is satisfied, the arc propagates with an increased length. Finally, for the new arc length or new applied voltage, r0, Rnon(x, I), I, Ep and Earc are recalculated and the above judging steps are repeated until x = L. The critical flashover voltage Ucal is obtained at this non-uniform pollution degree.

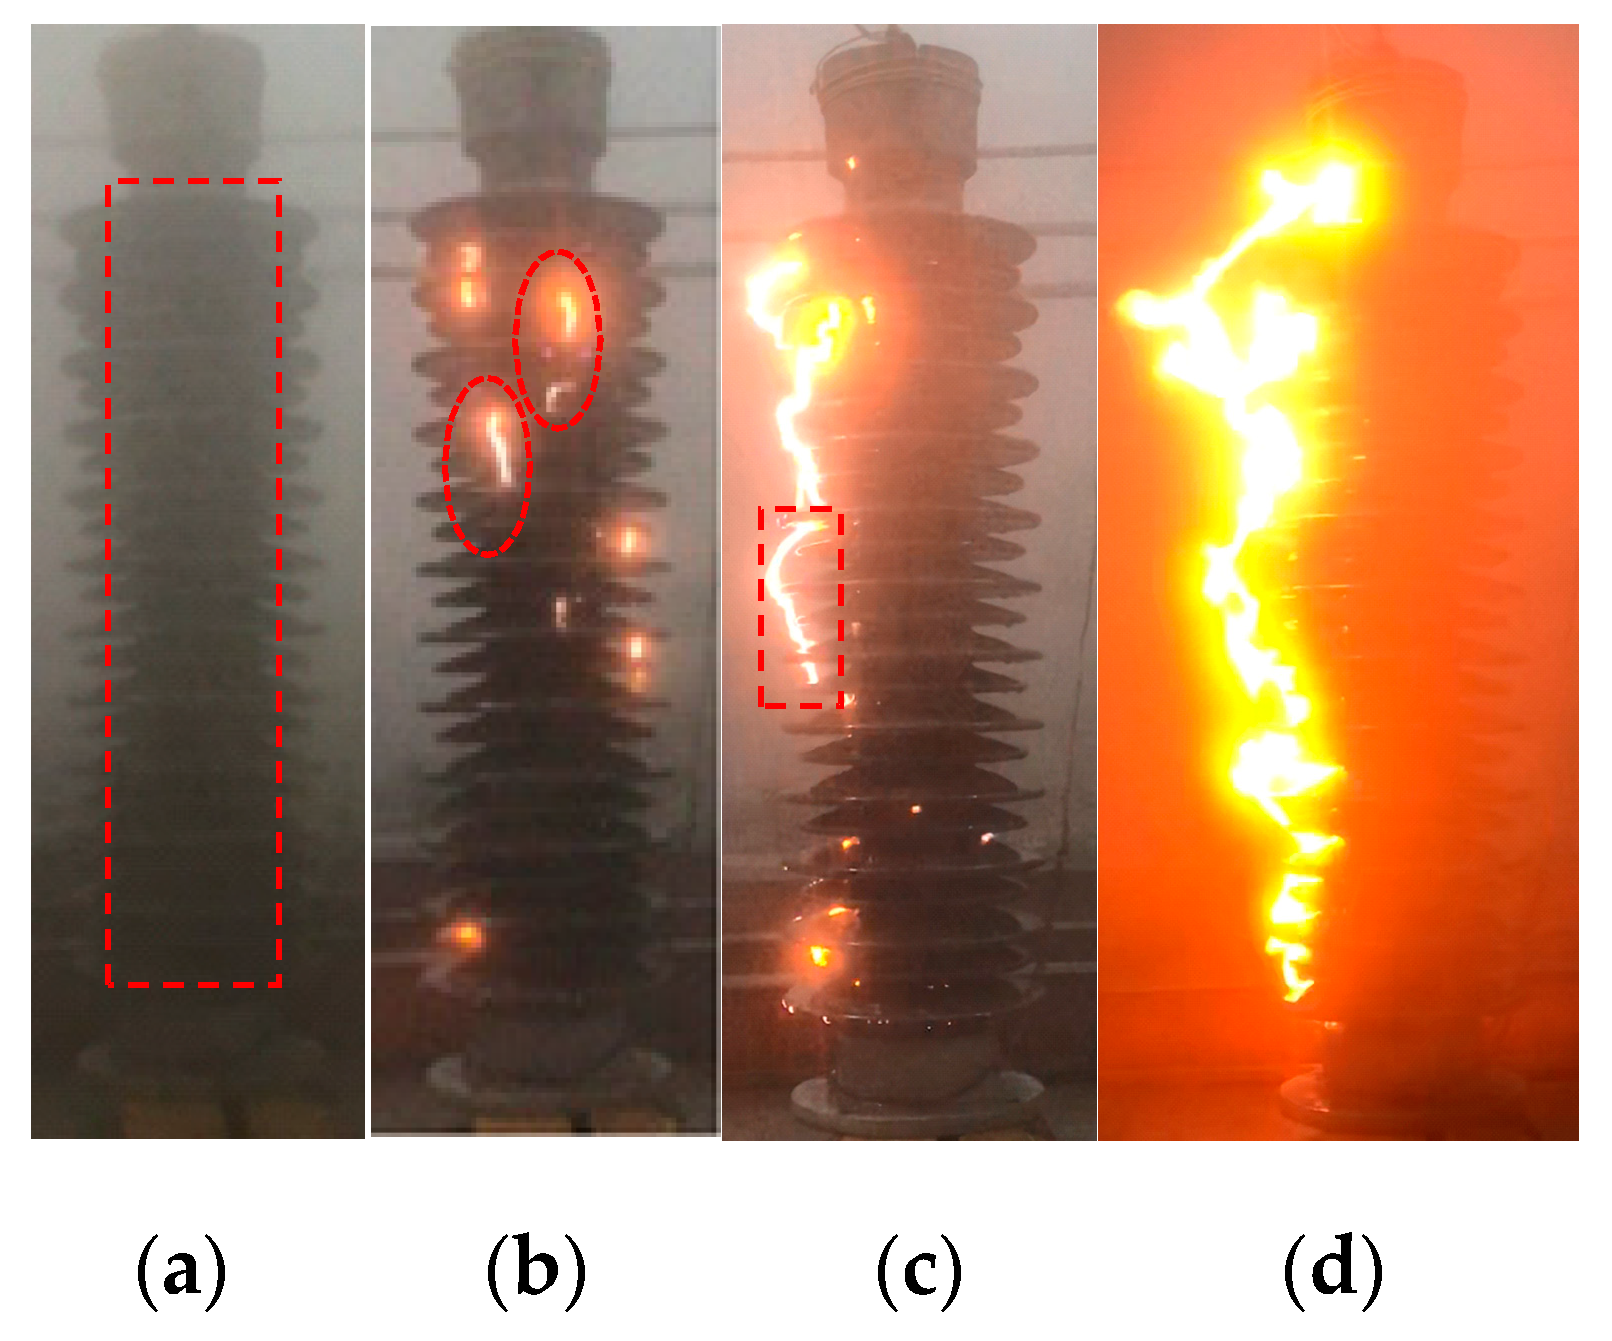
3.2. Experimental Validation

The flashover tests were carried out in a multifunction artificial climate chamber, with the height of 11.6 m and the diameter of 7.8 m. The power system can provide 600 kV/0.5 A DC voltage during tests, which ensures that the voltage ripple factor is less than 3.0% when the load current is 0.5 A. The Schematic diagram of the test circuit has been shown in literature [14,15]. The test power supply satisfies the requirements recommended by [29].
The samples were polluted by solid layer method according to IEC standard [29] referring to Figure 12. Sodium chloride and kaoline were used to simulate the conductive and inert materials on the polluted insulator, respectively. In order to study the non-uniformity between the windward and leeward sides and the non-uniformity between top and bottom surfaces was not the aim of this paper, therefore, the pollution degree of the top and bottom surfaces was simplified to be the same. The ratio of SDD to NSDD is fixed at one-sixth in all the tests.
After applying pollution, the insulators were placed in the shade and dried naturally for 24 h. Before DC voltage was applied, the insulator surface pollution layer was wetted with steam fog. During the tests, the average voltage method [30] was adopted to obtain the average flashover voltage (Uave). Uave and its relative standard deviation error are established by following equation:
{ U a v e = i 1 N U f ( i ) / N σ % = i 1 N ( U f ( i ) U a v e ) 2 N 1 × 100 % U a v e
where Uf(i) is a flashover voltage, kV; i represents the sequence number of each test; N is the number of all valid tests.
The pollution flashover tests under different non-uniformity were carried out according to above test procedure. Figure 13 shows the discharge process when SDD = 0.05 mg/cm2, m = 1:8, and k = 45%. (Figure 13a–d represent the discharge conditions as time increases, respectively.) The area in the red box of Figure 13a is the leeside side of the insulator. It can be obtained from Figure 13 that, under non-uniform pollution between windward and leeward sides, most of the partial discharges first occur at the leeward side, and the main arc, which develops into the flashover, is also generated at the leeward side. Therefore, the assumption that the dominant arc is at the leeward side is consistent with the arc development path.
In order to verify whether the assumption about the arc root radius in Section 2.2 is reasonable, the flashover test under the condition of SDD = 0.15 mg/cm2, m = 1:3 and k = 25% was carried out and the arc root radius was measured. The arc propagation process is shown in Figure 14 where the width of the arc gradually increases. By using Image J, which is an image processing software, and taking the diameter of the post insulator (D = 270 mm) as the measuring ruler, the arc root radius of each stage was measured and the results are shown in Figure 14. The results indicate that the arc root radius is between 0 and 0.54 cm in the development process, which ensures it is reasonable to take the two arc root radii in Section 2.2, i.e., r0 = 0.1 and 0.3 cm, to analyze its effect on the residual pollution layer resistance.
The comparison of theoretical and experimental results is shown in Table 2. It can be obtained from the table:
(1) The standard deviation of all test results is less than 7%, indicating that the dispersion of the test results is small.
(2) The calculated results with flashover dynamic model are in good agreement with the experimental results, most relative error within ±10%, which verifies the proposed residual resistance formulation and the DC flashover model under non-uniform pollution between windward and leeward sides in this paper. Some relative errors are higher, reaching 13.6%, possibly due to ignoring the effect of temperature changes on the residual resistance and the presence of multi-arc randomness and air-gap arc.

4. Results and Discussion

According to the flashover model above, the flashover characteristics of post insulator and the factors affecting insulator flashover voltage are analyzed. The effects of m and k on Ucal under different SDD are shown in the following three-dimensional diagram, Figure 15, where the three surfaces from top to bottom represent the flashover voltage distribution under SDD = 0.05, 0.10, and 0.15 mg/cm2 respectively.
Taking the flashover voltages when SDD = 0.05 mg/cm2 in Figure 15 as an example, the influence rule of m is illustrated as follows:
(1) The pollution flashover voltage of post insulator is related to salt deposit density ratio m. Specifically, under certain SDD and k, the more serious non-uniform pollution is (or the smaller m is), the lower the Ucal is. For example, the Ucal is 90.6, 82.6, 74.8, and 65.1 kV respectively when k = 35% and m is 1/1, 1/3, 1/5, and 1/8. Compared with the uniform pollution, the flashover voltage of m = 1/3, 1/5 and 1/8 decreases by 8.8%, 17.4%, and 28.1%, respectively.
(2) Under different k values, the downtrend of Ucal makes difference. The smaller k is, the sharper the trend of decrease. When k = 35% or 45%, the flashover voltages corresponding to adjacent m values only decrease by 5.7–9.7 kV, while the voltage drop of k = 25% is between 8.6 and 10.8 kV.
The decrease of Ucal is also related to k, and the variation trend of Ucal is exampled as follows when SDD = 0.10 mg/cm2.
(3) Under certain SDD and m, Ucal increases slightly with the increase of k. For example, when m = 1/3 and k = 25%, 35% and 45%, Ucal is 60.0, 63.3 and 64.7 kV respectively, which indicates that there is an increase of 5.5% and 7.8% when k increases from 25% to 45%.
(4) The rising trend of Ucal is relatively milder under a higher k, resulting in relatively little effect on Ucal.
Based on the equation ( U = a · SDD b ), the values of Ucal and SDD were fitted, and its results are presented in Table 3.
(5) All the fitting degrees are satisfied, therefore, under non-uniform pollution between windward and leeward sides, Ucal and SDD still satisfy the relationship of negative power function.
(6) The non-uniform pollution (m and k) has little effect on the pollution characteristic index b. b ranges from 0.36 to 0.39 and varies slightly around 0.36 (the characteristic index under uniform pollution). The effect of m and k on b is slight enough to be ignored. That is to say, the influence of SDD and the non-uniform pollution between windward and leeward sides on DC flashover voltage is independent from each other, which agrees with the experimental results in the literature [3,14,15].
(7) The coefficient a increases with the increase of m and k. For example, when k = 25%, compared with the uniform pollution, the coefficient a of m = 1/3, 1/5, and 1/8 decreases by 15.5%, 29.1%, and 39.5%, respectively. k has a slighter influence on a than m, to be specific, when m = 1/5 and k increases from 25% to 45%, and a merely increases by 12.8%.

5. Conclusions

This paper presents a residual resistance formulation under non-uniform pollution between windward and leeward sides, which is based on two circular electrodes model on a conductive plane and the narrow rectangular formula of Wilkins. The main advantage of the proposed formulation is that salt deposit density ratio, leeward side area proportion and the change of arc root radius with the leakage current can be taken into account. The analytical values of this formulation are in good agreement with the numerical results using COMSOL Multiphysics.
The proposed resistance formulation is then applied in a flashover dynamic model, which considers time-varying arc root radius and leakage current. Its results are compared with experimental results conducted in the artificial climate chamber. The good concordance validates the proposed resistance formulation and the flashover dynamic model.
The flashover characteristics of post insulator under non-uniform pollution between windward and leeward sides are analyzed using the dynamic model. The affecting factors are presented as follows:
(1) This non-uniformity lowers the DC flashover voltage Ucal. Ucal decreases markedly with the decrease of m and increases slightly with the increase of k. And the influence of m on Ucal is greater than that of k.
(2) Non-uniform pollution between windward and leeward sides has independent influence on Ucal of post insulator from SDD. The relationship between Ucal and SDD still fits power function.

Author Contributions

X.J. and Z.Z. conceived and designed this work; S.Y. performed the simulations and experiments; S.Y. and Z.Z. analyzed the data; X.Q., Y.X., and D.Z. assisted in the experiments and recorded the data; S.Y. wrote the paper.

Funding

This research was funded by the Jiangsu Natural Science Foundation Project (No. BK20181021).

Conflicts of Interest

The authors declare no conflict of interest.

References

  1. Zhang, Z.; You, J.; Wei, D.; Jiang, X.; Zhang, D.; Bi, M. Investigations on AC pollution flashover performance of insulator string under different non-uniform pollution conditions. IET Gener. Transm. Distrib. 2016, 10, 437–443. [Google Scholar] [CrossRef]
  2. Zhang, R.; Wu, G.; Yuan, T. Analysis on natural contamination characteristics of UHV AC post porcelain insulator. In Proceedings of the 2016 China International Conference on Electricity Distribution (CICED), Xi’an, China, 10–13 August 2016; pp. 1–8. [Google Scholar]
  3. Zhang, Z.; Qiao, X.; Zhang, Y.; Tian, L.; Zhang, D.; Jiang, X. AC flashover performance of different shed configurations of composite insulators under fan-shaped non-uniform pollution. High Volt. 2018, 3, 199–206. [Google Scholar] [CrossRef]
  4. Sun, J.; Gao, G.; Wu, G.; Cao, X.; Zhu, G. Influence of pollution distribution on insulator surface on flashover characteristics. IEEE Trans. Dielectr. Electr. Insul. 2014, 21, 1637–1646. [Google Scholar] [CrossRef]
  5. Karamousantas, D.C.; Chatzarakis, G.E.; Oikonomou, D.S.; Ekonomou, L.; Karampelas, P. Effective insulator maintenance scheduling using artificial neural networks. IET Gener. Transm. Distrib. 2010, 479–484. [Google Scholar] [CrossRef]
  6. Zhang, Z.; Qiao, X.; Yang, S.; Jiang, X. Non-Uniform Distribution of Contamination on Composite Insulators in HVDC Transmission Lines. Appl. Sci. 2018, 8, 1962. [Google Scholar] [CrossRef]
  7. Vita, V.; Ekonomou, L.; Chatzarakis, G.E. Design of artificial neural network models for the estimation of distribution system voltage insulators’ contamination. In Proceedings of the 12th WSEAS International Conference on Mathematical Methods, Computational Techniques and Intelligent Systems (MAMECTIS’10), Sousse, Tunisia, 3–6 May 2010; pp. 227–231. [Google Scholar]
  8. Pappas, S.S.; Ekonomou, L.; Heraklion, Ν. Comparison of adaptive techniques for the prediction of the equivalent salt deposit density of medium voltage insulators. WSEAS Trans. Power Syst. 2017, 12, 220–224. [Google Scholar]
  9. Gençoğlu, M.T.; Cebeci, M. The pollution flashover on high voltage insulators. Electr. Power Syst. Res. 2008, 78, 1914–1921. [Google Scholar] [CrossRef]
  10. Bessedik, S.A.; Hadi, H.; Volat, C.; Jabbari, M. Refinement of residual resistance calculation dedicated to polluted insulator flashover models. IEEE Trans. Dielectr. Electr. Insul. 2014, 21, 1207–1215. [Google Scholar] [CrossRef]
  11. Jabbari, M.; Volat, C.; Fofana, I. Application of a new dynamic numerical model to predict polluted insulator flashover voltage. In Proceedings of the 2014 IEEE Electrical Insulation Conference (EIC), Philadelphia, PA, USA, 8–11 June 2014. [Google Scholar]
  12. Abimouloud, A.; Arif, S.; Korichi, D.; Ale-Emran, S.M. Prediction of DC flashover voltage of cap-andpin polluted insulator. IET Sci. Meas. Technol. 2019, 13, 279–286. [Google Scholar] [CrossRef]
  13. Volat, C.; Farzaneh, M.; Mhaguen, N. Improved fem models of one- and two-arcs to predict ac critical flashover voltage of ice-covered insulators. IEEE Trans. Dielectr. Electr. Insul. 2011, 18, 393–400. [Google Scholar] [CrossRef]
  14. Zhang, Z.; Zhang, D.; You, J.; Zhao, J.; Jiang, X.; Hu, J. Study on the DC flashover performance of various types of insulators with fan-shaped nonuniform pollution. IEEE Trans. Power Deliv. 2015, 30, 1871–1879. [Google Scholar] [CrossRef]
  15. Zhang, D.; Zhang, Z.; Jiang, X.; Zhang, W.; Zhao, J.; Bi, M. Influence of fan-shaped non-uniform pollution on the electrical property of typical type HVDC insulator and insulation selection. IET Gener. Transm. Distrib. 2016, 10, 3555–3562. [Google Scholar] [CrossRef]
  16. Zhang, Z.; You, J.; Zhang, D.; Jiang, X.; Hu, J.; Zhang, W. AC flashover performance of various types of insulators under fan-shaped non-uniform pollution. IEEE Trans. Dielectr. Electr. Insul. 2016, 23, 1760–1768. [Google Scholar] [CrossRef]
  17. Boudissa, R.; Bayadi, A.; Baersch, R. Effect of pollution distribution class on insulators flashover under AC voltage. Electr. Power Syst. Res. 2013, 104, 176–182. [Google Scholar] [CrossRef]
  18. Sundararajan, R.; Gorur, R.S. Dynamic arc modeling of pollution flashover of insulators under DC voltage. IEEE Trans. Dielectr. Electr. Insul. 1993, 28, 209–218. [Google Scholar] [CrossRef]
  19. Wilkins, R. Flashover voltage of high-voltage insulators with uniform surface-pollution films. Proc. Inst. Electr. Eng. 1969, 116, 457–465. [Google Scholar] [CrossRef]
  20. Jabbari, M.; Volat, C.; Farzaneh, M. A new single-arc AC dynamic FEM model of arc propagation on ice surfaces. In Proceedings of the 2013 IEEE Electrical Insulation Conference (EIC), Ontario, ON, Canada, 2–5 June 2013; pp. 360–364. [Google Scholar]
  21. Edmonds, D.S., Jr.; Corson, M.R. The resistance between two contacts in a plane and the capacitance between paraxial cylinders. Am. J. Phys. 1986, 54, 811–816. [Google Scholar] [CrossRef]
  22. Li, Y.; Yang, H.; Zhang, Q.; Yang, X.; Yu, X.; Zhou, J. Pollution flashover calculation model based on characteristics of AC partial arc on top and bottom wet-polluted dielectric surfaces. IEEE Trans. Dielectr. Electr. Insul. 2014, 21, 1735–1746. [Google Scholar] [CrossRef]
  23. Topalis, F.V.; Gonos, I.F.; Stathopulos, I.A. Dielectric behaviour of polluted porcelain insulators. IEE Proc.-Gener. Transm. Distrib. 2001, 148, 269–274. [Google Scholar] [CrossRef] [Green Version]
  24. Slama, M.; Beroual, A.; Hadi, H. Analytical computation of discharge characteristic constants and critical parameters of flashover of polluted insulators. IEEE Trans. Dielectr. Electr. Insul. 2010, 17, 1764–1771. [Google Scholar] [CrossRef]
  25. Zhang, Z.; Zhao, J.; Zhang, D.; Jiang, X.; Li, Y.; Wu, B.; Wu, J. Study on the dc flashover performance of standard suspension insulator with ring-shaped non-uniform pollution. High Volt. 2018, 3, 133–139. [Google Scholar] [CrossRef]
  26. Sundararajan, R.; Gorur, R.S. Role of non-soluble contaminants on the flashover voltage of porcelain insulators. IEEE Trans. Dielectr. Electr. Insul. 1996, 3, 113–118. [Google Scholar] [CrossRef]
  27. Hampton, B.F. Flashover mechanism of polluted insulation. Proc. Inst. Electr. Eng. 2010, 111, 985–990. [Google Scholar] [CrossRef]
  28. Zhang, Z.; Jiang, X.; Chao, Y.; Chen, L.; Sun, C.; Hu, J. Study on DC pollution flashover performance of various types of long string insulators under low atmospheric pressure conditions. IEEE Trans. Power Deliv. 2010, 25, 2132–2142. [Google Scholar] [CrossRef]
  29. Artificial Pollution Tests on High-Voltage Insulators to Be Used on dc. Systems; IEC Tech. Rep. 1245.; IEC: Geneva, Switzerland, 1993.
  30. Zhang, Z.; Jiang, X.; Sun, C.; Hu, J.; Huang, H. Study of the influence of test methods on DC pollution flashover voltage of insulator strings and its flashover process. IEEE Trans. Dielectr. Electr. Insul. 2010, 17, 1787–1795. [Google Scholar] [CrossRef]
Figure 1. Non-uniform pollution between windward and leeward sides on insulator surface.
Energies 12 02345 g001
Figure 2. Obenaus circuit model.
Energies 12 02345 g002
Figure 3. Schematic diagram of residual pollution layer resistance.
Energies 12 02345 g003
Figure 4. Schematic diagram of staining.
Energies 12 02345 g004
Figure 5. Conductive layers under non-uniform pollution between windward side and leeward side.
Energies 12 02345 g005
Figure 6. Schematic diagram of the upper pollution layer resistance R2(x, I).
Energies 12 02345 g006
Figure 7. Relationship between residual pollution layer resistance and arc length.
Energies 12 02345 g007
Figure 8. Two-dimensional cross-section of the pollution layer.
Energies 12 02345 g008
Figure 9. Distributions of the potential and current density lines.
Energies 12 02345 g009
Figure 10. Comparison of R(x) between numerical values and analytical calculation.
Energies 12 02345 g010
Figure 11. Flow chart of DC pollution flashover dynamic model.
Energies 12 02345 g011
Figure 12. Schematic diagram of staining in the tests.
Energies 12 02345 g012
Figure 13. Flashover process of post insulator.
Energies 12 02345 g013
Figure 14. Measurement of arc root radius r0.
Energies 12 02345 g014
Figure 15. The effects of m and k on Ucal under different SDD.
Energies 12 02345 g015
Table 1. Parameters of post insulator.
Shed Parameters (mm)Leakage Distance (mm)Structure Diagram
L1 = 753528 Energies 12 02345 i001
L2 = 58
H1 = 69
H2 = 39
D = 270
H = 1050
Table 2. Results of validation test. SDD: salt deposit density.
Test ConditionExperimental Values Uave(kV)σ,%Theoretical Values Ucal (kV)Relative Error ΔU,%
SDD = 0.05 mg/cm2m = 1:1k = 25%83.23.990.68.9
m = 1:5k = 25%72.02.170.1−2.6
m = 1:5k = 35%73.85.874.81.3
SDD = 0.10 mg/cm2m = 1:3k = 35%60.32.563.35.0
m = 1:1k = 35%64.75.273.513.6
m = 1:8k = 45%57.56.254.9−4.5
SDD = 0.15 mg/cm2m = 1:8k = 25%45.03.439.2−12.8
m = 1:5k = 25%49.53.946.2−6.7
m = 1:8k = 45%50.14.944.7−10.8
Δ U = ( U c a l U a v e ) / U a v e × 100 % , Uave is experimental flashover voltage, Ucal is theoretical flashover voltage.
Table 3. Fitting results.
mk
25%35%45%
ababab
1:130.90.3630.90.3630.90.36
1:326.10.3727.10.3728.10.37
1:521.90.3922.80.3924.70.38
1:818.70.3920.60.3821.90.39

