Influence of Permeability and Injection Orientation Variations on Dispersion Coefficient during Enhanced Gas Recovery by CO2 Injection

 ,
,
Abstract
:1. Introduction
2. Materials and Methods
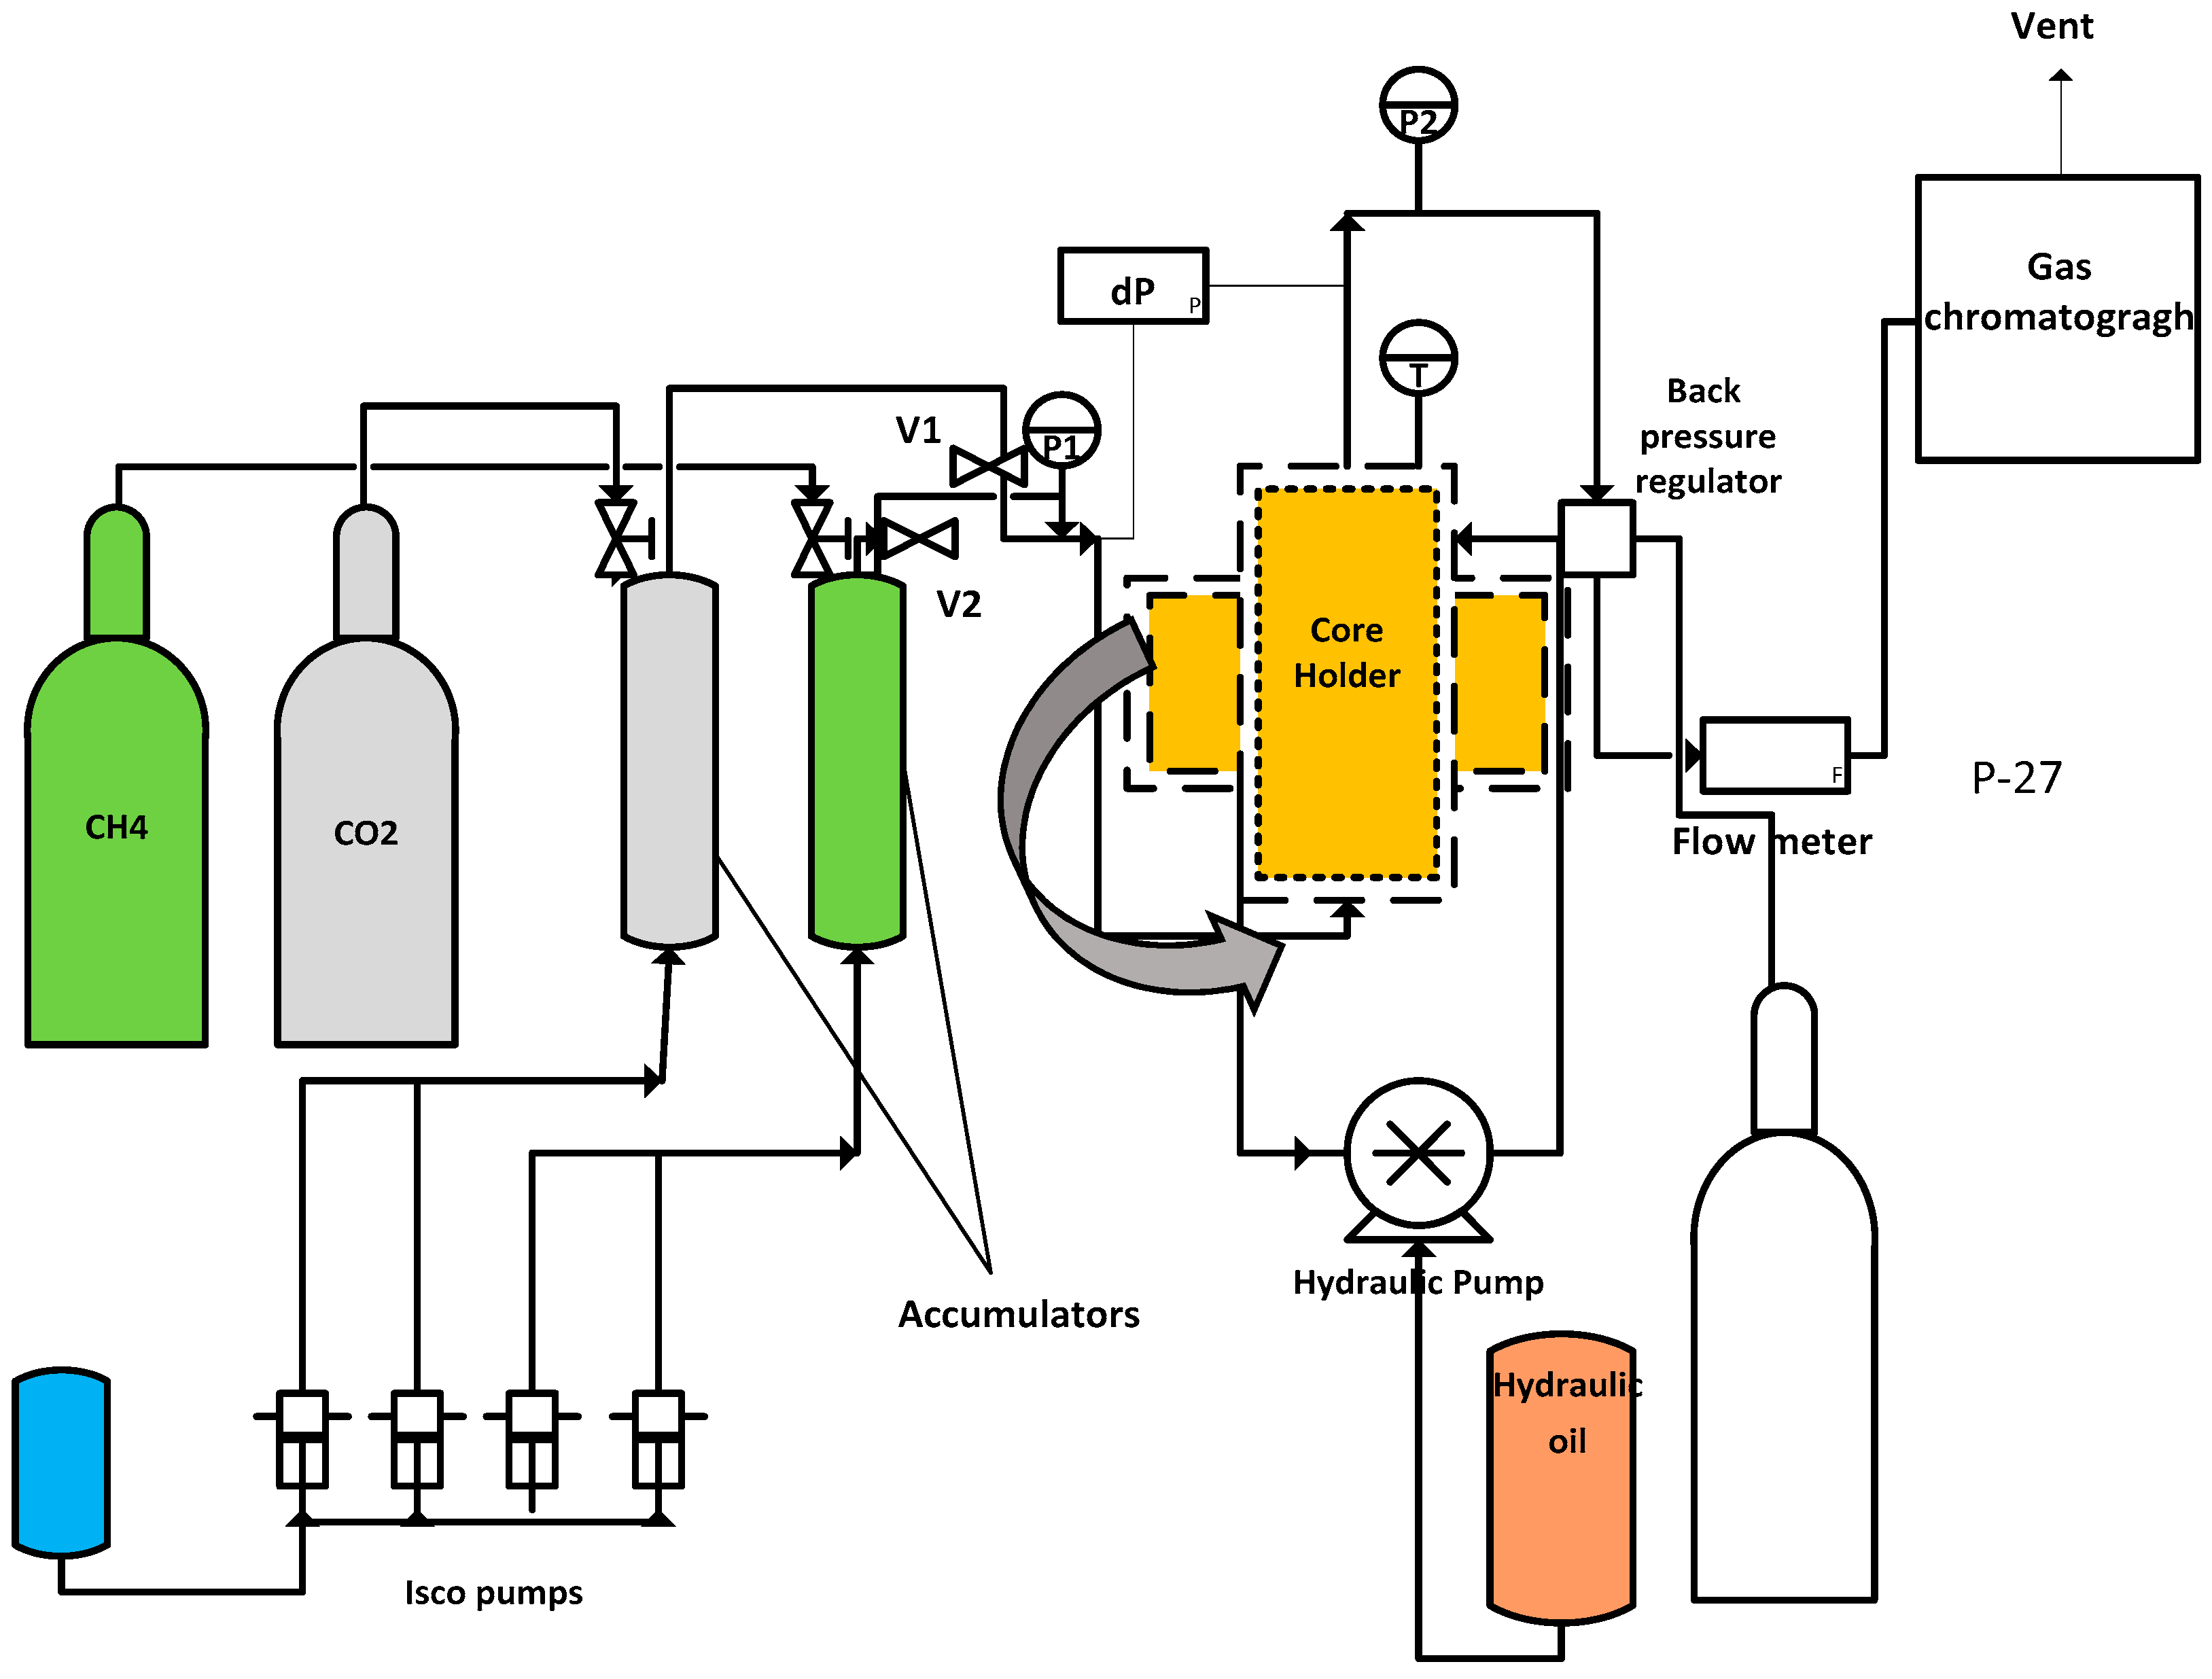
Apparatus and Procedure
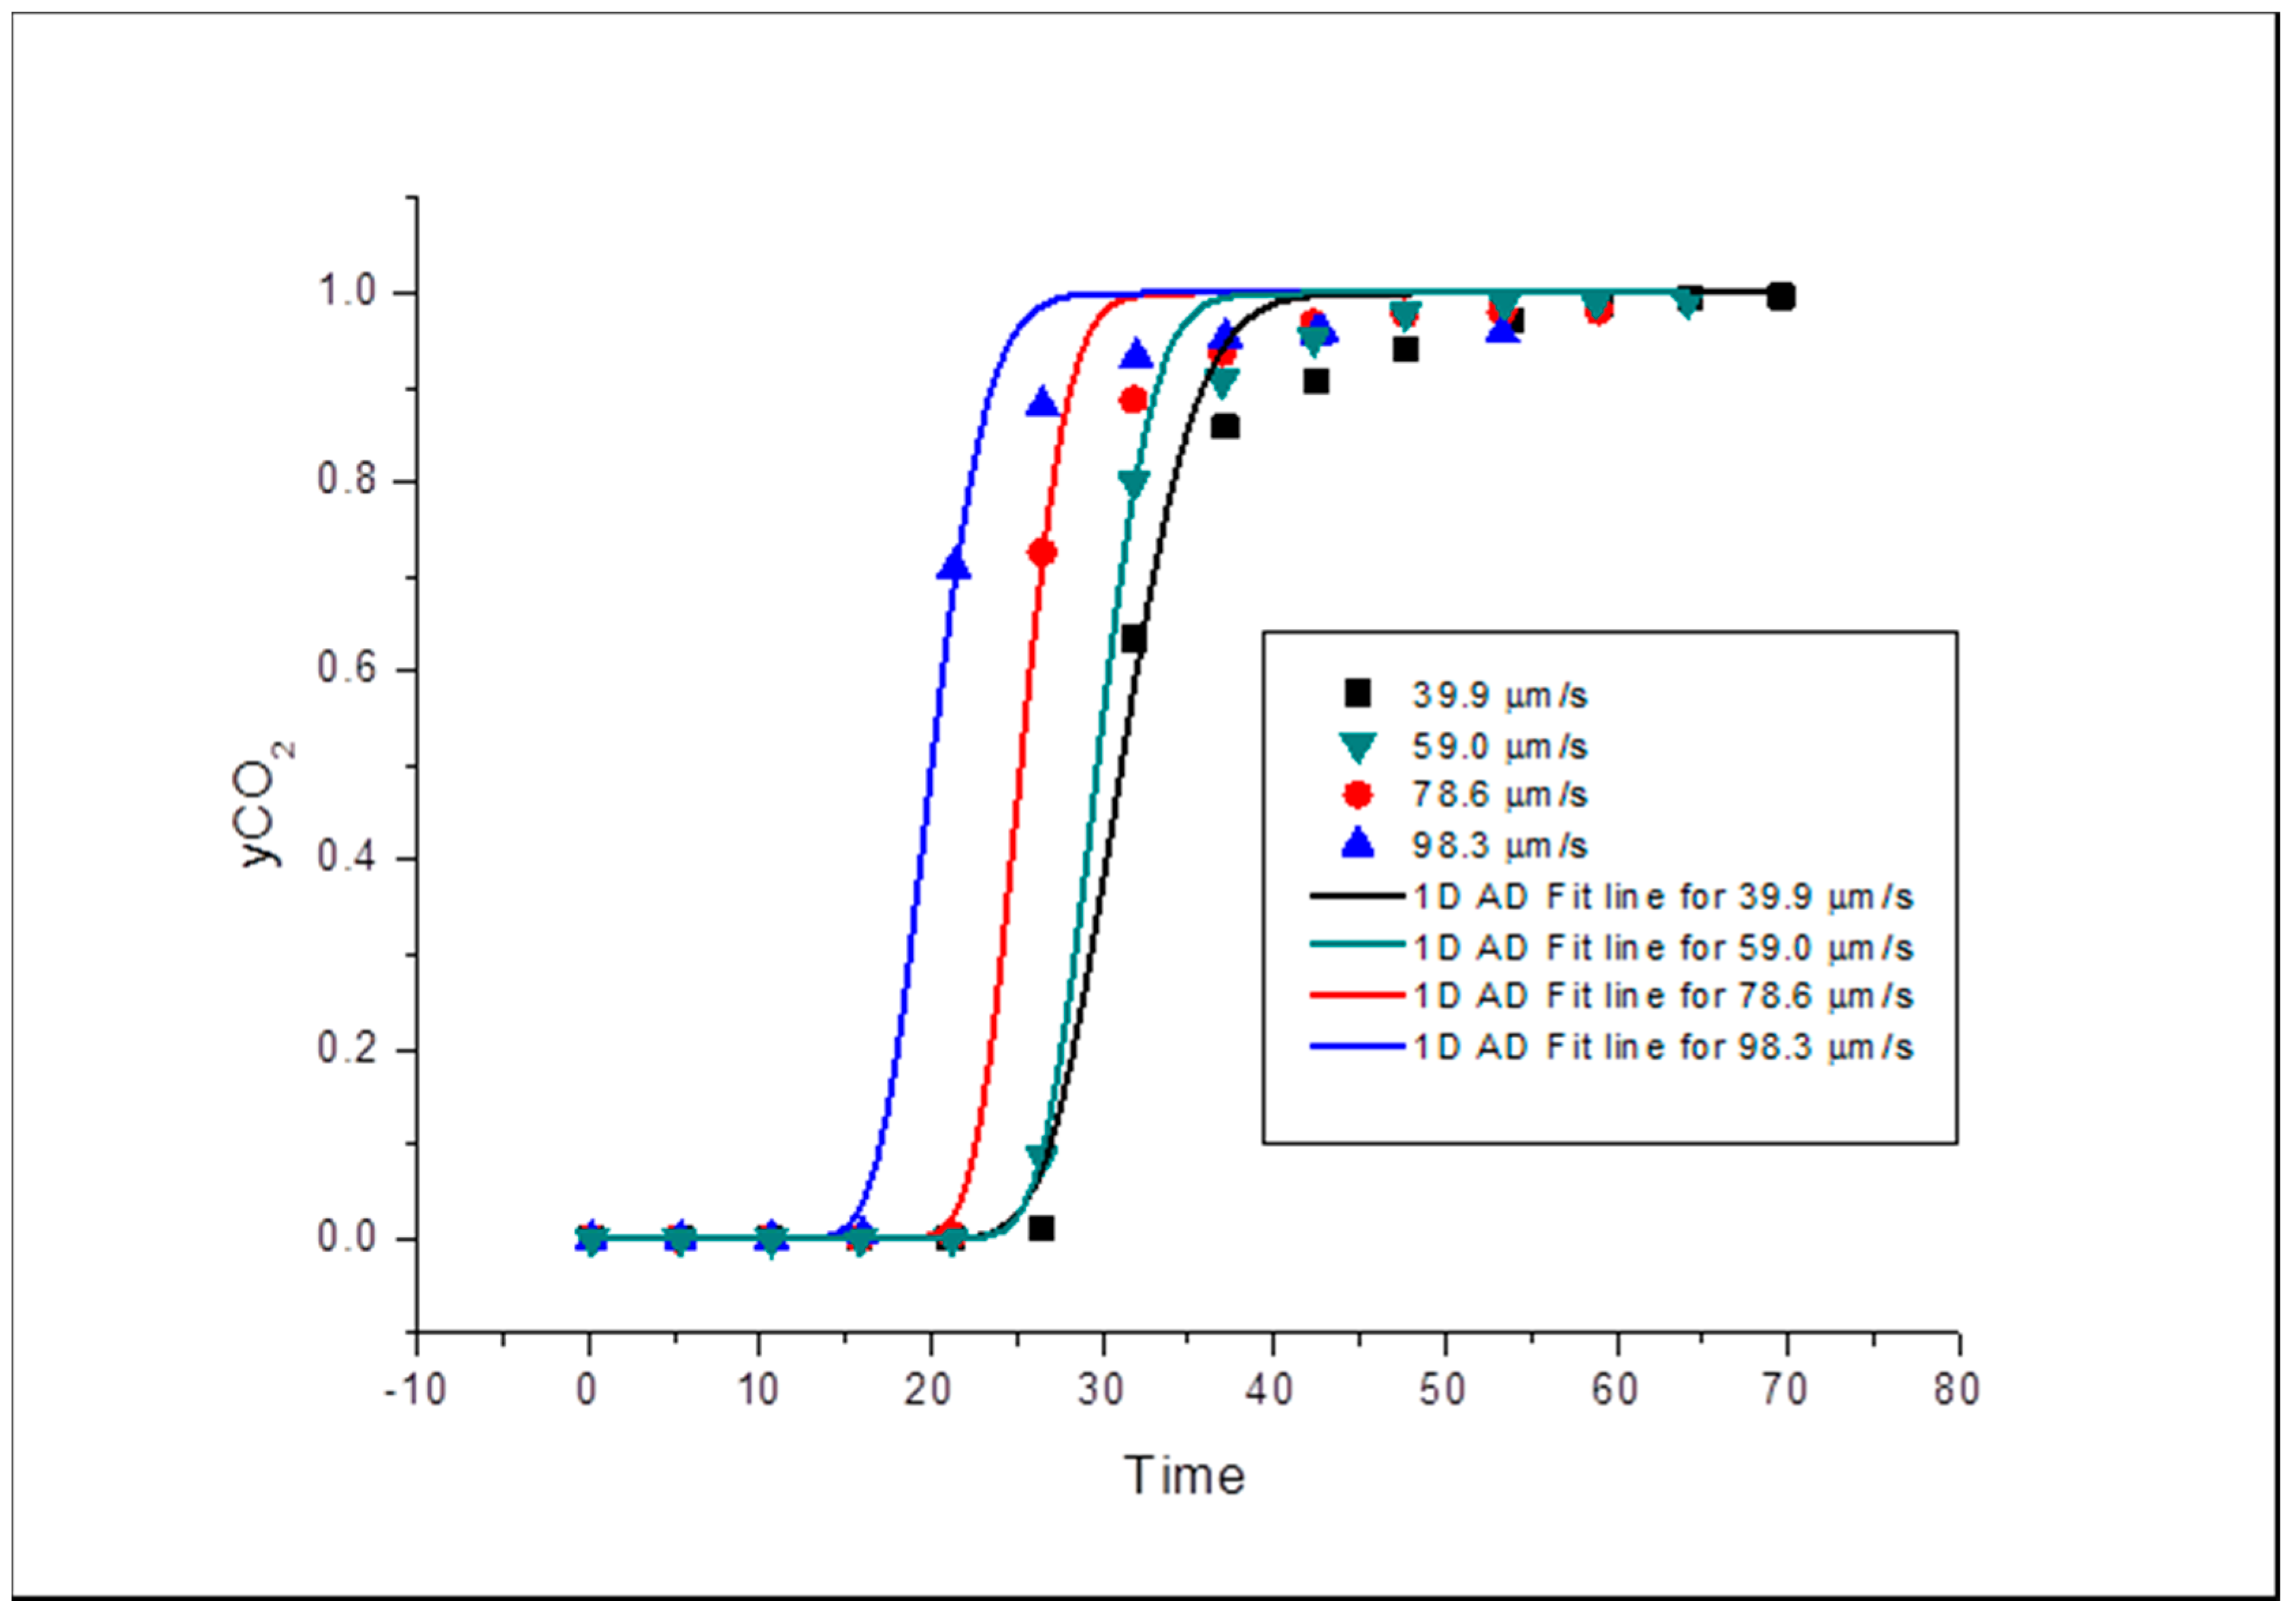
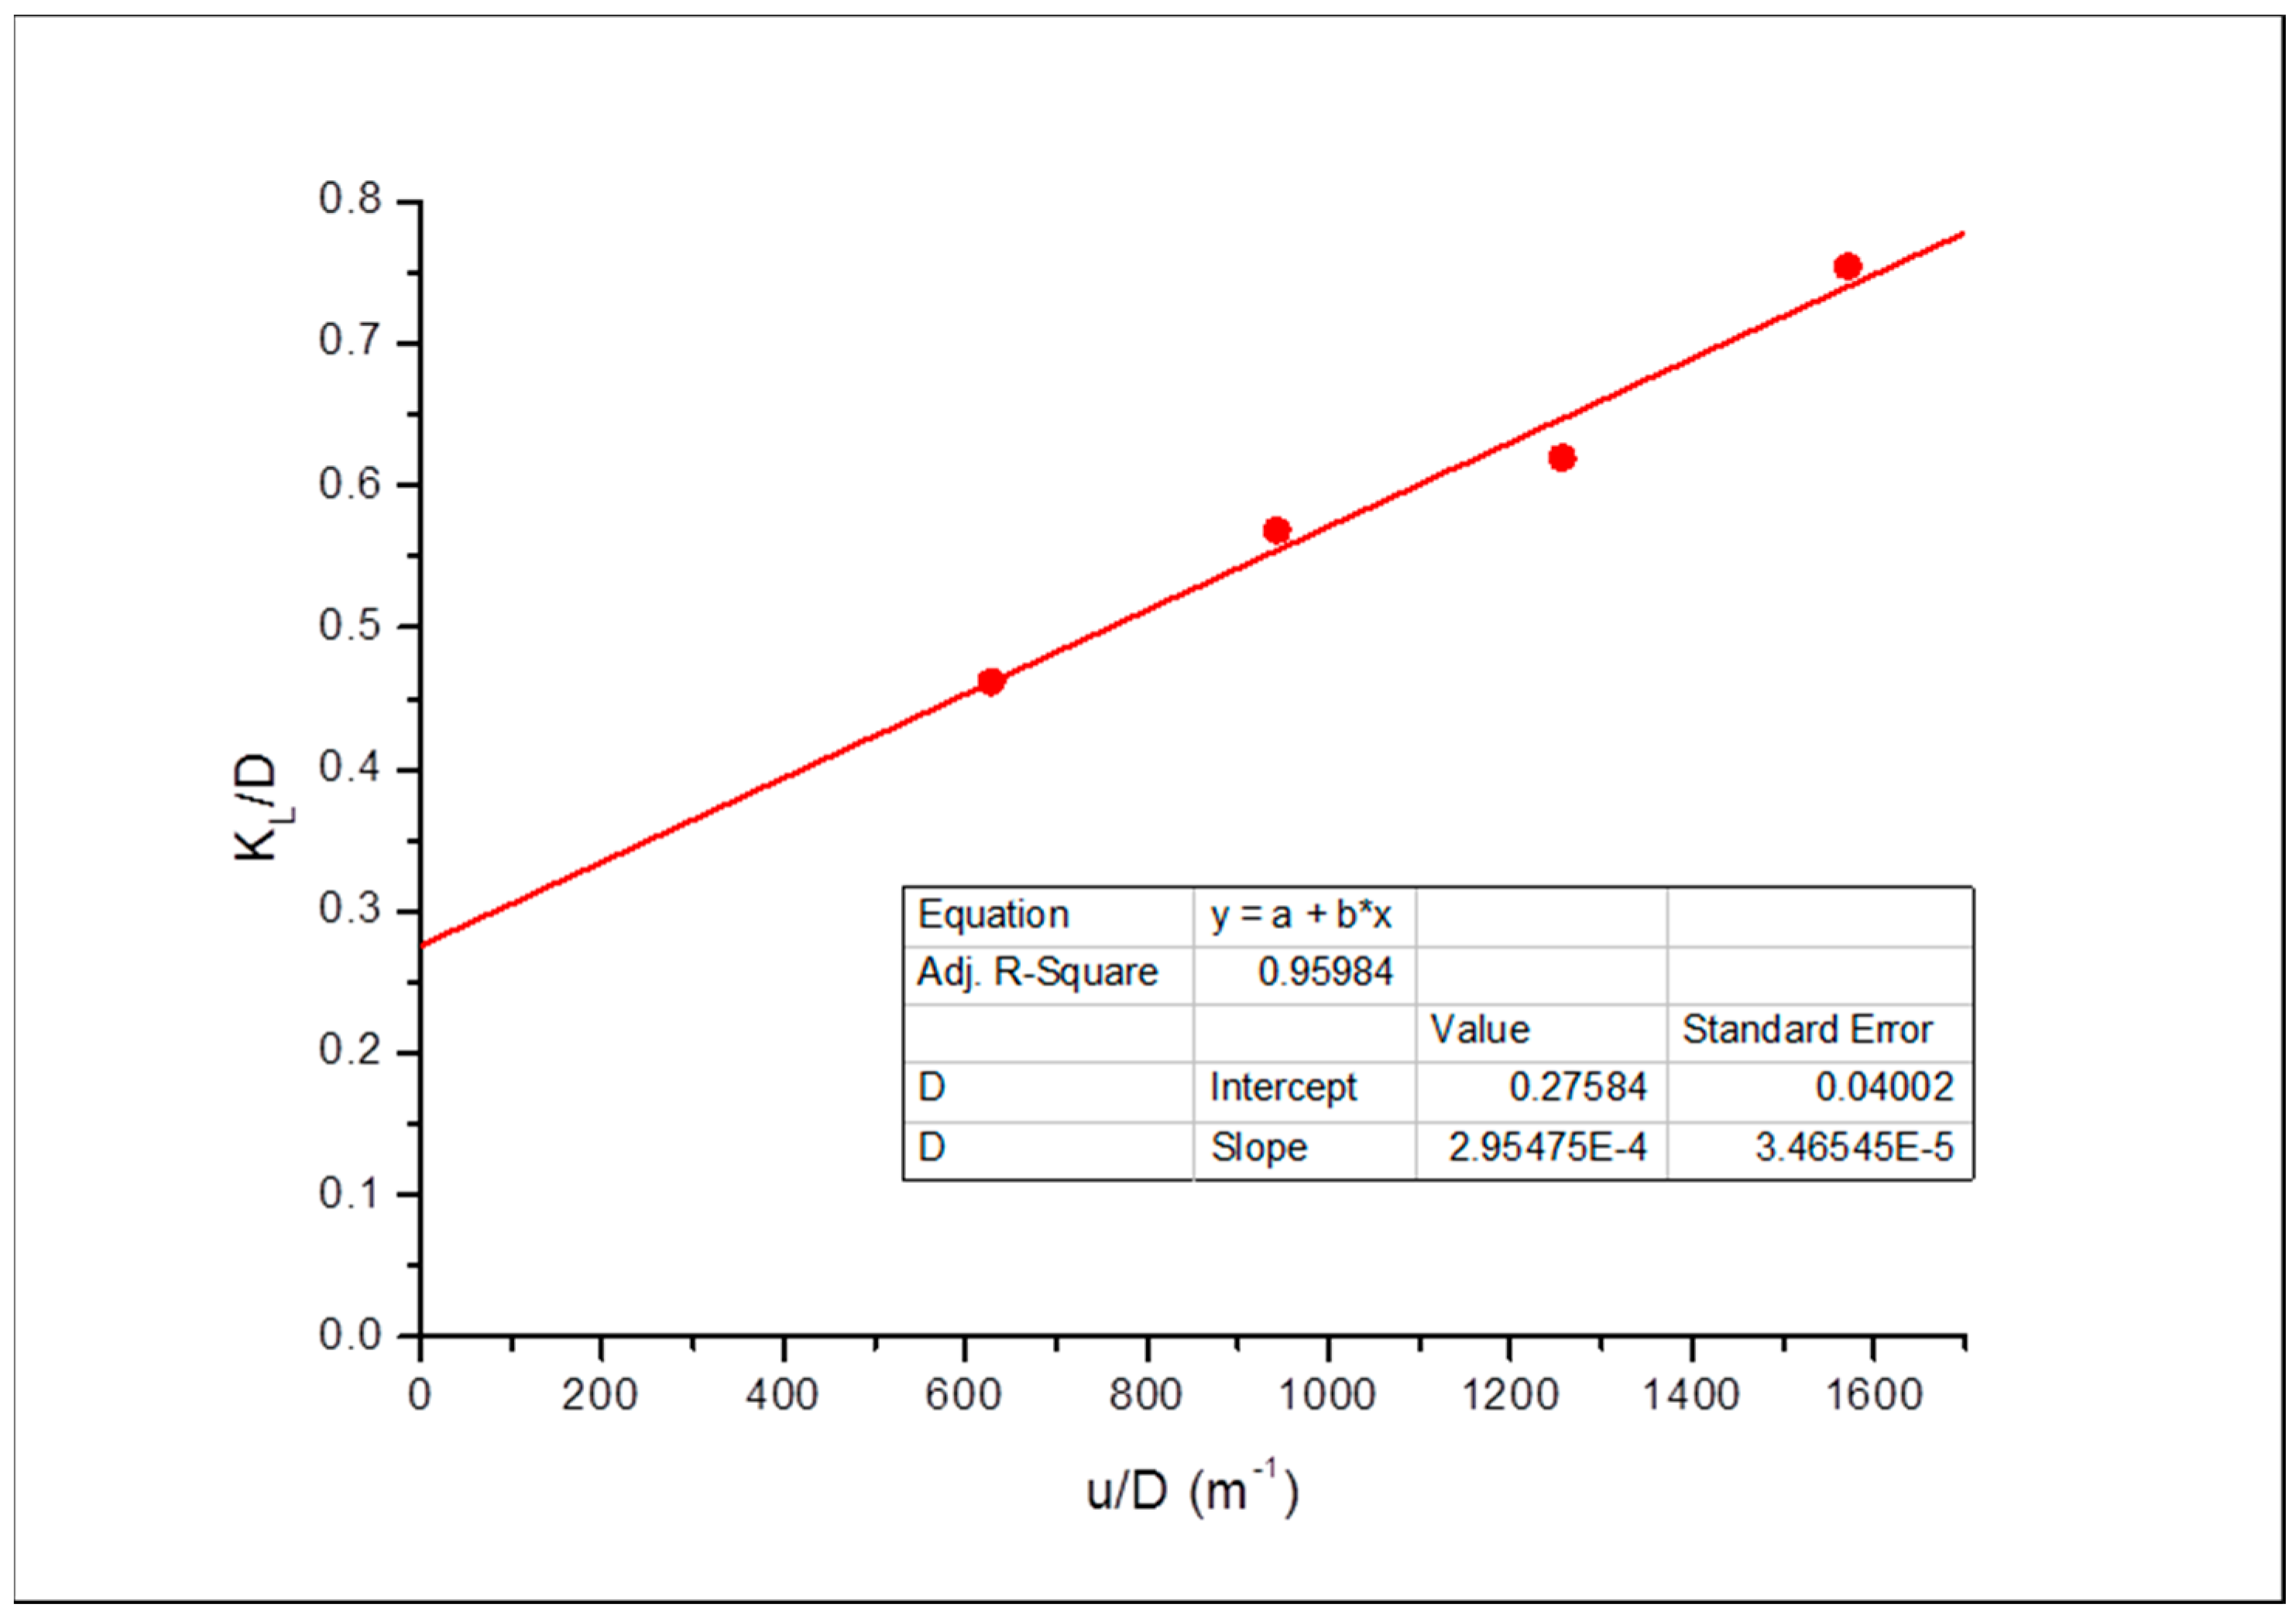
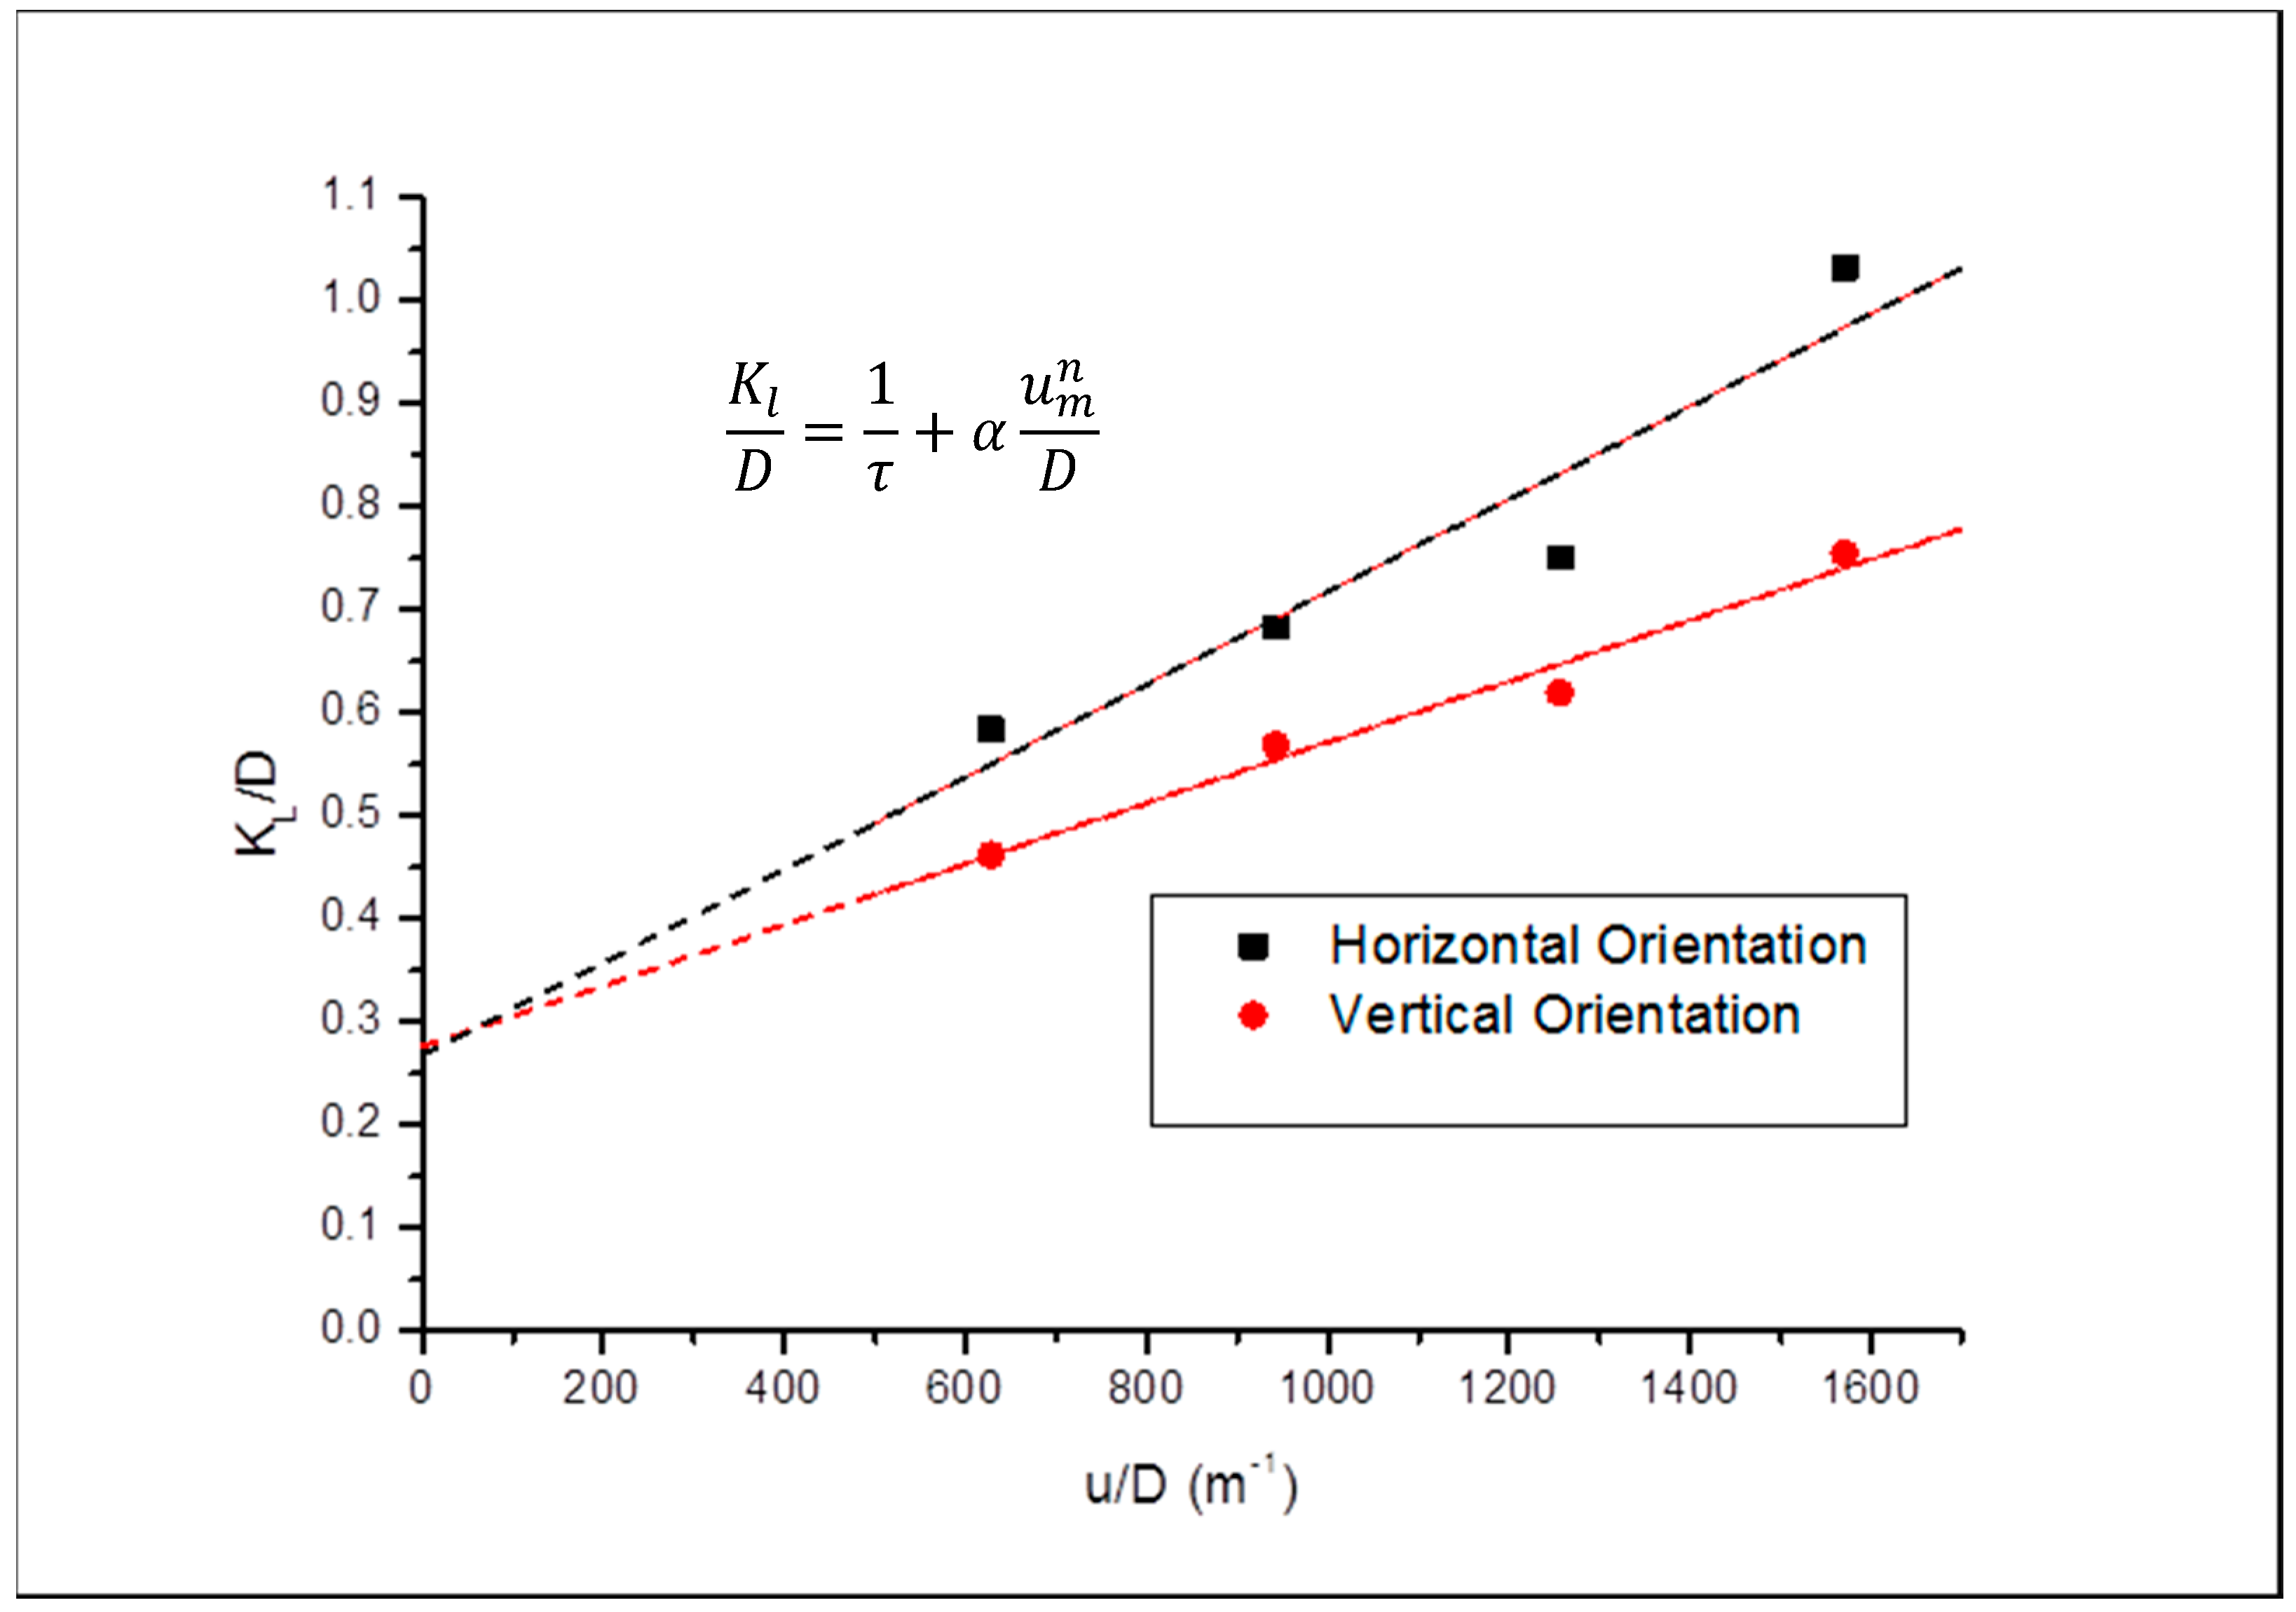
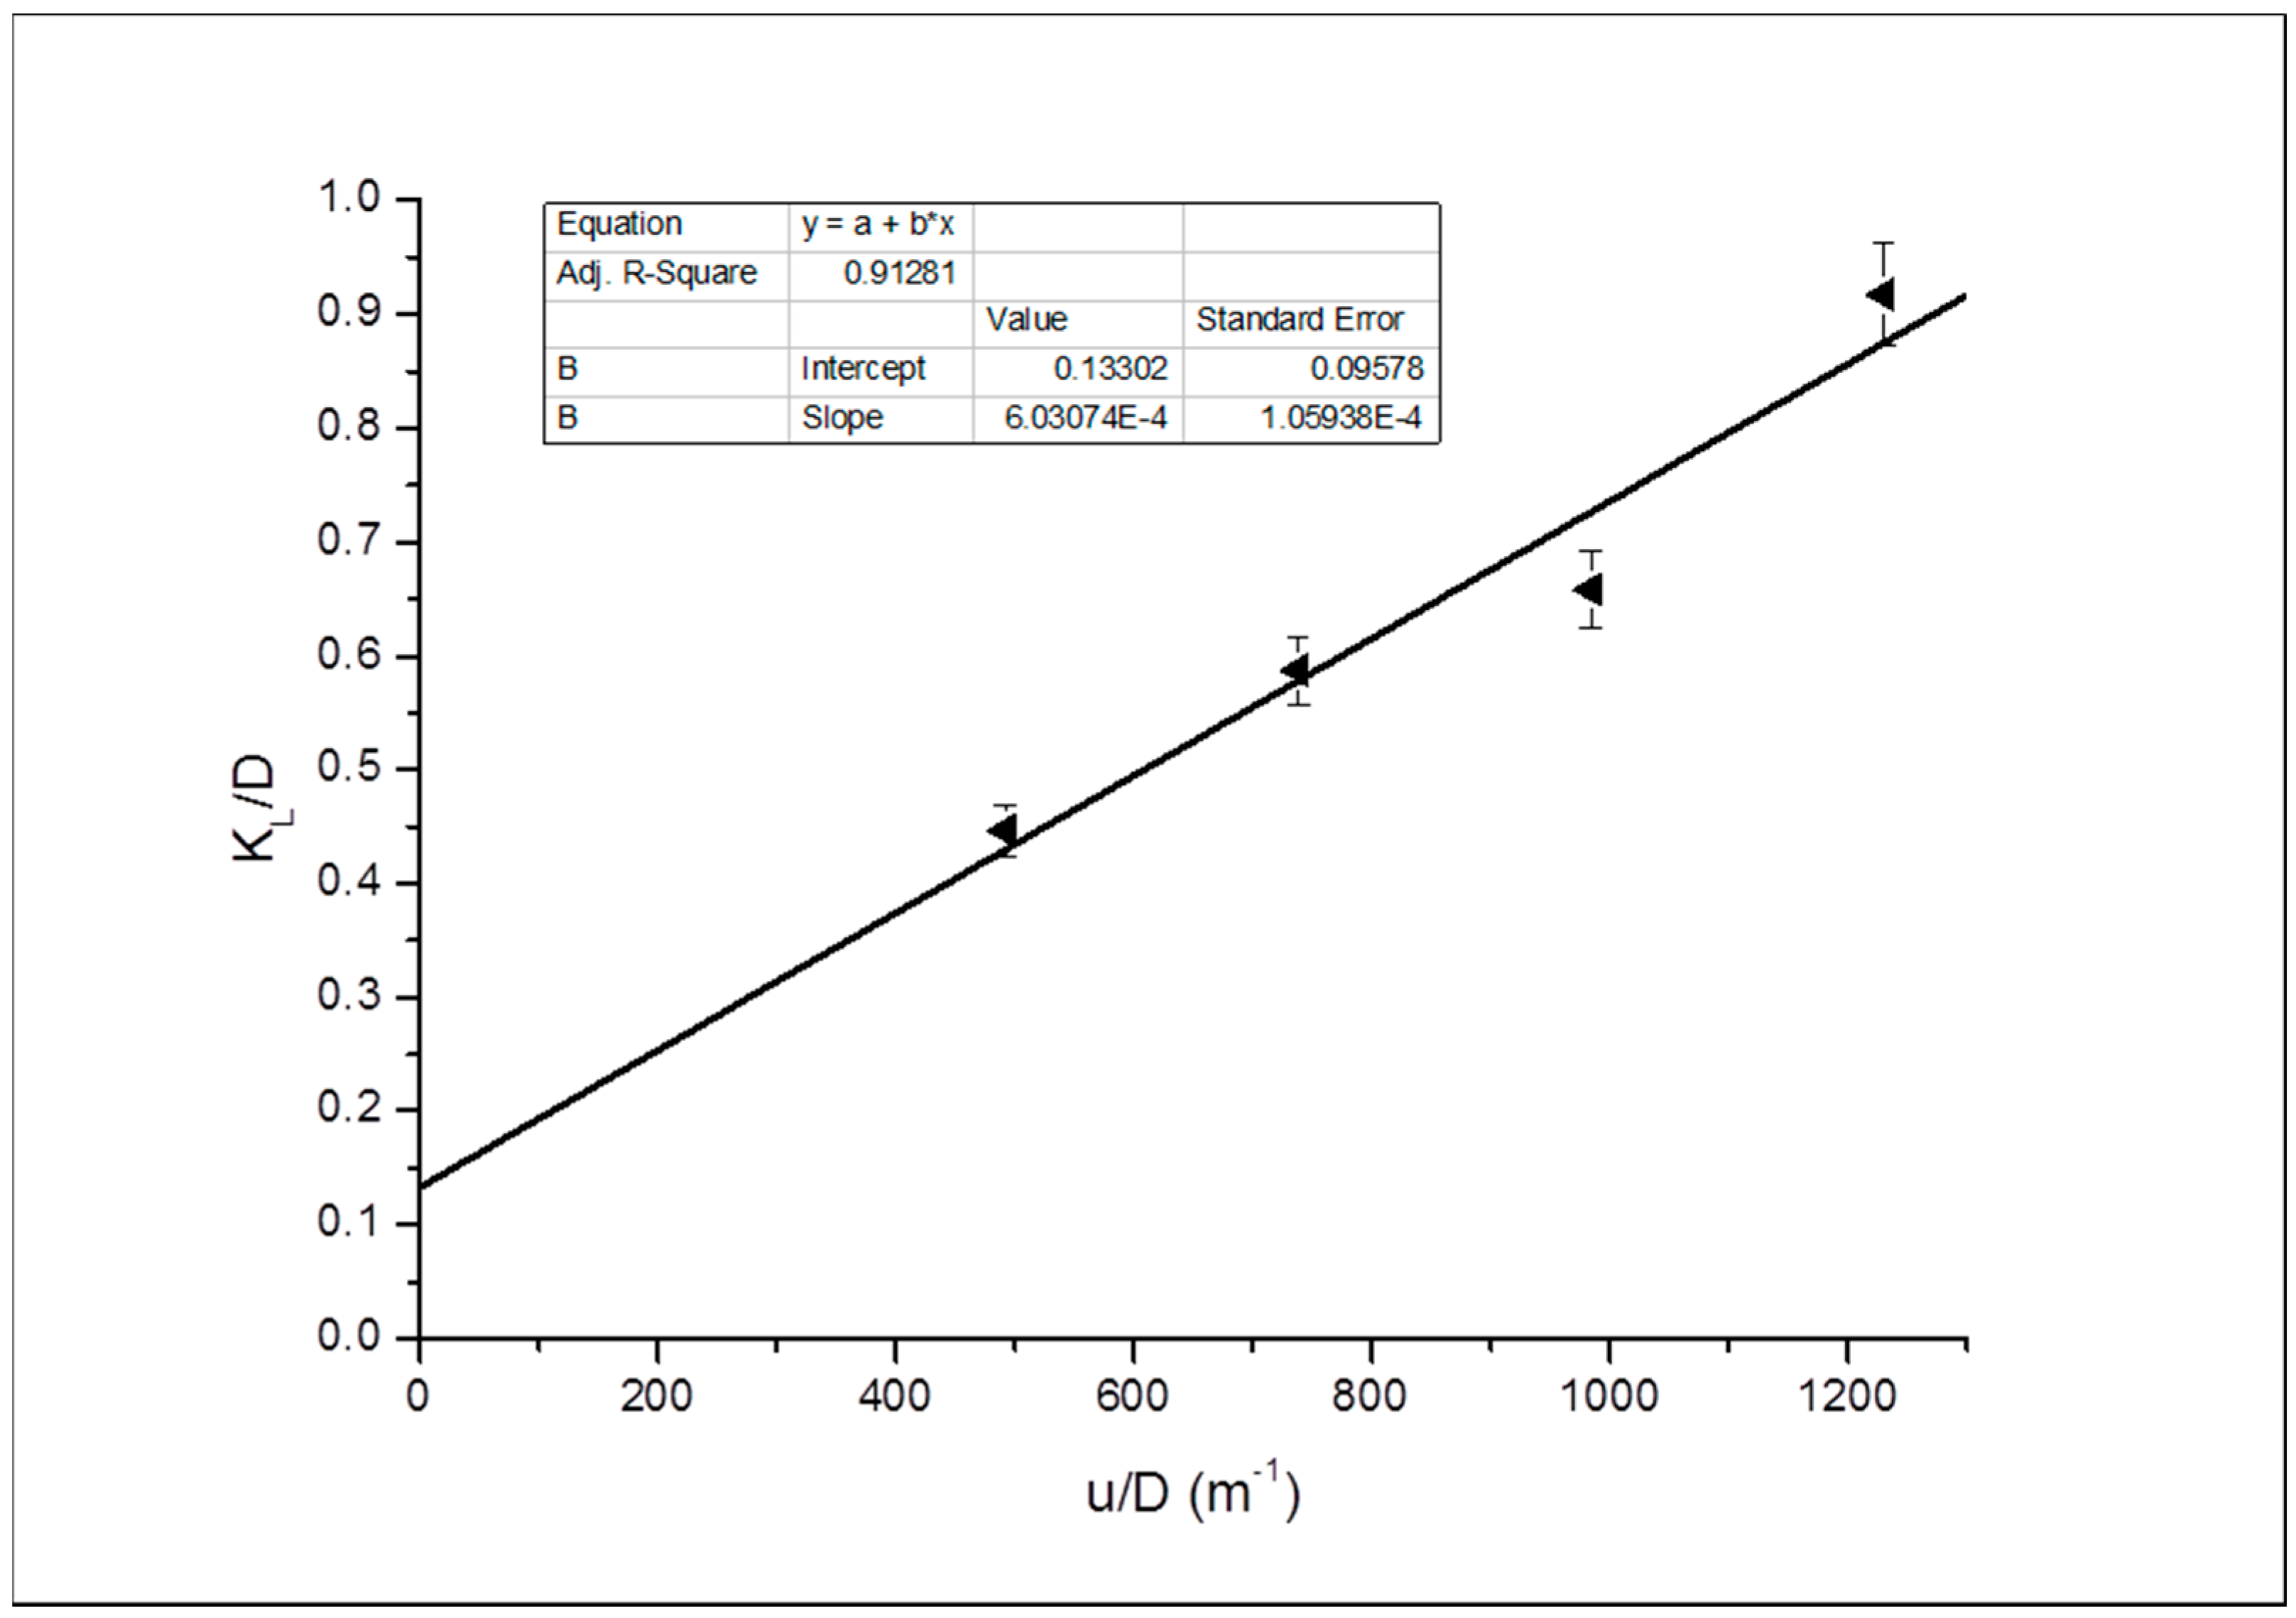
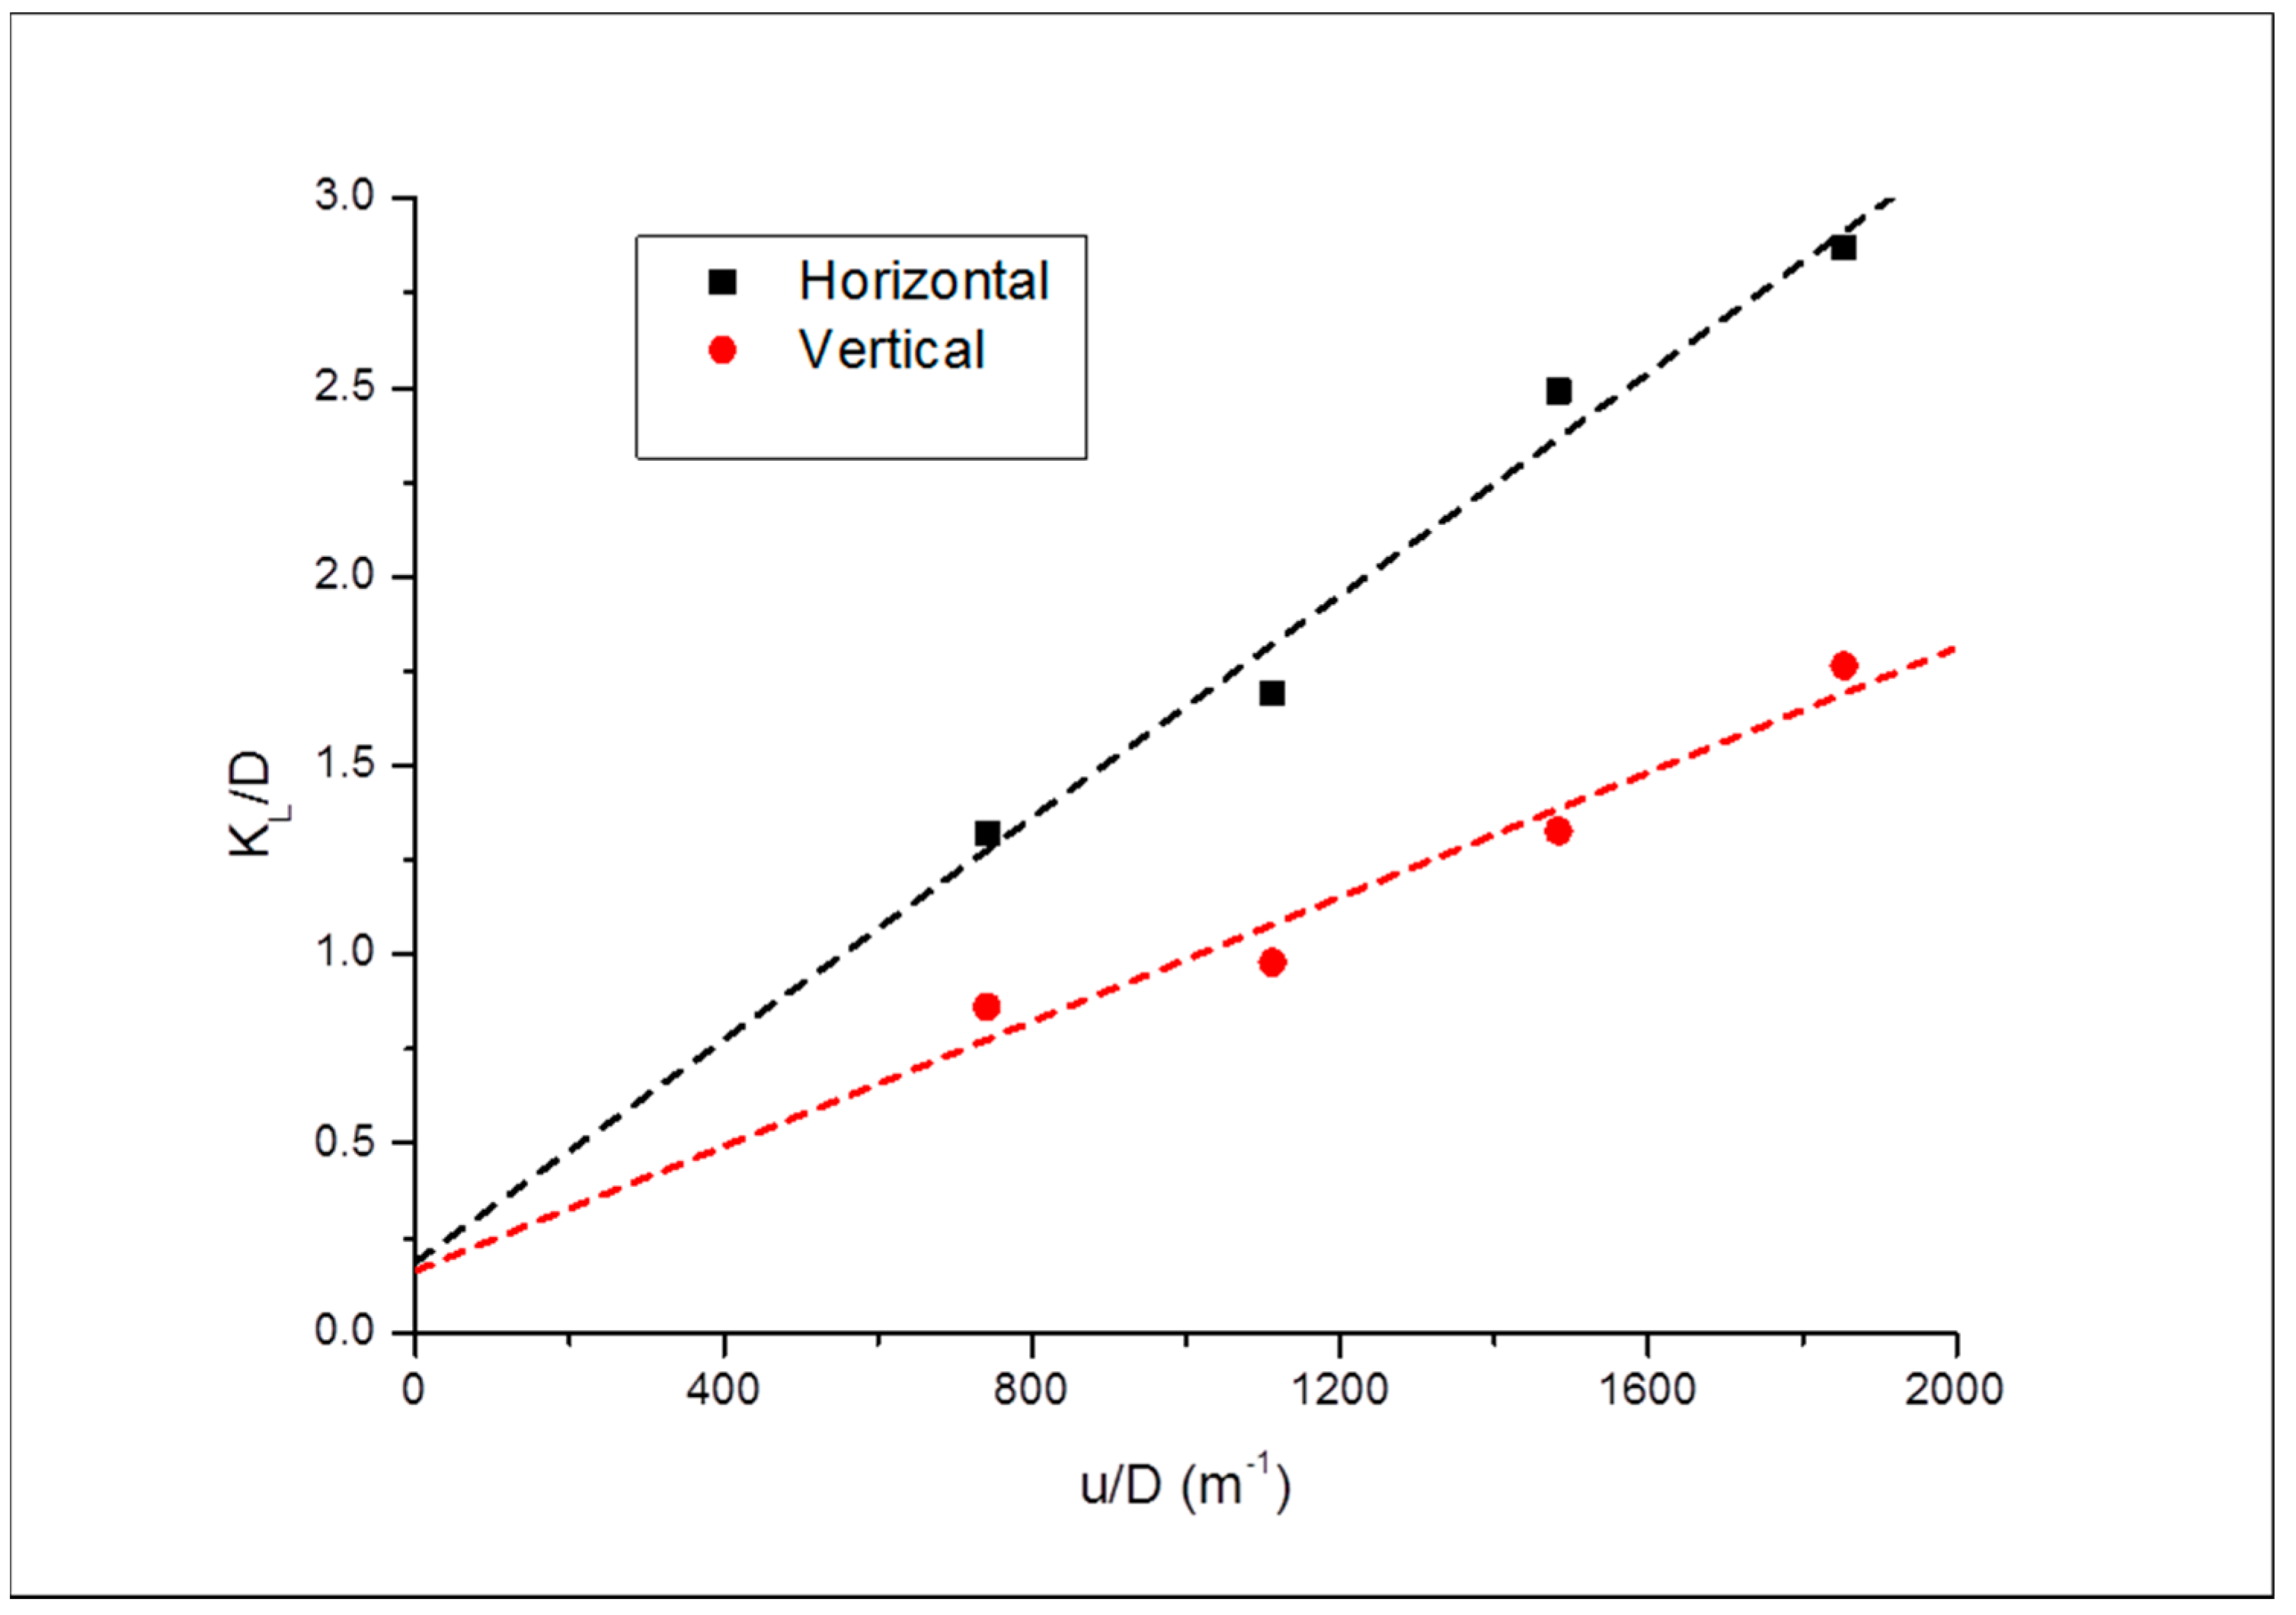
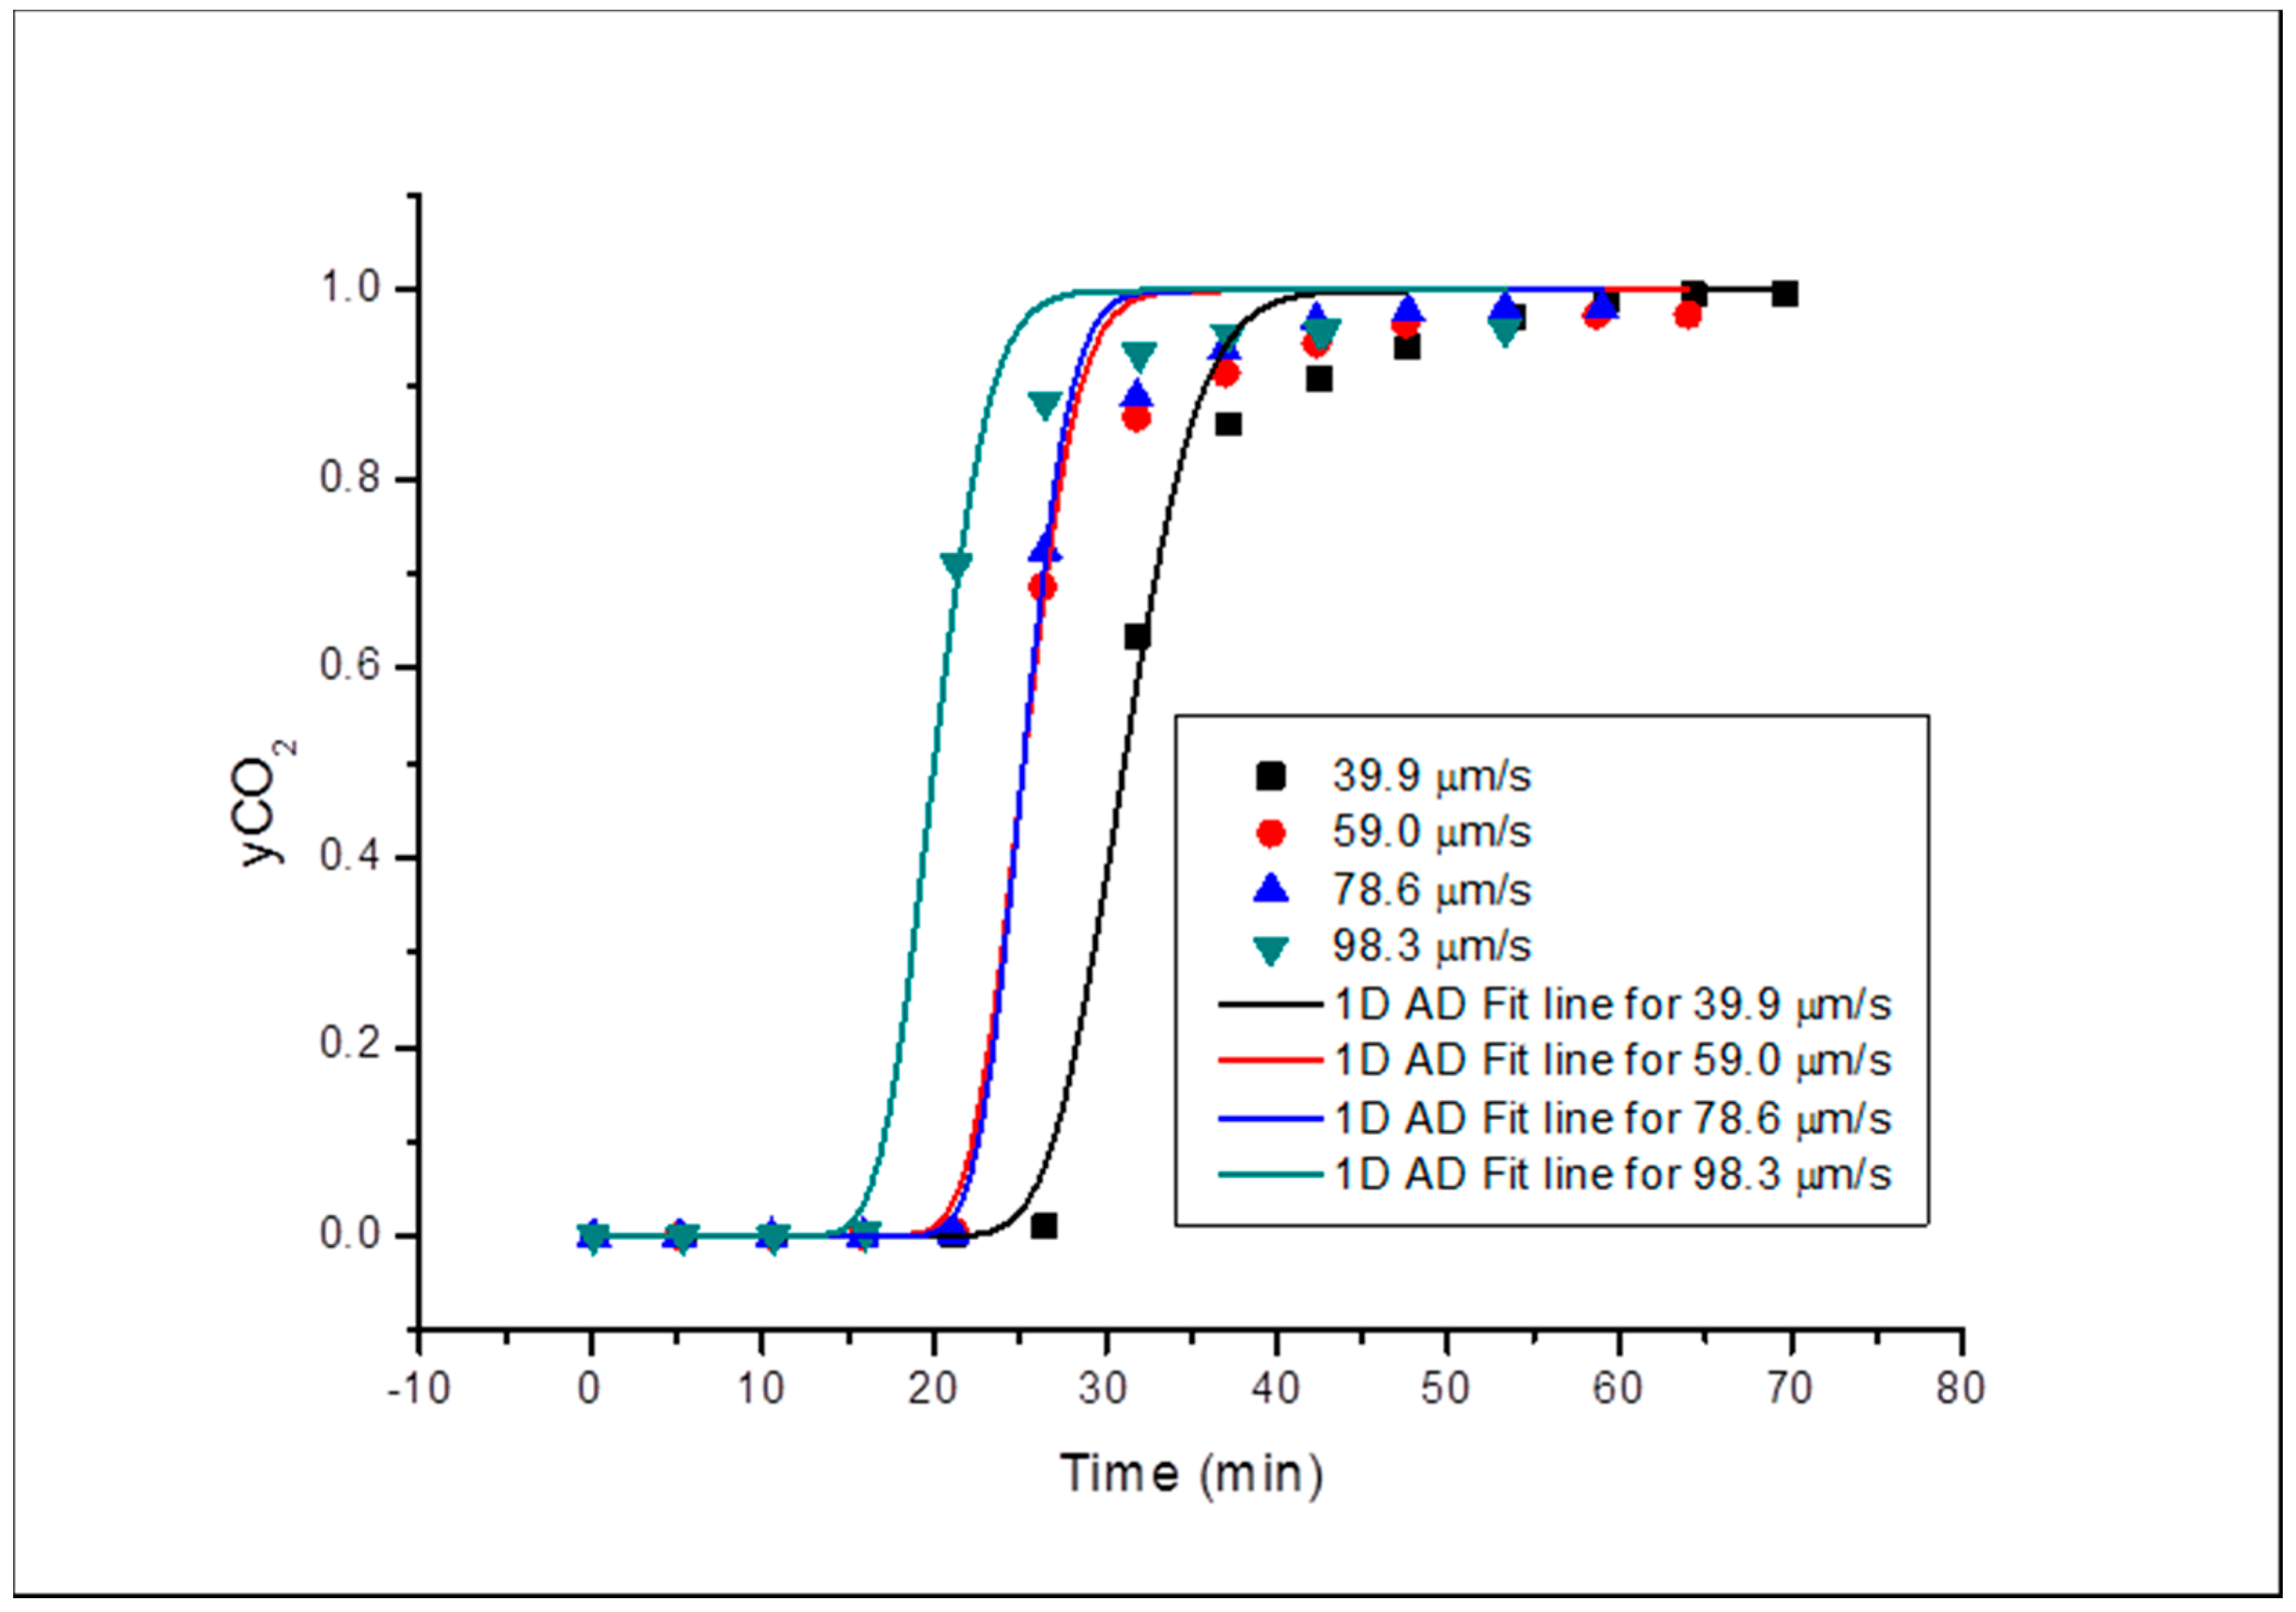
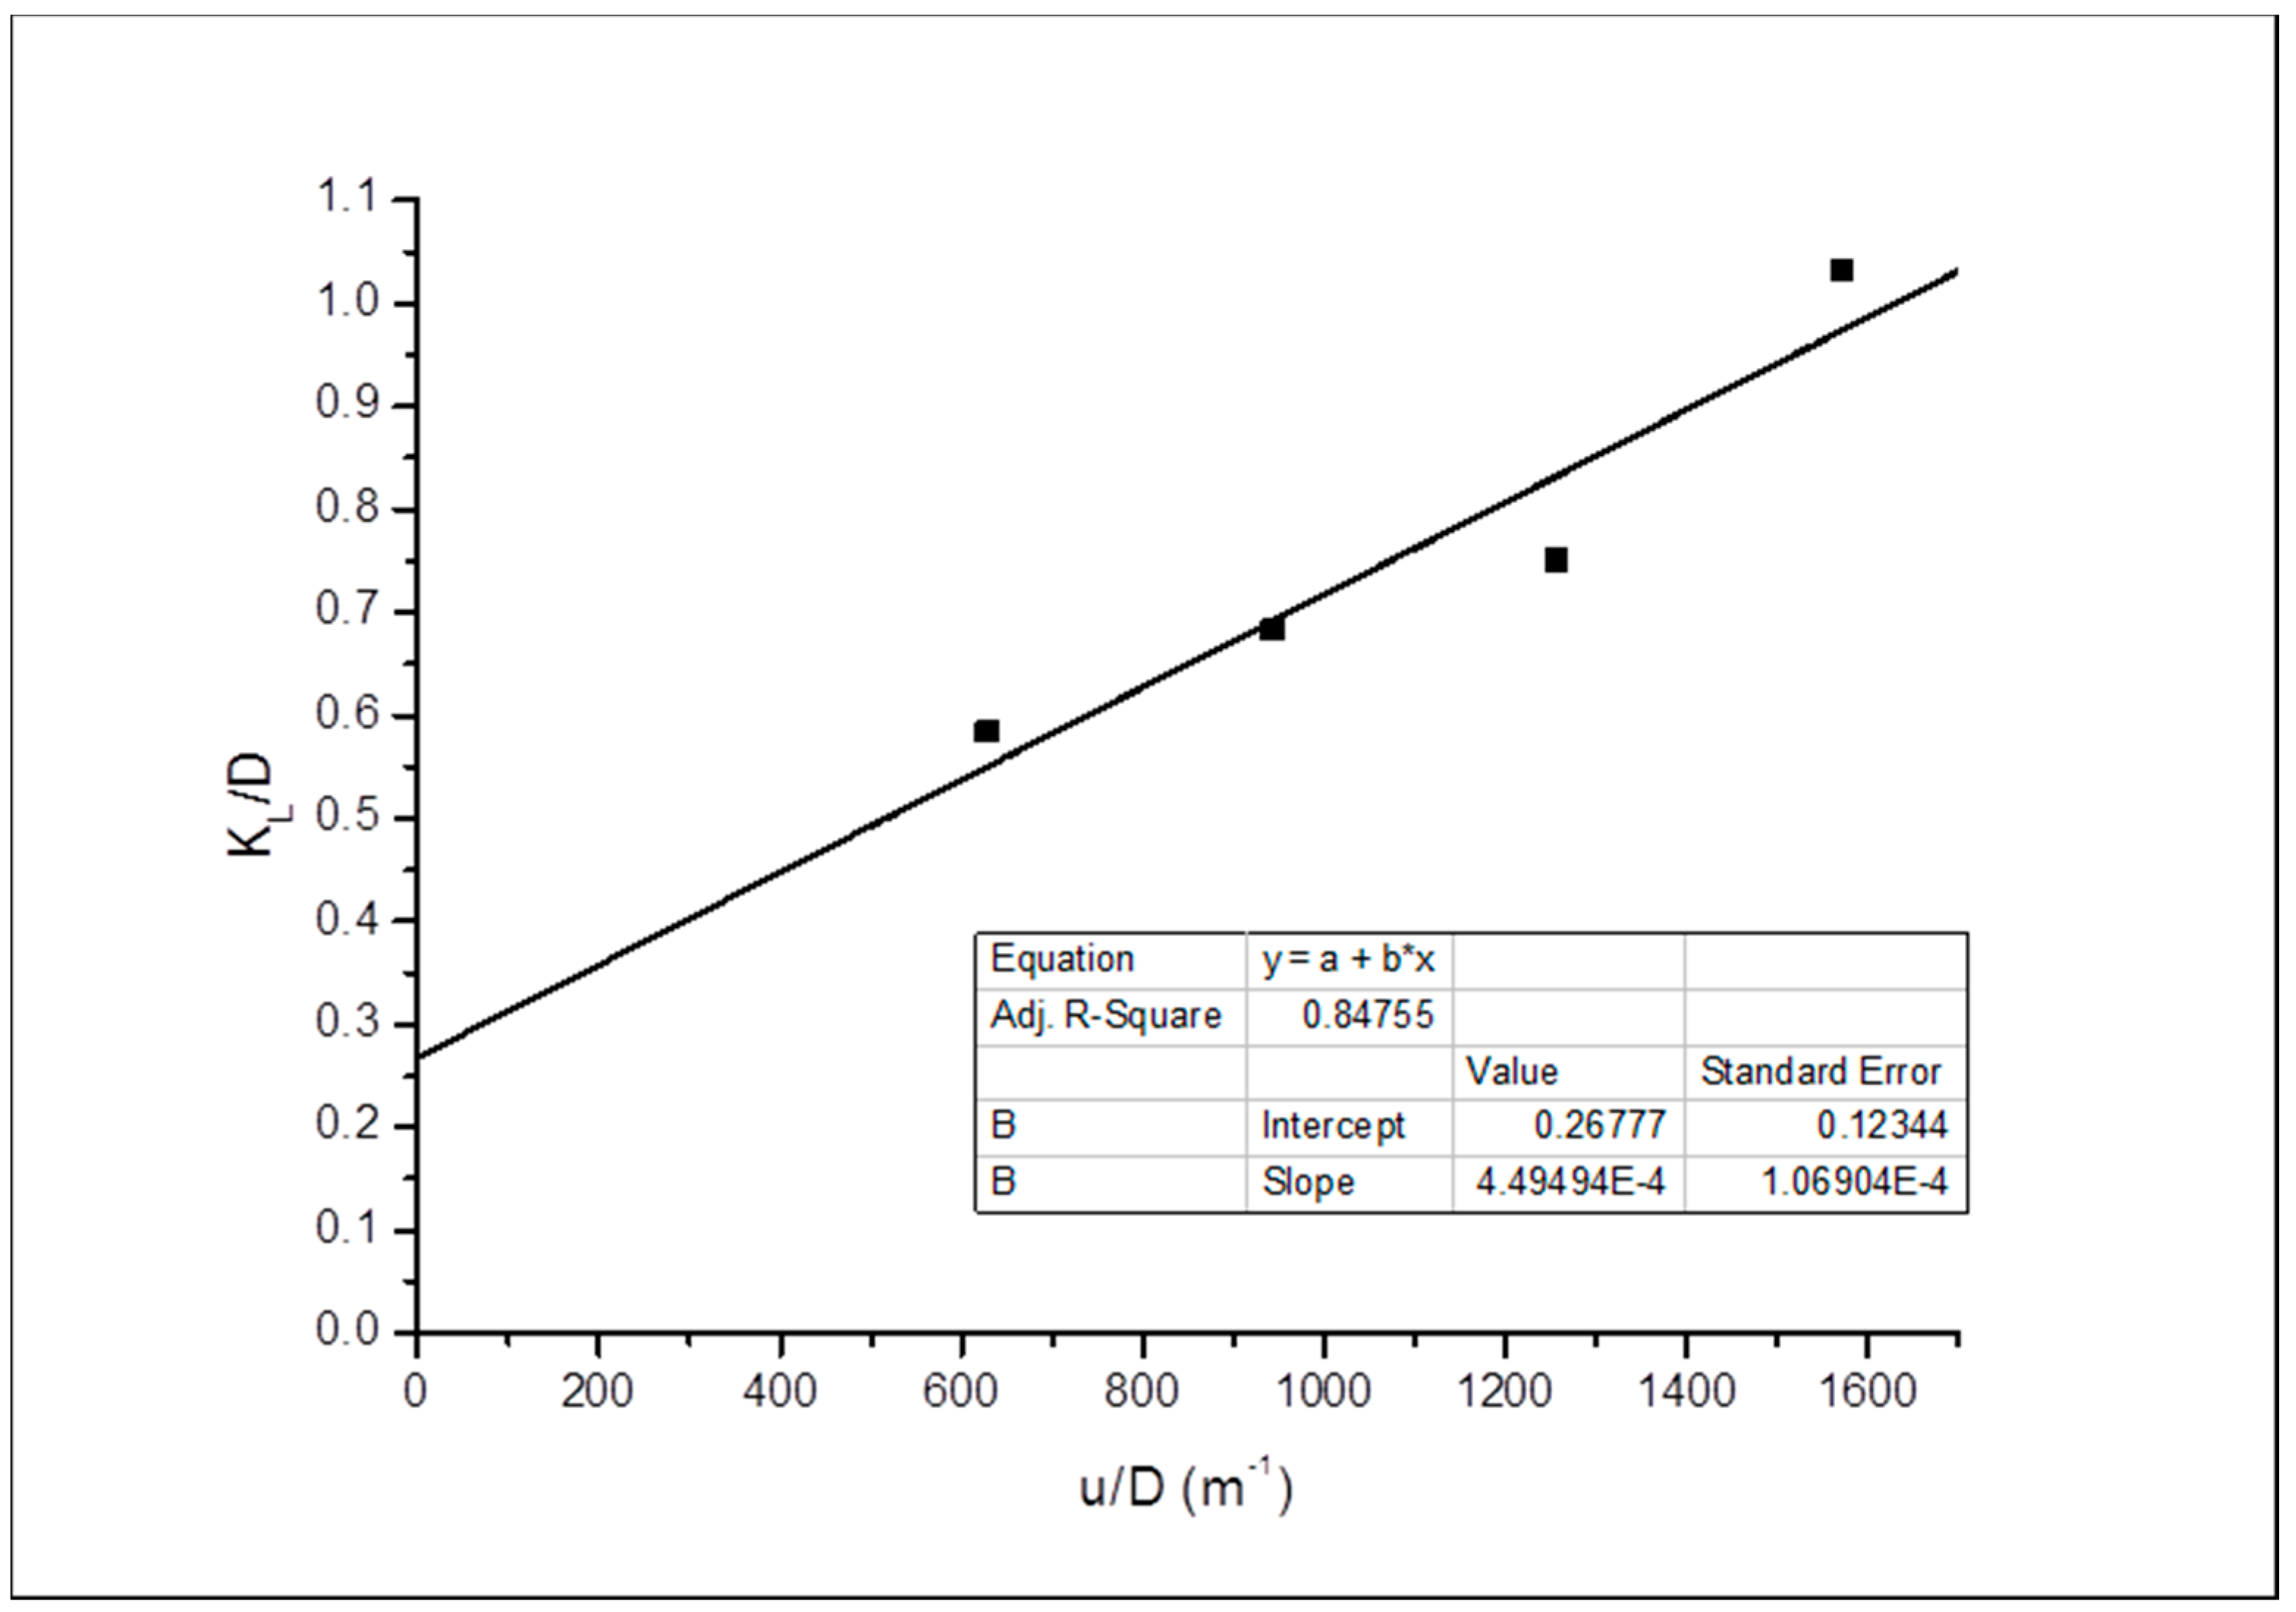
3. Results and Discussion
Summary of the Dispersion Coefficient Investigation
4. Conclusions
Author Contributions
Funding
Acknowledgments
Conflicts of Interest
References
- Ziyarati, M.T.; Bahramifar, N.; Baghmisheh, G.; Younesi, H.; Younessi, H. Greenhouse gas emission estimation of flaring in a gas processing plant: Technique development. Process. Saf. Environ. Prot. 2019, 123, 289–298. [Google Scholar] [CrossRef]
- Abas, N.; Kalair, A.; Khan, N. Review of fossil fuels and future energy technologies. Futures 2015, 69, 31–49. [Google Scholar] [CrossRef]
- Wegener, M.; Amin, G.R. Minimizing Greenhouse Gas Emissions using Inverse DEA with an Application in Oil and Gas. Expert Syst. Appl. 2018, 122, 369–375. [Google Scholar] [CrossRef]
- Vilcáez, J. Numerical modeling and simulation of microbial methanogenesis in geological CO2 storage sites. J. Pet. Sci. Eng. 2015, 135, 583–595. [Google Scholar] [CrossRef]
- Kalra, S.; Wu, X. CO2 injection for Enhanced Gas Recovery. In Proceedings of the SPE Western North American and Rocky Mountain Joint Meeting, Denver, CO, USA, 17–18 April 2014; pp. 16–18. [Google Scholar]
- Abba, M.K.; Abbas, A.J.; Nasr, G.G. Enhanced Gas Recovery by CO2 Injection and Sequestration: Effect of Connate Water Salinity on Displacement Efficiency. In Proceedings of the SPE Abu Dhabi International Petroleum Exhibition & Conference, Abu Dhabi, UAE, 13–16 November 2017. [Google Scholar]
- Abba, M.K.; Al-Othaibi, A.; Abbas, A.J.; Nasr, G.G. Effects of gravity on flow behaviour of supercritical CO2 during enhanced gas recovery and sequestration. In Proceedings of the Fifth CO2 Geological Storage Workshop, Utrecht, The Netherlands, 21–23 November 2018. [Google Scholar]
- Abba, M.K.; Al-Othaibi, A.; Abbas, A.J.; Nasr, G.G.; Mukhtar, A. Experimental investigation on the impact of connate water salinity on dispersion coefficient in consolidated rocks cores during Enhanced Gas Recovery by CO2 injection. J. Nat. Gas Sci. Eng. 2018, 60, 190–201. [Google Scholar] [CrossRef]
- Abba, M.K.; Abbas, A.J.; Al-Othaibi, A.; Nasr, G.G. Enhanced Gas Recovery by CO2 Injection and Sequestration: Effects of Temperature, Vertical and Horizontal Orientations on Dispersion Coefficient. In Proceedings of the Abu Dhabi International Petroleum Exhibition & Conference, Abu Dhabi, UAE, 12–15 November 2018. [Google Scholar]
- Liu, S.; Song, Y.; Zhao, C.; Zhang, Y.; Lv, P.; Jiang, L.; Liu, Y.; Zhao, Y. The horizontal dispersion properties of CO2-CH4in sand packs with CO2displacing the simulated natural gas. J. Nat. Gas Sci. Eng. 2018, 50, 293–300. [Google Scholar] [CrossRef]
- Newberg, M.; Foh, S. Measurement of Longitudinal Dispersion Coefficients for Gas Flowing Through Porous Media. In Proceedings of the SPE Gas Technology Symposium, Dallas, TX, USA, 13–15 June 1988; pp. 5–9. [Google Scholar]
- Mamora, D.D.; Seo, J.G. Enhanced Recovery by Carbon Dioxide Sequestration in Depleted Gas Reservoirs. In Proceedings of the SPE Annual Technical Conference and Exhibition, San Antonio, TX, USA, 29 September–2 October 2002; pp. 1–9. [Google Scholar]
- Nogueira, M.; Mamora, D.D. Effect of Flue-Gas Impurities on the Process of Injection and Storage of CO2 in Depleted Gas Reservoirs. J. Energy Resour. Technol. 2005, 130, 013301. [Google Scholar] [CrossRef]
- Perkins, T.; Johnston, O. A Review of Diffusion and Dispersion in Porous Media. Soc. Pet. Eng. J. 1963, 3, 70–84. [Google Scholar] [CrossRef]
- Coats, K.H.; Whitson, C.H.; Thomas, K. Modeling Conformance as Dispersion. SPE Reserv. Eval. Eng. 2009, 12, 33–47. [Google Scholar] [CrossRef]
- Hughes, T.J.; Honari, A.; Graham, B.F.; Chauhan, A.S.; Johns, M.L.; May, E.F. CO2 sequestration for enhanced gas recovery: New measurements of supercritical CO2–CH4 dispersion in porous media and a review of recent research. Int. J. Greenh. Gas Control. 2012, 9, 457–468. [Google Scholar] [CrossRef]
- Liu, S.; Zhang, Y.; Xing, W.; Jian, W.; Liu, Z.; Li, T.; Song, Y. Laboratory experiment of CO2-CH4 displacement and dispersion in sandpacks in enhanced gas recovery. J. Nat. Gas Sci. Eng. 2015, 26, 1585–1594. [Google Scholar] [CrossRef]
- Honari, A.; Hughes, T.J.; Fridjonsson, E.O.; Johns, M.L.; May, E.F. Dispersion of supercritical CO2 and CH4 in consolidated porous media for enhanced gas recovery simulations. Int. J. Greenh. Gas Control 2013, 19, 234–242. [Google Scholar] [CrossRef]
- Coats, K.H.; Whitson, C.H. SPE 90390 Modeling Conformance as Dispersion. In Proceedings of the SPE Annual Technical Conference and Exhibition, Houston, TX, USA, 26–29 September 2004. [Google Scholar]
- Bjerg, P. Dispersion in Aquifers; DTU Environment: Lyngby, Denmark, 2008. [Google Scholar]
- Schulze-Makuch, D. Longitudinal dispersivity data and implications for scaling behaviour. Groundwater 2005, 43, 443–456. [Google Scholar] [CrossRef] [PubMed]


| Core Samples | Length (mm) | Diameter (mm) | * Porosity (%) | * Permeability (md) |
|---|---|---|---|---|
| Grey Berea | 76.27 | 25.22 | 19–20 | 200–315 |
| Bandera Grey | 76.00 | 25.47 | 21 | 30 |
| Buff Berea | 76.18 | 24.95 | 26 | 350–600 |
| Core Samples | Porosimetry Porosity (%) | Measured Permeability (md) |
|---|---|---|
| Bandera Grey | 17 | 16.08 |
| Grey Berea | 20 | 217.04 |
| Buff Berea | 26.27 | 560.63 |
| Parameter | Expression |
|---|---|
| SN | Core Sample | Porosity (%) | Interstitial Velocity (μm/s) |
|---|---|---|---|
| 1 | Grey Berea | 20.10 | 33.5–83.8 |
| 2 | Bandera Grey | 17.20 | 39.3–98.3 |
| 3 | Buff Berea | 26.27 | 26.2–65.6 |
| Core Sample | U (μm/s) | KL (10−8 m2/s) | |
|---|---|---|---|
| Horizontal | Vertical | ||
| Bandera (k = 16.08 md) | 39.3 | 7.01 | 4.56 |
| 59.0 | 8.97 | 5.19 | |
| 78.6 | 13.20 | 7.03 | |
| 98.3 | 15.23 | 9.35 | |
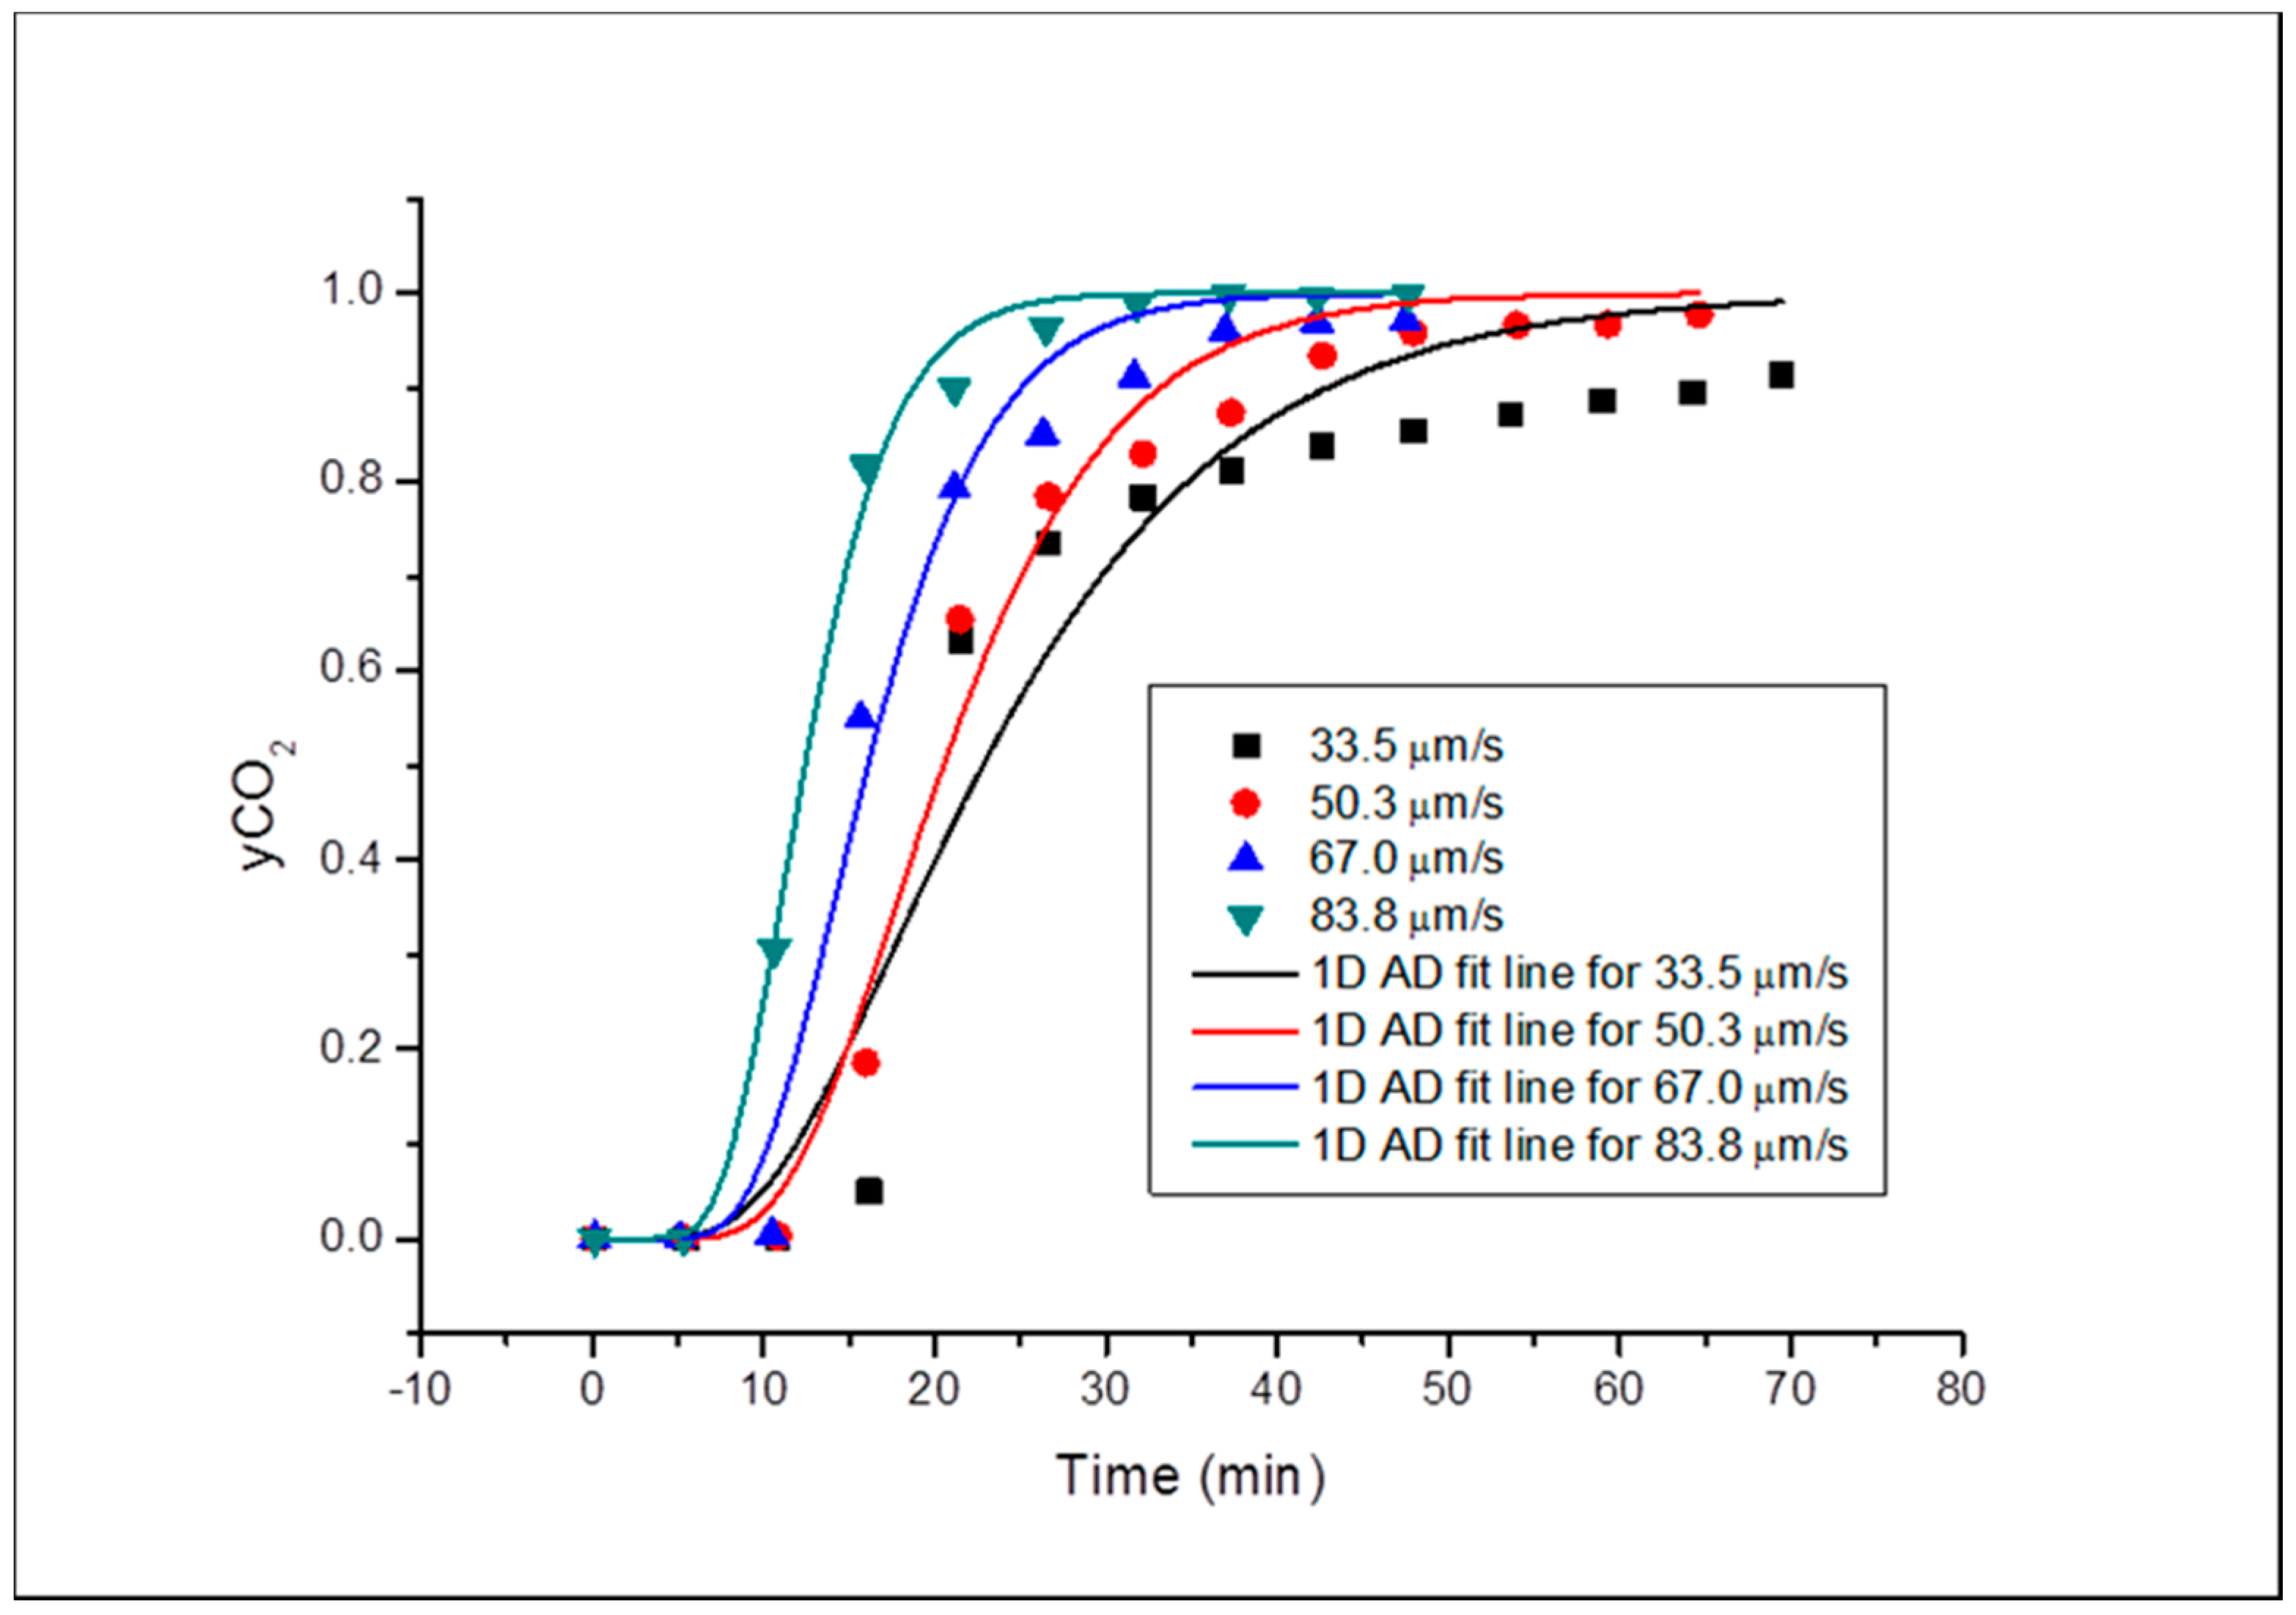
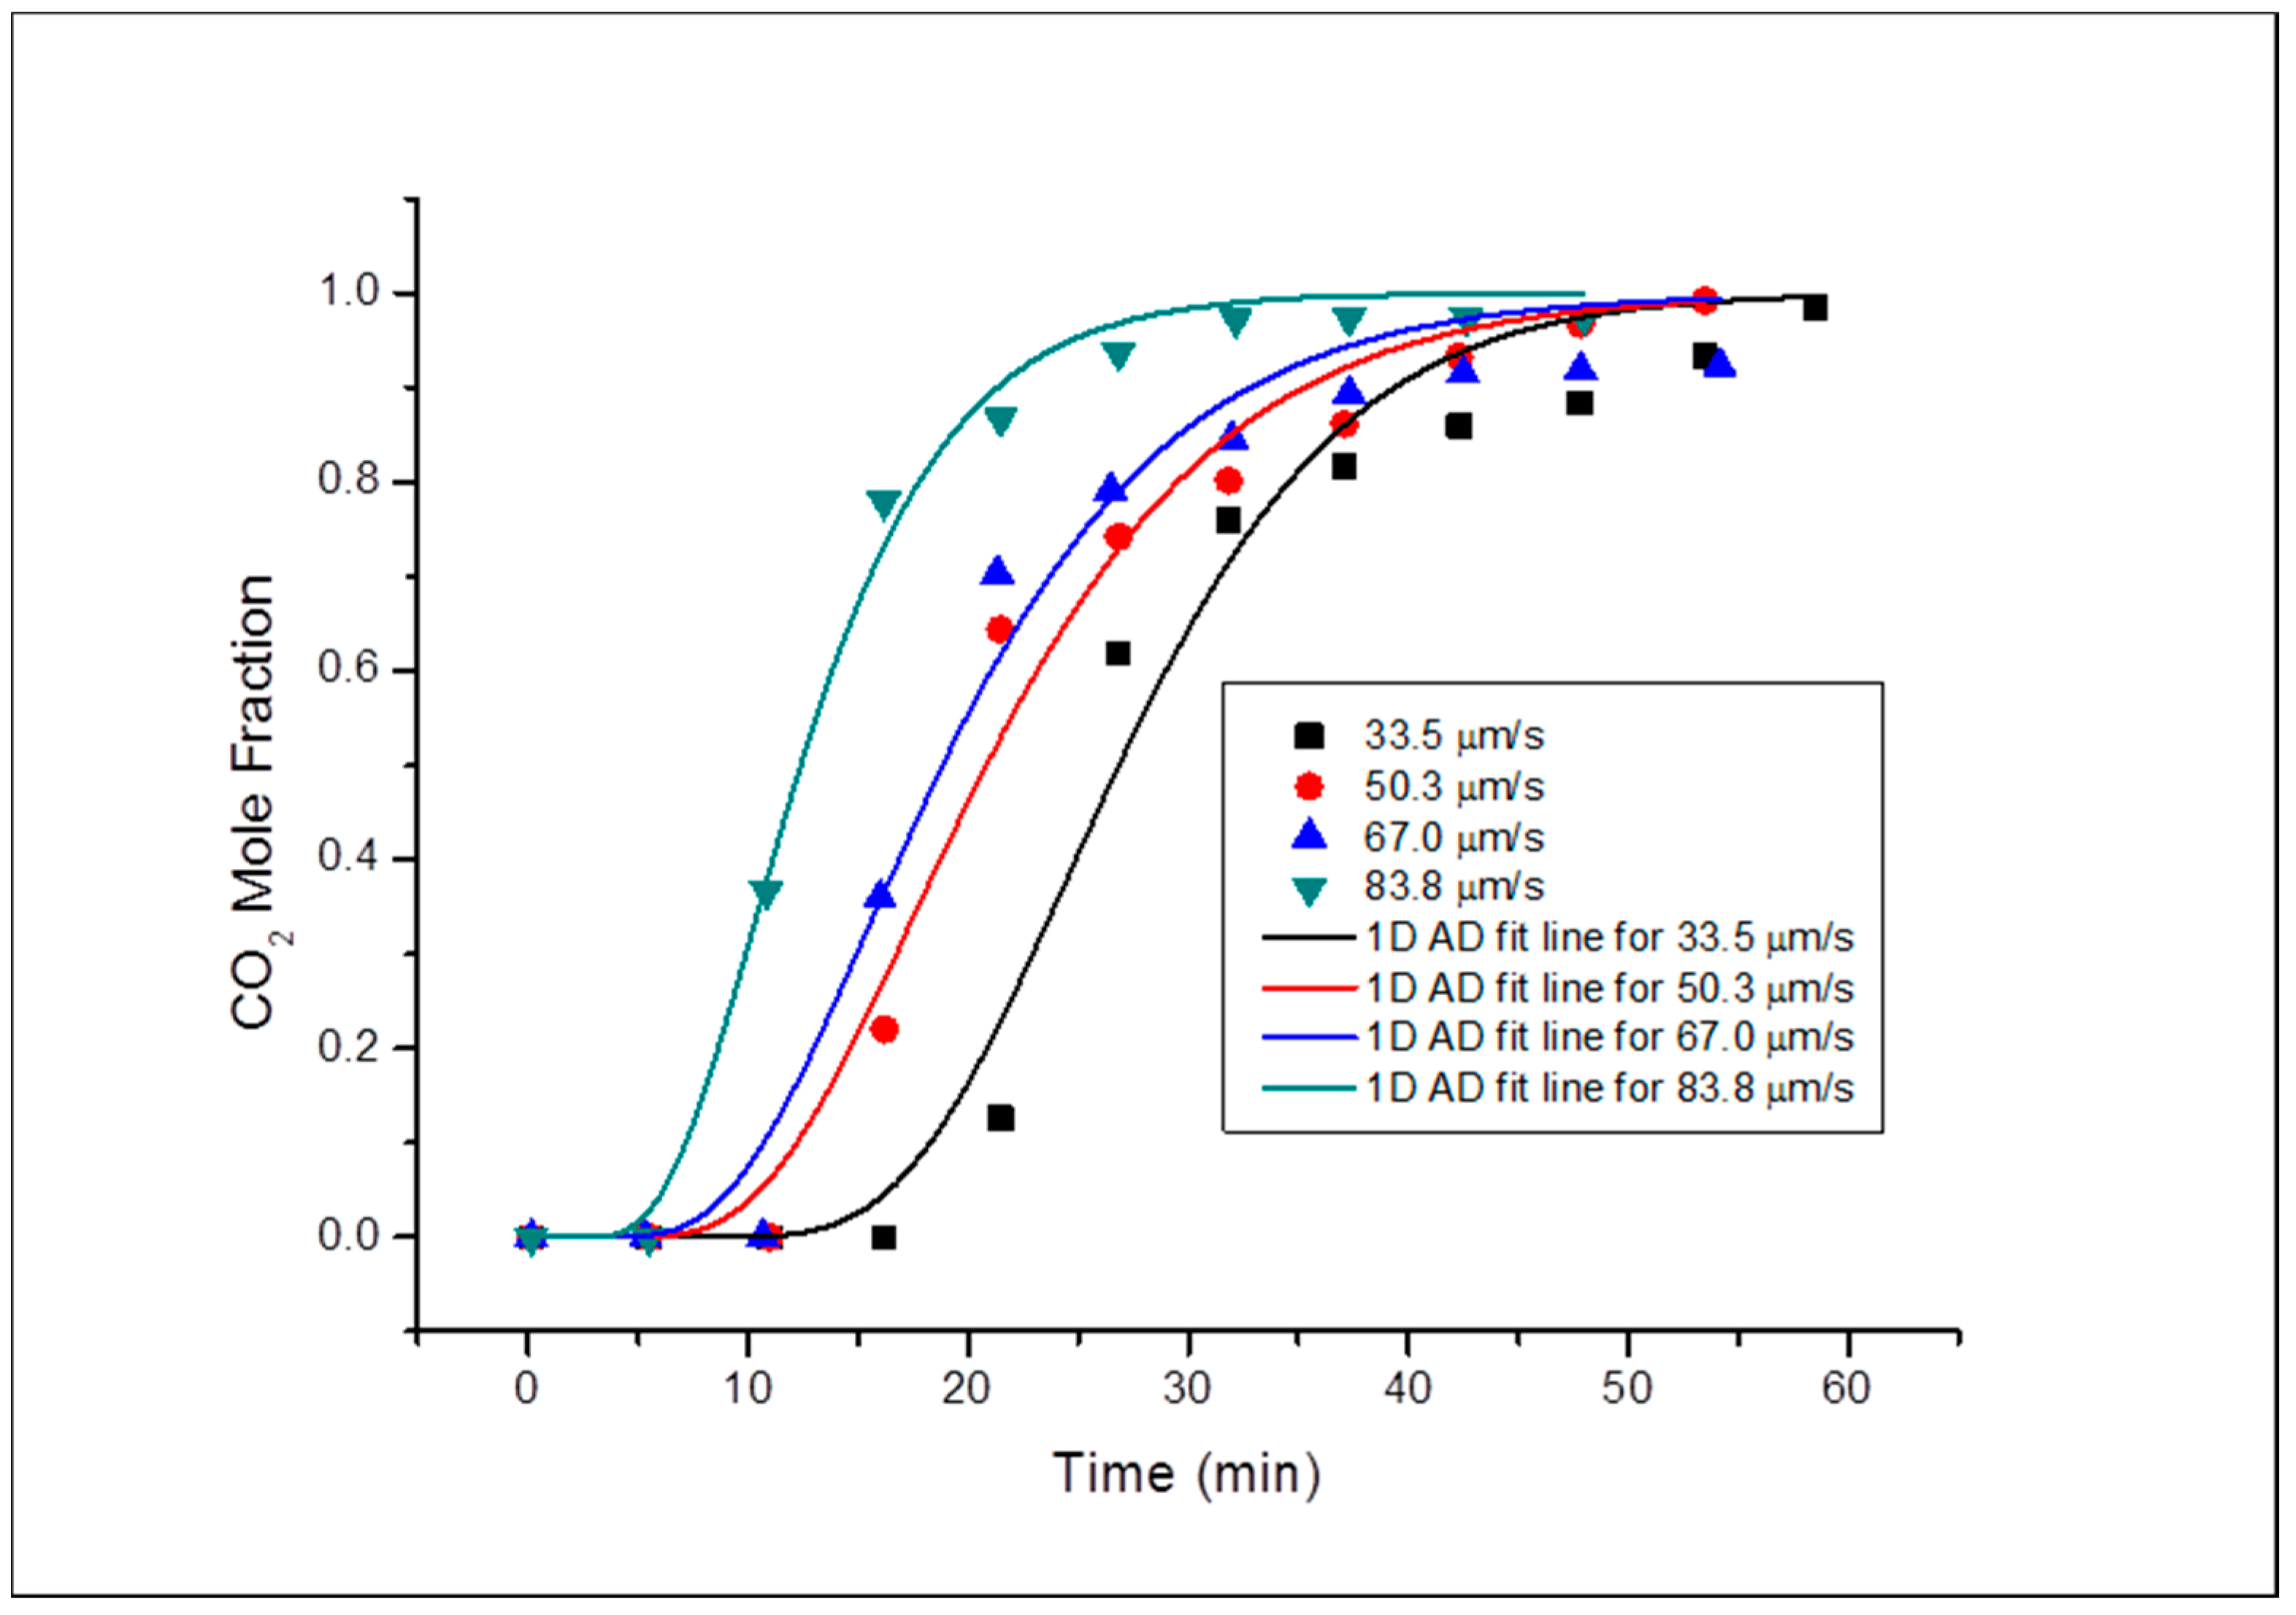
| Grey Berea (k = 217.04 md) | 33.5 | 3.11 | 2.46 |
| 50.3 | 3.64 | 3.03 | |
| 67.0 | 4.01 | 3.70 | |
| 83.8 | 5.51 | 4.02 | |
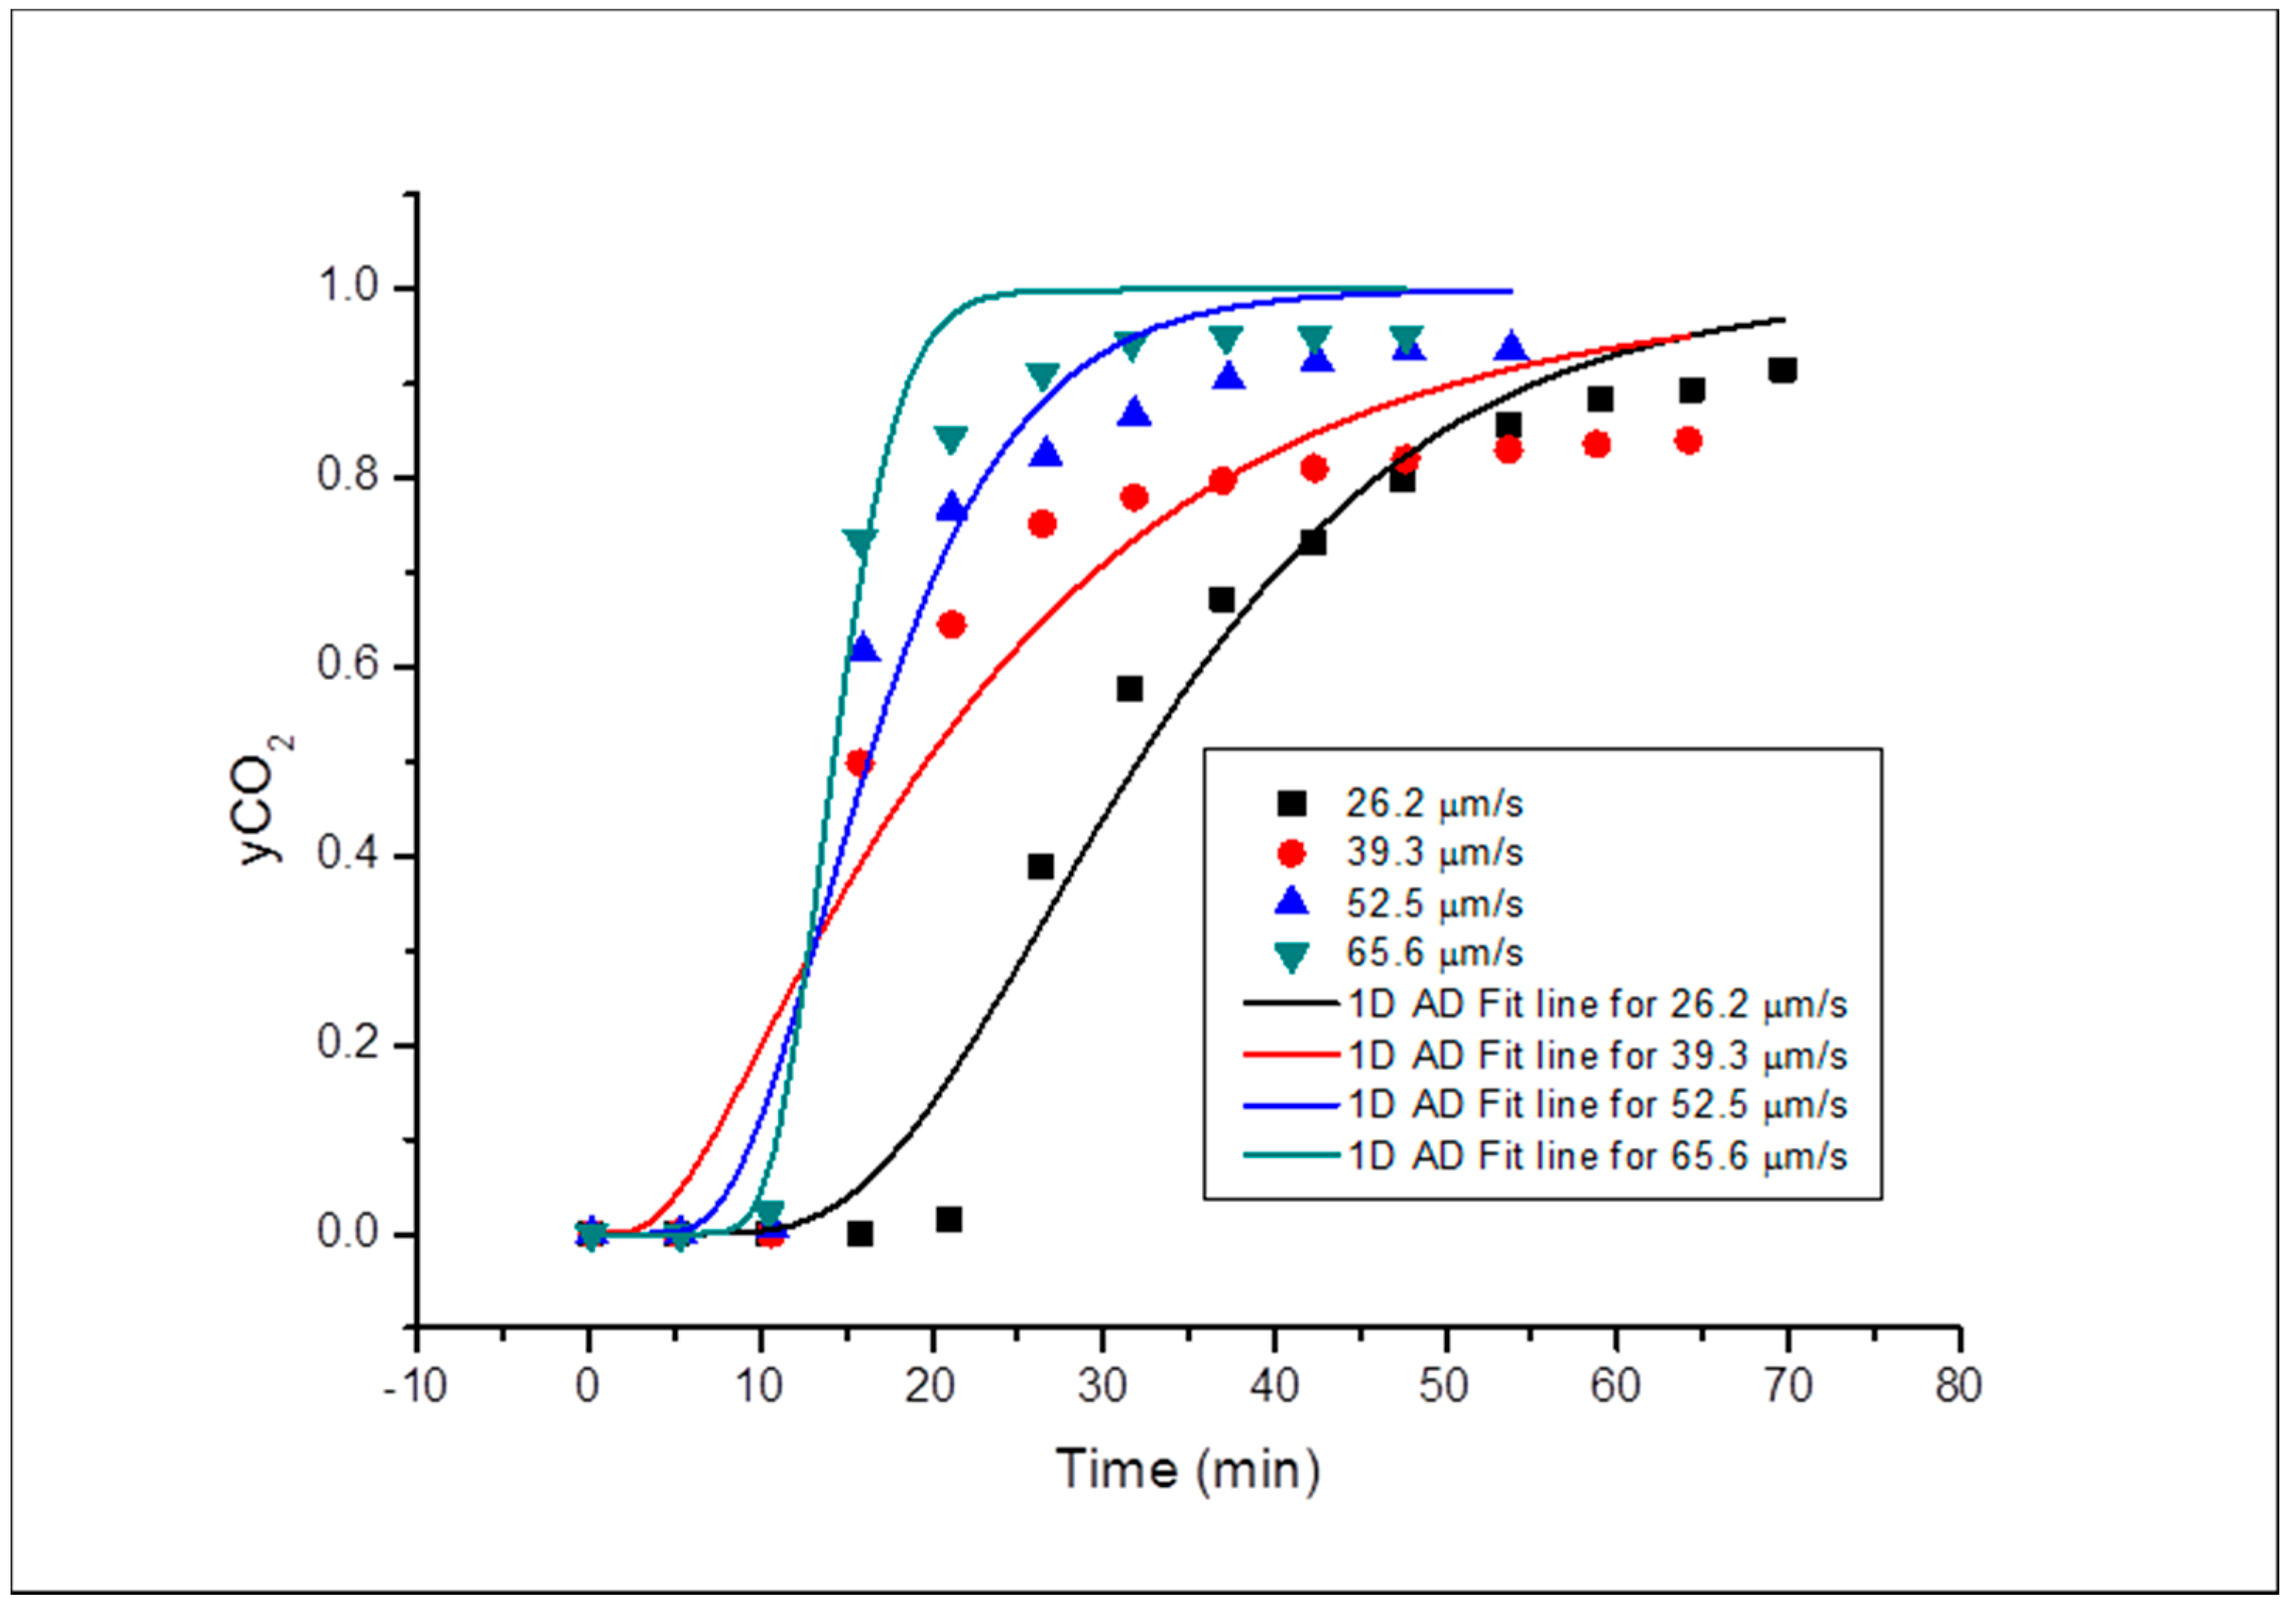
| Buff Berea (k = 560.63 md) | 26.2 | 2.38 | 1.44 |
| 39.3 | 3.13 | 2.56 | |
| 52.5 | 3.51 | 2.84 | |
| 65.6 | 4.89 | 3.12 | |
© 2019 by the authors. Licensee MDPI, Basel, Switzerland. This article is an open access article distributed under the terms and conditions of the Creative Commons Attribution (CC BY) license (http://creativecommons.org/licenses/by/4.0/).
Share and Cite
Abba, M.K.; Al-Otaibi, A.; Abbas, A.J.; Nasr, G.G.; Burby, M. Influence of Permeability and Injection Orientation Variations on Dispersion Coefficient during Enhanced Gas Recovery by CO2 Injection. Energies 2019, 12, 2328. https://doi.org/10.3390/en12122328
Abba MK, Al-Otaibi A, Abbas AJ, Nasr GG, Burby M. Influence of Permeability and Injection Orientation Variations on Dispersion Coefficient during Enhanced Gas Recovery by CO2 Injection. Energies. 2019; 12(12):2328. https://doi.org/10.3390/en12122328
Chicago/Turabian StyleAbba, Muhammad Kabir, Athari Al-Otaibi, Abubakar Jibrin Abbas, Ghasem Ghavami Nasr, and Martin Burby. 2019. "Influence of Permeability and Injection Orientation Variations on Dispersion Coefficient during Enhanced Gas Recovery by CO2 Injection" Energies 12, no. 12: 2328. https://doi.org/10.3390/en12122328
APA StyleAbba, M. K., Al-Otaibi, A., Abbas, A. J., Nasr, G. G., & Burby, M. (2019). Influence of Permeability and Injection Orientation Variations on Dispersion Coefficient during Enhanced Gas Recovery by CO2 Injection. Energies, 12(12), 2328. https://doi.org/10.3390/en12122328