1. Introduction
The DG and ESS planning (DEP) problem has been addressed in many previous studies with different objectives, such as minimizing investment and operating cost [
1,
2,
3], minimizing power losses and improving voltage profile [
4,
5], improving power supply reliability [
6], or a combination of the above [
7,
8]. Among the objectives of the DEP in a microgrid, power supply reliability is one of the most compelling. Although power supply concern is not critical in connected operation, it is still vital to take into account probable islanded operation where the microgrid must maintain a specific power supply reliability independently. From an economic perspective, DEP in a microgrid is to determine the capacity and placement of candidate DGs and ESS that satisfies the load demand as well as operational constraints with minimum comprehensive cost. As a non-negligible component of the comprehensive cost, microgrid’s expected operation cost under the planning scheme should also be considered, which can be reduced by exploiting electricity price fluctuations and harnessing excessive renewable energy through optimal power dispatch [
9,
10]. Given this, economic power dispatch is of great importance for a microgrid’s planning economy. Furthermore, since a microgrid’s power dispatch strategy correlates with the capacity of DGs and ESS, both of which are to be determined in the planning stage, consideration of economic power dispatch within DEP necessitates the design of an effective solving strategy for the DEP problem.
In fact, fluctuating load demand and volatile output of renewable DGs will increase the complexity of the planning problem [
1,
7]. In such a case, increasing penetration of EVs and consequent EV demand can pose potential challenges to the microgrid’s planning and operation. On the one hand, the large scale of EVs’ charging demand considerably aggravates load demand as well as load fluctuation [
9,
11], which will certainly set forth higher requirements for power generation and regulation facilities and inevitably increase the difficulty of the DEP problem. On the other hand, through coordinated energy management and V2G techniques, EVs operating as controllable loads and distributed energy storage can enhance system flexibility, lower system power losses, and reduce system reserve capacity [
10,
12]. It can be seen that the penetration of plug-in EVs has a complicated influence on microgrid’s planning and operation, and it is necessary to take into account EVs’ potential impacts when planning DGs and ESS in the microgrid.
With the development of smart grid technology, the research focus of microgrid optimal dispatch is gradually extended to utilize demand response (DR) to improve the economy of microgrid operation while only power side dispatch was used to ensure the stable operation of the system in the past. Relying solely on renewable DGs and ESS to guarantee the system running safely will increase the capacity of DGs and ESS, which makes the economy of microgrid get worse. The concept of DR is related to the eminent alteration of the electricity consumption pattern by end user customers, as a reaction to incentives or price signals, for technical or economic reasons when called or scheduled by the network or market operator. DR changes the load from passive to active, making it possible to exert an impact on power system operation [
13]. The consumers’ behavior is used to approach the output of renewable DGs by DR and it becomes an effective way to improve the reliability of system which includes DGs. EVs are not only a kind of load, but also a kind of mobile energy storage equipment. It is very important to study the participation of EVs in the demand response.
Though there are literatures covering DEP considering EVs, most literatures, to our knowledge, take EVs as an uncoordinated charging demand and few have studied in depth the influence of EV energy management and V2G capacity on DEP. In [
14,
15], two DG planning methods are presented to accommodate a high penetration of uncoordinated charging EVs in distribution networks. Both literatures have analyzed the impact of different levels of EV penetration and subsequent EV demand on DG planning. In [
16], the authors determine the optimal mix of DGs and ESS considering a coordinated EV demand. It is concluded that the need for distributed generation is reduced with coordinated EV demand. Though in [
14,
15,
16], the impacts, as well as the potential benefits, of EV penetration have been confirmed, EVs’ charging demand is estimated by probabilistic models that utilize historical data and virtual EV charging patterns, which is assumed to be unaffected by charge scheduling of EVs. Given that EV charge changes the status of EV battery and, therefore, changes EVs’ charging demand, charge scheduling should be considered and corresponding scheduling strategy should be designed when evaluating EVs’ charging demand to enhance the practicability of comprehensive energy dispatch in EV-penetrated microgrid [
17].
Nevertheless, existing literatures mainly consider EVs’ charging demand and focus on connected operation, detailed discharge scheduling, V2G analysis and islanded operation where power supply reliability may no longer be maintained are generally overlooked. In order to better assess the impact of EV penetration and improve the deployment model, charge and discharge scheduling of EVs and islanded operation concerning power supply reliability should be considered when deploying DGs and ESS in microgrid. As islanded operation is considered, utilization of available V2G capacity for power support in islanded operation should also be addressed accordingly.
In addition, as an important appliance in microgrid, ESS can shift peak load demand, mitigate the impact of volatile distributed generation and enhance power supply reliability [
18,
19,
20]. Besides, through economic power dispatch, ESS can also reduce the microgrid’s electricity cost in a fluctuating electricity market by exploiting electricity price fluctuations and harnessing excessive renewable energy [
21], which is of great importance for the microgrid’s economic operation, yet is not considered in most DEP studies. In [
22], the authors have proposed a co-scheduling algorithm for optimal power dispatch of ESS as well as heating, ventilation and air conditioning (HAVC) control under a dynamic pricing scheme to reduce the electricity cost of a typical building. The problem setup of ESS power dispatch is based on a predefined capacity, and impact of ESS capacity on electricity cost is studied. However, since ESS power dispatch is directly related to the capacity of DGs and ESS, both of which are to be determined in the planning stage, consideration of ESS’s economic power dispatch as a co-scheduling problem in DEP presents a challenge to the design of an effective solving strategy for the DEP problem.
Compared with former planning studies, the difficulty of DEP in a microgrid considering plug-in EVs lies in three aspects: (1) Appropriate utilization of standby EV batteries for power regulation in conjunction with DGs and ESS; (2) Economic power dispatch of the microgrid in the planning stage; (3) Coordination of microgrid power dispatch with DGs, ESS, and EVs to compromise a cost-efficient and reliable DEP scheme that satisfies both connected and islanded operation constraints. To tackle the above issues, this paper proposes an approach for DEP in microgrid considering energy management of EVs and microgrid economic power dispatch. The contributions of this paper are summarized as follows:
A new incentive price mechanism is proposed to assess EV fleet’s charging demand, discharging power and available islanding V2G capacity. The proposed price-based management strategy and islanding V2G capacity evaluation method guide EVs’ charge and discharge with price signals, with due consideration of EV users’ initiative, interest, charging expectation, and battery status.
An economic power dispatch strategy for ESS considering purchasing and selling electricity price difference is integrated in the DEP model. Given that the capacity of DGs and ESS are to be determined in the deployment stage, economic power dispatch of ESS is solved as a sub-problem within the DEP problem. Further consideration of price difference enables the economic power dispatch strategy to apply to different electricity pricing schemes.
A DEP approach that integrates with EV energy management and ESS power dispatch is presented. The approach takes into account both connected and islanded operation, and interactive power limit and power supply reliability constraint are particularly considered. EVs’ coordinated charging demand, discharging power and ESS’s economic power dispatch are considered in connected operation. Islanding V2G serves as an ancillary power supply in islanded operation. A bi-level heuristic algorithm is designed to determine the sizes and sites of DGs and ESS as well as the economic power dispatch of ESS.
The remainder of the paper is organized as follows:
Section 2 presents the energy management strategy for EV and the economic power dispatch strategy for microgrid. DEP model and solving techniques are described in
Section 3. Case studies, results, and discussion are included in
Section 4. Finally,
Section 5 concludes the paper.
2. Problem Formulation
2.1. Coordinated Charge and Discharge of EVs
The charging and discharging of EVs can be considered as power loads and power supplies, respectively, when connected to the microgrid. In order to investigate the impacts and economical potentials of EV penetration on microgrid planning and operation, in this work, we exploit a microgrid with general load, distributed generation, and energy storage, as well as EVs.
A price-based coordinated dispatching method of EVs is presented in detail as follows. We assume that all EV users in the microgrid are rational and sensitive to electricity price. EVs’ charge and discharge through chargers that collect SOC data on the battery from the battery management system. After users input their foreseen parking time, chargers will display the estimated charging and discharging prices in the coming hours, and a cost-efficient strategy will be generated to commence EVs’ charge and discharge. A centralized incentive price mechanism is employed to coordinate EVs’ charge and discharge, and the charging and discharging price for EVs are formulated as:
Through the above mechanism, the charging and discharging prices for EV fleet are correlated with general load demand and EV fleet’s charging and discharging power. EVs’ charging and discharging prices are increased in load peak hours and decreased in load valley hours, so as to encourage EV users to shift the charging demand to load valley hours and offer peak shaving support via V2G in load peak hours. Meanwhile, intensive EV charge will result in higher charging prices, and concurrent EV discharge will lead to lower discharging prices. So, the mechanism can also ensure that not all price-sensitive EV users start charging or discharging in the same timeslot, thus avoiding grid contingencies, such as overloads and voltage drops. EV users initiatively adjust their charging and discharging plans on an hourly basis to reduce charging costs and obtain discharging profits. The objective is to minimize EV fleet’s daily charging cost, which is the difference of the EV fleet’s charging cost and discharging profit:
It is assumed that all EVs are equipped with unified batteries, which possess same rated capacity, charging and discharging power, and efficiency. In fact, different types of EVs have different rated capacity of battery, charging and discharging power, and efficiency. The chargers will collect the data on the EVs’ battery from the battery management system and a cost-efficient strategy will be generated to commence the EVs’ charge and discharge. In any case, each EV follows the above model. The difference in parameters between different types of EVs does not affect the feasibility of DEP results. Inequation (4) indicates that EV batteries’ charging and discharging power are limited to the rated one. Constraint (5) and (6) ensure that EV batteries operate within an acceptable SOC range to prevent over charge and discharge, and all EVs should be fully charged. Since it is not feasible for EVs to simultaneously charge and discharge in the same timeslot, inequation (7) is necessary to ensure this operation constraint. Equation (8) indicates that power exchange between EVs and the microgrid is only possible in parking hours, and EVs’ charging and discharging power are 0 when departing.
2.2. Economic Power Dispatch of Microgrid
We assume that Maximum Power Point Trackers are used in distributed generation systems. In such case, the economic power dispatch of microgrid is to coordinate distributed generation, ESS output and interactive power with general load and EV demand. In detail, microgrid management system formulates an economic power dispatch strategy that optimizes ESS’s charging/discharging power and power exchange with utility grid based on the supply-demand relationship and time-of-use electricity price to minimize the comprehensive operational cost, while meeting electrical load demand and satisfying operating constraints. The comprehensive operational cost is the difference between operational cost and income. The operational cost includes maintenance cost of DGs and ESS, power purchasing cost from utility grid as well as peak regulation service cost and ancillary service cost paid to EVs. The operation income comprises residential load supply income, EV demand supply income and selling electricity to utility grid income. Therefore, the objective of microgrid economic power dispatch can be expressed as:
Cm represents the maintenance cost of DGs and ESS, which is assumed to be proportional to DGs’ generating power and ESS’s charging and discharging power.
Cpg is the purchasing power cost form utility grid.
Cpr and
Csc are the peaking regulation cost in connected mode and ancillary service cost in islanded mode.
Crsi and
Cesi indicate the income by supplying general load and EV demand.
Csg is the income by selling electricity to utility grid. Above functions can be calculated by:
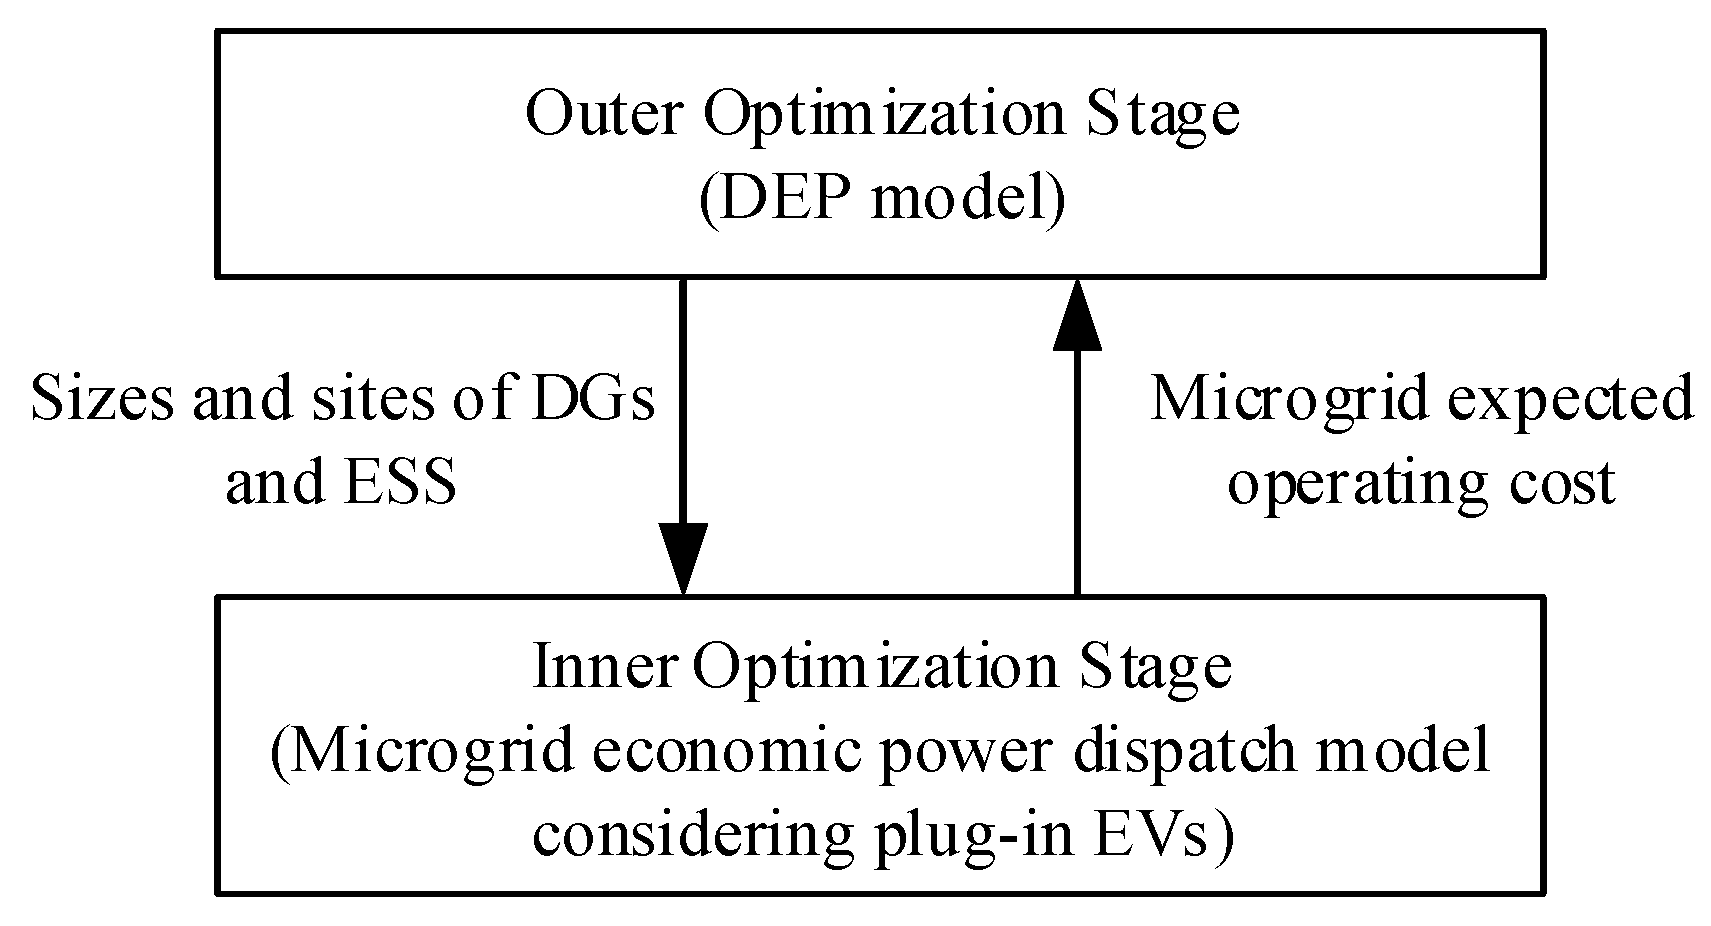
The inputs of the economic power dispatch problem include time-of-use electricity prices, DG and ESS capacity, sequences of total load demand and distributed generation. The decision variables are the charging and discharging power of ESS and interactive power between microgrid and utility grid. In the planning stage, capacity of DGs and ESS are both variables that have a direct impact on power dispatch, whilst economic power dispatch in turn influences the operational and electricity cost of microgrid and consequently the economy of DEP. To tackle such interaction, economic power dispatch of microgrid is decomposed and solved as a subproblem within the DEP problem. The two-stage modeling framework of DEP problem is illustrated in
Figure 1.
To solve the economic power dispatch problem, the following constraints are considered:
1. Power balance and interactive power limit in connected operation: interactive power is limited by flow limits of the line connecting microgrid to the utility grid.
Other power flow constraints including reactive power balance, node voltage limits and branch power flow limits are also considered but not presented in this section.
2. Operation constraints of ESS
Inequation (20) indicates that the charging and discharging power of ESS is limited to the rated power, which is in proportion to the number of ESS. Constraint (21) prevents ESS from over charge and discharge. To assure ESS’s sustainable operation, Equation (22) prescribes that the expected SOC of ESS at the end of an operation cycle should be the same as the initial one. Inequation (23) ensures that ESS does not charge and discharge simultaneously. Constraints (4)–(8), (20)–(23) also apply to EVs and ESS in islanded mode.
Besides, as microgrid operates in islanded mode when it disconnects from utility grid, islanded operational constraints should also be considered, which is discussed as follows.
2.3. Islanded Operation
When switching from connected mode to islanded mode, microgrid dispatches distributed generation, ESS discharge and EVs’ ancillary services to maintain load power supply. The time scope of this paper is a day of 24 hours, namely, 24 time intervals. Each time interval starts from sharp to sharp. It is presumed that islanded operation begins at the start of each time interval and lasts for 1 hour. When distributed generation cannot satisfy total load demand, charge of EVs and ESS will be terminated to reduce power supply pressure, and load might be curtailed to further tackle the power imbalance. In this case, islanding power supply probability (IPSP) is introduced to estimate the proportion of base load supplied in islanded operation, which is formulated as follows:
IPSP
t is adopted as the index of islanding power supply reliability in this paper. Microgrid imposes specific requirements on IPSP, i.e., IPSP
req, which should be satisfied in probable islanded operation:
Given that ESS is invested by microgrid, ESS should share the responsibility for durable power supply and discharge in priority if load demand cannot be satisfied by distributed generation. But EV users may not be willing to provide ancillary services due to the risk of unavailability in later use. As mentioned in
Section 3, microgrid provides EV users with high ancillary service subsidy, and rational EV users will weigh the potential risks and rewards. Therefore, we assume that all EV users without travel demand are willing to provide ancillary service via discharge and delay charge to gain a considerable profit. Sensitivity analysis on EV users’ participation rate is presented in
Section 5.
4. Case Studies
4.1. Parameters
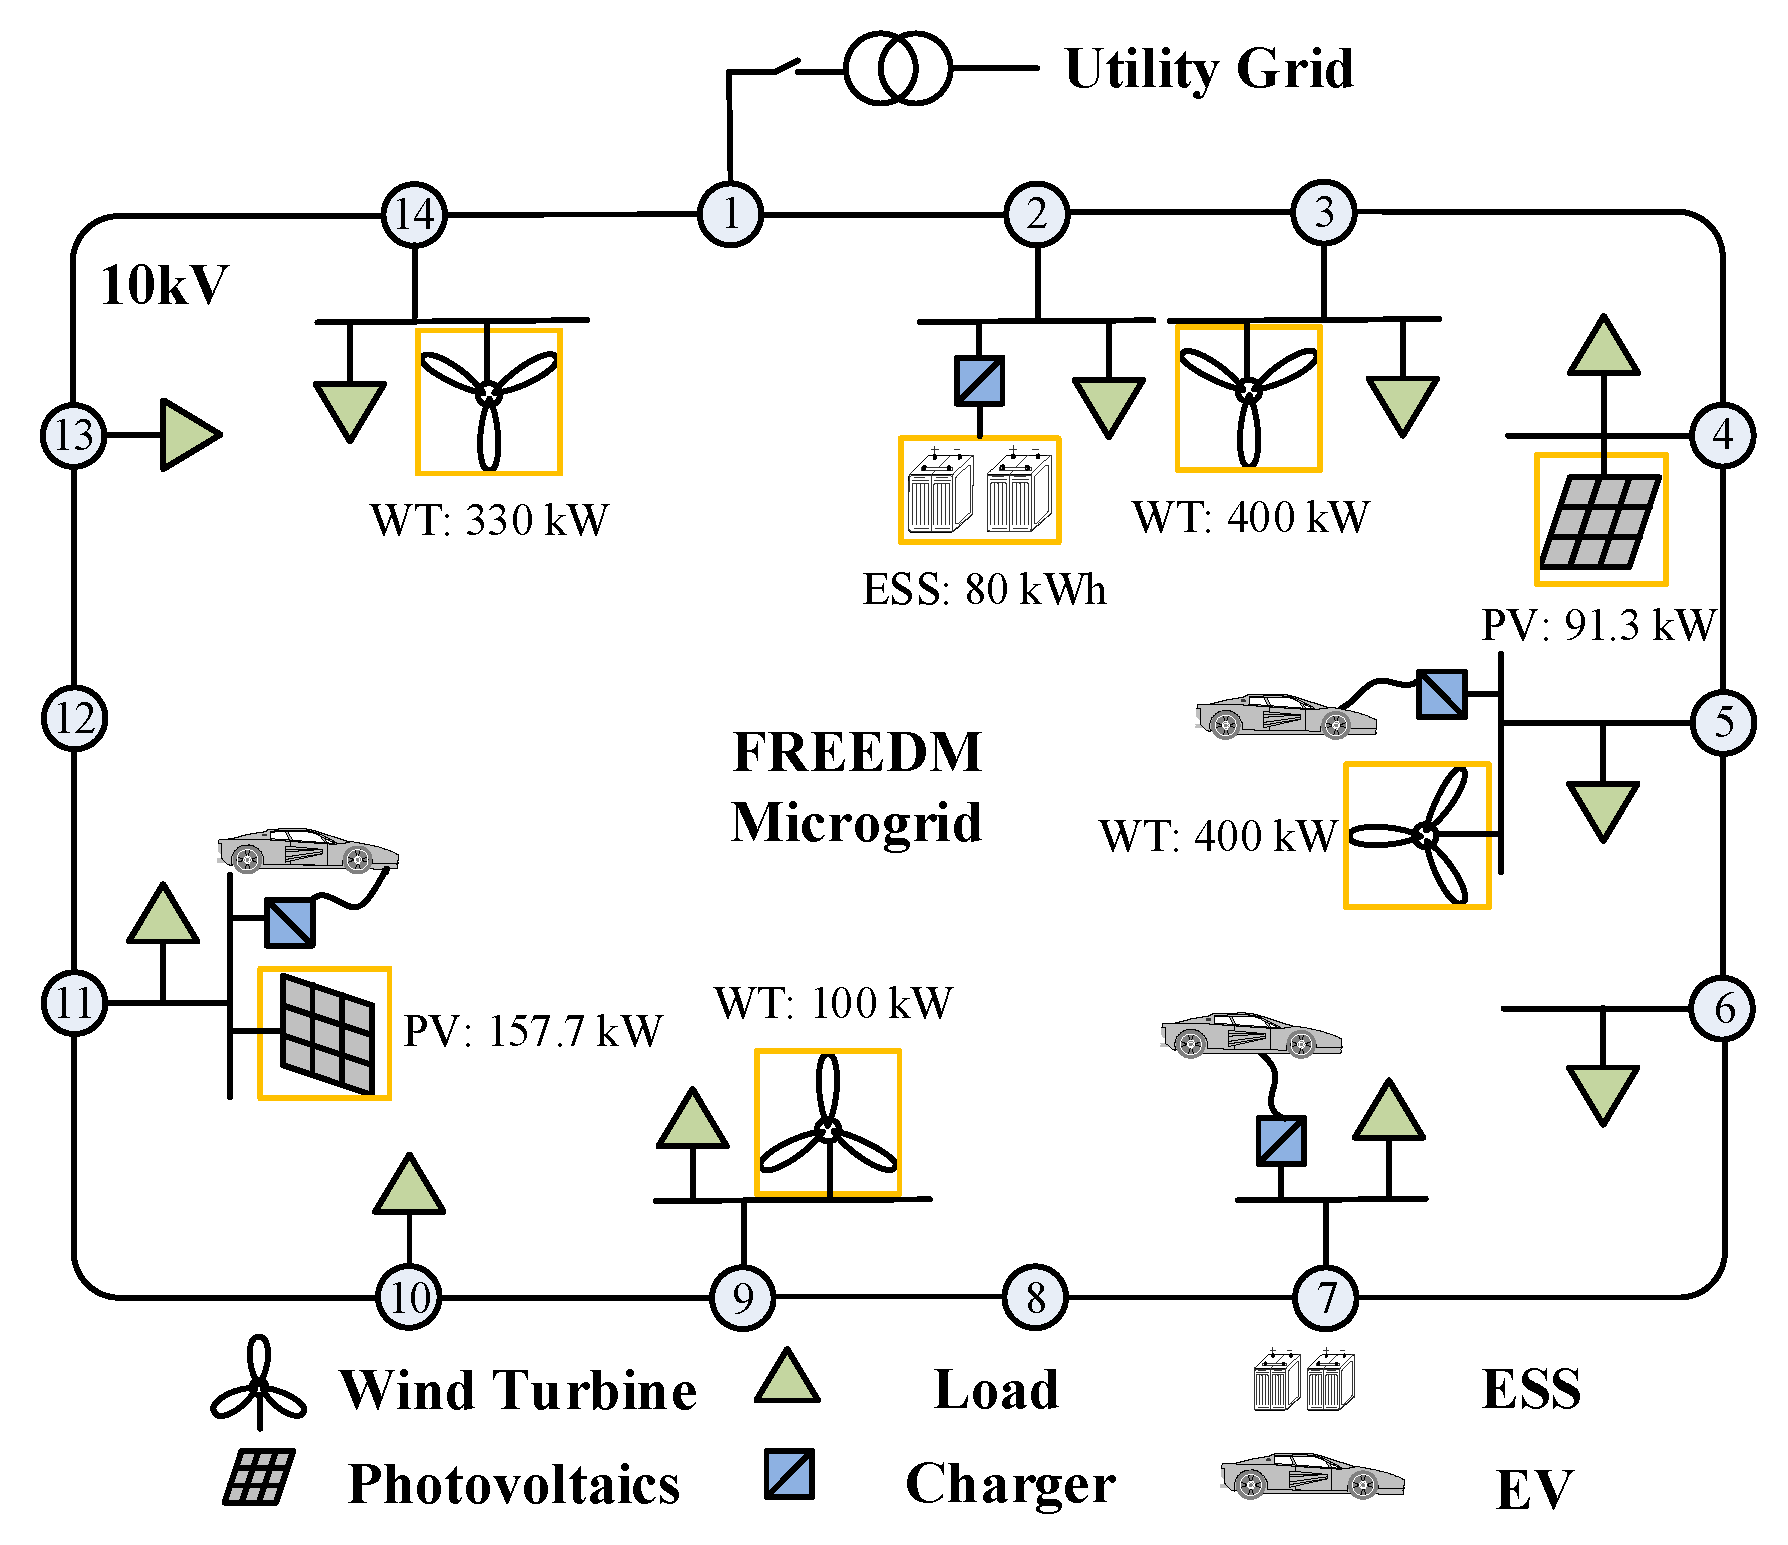
Nominal capacity of the 14-node FREEDM microgrid adopted in this paper is 1 MW. Interactive power limit between the microgrid and utility grid is 500 kW. The minimum installation units of DGs at each node are set to 0, while the maximum of DGs at each node are 40. If a node needs to install ESS, the minimum installation units of ESS are 1 while the maximum are 35. Typical forecasted wind and photovoltaic generation profile along with load curve is shown in
Figure 3, where the values represent the hourly capacity factors of WT and PV. The EVs are the principal part of DR in this paper. The time-of-use electricity price is used for the residential load and power exchange between microgrid and utility grid. Peak/ordinary/valley electricity price in
Table 1 is utilized as the time-of-use electricity price for power exchange between microgrid and utility grid. Peak/valley electricity price for residential load is presented in
Table 2. Microgrid load data are shown in
Table 3. Capacity and cost of WT, PV, and ESS are shown in
Table 4. The initial SOC of the ESS is 50%. The available SOC range of the ESS is [20%, 90%]. Given the consideration of probable islanded operation, the lower bound of the SOC of the ESS in connected operation is increased to 35%. Rated charging and discharging power and efficiency of ESS unit are 10 kW and 90%, respectively.
There are 60 EVs in the microgrid area with charging demand. EVs’ parking percentage on a workday in [
11] is adopted, and the corresponding estimated parking duration, departure time, and average power consumption per departing hour are generated considering the randomness in practical use [
23,
24]. In order to approximate the spatial distribution of EVs, each EV is randomly assigned a destination for each travel, and it is assumed that the EV departs from the current charging station and arrives at the destination charging station after the departing duration. Rated capacity of EV battery is 64 kWh. To avoid over charge and discharge, the available upper and lower limit of EV battery’s SOC are set to 95% and 20%, respectively. The EV battery’s rated charging and discharging power and efficiency are 7 kW and 90%, respectively. Considering the randomness in the EV battery’s initial SOC, Monte Carlo stochastic simulation is used to generate each EV’s initial SOC, which is presumed to conform to a normal distribution N (0.5, 0.42) within the available SOC range. EVs charge and discharge through battery chargers in charging stations deployed at nodes 5, 7 and 11.
4.2. Microgrid Total Load Profile
With regard to the incentive price mechanism for EVs, reference load demand Po and reference electricity price Co in (1) and (2) are set as 230 kW and 0.356 Yuan/kWh, which are the minimums of general load and purchasing electricity price, respectively. Coefficient Cks in this paper is set as 0.186, thereby matching the minimum electricity prices for both general load and EV load. In consequence, though EV’s hourly charging prices during valley hours are raised slightly from 0.356 Yuan/kWh to a maximum of 0.585 Yuan/kWh, the charging prices in ordinary hours are decreased from 0.744 Yuan/kWh to a minimum of 0.570 Yuan/kWh; and the discharging price in peak hours reaches to a maximum of 1.068 Yuan/kWh. Under the guidance of price signals, EV users charge at a favorable charging price and discharge when the discharging price is high.
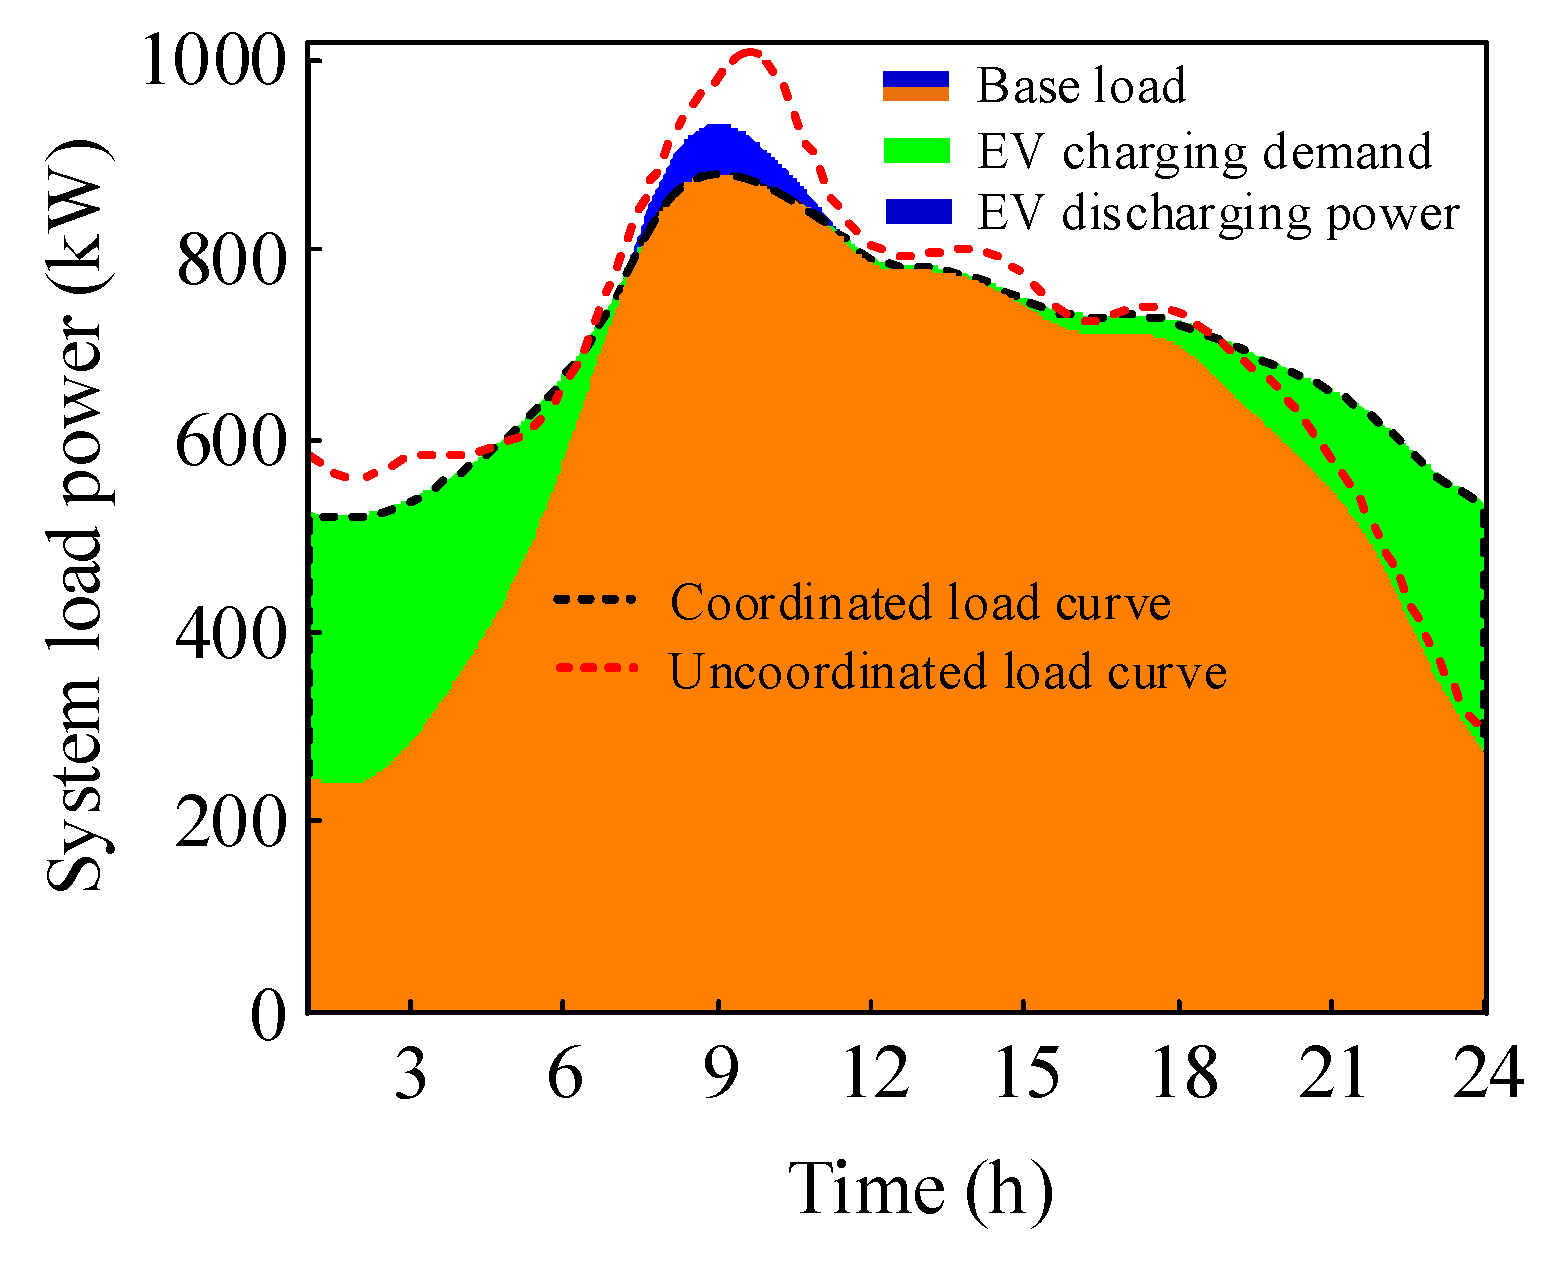
Microgrid’s total load profile considering EVs’ coordinated charging demand and discharging power is depicted in
Figure 4. Compared with uncoordinated charge, i.e., the microgrid provides no incentive price for EV fleet and EVs start charging at rated power once parking, penetration of coordinated EVs does not burden the microgrid in load peak hours, but rather smooths the load profile. Meanwhile, daily charging cost of EV fleet is decreased from 1134.8 Yuan to 999.0 Yuan. Taking into account the discharging profit (205.3 Yuan), the daily charging cost is further reduced to 793.7 Yuan. Therefore, the proposed incentive price mechanism is a win-win management strategy for both EVs and the microgrid.
4.3. Planning Results and Analysis
In order to investigate the impact of EV’s penetration and energy management mode on DEP, three scenarios are considered. DEP is firstly implemented without consideration of plug-in EVs (S-1). Then DEP is carried out with consideration of the uncoordinated charge of EVs (S-2), coordinated charge and discharge of EVs (S-3). Planning results when IPSP
req = 90% are demonstrated in
Table 5.
It is obvious that the planning scheme considering coordinated EVs obtains the best economy. The comprehensive cost of S-3 is reduced by 41.26% and 32.52% compared with S-1 and S-2, respectively, among which the capital cost and installation cost of DGs and ESS in particular accounts for the most cost reduction. In detail, the microgrid’s need for energy storage is considerably reduced for the following two reasons. Coordinated EV charging demand and discharging power smooths the load profile in connected operation, which eases the power regulation burden of ESS. Besides, EVs’ ancillary services can share the ESS’s emergent power supply pressure in islanded operation. In general, the planning scheme considering coordinated EVs takes full advantage of economic power dispatch of the microgrid and mobile energy storage of EVs, thereby reducing the necessary capacity of DGs and ESS, and the comprehensive cost, accordingly.
Comparing the planning results of S-1 with S-2, though the load level is greatly increased with EVs’ uncoordinated charging demand, the comprehensive cost of S-2 is instead 12.95% (1386.61 Yuan) less than that of S-1. The main cause of such result is that EV demand in this case promotes the load-generation matching. EV users’ uncoordinated charging behaviors indicate that most EVs get charged during load valley hours from 0:00 to 6:00 when wind generation is high and PV generation is negligible. Therefore, it is more appropriate for the microgrid to plan more high cost-performance and high capacity factor WTs and utilize WT generation to meet total load demand in that time interval. In comparison, without EVs’ demand to absorb the surplus WT generation power, the microgrid must intensively transmit power to the utility grid, and, accordingly, the DEP scheme of S-1 plans fewer WTs and deploys more high-cost ESSs and PVs, so as to keep the interactive power within the limit and satisfy load demand in peak hours.
4.4. Operational Analysis of Microgrid with DGs and ESS
Microgrid structure with planned DGs and ESS in S-3 is depicted in
Figure 5. The sites of DGs and ESS are optimized in the iterative process of the two-stage heuristic algorithm, progressing towards improving microgrid’s power flow and decreasing the power loss. As a result, DGs and ESS are preferentially placed at heavy load nodes. Simulations results on connected and islanded operation are presented in
Figure 6 and
Figure 7.
4.4.1. Connected Operation
As depicted in
Figure 6, fluctuation of ESS’s SOC indicates that the ESS charges intensively during 0:00–5:00 and 21:00–24:00 when wind generation is redundant and discharges in 7:00–10:00 and 17:00–20:00 when distributed generation cannot meet the total load demand, during which the power purchasing price is the highest of 1.197 Yuan/kWh. Redundant distributed generation is not all sold to the utility grid, but is rather stored in the ESS for later power supply when distributed generation cannot meet total load demand and the electricity price is higher. Moreover, the ESS also gets charged from 10:00 to 17:00, during which distributed generation is insufficient and microgrid purchases power from utility grid to maintain power balance. Though ESS charge in this period results in an extra electricity cost, it is still necessary and cost-effective for the microgrid to get the ESS charged for the coming discharge operations at higher electricity prices. Hence, the proposed economic power dispatch strategy takes advantage of surplus distributed generation and the fluctuation of the electricity price, and forms an overall least-cost dispatch plan for the ESS and power transaction with the utility grid.
4.4.2. Islanded Operation
It can be observed from
Figure 7 that, for 19 of 24 possible islanding hours, distributed generation and ESS discharge along with EVs’ ancillary service can satisfy all the base load demand. During 0:00–7:00, 22:00–24:00 when WT generation is high and load is relatively light, surplus wind power can also meet EVs’ charging demand. Typically in 10:00, the available V2G capacity reaches to a maximum of 276.06 kW and fills up 96.50% of the power vacancy. Given that the ancillary service cost is much less than that of increasing the capacity of ESS, rational utilization of EVs’ ancillary service can be a cost-effective alternative for ESS in islanded operation.
4.5. Reliability Analysis
The power supply reliability of the DEP scheme is verified by the simulation results of the microgrid. The simulations are carried out in S-2 and S-3 with annual load data, wind speed and solar radiation power of a region from the National Renewable Energy Laboratory (NREL). Power demands from the microgrid to the utility grid throughout the year are depicted in
Figure 8. It is obvious that consideration of coordinated charge and discharge of EVs (S-3) can effectively reduce the reserve capacity and the dependence of the microgrid on the utility grid. The simulation results show that there are 8740 hours in S-3, 99.77% of the total year, which meet the constraint of interaction power between the microgrid and the utility grid, less than 500 kW in connected operation. By contrast, only 7542 hours in S-2, 86.09% of the total year, meet this constraint. In islanded operation, period 95.33% of possible islanding hours in S-3 is reliable in power supply when IPSP
req = 90%. Therefore, in a sense, the proposed DEP scheme can ensure the reliability of the power supply.
4.6. Sensitivity Analysis
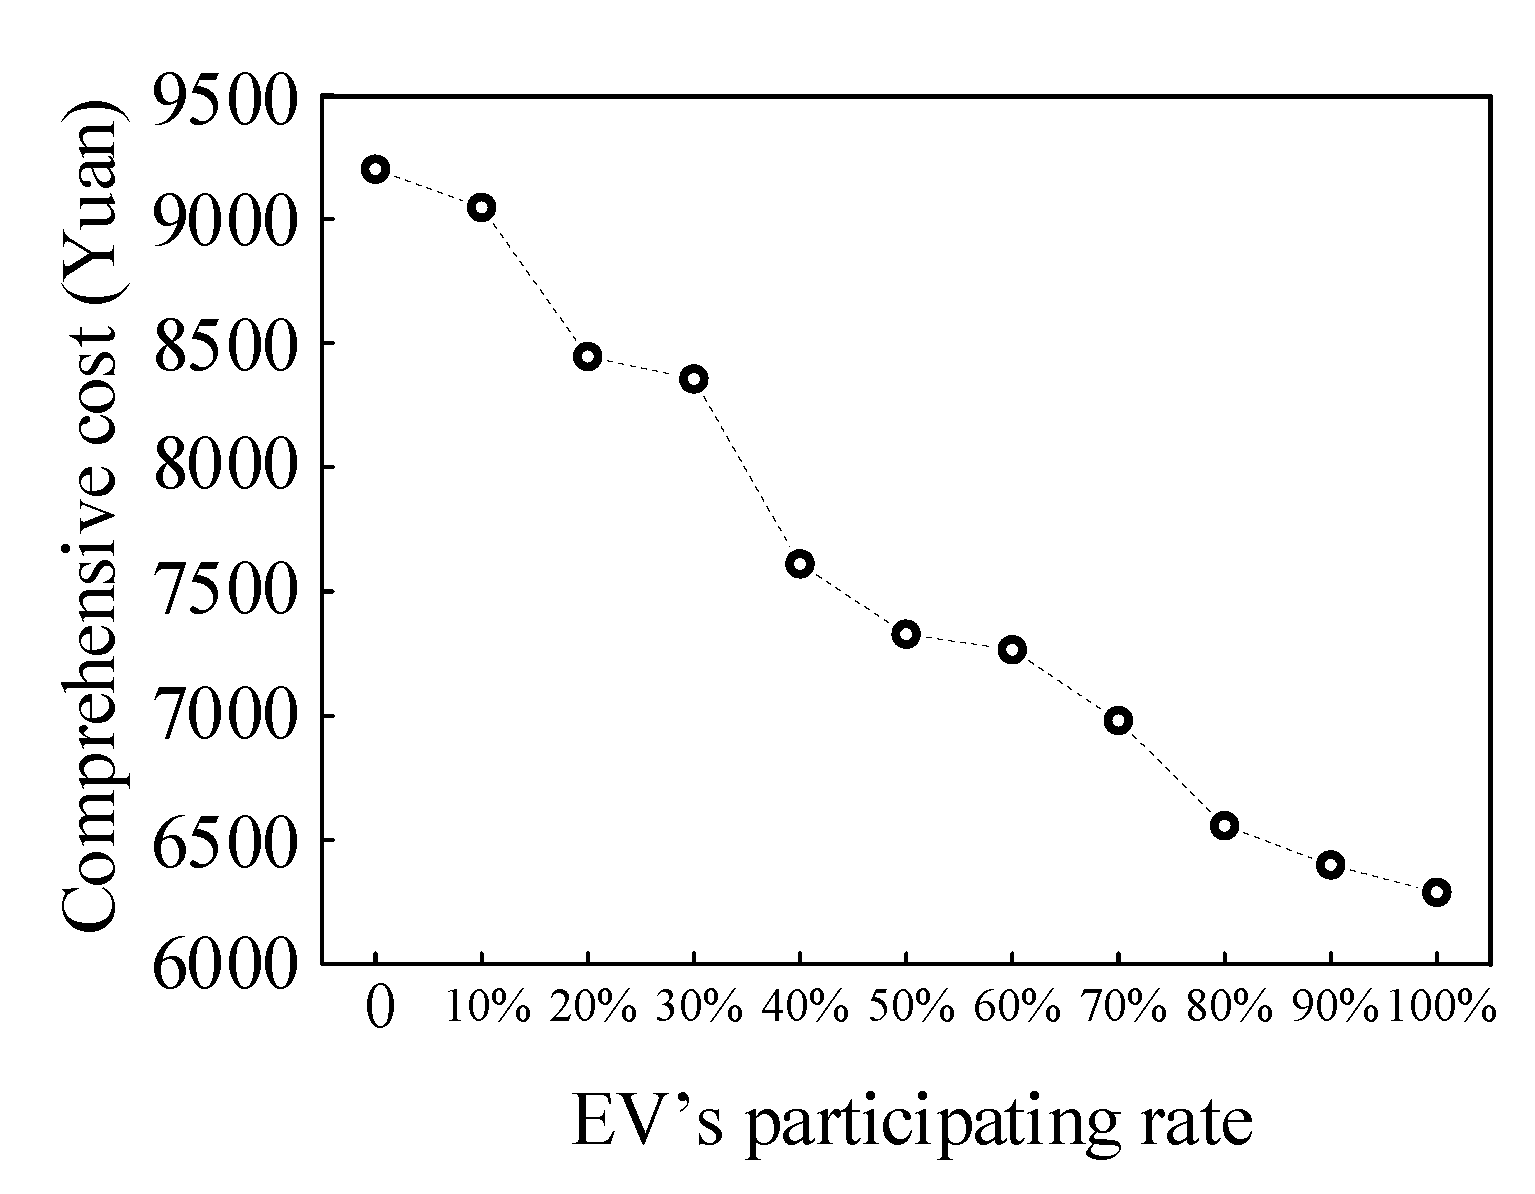
In the former sections, we assume that all EV users are willing to provide ancillary services due to the high paybacks. However, this may not be practical for EV users with mileage anxiety. In order to further study the influence of V2G capacity on DEP, simulations are carried out in S-3 with linearly increasing participating rate of EVs. Cost related results are depicted in
Figure 9. In general, the daily comprehensive cost of DEP rises with the decrease of EVs’ participating rate. It is conceivable that more DGs and ESS are planned to cope with power shortage in islanded operation when an increasing number of EV users refuse to provide delay charging and discharging services. It should also be noted that when no EV provides ancillary services, the comprehensive cost of the planning scheme in S-3 (9201.49 Yuan) is still 117.23 Yuan less than that of S-2, proving the positive impact of EVs’ coordinated management on DEP.
Although a microgrid with high EV penetration is considered in this paper, it can be concluded that as long as there is an EV which responds to the dispatch of the microgrid and participates in ancillary services, the proposed strategy was validated. This is because the load curve is smoothed and the ESS capacity is reduced by EVs’ coordinated management.


