Wind Power Economic Feasibility under Uncertainty and the Application of ANN in Sensitivity Analysis

 , ,
, ,  ,
,  and
and
Abstract
:1. Introduction
2. Theoretical Background
2.1. Economic Feasibility Analysis
2.2. Weighted Average Cost of Capital
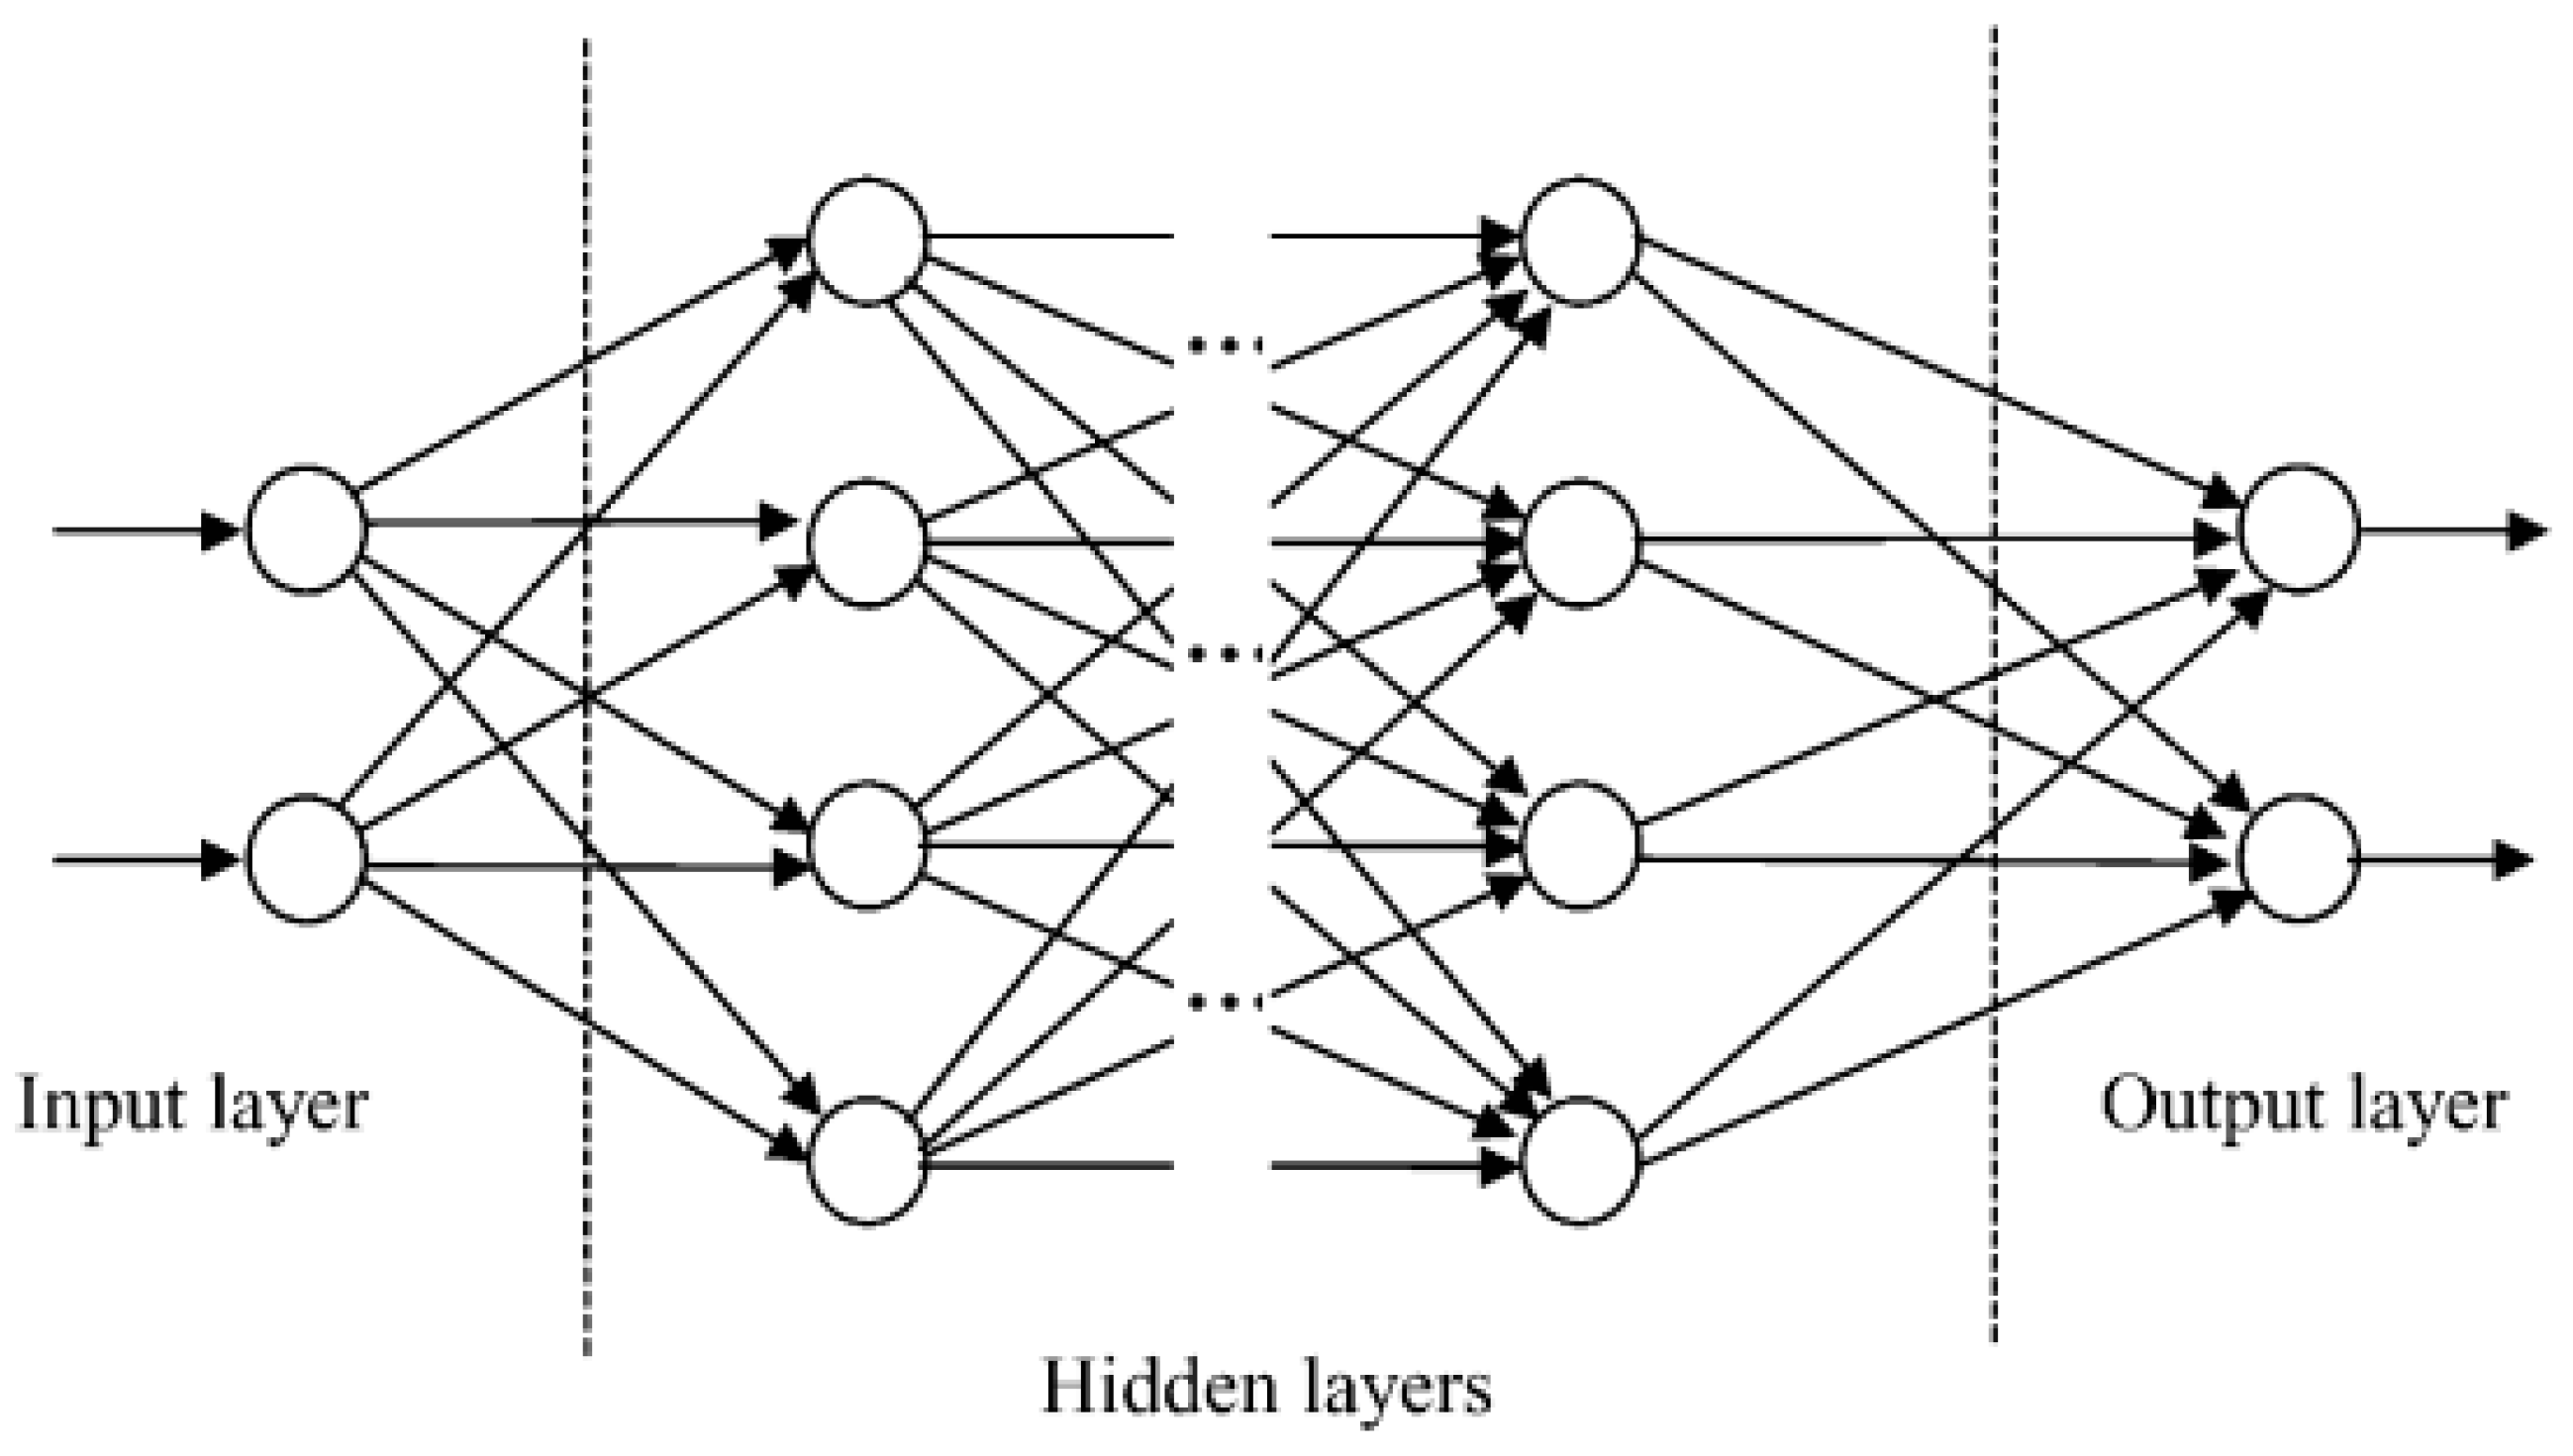
2.3. Artificial Neural Networks
- The vector, M (1 × n), must be organized with the interconnection weights between the nodes of the hidden layers (n) and the nodes of the output layers;
- The matrix, W (m × n), must be organized with the interconnection weights between the nodes of the input layers (m) and the nodes of the hidden layers (n);
- Calculate the vector R = MWT, where R = [r1, r2, …, rm];
- Finally, we calculate the relative importance (RIi), in percentage, of each node i of the input layer, as given by Equation (5).
3. Materials and Methods
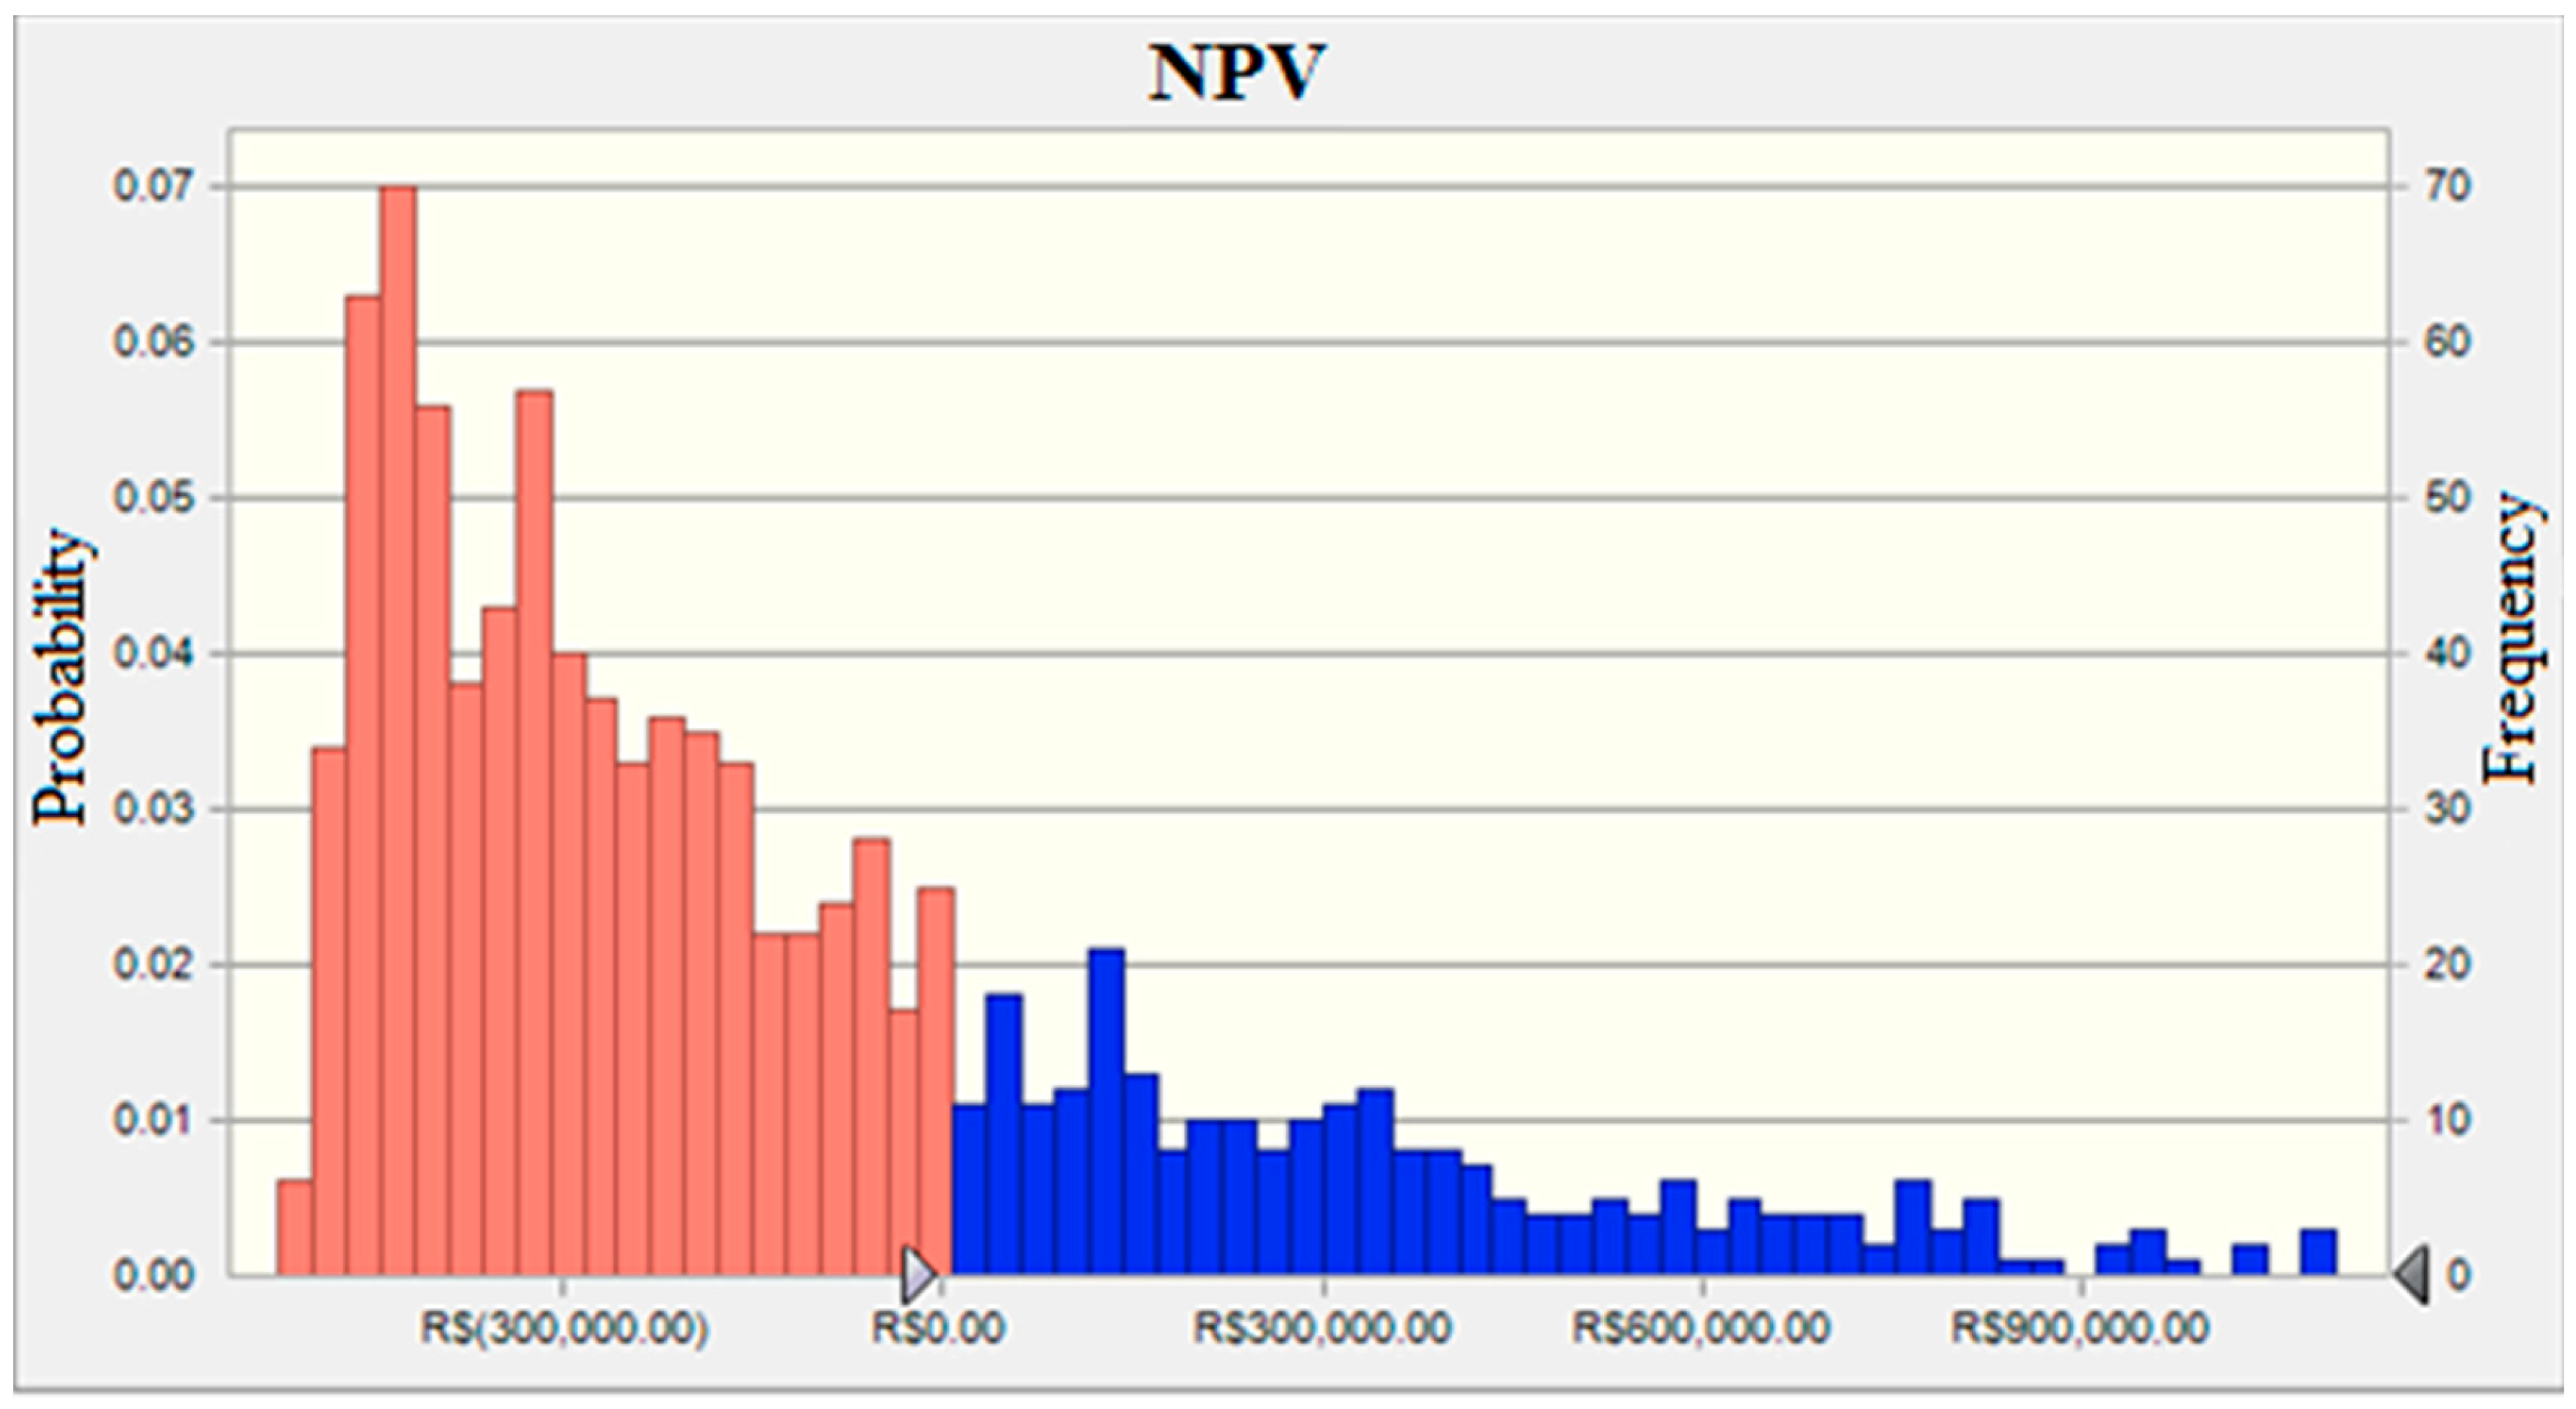
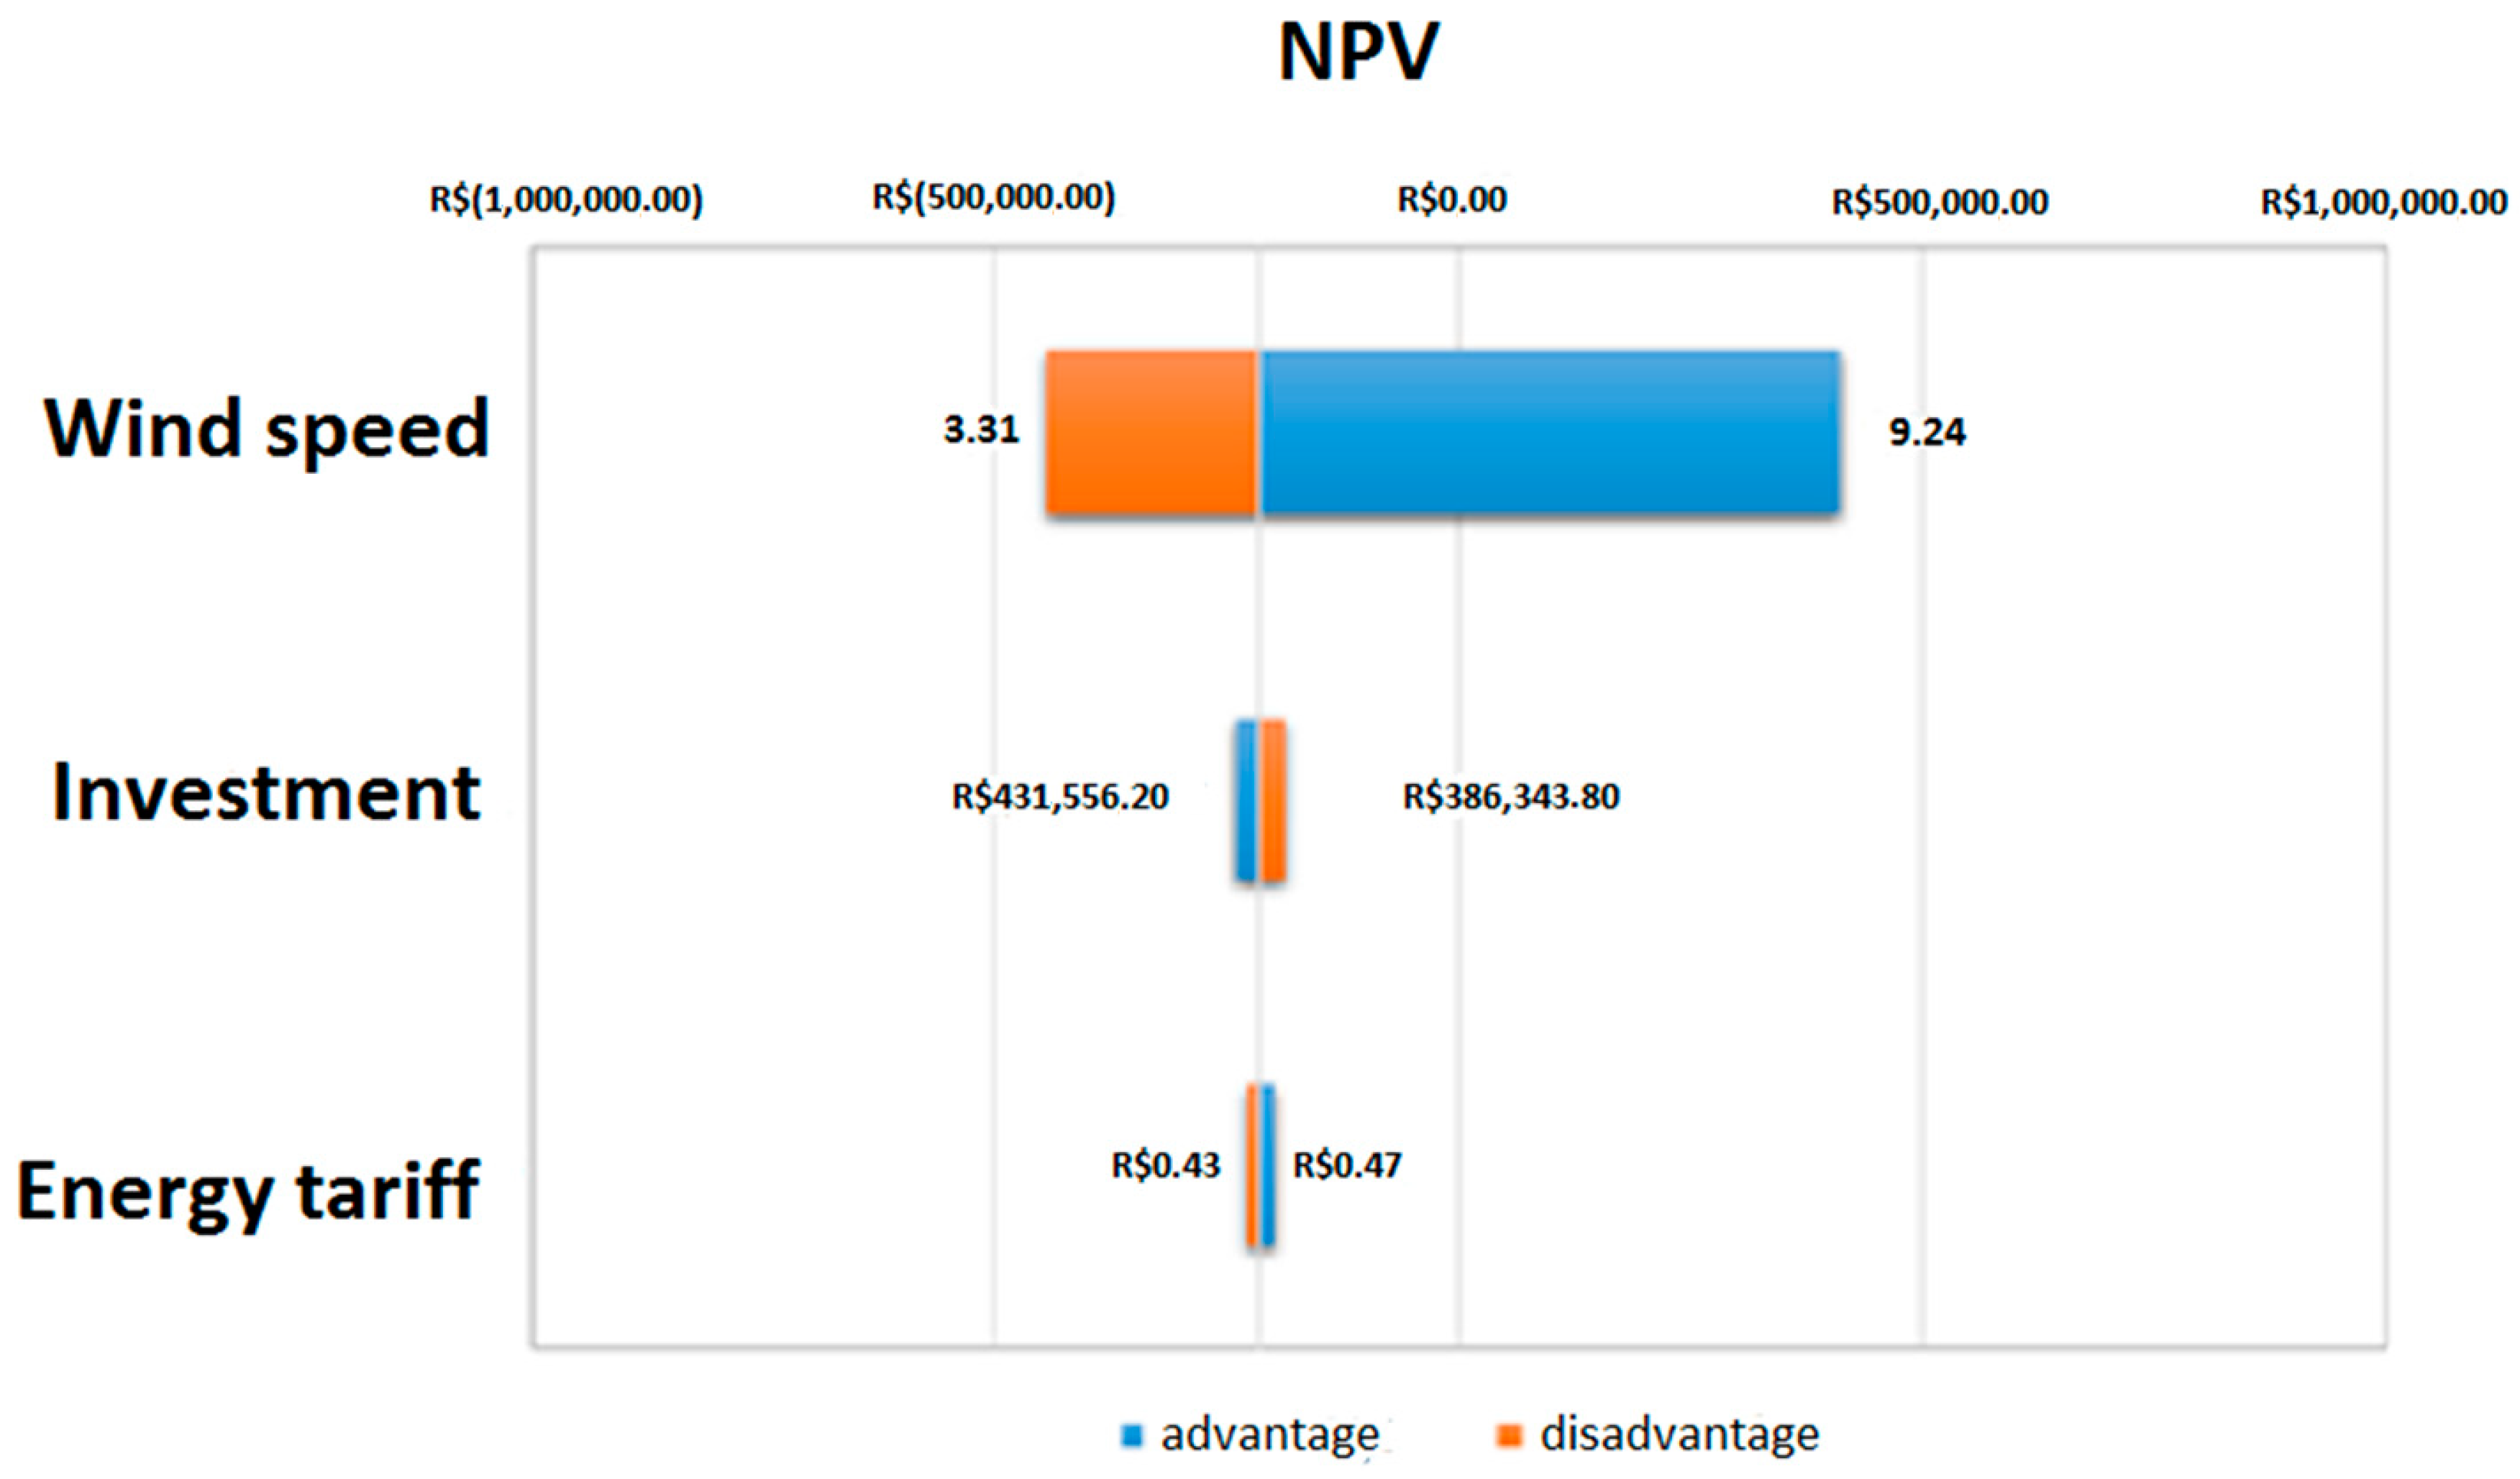
4. Results and Discussion
5. Conclusions
Author Contributions
Funding
Conflicts of Interest
References
- Aquila, G.; Rocha, L.C.S.; Junior, P.R.; Pamplona, E.O.; Queiroz, A.R.; Paiva, A.P. Wind power generation: An impact analysis of incentive strategies for cleaner energy provision in Brazil. J. Clean. Prod. 2016, 137, 1100–1108. [Google Scholar] [CrossRef]
- Ringel, M. Fostering the use of renewable energies in the European Union: The race between feed-in tariffs and green certificates. Renew. Energy 2006, 31, 1–17. [Google Scholar] [CrossRef]
- Rocha, L.C.; Aquila, G.; Junior, P.R.; Paiva, A.; Pamplona, E.; Balestrassi, P. A stochastic economic viability analysis of residential wind power generation in Brazil. Renew. Sustain. Energy Rev. 2018, 90, 412–419. [Google Scholar] [CrossRef]
- Ertürk, M. The evaluation of feed-in tariff regulation of Turkey for onshore wind energy based on the economic analysis. Energy Policy 2012, 45, 359–367. [Google Scholar] [CrossRef]
- Anoune, K.; Bouya, M.; Astito, A.; Ben Abdellah, A. Sizing methods and optimization techniques for PV-wind based hybrid renewable energy system: A review. Renew. Sustain. Energy Rev. 2018, 93, 652–673. [Google Scholar] [CrossRef]
- Mohammadi, A.; Mehrpooya, M. A comprehensive review on coupling different types of electrolyzer to renewable energy sources. Energy 2018, 158, 632–655. [Google Scholar] [CrossRef]
- Aquila, G.; Junior, P.R.; Pamplona, E.O.; Queiroz, A.R. Wind power feasibility analysis under uncertainty in the Brazilian electricity market. Energy Econ. 2017, 65, 127–136. [Google Scholar] [CrossRef]
- Wong, S.; Bhattacharya, K.; Fuller, J.D. Long-Term Effects of Feed-in Tariffs and Carbon Taxes on Distribution Systems. IEEE Trans. Power Syst. 2010, 25, 1241–1253. [Google Scholar] [CrossRef]
- Empresa de Pesquisa Energética (EPE). Avaliação da Geração de Usinas Híbridas Eólico-Fotovoltaicas: Proposta Metodológica e Estudos de caso; EPE: Rio de Janeiro, Brazil, 2016; p. 32. [Google Scholar]
- Silva, N.F.; Rosa, L.P.; Freitas, M.A.V.; Pereira, M.G. Wind energy in Brazil: From the power sector’s expansion crisis model to the favorable environment. Renew. Sustain. Energy Rev. 2013, 22, 686–697. [Google Scholar] [CrossRef]
- Montes, G.; Martin, E.; Bayo, J.; Garcia, J. The applicability of computer simulation using Monte Carlo techniques in windfarm profitability analysis. Renew. Sustain. Energy Rev. 2011, 15, 4746–4755. [Google Scholar] [CrossRef]
- Arnold, U.; Yildiz, Ö. Economic risk analysis of decentralized renewable energy infrastructures and a Monte Carlo Simulation approach. Renew. Energy 2015, 77, 227–239. [Google Scholar] [CrossRef]
- Haufe, M.; Ehrhart, K. Auctions for renewable energy support—Suitability, design, and first lessons learned. Energy Policy 2018, 121, 217–224. [Google Scholar] [CrossRef]
- Li, C.-B.; Lu, G.-S.; Wu, S. The investment risk analysis of wind power project in China. Renew. Energy 2013, 50, 481–487. [Google Scholar] [CrossRef]
- Holdermann, C.; Kissel, J.; Beigel, J. Distributed photovoltaic generation in Brazil: An economic viability analysis of small-scale photovoltaic systems in the residential and commercial sectors. Energy Policy 2014, 67, 612–617. [Google Scholar] [CrossRef]
- Hawawini, G.; Viallet, C. Finance for Executives: Managing for Value Creation, 4th ed.; South-Western Cengage Learning: Boston, MA, USA, 2009; pp. 190–334. [Google Scholar]
- Ross, S.A.; Westerfield, R.W.; Jordan, B.D.; Lamb, R. Fundamentos de Administração Financeira, 9th ed.; Mcgraw-Hill AMGH: New York, NY, USA, 2013; pp. 280–438. [Google Scholar]
- Tao, J.Y.; Finenko, A. Moving beyond LCOE: Impact of various financing methods on PV profitability for SIDS. Energy Policy 2016, 98, 749–758. [Google Scholar] [CrossRef]
- Ross, S.A.; Westerfield, R.W.; Jordan, B.D. Fundamentals of Corporate Finance, 6th ed.; Mcgraw-Hill: New York, NY, USA, 2002; pp. 104–337. [Google Scholar]
- Reichelstein, S.; Yorston, M. The prospects for cost competitive solar PV power. Energy Policy 2013, 55, 117–127. [Google Scholar] [CrossRef]
- Bolsa de Valores, Mercadorias E Futuros. Available online: http://www.bmfbovespa.com.br/pt_br/ (accessed on 1 April 2018).
- ANEEL. Nota Técnica n° 22/2015-SGT/ANEEL, de 29 de janeiro de 2015. 2015. Available online: http://www.aneel.gov.br/aplicacoes/audiencia/arquivo/2014/023/resultado/nt_22_2015_sgt_custo_de_capital.df (accessed on 5 April 2018).
- Damodaran, A. Betas by Sector (US). January 2018. Available online: http://people.stern.nyu.edu/adamodar/New_Home_Page/datafile/Betas.html (accessed on 1 December 2018).
- Adya, M.; Collopy, F. How effective are Neural Networks at Forecasting and Prediction? A Review and Evaluation. J. Forecast. 1998, 17, 481–495. [Google Scholar] [CrossRef]
- Haykin, S. Neural Networks and Learning Machines, 3rd ed.; Prentice Hall: Upper Saddle River, NJ, USA, 2009. [Google Scholar]
- Bigdeli, N.; Afshar, K.; Gazafroudi, A.; Ramandi, M. A comparative study of optimal hybrid methods for wind power prediction in wind farm of Alberta, Canada. Renew. Sustain. Energy Rev. 2013, 27, 20–29. [Google Scholar] [CrossRef]
- Chakrabarty, S.; Boksh, F.; Chakraborty, A. Economic viability of biogas and green self-employment opportunities. Renew. Sustain. Energy Rev. 2013, 28, 757–766. [Google Scholar] [CrossRef]
- Ata, R. Artificial neural networks applications in wind energy systems: A review. Renew. Sustain. Energy Rev. 2015, 49, 534–562. [Google Scholar] [CrossRef]
- Zhang, G.; Patuwo, B.E.; Hu, M.Y. Forecasting with artificial neural networks: The state of the art. Int. J. Forecast. 1998, 14, 35–62. [Google Scholar] [CrossRef]
- Costa, S.P.; Lima, F.R.; Lapa, C.M.F.; Mól, A.C.; Lira, C.A. The artificial neural network used in the study of sensitivities in the IRIS reactor pressurizer. Prog. Nucl. Energy 2013, 69, 64–70. [Google Scholar] [CrossRef]
- Bertrand, J.; Fransoo, J. Operations Management research methodologies using quantitative modeling. Int. J. Oper. Prod. Manag. 2002, 22, 241–264. [Google Scholar] [CrossRef]
- NASA. Power Data Access View. 2019. Available online: https://power.larc.nasa.gov/data-access-viewer/ (accessed on 10 January 2019).
- Atlas do Potencial Eólico Brasileiro. 2001. Available online: http://www.cresesb.cepel.br/publicacoes/download/atlas_eolico/Atlas%20do%20Potencial%20Eolico%20Brasiliro.pdf (accessed on 5 May 2018).
- Rocha, L.C.S.; Aquila, G.; Pamplona, E.; Paiva, A.P.; Chieregatti, B.G.; Lima, J.S. Photovoltaic electricity production in Brazil: A stochastic economic viability analysis for small systems in the face of net metering and tax incentives. J. Clean. Prod. 2017, 168, 1448–1462. [Google Scholar] [CrossRef]

| Parameters | Distribution | Minimum | Probable | Maximum |
|---|---|---|---|---|
| Wind speed | Weibull | - | ||
| Investment | Triangular | R$ 368,055.00 | R$ 408,950.00 | R$ 449,845.00 |
| Energy tariff | Triangular | R$ 0.41 | R$ 0.45 | R$ 0.50 |
| Period (years) | Fixed | - | 20 | - |
| Annual tariff readjustment | Fixed | 2.30% | ||
| WACC | Fixed | 10.29% | ||
| Financing rate | Fixed | 11.33% | ||
| Depreciation | Fixed | 5% | ||
| Energy production | Calculated | - | ||
| Parameters | Relative Importance (RI) |
|---|---|
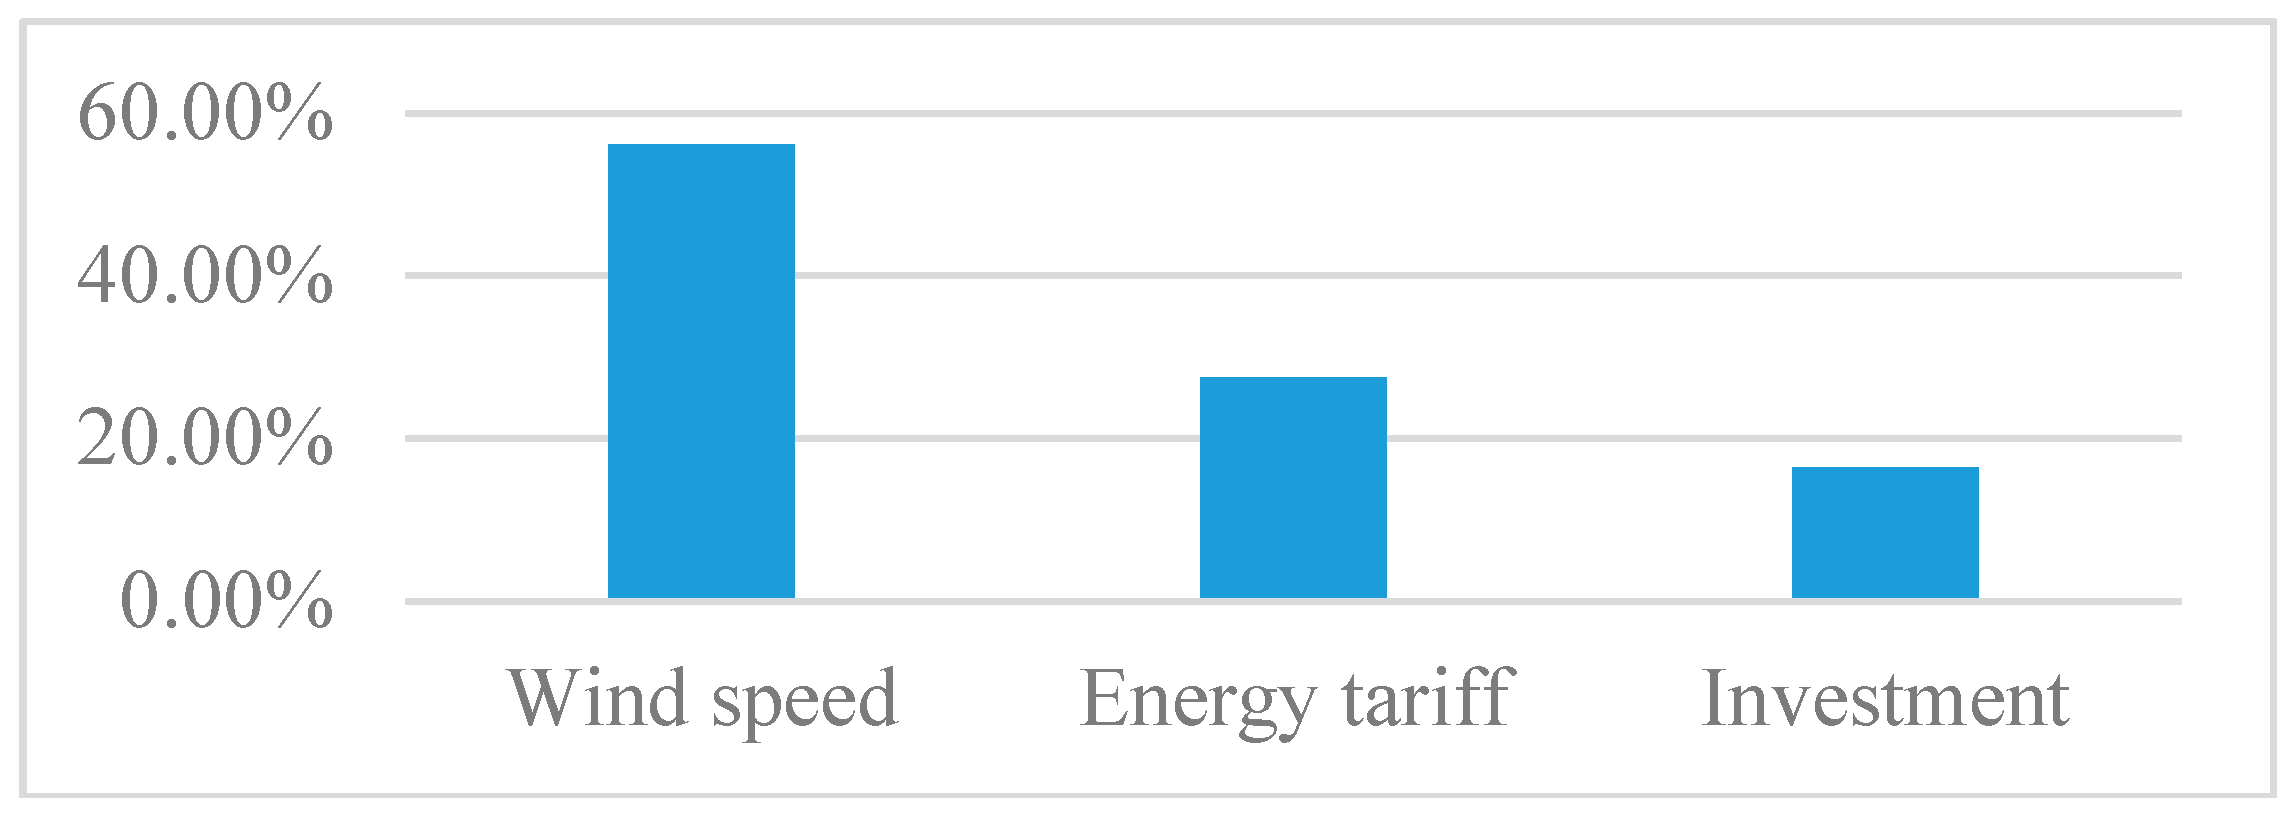
| Wind speed | 56.12% |
| Energy tariff | 27.51% |
| Investment | 16.37% |
© 2019 by the authors. Licensee MDPI, Basel, Switzerland. This article is an open access article distributed under the terms and conditions of the Creative Commons Attribution (CC BY) license (http://creativecommons.org/licenses/by/4.0/).
Share and Cite
Rotela Junior, P.; Fischetti, E.; Araújo, V.G.; Peruchi, R.S.; Aquila, G.; Rocha, L.C.S.; Lacerda, L.S. Wind Power Economic Feasibility under Uncertainty and the Application of ANN in Sensitivity Analysis. Energies 2019, 12, 2281. https://doi.org/10.3390/en12122281
Rotela Junior P, Fischetti E, Araújo VG, Peruchi RS, Aquila G, Rocha LCS, Lacerda LS. Wind Power Economic Feasibility under Uncertainty and the Application of ANN in Sensitivity Analysis. Energies. 2019; 12(12):2281. https://doi.org/10.3390/en12122281
Chicago/Turabian StyleRotela Junior, Paulo, Eugenio Fischetti, Victor G. Araújo, Rogério S. Peruchi, Giancarlo Aquila, Luiz Célio S. Rocha, and Liviam S. Lacerda. 2019. "Wind Power Economic Feasibility under Uncertainty and the Application of ANN in Sensitivity Analysis" Energies 12, no. 12: 2281. https://doi.org/10.3390/en12122281