Article

Numerical Simulation of Bubble-Liquid Two-Phase Turbulent Flows in Shallow Bioreactor

1
College of Aerospace Engineering, Taizhou University, Taizhou 318000, China
2
Department of Engineering Mechanics, Tsinghua University, Beijing 10084, China
*
Author to whom correspondence should be addressed.
Energies 2019, 12(12), 2269; https://doi.org/10.3390/en12122269
Submission received: 5 May 2019 / Revised: 9 June 2019 / Accepted: 10 June 2019 / Published: 13 June 2019

Abstract

:
An improved second-order moment bubble-liquid two-phase turbulent model is developed to predict the hydrodynamic characteristics of the shallow bioreactor using two height-to-diameter ratios of H/D = 1.4 and H/D = 2.9. The two-phase hydrodynamic parameters, the bubble normal and shear stress, the bubble energy dissipation rate, the bubble turbulent kinetic energy, etc. were numerically simulated. These parameters increased along with flow direction and constituted a threat to cells living at far distance away from the gas jetting inlet regions, rather than a finding of higher cell damage at near the jetting inlet region, as reported by Babosa et al. 2003. A new correlation named the turbulent energy production of bubble-liquid two-phase flow was proposed to successfully verify this experimental observation. A smaller H/D ratio makes more contributions to the generation of lower turbulent energy productions, which are in favor of the alleviation of cell damage. The extremely long and narrow shape of the bioreactor is deteriorative for cell living.

1. Introduction

The shallow gas-liquid bioreactor characterized by the lower height-to-diameter ratios, has been widely applied in the field of biotechnology engineering, chemical engineering and pharmaceutical industries because of its low gas pressure drop, absence of moving parts, low cost and robust liquid phase residence time, especially eliminating the high-pressure drop of the tall reactors [1,2,3], Bubble-liquid hydrodynamics in the shallow reactor are predominantly controlled by sparger construction and the ratios of height to diameter (H/D), which are quietly different from those of a taller-shaped reactor. To thoroughly understand the hydrodynamic characteristics, it is essential to grasp the essences of optimization and scale-up strategies. However, the complex mechanism of bubble-liquid two-phase turbulent hydrodynamics and the effects of sparger design and H/D ratios on flows and transport characteristics have not been acquainted clearly. Up to now, most investigations have been performed heavily on an empirical or semi-empirical basis, and evidences that only originated from the experimental data, resulting in the difficulty to fulfill in-depth experimental validations under different platforms and derivations of theoretical applications due to their limitations [4,5,6].
With respect to the animal cell culture of biotechnology engineering, although early industrial exploitation began with Salk poliovirus vaccine production in primary monkey kidney cells, commercial application of animal cells to produce human biopharmaceuticals has rapidly increased in recent years [7,8]. Thus, reasonable design and optimized strategies of the bioreactor are the key issues for successfully producing commercial biopharmaceuticals. Both the experimental and the simulation investigations have been focused on the effect of the height-to-diameter (H/D) ratios on the flow performance in the shallow bubble column reactor. Throat et al. [9] investigated the combined effects of sparger design and height-to-diameter ratio (H/D) on gas holdup. Maximum gas holdup was observed at H/D = 1 and began to decrease with H/D ratio increase using a multipoint sparger in the air-water system The gas holdup will also increase with increasing H/D ratio for a single point sparger. However, regarding a single point sparger, the reverse trend was obtained by Lau et al. [6]. In this study, three types of gas distributors, single nozzle, perforated plate and porous plate, were serviced to study the effect of H/D ratios. An increase in the H/D ratio resulted in decreasing overall gas holdup, and with a diminishing effect for an H/D ratio of higher than 4.0. Veera et al. [10] found that gas holdup increased by about 50%–100% as H/D increased from 1 to 5 for a single point sparger, and gas holdup is at its maximum at a very low H/D and decreases by 15%–20% as H/D increases up to a value of 5 for a multipoint sparger. Dhotre et al. [11] revealed that centerline gas holdup increased with distance from the bottom section for a multipoint sparger and gas holdup profiles exhibit steeply at the axial location of H/D = 0.259, and then became flat with increasing distance from the sparger. If the homogeneous regime is ensured as the diameter is less than 150 mm and the superficial gas velocity is less than 100 mm/s, and the H/D is larger than 5, this influence becomes negligible [12,13,14,15,16,17,18]. Optimum gas distributor design is found to be irrelative to the system properties, but, so far, no design procedure has been derived due to the complex flow patterns in the distributor flow regions.
In recent years, the computational fluid dynamics (CFD) method became a promising tool to predict single/multiphase laminar or turbulent flows, and it is more practical and effective to use numerical algorithms than traditional experiments to predict bioreactor hydrodynamics. Gas sparging that related to the cell damage has been considered as a threat factor to cell culture, and the cell-bubble interactions play a principle role in the process of physical cell damage in bioreactors. The energy dissipation rate (EDR) parameter has been considered as a leading hydrodynamic parameter to characterize mammalian cell damage. It is a pity that the EDR is not a perfect hydrodynamic parameter to characterize the complexity of fluid flow and set forth the interactions between turbulent flows and suspended cells. Mollet et al. [19] performed a CFD simulation using ANSYS Fluent commercial software to predict the EDR distributions in a 1.6 L bioreactor. They found that the local energy dissipation rate at this scale level is on the order of 107 W/m3, which results in an immediate, catastrophic rupture of suspended animal cells. The averaged energy dissipation rate is on the order of 103, causing damage to suspended animal cells. Zhang et al. [20] predicted the bubble-liquid mixing and mass transfer in a 250 mL shake flask operating over a range of shaking frequencies between 100 and 300 rev/min by Fluent software. Rajaram et al. [21] used a standard k-ε two-equation turbulence model to reveal the distributions of the average energy dissipation rate and the maximum energy dissipation rate in the volumes of 0.785 L, 22.0 L, 145.0 L and 785.0 L stirred tank bioreactors. They revealed that tank diameter and impeller configuration deactivations were dramatically different. Kelly et al. [22] numerically simulated the upstream bioprocessing steps, i.e., fermentation and homogenization, etc., in order to characterize single-phase (liquid) flow hydrodynamic shear stress and to find the most dangerous factors on cell culture. Mollet et al. [23] simulated the typical fluid flow through the nozzle of a BD FACS vantage and indicated that the hydrodynamic forces are similar to those of an e FACS nozzle. Zhang et al. [24] found that the local maximum EDR profile located in vertical plane between baffles showed that EDR values around top and bottom impellers decreased rapidly along a radial direction by means of a multiple size groups model. Oncul et al. [25] characterized the flow conditions by numerical simulation using Fluent software to explore cell growth and cell damage for the consideration of the influence on flow regime properties in bioreactors. He indicated that shear stress levels are the threshold values for judgement regarding animal cell damage. Chris et al. [26] proposed that the turbulent eddies that are much larger or smaller than the biological cell diameter would not inhibit or destroy the cell viability. Simulated results showed that the mean turbulent eddies in all scales are substantially larger than average cell diameter, which means that the cell death due to mechanical agitation exists at all scales. Extending these results to the gas sparger bioreactor for the first time, Liu et al. [27] defined the stress-induced turbulent energy production as an increase in gas flow rate that would increase cell death at near sparger region, reported by Babosa et al. [28].
As mentioned above, the standard k-ε model or the renormalization group RNG k-ε model are currently used in the ANSYS Fluent commercial software. Moreover, the existing two-fluid models are based on the isotropic turbulent viscosity. Meanwhile, liquid turbulence and bubble turbulence are distinctively anisotropic. Even though the EDR or the normal/shear stresses are considered as generally hydrodynamic parameters related to cell damage, the main findings are that they have larger values at a far distance away from gas jetting inlet regions. This conclusion failed to elaborate on the higher death rate. Furthermore, the bubble rupture or coalescence resulting in cell damage are also unreasonable because these events are primarily located at the top of the liquid surface or nearby the stirred blade, rather than at gas jetting inlet regions [29,30,31,32,33,34,35,36].
In this work, an improved second-order moment bubble-liquid two-phase model that can fully consider the anisotropic bubble dispersion characteristics was proposed to predict the bubble-liquid hydrodynamic parameters in relationship with cell culture in the shallow bubble column bioreactor. A new correlation, the turbulent energy production (TEP) of bubble-liquid two-phase flow, was established to verify the higher cell death at jetting inlet regions. Here, the effects of bubble breakup or coalescence are being neglected. The purpose of this work is to analyze the effects of H/D ratios on bubble-liquid hydrodynamics, i.e., normal and shear stress of bubble flow, energy dissipation rate of bubble phase, turbulent kinetic energy of bubble flow and two-phase turbulent energy production values, etc. The experimental observation that higher cell death at jetting inlet regions is elaborated on as well. In addition, the proposed model is based on the anisotropic characteristics instead of isotropic behaviors built in ANSYS Fluent software.

2. Governing Equations of the Bubble-Liquid Flows

A second-order moment bubble-liquid two-phase turbulent model based on a two-fluid continuum approach, first proposed by Zhou et al. [37,38], was improved to simulate the hydrodynamics. In this model, the bubble was considered as a dispersed phase and the liquid as a continuous phase. The bubble-bubble interactions were neglected. Single bubble motion and liquid Navier–Stokes equations under the Eulerian coordination system were established for continuity, as well as the momentum governing equations of bubble and liquid phases. Furthermore, the anisotropic behaviors of two-phase turbulent flows were fully considered. Here, we only listed the key equations and others can be referred to by the above references. They are as follows:
The momentum equations of bubble and liquid phases are:
t ( α m ¯ ρ m v m i ¯ ¯ ) + x k ( α m ¯ ρ m v m k ¯ ¯ v m i ¯ ¯ ) = β m 0 ρ m g i β m 1 [ p ¯ x i x k ( τ m k i ¯ ) ] x k ( α m ¯ ρ m v m k v m i ¯ ¯ ) + β m 2 α b ¯ ρ g τ r b ( v b i ¯ ¯ v l i ¯ ¯ )
The Reynolds stress transport equations of bubble and liquid phases are:
t ( α m ¯ ρ m ¯ v m i v m j ¯ ¯ ) + x k ( α m ¯ ρ m ¯ V m k ¯ ¯ v m i v m j ¯ ¯ ) = D m i j + P m i j + Π m i j + S m i j + ε m i j ( m = b , l )
where the terms on the right-hand side of Equation (2) represent diffusion term, shear production term, pressure-strain correlation term, dissipation term and phase interaction terms, respectively. These terms are provided in detail:
D m i j = x k ( c s m α m ¯ ρ m ¯ k m ε m v m k v m l ¯ ¯ v m i v m j ¯ ¯ x l )
P m i j = α m ¯ ρ m ¯ ( v m k v m i ¯ ¯ V m j ¯ x k + v m k v m j ¯ ¯ V m i ¯ x k )
Π l i j = Π l i j , 1 + Π l i j , 2 = c l 1 ε l k l α l ¯ ρ l ¯ ( v l i v l j ¯ ¯ 2 3 k l δ i j ) c l 2 ( P l i j 2 3 P l δ i j ) Π b i j = 0
S m i j = α b ¯ ρ g ¯ τ r b ( v b i v l j ¯ ¯ + v b j v l i ¯ ¯ 2 v m i v m j ¯ ¯ )
ε l i j = 2 3 α l ¯ ρ l ¯ ε l δ i j ε b i j = 0
The turbulent kinetic energy equations of the bubble and liquid phases are given:
t ( α m ¯ ρ m k m ) + x j ( α m ¯ ρ m v m j ¯ ¯ k m ) = x j ( α m ¯ μ e m σ k k m x j ) + α m ¯ P m + S m α m ¯ ρ m ε m
The liquid dissipation rate equation of the turbulent kinetic energy is given:
t ( α l ¯ ρ l ε l ) + x j ( α l ¯ ρ l v l j ¯ ¯ ε l ) = x j ( α l ¯ μ e l σ ε ε l x j ) + α l ¯ ε l k l [ c ε 1 ( P l + S l ) c ε 2 ρ l ε l ]
where:
P m = μ e m ( v m k ¯ ¯ x i + v m i ¯ ¯ x k ) v m , i ¯ ¯ x k
S m = α ¯ b ρ g τ r b ( v l i v b i ¯ ¯ 2 k m )
μ e b = c μ b ρ g k b 2 / | S b / ( α ¯ b ρ g ) | μ e l = μ l + μ T l
The key problem is to close the Reynolds stress equations by a perfect anisotropic correlation to reflect anisotropic particle dispersion velocity. An interaction correlation term to successfully explain anisotropic bubble-liquid two-phase turbulence flows was first established by Zhou et al. [37]. It is:
t ( α b ¯ v b i v l j ¯ ¯ ) + x k ( α b ¯ V b k ¯ ¯ v b i v l j ¯ ¯ ) = D b l , i j + P b l , i j + S b l , i j + Π b l , i j + ε b l , i j
The terms on the right-hand side are closed:
D b l , i j = x k [ c b l ( α b ¯ k b ε b v b k v b n ¯ ¯ + α l ¯ k l ε l v l k v ln ¯ ¯ ) v l i v l j ¯ ¯ x n ]
P b l , i j = α ¯ b ( v b k v l j ¯ ¯ V b i ¯ ¯ x k + v l k v b i ¯ ¯ V l j ¯ ¯ x k )
S b l , i j = α b ¯ α l ¯ ρ l ¯ τ r b [ α b ¯ ρ b ¯ v b i v b j ¯ ¯ + α l ¯ ρ l ¯ v l i v l j ¯ ¯ ( α b ¯ ρ b ¯ + α l ¯ ρ l ¯ ) v b i v l j ¯ ¯ ]
ε b l , i j = c b l , 1 α ¯ b τ e v b i v l i ¯ ¯ δ i j
Π b l , i j = Π b l , i j , 1 + Π b l , i j , 2 Π b l , i j , 1 = c b l 2 τ r b α ¯ b ( v b i v l j ¯ ¯ 1 3 δ i j v b i v l i ¯ ¯ ) Π b l , i j , 2 = c b l 3 ( P b l , i j 2 3 δ i j P b P l )
τ e = min [ τ t , τ r b ]
Thus, bubble-liquid turbulent flow can be described by the aforementioned transport equations and closure transport correlations.

3. Numerical Simulation and Experiments

3.1. Simulation Algorithm

The hybrid difference scheme to discrete the equations 1 through 13 was utilized, and the finite difference equations (FDEs) were obtained by the integration of the control volumes. The domain of calculation was first divided into a finite number of control volumes and then the differential equations were integrated over this certain control volume. A staggered grid technique was utilized to store the scalar parameters, i.e., the volume fraction, the density and the turbulent kinetic energy in the main grid points at the center of the control volumes. The tensor velocity components are marked at the control volume surface. The semi-implicit pressure linked equations algorithm, the tridiagonal marching algorithm and under-relaxation algorithm were used to solve the FDEs. The convergence criteria of 1.0 × 10⁻⁴ for residual mass sources was set to both bubble and liquid phases.

3.2. Experiments

Two-dimensional numerical simulations were carried out in the shallow bioreactor with the height-to-diameter ratios of H/D = 2.9 (1.32 m/0.44 m) and H/D = 1.4 (0.75 m/0.58 m), respectively. Here, the swirling flow along tangential direction was neglected. The bioreactor dimensions details are provided in Figure 1. The gas entrance velocity was set to 57.2 m/s using two jetting holes with diameters of 1.0 mm in accordance with the experimental velocity value by Babosa et al. [28], corresponding to the lower superficial gas velocity of 0.06 cm/s. The initial turbulent kinetic energy was 5% of k0 = 0.004·ujet2 and the Reynolds stresses were specified as k’ = 2/3·k0. The shear Reynolds stress was determined by the eddy-viscosity assumption and the outlet condition was for fully developed flow regions, in which zero gradients of all variables were taken for granted. The non-slip wall conditions were used for both gas and liquid velocities and the gas Reynolds stresses were determined by the production term, including effects of wall function on near-wall grid nodes, i.e., əϕ/əx = 0 (ϕ = ub, ul, …). Symmetric conditions were used for both the two phases əϕl/ər = əϕb/ər = 0 at the axis as well. In-house source codes were written in the Fortran 77 language with approximately 9200 statements.

4. Results and Discussion

The key hydrodynamic parameters in association with cell culture solved by this model are the shear and normal stresses of bubble phase, the turbulent kinetic energy of bubble phase and the turbulent energy dissipation rate of bubble phase. A new definition of the energy production correlation of bubble-liquid two-phase turbulence and effects of the height-to-diameter ratios on hydrodynamics are discussed details.

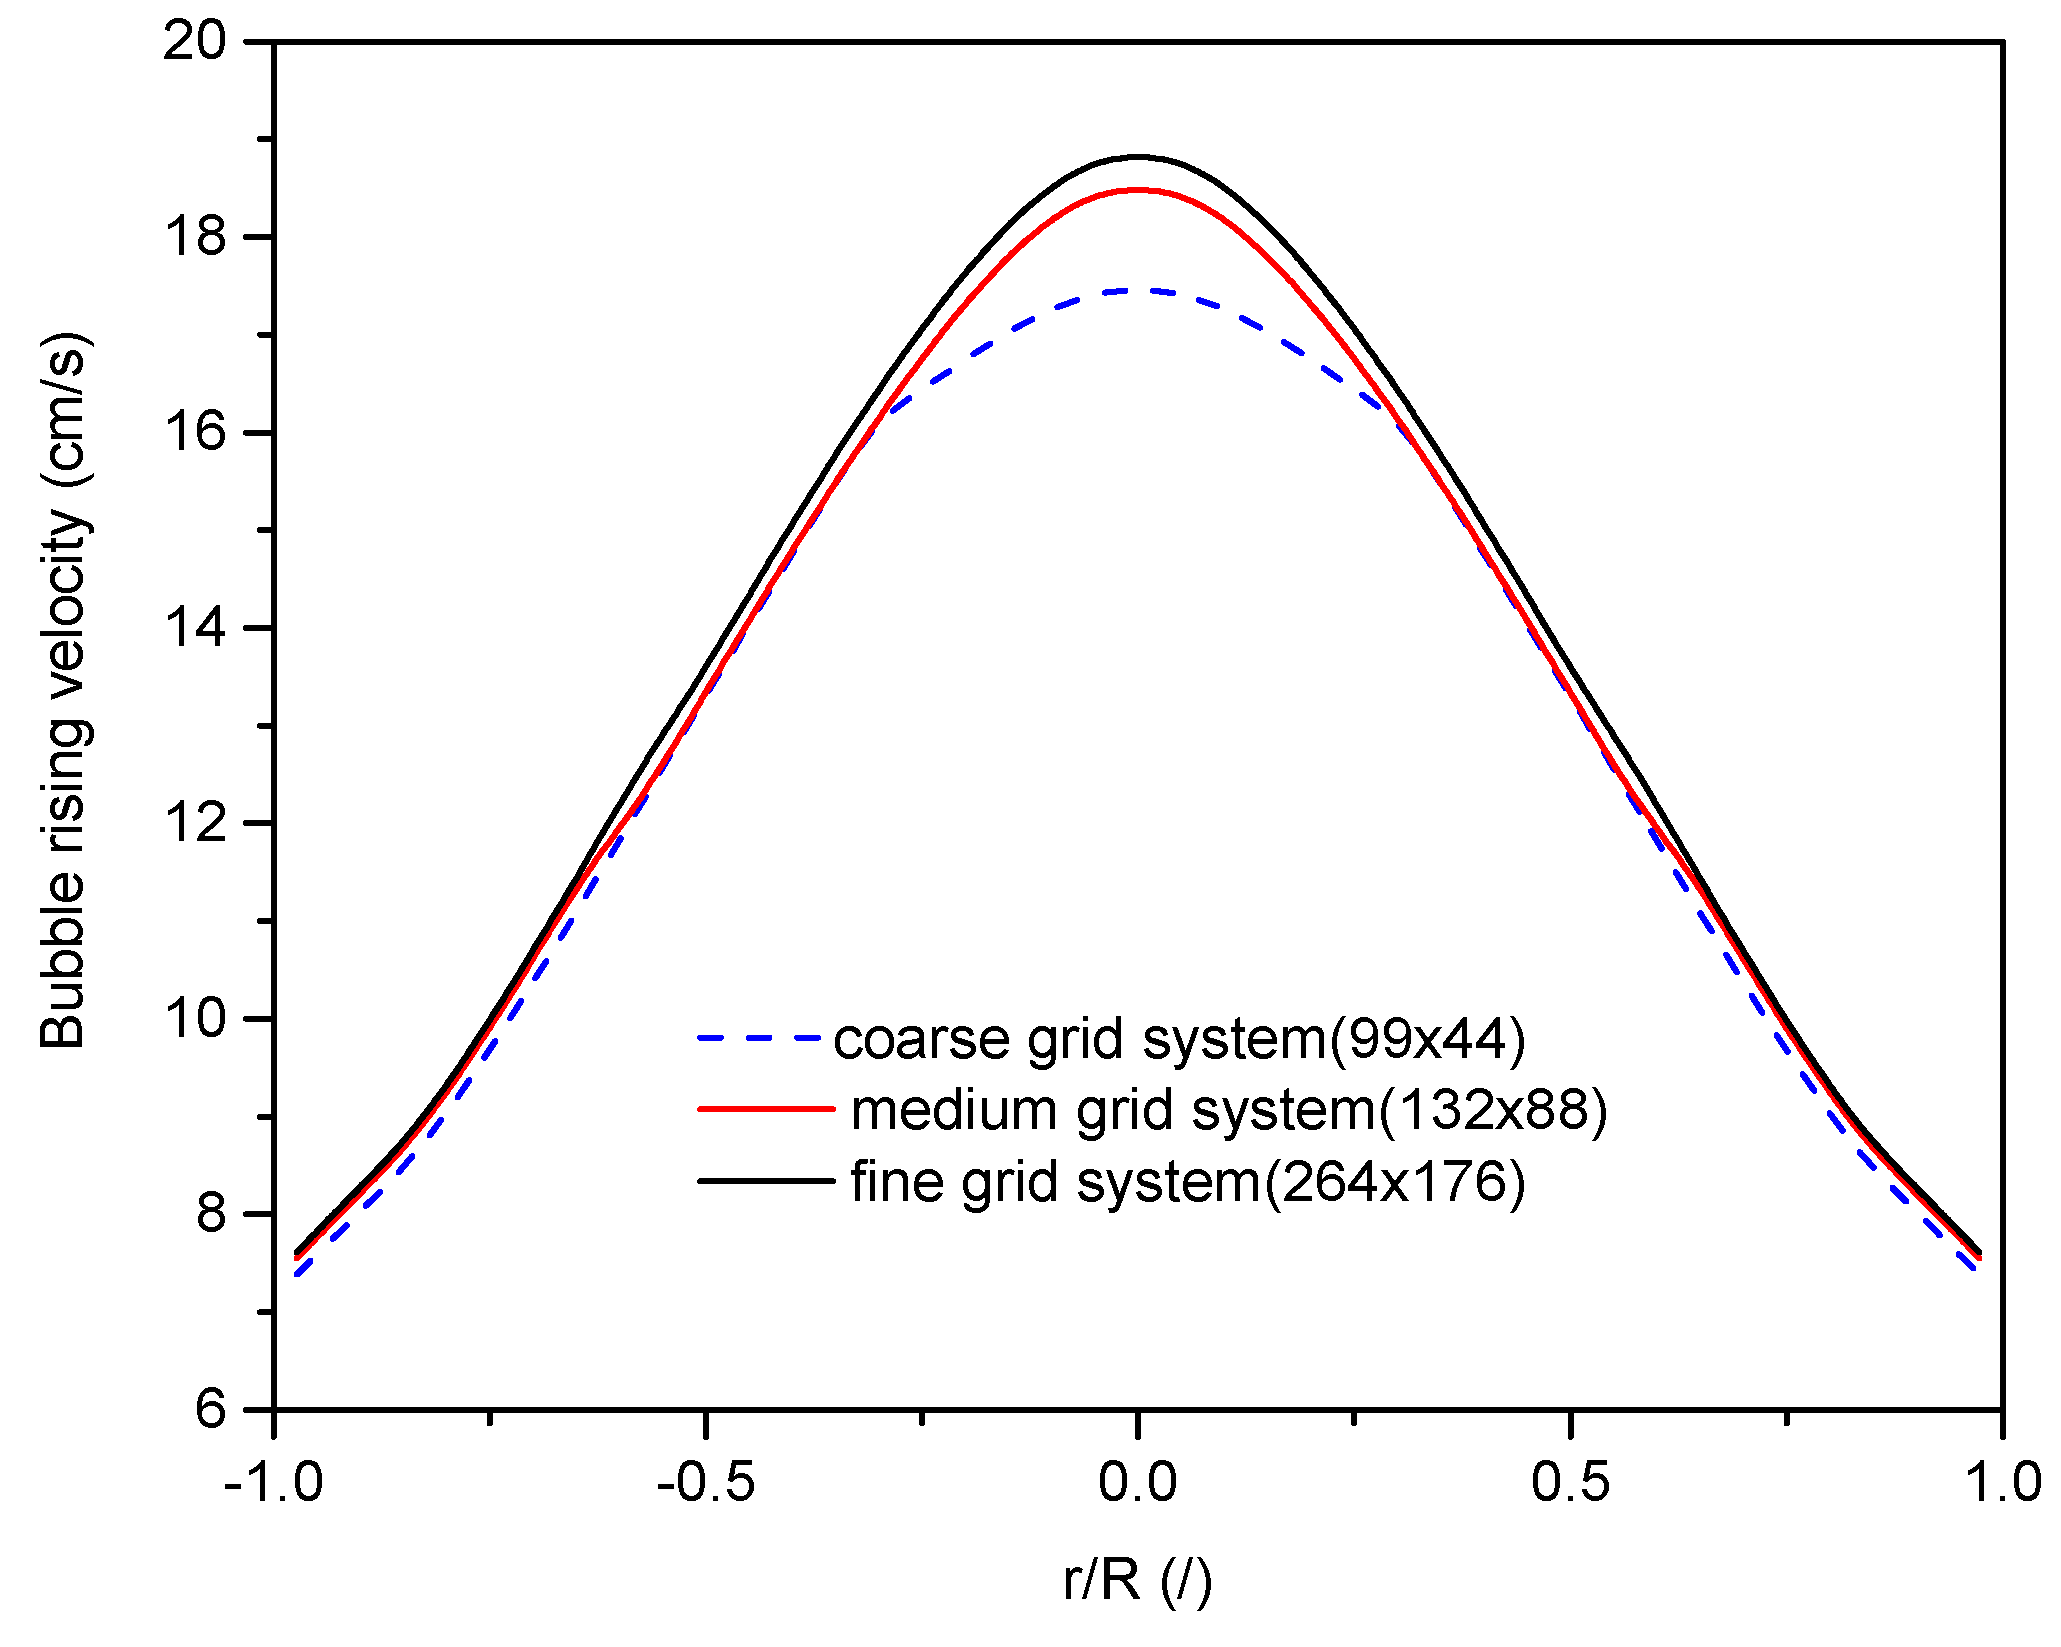
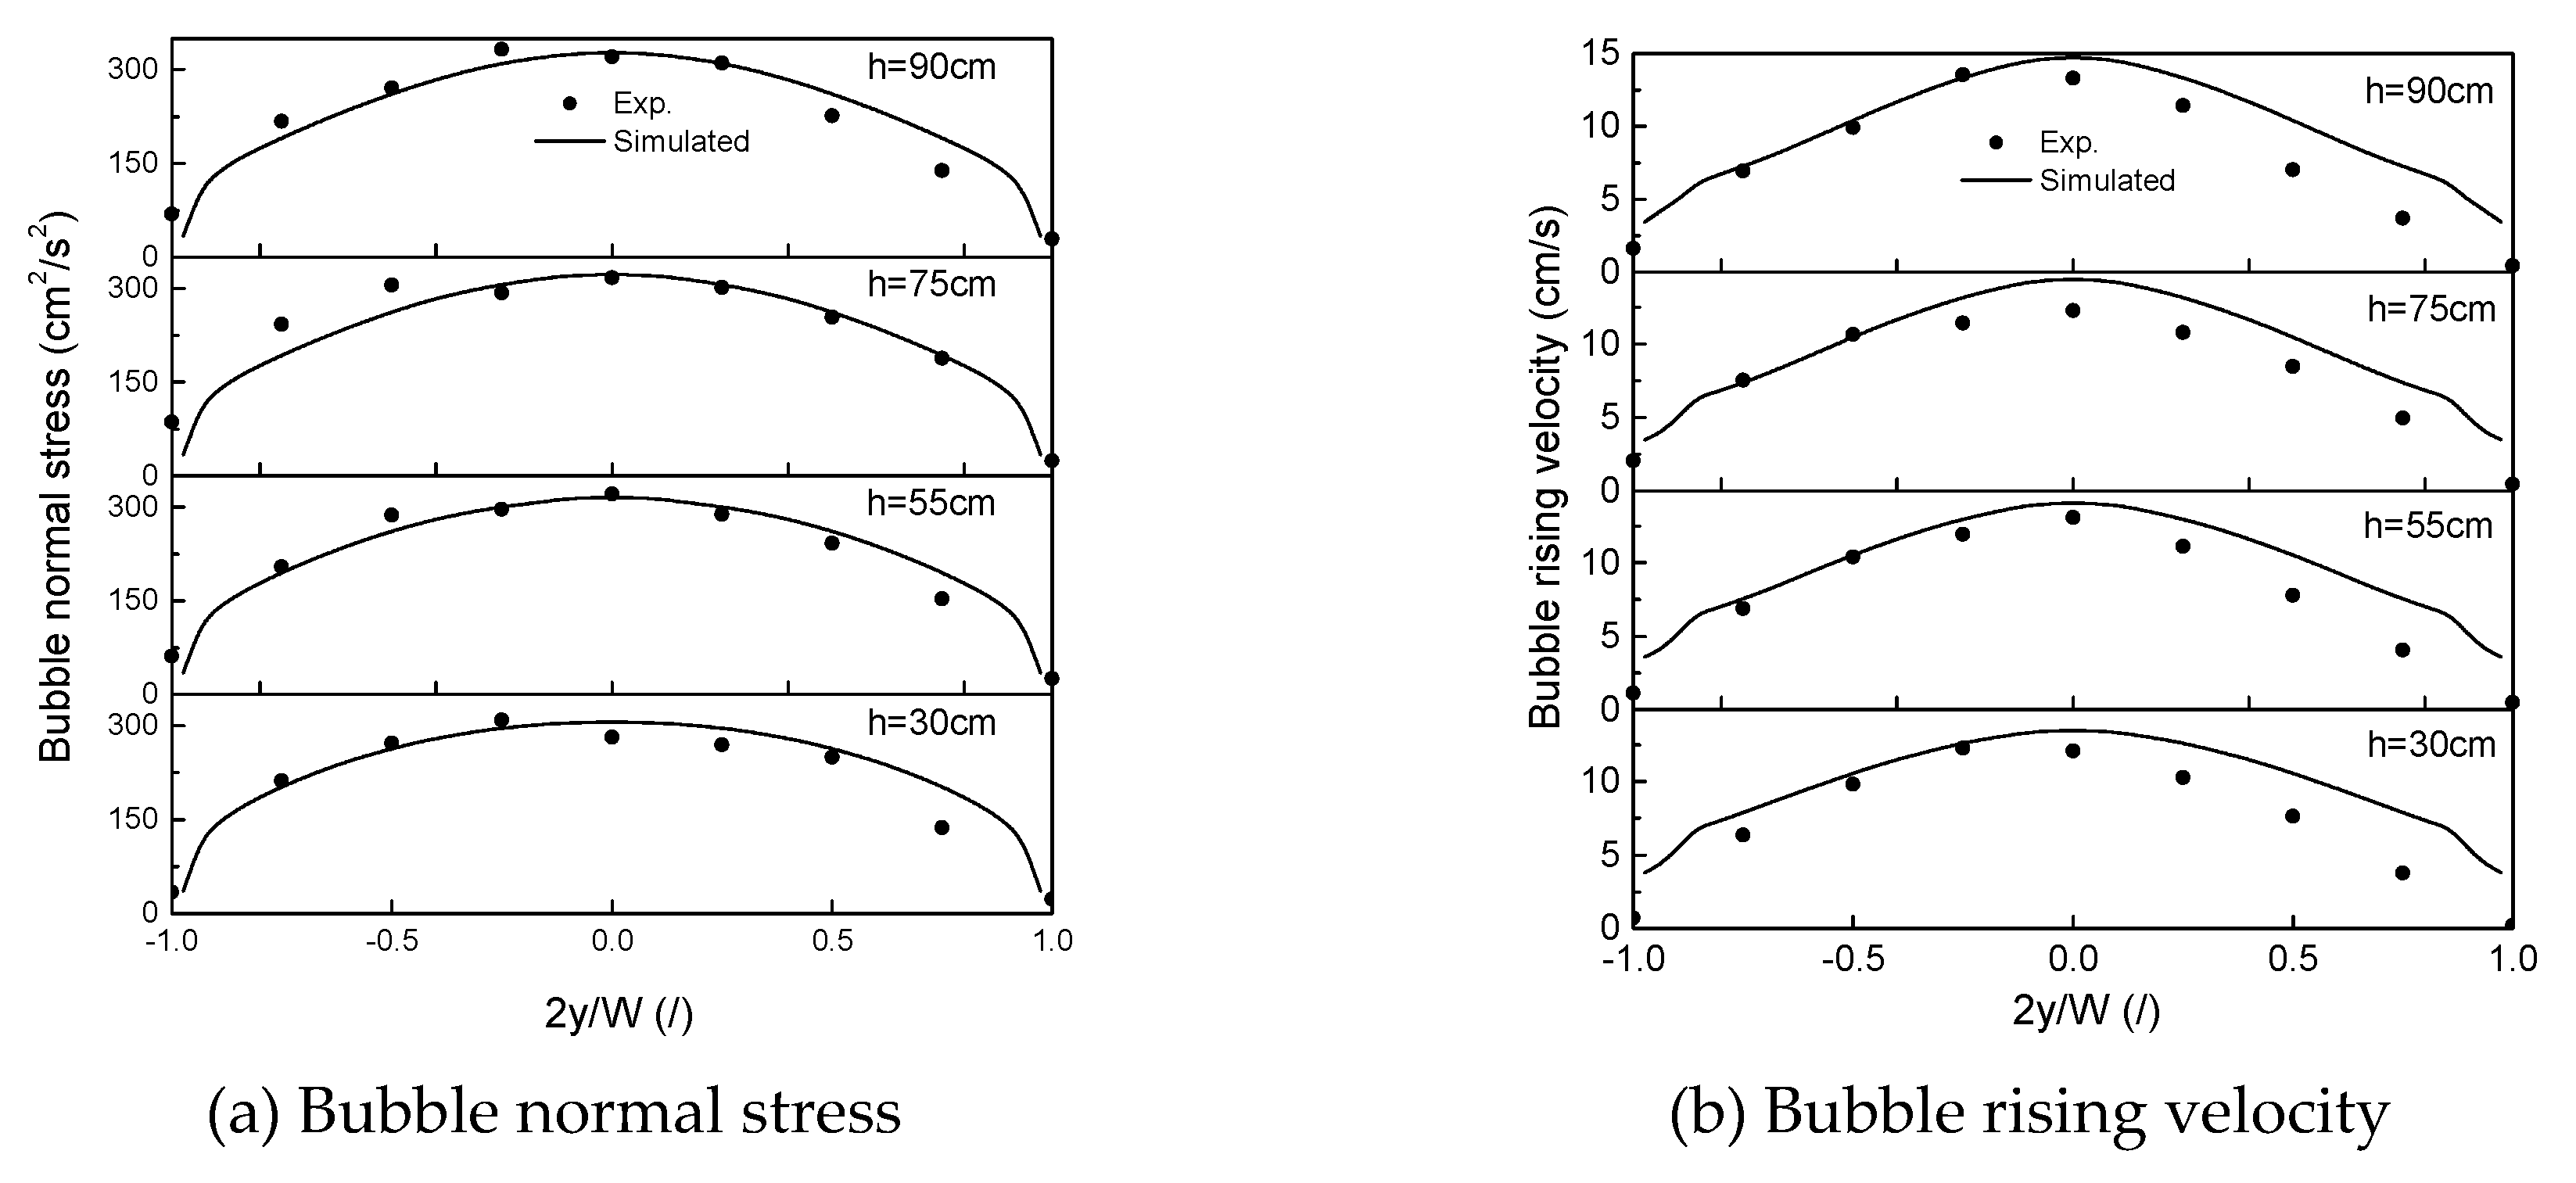
4.1. Grid Independence and Validation of Proposed Model

The grid independence validation was performed based on the bubble time-averaged axial velocity (see Figure 2). Here, three kinds of grid systems, coarse (99 × 44), medium (132 × 88), and fine (264 × 176) mesh, are applied and all simulations are converged at 1.0 × 10⁻⁴ for both bubble and liquid phases. The distributions of bubble rising velocities at the height of 0.3 m using three grid systems were compared. As seen from Figure 2, all of the velocity distributions have the same trends along both axial and radial directions, especially for close agreement by medium and fine grids. Thus, the medium grid scheme was adopted for the simulation because of reasonable computation time and accepted accuracy. Figure 3 showed the validation of the proposed model by the experimental results of Lin et al. [39]. Using vertical bubble rising velocity and bubble normal stress, it indicated that they are in accordance with the experimental data. Hence, the proposed model can be used for this study with good accuracy.

4.2. Key Bubble-Liquid Turbulent Hydrodynamics

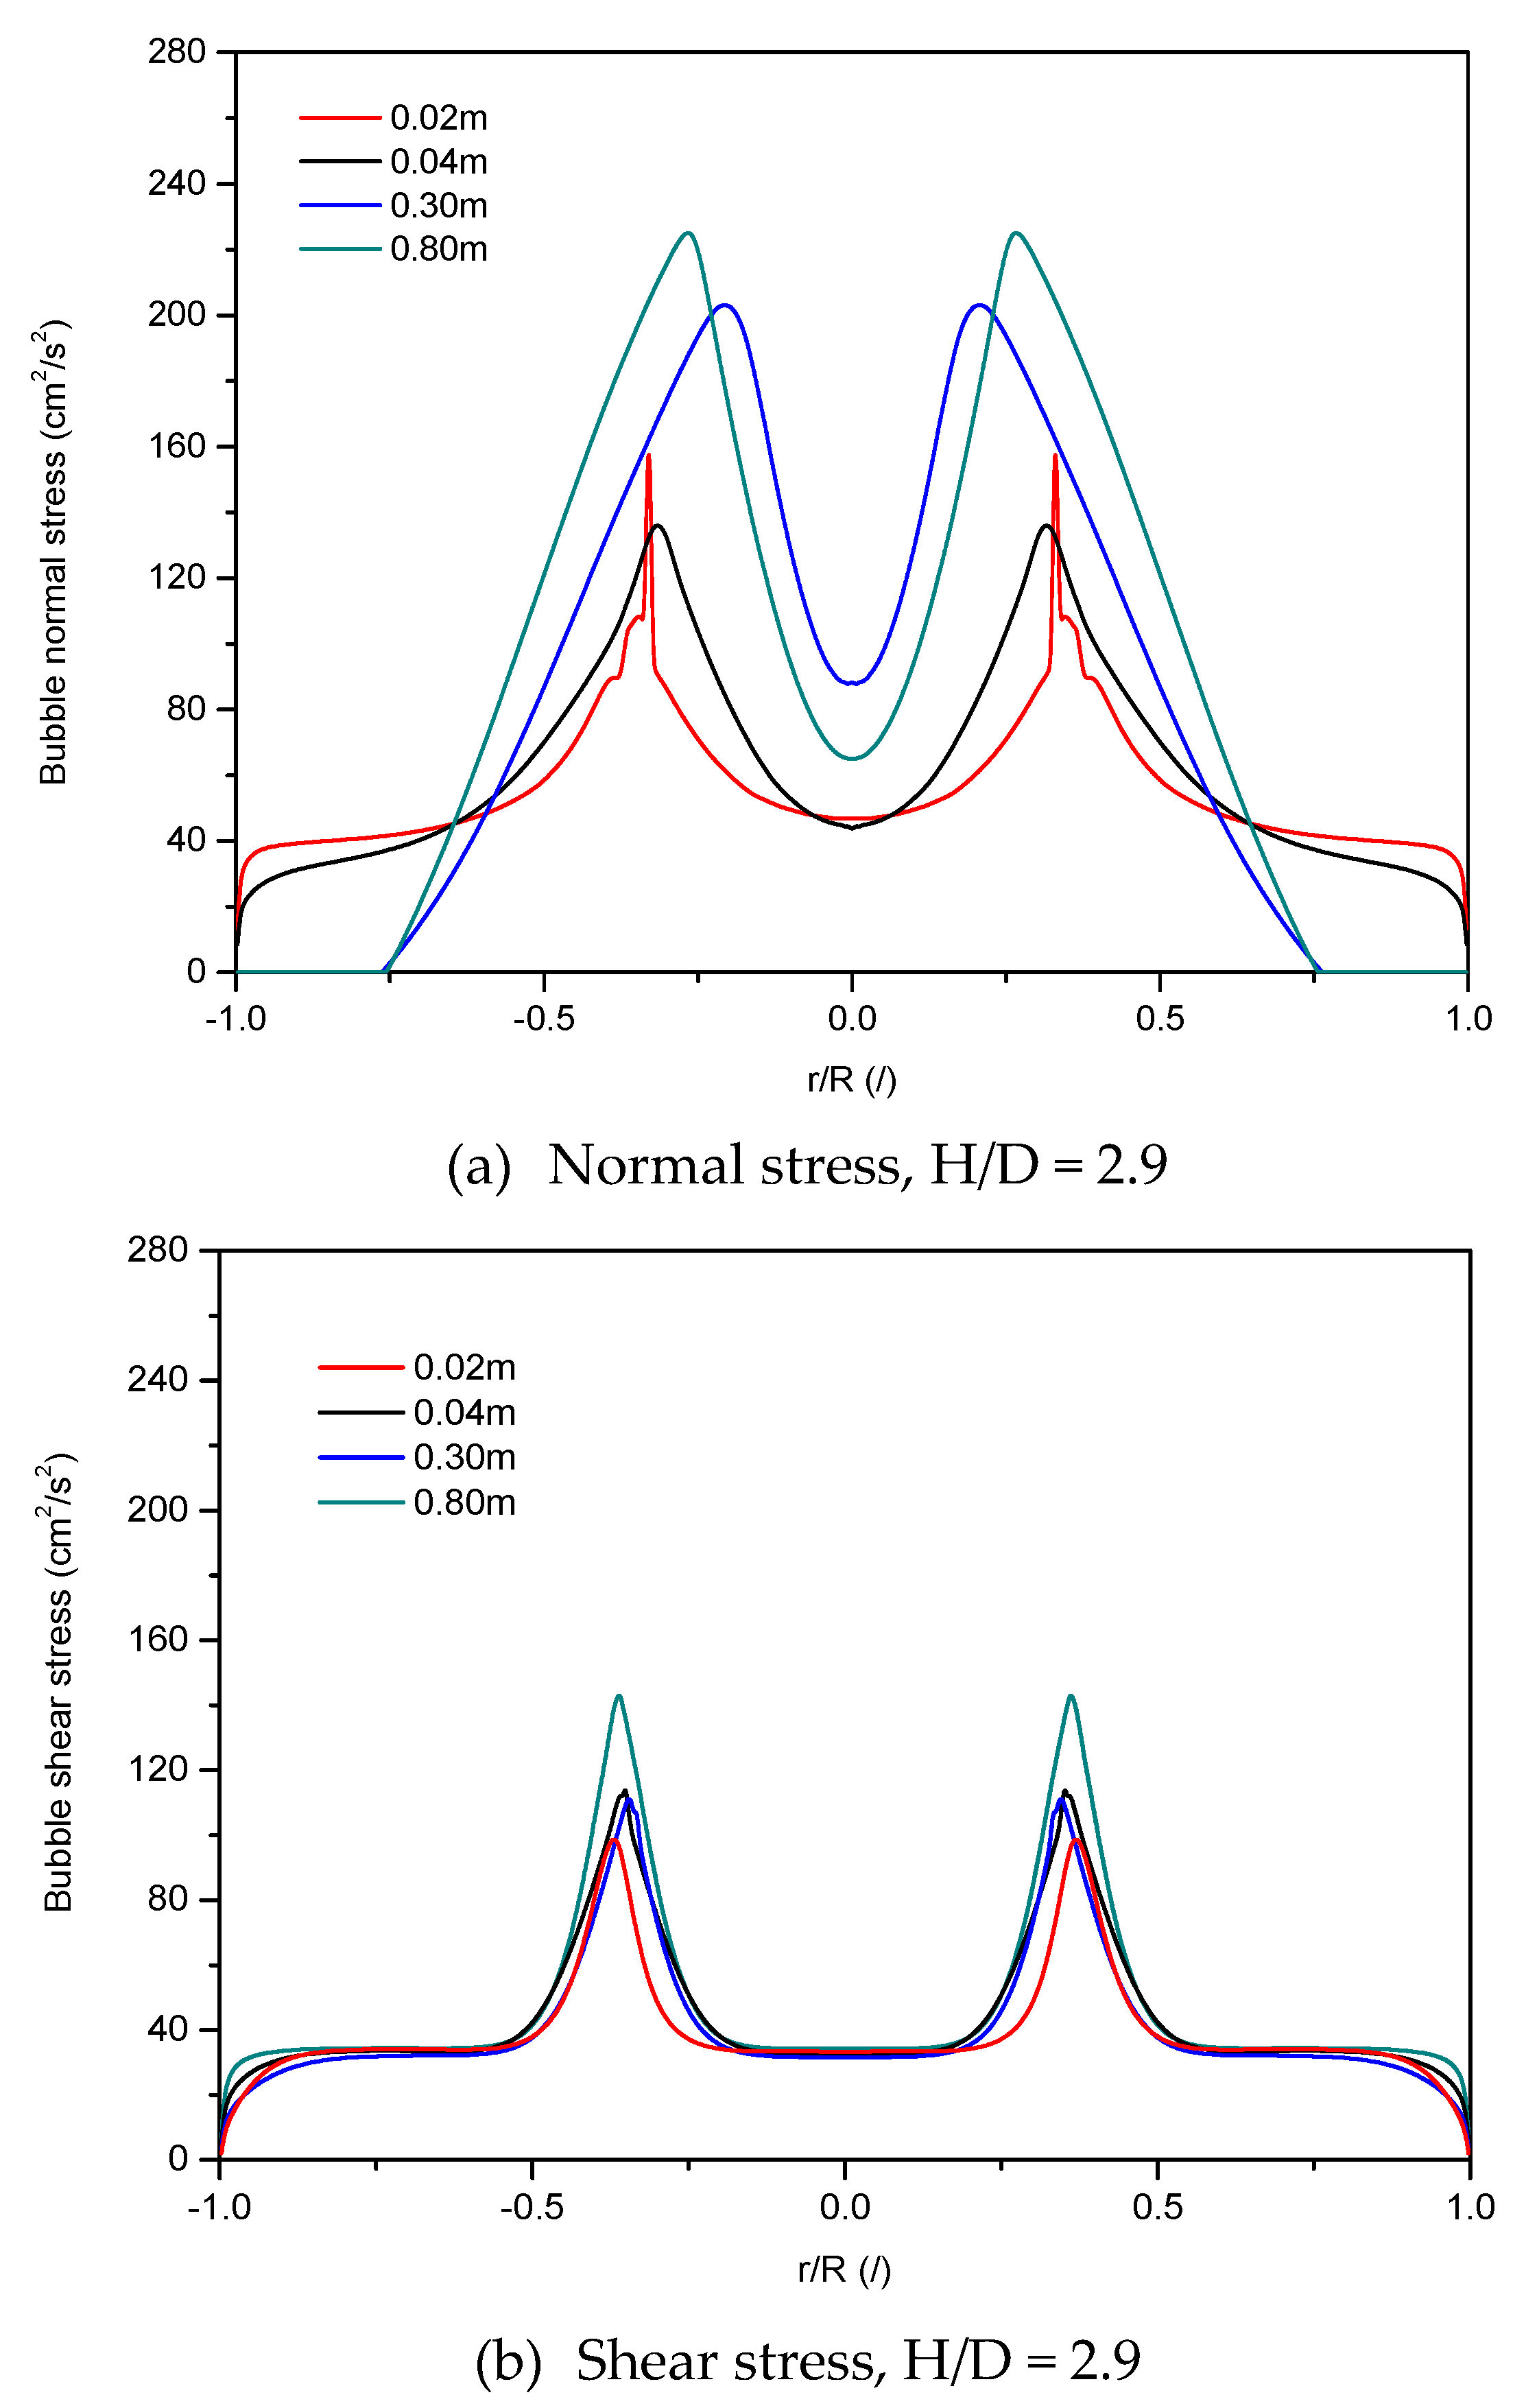
4.2.1. Normal and Shear Stresses of Bubble Phase

Figure 4 and Figure 5 showed the distributions of bubble normal and shear stresses using two jetting holes (rjet/R = ±0.36) with height-to-diameter ratios of H/D = 2.9 and H/D = 1.4 at a gas entrance velocity of 57.4 m/s, respectively. Although the time-averaged velocity of bubble was relatively smaller, the higher stresses that originated from the high turbulence intensity of the liquid phase were higher because the fluid fluctuations were extraordinarily vigorous. In Figure 4a and Figure 5a, the larger velocity gradient was observed due to stronger turbulent kinetic energy. The normal stress values gradually increased along with flow direction as well. When peaks reached the maximum values, they become a little flat due to the stable variation of stresses and velocity profiles along axial direction. Similar to those of the normal stresses variation trend, shear stresses with two peak values were also found in Figure 4b and Figure 5b. When comparing their absolute values between H/D = 2.9 and H/D = 1.4 ratios, normal stresses and shear stresses had the same order of magnitude and the normal stresses were slightly larger. It indicated that the intensities of turbulent mixing and diffusion along with axial and radial directions were approximately equivalent, in which those of axial direction were slightly larger. Bubble normal stresses at axial and radial directions had larger values in the center of the reactor than those of near wall regions, which indicated that those of regions had dominantly anisotropic characteristics. Compared with the results of H/D = 2.9 to H/D = 1.4, both absolute normal and shear stress of H/D = 2.9 were greater than those of H/D = 1.4. It can be explained that the larger H/D ratio reactor easily generated more smaller-size bubbles, resulting in serious bubble breakup or coalescence, circulation and bubble fluctuations.
The most important finding is that bubble stresses have generally smaller values near the inlet region when compared with those of fully developed flow regions. This means that normal and shear stresses increased toward the development of bubble-liquid two-phase flow, and minimum values are located near the gas entrance region. These results are consistent with experimental observations by Babosa et al. [28]. Shear stresses are contributed to by the enhancement mixing and heat and mass transfer, which are most likely to cause cell damage and death [40]. Therefore, according to the stress-associated cell damage possibility, the protentional high cell damage would occur towards fully developed flow, rather than near gas jetting regions, in terms of the simulated normal and shear stresses.

4.2.2. Turbulent Kinetic Energy of Bubble Phase

The distributions of turbulent kinetic energy of bubble phase using two jetting holes (rjet/R = ±0.36) with height-to-diameter ratios of H/D = 2.9 and H/D = 1.4 at a gas entrance velocity of 57.4 m/s are shown in Figure 6. The two peaks between center axis and reactor wall were observed and their absolute values gradually increased with the development of turbulent flow. Stronger turbulent fluctuations are always accompanied with bubble formation, movement and breakup or coalescence, which may cause the positions of peaks above jetting holes. Furthermore, according to the gas-bubble two-phase theory, non-uniform liquid velocity distributions will generate when bubbles enter the reactor through jetting holes. Larger liquid velocity gradient leads to the strong liquid fluctuations, which frequently occurred near jetting regions. The turbulent kinetic energy of the bubble phase at jetting inlet regions was weaken, which was mainly controlled by the lower bubble velocity and absence of bubble wake or bubble circulation. In comparisons with the values of H/D = 2.9, results of H/D = 1.4 were less because of the relative weak bubble and liquid fluctuations. Thus, the turbulent kinetic energy parameter is deemed inadequate to explain cell death at the jetting inlet region.

4.2.3. Turbulent Energy Dissipation Rate of Bubble Phase

The definition of the turbulent energy dissipation rate of bubble phase is:
ε = μ i j [ u i x j + ( u j x i ) T ] u j x i
The distributions of turbulent kinetic energy of the bubble phase with height-to-diameter ratios of H/D = 2.9 and H/D = 1.4 at a gas entrance velocity of 57.4 m/s are shown in Figure 7. We can see that the ε began to increase toward the development of turbulent flows above the jetting holes. The largest energy dissipation rate of bubble flow located at fully developed regions can be explained by Kolmogorov’s energy cascade theory, that energy is dissipated by fluctuating viscous stresses in resisting deformation of fluid at fluctuating strain rates. Hence, a dissipation rate is primarily determined because of rapid viscous scale dissipation, and energy is set down by the non-linear process of scale-to-scale energy. Considering the effects of the larger H/D ratio, a larger energy dissipation rate was observed in comparison with the small H/D ratio because much more smaller bubbles originating from bubble breakup or coalescence caused severe bubble interactions and circulation and brought higher energy dissipation consumptions. In the meantime, the larger energy dissipation rate at fully developed regions can be elaborated by this explanation. The bubble energy dissipation rate did not exhibit large values at the jetting inlet region, and cells also located in the liquid phase were coupled with the low liquid phase energy dissipation rate. They indicated that the energy dissipation rate parameter may not be a satisfactory hydrodynamic parameter to reveal cell damage at jetting inlet regions.
In summary, the aforementioned hydrodynamic parameters, i.e., the normal and shear stresses, the turbulent kinetic energy and the turbulent energy dissipation rate, indicated that all of them have smaller values at the gas inlet region when compared to those of the developed regions. Therefore, they may not be responsible for the higher cell death rate observed at the jetting inlet region. Hence, an appropriate parameter that can theoretically explain such a phenomenon is required.

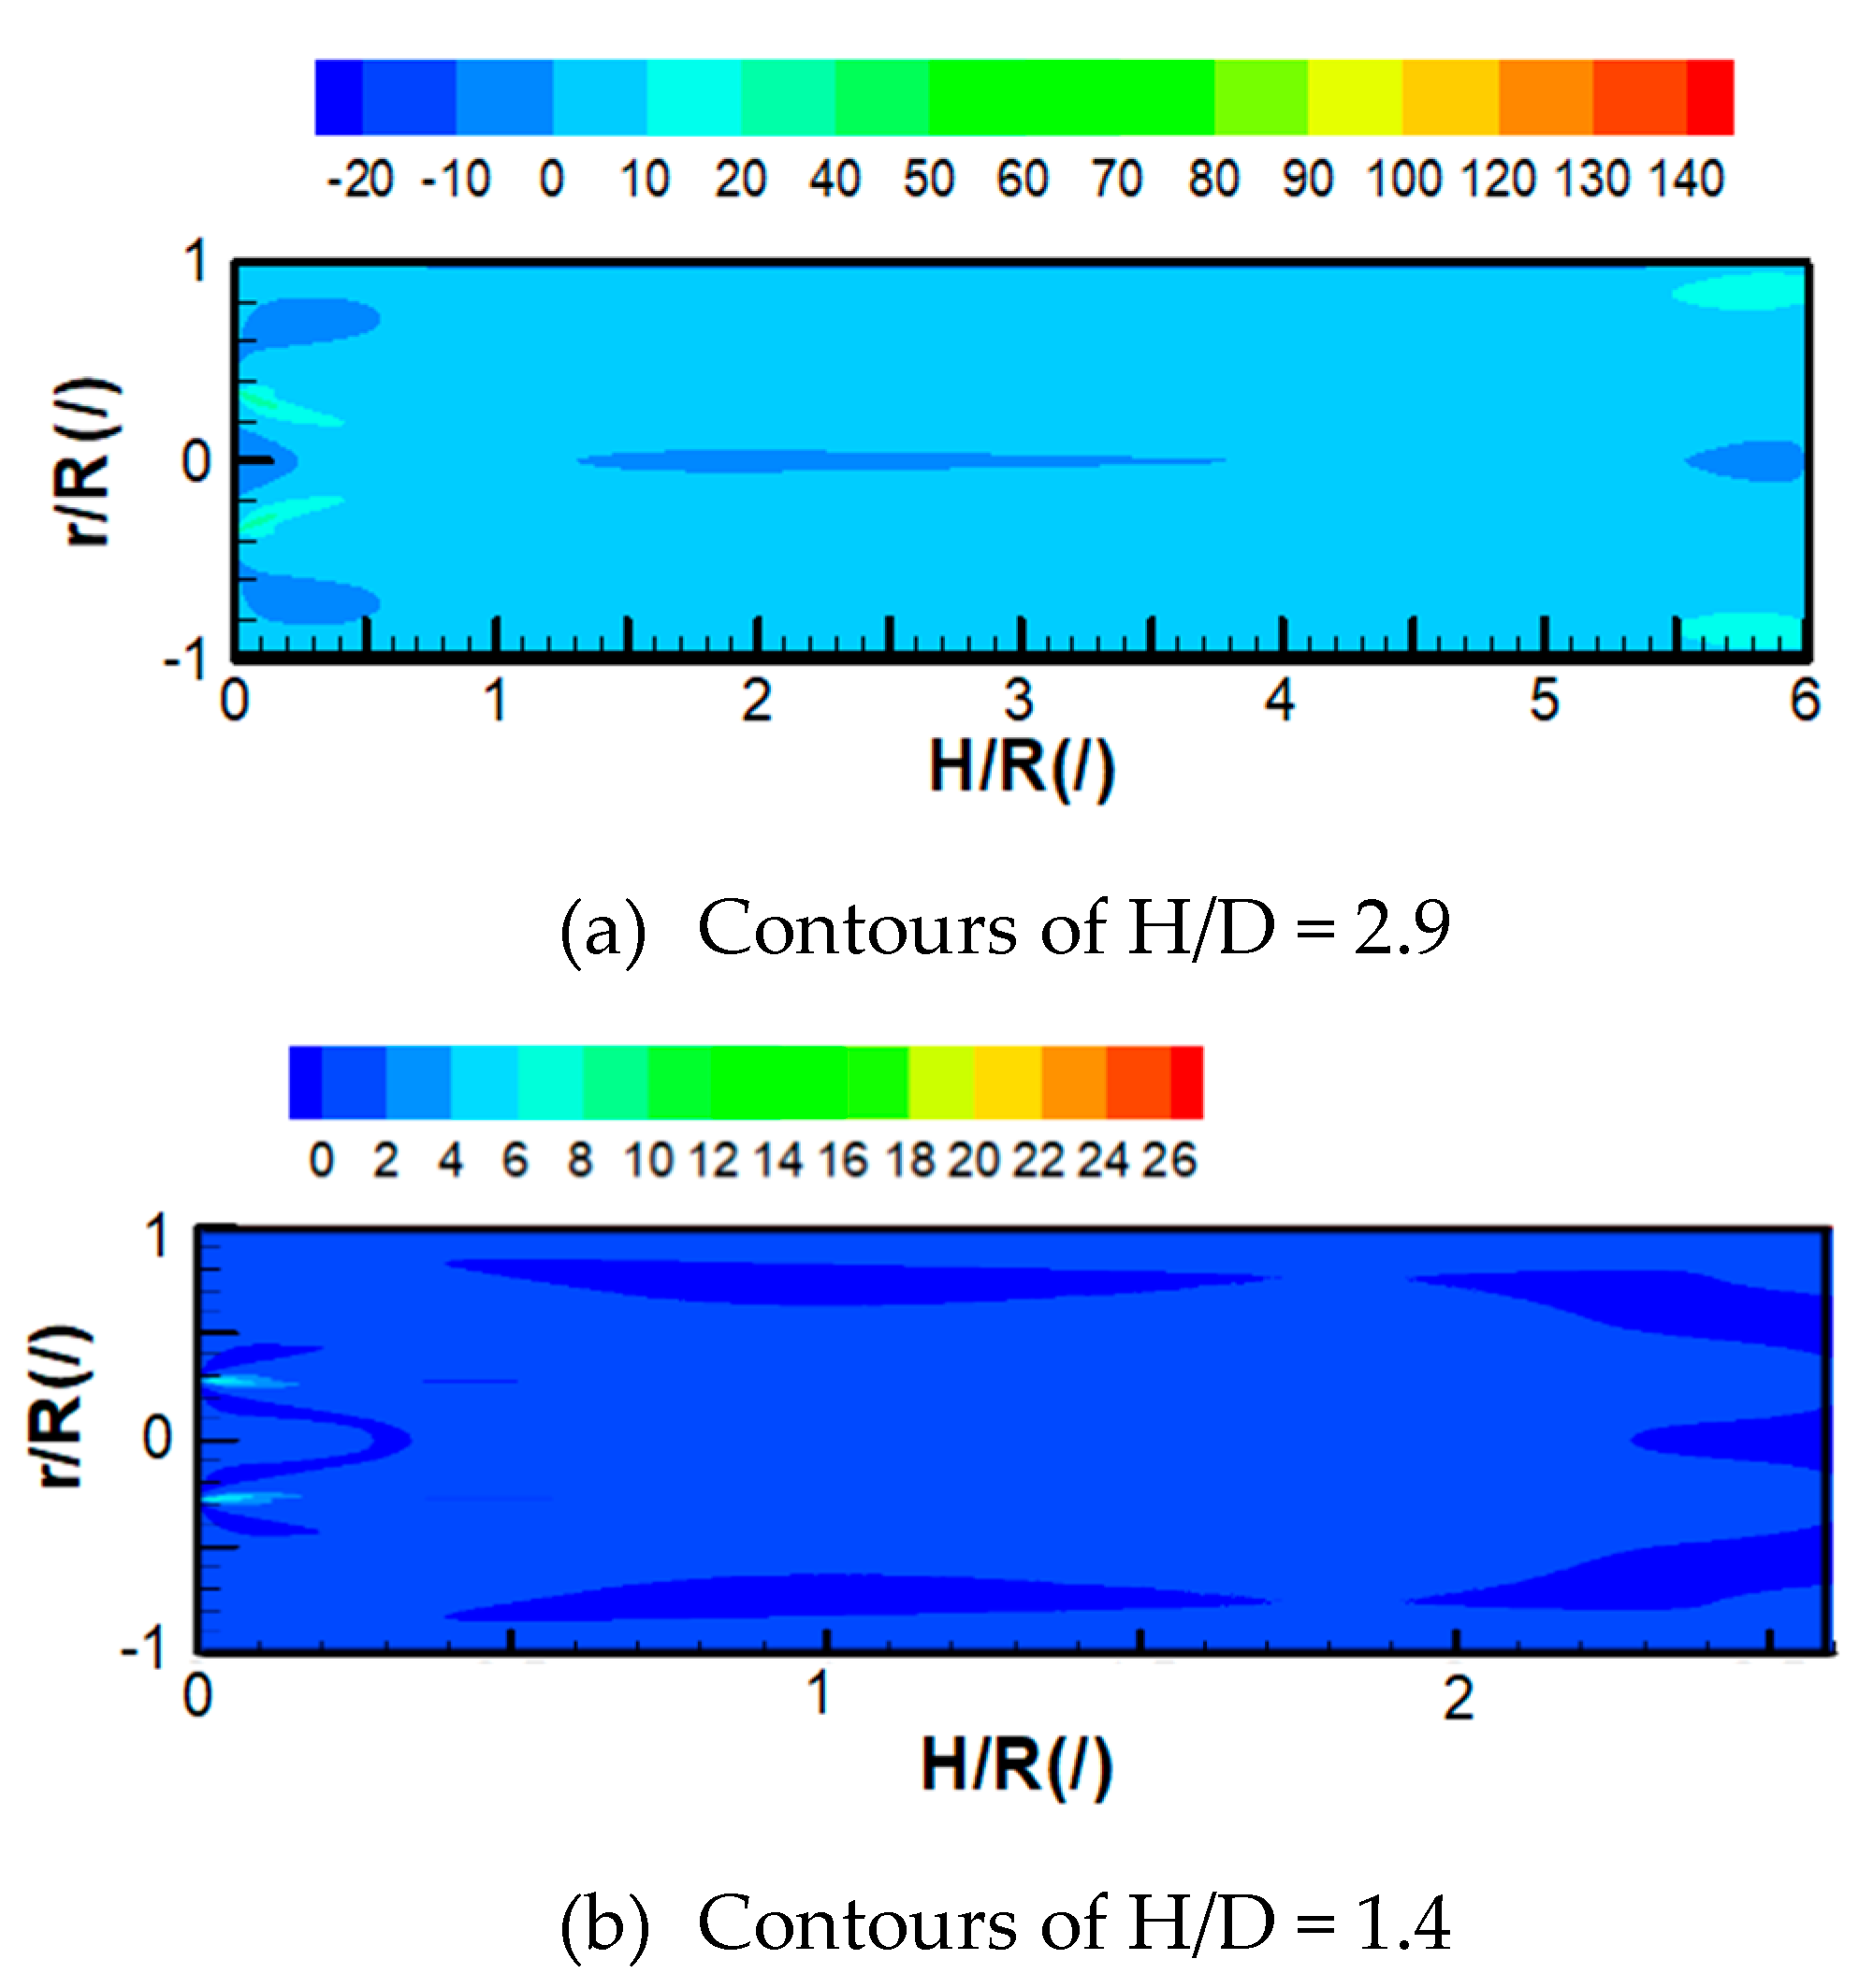
4.2.4. Turbulent Energy Production of Bubble-Liquid Two-Phase Flow

So far, a reasonable hydrodynamic parameter that successfully discloses the higher cell death rate near the jetting inlet region has not been obtained. Here, we define a correlation of the turbulent energy production (TEP) of bubble-liquid two-phase flow to perform a theoretical investigation. It is:
T E P = ( 1 α b ) ρ l ( u l k u l j ¯ u l , i x k + u l k u l j ¯ u l , j x k )
The turbulent energy production correlation is a function of the Reynolds stress and the mean velocity gradient, representing the energy exchange rate between mean and fluctuating motions. It is quietly different from the aforementioned energy dissipation that presented by the form of viscous heat loss.
Figure 8 shows the bubble-liquid two-phase turbulent production term contour near the inlet region and fully developed regions using two jetting holes (rjet/R = ±0.36) with H/D = 2.9 and H/D = 1.4 at a gas entrance velocity is 57.4 m/s, respectively. As we can see, the values near the jetting inlet regions are significantly larger than those of the fully developed regions due to the larger energy transfer rate in that region coming from the gas injection. It is quietly different from the energy dissipation rate, characterized by the viscous heat loss. These results were satisfied well with the experimental results [28]. A unimodal peak was observed between two jet holes, which may have originated from the bubbles’ synergistic effects by the neighbor jetting holes. Meanwhile, bimodal distributions near the jetting region, and flatter profiles at the developed flow regime, were found. It can be explained that when stronger bubble interaction effects happened, they occurred among multi-holes near the jetting inlet regions, and gradually weakened with the development of flows. The H/D ratio values near the jetting inlet regions were greater than those of the developed regions since the bubbles attached to the sparger surface, which installed at the reactor’s bottom section, had larger bubble sizes as generation during the first stage. They then begin to decrease with the bubble flow toward the top of the reactor together with bubble swing, downward flow, circulation, deformation and bubble plume fluctuations.
Compared with H/D = 1.4, those values of H/D = 2.9 are greater (see Figure 8). As a matter of fact, the bubble behaviors near the jetting inlet regions belong to the sparger configuration impact regions on bubble-liquid two-phase flow regime. The bubbles generated at sparger surfaces began to grow up toward the developed flow gradually, accompanied with coalescence, breakup, swing and circulation fluctuations. It enhanced the energy dissipation and weakened the fluctuations along with the developing flows. So, these values at a far distance from the sparger position should be smaller than those near the jetting inlet regions. Furthermore, the smaller H/D ratio under a fixed volume condition, representing a larger diameter, was beneficial for the growth of bubble expansion, the mitigation of bubble rupture and bubble-liquid fluctuation intensity. Thus, the Favre-averaged Reynolds stresses caused by fluctuations were reduced, which is in favor of the smaller values generation.
According to Figure 8 and Figure 9, the maximum energy production values were approximately 40.0 W/m3, much less than the approximate 3000 W/m3 simulated by Liu et al. [27] using Babosa’s experiment reactor dimension (see Figure 10). This extreme narrow-shape bioreactor, with an H/D ratio of 20.1, has bigger criteria threshold value than that of H/D = 5 [9,11], which gives rise to the largest values near the jetting inlet regions resulting in the deterioration of cell culture.

5. Conclusions

  • The proposed second-order moment bubble-liquid two-phase turbulence model can well simulate the hydrodynamic parameters with good accuracy.
  • The velocities and their fluctuations, and the normal and shear Reynolds stresses of bubble and liquid phases are distinctively anisotropic.
  • The established turbulent energy production successfully verifies the higher cell damage at the gas jetting inlet region.
  • The shallow shape bioreactor is more favorable for cell living than the long and narrow-shaped reactor.

Author Contributions

All authors equally contributed to the data analysis and the simulation, the results analysis, the writing, and review

Funding

This research was funded by Startup Funding of Taizhou University, grant number 2018158 and The APC was funded by Taizhou University

Acknowledgments

We greatly appreciated the editor’s and reviewer’s comments and valuable suggestions.

Conflicts of Interest

The authors declare no conflict of interest.

Nomenclature

cEmpirical constants
cdDrag coefficient
DDiffusion term
dBubble size
EoEotvos number
gGravitational acceleration
kTurbulent kinetic energy
mBubble mass
PProduction term
pPressure
ReReynolds number
SPhase interaction term
u,vVelocity components
U V Velocity vector coordination
Greek Alphabets
αVolume fraction
βCoefficients defined in the text
δUnit tensor
εDissipation rate of turbulent kinetic energy
λEmpirical constant
μDynamic viscosity
νKinematic viscosity
ΠPressure strain term
ρDensity
σPrandtl number; surface tension force
τrbBubble relaxation time
τijMolecular viscous stress
Subscripts
bBubble phase
eEffective
gGas
i, j, kCoordinate directions
lLiquid phase
mBubble or liquid phase
tTurbulent
Superscripts
=Mass weighted value
Fluctuating component of mass weighting
-Time-averaged value
Fluctuation component of in time averaging

References

  1. Harrison, D.; Grace, J.R. Fluidized Bed with Internal Baffles; Academic Press: New York, NY, USA, 1971; pp. 599–626. [Google Scholar]
  2. Virr, M.J.; Williams, H.W. Heat recovery by shallow fluidized beds. Chem. Eng. Prog. 1985, 81, 50–59. [Google Scholar]
  3. Yang, J.Y.; Liu, A.Y.; Squires, A.M. Pressure drop across shallow fluidized beds: Theory and experiment. Powder Technol. 1987, 53, 79–89. [Google Scholar] [CrossRef]
  4. Chisti, Y. Animal-cell damage in sparged bioreactors. Trends Biotechnol. 2000, 18, 420–432. [Google Scholar] [CrossRef]
  5. Bahadori, F.; Rahimi, R. Simulations of gas distributors in the design of shallow bubble column reactors. Chem. Eng. Technol. 2007, 30, 443–447. [Google Scholar] [CrossRef]
  6. Lau, R.; Sim, W.S.B. Effect of gas distributor on hydrodynamics in shallow bubble column reactors. Can. J. Chem. Eng. 2009, 87, 847–854. [Google Scholar] [CrossRef]
  7. Fife, J.P.; Derksen, R.C.; Ozkan, H.E. Evaluation of a contraction flow field on hydrodynamic damage to entomopathogenic nematodes-A biological pest control agent. Biotechnol. Bioeng. 2004, 5, 96–107. [Google Scholar] [CrossRef] [PubMed]
  8. Chalmers, J.J. Current opinion in chemical engineering, mixing, aeration and cell damage, 30+ years later: What we learned, how it affected the cell culture industry and what we would like to know more about. Curr. Opin. Chem. Eng. 2015, 10, 94–102. [Google Scholar] [CrossRef]
  9. Throat, B.N.; Joshi, J.B. Effect of sparger design and height to diameter ratio on fractional gas holdup in bubble column. Trans. Inst. Chem. Eng. 1998, 76, 823–834. [Google Scholar] [CrossRef]
  10. Veera, P.; Joshi, J.B. Measurement of gas hold up profiles by gamma ray tomography: Effect of sparger design and height of dispersion in bubble columns. Trans. Inst. Chem. Eng. 1999, 77, 303–317. [Google Scholar] [CrossRef]
  11. Dhotre, M.T.; Ekambara, K.; Joshi, J.B. CFD simulation of sparger design and height to diameter ratio on gas hold-up profiles in bubble column reactors. Exp. Therm. Fluid Sci. 2004, 28, 407–421. [Google Scholar] [CrossRef]
  12. Kawasaki, H.; Tanaka, H. Correlation of volumetric mass transfer coefficient with gas hold-up in the calming section in a bubble column with a single hole orifice. J. Chem. Eng. Jpn. 1996, 29, 365–367. [Google Scholar] [CrossRef]
  13. Griffiths, J.B. Animal cell products, overview. In Encyclopedia of Cell Technology; Spier, R.E., Ed.; Wiley: New York, NY, USA, 2000; Volume 1, pp. 71–76. [Google Scholar]
  14. Catapano, G.; Czermak, P.; Eibl, R.; Eibl, D.; Portner, R. Bioreactor design and scale-up. In Cell and Tissue Reaction Engineering; Springer: Berlin, Germany, 2009. [Google Scholar]
  15. Camarasa, E.; Vial, C.; Poncin, S.; Wild, G.; Midoux, N.; Bouillard, J. Influence of coalescence behaviors of the liquid and of gas sparging on hydrodynamics and bubble characteristics in bubble column. Chem. Eng. Process. 1999, 38, 329–344. [Google Scholar] [CrossRef]
  16. Liu, Y.; Lu, H.L.; Liu, W.T.; Zhao, Y.H. Model and simulation of gas liquid flow with wide size distributions in circulating fluidized bed. J. Chem. Indust. Eng. 2003, 54, 1065–1071. [Google Scholar]
  17. Pfleger, C.P.; Becker, S. Modeling and simulation of the dynamic flow behavior in bubble column. Chem. Eng. Sci. 2001, 56, 1737–1747. [Google Scholar] [CrossRef]
  18. Gregoriades, N.; Clay, J.; Ma, N.; Koelling, K.; Chalmers, J.J. Cell damage of microcarrier culture as a function of local energy dissipation created by a rapid extensional flow. Biotechnol. Bioeng. 2000, 69, 171–182. [Google Scholar] [CrossRef]
  19. Mollet, M.; Ma, N.N.; Zhao, Y.; Brodkey, B.; Taticek, R.; Chalmers, J.J. Bioprocess equipment: Characterization of energy dissipation rate and its potential to damage cells. Biotechnol. Prog. 2004, 20, 1437–1448. [Google Scholar] [CrossRef] [PubMed]
  20. Zhang, H.; Williams-Dalson, W.; Keshavarz-Moore, E.; Shamlou, P.A. Computational-fluid-dynamic (CFD) analysis of mixing and gas–liquid mass transfer in shake flasks. Biotechnol. Appl. Biochem. 2005, 41, 1–8. [Google Scholar]
  21. Rajaram, S.G.; Ashwin, W.P.; Jyeshtharaj, B.J. Combined effect of hydrodynamic and interfacial flow parameters on Lysozyme deactivation in a stirred tank bioreactor. Biotechnol. Prog. 2006, 22, 660–672. [Google Scholar]
  22. Kelly, W.J. Using computational fluid dynamics to characterize and improve bioreactor performance. Biotechnol. Appl. Biochem. 2008, 49, 225–238. [Google Scholar] [CrossRef]
  23. Mollet, M.; Godoy, R.; Berdugo, C.; Chalmers, J.J. Computer simulations of the energy dissipation rate in a fluorescence-activated cell sorter: Implications to cells. Biotechnol. Bioeng. 2008, 100, 260–272. [Google Scholar] [CrossRef]
  24. Zhang, H.; Zhang, K.; Fan, S. CFD simulation coupled with population balance equations for aerate stirred bioreactors. Eng. Life Sci. 2009, 9, 421–430. [Google Scholar] [CrossRef]
  25. Oncul, A.A.; Kalmbach, A.; Genzel, Y.; Reichl, U.; Thevenin, D. Characterization of the flow conditions in 2 L and 20 L wave bioreactors using computational fluid dynamics. Biotechnol. Prog. 2010, 26, 101–111. [Google Scholar] [CrossRef] [PubMed]
  26. Chris, J.; Venkatesh, N.; Chris, A. Verification of energy dissipation rate scalability in pilot and production scale bioreactors using computational fluid dynamics. Biotechnol. Prog. 2014, 30, 760–764. [Google Scholar]
  27. Liu, Y.; Hu, W.W.; Wiltberger, K. Effects of bubble–liquid two-phase turbulent hydrodynamics on cell damage in sparged bioreactor. In Proceedings of the 245th ACS National Meeting and Exposition, New Orleans, LA, USA, 7–11 April 2014. [Google Scholar]
  28. Babosa, M.J.; Albrecht, M.; Wijffels, R.H. Hydrodynamic stress and lethal events in sparged microalgae cultures. Biotechnol. Bioeng. 2003, 83, 112–120. [Google Scholar] [CrossRef] [PubMed]
  29. Ma, N.; Koelling, K.; Chalmers, J.J. The fabrication and use of a transient contraction flow device to quantify the sensitivity of mammalian and insect cells to hydrodynamic forces. Biotechnol. Bioeng. 2002, 80, 428–437. [Google Scholar] [CrossRef] [PubMed]
  30. Venkat, R.V.; Stock, L.R.; Chalmers, J.J. Study of hydrodynamics in microcarrier culture spinner vessels: Particle tracking velocimetry approach. Biotechnol. Bioeng. 1996, 49, 456–466. [Google Scholar] [CrossRef]
  31. Sucosky, P.; Osorio, D.F.; Brown, J.B.; Neitzel, G.P. Fluid mechanics of a spinner-flask bioreactor. Biotechnol. Bioeng. 2003, 85, 34–42. [Google Scholar] [CrossRef]
  32. Xia, J.Y.; Wang, S.J.; Zhang, S.L.; Zhong, J.J. Computational investigation of fluid dynamics in a recently developed centrifugal impeller bioreactor. Biochem. Eng. J. 2008, 38, 406–413. [Google Scholar] [CrossRef]
  33. Ma, N.; Xie, L.; Chalmers, J.J.; Aunins, J.G. Quantitative studies of cell damage in sparged bioreactors using a bubble collector to segregate bubble rupture events. Biotechnol. Prog. 2004, 20, 1183–1191. [Google Scholar] [CrossRef]
  34. Meier, S.J.; Hatton, T.A.; Wang, D.I. Cell death from bursting bubbles: Role of cell attachment to rising bubbles in sparged reactors. Biotechnol. Bioeng. 1999, 62, 468–478. [Google Scholar] [CrossRef]
  35. Zhu, Y.; Cuenca, V.Y.; Zhou, W.C.; Varma, A. NS0 cell damage by high gas velocity sparging in protein-free and cholesterol-free cultures. Biotechnol. Bioeng. 2008, 101, 751–760. [Google Scholar] [CrossRef] [PubMed]
  36. Liu, Y.; Liu, X.; Jiang, L.X. Numerical prediction effects of particle-particle collisions on gas-particle flows in swirl chamber. Energy Convers. Manag. 2011, 3, 1748–1754. [Google Scholar] [CrossRef]
  37. Zhou, L.X.; Yang, M.; Lian, C.Y.; Fan, L.S.; Lee, D.J. On the second-order moment turbulence model for simulating a bubble column. Chem. Eng. Sci. 2002, 57, 3269–3281. [Google Scholar] [CrossRef]
  38. Zhou, L.X.; Yang, M.; Fan, L.S. A second-order moment three-phase turbulence model for simulating gas–liquid–solid flows. Chem. Eng. Sci. 2005, 60, 647–653. [Google Scholar] [CrossRef]
  39. Lin, T.J.; Reese, J.; Hong, T.; Fan, L.S. Quantitative analysis and computation of two-dimensional bubble columns. AIChE J. 1996, 42, 301–318. [Google Scholar] [CrossRef]
  40. Gudin, C.; Chaumont, D. Cell fragility—The key problem of microalgae mass production in closed photobioreactors. Bioresour. Technol. 1991, 38, 145–151. [Google Scholar] [CrossRef]
Figure 1. 2-D schematic of the sparged bioreactor in this simulation.
Energies 12 02269 g001
Figure 2. Validation of grid size resolution.
Energies 12 02269 g002
Figure 3. Experimental validation of the proposed model.
Energies 12 02269 g003
Figure 4. Distributions of bubble normal and shear stresses using two jetting holes (rjet/R = ±0.36), H/D = 2.9.
Energies 12 02269 g004
Figure 5. Distributions of bubble normal and shear stresses using two jetting holes (rjet/R = ±0.36), H/D = 1.4.
Energies 12 02269 g005aEnergies 12 02269 g005b
Figure 6. Distributions of turbulent kinetic energy of bubble phases using two jetting holes (rjet/R = ±0.36), H/D = 2.9 and H/D = 1.4.
Energies 12 02269 g006aEnergies 12 02269 g006b
Figure 7. Distributions of turbulent energy dissipation rate of bubble phases using two jetting holes (rjet/R = ±0.36), H/D = 2.9 and H/D = 1.4.
Energies 12 02269 g007
Figure 8. Two-phase turbulent energy production contours near the inlet region and fully developed region using two jetting holes (rjet/R = ±0.36), H/D = 2.9 and H/D = 1.4.
Energies 12 02269 g008
Figure 9. Distributions of two-phase turbulent energy production values near the inlet region and fully developed region using two jetting holes (rjet/R = ±0.36), H/D = 2.9 and H/D = 1.4.
Energies 12 02269 g009
Figure 10. Comparisons of two-phase turbulent energy production values.
Energies 12 02269 g010

