Cost–Benefit Analysis of Rooftop PV Systems on Utilities and Ratepayers in Thailand

Abstract
:1. Introduction
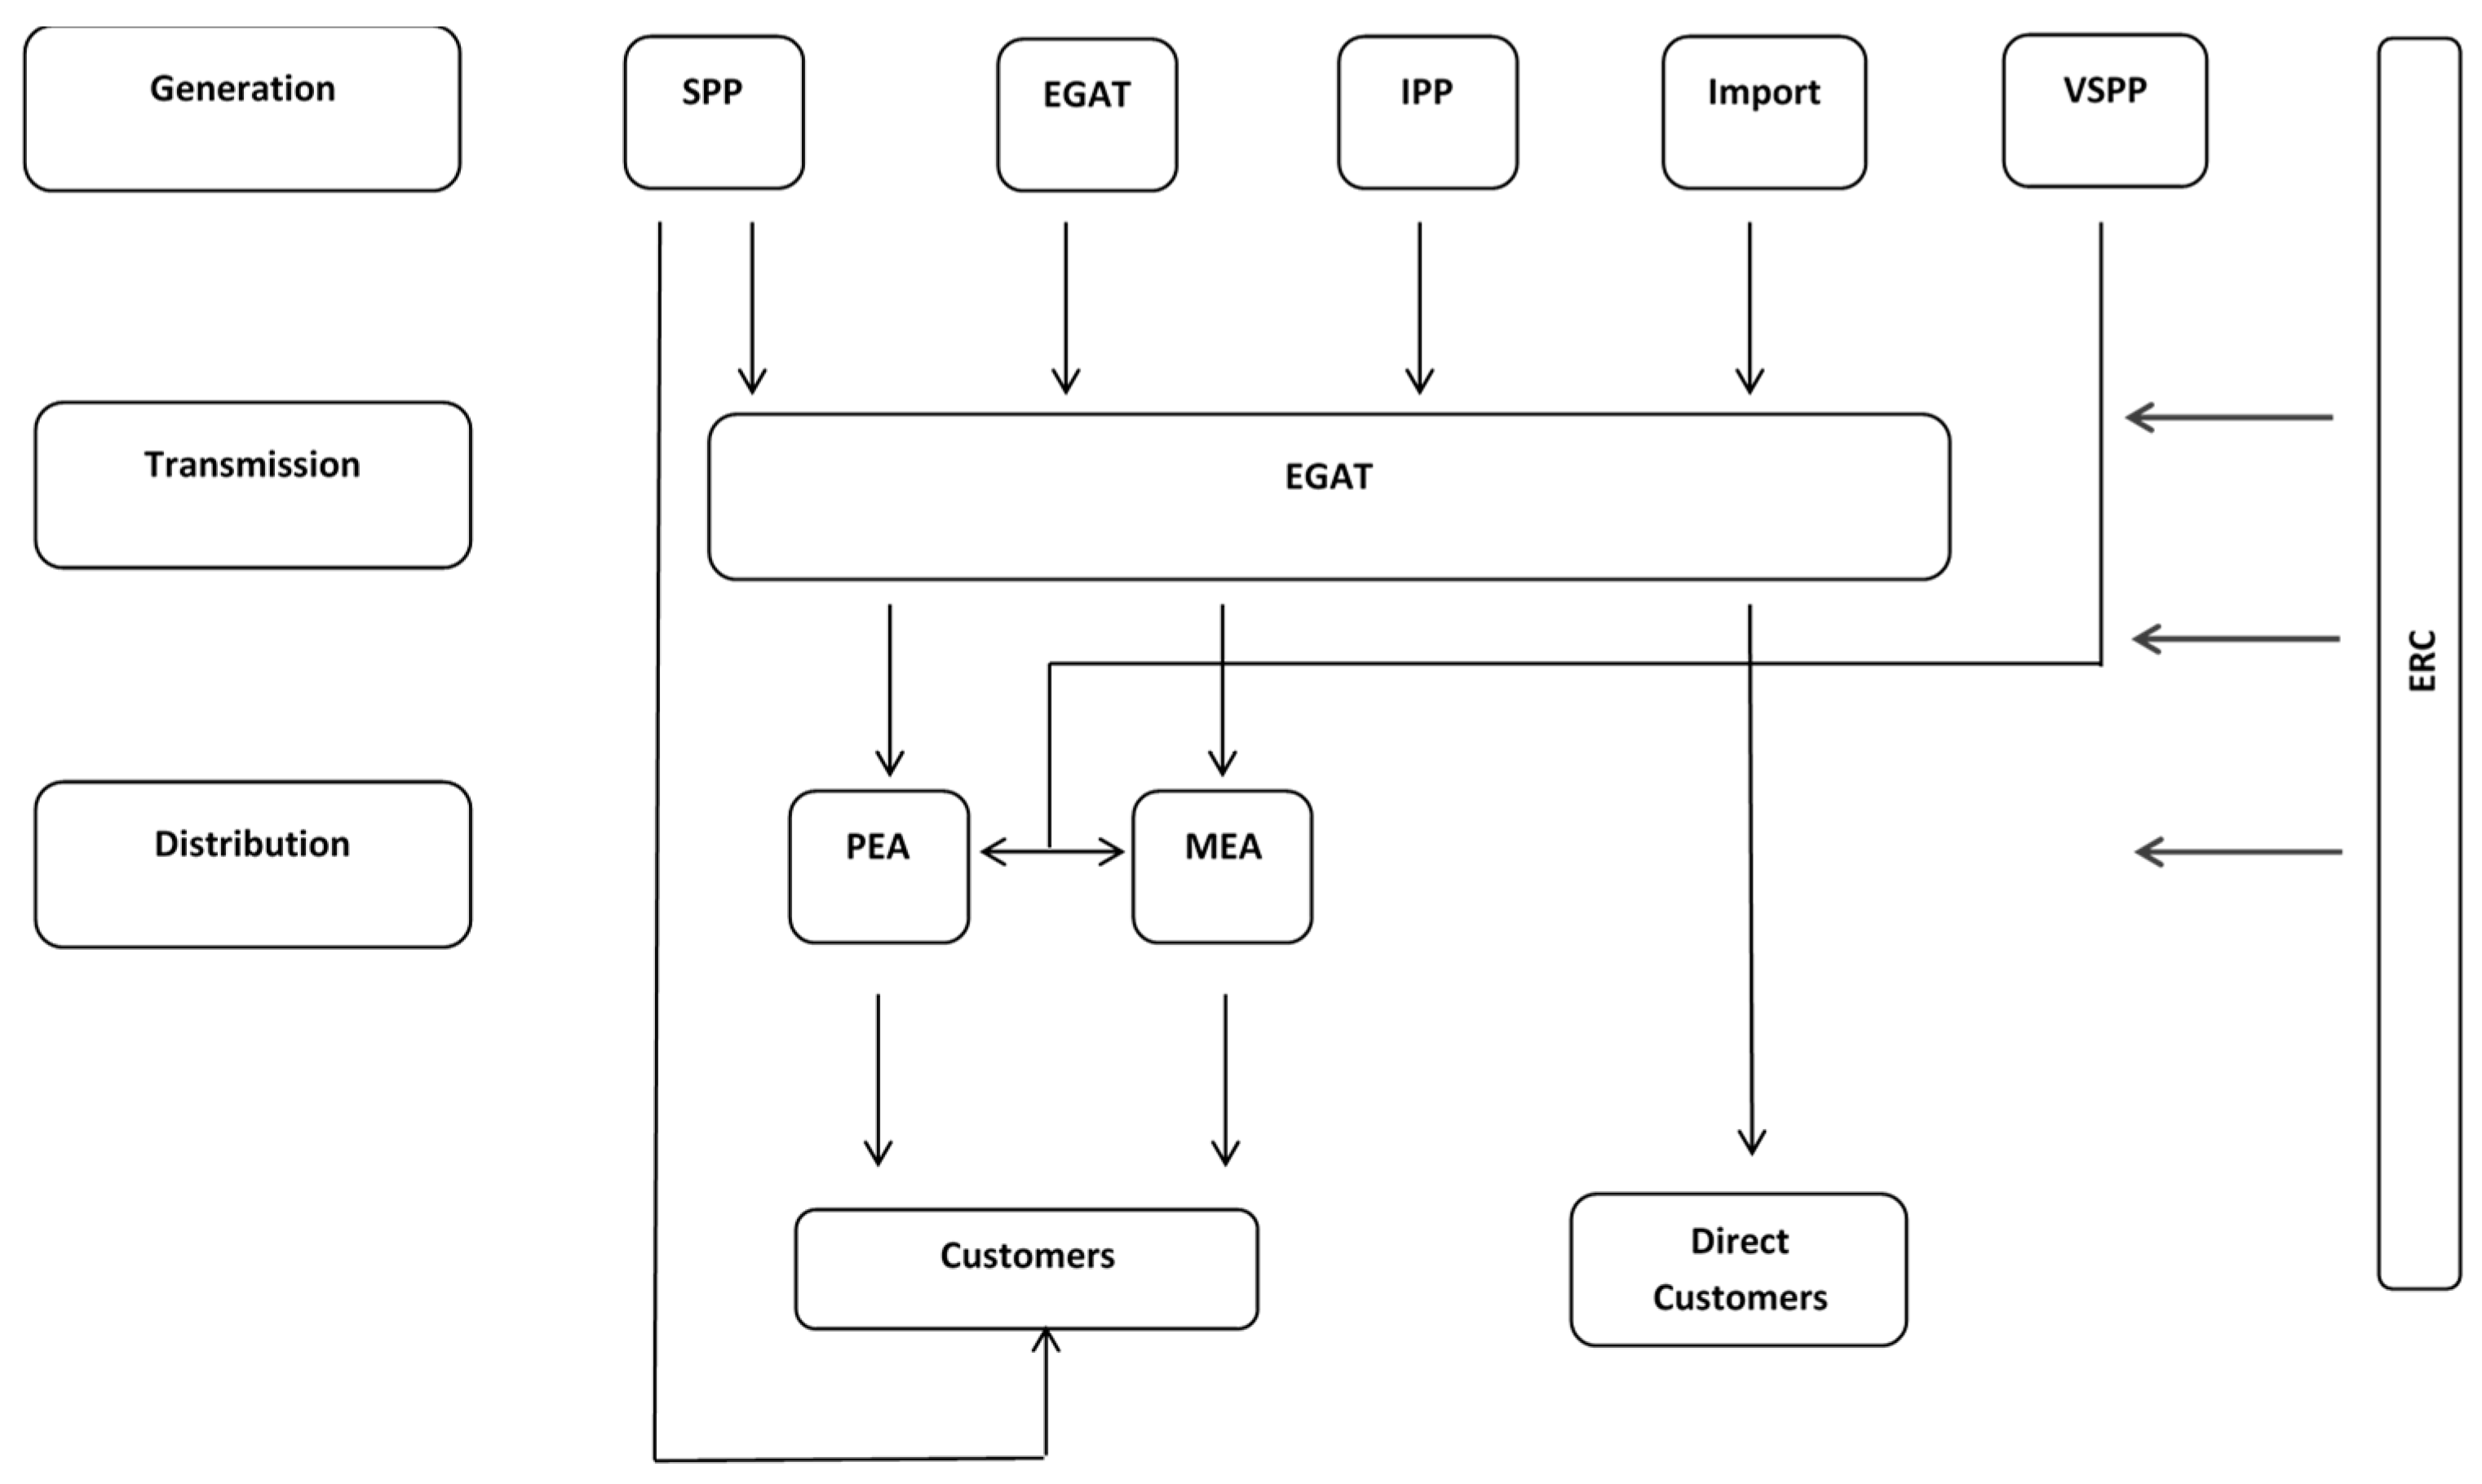
2. Background of Power Sector and Tariff Structure in Thailand
3. Methodology
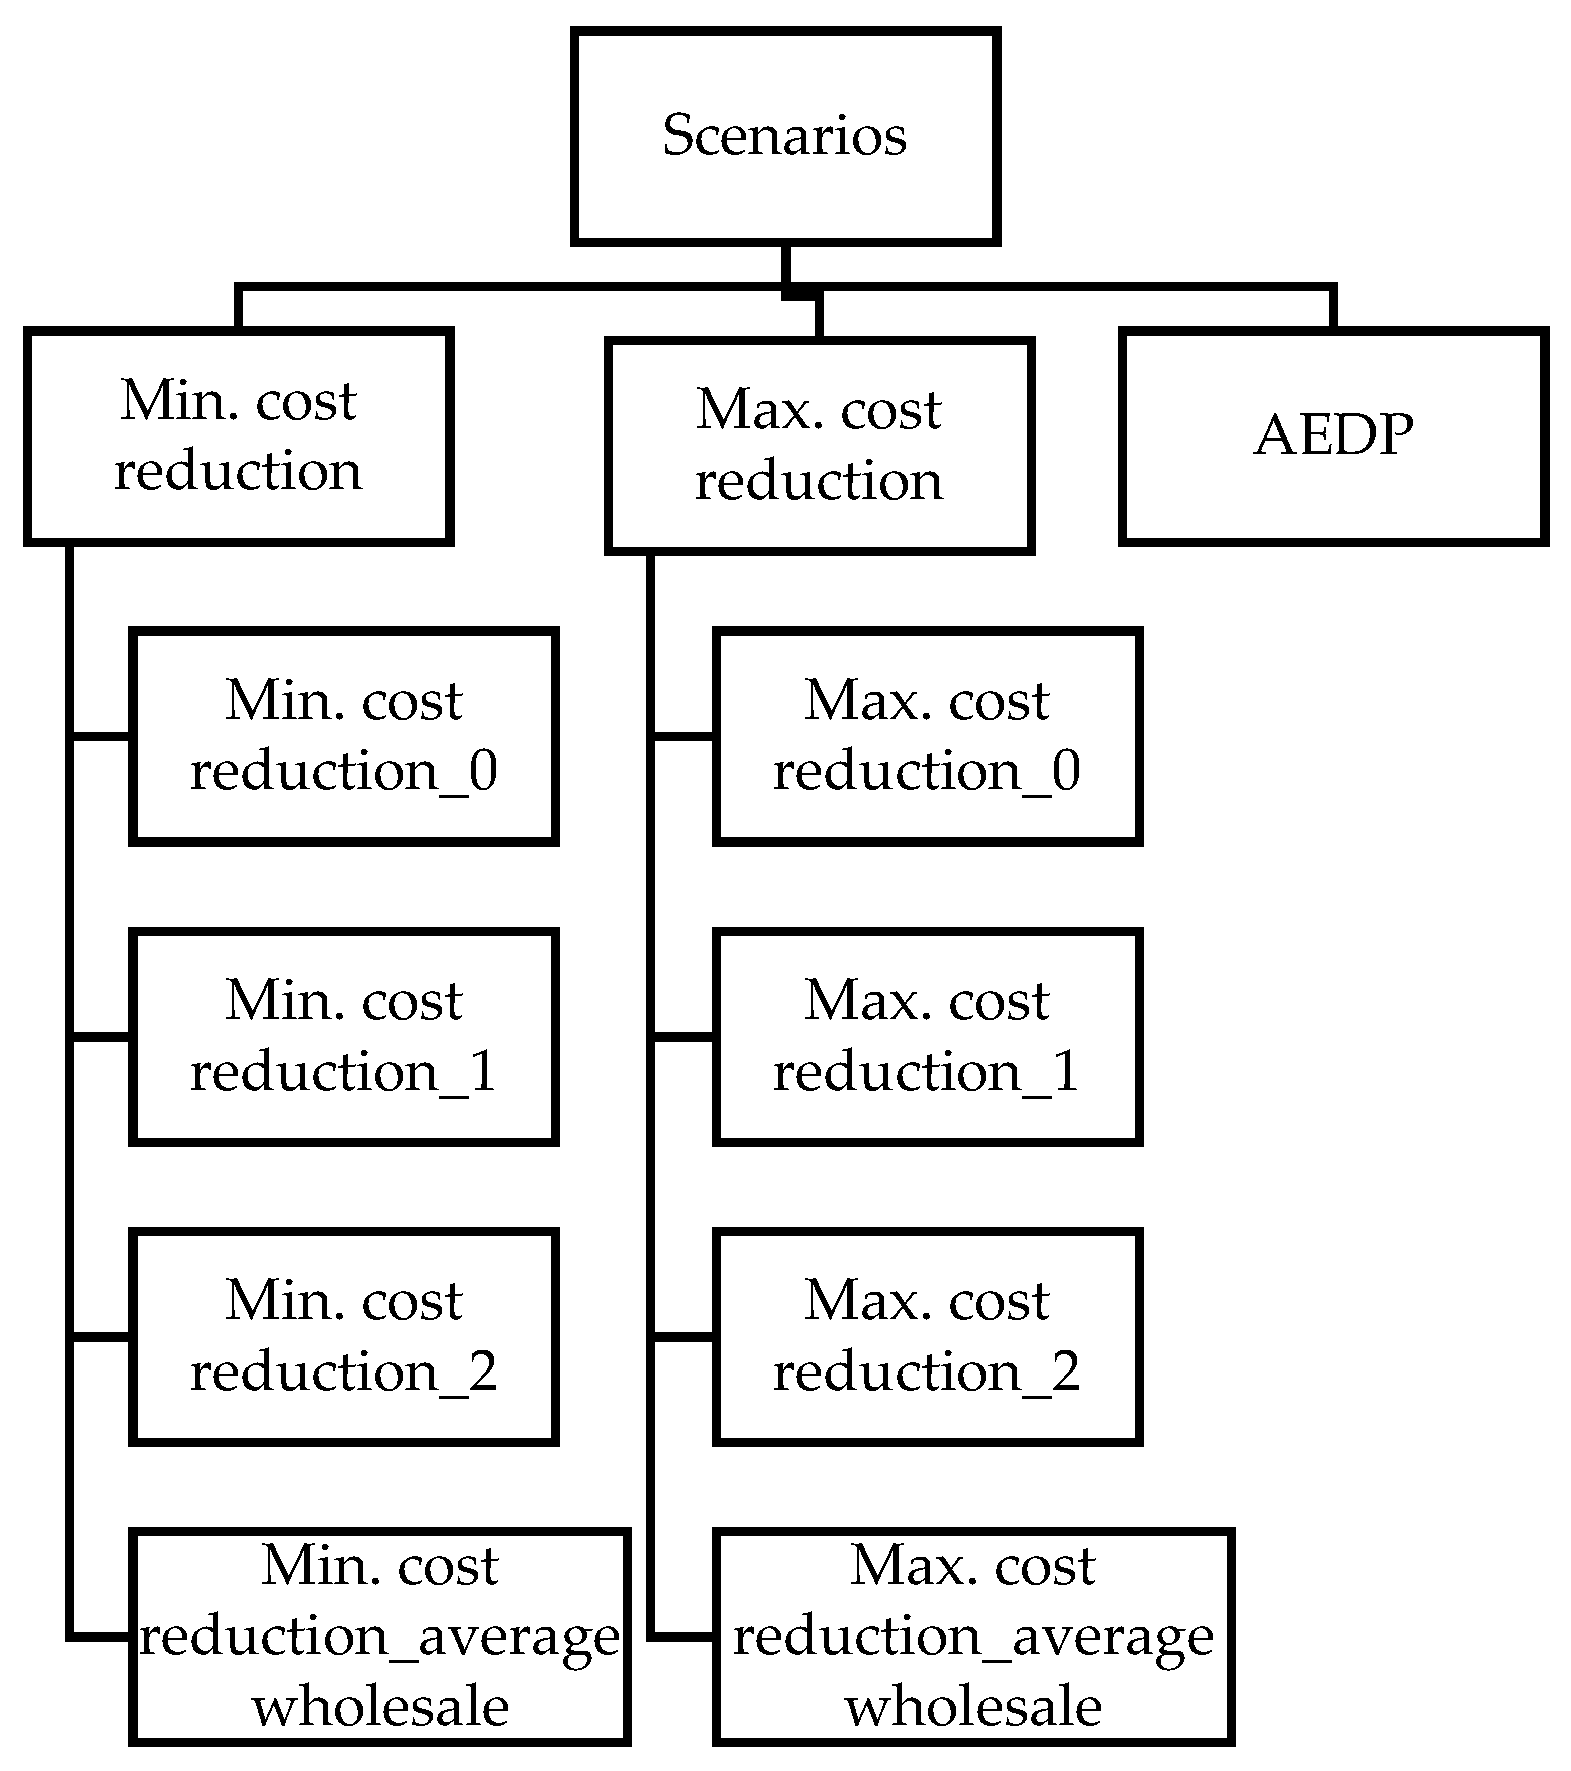
3.1. Scope of Work
- Minimum cost reduction. Buyback rates are 0, 1, 2, and 2.6 (the average wholesale electricity rate) THB/kWh. Weighted average wholesale rate is from the rate at voltage level of 69–115 kV. A fuel adjustment charge (Ft) was included as of September–December 2017 (−0.0045 USD/unit for MEA and −0.0071 USD/unit for PEA). Buyback rates of 0, 1, 2, and 2.6 THB/kWh would be 0, 0.03, 0.06, and 0.07 USD/kWh, respectively (exchange rate: 35 THB/USD). An annual PV installation cost reduction is 2%. The timeframe of this analysis starts from the date of this writing (2018) to the end of AEDP (2036).
- Maximum cost reduction. Buyback rates are as above with an annual PV installation cost reduction of 4%.
- AEDP. Self-consumption only (the buyback rate is 0 THB/kWh with an annual PV installation cost reduction of 2%).
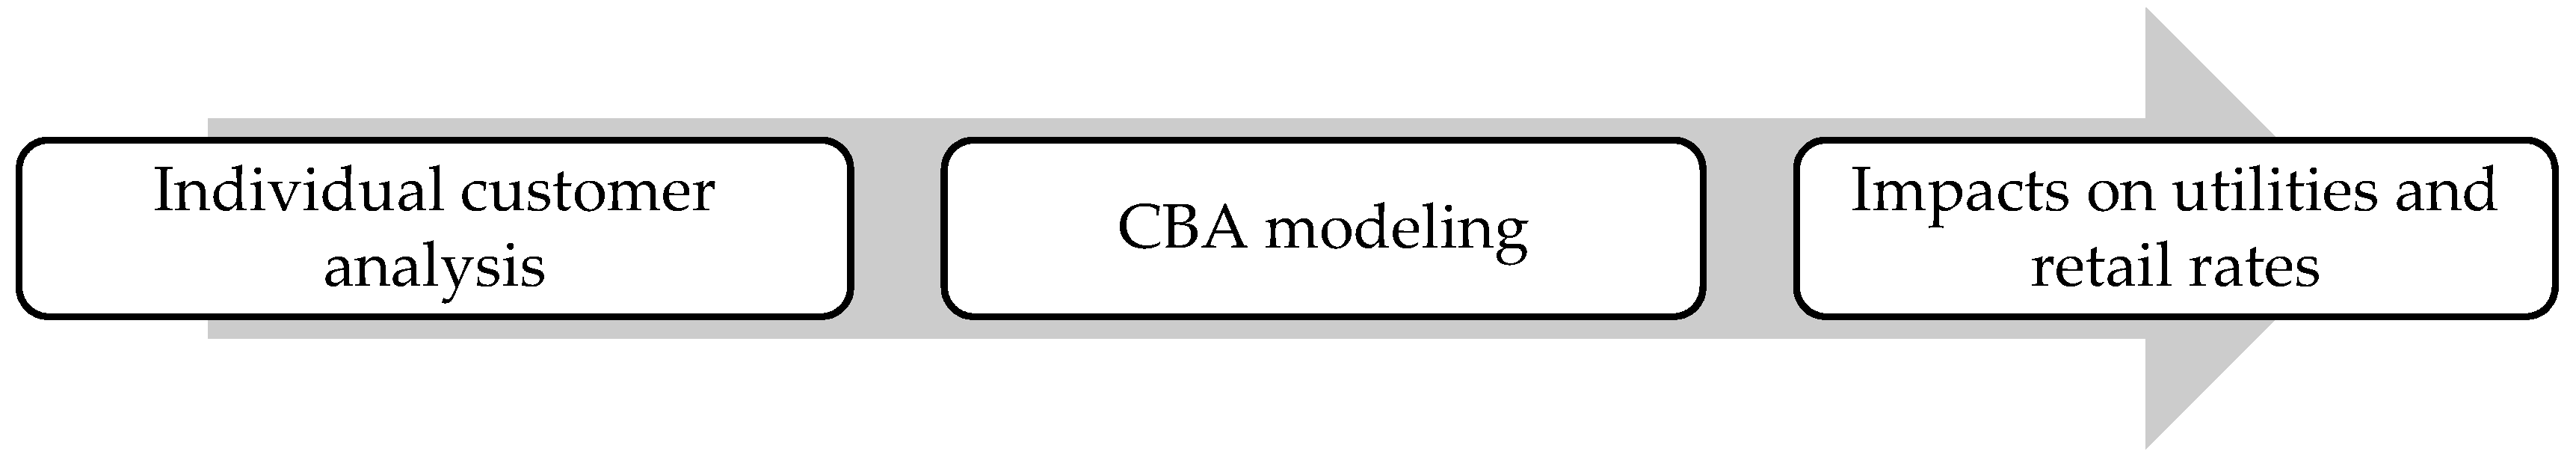
3.2. Methodology
4. Results
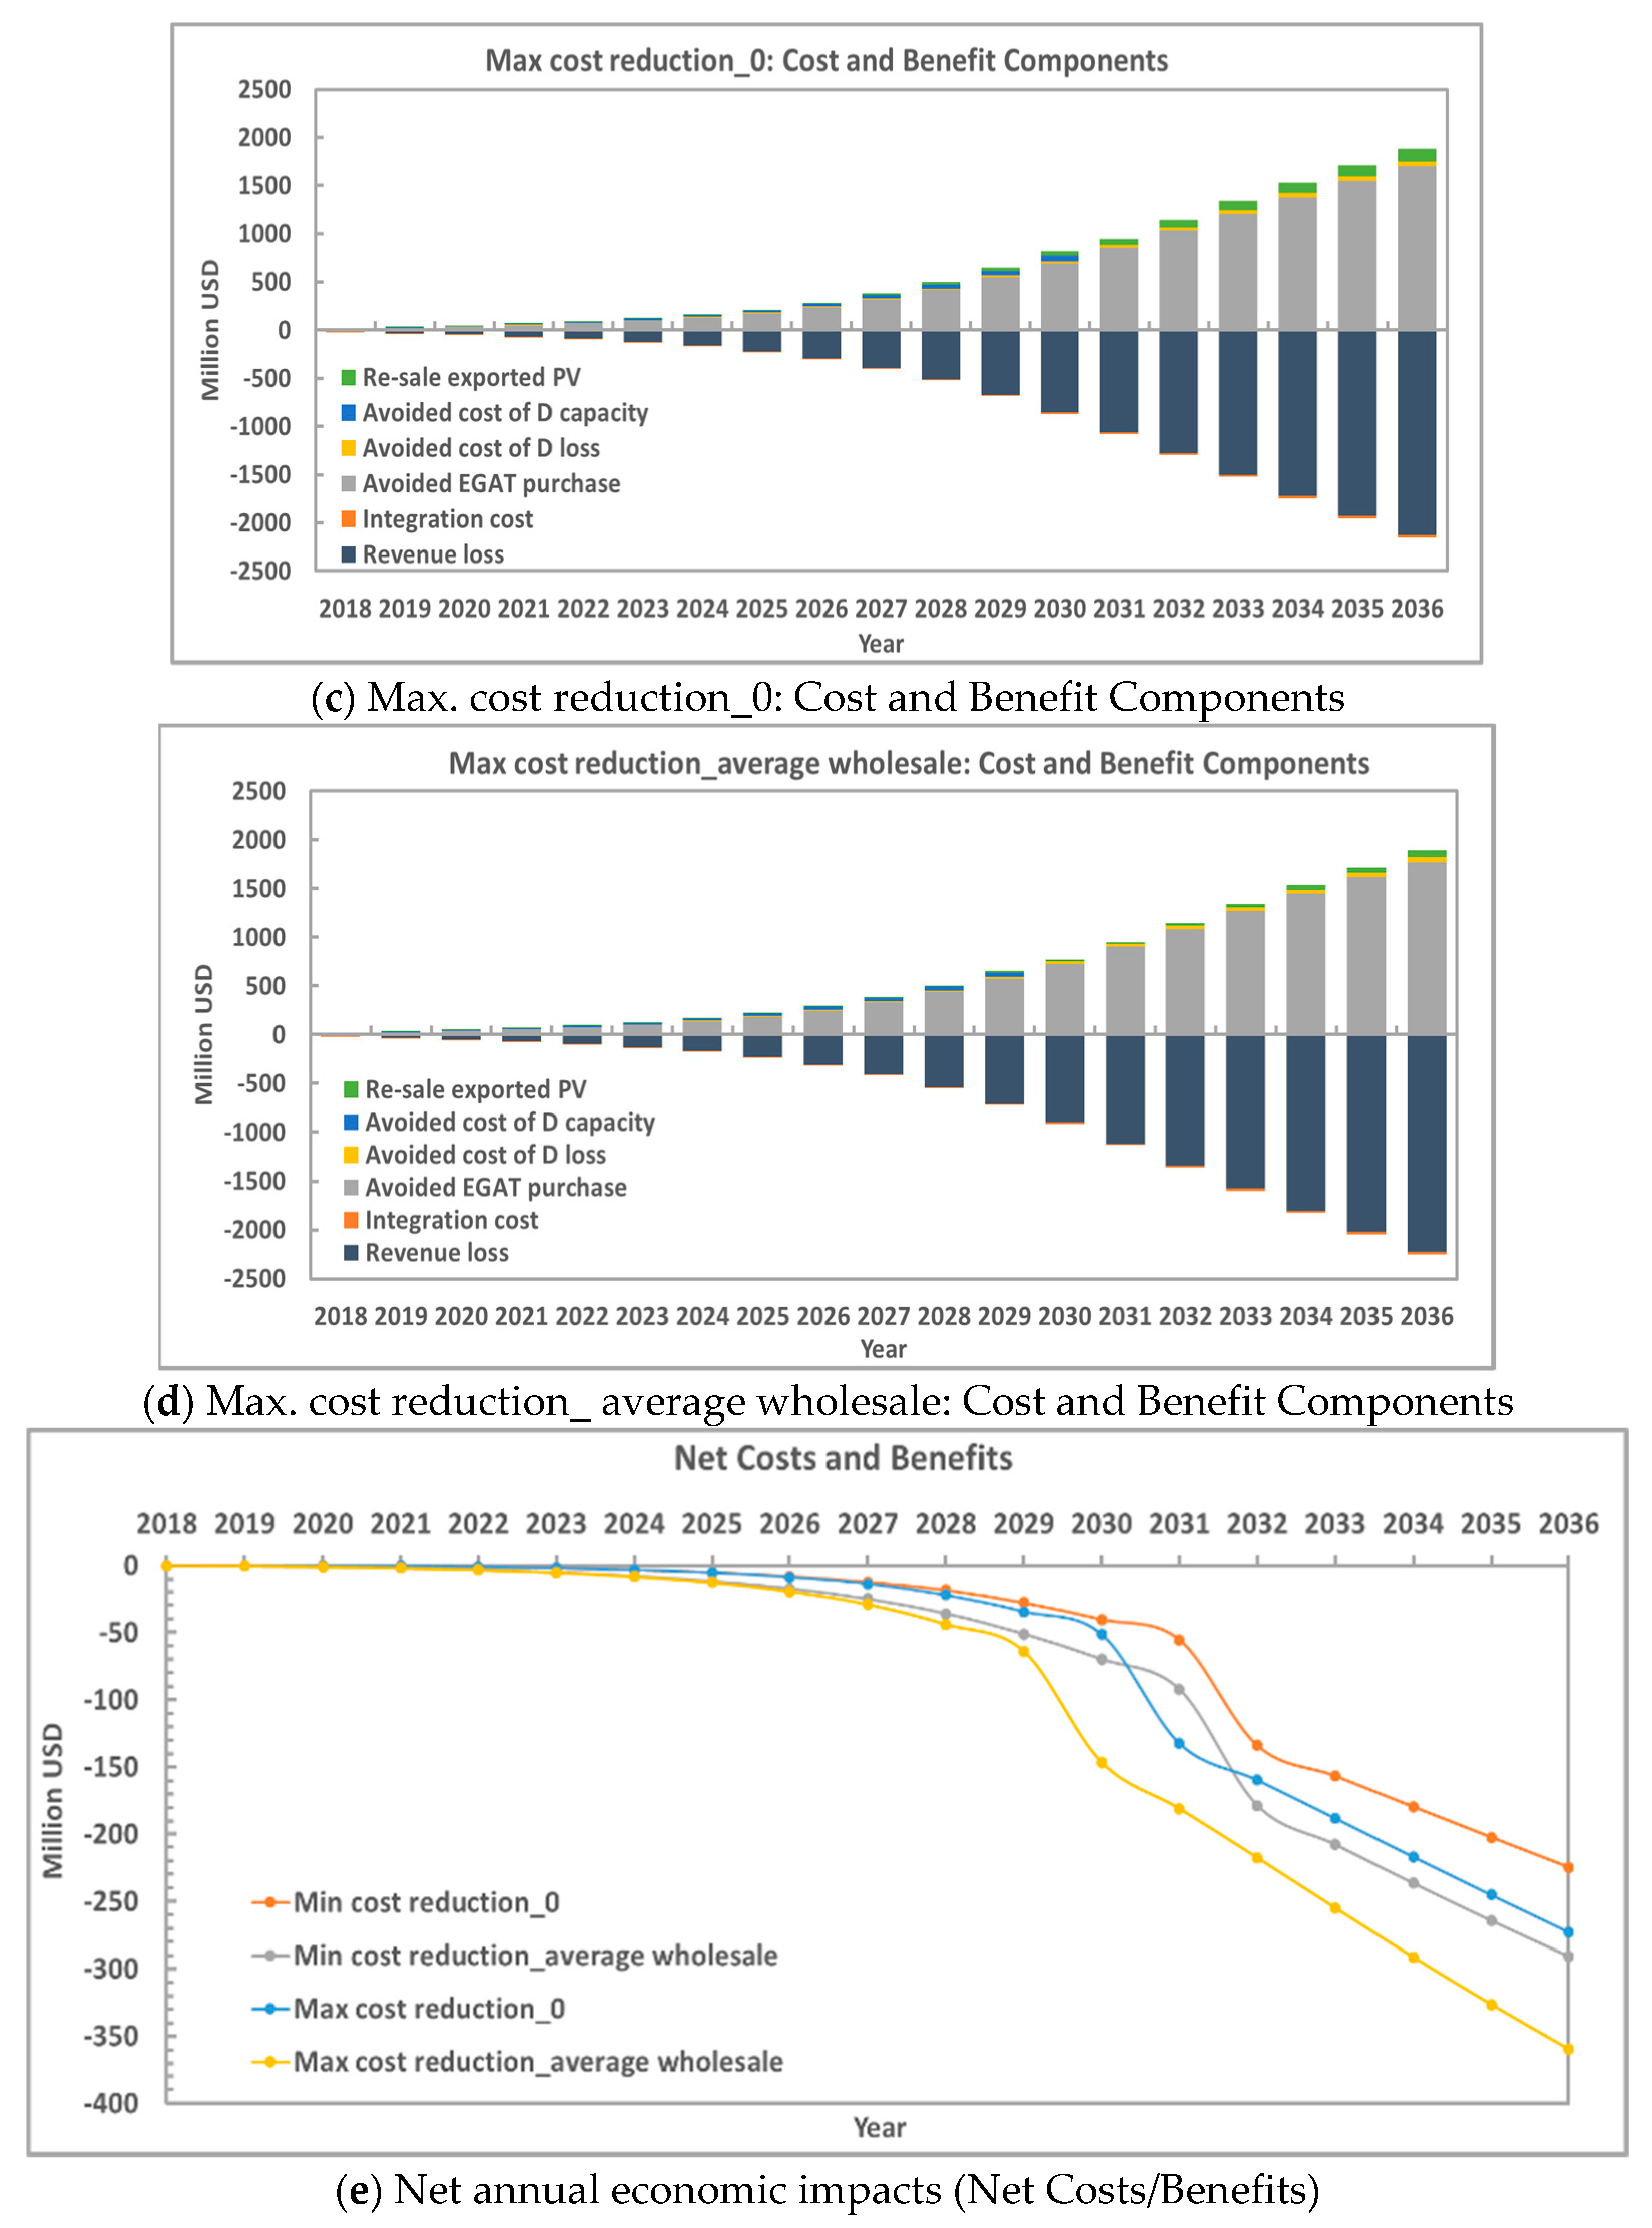
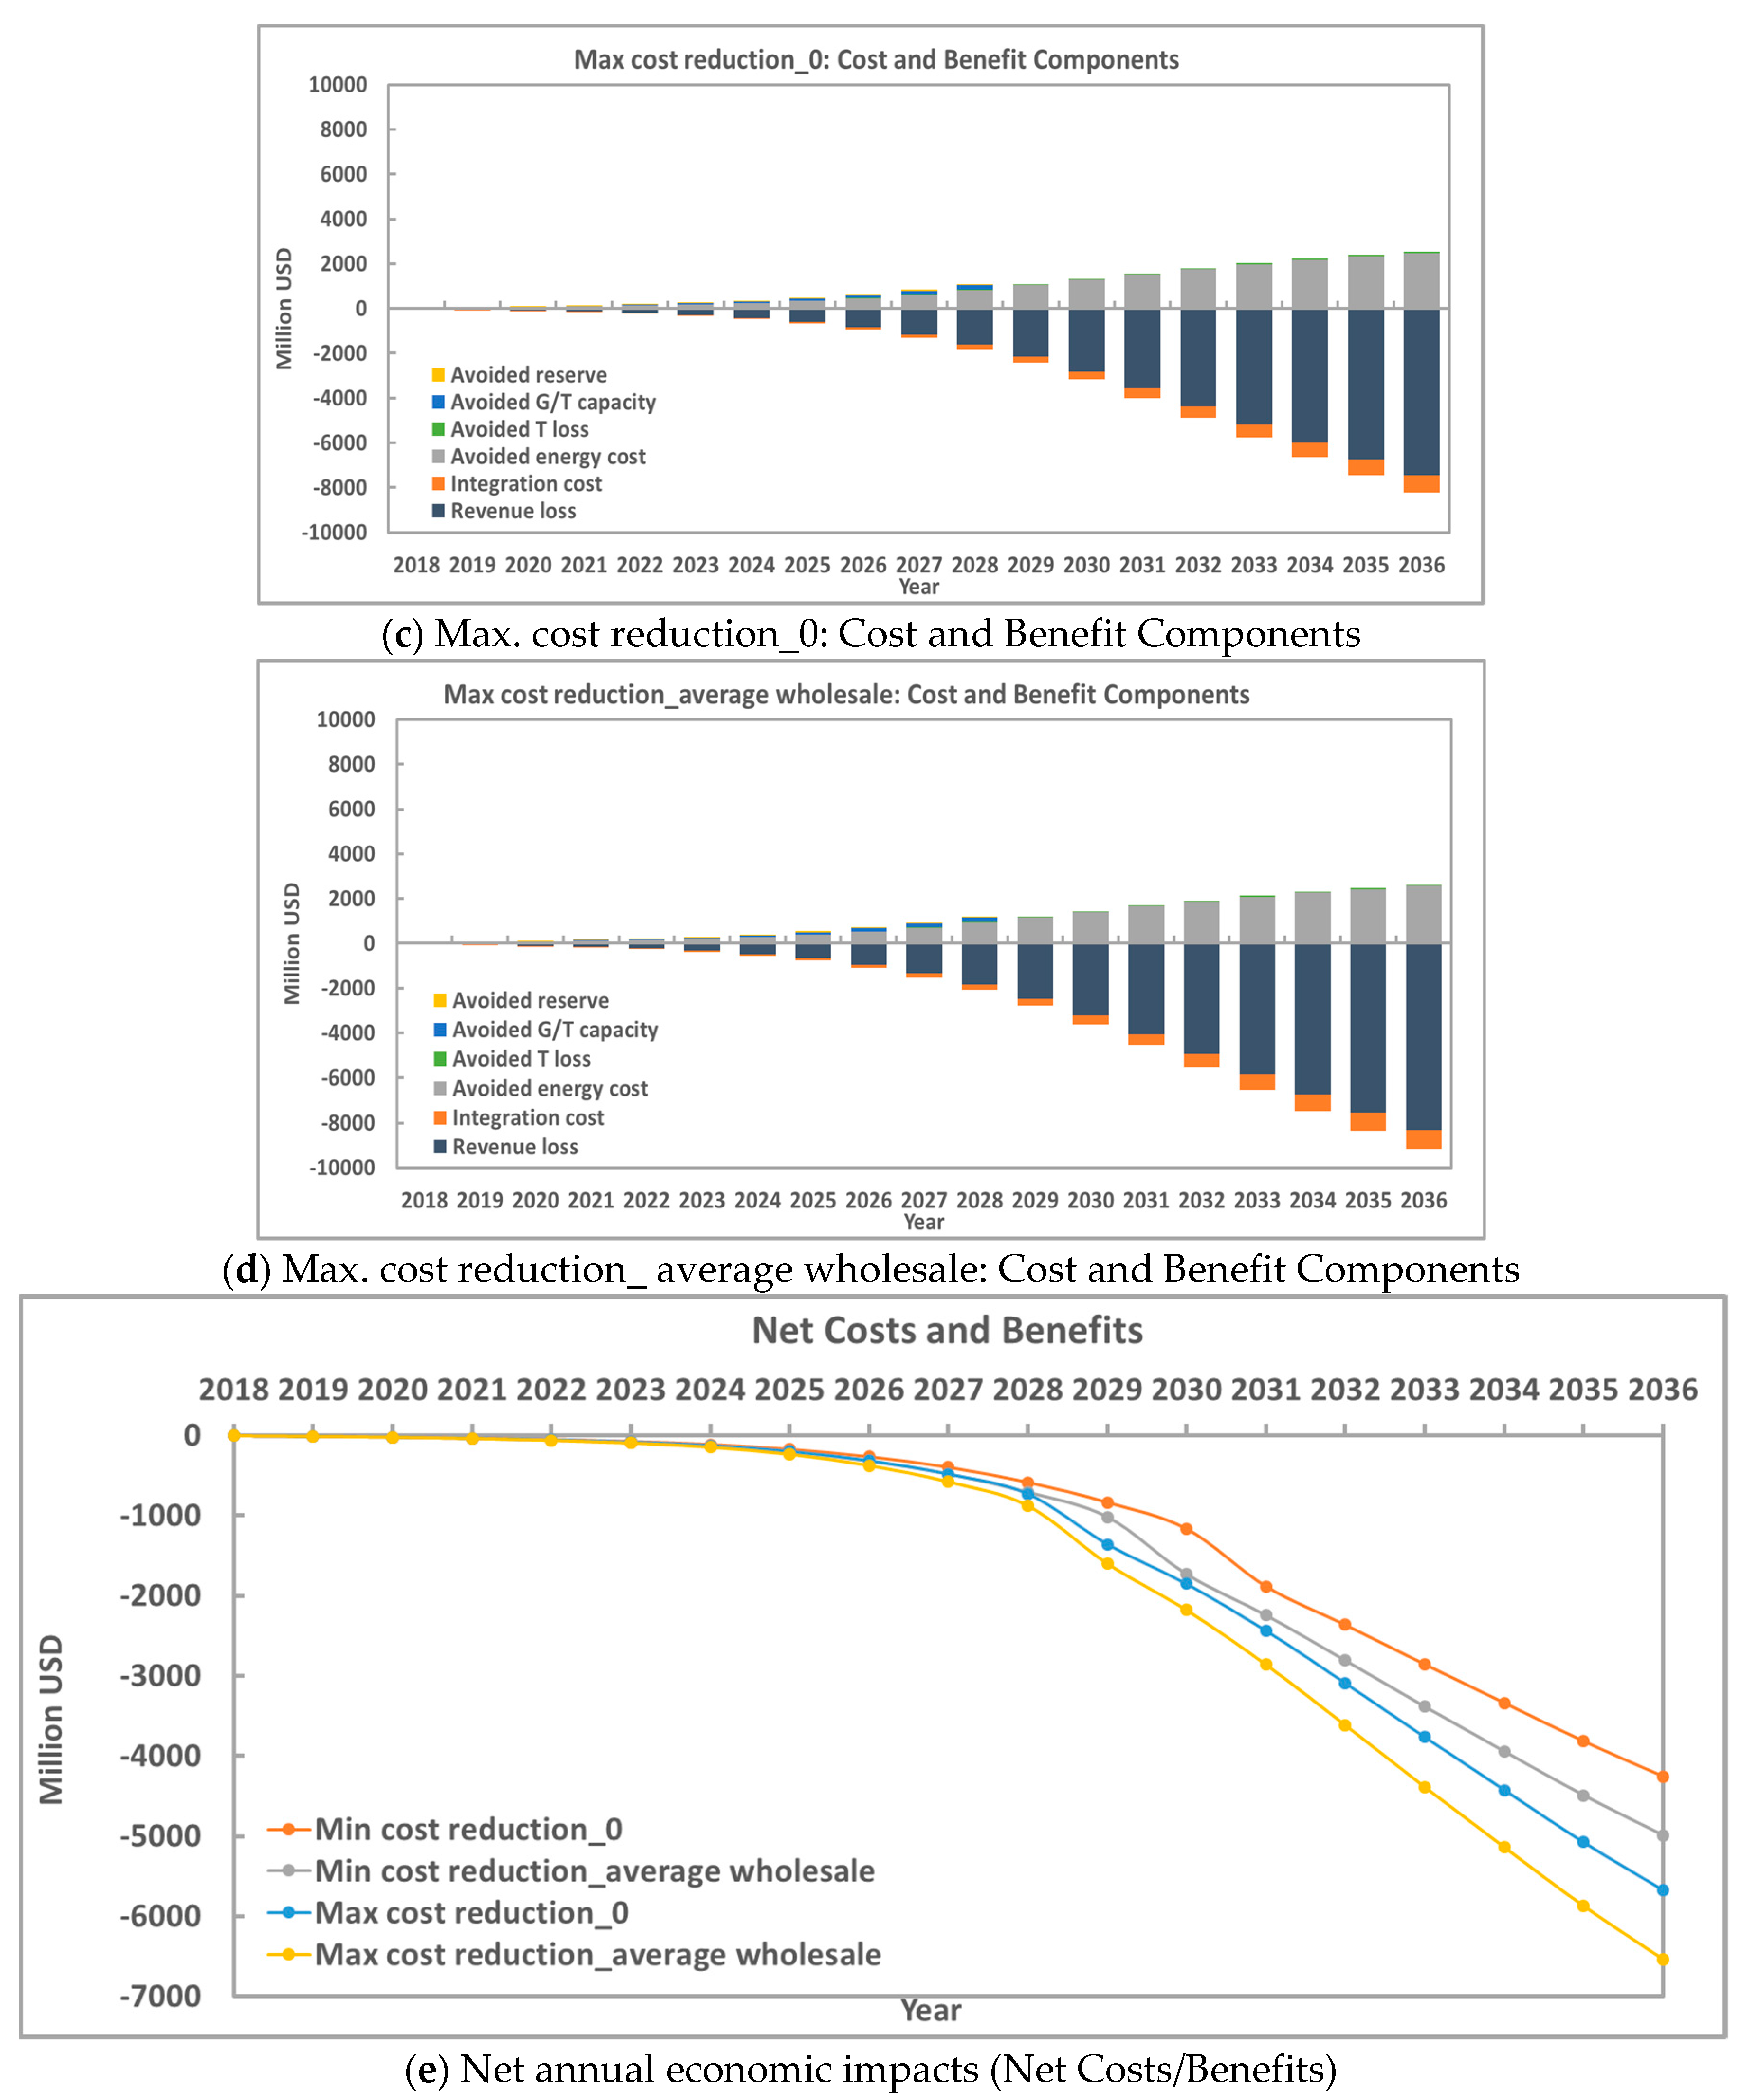
4.1. Net Economic Impacts on MEA, PEA, and EGAT
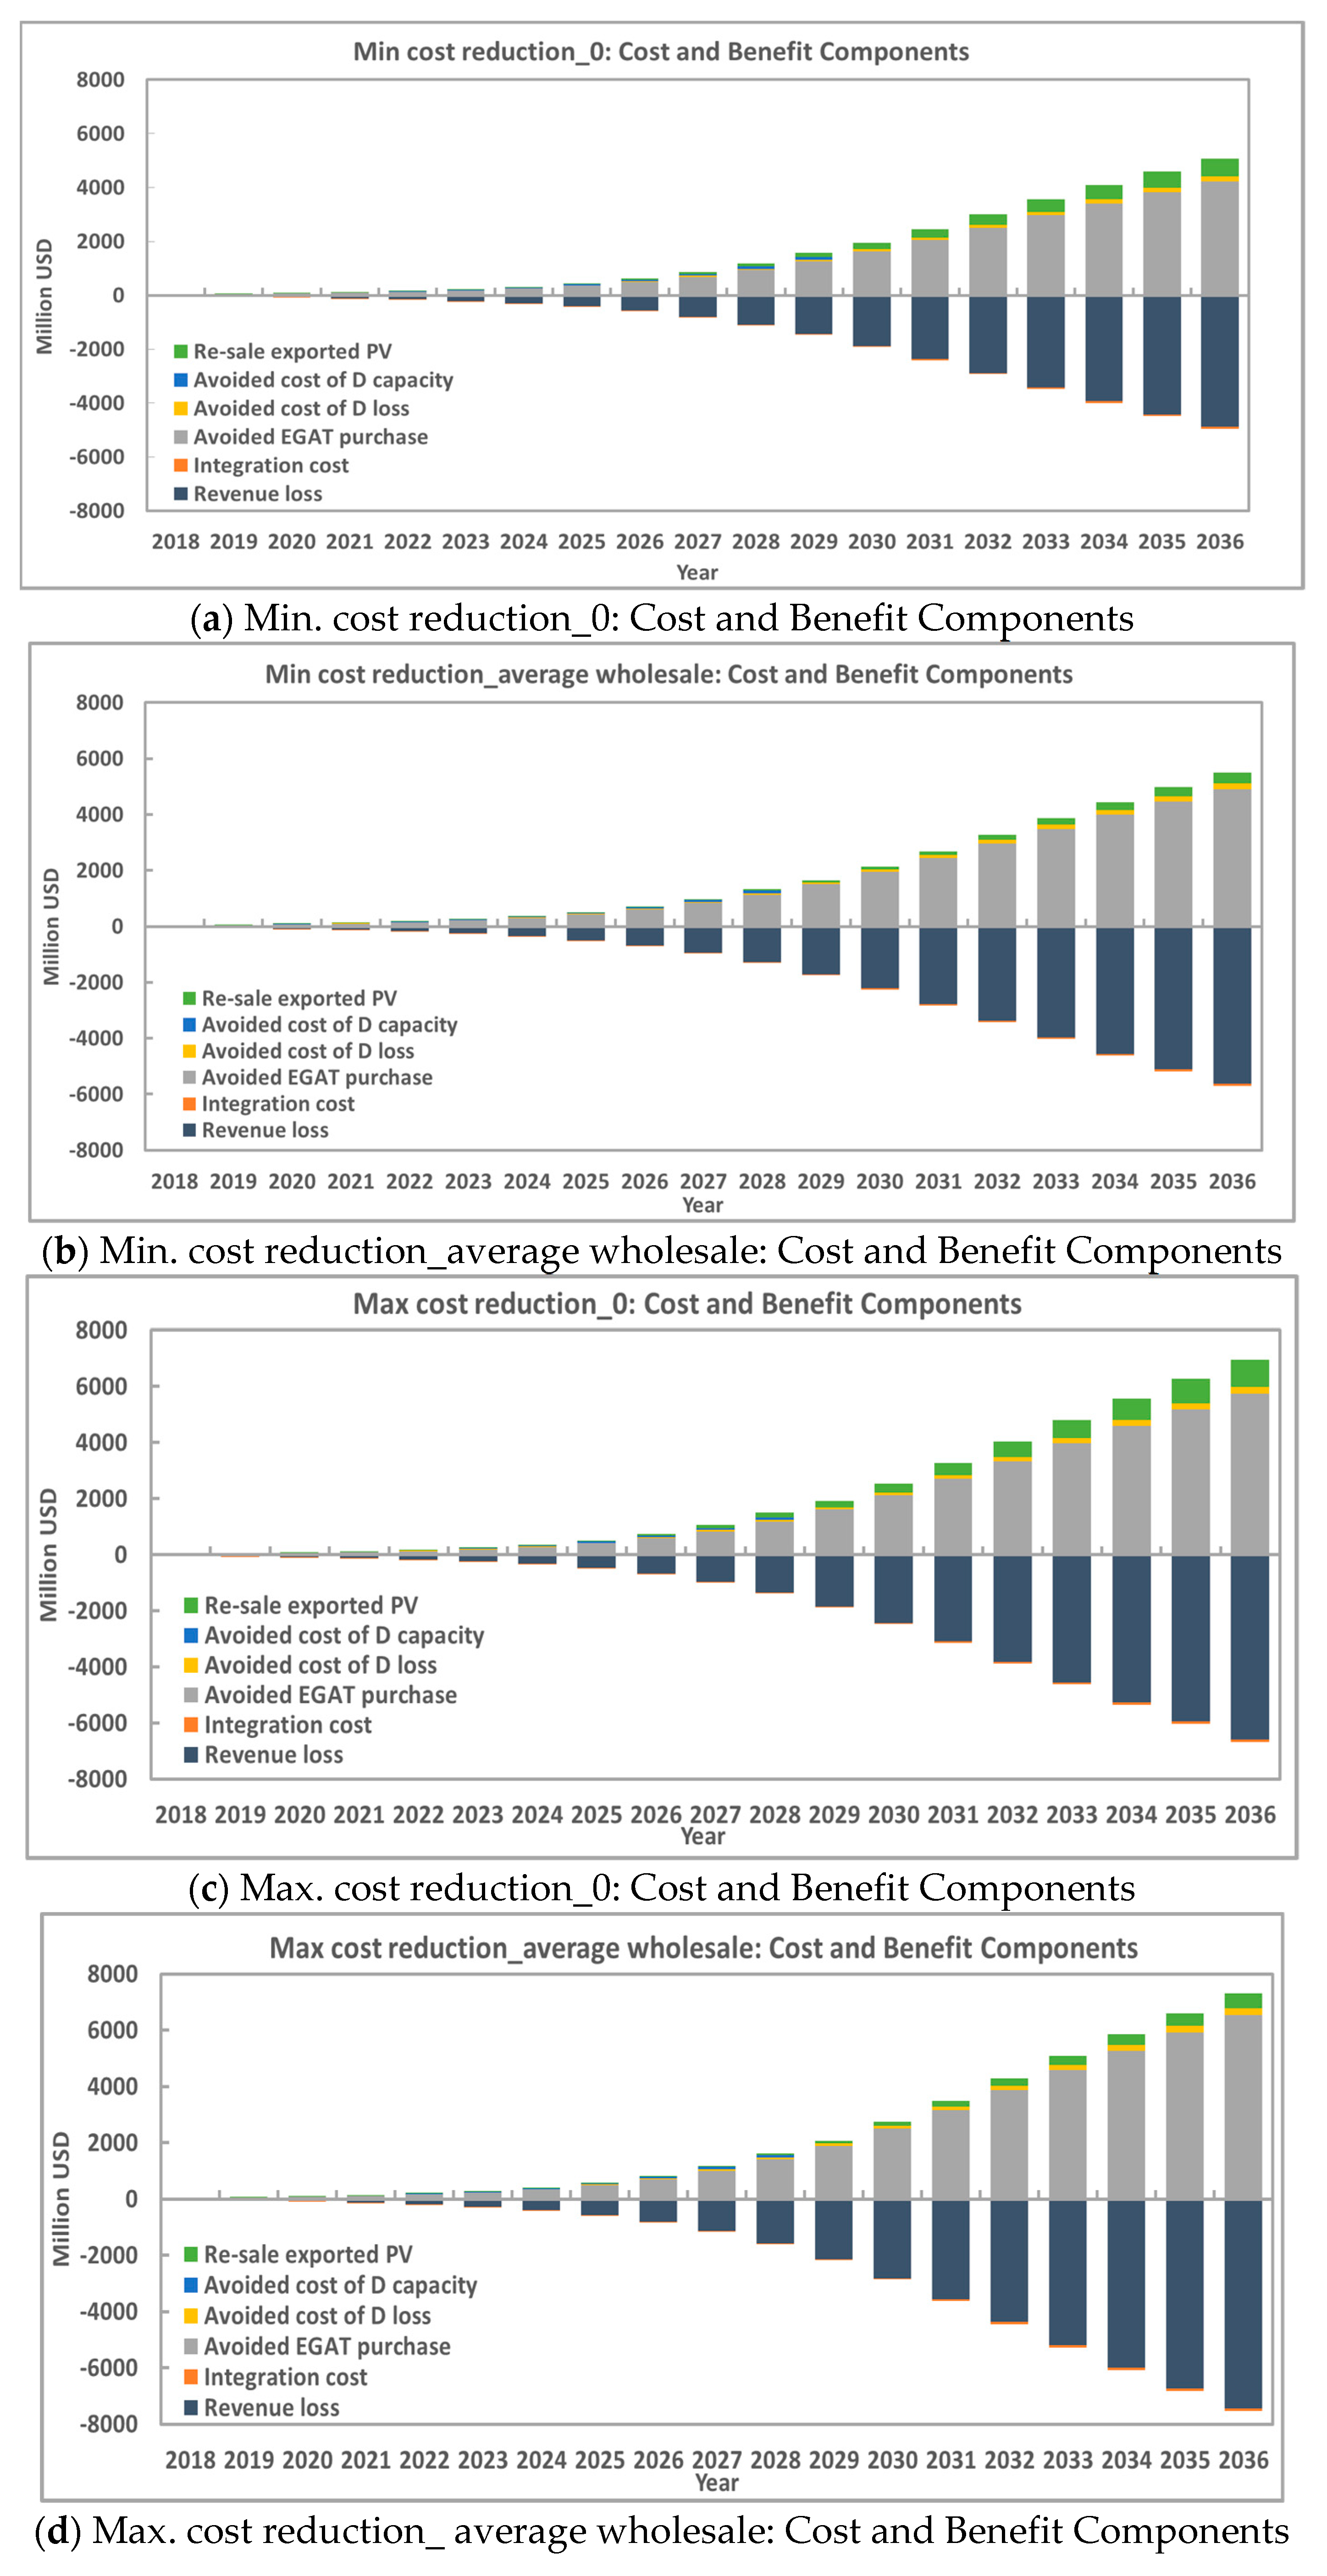
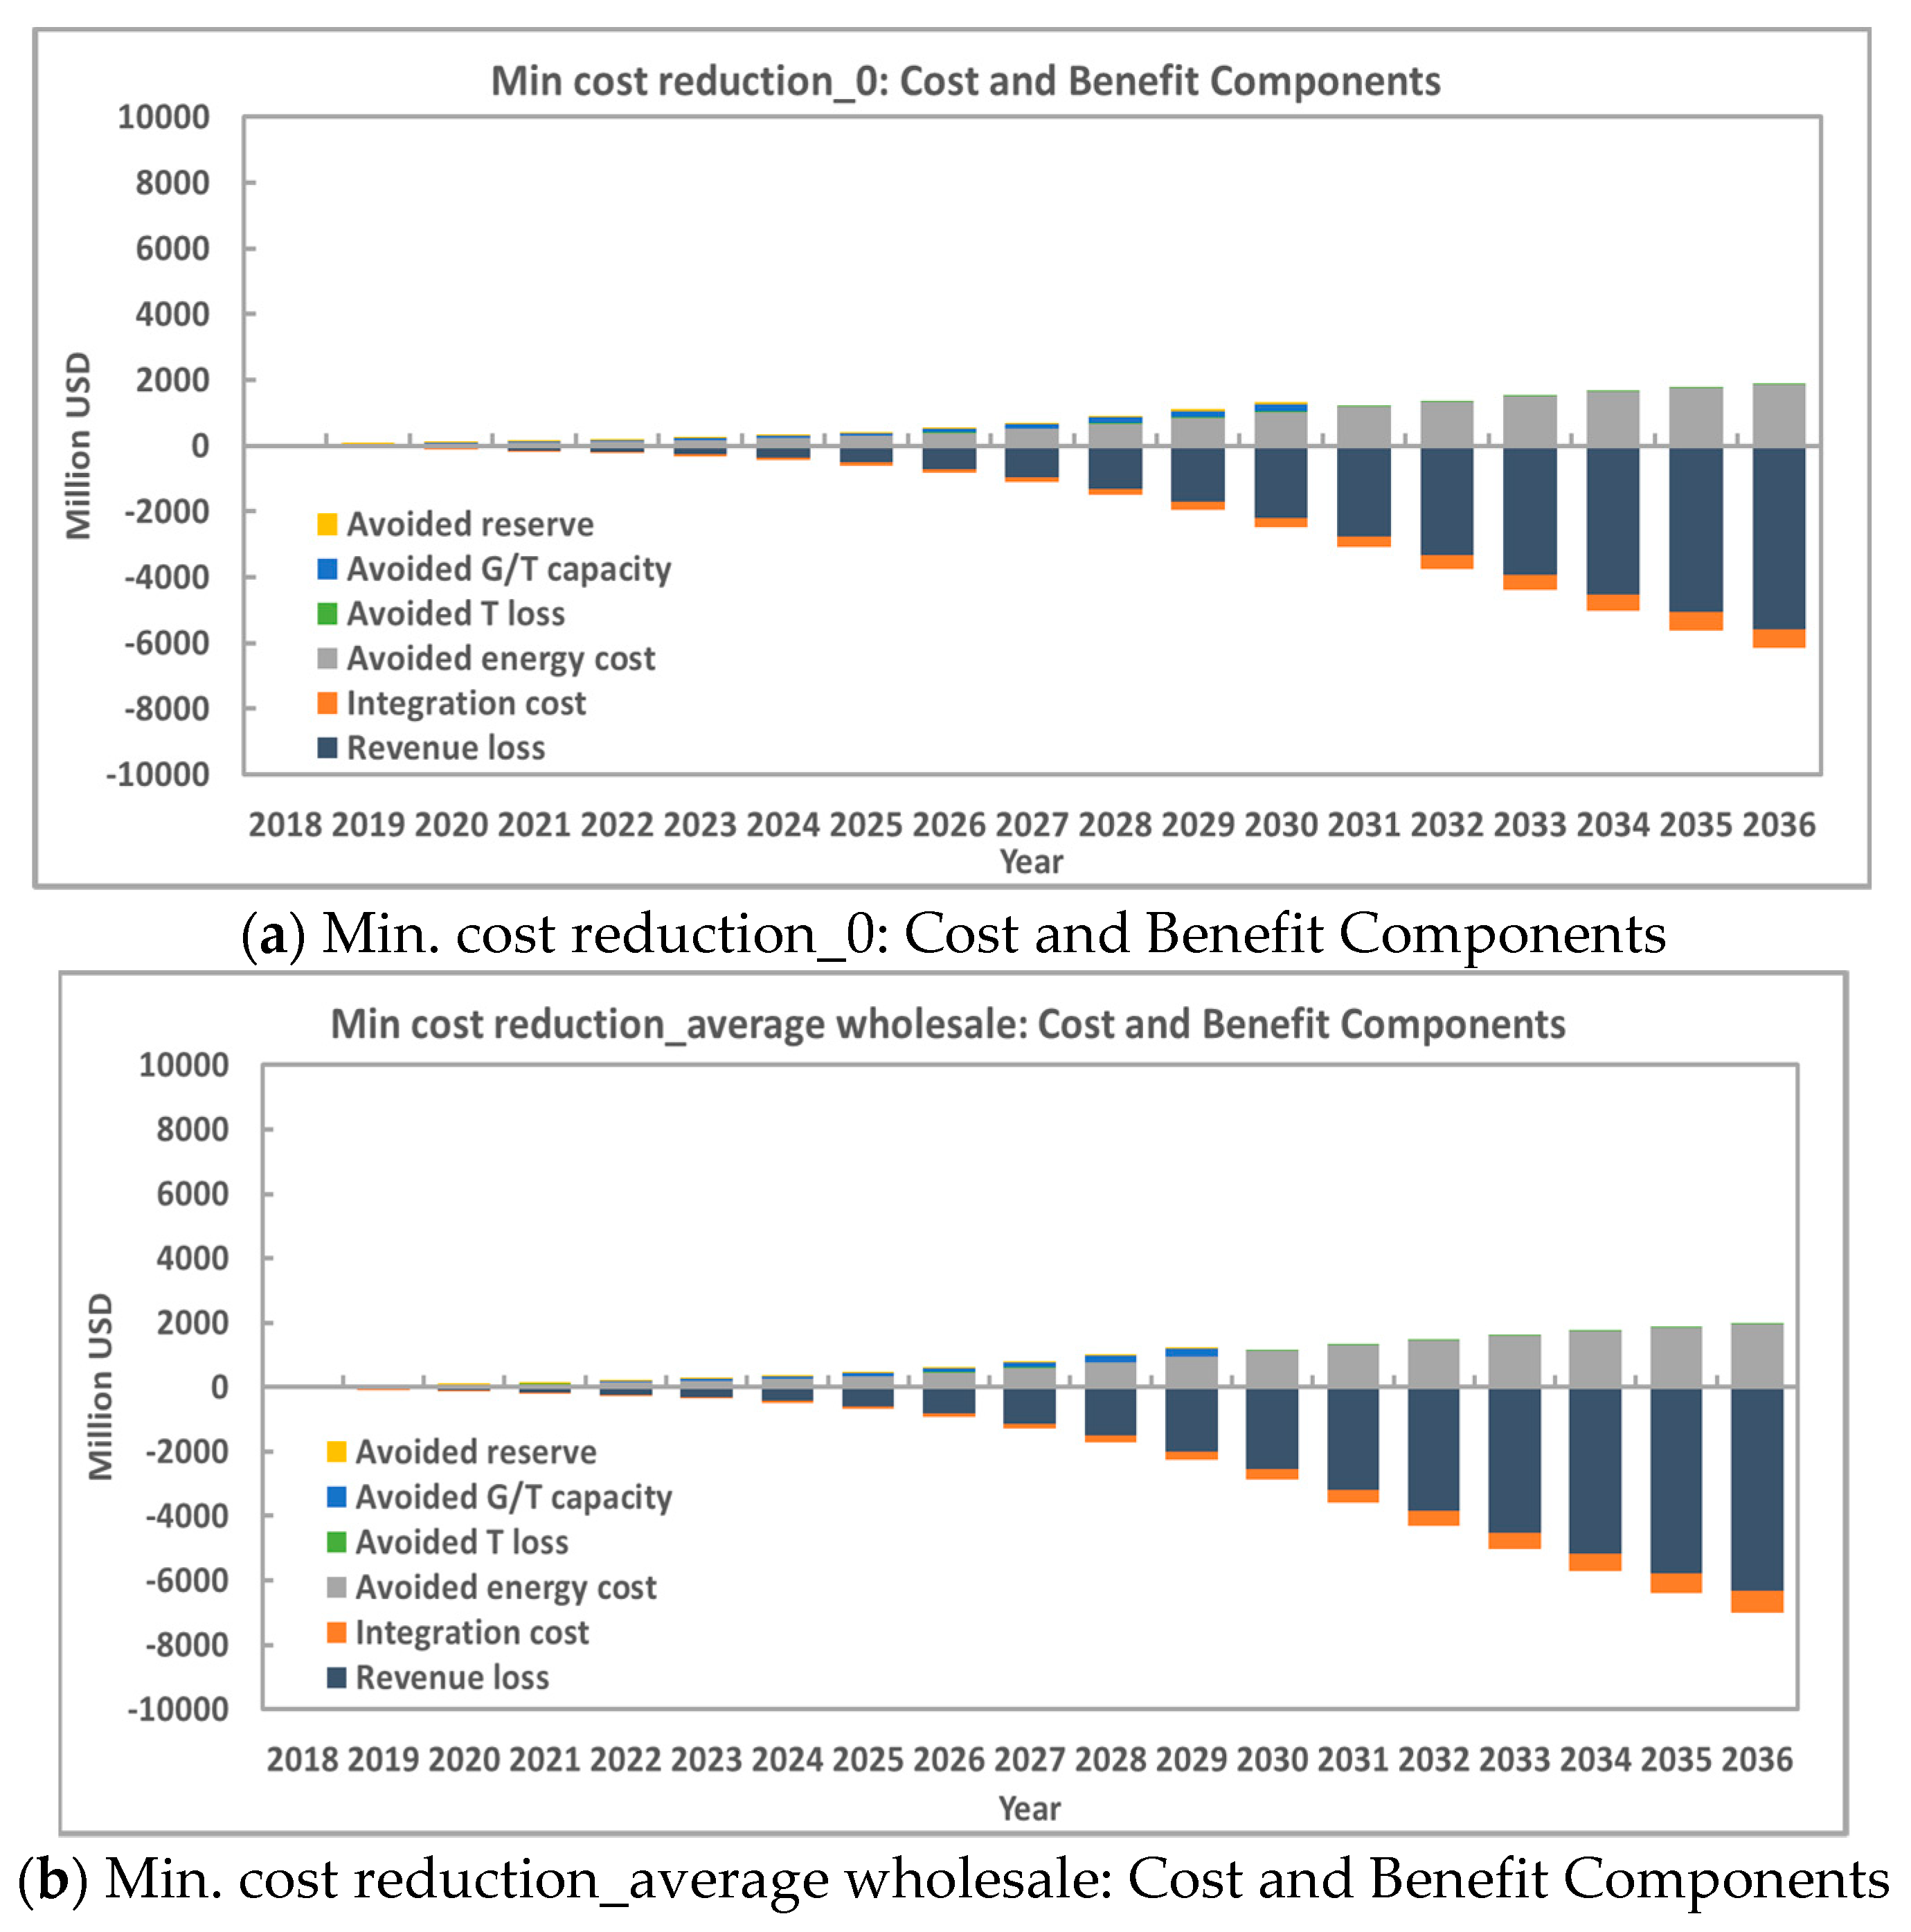
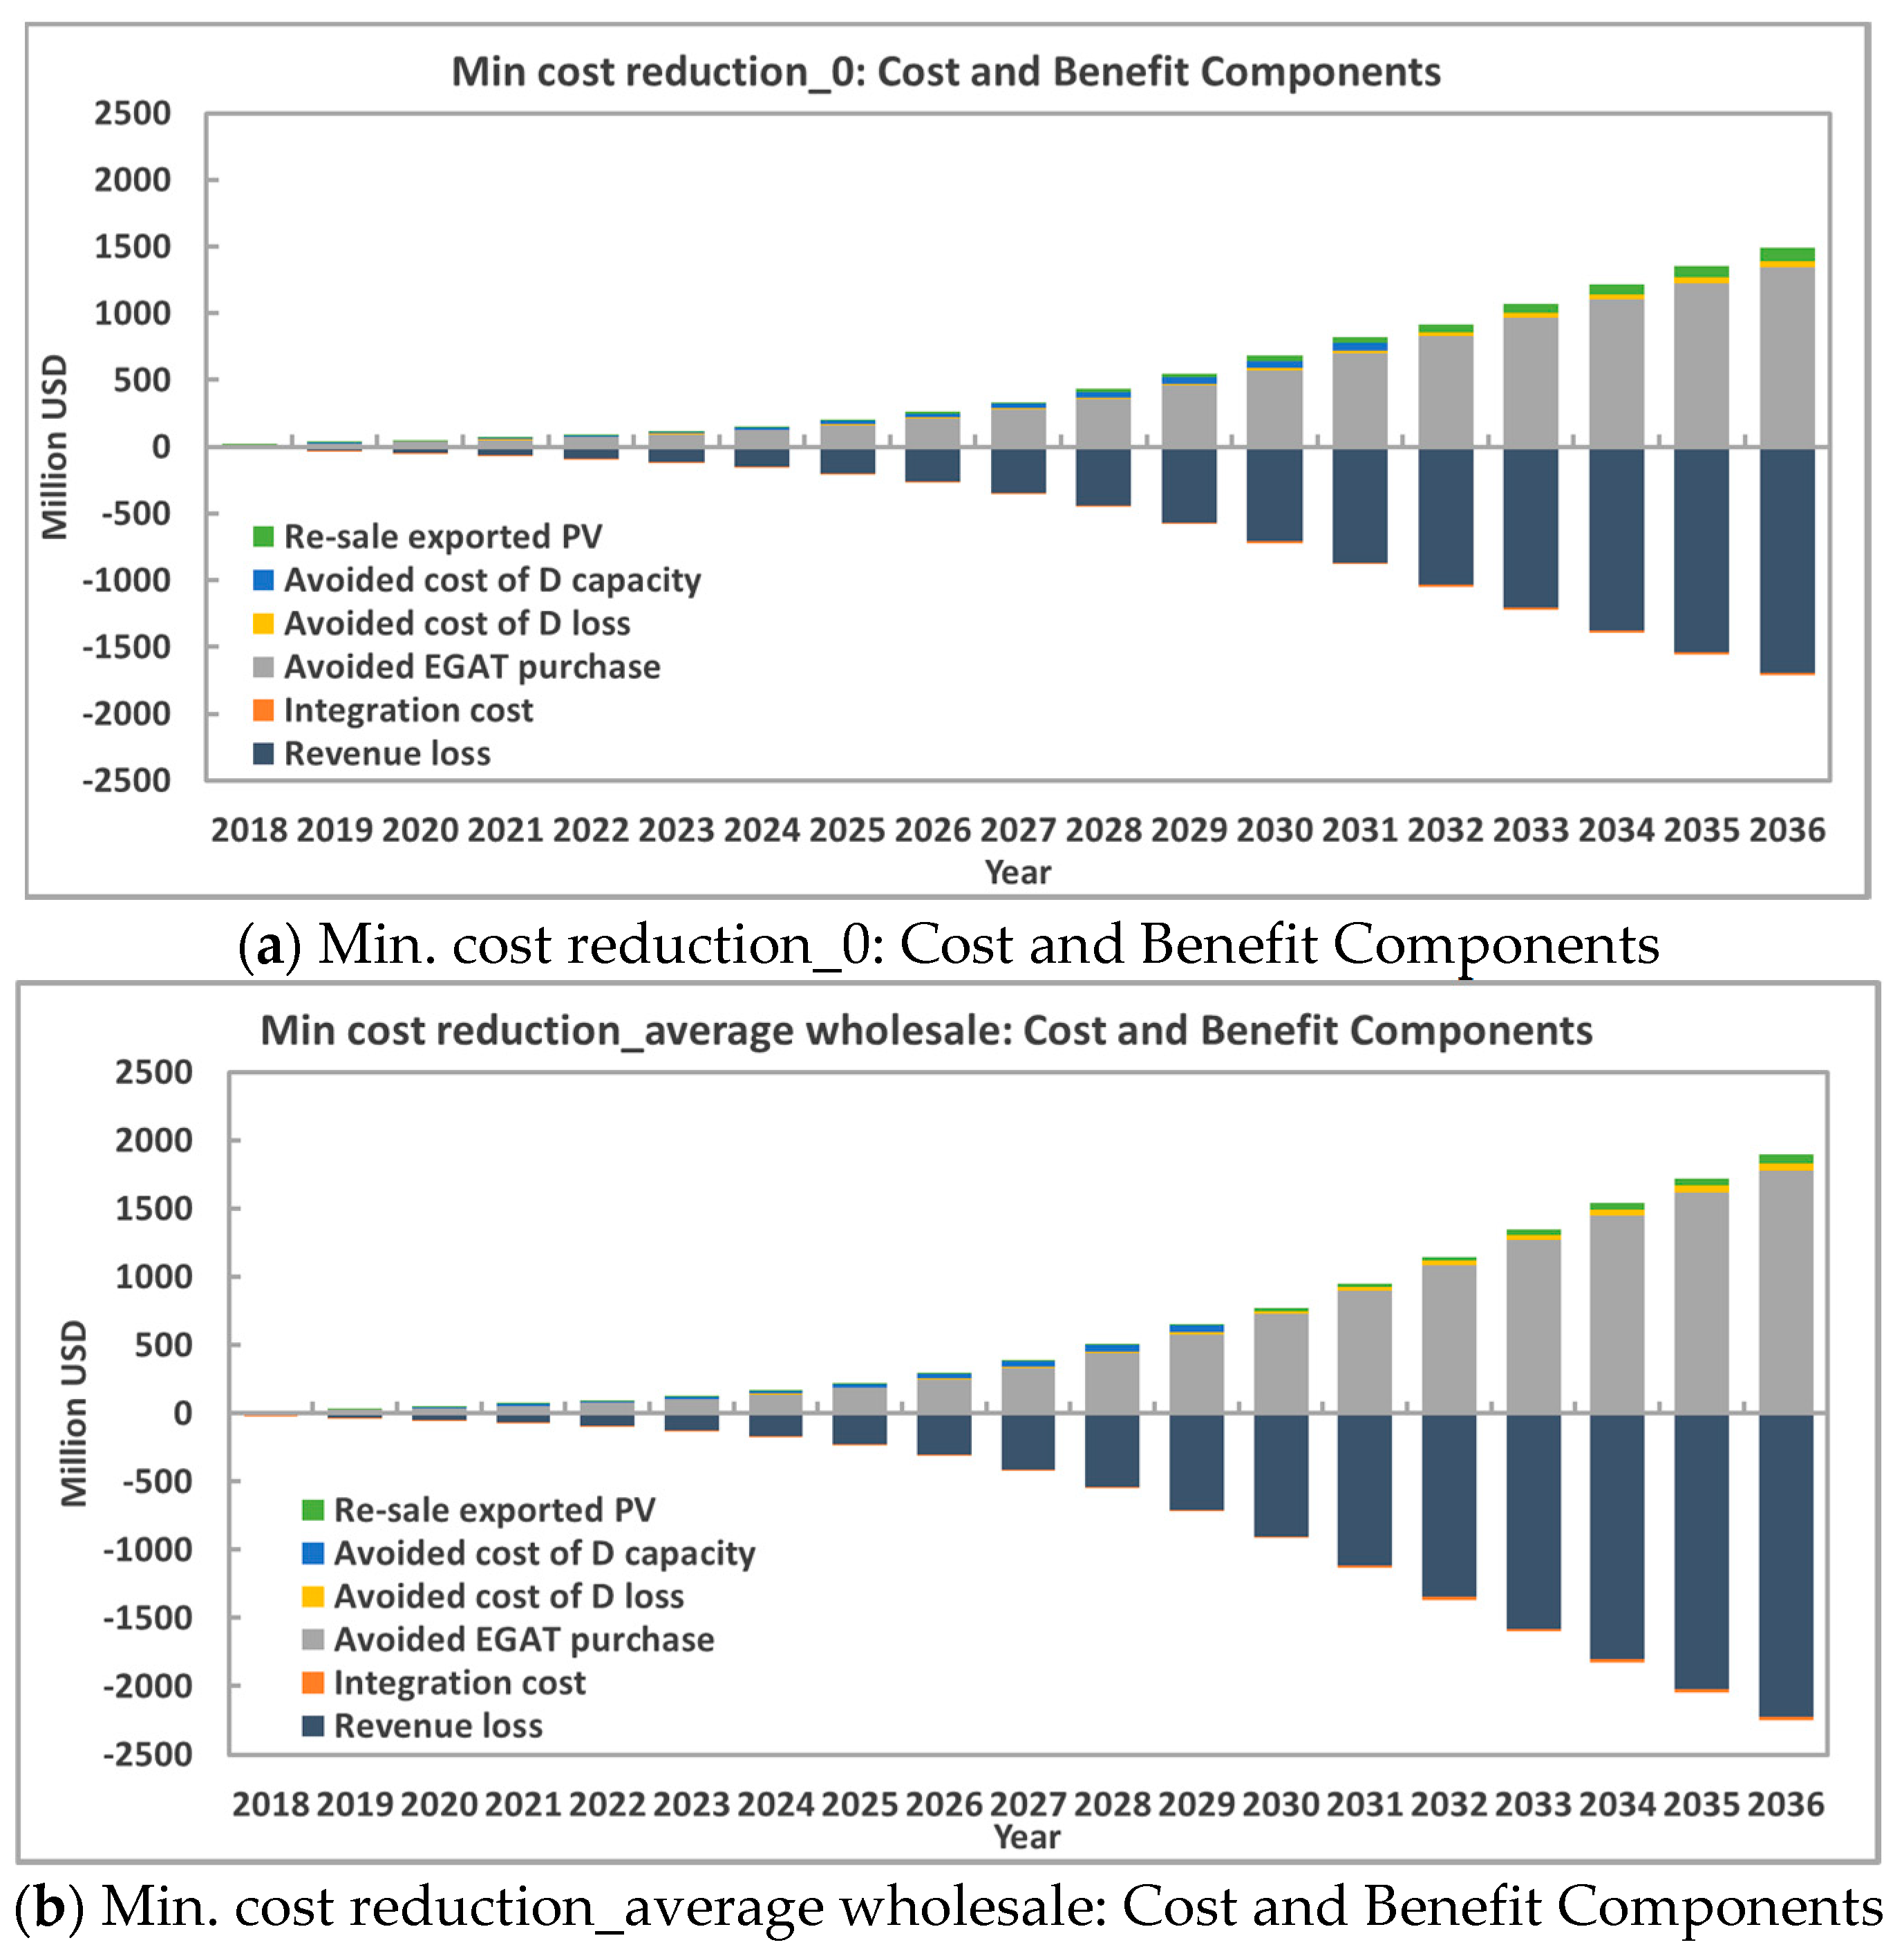
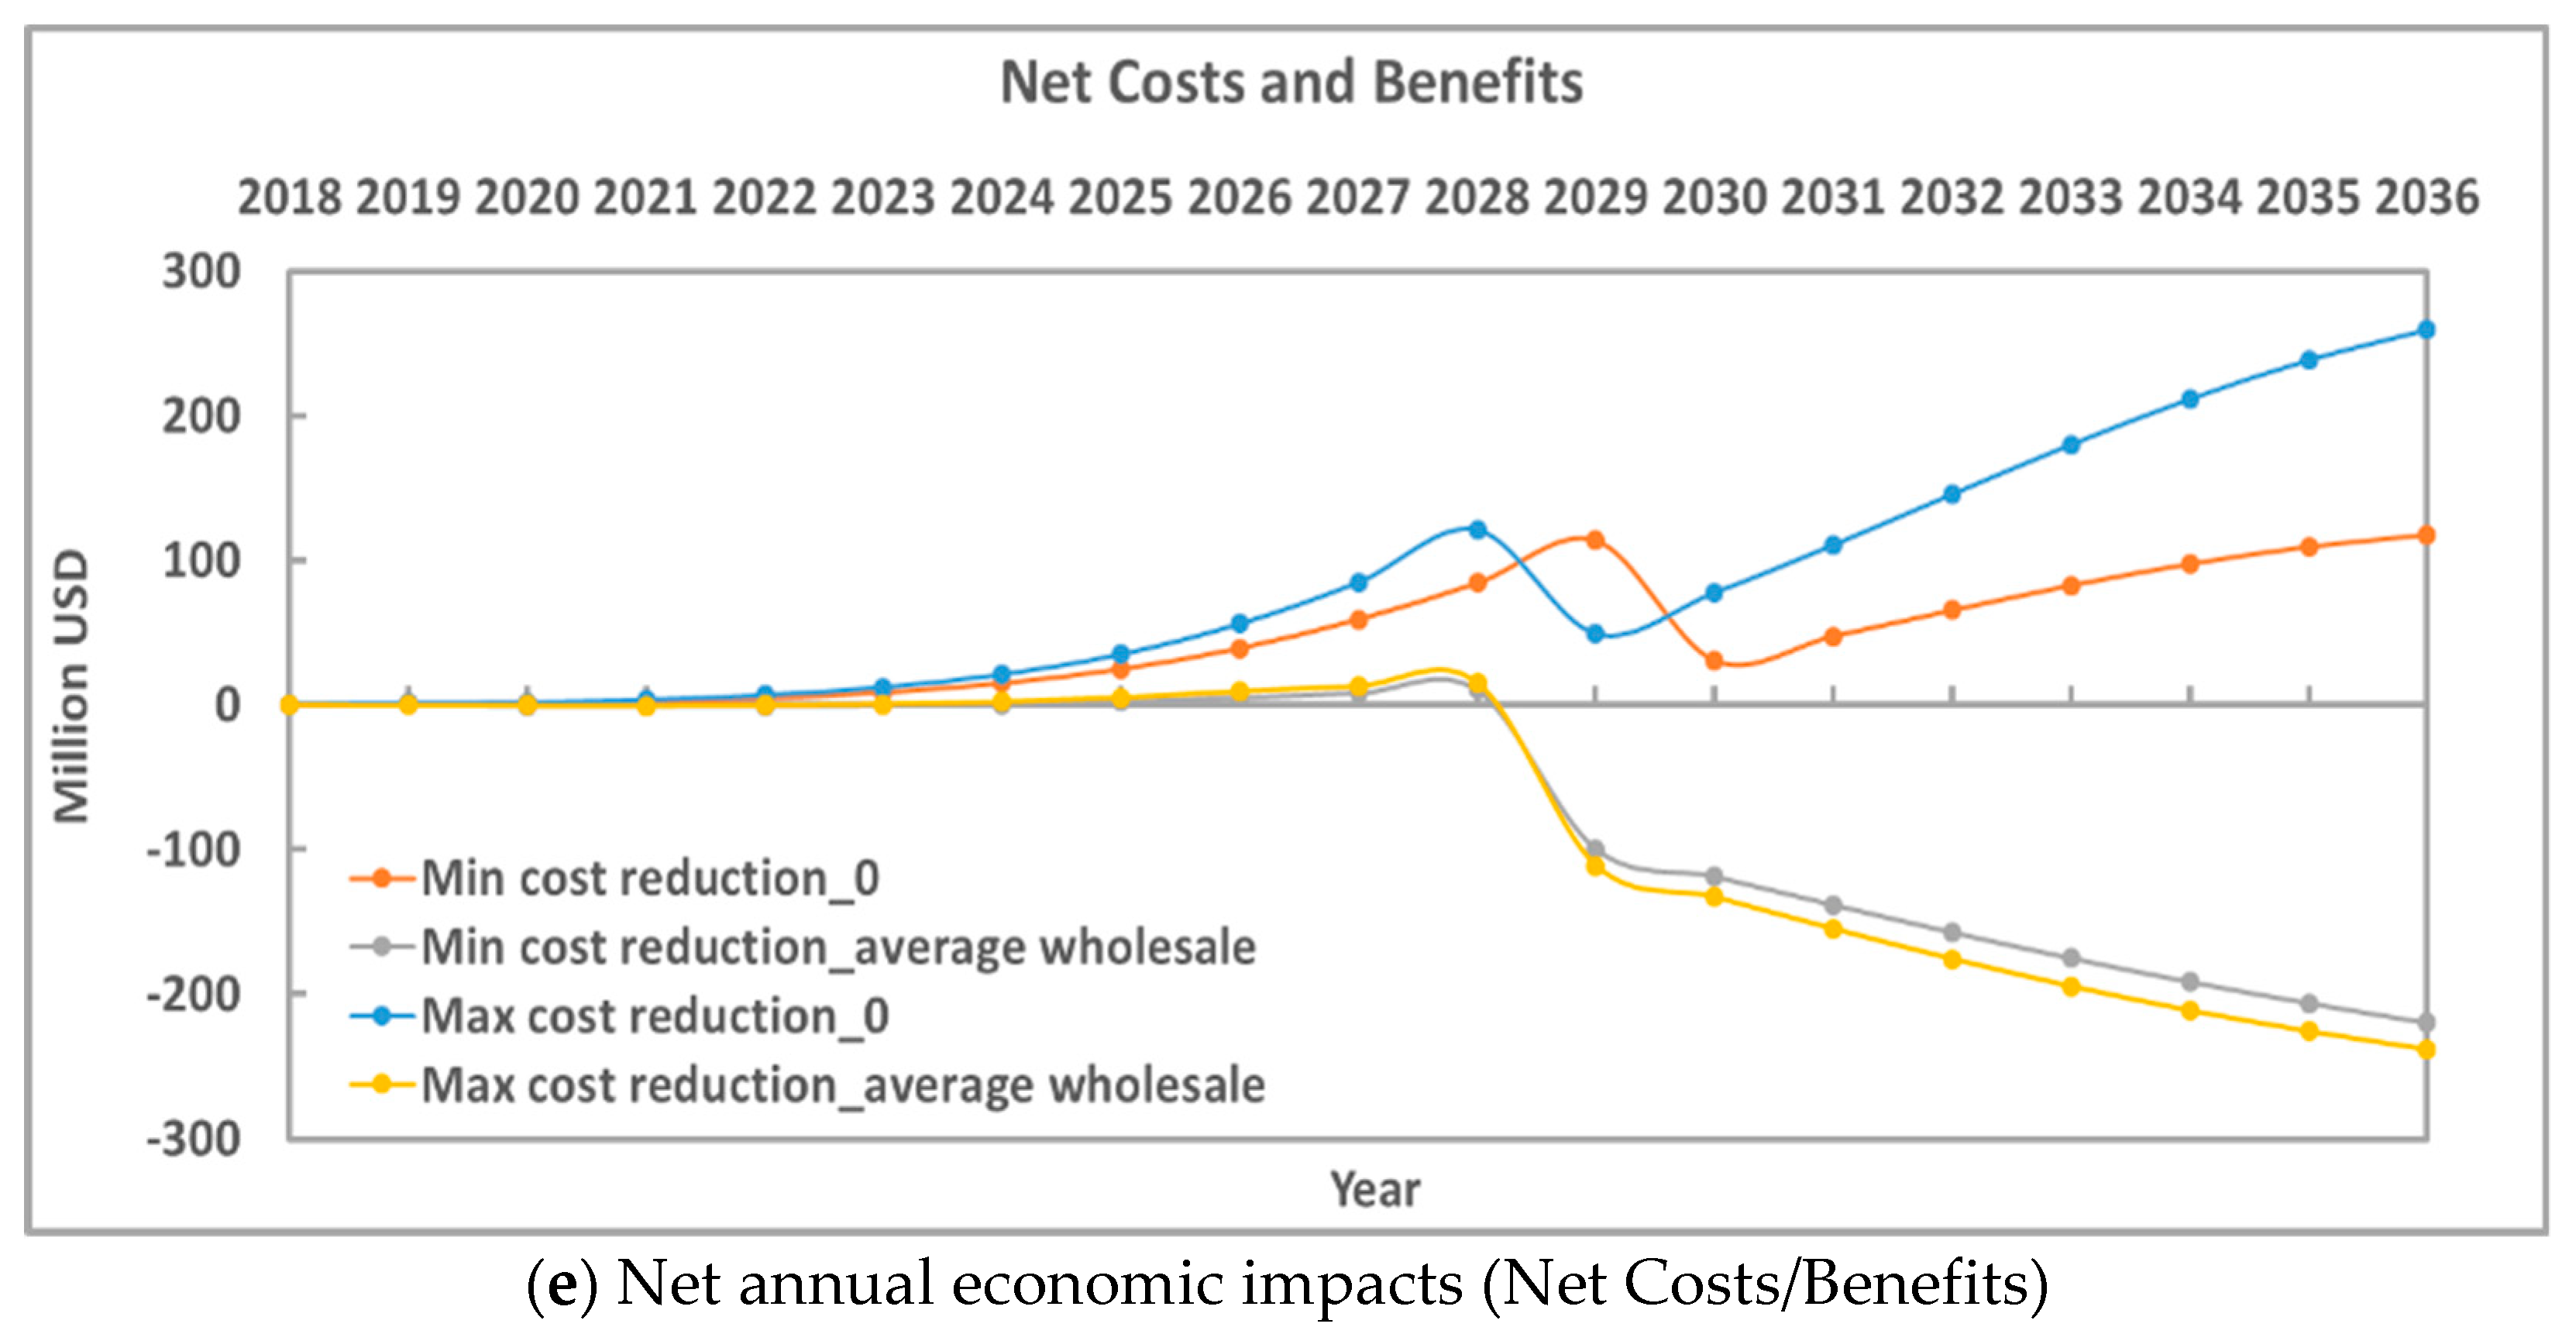
4.1.1. Minimum and Maximum Cost Reduction Scenarios
- −225 to −360 million USD (or approximately −1 to −2% of projected revenue in 2036 for MEA). (The negative percentages mean that the net costs are greater than the net benefits, while the positive percentages mean that the net benefits are greater than the net costs.);
- −238 to 259 million USD (or approximately −0.59% to 0.63% of projected revenue in 2036) for PEA;
- −4254 to −6537 million USD (or approximately 9 to 14% of projected revenue in 2036) for EGAT.
4.1.2. AEDP Scenario
4.2. Retail Rate Impacts
4.2.1. Minimum and Maximum Cost Reduction Scenarios
4.2.2. AEDP Scenario
5. Discussion
- The net economic impacts on utilities depend on the specific characteristics of each utility.
- With a low level of PV adoption, the net economic impacts and retail rates are minimal.
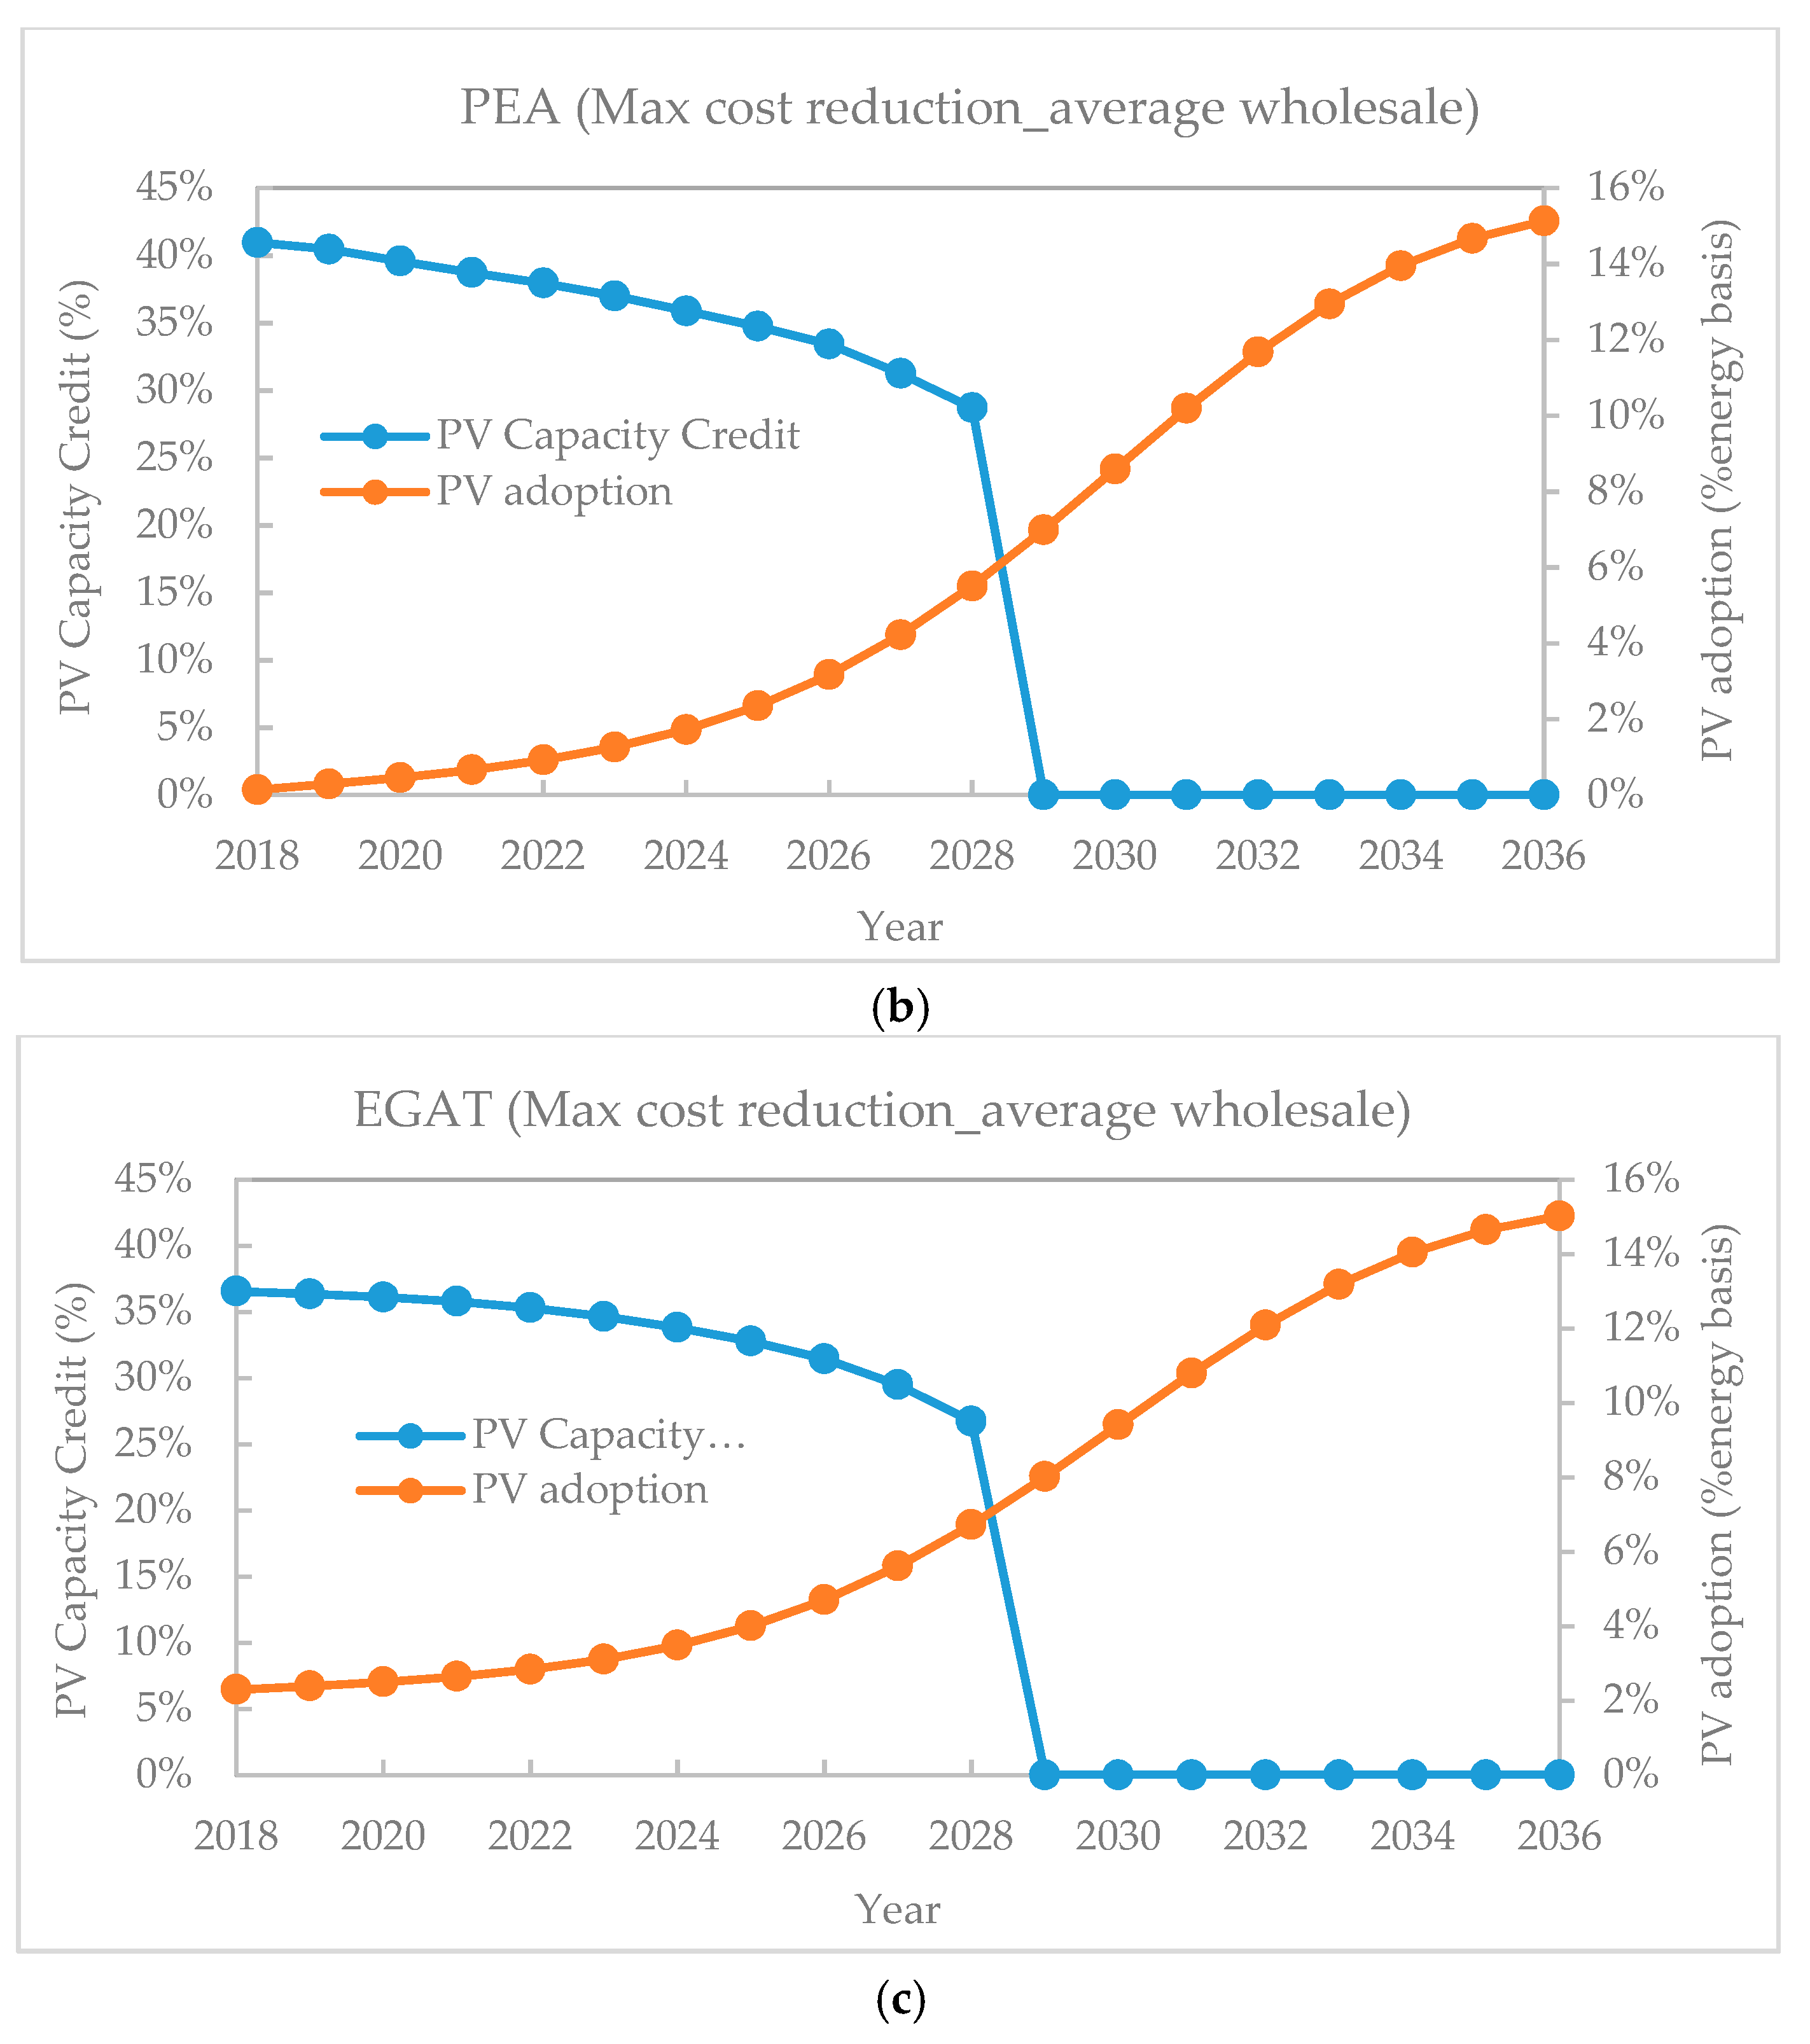
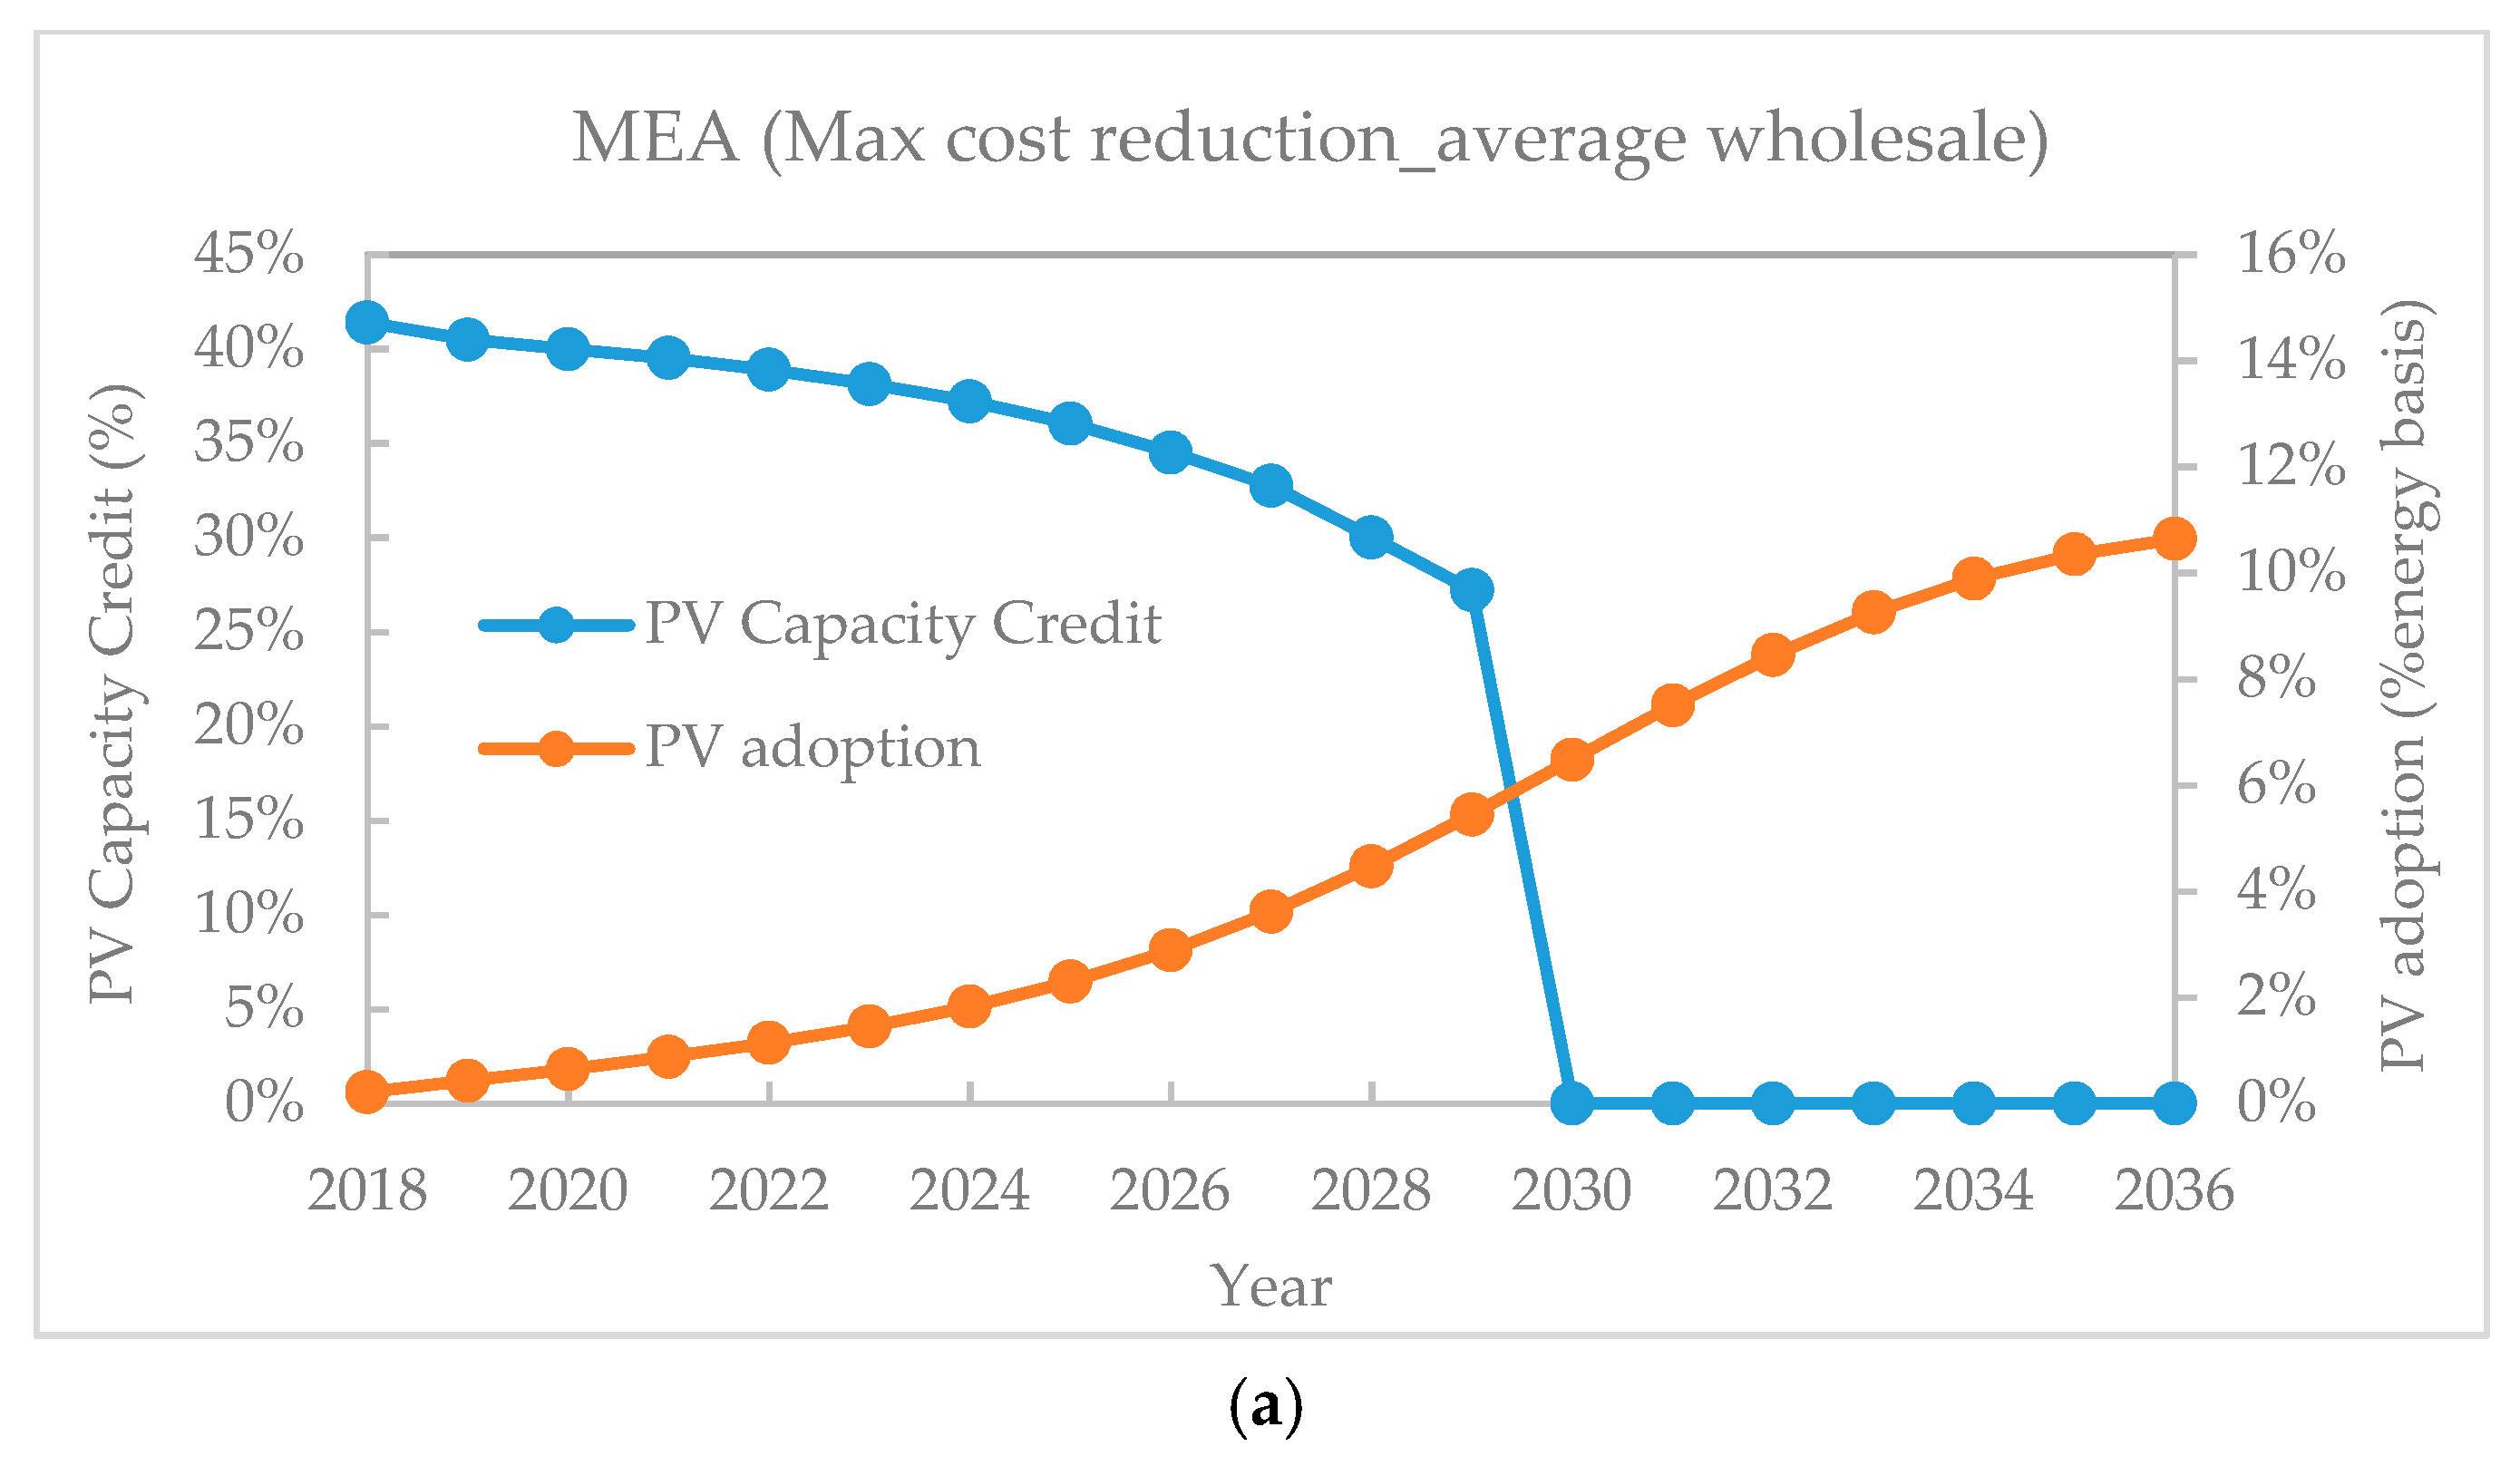
- Higher PV adoption influenced by higher buyback rates and higher PV installation cost reductions leads to higher net economic impacts and retail rates as the values of solar power decrease.
- As PV policies can help increase PV adoption and impact utilities and retail rates at the same time, it is necessary to seek a balance among the relevant stakeholders before proposing such a policy.
- There are also approaches to mitigating the impacts on utilities and ratepayers in terms of policy mechanisms, utility business models, and regulatory approaches on rate designs that require tradeoffs among the stakeholders.
6. Conclusions
Supplementary Materials
Author Contributions
Funding
Acknowledgments
Conflicts of Interest
References
- EPPO-Energy Policy and Planning Office. Alternative Energy Development Plan. Available online: https://bit.ly/2FIDnJt (accessed on 4 May 2018).
- GIZ-Deutsche Gesellschaft für Internationale Zusammenarbeit. Thailand Solar PV Policy Update 01/2017; Federal Ministry for Economic Affairs and Energy: Bangkok, Thailand, 2017.
- Tongsopit, S. Thailand’s Feed-in Tariff for Residential Rooftop Solar PV Systems: Progress so far. Energy Sustain. Dev. 2015, 29, 127–134. [Google Scholar] [CrossRef]
- International Energy Cooperation Center. News (Available in Thai). Available online: https://goo.gl/jnhPFZ (accessed on 11 October 2017).
- E3-Energy + Environmental Economics. California Net Energy Metering Ratepayer Impacts Evaluation; Energy + Environmental Economics: San Francisco, CA, USA, 2013. [Google Scholar]
- RMI- Rocky Mountain Institute. A Review of Solar PV Benefit & Cost Studies; Rocky Mountain Institute: Snowmass, CO, USA, 2013. [Google Scholar]
- Satchwell, A.; Mills, A.; Barbose, G. Quantifying the Financial Impacts of Net-metered PV on Utilities and Ratepayers. Energy Policy 2015, 80, 133–144. [Google Scholar] [CrossRef]
- Richter, M. Utilities’ Business Models for Renewable Energy: A Review. Renew. Sust. Energy Rev. 2012, 16, 2483–2493. [Google Scholar] [CrossRef]
- Kroze, Y. Cost and Benefit of Renewable Energy in the European Union. Renew. Energy 2013, 50, 68–73. [Google Scholar] [CrossRef]
- Pikas, E.; Kurnitski, J.; Thalfeldt, M.; Koskela, L. Cost-benefit Analysis of nZEB Energy Efficiency Strategies with On-site Photovoltaic Generation. Energy 2017, 128, 291–301. [Google Scholar] [CrossRef]
- Leurent, M.; Costa, P.D.; Rama, M.; Persson, U.; Jasserand, F. Cost-benefit Analysis of District Heating Systems Using Heat from Nuclear Plants in Seven European countries. Energy 2018, 149, 454–472. [Google Scholar] [CrossRef]
- E3-Energy + Environmental Economics. Nevada Net Energy Metering Impacts Evaluation; Energy + Environmental Economics: San Francisco, CA, USA, 2014. [Google Scholar]
- CPR-Clean Power Research. The Value of Distributed Photovoltaics to Austin Energy and the City of Austin; Clean Power Research: Austin, TX, USA, 2006. [Google Scholar]
- Keyes, J.; Rabago, K. A Regulator’s Guidebook: Calculating the Benefits and Costs of Distributed Solar Generation; Interstate Renewable Energy Council, Inc.: Latham, NY, USA, 2013. [Google Scholar]
- Xcel Energy, Inc. Costs and Benefits of Distributed Solar Generation on the Public Service Company of Colorado System; Excel Energy, Inc.: Minneapolis, MN, USA, 2013. [Google Scholar]
- APPA-American Public Power Association. Solar Photovoltaic Power: Assessing the Benefits &Costs; American Public Power Association: Washington, DC, USA, 2014. [Google Scholar]
- Denholm, P.; Margolis, R.; Palmintier, B.; Barrows, C.; Ibanez, E.; Bird, L.; Zuboy, J. Methods for Analyzing the Benefits and Costs of Distributed Photovoltaic Generation; National Renewable Energy Laboratory: Golden, CO, USA, 2014.
- Tongsopit, S.; Zinaman, O.R.; Darghouth, N.R. Understanding the Impact of Distributed Photovoltaic Adoption on Utility Revenues and Retail Tariffs in Thailand; USAID Clean Power Asia: Bangkok, Thailand, 2017. [Google Scholar]
- Chaianong, A.; Bangviwa, A.; Menke, C. Forecast of Rooftop PV Adoption in Bangkok, Thailand. In Proceedings of the 41st IAEE International Conference, Groningen, The Netherlands, 10–13 June 2018. [Google Scholar]
- Chaianong, A.; Tongsopit, S.; Bangviwat, A.; Menke, C. Bill Saving Analysis of Rooftop PV Customers and Policy Implications for Thailand. Renew. Energy 2019, 131, 422–434. [Google Scholar] [CrossRef]
- Tongsopit, S.; Julakarn, S.; Wibulpolprasert, W.; Chaianong, A.; Kokchang, P.; Hoang, N.V. The Economics of Solar PV Self-consumption in Thailand. Renew. Energy 2019, 138, 395–408. [Google Scholar] [CrossRef]
- Chaianong, A.; Bangviwat, A.; Menke, C. A Framework for Evaluating Economic Impacts of Rooftop PV Systems with or Without Energy Storage on Thai Distribution Utilities and Ratepayers. In IOP Conference Series: Earth and Environmental Science; IOP Publishing: Bristol, UK, 2017. [Google Scholar]
- Ministry of Energy. Thailand Power Development Plan 2015–2036. Available online: https://bit.ly/2JVMXet (accessed on 4 May 2018).
- Frew, B. 8760-Based Method for Representing Variable Generation Capacity Value in Capacity Expansion Models; National Renewable Energy Laboratory: Golden, CO, USA, 2017.
- EGAT-Energy Generating Authority of Thailand. EGAT’s Article (in Thai). Available online: https://goo.gl/ttUJmr (accessed on 15 May 2018).
- Wiser, R.; Mills, A.; Seel, J.; Levin, T.; Botterud, A. Impacts of Variable Renewable Energy on Bulk Power System Assets, Pricing and Costs; Lawrence Berkeley National Laboratory and Argonne National Laboratory: Berkeley, CA, USA, 2017.
- Sensfuß, F.; Ragwitz, M.; Genoese, M. The Merit-order Effect: A Detailed Analysis of the Price Effect of Renewable Electricity Generation on Spot Market Prices in Germany. Energy Policy 2008, 36, 3086–3094. [Google Scholar] [CrossRef]
- Seel, J.; Mill, A.; Wiser, R. Impacts of High Variable Renewable Energy Futures on Wholesale Electricity Prices, and on Electric-Sector Decision Making; Lawrence Berkley National Laboratory: Berkeley, CA, USA, 2018.
- Thakur, J.; Rauner, S.; Darhougth, N.R.; Chakraborty, B. Exploring the Impact of Increased Solar Deployment Levels on Residential Electricity Bills in India. Renew. Energy 2018, 120, 512–523. [Google Scholar] [CrossRef]
- IEA-PVPS—International Energy Agency-Photovoltaic Power Systems Program. Review and Analysis of PV Self-Consumption Policies; IEA Photovoltaic Power Systems Program; IEA: Paris, France, 2016. [Google Scholar]
- Frantzis, L.; Graham, S.; Katofsky, R.; Sawyer, H. Photovoltaic Business Models; National Renewable Energy Laboratory: Golden, CO, USA, 2008.
- RMI-Rocky Mountain Institute. Net Energy Metering, Zero Net Energy and the Distributed Energy Resource Future: Adapting Electric Utility Business Models for the 21st Century; RMI: Snowmass, CO, USA, 2012. [Google Scholar]
- Richter, M. German Utilities and Distributed PV: How to Overcome Barriers to Business Model Innovation. Renew. Energy 2013, 55, 456–466. [Google Scholar] [CrossRef]
- Satchwell, A.; Mills, A.; Barbose, G. Regulatory and Ratemaking Approaches to Mitigate Financial Impacts of Net-metered PV on Utilities and Ratepayers. Energy Policy 2015, 85, 115–125. [Google Scholar] [CrossRef]
- Satchwell, A.; Cappers, P.; Schwartz, L.; Fadrhonc, E.M. A Framework for Organizing Current and Future Electric Utility Regulatory and Business Models; Lawrence Berkeley National Laboratory: Berkeley, CA, USA, 2015.
- Barbose, G.; Miller, J.; Sigrin, B.; Reiter, E.; Cory, K.; McLaren, J.; Seel, J.; Mills, A.; Darghouth, N.R.; Satchwell, A. On the Path to Sunshot: Utility Regulatory and Business Model. Reforms for Addressing the Financial Impacts of Distributed Solar on Utilities; National Renewable Energy Laboratory: Golden, CO, USA, 2016.
- Utility Dive. 2018 State of the Electric Utility; Utility Dive: Washington, DC, USA, 2018. [Google Scholar]
- PEA-Provincial Electricity Authority. PEA’s Article (Thai). Available online: https://bit.ly/2wh9u3q.2017 (accessed on 4 May 2018).
- The Regulatory Assistance Project. Performance-Based Regulation for Distribution Utilities; The Regulatory Assistance Project for the National Association of Regulatory Utility Commissioners; National Association of Regulatory Utility Commissioners: Washington, DC, USA, 2000. [Google Scholar]
- IRENA-International Renewable Energy Agency. Battery Storage for Renewables: Market. Status and Technology Outlook; International Renewable Energy Agency: Abu Dhabi, UAE, 2015. [Google Scholar]
- Kittner, N.; Lill, F.; Kammen, D.M. Energy Storage Development and Innovation for the Clean Energy Transition. Nat. Energy 2017, 2, 17125. [Google Scholar] [CrossRef]


| Groups | PV System Size (kW) |
|---|---|
| Residential scale (RES) | 5 |
| Small general service (SGS) | 5 |
| Medium general service (MGS) | 100 |
| Large general service (LGS) | 1000 |
| Utility | Maximum Forecasts of PV Adoption (MW) | |||||||
|---|---|---|---|---|---|---|---|---|
| Min. Cost Reduction_0 | Min. Cost Reduction_1 | Min. Cost Reduction_2 | Min. Cost Reduction_Average Wholesale | Max. Cost Reduction_0 | Max. Cost Reduction_1 | Max. Cost Reduction_2 | Max. Cost Reduction_Average Wholesale | |
| MEA | 5946 | 6066 | 6185 | 6256 | 7483 | 7618 | 7749 | 7827 |
| PEA | 18,668 | 19,836 | 20,984 | 21,671 | 25,345 | 26,688 | 28,003 | 28,778 |
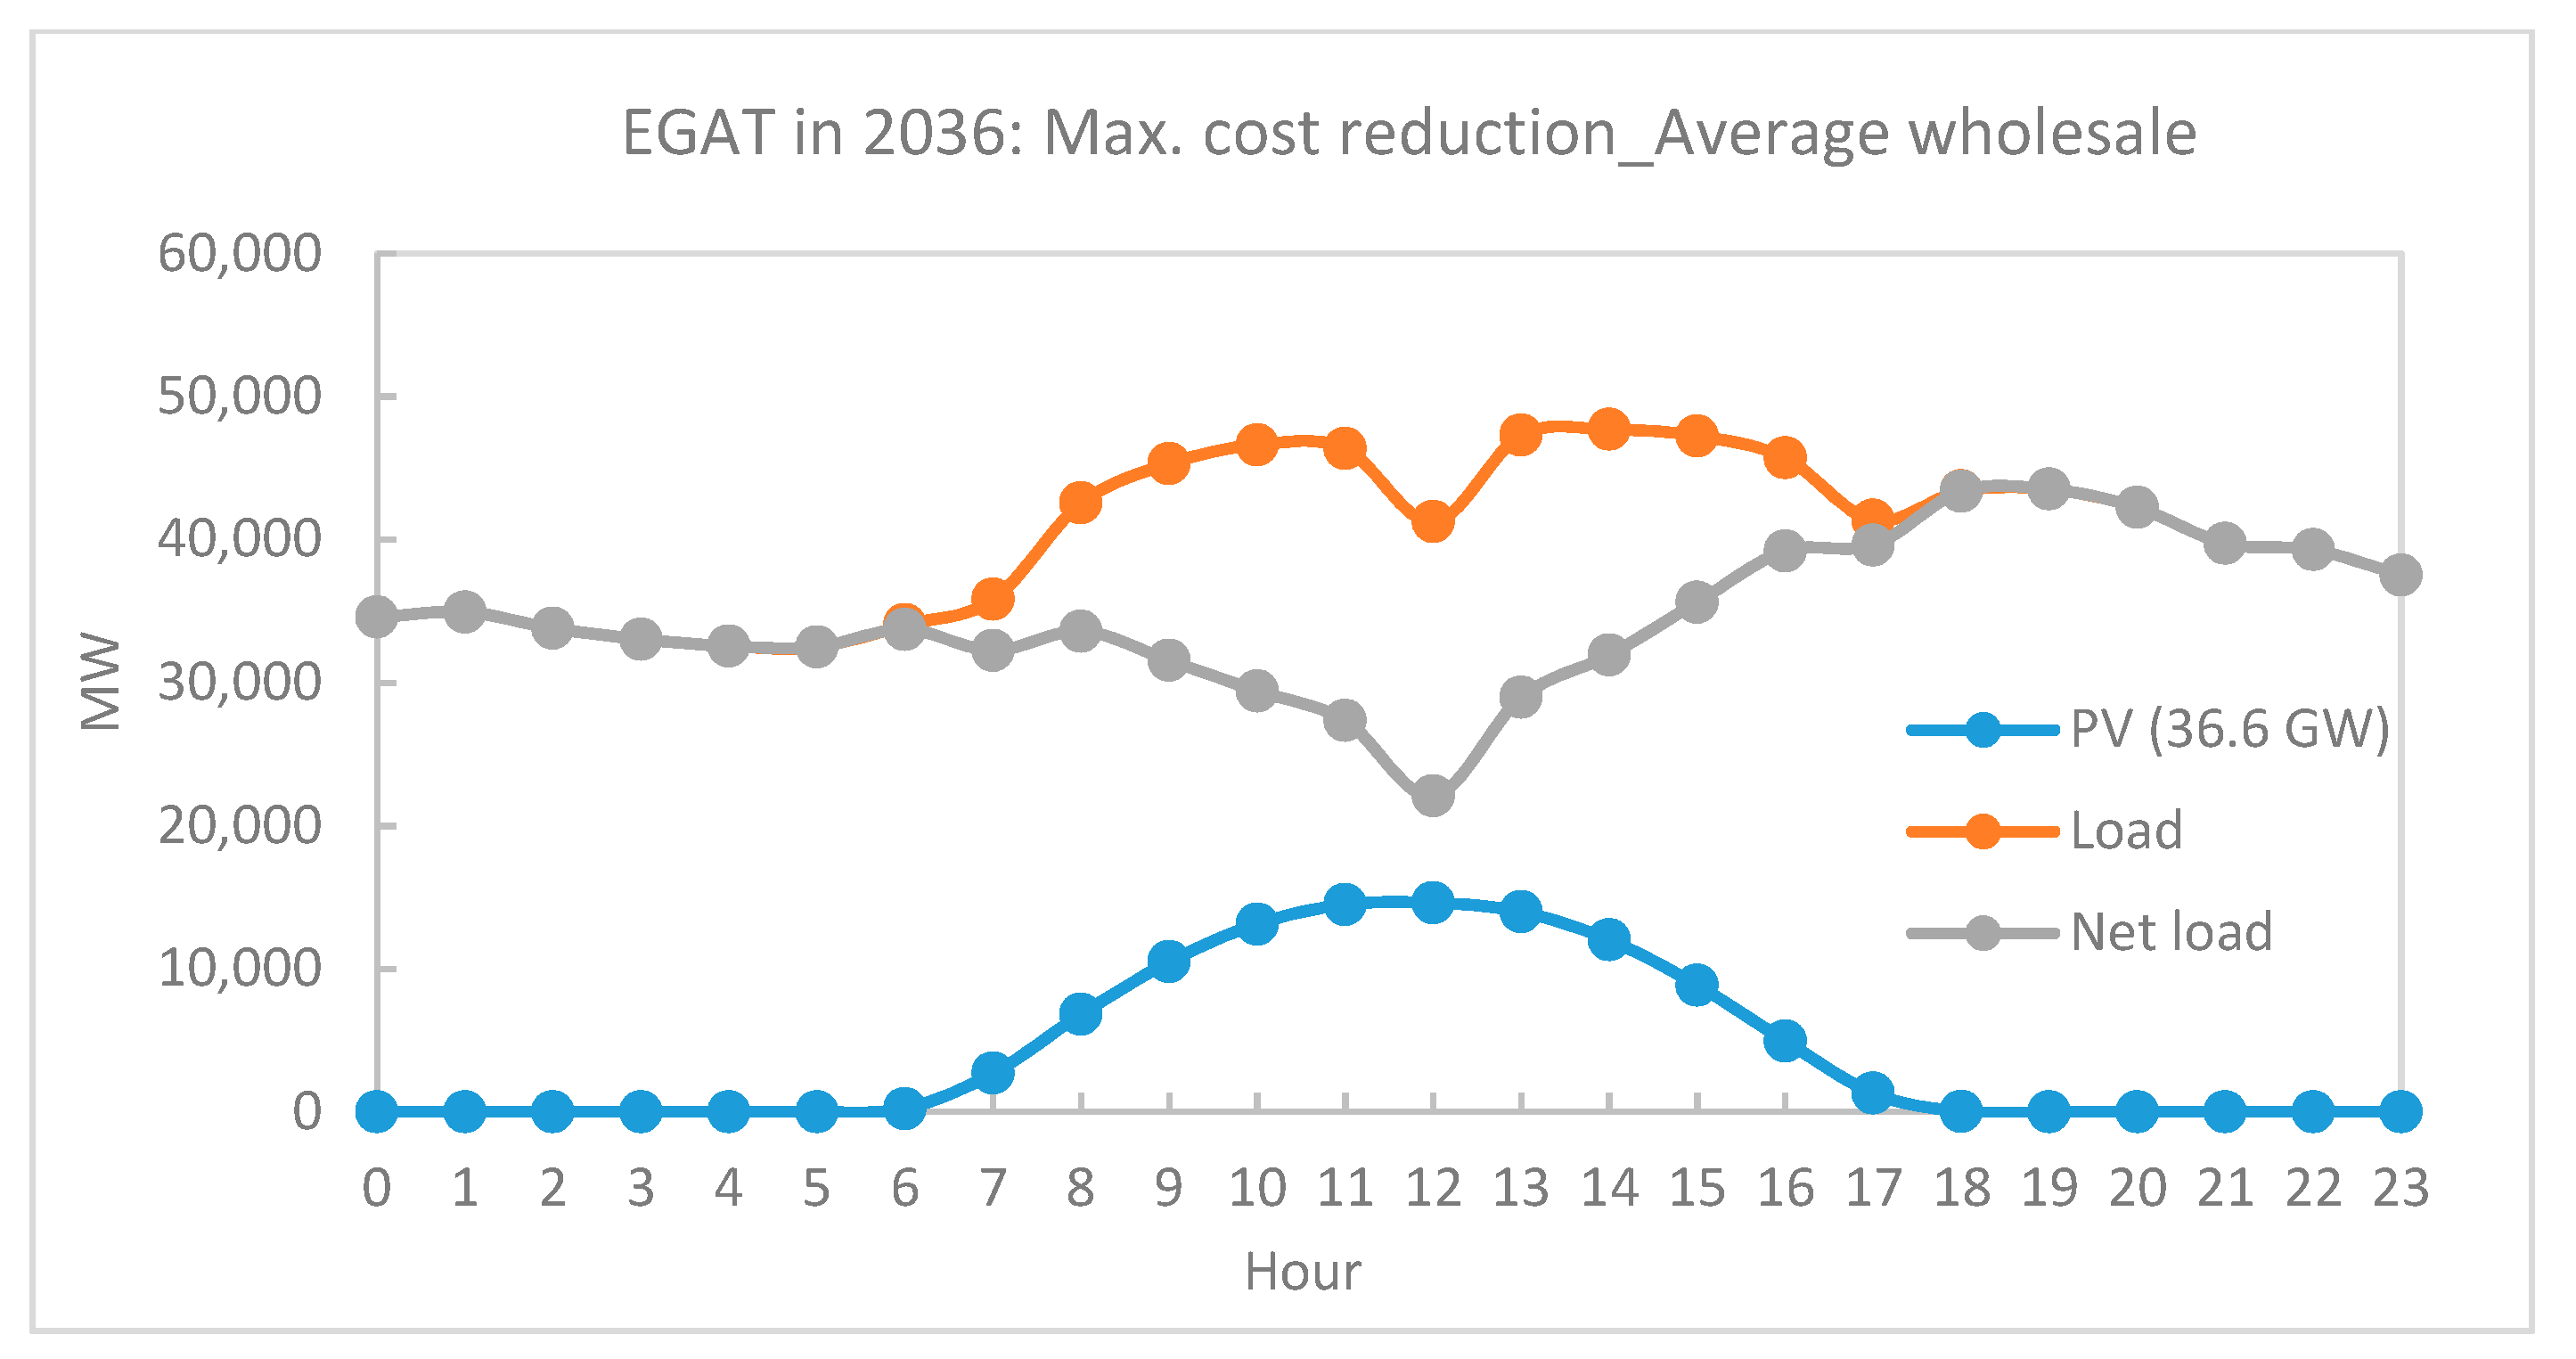
| Total | 24,614 | 25,902 | 27,169 | 27,927 | 32,828 | 34,306 | 35,752 | 36,605 |
| % PV adoption (country level; energy basis) | 9.3% | 9.8% | 10.3% | 10.6% | 12.4% | 13.0% | 13.6% | 13.9% |
| Benefits | Costs | |
|---|---|---|
| Distribution utilities (MEA/PEA) | - Avoided Electricity Generating Authority of Thailand (EGAT) purchases =Total PV generation × Weighted average wholesale price during solar production hours. (It equals to 3.05 THB/kWh as of 2017—during solar production hours, it is mostly on-peak period on weekdays while it is off-peak period on weekends.) - Avoided cost of distribution (D) loss = Avoided EGAT purchases due to self-consumption × % Distribution line loss - Avoided cost of distribution (D) capacity = Deferred investment cost due to decreases in peak demand × % utility interest rate - Resale margin of exported PV = (Excess generation) × (Average wholesale rate − Export rate) | - Revenue loss from lower customer sales - Integration cost (For MEA and PEA, the integration costs are related to distribution system upgrades and balancing issues to accommodate PV.) |
| Benefits | Costs | |
|---|---|---|
| Generation/Transmission utilities (EGAT) | - Avoided cost of energy = Total PV generation × % Energy mix × Fuel price × Heat rate × Value Factor - Avoided cost of transmission (T) loss = Avoided energy × % Transmission line loss - Avoided cost of generation/transmission (G/T) capacity = Deferred investment cost due to decreases in peak demand × % utility interest rate - Avoided cost of reserve = Avoided cost of G/T capacity × % reserve | - Revenue loss from fewer sales to distribution utilities (MEA/PEA) = Total PV generation × Weighted average wholesale price during solar production hours - Integration cost (For EGAT, the integration costs are related to generation and transmission system upgrades as well as balancing and power back-up issues to accommodate PV.) |
| Utility | Net Economic Impacts in 2036 (million USD) | |||||||
|---|---|---|---|---|---|---|---|---|
| Min. Cost Reduction_0 | Min. Cost Reduction_1 | Min. Cost Reduction_2 | Min. Cost Reduction_Average Wholesale | Max. Cost Reduction_0 | Max. Cost Reduction_1 | Max. Cost Reduction_2 | Max. Cost Reduction_Average Wholesale | |
| MEA | −225 (−1.34%) | −245 (−1.47%) | −268 (−1.60%) | −291 (−1.74%) | −273 (−1.67%) | −301 (−1.84%) | −330 (2.02%) | −360 (2.21%) |
| PEA | 118 (0.28%) | 33 (0.08%) | −75 (−0.18%) | −220 (−0.53%) | 259 (0.63%) | 127 (0.31%) | −34 (−0.08%) | −238 (−0.59%) |
| EGAT | −4254 (8.92%) | −4535 (-9.51%) | −4816 (−10.10%) | −4987 (10.46%) | −5674 (−11.90%) | −6006 (−12.60%) | −6338 (−13.29%) | −6537 (−13.71%) |
| Utility | Net Economic Impacts in 2025 (million USD) | % Net Economic Impacts to Projected Revenue in 2025 |
|---|---|---|
| MEA | −5 | −0.05% |
| PEA | 19 | 0.09% |
| EGAT | −150 | −0.65% |
| Year | Retail Rate Impact (USD/kWh) | |||||||
|---|---|---|---|---|---|---|---|---|
| Min. Cost Reduction_0 | Min. Cost Reduction_1 | Min. Cost Reduction_2 | Min. Cost Reduction_Average Wholesale | Max. Cost Reduction_0 | Max. Cost Reduction_1 | Max. Cost Reduction_2 | Max. Cost Reduction_Average Wholesale | |
| 2018–2022 | 0.0001 (0.1%) | 0.0001 (0.1%) | 0.0001 (0.1%) | 0.0001 (0.1%) | 0.0001 (0.1%) | 0.0001 (0.1%) | 0.0001 (0.1%) | 0.0002 (0.1%) |
| 2023–2027 | 0.001 (0.6%) | 0.001 (0.6%) | 0.001 (0.7%) | 0.001 (0.8%) | 0.001 (0.6%) | 0.001 (0.7%) | 0.001 (0.8%) | 0.001 (0.9%) |
| 2028–2032 | 0.005 (3.1%) | 0.006 (3.6%) | 0.006 (4.0%) | 0.007 (4.3%) | 0.007 (4.3%) | 0.008 (4.8%) | 0.009 (5.3%) | 0.009 (5.8%) |
| 2033–2036 | 0.012 (6.4%) | 0.013 (7.1%) | 0.014 (7.8%) | 0.015 (8.3%) | 0.016 (8.6%) | 0.017 (9.5%) | 0.019 (10.4%) | 0.020 (11.1%) |
| Period | 5-Year Retail Rate Impacts (USD/kWh) | Change in Projected Retail Rate (%) |
|---|---|---|
| 2018–2022 | 0.0001 (0.004 THB/kWh) | 0.1% |
| 2023–2025 | 0.0004 (0.02 THB/kWh) | 0.4% |
© 2019 by the authors. Licensee MDPI, Basel, Switzerland. This article is an open access article distributed under the terms and conditions of the Creative Commons Attribution (CC BY) license (http://creativecommons.org/licenses/by/4.0/).
Share and Cite
Chaianong, A.; Bangviwat, A.; Menke, C.; Darghouth, N.R. Cost–Benefit Analysis of Rooftop PV Systems on Utilities and Ratepayers in Thailand. Energies 2019, 12, 2265. https://doi.org/10.3390/en12122265
Chaianong A, Bangviwat A, Menke C, Darghouth NR. Cost–Benefit Analysis of Rooftop PV Systems on Utilities and Ratepayers in Thailand. Energies. 2019; 12(12):2265. https://doi.org/10.3390/en12122265
Chicago/Turabian StyleChaianong, Aksornchan, Athikom Bangviwat, Christoph Menke, and Naïm R. Darghouth. 2019. "Cost–Benefit Analysis of Rooftop PV Systems on Utilities and Ratepayers in Thailand" Energies 12, no. 12: 2265. https://doi.org/10.3390/en12122265
APA StyleChaianong, A., Bangviwat, A., Menke, C., & Darghouth, N. R. (2019). Cost–Benefit Analysis of Rooftop PV Systems on Utilities and Ratepayers in Thailand. Energies, 12(12), 2265. https://doi.org/10.3390/en12122265