Article

Forecasting Corporate Failure in the Chinese Energy Sector: A Novel Integrated Model of Deep Learning and Support Vector Machine

1
School of Business, Jiangnan University, Wuxi 214122, China
2
China Research Institute of Enterprise Governed by Law, Southwest University of Political Science and Law, Chongqing 401120, China
*
Author to whom correspondence should be addressed.
Energies 2019, 12(12), 2251; https://doi.org/10.3390/en12122251
Submission received: 20 May 2019 / Revised: 9 June 2019 / Accepted: 11 June 2019 / Published: 12 June 2019

Abstract

:
Accurate forecasts of corporate failure in the Chinese energy sector are drivers for both operational excellence in the national energy systems and sustainable investment of the energy sector. This paper proposes a novel integrated model (NIM) for corporate failure forecasting in the Chinese energy sector by considering textual data and numerical data simultaneously. Given the feature of textual data and numerical data, convolutional neural network oriented deep learning (CNN-DL) and support vector machine (SVM) are employed as the base classifiers to forecast using textual data and numerical data, respectively. Subsequently, soft set (SS) theory is applied to integrate outputs of CNN-DL and SVM. Hence, NIM inherits advantages and avoids disadvantages of CNN-DL, SVM, and SS. It is able to improve the forecasting performance by taking full use of textual data and numerical data. For verification, NIM is applied to the real data of Chinese listed energy firms. Empirical results indicate that, compared with benchmarks, NIM demonstrates superior performance of corporate failure forecasting in the Chinese energy sector.

1. Introduction

Energy is an essential material basis for human survival and development. Along with economic development and social progress in China, large amounts of investments are required in the energy sector to meet the increasing needs of energy. According to the estimation of the International Energy Agency, China will be the world’s largest consumer of energy by 2040, accounting for 22% [1]. This means that one trillion dollars should be invested in the energy sector in China. Meanwhile, the Chinese energy sector is experiencing challenges due to the geopolitical uncertainty [2]. To address concerns of climate changes, the Chinese energy sector is also working for national energy policies and actions of strengthening energy security and sustainability. Hence, it is of great significance to keep investing in the Chinese energy sector. However, it suffers high risks.
As main operators and investment targets, the financial performance of energy corporates has attracted tremendous interest from both practitioners and academic researchers recently [3,4], for the financial and the social damage inflicted by energy corporate failure cannot be overstated [2]. More specifically, energy corporate failure, in which the firm is legally bankrupt or cannot pay for bills, etc. [5], not only makes investors and energy firms suffer huge economic losses but also brings strong negative impacts on both national economies and society stability.
Fortunately, it is generally believed that symptoms of corporate failure can be detected before a firm encounters a failure [6]. Through the accurate corporate failure forecasting, which is an excellent tool to distinguish firms in failure from normal ones, investors and creditors can obtain timely warnings of energy corporate failure risks. Since the early research in the 1960s [7], there has been a great deal of literature researching corporate failure forecasting [8]. Prior studies routinely adopt accounting data from the financial statements to forecast corporate failure. For example, Xu et al. [9], Hosaka [10], Li et al. [11], etc., have demonstrated that accounting based financial ratios can offer signals to forecast corporate failure effectively. At the same time, given the high cost of corporate failure events, many forecasting methods have been proposed for corporate failure forecasting, including discriminant analysis [7], logistic regression [12], neural networks [10], genetic algorithm [13], decision tree [14], support vector machine [15], rough set [16], and deep learning [17], to name a few. To improve the forecasting performance, various integrated methods developed based on the basis classifiers above have also been proposed for corporate failure forecasting [18]. Past studies above have established the foundation for corporate failure forecasting.
A common element of most of the above research is adopting firms from different sectors as samples simultaneously [19]. It is well known that the character of corporates in different sectors is quite different [20]. Recently, researchers have paid more attention to the corporate failure forecasting in a specific sector, such as commercial banks distress prediction [21], bankruptcy forecasting in the agribusiness sector [22], manufacturing firms financial distress forecasting [23], hospitality firm failure prediction [11,24], etc. Up to date, to the best of our knowledge, only Doumpos et al. [2] has explored corporate failure forecasting in the energy sector. While their samples were collected from developed European countries, little attention has been paid to corporate failure forecasting in the Chinese energy sector. This motivates us to explore this work.
Another common element of most studies above is that they adopt financial ratios to forecast corporate failure. Recent studies have demonstrated that textual data, such as national policies, news, reports, etc., have high discriminating power in forecasting business failure [17], for textual data may contain some valuable risk information [25]. These data can play a key role in corporate failure forecasting in the Chinese energy sector as the complement of financial ratios. For example, in China, energy firms are seriously impacted by national policies [26]. Chinese listed energy firms always present the impact and related actions in the annual report. However, textual data are qualitative data. Financial ratios are quantitative data. It is a big challenge to effectively integrate textual data with financial ratios for energy corporate failure forecasting due to different formats and qualifying the textual data. Here, we tackle this challenge.
In this framework, the aim of this paper is to propose a novel integrated model (NIM) for corporate failure forecasting in the Chinese energy sector by considering numerical data and textual data simultaneously. It integrates convolutional neural network oriented deep learning (CNN-DL) and support vector machine (SVM) based on the soft set theory (SS). CNN-DL has theoretically proven to be an excellent tool for textual data mining [27]. It is employed as a basis classifier to forecast with textual data. SVM is a widely accepted machine learning method in the field of corporate failure forecasting [28]. It is applied to forecast with numerical data as a basis classifier. SS, which is an advanced nonparametric method for dealing with high dimensions [29], is used to integrate outputs of CNN-DLs and SVMs. Therefore, the model NIM inherits advantages and avoids disadvantages of CNN-DL, SVM, and SS. This algorithm enables it to take full advantage of textual information and financial ratios to forecast corporate failure in the Chinese energy sector. We hope NIM produces a good performance.
To verify the performance of NIM, it is applied to real data of Chinese listed corporates in the energy sector. For comparison, the individual CNN-DL trained using textual data (CNN-DLT), the individual SVM trained using numerical data, the individual CNN-DL trained using textual data and numerical data (CNN-DLM), the integrated model with CNN-DLT and SVM based on the unanimous voting method (IMUV) [30], and the Dempster–Shafer evidence theory [31] (IMET) are included as benchmarks.
The important contributions of this study can be summarized as follows.
  • Compared to developed economies, energy investment in emerging economies climbs faster. Due to immature business environments, it is easier for energy firms in emerging economies to fail. It is significant to identify the failure as early as possible, though it is complex. To date, little attention has been paid to firm failure forecasting in the energy sector of emerging economies. This paper complements prior literature with new empirical evidence from China.
  • A novel integrated model is proposed for corporate failure forecasting in the Chinese energy sector. It integrates CNN-DL and SVM into SS. More specifically, CNN-DL is employed to forecast with textual data, SVM is applied to forecast with numerical data, and results of CNN-DL and SVM are integrated by SS. The algorithm enables NIM to effectively improve performance by taking full use of textual data and numerical data.
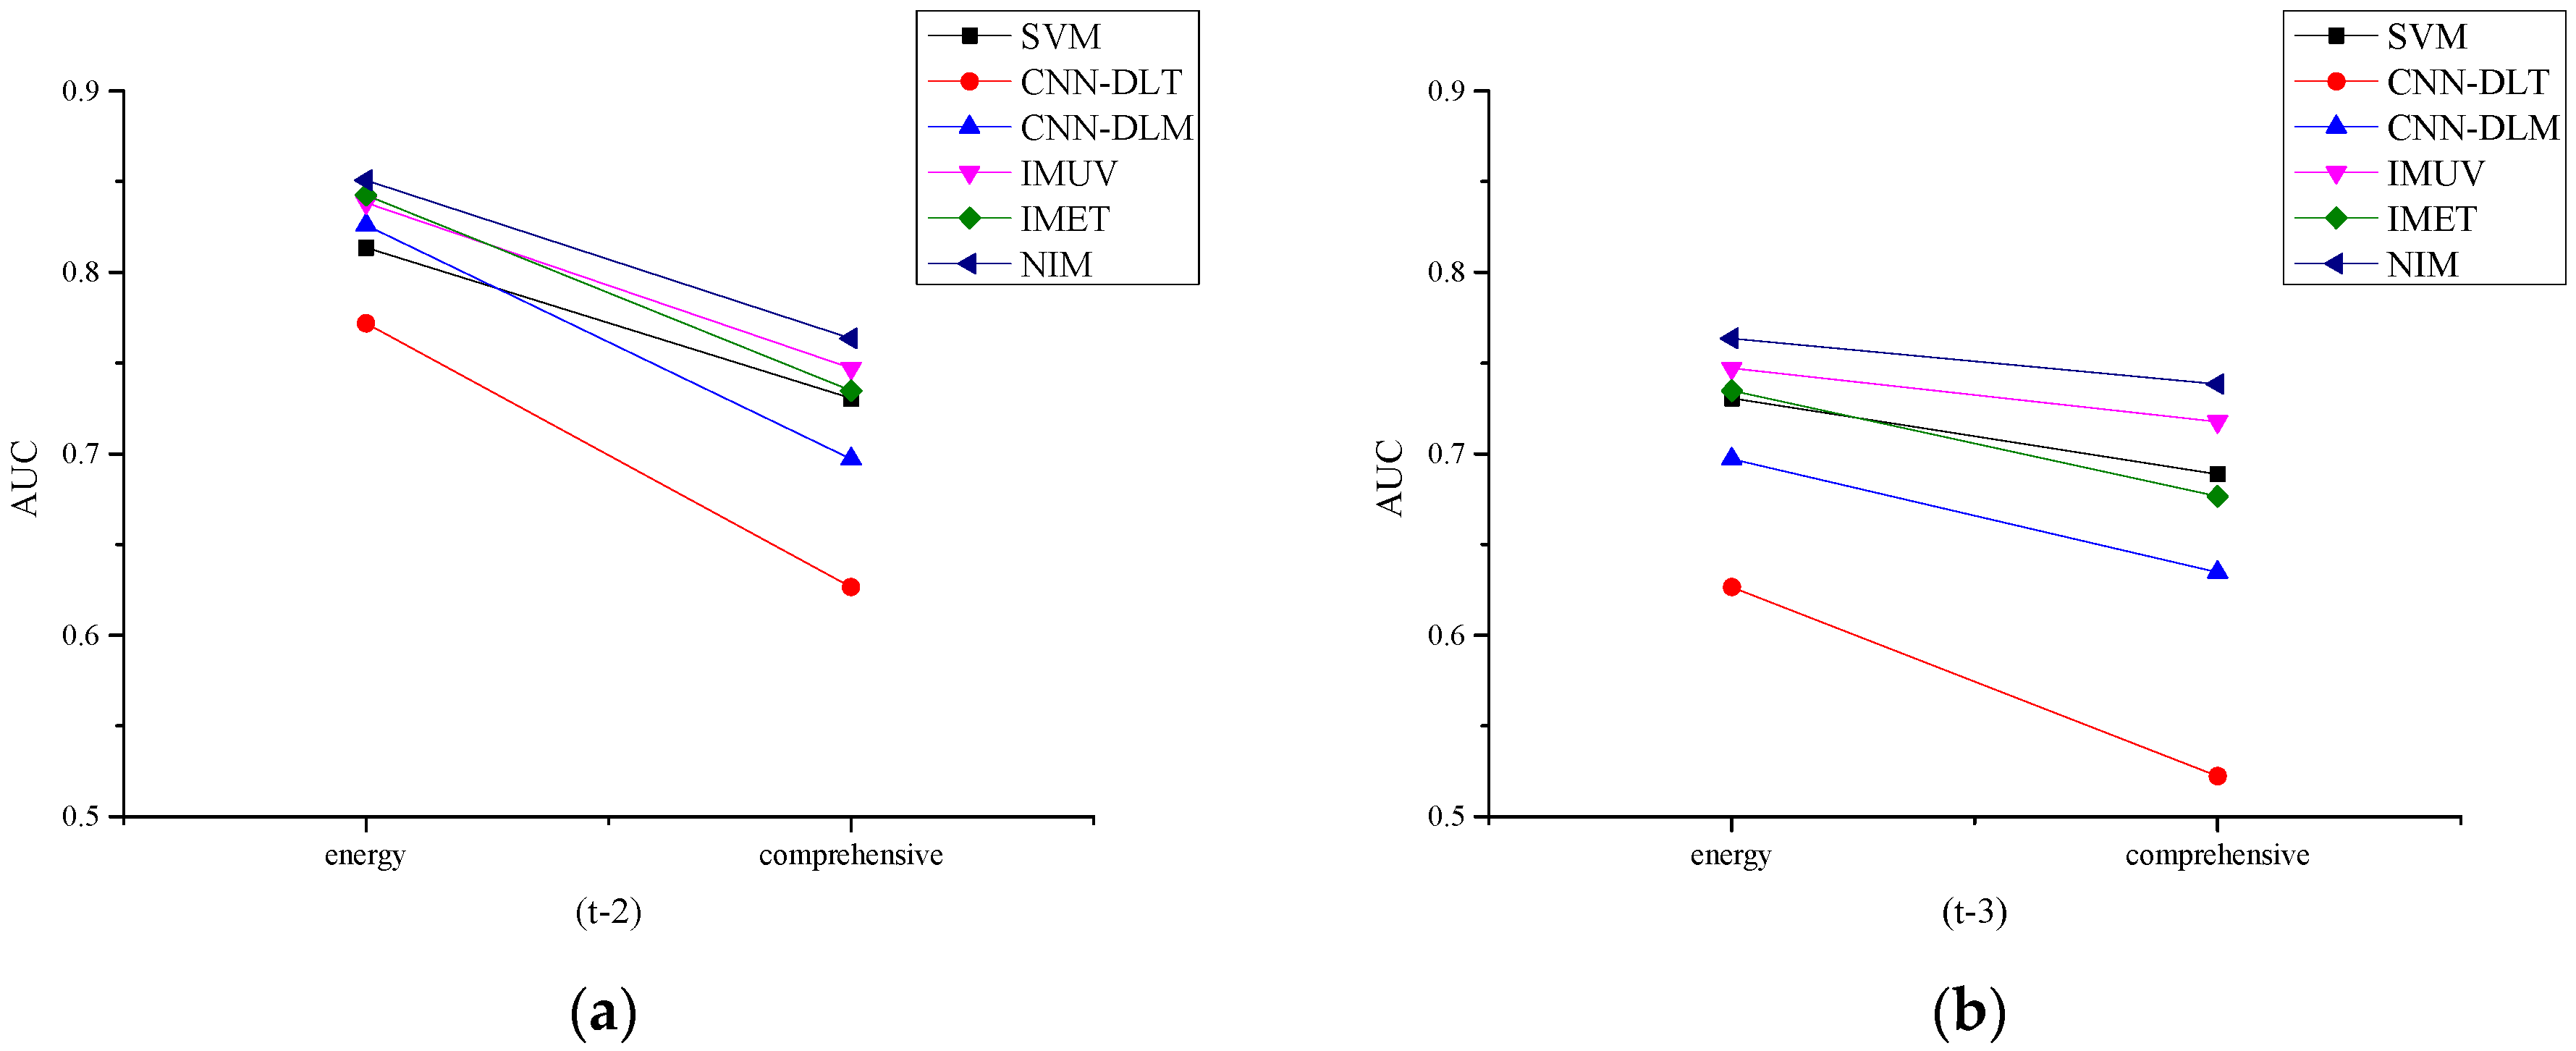
  • Empirical results demonstrate that textual data can play an important role in corporate failure forecasting in the Chinese energy sector as the complement of numerical data, but the validity is decreasing with a longer forecasting horizon.
The rest of this paper is organized as follows. Section 2 reviews the pertinent literature on corporate failure forecasting. In Section 3, we introduce the proposed NIM in detail. Section 4 presents the application of NIM to real data. Section 5 reports and compares empirical results. We conclude and discuss the future work in Section 6.

2. Literature Review

During past decades, some literature has reviewed corporate failure forecasting in detail, such as Sun et al. [5], Alaka et al. [20], Prusak [32], etc. Here, we briefly review more recent literature of corporate failure forecasting (shown as Table A1) and summarize the recent development as follows.
First, more and more studies have started to forecast corporate failure in a specific sector to improve forecasting performance in recent years because each sector has its characters, such as financial characters, organizational characters, environment characters, etc. [33]. However, past studies as those above mainly focus on a specific sector such as manufacture, bank, hotel, agribusiness, etc. [22,23,24,34]. Until now, to the best of our knowledge, only Doumpos et al. [2] has explored corporate failure forecasting in the energy sector. While their samples were collected from developed European, little attention has been paid to forecast corporate failure in the energy sector of developing economics.
Second, non-financial variables are being more widely applied for corporate failure forecasting recently, though financial ratios are still the most popular variables [9,20], such as market information, macroeconomic, industry information, and so on [2,24,34]. With the development of artificial intelligence, some literature has started to adopt textual data to forecast corporate failure [5,27,28]. It can be applied to forecast corporate failure as the complement of financial ratios.
Third, forecasting methods proposed by recent literature can be divided into two categories—individual models and integrated models. Individual statistic methods are widely employed to forecast corporate failure, such as discriminant analysis and its expansions [35], logistic regression and its expansions [21], a proportional hazards model and its expansions [36], etc. It is easy to analyze and explain the impact of each variable on corporate failure using individual statistic models. However, we have to meet some stringent model assumptions about sample data to apply those models [9]. To overcome the limitations above, more and more individual machine learning methods have been proposed for corporate failure prediction, such as neural networks [10], genetic algorithm [13], decision tree [14], support vector machine [15], rough set [16], deep learning [17], etc. The main advantage of a machine learning algorithm is that it is able to consider multiple features simultaneously and capture the hidden relationship between them, which enables it to perform better when compared to the statistical models [37,38,39,40]. This enables machine learning methods to have better flexibility in corporate failure forecasting. It is significant for both academic research and real practices.
To achieve a better forecasting performance, integrated models, which employ individual models as basis classifiers, have become a new exploring trend. A great deal of literature has demonstrated how to integrate basis classifiers for corporate failure forecasting [5,32]. To date, integrated models can be divided into two groups. One includes horizontal integrated models, such as a UV ensemble model [30], a spline-rule ensemble model [41], etc. Horizontal integrated models are used to employ a combination technique to integrate basis classifiers. The other group includes vertical integrated models. Vertical integrated models are mainly employed to improve another method. For example, Chen [42] adopts particle swarm optimization (PSO) techniques to obtain appropriate parameter settings for subtractive clustering. Integrated models can capture more information and result in much more accurate and stable forecasting performance.
Based on the review above, the main contribution of this paper to corporate failure forecasting can be summarized as follows. First, this study is the pioneering work of corporate failure forecasting in the Chinese energy sector. To date, little attention has been paid to the corporate failure forecasting in the energy sector of emerging economies. China is one of the largest energy consuming countries, and it is also the largest developing state. This paper complements prior literature by providing new empirical evidence from China. Second, given the role of textual data in discriminating failure corporates from normal ones [17] and the characters of the Chinese energy sector [26], we propose a novel integrated model with CNN-DL and SVM based on SS to make full use of textual data and numerical data. Until now, there has been no literature reporting the novel integrated model. This paper complements prior literature by proposing a novel integrated model for corporate failure forecasting.

3. The Proposed NIM

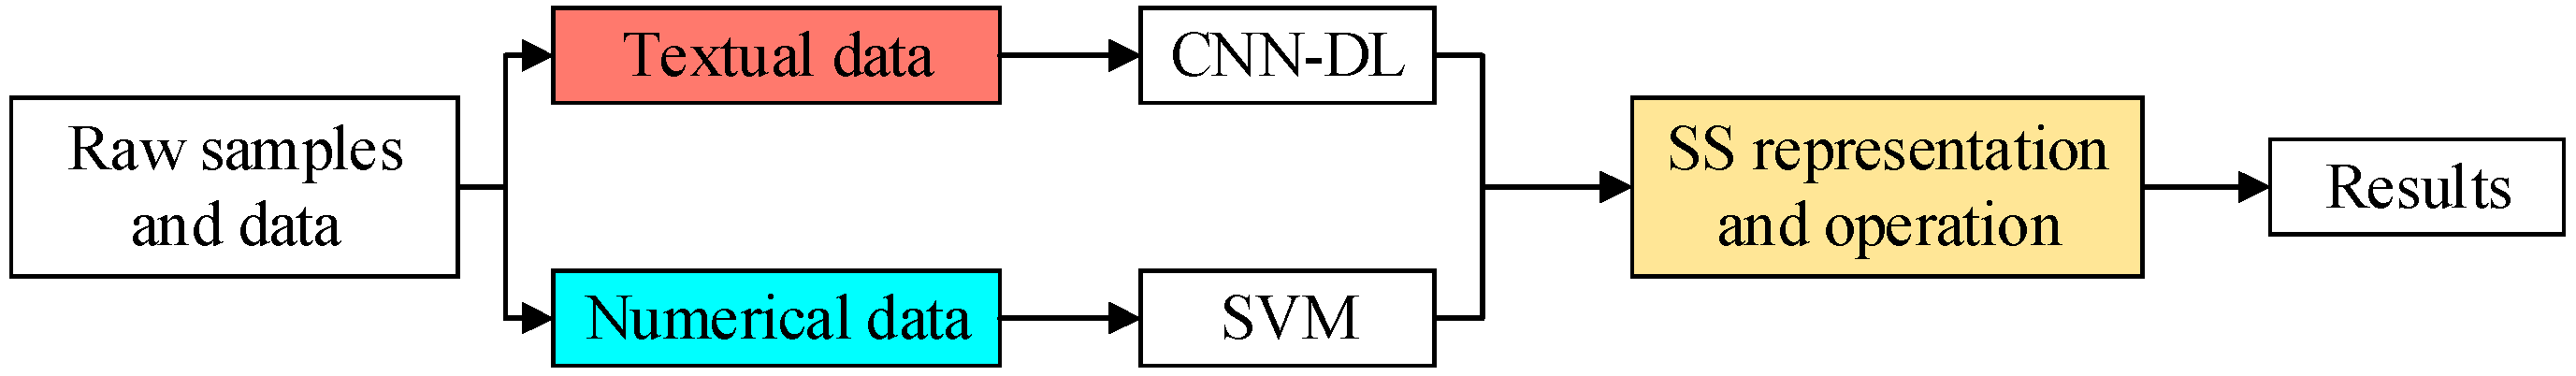
Deep learning models, which can obtain better identification performance than conventional methods in text analysis [17], have been applied to forecast corporate failure with textual data and numerical data simultaneously and have achieved excellent performance [10,17]. However, past studies have also demonstrated that deep learning models seem to be more suitable for identifying images and less suitable for numerical data analyses [
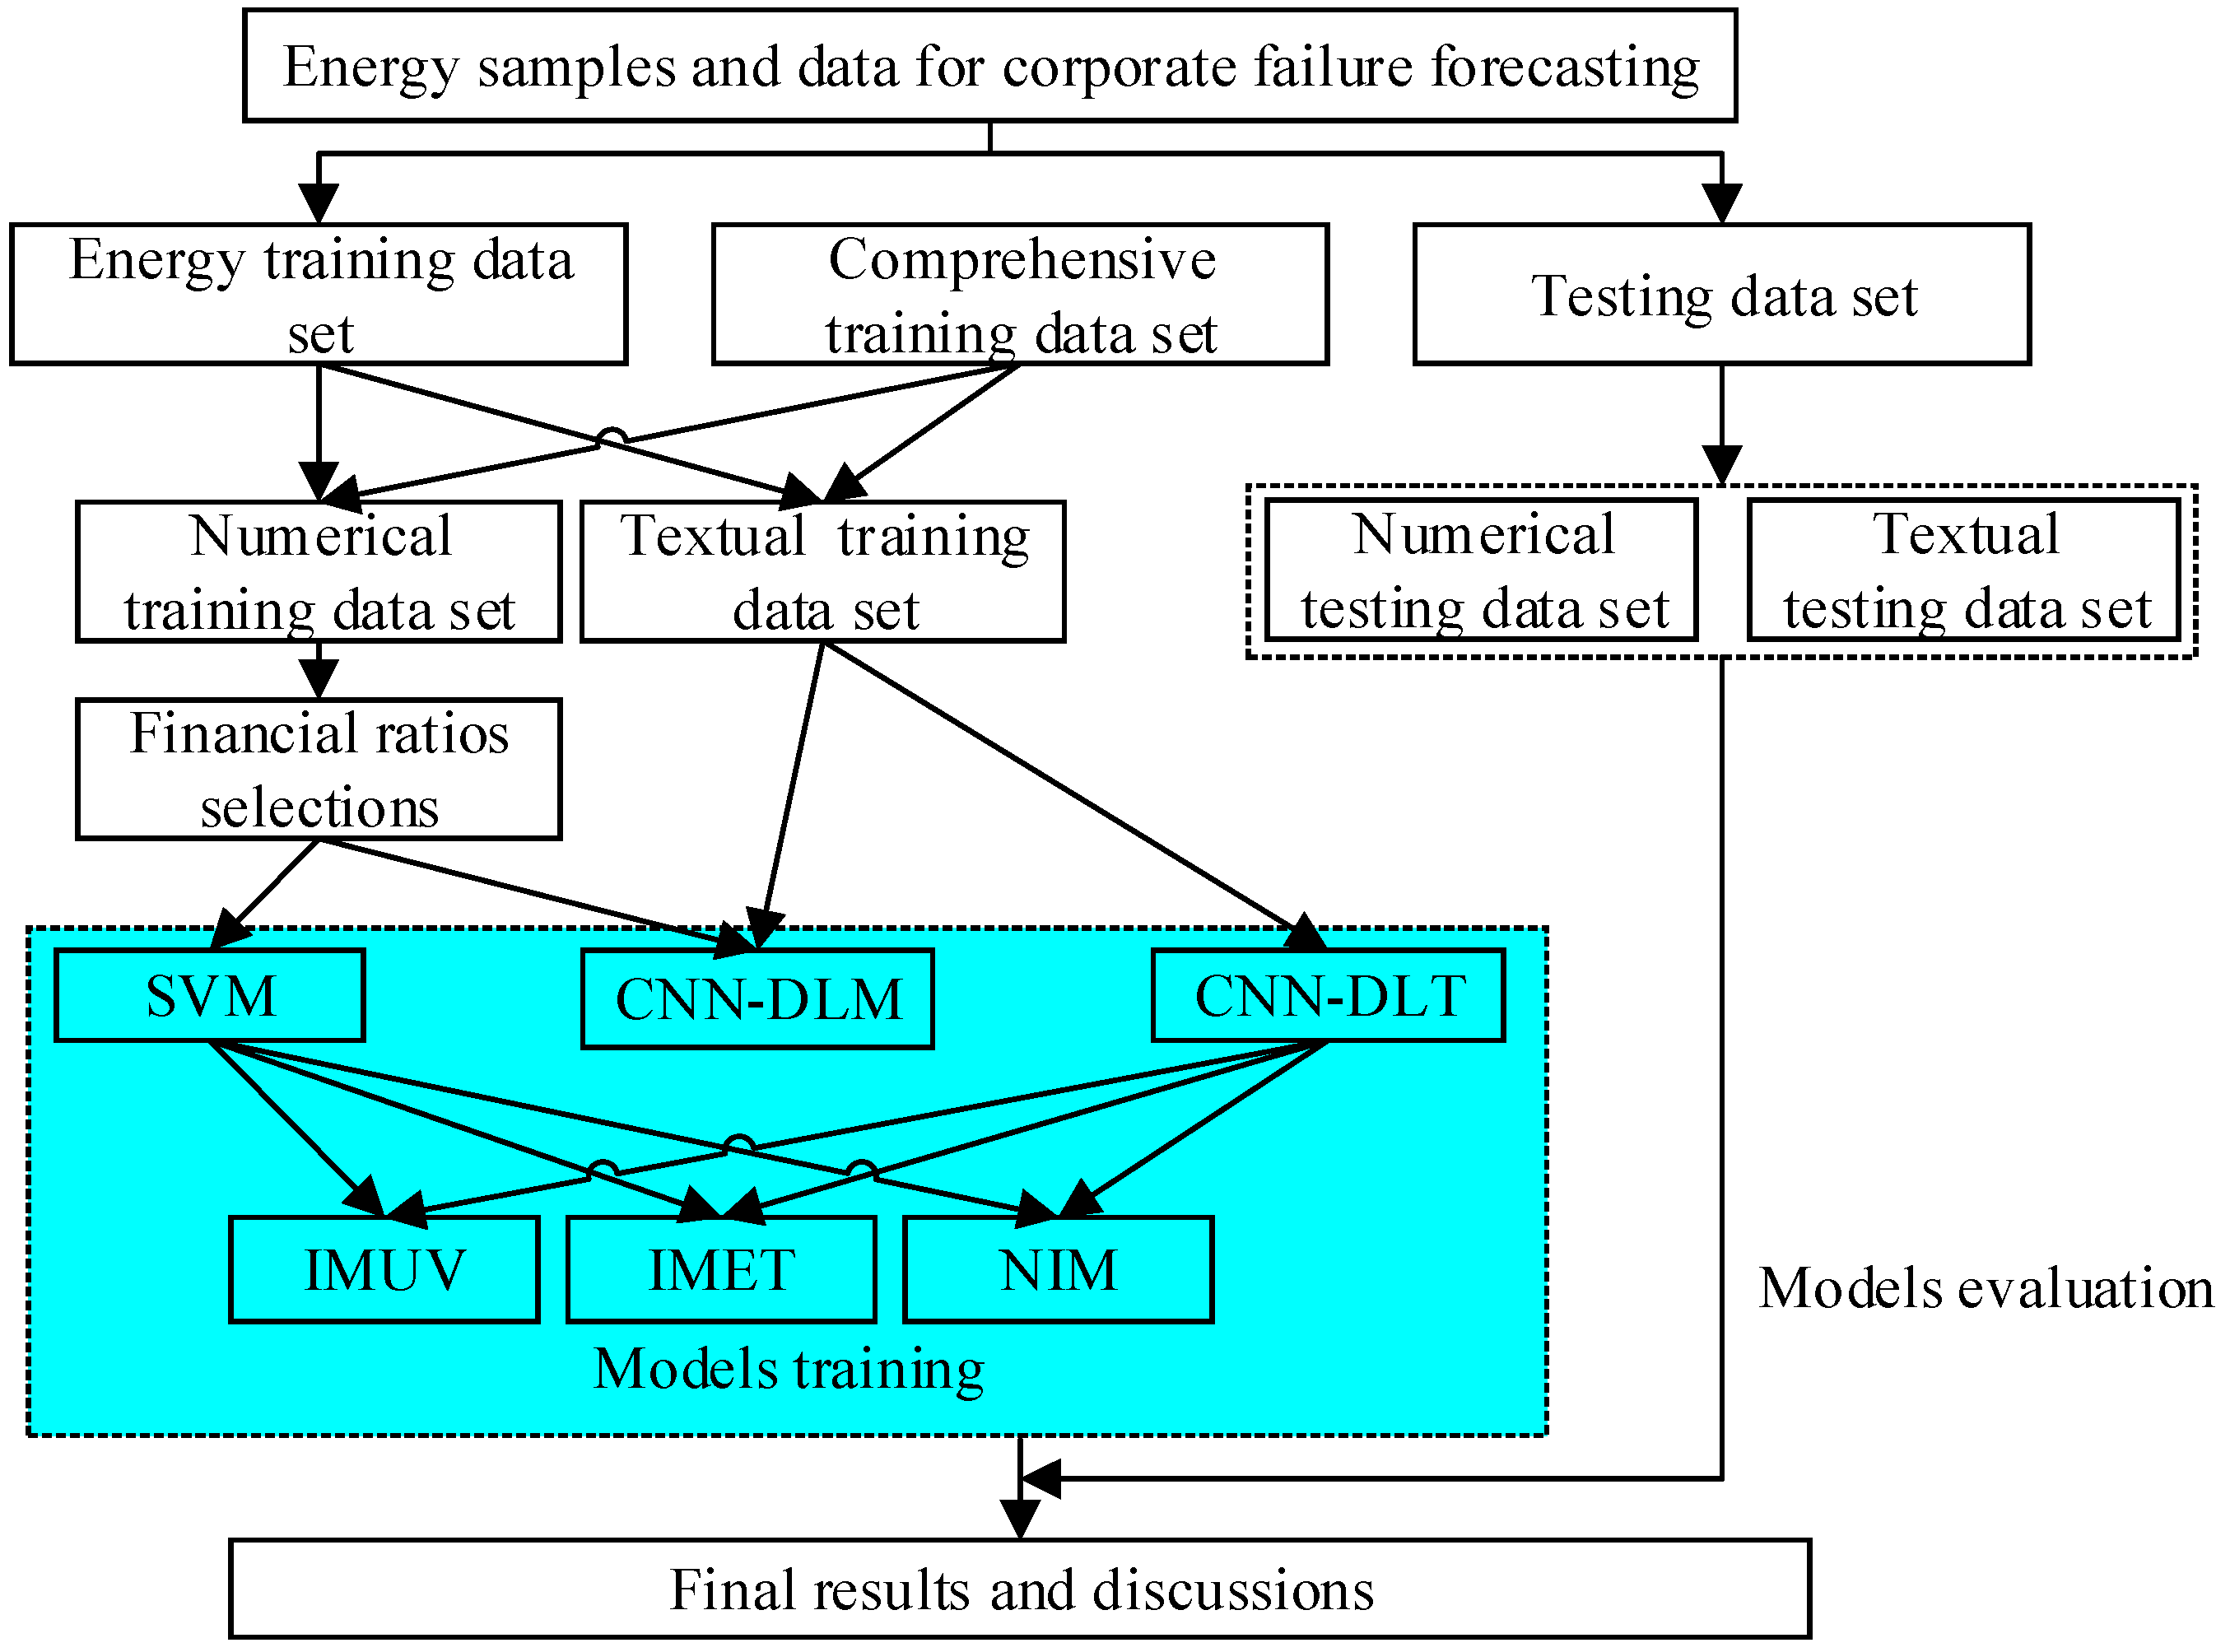
10]. Furthermore, considering the big challenge in forecasting textual data and numerical data simultaneously (due to their widely different features), we believe that an effective way to get a better forecasting performance is by adopting a model to forecast with textual data and numerical data respectively, as shown as Figure 1.
In the framework, we propose an NIM to improve the performance of corporate failure forecasting in the Chinese energy sector by making full use of textual data and numerical data. Specifically, we divide the row samples and data into two groups—textual data and numerical data. CNN-DL is applied to textual data, and SVM is used for numerical data. Subsequently, SS is employed to integrate outputs of CNN-DL and SVM. Details of NIM are demonstrated as follows.

3.1. Corporate Failure Forecasting with Textual Data

CNN-DL is employed for corporate failure forecasting in the Chinese energy sector with textual data. There are three key points of CNN-DL: data preprocessing, word embedding, and convolutional neural network (CNN).

3.1.1. Data Preprocessing and Word Embedding

Textual data is a natural language [17]. It cannot be directly employed as inputs in many conventional forecasting models. Textual data have to be transformed into numerical data so that mathematic models can be adopted. Therefore, raw data have to be cleaned to reduce noise at first. Numbers and Hypertext Markup Language (HTML) tags included in the textual data are removed. Second, given the difference between Chinese and English, the Jieba package of Python is employed to segment the textual document into words [43]. To reduce the number of dimensionality, words with low frequency are deleted.
After the preprocessing of textual data, words need to be converted to numerical representations. Many techniques have been proposed for this purpose, such as one-hot representation, distributed representation, word embedding, FastText, embedding from language, etc. [44]. One can refer to the review literature [45] for details. Here, given that understanding the semantics of textual data is much more important for corporate failure forecasting, we employ the skip-gram model to convert textual words to numerical word vectors. The skip-gram model, one of the most famous word embedding models, has proved to be an excellent tool for understanding the meaning of textual documents and converting them to word vectors [46]. Assuming that there are N training words, w 1 ,   w 2 ,   w 3 ,   , w N , the object of the skip-gram model is to maximize the log probability, as shown as in Formula (1).
1 N n = 1 N c i c ,   i 0 log p ( w n + i | w n )
where c is the size of the context. Past studies have demonstrated that the skip-gram model is useful to represent a word w using a numerical vector v w with d dimensions. However, the time cost of the skip-gram model is higher, thus we adopt a negative sampling technique to address this issue. For more details about the skip-gram model, please refer to the literature [46].

3.1.2. Convolutional Neural Network (CNN)

Each document can be converted to an n × d numerical metric by the vectorized presentation of words. The metric can be used as an input of the CNN to forecast corporate failure in the Chinese energy sector. CNN is widely used for mining textual data and has been successfully applied in some financial forecasting fields recently [10,17]. The most important point of CNN is that it can detect local features of documents by adopting m convolving filters. For more information about CNN, please refer to literature [47].
Assume there are some convolutional filters, denoted as θ = ( θ 1 , θ 2 , θ 3 , , θ M ) . Then, θ is a function mapping R m to R . Given an input word vector of a document x R m , the i-th entry of the output u that transformed x to a phrase of length h by the filter θ can be calculated using Formula (2):
u i = f ( θ · x i : i + h 1 + b )
where b R is the bias parameter of CNN, and f is the activation function, including sigmoid function, tanh function, ReLu function, etc. [11]. Here, we employ the ReLu function as f to expedite the convergent speed of CNN, shown as Formula (3):
f ( x ) = max ( 0 , x )
By conducting the method above to the textual document, a full version of features U R i h + 1 is obtained. To forecast corporate failure in the Chinese energy sector, the document including a key phrase (features) or not is the discriminate criteria. Therefore, the pooling operation is employed to maximize the value of each feature map vector, U = max { u } . At last, a sigmoid output unit and two layers of hidden filters can be added to obtain the forecasting outputs [17].

3.2. Corporate Failure Forecasting with Nemuerical Data

Various statistical models and machine learning models have been proposed for corporate failure forecasting with numerical data [32]. SVM has been widely used in various fields [48,49,50,51,52], including corporate failure forecasting [44], and has received great attention in recent years. By mapping original data into the high dimensional space using different kernel functions, SVM not only has advantages in forecasting with linear and non-linear financial data but also performs well in forecasting with high dimensional data and small sample sizes. Hence, given the character of Chinese energy firms, SVM is adopted to forecast with numerical data. Here, we present a brief review; for more information, please refer to the literature.
Given the training data set ( x n , y n ) ,   ( n = 1 , 2 , 3 , , N ) , x n R M presents a vector in the M dimensional feature space, and y n { 1 , 1 } , y n = 1 means that x n belongs to one category, and y n = 1 means that x n belongs to the other category. The calculation of SVM can be presented as Formula (4), and constraint conditions are shown as Formula (5):
min 1 2 W T · W + C n = 1 N ξ n
s . t .   y n ( W · x n + b ) 1 ξ n , n = 1 , 2 , 3 , , N
where C, ξ is the key parameter. Generally, there are four widely applied kernel functions for mapping original data into high dimensional space, including Gaussian kernel, polynomial kernel, radial basis function (RBF) kernel, and sigmoid kernel.

3.3. Integration of Individual Outputs

An important innovation of this paper is that we introduce the SS as the integration method to integrate outputs of CNN-DL and SVM. To date, unanimous voting algorithm, equal weighted method, Borda count, Bayesian, neural network, evidence theory, rough set theory, etc., are well-known integration methods [20]. However, it is a big challenge to determine the weight of each individual model. To overcome the limitations above and make full use of individual outputs effectively, SS is employed as the integration method of NIM. SS, initiated by Molodtsov [29], has advantages in decision making and information discovering [9,53]. Details of applying SS to integrate individual outputs are demonstrated as follows.
Let U be a non-empty universe of objects, let E be a non-empty set of parameters related to objects in U , and the power set of U is P ( U ) . A soft set over U is a pair S = ( F , A ) , where F : A P ( U ) is the approximate function of S and A E . In others words, S is a parameterized family of subsets of U . With the definition of SS, a binary operation, named uni-int decision making method, is proposed to improve the performance of decision making by taking full information of SSs [9].
Let S = ( F , A ) and T = ( G , B ) be two SSs over the universe U , and the -product (and product) of S and T equals to ( P , A × B ) , where P ( x , y ) = F ( x ) G ( y ) for ( x , y ) A × B . The uni-int operators for S T are defined as follows and denoted as u n i x i n t y and u n i y i n t x .
u n i x i n t y ( S T ) = x A ( y B P ( x , y ) )
u n i y i n t x ( S T ) = y B ( x A P ( x , y ) )
Then, the uni-int decision set is the union of two uni-int operators, shown as Formula (8).
u n i i n t ( S T ) = u n i x i n t y ( S T ) u n i y i n t x ( S T )

3.4. Algorithm

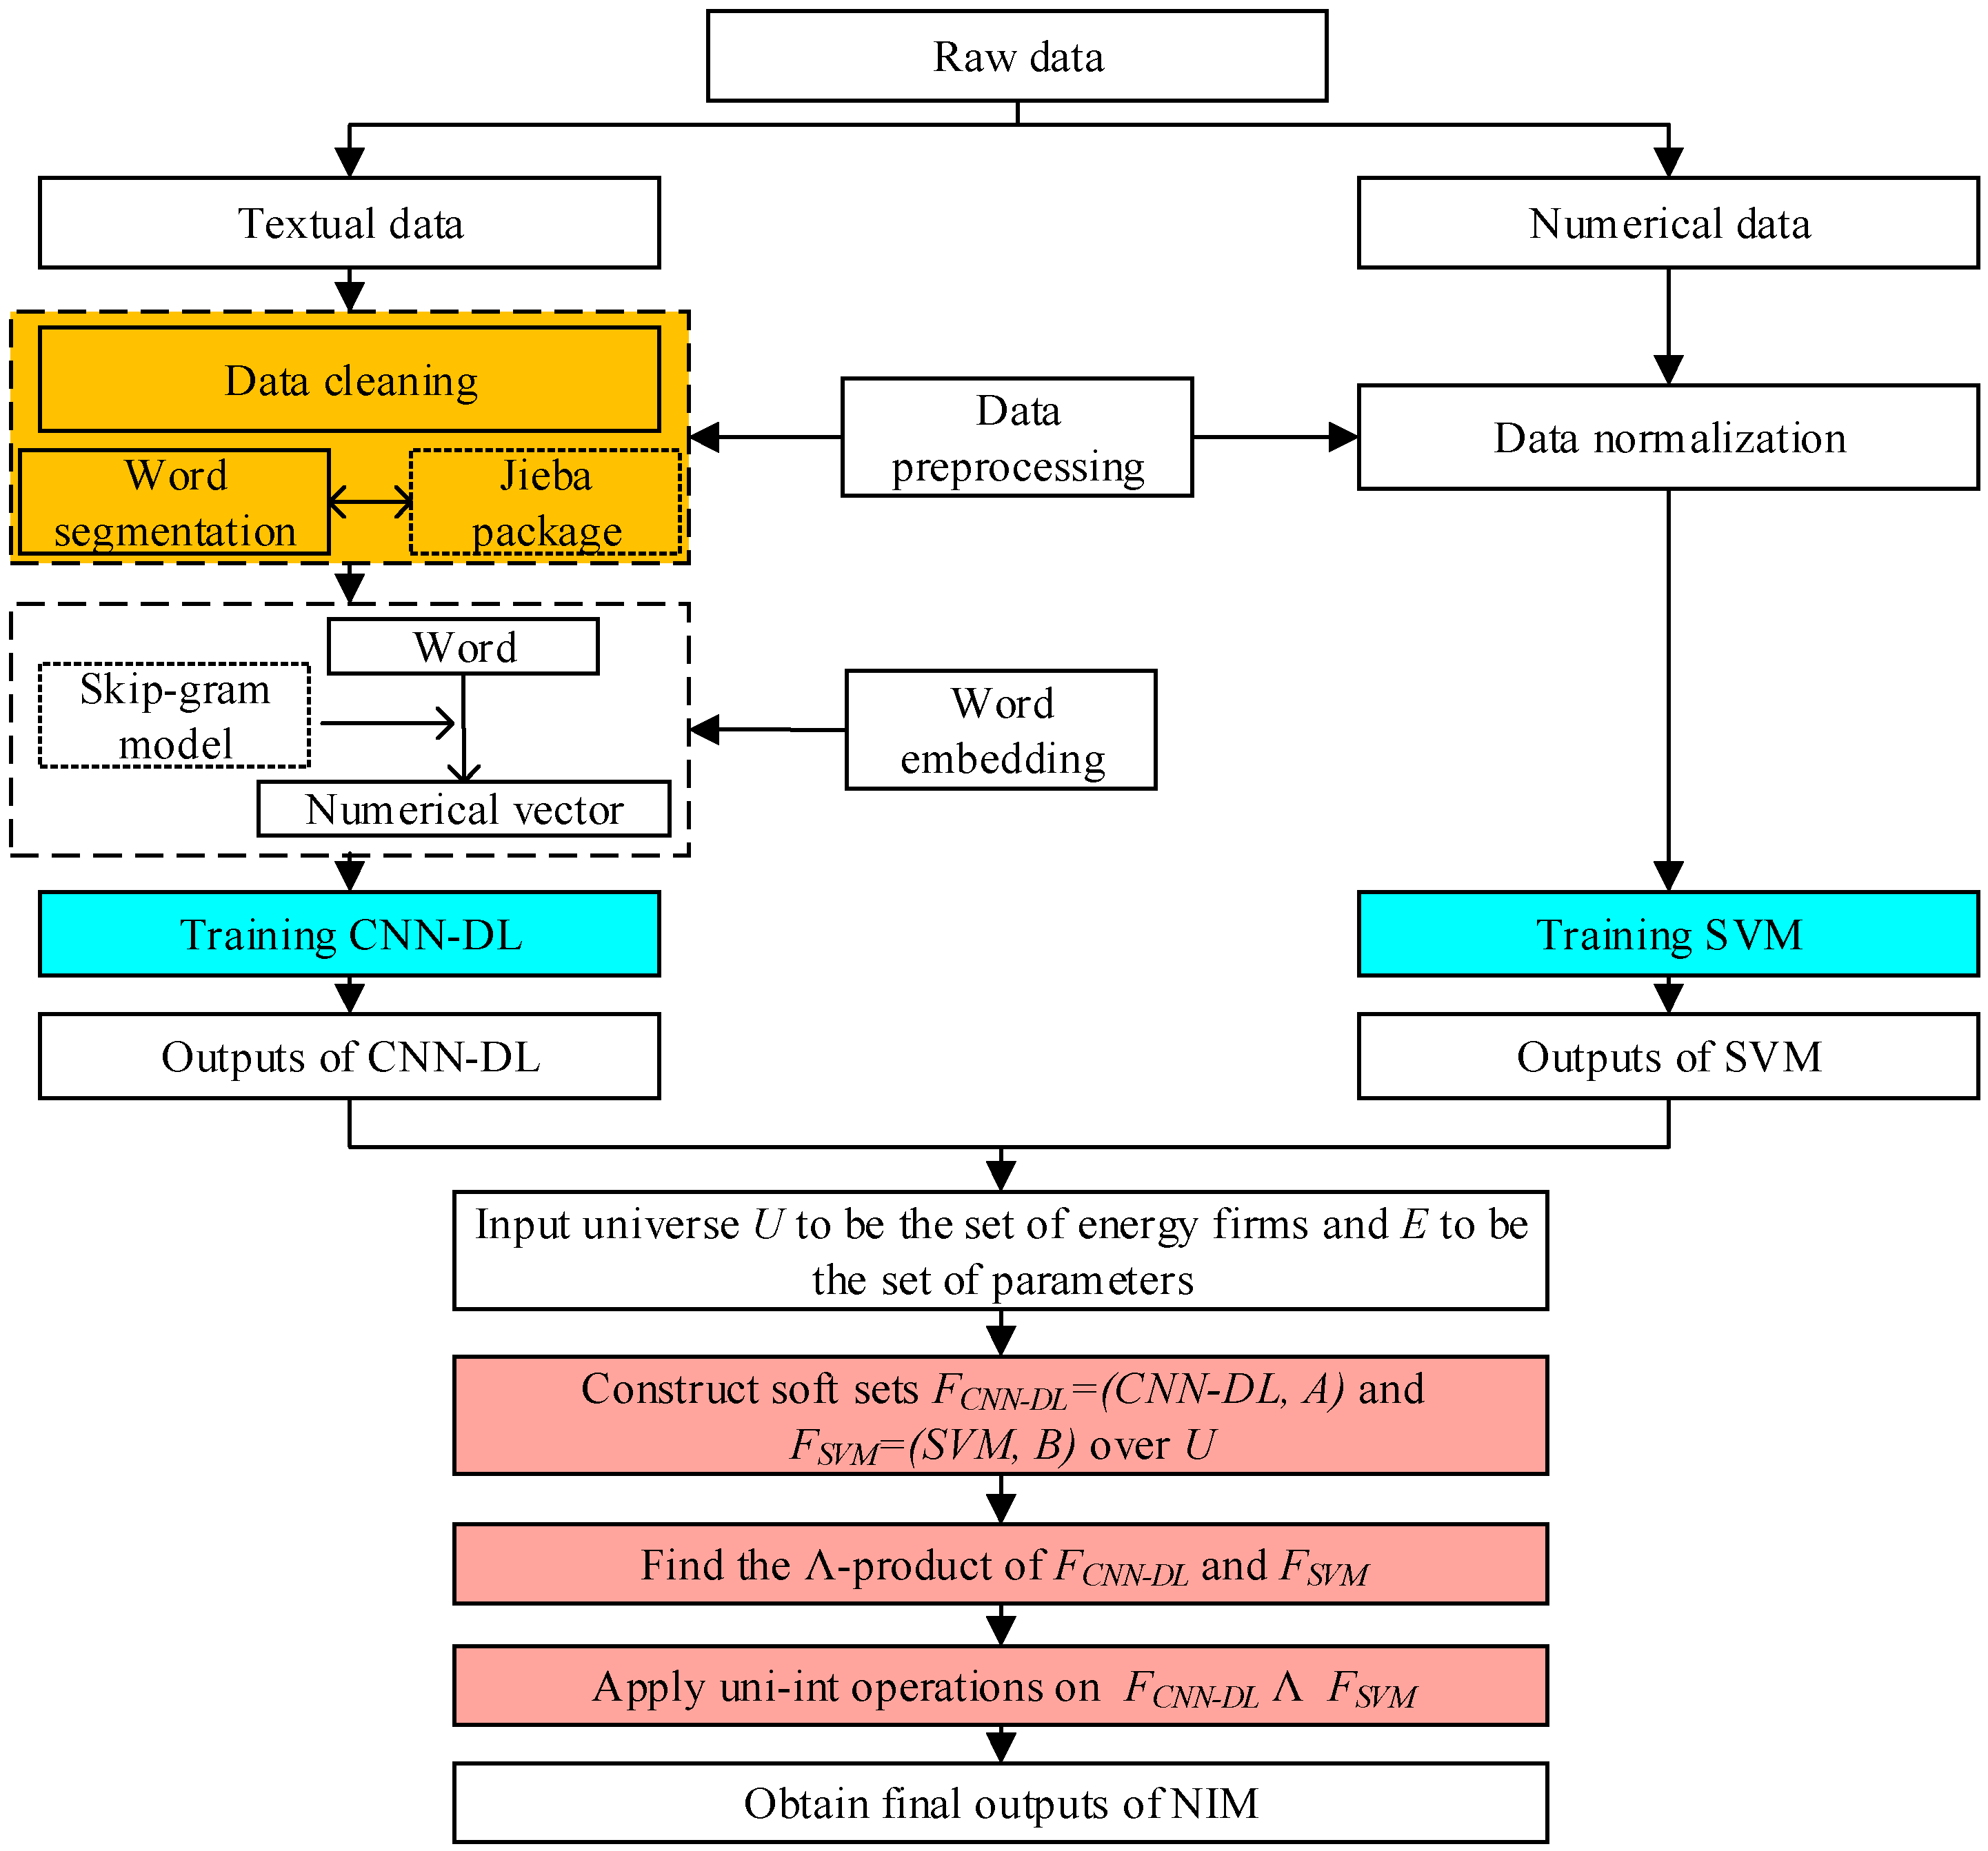
Based on the analysis above, the algorithm of NIM, which is the key innovation of this paper, is illustrated in Figure 2.
  • The collected raw data are divided into two groups—textual data and numerical data. Textual data are text documents. Numerical data are financial ratios.
  • Textual data are cleaned by removing numbers and HTML tags and are segmented using the Jieba package of Python. At the same time, numerical data are normalized using Formula (9).
    x i j = x i j min { x j } max ( x j ) min { x j }
  • Apply the skip-gram model to convert each word of the textual document to a numerical vector.
  • Train CNN-DL with transformed textual data and train SVM with normalized financial ratios.
  • Obtain individual outputs of CNN-DL and SVM.
  • Input a universe U to be the set of energy firms and E to be the set of parameters. In particular, E is the set of selected textual variables and financial ratios for corporate failure forecasting in the Chinese energy sector.
  • Construct two soft sets F C N N D L = ( C N N D L ,   A ) and F S V M = ( S V M ,   B ) over U . For soft set F C N N D L , the approximate function is CNN-DL, and parameter set A is the set of textual variables, A E . For soft set F S V M , the approximate function is SVM, and parameter set B is the set of selected financial ratios, B E .
  • Find the -product (and product) of SSs F C N N D L and F S V M .
  • Apply the uni-int operations on F C N N D L   F S V M .
  • Obtain the final integrated outputs of NIM.
In such a way, the proposed NIM integrates CNN-DL and SVM into SS and hence inherits advantages of three methods. We hope for an excellent performance of NIM on corporate failure forecasting in the Chinese energy sector with textual data and numerical data.

3.5. Model Evaluation Metrics

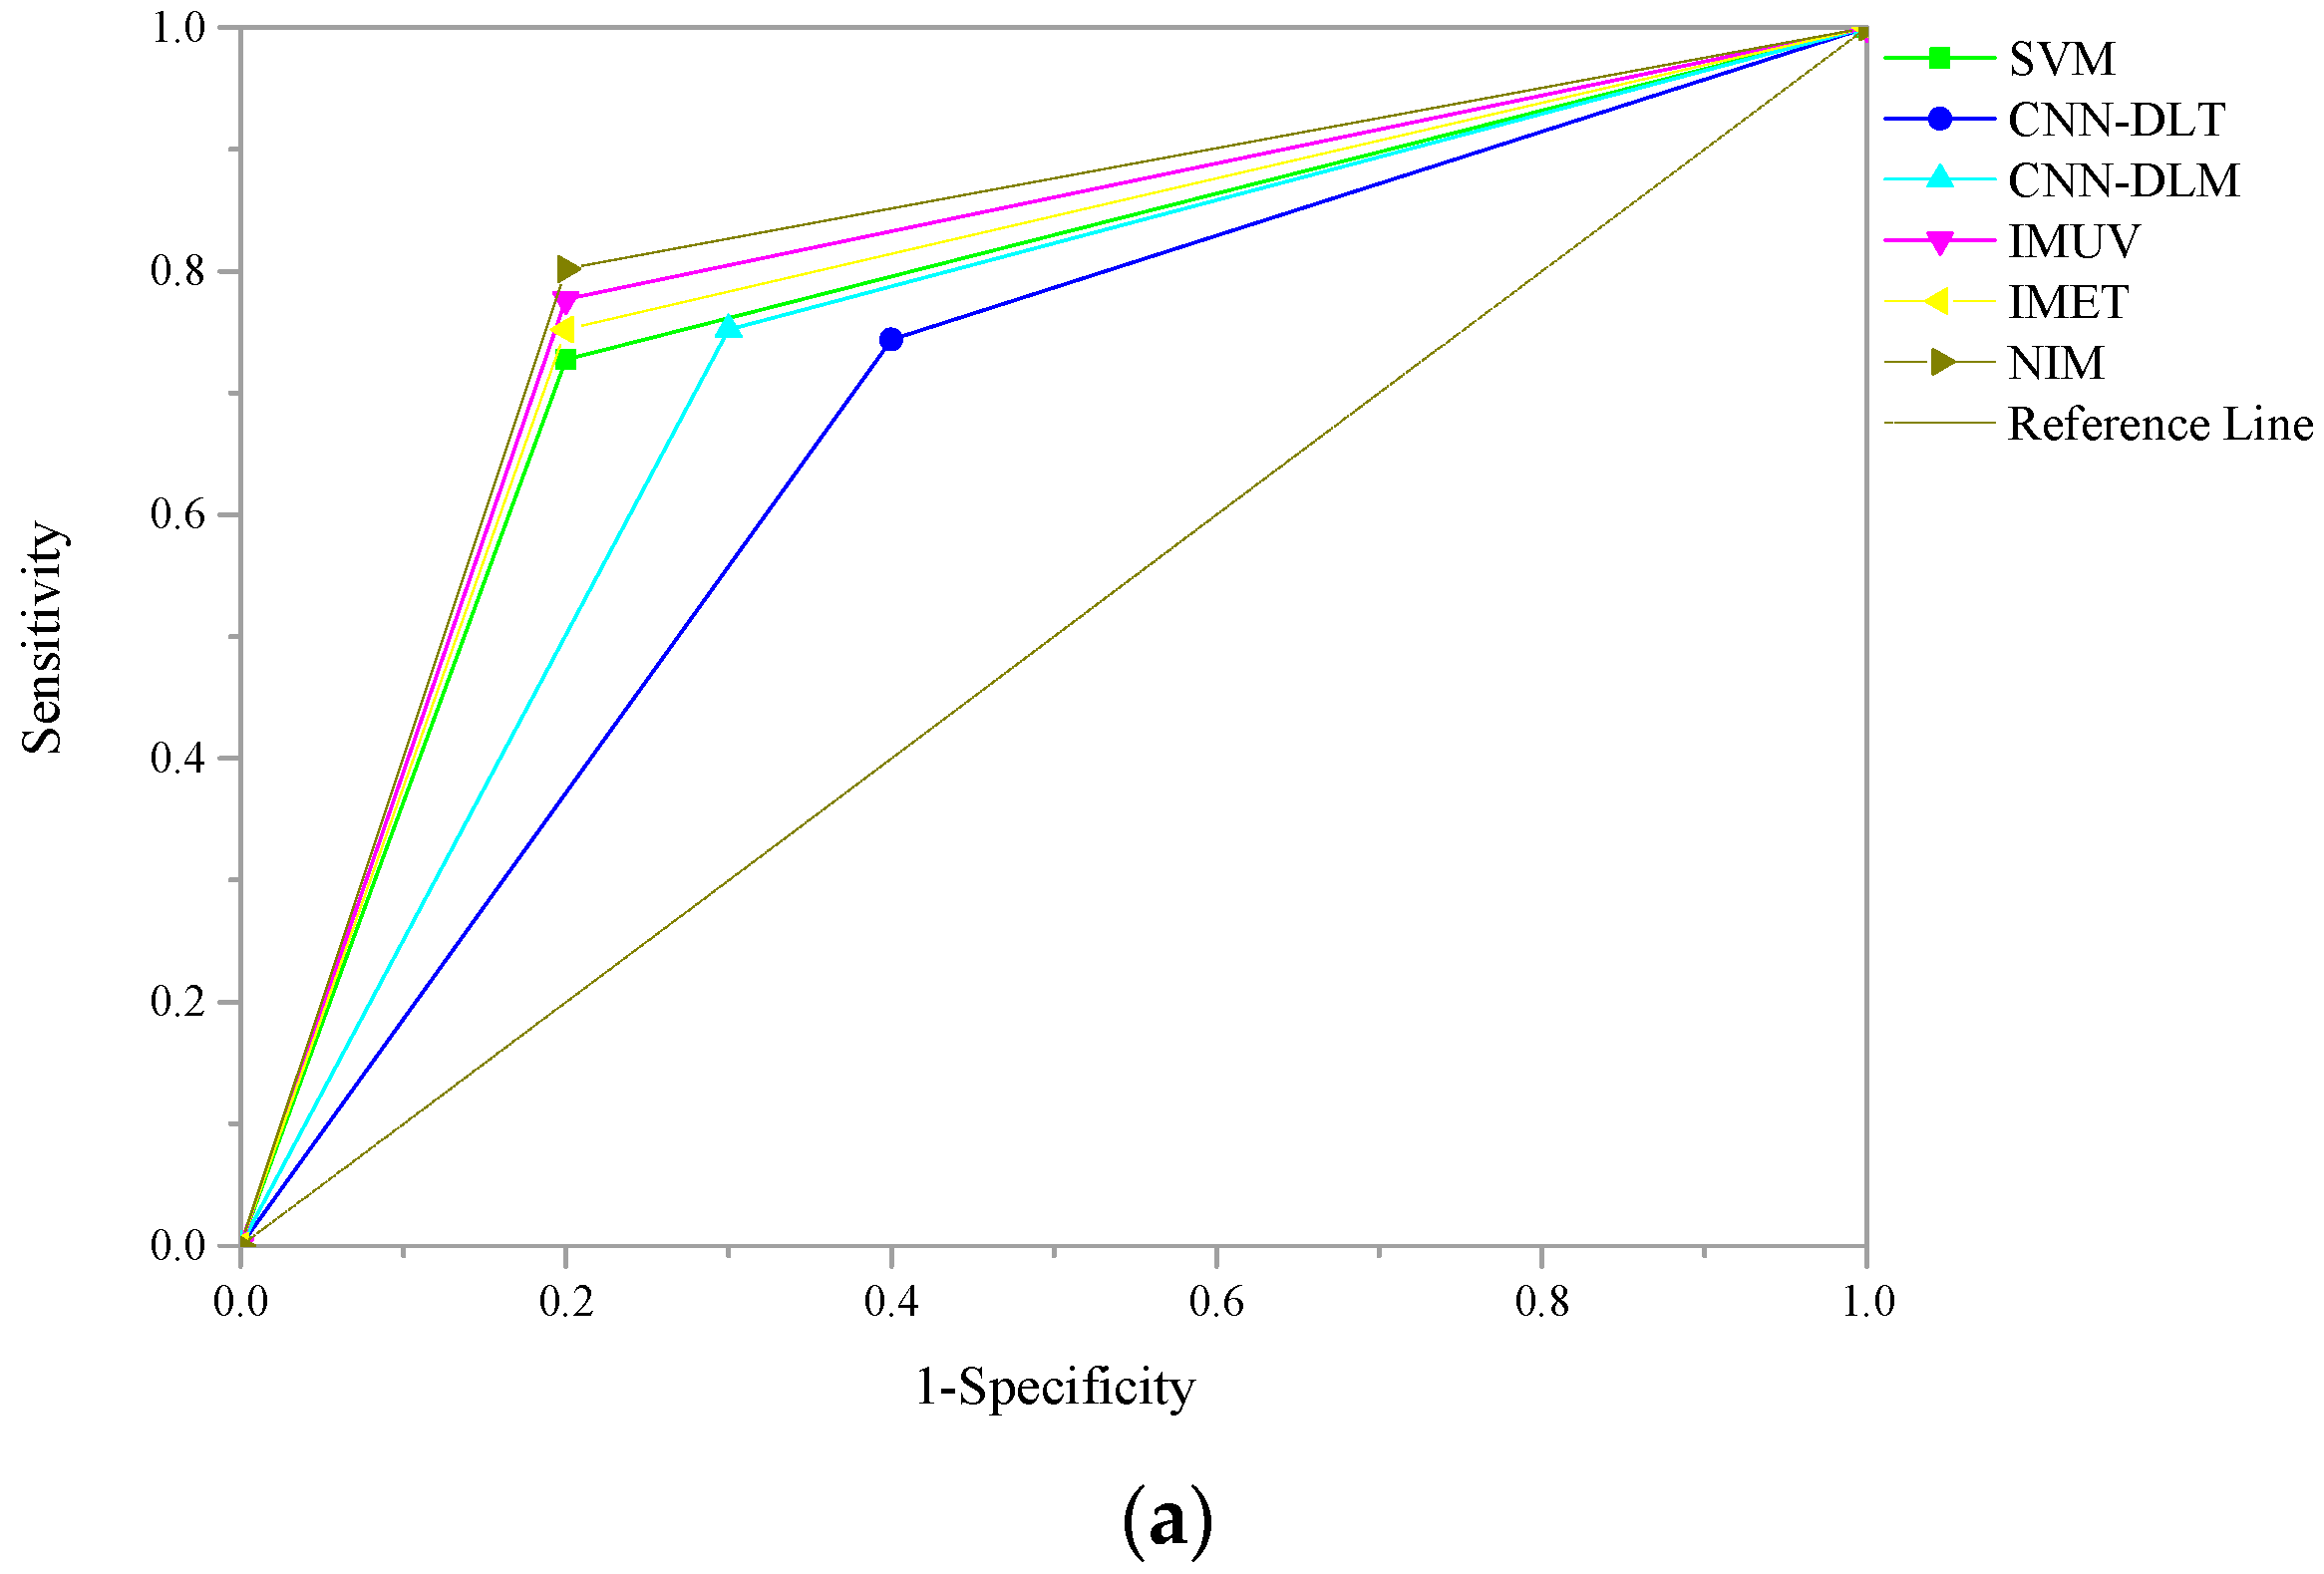
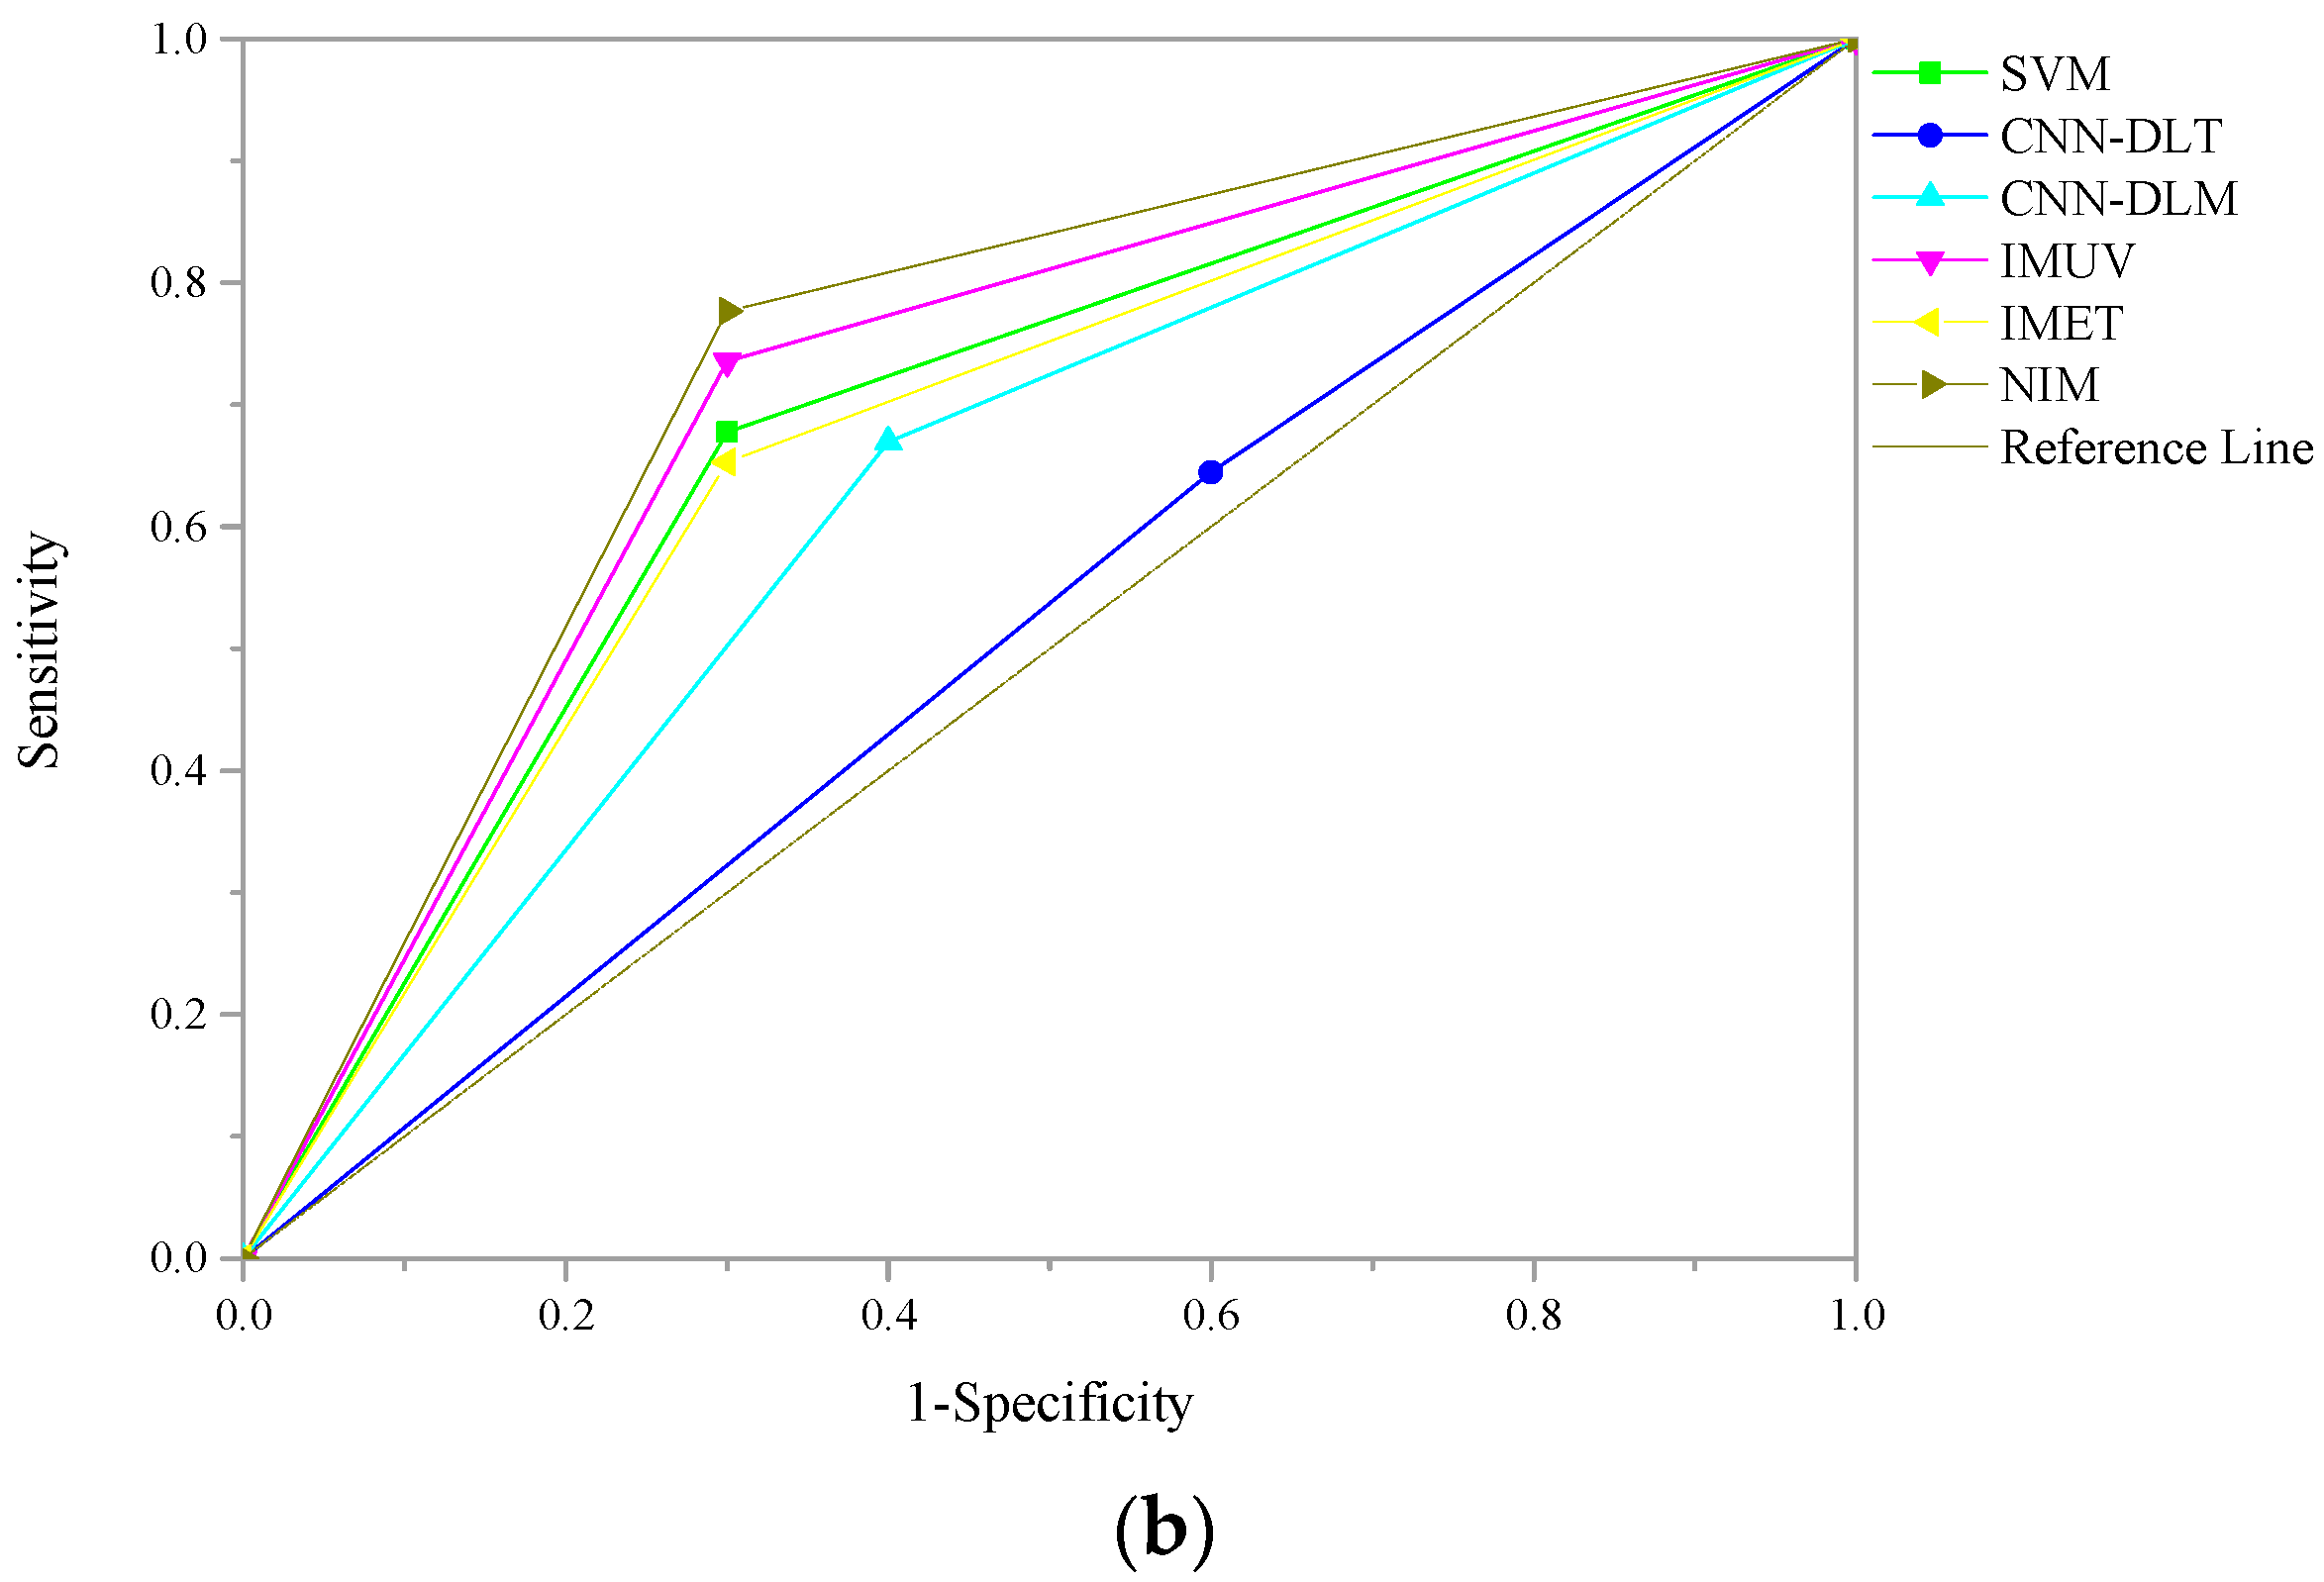
Many metrics have been proposed to evaluate the performance of forecasting models, such as accuracy (ACC), Matthews correlation coefficient (MCC), F1-score (F1), the area under curve (AUC) of receiver operating characteristic (ROC), etc. In this paper, due to the imbalanced testing sample set, AUC is employed as the evaluation metric [54]. AUC is widely used to measure the overall discriminatory power of models for flexibility and comprehensiveness [17]. Commonly, AUC scores range from zero to one, which means that the classification performance is the worst. One indicates the best classification performance. The bigger the AUC score is, the better the classification performance is.

4. Empirical Experiment

4.1. Sample and Data

In this paper, real samples and data from Chinese listed energy firms are adopted for empirical experiments to verify the performance of NIM on corporate failure forecasting in the Chinese energy sector. In China, if the net profit of a listed firm is negative in two consecutive years, the firm will be labeled as special treatment (ST). According to the China Securities Supervision and Management Committee (CSSMC), negative net profit will increase the possibility of corporate failure [9,11]. Here, we treat ST as the corporate failure. Such listed energy firms are viewed as failure samples. The rest of the listed energy firms that have not been labeled as ST are regarded as non-failure samples.
During 1998–2018, 705 energy-related corporates were listed on the Shenzhen Stock Exchange and the Shanghai Stock Exchange. With no missing observations, there are 651 Chinese listed energy-related corporates adopted as empirical samples in this work, including 605 non-failure firms and 46 failure firms. In terms of modeling, all samples are divided into the energy training data set and the testing data set using the 10-times split technique. Here, 80% of the non-failure samples (484 samples) and the failure samples (36 samples) are employed as training samples, and the rest of the samples are used to evaluate the performance of models as testing samples. This percentage was widely used in many prior studies [2,17].
In addition, to observe the performance change of corporate failure forecasting with samples from the energy sector, we randomly collect another comprehensive training data set, including 484 non-failure samples and 36 failure samples in all sectors from the Shenzhen Stock Exchange and the Shanghai Stock Exchange during the period of 1998–2018. All data employed in this paper are collected from the CSMAR database and the CNINF database.

4.2. Variables

It is more difficult to forecast corporate status at the year t using data of the year ( t 2 ) or ( t 3 ) than it is using data of the year ( t 1 ) [9]. Here, we attempt to challenge it. Given that characters of listed firm failure for the year ( t 2 ) and ( t 3 ) are different [11], two variable sets are selected for forecasting corporate failure in the Chinese energy sector using data of the year ( t 2 ) and ( t 3 ) Numerical variables and textual variables are included in the selected variable set.

4.2.1. Numerical Variables Selection

For numerical data, we treat financial ratios as variables. Various financial ratios have been selected for corporate failure forecasting [7,9,55]. In this paper, based on the literature review, financial ratios that have been widely adopted in prior studies are summarized in Table A2. Then, we select numerical variables from Table A2 with a training data set of the year ( t 2 ) and ( t 3 ) using the following approaches. First, financial ratios with null values are removed. Second, key financial ratios are filtered out by the significant test with 95% confidence interval. Third, the multi-collinearity test is employed to remove variables with high multi-collinearity relationships. Final financial ratios are treated as numerical variables for corporate failure forecasting in the Chinese energy sector, as listed in Table 1, Table 2, Table 3 and Table 4.

4.2.2. Textual Variables Description

For textual data, as pointed out in prior literature [17,56], the management discussion and analysis section included in the annual report of listed firms can be used to distinguish firm risks. In China, the CSSMC intends for the management discussion and analysis section to offer more information for readers to improve the understanding of the current operating and financial status and to forecast the future status with higher accuracy. Hence, we employ the management discussion and analysis section as the textual data of a Chinese listed energy firm. It can be downloaded from the CNINF database.
More specifically, the Perl script is applied to extract the management discussion and analysis section at first. Then, samples with empty management discussion and analysis sections are excluded. To reduce noisy data, numbers, HTML tags, etc., are removed from extracted documents. The final preprocessed document is segmented into words using the Jieba package of Python. After the numerical vector presentation of words using the skip-gram model, we apply the convolutional process of CNN to extract features as textual variables.

4.3. Experiment Design

To investigate whether NIM has an acceptable performance for corporate failure forecasting in the Chinese energy sector, we design a comprehensive empirical experiment. CNN-DLT, SVM, CNN-DLM, IMUV, and IMET are included as benchmarks. Figure 3 illustrates the empirical experiment.
Details of the empirical experiment are presented as follows.
Step 1. Energy samples are randomly divided into the energy training data set and the testing data set using the 10-times split technique. Meanwhile, the comprehensive training data set with samples from different sectors is proposed as well.
Step 2. Select financial ratios for SVM and CNN-DLM with the numerical training data of the year ( t 2 ) and ( t 3 ) .
Step 3. Train CNN-DLT, SVM, CNN-DLM, IMUV, IMET, and NIM with the energy training data set and the comprehensive training data set.
Step 4. Output forecasting results with the testing data set and compare the performance of each forecasting model.

5. Results and Discussion

As the key process of corporate failure forecasting is mapping inputs to binary outputs, we use the back propagation algorithm to train the CNN-DL. The early stopping technique is employed to prevent the overfitting problem [57]. The empirical experiment is repeated 20 times on CNN-DLs and selects the optimal set of forecasting results as the final output of CNN-DLs. For SVM, RBF function is applied as kernel function, and optimal parameters ( C , ξ ) are searched using the grid search technique and the cross validation method. This paper is executed with Matlab (2016b) and Python (3.6). Some codes are presented in Supplementary Materials.

5.1. Forecasting Results and Analysis

The out-of-sample forecasting results of SVM, CNN-DLT, CNN-DLM, IMUV, IMET, and NIM using the testing data set of the year ( t 2 ) and ( t 3 ) are illustrated in Figure 4 and Figure 5, respectively.

5.1.1. Results of Models Trained Using the Energy Training Data

For models trained using the energy training data set, the forecasting results using the testing data set of the year ( t 2 ) are illustrated in Figure 4a. It is easy to find out that the proposed NIM has the biggest AUC score, and CNN-DLT has the smallest AUC score. Without any surprise, all integrated models (IMUV, IMET, and NIM) have a much better forecasting performance than CNN-DLM does, because the algorithm of integrated models cans mine numerical data and textual data more efficiently. Consistent with the study of Mai et al. [17], CNN-DLM, which is trained and tested using both numerical data and textual data simultaneously, performs better than CNN-DLT and SVM. According to the out-of-sample forecasting performance, the models can be ranked as follow: NIM > IMET > IMUV > CNN-DLS > SVM > CNN-DLF.
For forecasting models trained using the energy training data set, the forecasting results using the testing data set of the year ( t 3 ) are shown in Figure 4b. It is similar to the performance using the testing data set of the year ( t 2 ) , but there are two differences. One is that the forecasting performance of IMUV is better than IMET’s. That is because evidence theory (ET) has disadvantages in integrating outputs of SVM and CNN-DLT when the output of SVM and CNN-DLT is seriously conflicted. Longer forecasting terms will result in decreasing the consistency of outputs of SVM and CNN-DLT. The other one is that the forecasting performance of CNN-DLM becomes worse than SVM’s. This is not a surprise due to the loss of timely textual information. Moreover, the useless textual data becomes noisy data for forecasting and results in inferior performance.

5.1.2. Results of Models Trained Using the Comprehensive Training Data

To verify the performance of corporate failure forecasting in one sector, we train models using the comprehensive training data set of the year ( t 2 ) , ( t 3 ) , and evaluate models using the testing data set of the year ( t 2 ) , ( t 3 ) respectively. Out-of-sample forecasting ROC curves of each model are summarized in Figure 5.
For forecasting models trained using the comprehensive training data set, forecasting results using the testing data set of the year ( t 2 ) are illustrated in Figure 5a. It is easy to see that the proposed NIM performs the best, and CNN-DLT performs the worst. The more important point is that the performance of SVM is better than that of CNN-DLM. Because the management discussion and analysis section of listed firms in different sectors are quite different, a huge volume of useless textual data results in decreasing the AUC score.
For models trained using the comprehensive training data set, forecasting results using the testing data set of the year ( t 3 ) are presented in Figure 5b. The conclusion is similar to results using the testing data set of the year ( t 2 ) .

5.2. Comparsions and Discussions

For comparison and analyses, AUC scores of each model are summarized in Table 5 and Table 6.

5.2.1. Results Comparison and Discussion with Different Training Data Set

From Table 5 and Table 6, one can easily find that models trained using the energy sector data set uniformly outperform models trained using the comprehensive training data set no matter which year of the testing data set is employed for evaluation. Therefore, it is an effective way to improve performance of corporate failure forecasting in the Chinese energy sector by focusing on this sector.
Specifically, the proposed NIM has the highest AUC score no matter which year of the testing data set is employed or what training data set is used. As shown in Figure 6, the performance of NIM changes the least when the energy training data set is replaced by the comprehensive training data set no matter which year of the data set is used for forecasting. This means that NIM is an effective model for corporate failure forecasting in the Chinese energy sector. However, one can also see that the performance of NIM trained using the energy training data set is better than NIM trained using the comprehensive training data set. IMUV, IMET, and SVM have similar performances.
For Chinese listed firms in different sectors, the management discussion and analysis sections have great differences [58]. As a result, there are many useless textual data included in the training data set if it is collected from different sectors. Under such context, it is more difficult to mine valuable information for corporate failure forecasting. The performance of CNN-DLT and CNN-DLM have big changes when the energy training data set is replaced by the comprehensive training data set no matter which year of the testing data set is used. This means that textual data can play a much more significant role in forecasting corporate failure by focusing on one sector.

5.2.2. Results Comparison and Discussion with the Year of ( t 2 ) and ( t 3 )

From Table 5 and Table 6, for each employed model, one can easily find that corporate failure forecasting in the Chinese energy sector with the data set of the year ( t 2 ) outperforms forecasting with the data set of the year ( t 3 ) . This is not a surprise due to timely information loss with longer forecasting periods. Forecasting corporate failure on a long horizon is more complex and difficult than short term forecasting.
Similar to the results above, no matter which year of the testing data set is used, our NIM performs the best. As shown in Figure 7, no matter what the training data set is applied to forecast, NIM not only has the highest AUC score but also obtains the least change when the data set of the year ( t 2 ) is replaced by the data set of the year ( t 3 ) . This means that NIM can effectively forecast corporate failure in the Chinese energy sector with textual data and numerical data under the longer forecasting period. SVM and IMUV have similar results. IMET, CNN-DLM, and CNN-DLT have worse performances.

5.3. Summary

For corporate failure forecasting in the Chinese energy sector, empirical results demonstrate three important conclusions. First, NIM can improve the performance of corporate failure forecasting in the Chinese energy sector by integrating CNN-DLT and SVM based on SS. CNN-DLT is applied to the textual data, and SVM is applied to the numerical data. Then, outputs of CNN-DL and SVM are integrated by SS. Second, it is useful to improve the performance of corporate failure forecasting in the Chinese energy sector by focusing on this sector. Third, textual data can play an important role in corporate failure forecasting in the Chinese energy sector, but the validity decreases with longer forecasting horizons.

6. Conclusions

In this study, we extend the research of corporate failure forecasting by proposing a novel integrated model with convolutional neural network oriented deep learning and support vector machine based on soft set theory for corporate failure forecasting in the Chinese energy sector. Given characters of energy firms in China, both numerical data and textual data are considered as inputs here. Due to different features of numerical data and textual data, CNN-DL is employed to forecast corporate failure based on the textual data, and SVM is used to forecast based on the numerical data. Then, outputs of CNN-DL and SVM are integrated using SS. Hence, NIM inherits advantages and simultaneously avoids disadvantages of CNN-DL, SVM, and SS. This algorithm enables NIM to make full use of numerical data and textual data. Compared with benchmarks, NIM shows superior performance for corporate failure forecasting in the Chinese energy sector. Empirical results also demonstrate that it is an effective way to improve the performance of corporate failure forecasting in the Chinese energy sector by focusing on this sector.
Though empirical results are satisfactory, there is some work needed to be done in the future to improve the forecasting performance. First, as the key component for the success of NIM, the word segmentation technique with high computing efficiency should be studied more with consideration to the features of Chinese. Second, the management discussion and analysis section is used as textual data for corporate failure forecasting in the Chinese energy sector. Some related national polices and news should be investigated as textual data in future research. Third, financial ratios are employed as numerical variables in this study. More numerical variables should be included for corporate failure forecasting in the Chinese energy sector, such as market data, governance data, national economic data, etc.

Supplementary Materials

The data used to support the findings of this study is available online at https://www.mdpi.com/1996-1073/12/12/2251/s1, RAR file: Source Code.

Author Contributions

W.X., Y.C., W.C., and H.F. conceived and worked together to achieve this work. W.X. designed the research framework and wrote the paper; H.F. carried on the formal analysis and revising the manuscript. Y.C., and W.C. made contribution to the idea and revision of the manuscript. All authors read and approved the final manuscript.

Funding

This work is supported by National Natural Science Foundation of China (No. 71801113, 11601189).We also acknowledge MOE (Ministry of Education in China) Project of Humanities and Social Sciences (No. 18YJC630212), Fundamental Research Funds for the Central Universities (No. 2019JDZD16), Natural Science Foundation of Jiangsu Province (No. BK20160156), and research base of humanities and social science outside Jiangsu universities “research center of southern Jiangsu capital market” (No. 2017ZSJD020).

Acknowledgments

We sincerely thank the anonymous reviewers for their helpful and constructive suggestions and the editors for their careful and patient work.

Conflicts of Interest

The authors declare no conflict of interest.

Appendix A

Table A1. Recent literatures of corporate failure forecasting.
LiteratureSampleCountryVariableModel
Li et al. (2019)hospitality firmsChinafinancial ratiocase-based deep-layer predictive analysis
Mai et al. (2019)firmsUSAtextual variable, financial ratioaverage embedding model, CNN
Gonzalez et al. (2019)construction firmsSpainFinancial ratio, macroeconomiceconometric model
Hosaka (2019)firmsJapanfinancial ratioCNN
Liu and Wu (2019)firmsChinafinancial ratiohierarchical selective ensemble model
Charalambakis and Garrett (2019)firmsGreekfinancial ratio, macroeconomicdiscrete hazard model
Climent et al. (2018)banksEuropeanfinancial ratioextreme gradient boosting approach
Forgione and Migliardo (2018)banksItaliagovernance, financial ratiobayesian logit, monte carlo markov chain
Gupta et al. (2018)firmsUSAcharacter, financial ratiomultivariate hazard model
Weinblat (2018)high-growth firmsEuropeancharacter, financial ratiorandom forest
Kim (2018)hotel, restaurant, amusement, recreation firmsUSAfinancial ratioSupport vector machine-neural network-decision tree
Gogas et al. (2018)banksUSAFinancial ratioSVM
Boratynska and Grzegorzewska (2018)agribusiness firmsPolandmacroeconomic, agribusiness sector, financial ratiofuzzy set- Qualitative Comparative Analysis
Dong et al. (2018)firmsChinafinancial ratioquantile hazard model
Kim et al. (2018)manufacture firmsKoreafinancial ratiodata depth based SVM
du Jardin (2018)firmsFrancefinancial ratiofailure pattern-based ensemble model
Liang et al. (2018)firmsAustralia, Germany, Chinafinancial ratioUV ensemble model
Gabbianelli (2018)firmsItaliafinancial ratios, regionlogit
de Bock (2017)firmsBelgium, France, Italiafinancial ratio, characterspline-rule ensemble model
Doumpos et al. (2017)energy firmsEuropeanfinancial ratios, macroeconomicMultiple Criteria Decision Making
Tian and Yu (2017)firmsEuropean, Japanfinancial ratioshazard model, Least absolute shrinkage and selection operator
Jones (2017)firmsUSAfinancial ratios, governance, macroeconomicgradient boosting model
Amendola et al. (2017)building firmsItaliafinancial ratiosRedeo, generalized additive model
Ghosh (2017)public banksIndiafinancial ratiosneural trace
Altman et al. (2017)firmEuropean, USAfinancial ratiosZ-score model
Table A2. Financial ratios widely adopted in prior studies for corporate failure forecasting.
No.Financial RatioNo.Financial Ratio
x 1 Net operating income rate x 2 Net income/total asset
x 3 Net profit margin of total assets x 4 Retained earnings/total asset
x 5 Tax rates x 6 Earnings before interest and taxes/total asset
x 7 Equity value per share x 8 No-credit interval
x 9 Continuous 4 quarterly EPS (earning per share) x 10 log(total assets/Gross National Product price-level index)
x 11 Operating earnings per share x 12 Return on equity
x 13 Equity growth ratio x 14 Return on total assets
x 15 Earning per share x 16 Return on invested capital
x 17 Current ratio x 18 Operating margin
x 19 Cash flow/total debt x 20 Profit margin
x 21 Cash flow/total asset x 22 Asset-liability ratio
x 23 Cash flow/sales x 24 Tangible net debt ratio
x 25 Debt ratio x 26 Working capital ratio
x 27 Working capital/total asset x 28 Working capital/net assets
x 29 Market value equity/total debt x 30 Equity ratio
x 31 Current assets/total asset x 32 Long-term debt ratio
x 33 Quick asset/total asset x 34 Equity to liability ratio
x 35 Sales/total asset x 36 Interest coverage ratio
x 37 Current debt/sales x 38 Account receivable turnover
x 39 Quick asset/sales x 40 Account payable turnover
x 41 Working capital/sales x 42 Inventories turnover
x 43 Total assets turnover x 44 Fixed assets turnover
x 45 Working capital turnover x 46 Net operating cash flow per share
x 47 Net assets per share x 48 Net cash flow of investing activities per share
x 49 Growth ratio of net profit x 50 Capital maintenance and appreciation
x 51 Provident fund per share x 52 Sales growth rate of major operation
x 53 Growth ratio of total assets x 54 Price-to-book ratio
x 55 Cash flow to current liability x 56 Cash to main business income ratio
x 57 One if total liabilities exceeds total assets, zero otherwise
x 58 ( N I t N I t 1 ) / ( | N I t | + | N I t 1 | ) , N I t : Latest net income

References

  1. International Energy Agency. World Energy Outlook 2018-Executive Summary; International Energy Agency: Paris, France, 2018. [Google Scholar]
  2. Doumpos, M.; Andriosopoulos, K.; Galariotis, E.; Makridou, G.; Zopounidis, C. Corporate failure prediction in the European energy sector: A multicriteria approach and the effect of country characteristics. Eur. J. Oper. Res. 2017, 262, 347–360. [Google Scholar] [CrossRef]
  3. Bogetoft, P.; Kromann, L. Evaluating treatment effects using data envelopment analysis on matched samples: An analysis of electronic information sharing and firm performance. Eur. J. Oper. Res. 2018, 270, 302–313. [Google Scholar] [CrossRef]
  4. Fan, L.W.; Pan, S.J.; Liu, G.Q.; Zhou, P. Does energy efficiency affect financial performance? Evidence from Chinese energy-intensive firms. J. Clean. Prod. 2017, 151, 53–59. [Google Scholar] [CrossRef]
  5. Sun, J.; Li, H.; Huang, Q.-H.; He, K.-Y. Predicting financial distress and corporate failure: A review from the state-of-the-art definitions, modeling, sampling, and featuring approaches. Knowl. Based Syst. 2014, 57, 41–56. [Google Scholar] [CrossRef]
  6. Wang, L.; Wu, C. Business failure prediction based on two-stage selective ensemble with manifold learning algorithm and kernel-based fuzzy self-organizing map. Knowl. Based Syst. 2017, 121, 99–110. [Google Scholar] [CrossRef]
  7. Altman, E.I. Fincial ratios, discriminant analysis and the prediction of corporate bankruptcy. J. Financ. 1968, 23, 589–609. [Google Scholar] [CrossRef]
  8. Liu, J.; Wu, C. Hybridizing kernel-based fuzzy c-means with hierarchical selective neural network ensemble model for business failure prediction. J. Forecast. 2019, 38, 92–105. [Google Scholar] [CrossRef]
  9. Xu, W.; Xiao, Z.; Dang, X.; Yang, D.; Yang, X. Financial ratio selection for business failure prediction using soft set theory. Knowl. Based Syst. 2014, 63, 59–67. [Google Scholar] [CrossRef]
  10. Hosaka, T. Bankruptcy prediction using imaged financial ratios and convolutional neural networks. Expert Syst. Appl. 2019, 117, 287–299. [Google Scholar] [CrossRef]
  11. Li, H.; Xu, Y.-H.; Yu, L. Predicting hospitality firm failure: Mixed sample modelling. Int. J. Contemp. Hosp. Manag. 2017, 29, 1770–1792. [Google Scholar] [CrossRef]
  12. Ohlson, J.A. Financial ratios and the probabilistic prediction of bankruptcy. J. Account. Res. 1980, 18, 109–131. [Google Scholar] [CrossRef]
  13. Acosta-Gonzalez, E.; Fernandez-Rodriguez, F. Forecasting Financial Failure of Firms via Genetic Algorithms. Comput. Econ. 2014, 43, 133–157. [Google Scholar] [CrossRef]
  14. Gepp, A.; Kumar, K.; Bhattacharya, S. Business Failure Prediction using Decision Trees. J. Forecast. 2010, 29, 536–555. [Google Scholar] [CrossRef]
  15. Yu, L.; Yao, X.; Wang, S.; Lai, K.K. Credit risk evaluation using a weighted least squares SVM classifier with design of experiment for parameter selection. Expert Syst. Appl. 2011, 38, 15392–15399. [Google Scholar] [CrossRef]
  16. Chen, Y.-S.; Cheng, C.-H. Forecasting PGR of the financial industry using a rough sets classifier based on attribute-granularity. Knowl. Inf. Syst. 2010, 25, 57–79. [Google Scholar] [CrossRef]
  17. Mai, F.; Tian, S.; Lee, C.; Ma, L. Deep learning models for bankruptcy prediction using textual disclosures. Eur. J. Oper. Res. 2019, 274, 743–758. [Google Scholar] [CrossRef]
  18. Altman, E.I.; Iwanicz-Drozdowska, M.; Laitinen, E.K.; Suvas, A. Financial Distress Prediction in an International Context: A Review and Empirical Analysis of Altman’s Z-Score Model. J. Int. Financ. Manag. Account. 2017, 28, 131–171. [Google Scholar] [CrossRef]
  19. Jayasekera, R. Prediction of company failure: Past, present and promising directions for the future. Int. Rev. Financ. Anal. 2018, 55, 196–208. [Google Scholar] [CrossRef]
  20. Alaka, H.A.; Oyedele, L.O.; Owolabi, H.A.; Kumar, V.; Ajayi, S.O.; Akinade, O.O.; Bilal, M. Systematic review of bankruptcy prediction models: Towards a framework for tool selection. Expert Syst. Appl. 2018, 94, 164–184. [Google Scholar] [CrossRef]
  21. Forgione, A.F.; Migliardo, C. Forecasting distress in cooperative banks: The role of asset quality. Int. J. Forecast. 2018, 34, 678–695. [Google Scholar] [CrossRef]
  22. Boratynska, K.; Grzegorzewska, E. Bankruptcy prediction in the agribusiness sector: Lessons from quantitative and qualitative approaches. J. Bus. Res. 2018, 89, 175–181. [Google Scholar] [CrossRef]
  23. Bae, J.K. Predicting financial distress of the South Korean manufacturing industries. Expert Syst. Appl. 2012, 39, 9159–9165. [Google Scholar] [CrossRef]
  24. Li, H.; Xu, Y.-H.; Li, X.; Xu, H. Failure analysis of corporations with multiple hospitality businesses. Tour. Manag. 2019, 73, 21–34. [Google Scholar] [CrossRef]
  25. Muñoz-Izquierdo, N.; Segovia-Vargas, M.J.; Camacho-Miñano, M.-D.-M.; Pascual-Ezama, D. Explaining the causes of business failure using audit report disclosures. J. Bus. Res. 2019, 98, 403–414. [Google Scholar] [CrossRef]
  26. Arslan-Ayaydin, Ö.; Thewissen, J. The financial reward for environmental performance in the energy sector. Energy Environ. 2016, 27, 389–413. [Google Scholar] [CrossRef]
  27. Li, L.; Goh, T.-T.; Jin, D. How textual quality of online reviews affect classification performance: A case of deep learning sentiment analysis. Neural Comput. Appl. 2018, 37, 1–29. [Google Scholar] [CrossRef]
  28. Abedin, M.Z.; Guotai, C.; Colombage, S.; Moula, F.E. Credit default prediction using a support vector machine and a probabilistic neural network. J. Credit Risk 2018, 14, 1–27. [Google Scholar] [CrossRef]
  29. Molodtsov, D. Soft set theory—First results. Comput. Math. Appl. 1999, 37, 19–31. [Google Scholar] [CrossRef]
  30. Liang, D.; Tsai, C.-F.; Dai, A.-J.; Eberle, W. A novel classifier ensemble approach for financial distress prediction. Knowl. Inf. Syst. 2018, 54, 437–462. [Google Scholar] [CrossRef]
  31. Xiao, Z.; Yang, X.; Pang, Y.; Dang, X. The prediction for listed companies’ financial distress by using multiple prediction methods with rough set and Dempster–Shafer evidence theory. Knowl. Based Syst. 2012, 26, 196–206. [Google Scholar] [CrossRef]
  32. Prusak, B. Review of Research into Enterprise Bankruptcy Prediction in Selected Central and Eastern European Countries. Int. J. Financ. Stud. 2018, 6, 60. [Google Scholar] [CrossRef]
  33. Mufti, S.W.; Amjad, S. Cross Industry Capital Structure and Firm Characteristics in Pakistan. Int. J. Inf. Bus. Manag. 2018, 10, 174–188. [Google Scholar]
  34. Climent, F.; Momparler, A.; Carmona, P. Anticipating bank distress in the Eurozone: An Extreme Gradient Boosting approach. J. Bus. Res. 2018. [Google Scholar] [CrossRef]
  35. du Jardin, P. Dynamics of firm financial evolution and bankruptcy prediction. Expert Syst. Appl. 2017, 75, 25–43. [Google Scholar] [CrossRef]
  36. Charalambakis, E.C.; Garrett, I. On corporate financial distress prediction: What can we learn from private firms in a developing economy? Evidence from Greece. Rev. Quant. Financ. Account. 2019, 52, 467–491. [Google Scholar] [CrossRef]
  37. Wei, L.; Su, R.; Luan, S.; Liao, Z.; Manavalan, B.; Zou, Q.; Shi, X. Iterative feature representations improve N4-methylcytosine site prediction. Bioinformatics 2019. [Google Scholar] [CrossRef] [PubMed]
  38. Boopathi, V.; Subramaniyam, S.; Malik, A.; Lee, G.; Manavalan, B.; Yang, D.-C. mACPpred: A support vector machine-based meta-predictor for identification of anticancer peptides. Int. J. Mol. Sci. 2019, 20, 1964. [Google Scholar] [CrossRef]
  39. Manavalan, B.; Basith, S.; Shin, T.H.; Wei, L.; Lee, G. mAHTPred: A sequence-based meta-predictor for improving the prediction of anti-hypertensive peptides using effective feature representation. Bioinformatics 2018, 1–8. [Google Scholar] [CrossRef]
  40. Basith, S.; Manavalan, B.; Shin, T.H.; Lee, G. iGHBP: Computational identification of growth hormone binding proteins from sequences using extremely randomised tree. Comput. Struct. Biotechnol. J. 2018, 16, 412–420. [Google Scholar] [CrossRef]
  41. de Bock, K.W. The best of two worlds: Balancing model strength and comprehensibility in business failure prediction using spline-rule ensembles. Expert Syst. Appl. 2017, 90, 23–39. [Google Scholar] [CrossRef]
  42. Chen, M.-Y. A hybrid ANFIS model for business failure prediction utilizing particle swarm optimization and subtractive clustering. Inf. Sci. 2013, 220, 180–195. [Google Scholar] [CrossRef]
  43. Liang, R.; Wang, J.-Q. A Linguistic Intuitionistic Cloud Decision Support Model with Sentiment Analysis for Product Selection in E-commerce. Int. J. Fuzzy Syst. 2019, 21, 963–977. [Google Scholar] [CrossRef]
  44. Howard, J.; Ruder, S. Universal Language Model Fine-tuning for Text Classification. arXiv 2018, arXiv:1801.06146. [Google Scholar] [Green Version]
  45. Mirończuk, M.M.; Protasiewicz, J. A recent overview of the state-of-the-art elements of text classification. Expert Syst. Appl. 2018, 106, 36–54. [Google Scholar] [CrossRef]
  46. Mikolov, T.; Sutskever, I.; Chen, K.; Corrado, G.S.; Dean, J. Distributed Representations of Words and Phrases and their Compositionality. In Advances in Neural Information Processing Systems 26; Burges, C.J.C., Bottou, L., Welling, M., Ghahramani, Z., Weinberger, K.Q., Eds.; Curran Associates, Inc.: Red Hook, NY, USA, 2013; pp. 3111–3119. [Google Scholar]
  47. Kvamme, H.; Sellereite, N.; Aas, K.; Sjursen, S. Predicting mortgage default using convolutional neural networks. Expert Syst. Appl. 2018, 102, 207–217. [Google Scholar] [CrossRef] [Green Version]
  48. Manavalan, B.; Shin, T.H.; Lee, G. DHSpred: Support-vector-machine-based human DNase I hypersensitive sites prediction using the optimal features selected by random forest. Oncotarget 2018, 9, 1944–1956. [Google Scholar] [CrossRef]
  49. Wei, L.; Luan, S.; Nagai, L.A.E.; Su, R.; Zou, Q. Exploring sequence-based features for the improved prediction of DNA N4-methylcytosine sites in multiple species. Bioinformatics 2018, 35, 1326–1333. [Google Scholar] [CrossRef]
  50. Manavalan, B.; Shin, T.H.; Lee, G. PVP-SVM: Sequence-based prediction of phage virion proteins using a support vector machine. Front. Microbiol 2018, 9, 476. [Google Scholar] [CrossRef]
  51. Wei, L.; Chen, H.; Su, R. M6APred-EL: A sequence-based predictor for identifying N6-methyladenosine sites using ensemble learning. Mol. Ther. Nucleic Acids 2018, 12, 635–644. [Google Scholar] [CrossRef]
  52. Manavalan, B.; Basith, S.; Shin, T.H.; Choi, S.; Kim, M.O.; Lee, G. MLACP: Machine-learning-based prediction of anticancer peptides. Oncotarget 2017, 8, 77121–77136. [Google Scholar] [CrossRef] [PubMed]
  53. Gong, K.; Wang, Y.; Xu, M.; Xiao, Z. BSSReduce an $O(\left|U\right|)$ Incremental Feature Selection Approach for Large-Scale and High-Dimensional Data. IEEE Trans. Fuzzy Syst. 2018, 26, 3356–3367. [Google Scholar] [CrossRef]
  54. Bradley, A.P. The use of the area under the ROC curve in the evaluation of machine learning algorithms. Pattern Recognit. 1997, 30, 1145–1159. [Google Scholar] [CrossRef] [Green Version]
  55. Tian, S.; Yu, Y. Financial ratios and bankruptcy predictions: An international evidence. Int. Rev. Econ. Financ. 2017, 51, 510–526. [Google Scholar] [CrossRef]
  56. Cecchini, M.; Aytug, H.; Koehler, G.J.; Pathak, P. Making words work: Using financial text as a predictor of financial events. Decis. Support Syst. 2010, 50, 164–175. [Google Scholar] [CrossRef]
  57. Bengio, Y. Practical Recommendations for Gradient-Based Training of Deep Architectures. In Neural Networks: Tricks of the Trade, 2nd ed.; Montavon, G., Orr, G.B., Müller, K.-R., Eds.; Springer: Berlin/Heidelberg, Germany, 2012; pp. 437–478. [Google Scholar] [Green Version]
  58. Davey, H.; Yi, A. Intellectual capital disclosure in Chinese (mainland) companies. J. Intellect. Cap. 2010, 11, 326–347. [Google Scholar]
Figure 1. The framework of the novel integrated model (NIM).
Energies 12 02251 g001
Figure 2. The algorithm of NIM for corporate failure forecasting in the Chinese energy sector.
Energies 12 02251 g002
Figure 3. The framework of the empirical experiment. SVM: support vector machine; CNN-DLT: convolutional neural network oriented deep learning (CNN-DL) trained using textual data; CNN-DLM: CNN-DL trained using textual data and numerical data; IMUV: unanimous voting method; IMET: Dempster–Shafer evidence theory.
Energies 12 02251 g003
Figure 4. The receiver operating characteristics (ROC) curve of each model with the energy training data and the testing data. (a) Evaluation results with the testing data set of the year ( t 2 ) ; (b) evaluation results with the testing data set of the year ( t 3 ) . The confidence level is 95%.
Energies 12 02251 g004
Figure 5. The ROC curve of each model with the comprehensive training data and the testing data. (a) Evaluation results with the testing data set of the year ( t 2 ) ; (b) evaluation results with the testing data set of the year ( t 3 ) . The confidence level is 95%.
Energies 12 02251 g005aEnergies 12 02251 g005b
Figure 6. Performance comparisons of models with the energy training data set and the comprehensive training data set. (a) Evaluation results with the testing data set of the year ( t 2 ) ; (b) evaluation results with the testing data set of the year ( t 3 ) .
Energies 12 02251 g006
Figure 7. Performance comparisons of models evaluated using the testing data set of the year ( t 2 ) and ( t 3 ) . (a) Models trained using the energy training data set; (b) models trained using the comprehensive training data set.
Energies 12 02251 g007
Table 1. Financial ratios selected using the energy training data set of the year ( t 2 ) .
No.Financial RatioNo.Financial Ratio
x 2 Net income/total asset x 15 Earning per share
x 19 Cash flow/total debt x 25 Debt ratio
x 29 Market value equity/total debt x 38 Account receivable turnover
x 45 Working capital turnover x 52 Sales growth rate of major operation
x 57 One if total liabilities exceeds total assets, zero otherwise
x 58 ( N I t N I t 1 ) / ( | N I t | + | N I t 1 | ) , N I t : Latest net income
Table 2. Financial ratios selected using the energy training data set of the year ( t 3 ) .
No.Financial RatioNo.Financial Ratio
x 2 Net income/total asset x 13 Equity growth ratio
x 15 Earning per share x 19 Cash flow/total debt
x 25 Debt ratio x 32 Long-term debt ratio
x 38 Account receivable turnover x 48 Net cash flow of investing activities per share
x 49 Growth ratio of net profit x 52 Sales growth rate of major operation
x 57 One if total liabilities exceeds total assets, zero otherwise
x 58 ( N I t N I t 1 ) / ( | N I t | + | N I t 1 | ) , N I t : Latest net income
Table 3. Financial ratios selected using the comprehensive training data set of the year ( t 2 ) .
No.Financial RatioNo.Financial Ratio
x 2 Net income/total asset x 9 Continuous 4 quarterly EPS
x 19 Cash flow/total debt x 25 Debt ratio
x 29 Market value equity/total debt x 30 Equity ratio
x 38 Account receivable turnover x 45 Working capital turnover
x 47 Net assets per share
x 57 One if total liabilities exceeds total assets, zero otherwise
x 58 ( N I t N I t 1 ) / ( | N I t | + | N I t 1 | ) , N I t : Latest net income
EPS: earning per share.
Table 4. Financial ratios selected using the comprehensive training data set of the year ( t 3 ) .
No.Financial RatioNo.Financial Ratio
x 2 Net income/total asset x 15 Earning per share
x 19 Cash flow/total debt x 25 Debt ratio
x 30 Equity ratio x 32 Long-term debt ratio
x 38 Account receivable turnover x 43 Total assets turnover
x 45 Working capital turnover x 47 Net assets per share
x 55 Cash flow to current liability x 56 Cash to main business income ratio
x 57 One if total liabilities exceeds total assets, zero otherwise
x 58 ( N I t N I t 1 ) / ( | N I t | + | N I t 1 | ) , N I t : Latest net income
Table 5. The out-of-sample forecasting area under the curve (AUC) scores of each model with the energy training data set of the year ( t 2 ) and ( t 3 ) .
YearSVMCNN-DLTCNN-DLMIMUVIMETNIM
( t 2 ) 0.81360.77190.82600.83840.84260.8508
( t 3 ) 0.73060.62650.69710.74710.73470.7636
Table 6. The out-of-sample forecasting AUC scores of each model with the comprehensive training data set of the year ( t 2 ) and ( t 3 ) .
YearSVMCNN-DLTCNN-DLMIMUVIMETNIM
( t 2 ) 0.76360.67190.72600.78840.79260.8008
( t 3 ) 0.68880.52230.63470.71770.67650.7384

