Article

BRIM: An Accurate Electricity Spot Price Prediction Scheme-Based Bidirectional Recurrent Neural Network and Integrated Market

1
College of Telecommunications and Information Engineering, Nanjing University of Posts and Telecommunications, Nanjing 210000, China
2
Faculty of Computer & Information Sciences, Hosei University, Tokyo 184-8584, Japan
3
Department of Human Informatics and Cognitive Sciences, Waseda University, Saitama 359-1192, Japan
*
Author to whom correspondence should be addressed.
Energies 2019, 12(12), 2241; https://doi.org/10.3390/en12122241
Submission received: 8 May 2019 / Revised: 5 June 2019 / Accepted: 10 June 2019 / Published: 12 June 2019
(This article belongs to the Section C: Energy Economics and Policy)

Abstract

:
For the benefit from accurate electricity price forecasting, not only can various electricity market stakeholders make proper decisions to gain profit in a competitive environment, but also power system stability can be improved. Nevertheless, because of the high volatility and uncertainty, it is an essential challenge to accurately forecast the electricity price. Considering that recurrent neural networks (RNNs) are suitable for processing time series data, in this paper, we propose a bidirectional long short-term memory (LSTM)-based forecasting model, BRIM, which splits the state neurons of a regular RNN into two parts: the forward states (using the historical electricity price information) are designed for processing the data in positive time direction and backward states (using the future price information available at inter-connected markets) for the data in negative time direction. Moreover, due to the fact that inter-connected power exchange markets show a common trend for other neighboring markets and can provide signaling information for each other, it is sensible to incorporate and exploit the impact of the neighboring markets on forecasting accuracy of electricity price. Specifically, future electricity prices of the interconnected market are utilized both as input features for forward LSTM and backward LSTM. By testing on day-ahead electricity prices in the European Power Exchange (EPEX), the experimental results show the superiority of the proposed method BRIM in enhancing predictive accuracy in comparison with the various benchmarks, and moreover Diebold-Mariano (DM) shows that the forecast accuracy of BRIM is not equal to other forecasting models, and thus indirectly demonstrates that BRIM statistically significantly outperforms other schemes.

1. Introduction

Liberalization and deregulation of electricity markets are the general trends of the global power system. Generally, with the growing complexity of electricity markets, the dynamics of electricity prices exhibit volatility, including non-storable nature of electrical energy, the need to maintain constant balance between supply and demand, inelastic demand over short time period, oligopolistic generation side, uncertainties in both load and generation sides, etc. [1]. In the environment of electric power trade marketization, accurate electricity price forecasting is significant to all stakeholders in the electricity market, for economic benefits are realized by electricity trading, and the acquisition of electricity price information in advance makes it possible to earn more profits in electricity exchanges. From the viewpoint of the power system, accurate electricity forecasting can increase system load rate, reduce system operation cost, and ensure the safety and stability of the power system. In brief, with accurate electricity price forecasting, not only can market participants make smart decisions to gain profit in a competitive and volatile environment, but also power system stability can be improved.

1.1. Research Motivation

Because of the high volatility and uncertainty, electricity price forecasting has become an essential challenge. In literature, a large variety of distinctive methodologies has been proposed. In general, electricity price forecasting includes point forecasting and probabilistic forecasting. The probabilistic forecasting means to provide forecasting output in the form of scenarios, intervals, probabilities, or density functions [2]. Considering that it can model the whole time-dependent distribution function of electricity prices and provide the possible price fluctuation range and the average price during a period of time, probabilistic forecasting is mainly used for mid- and long-term forecasting [3]. The majority of the existed electricity price forecasting schemes has concentrated on point forecasting, which forecasts the specific expected value of each future forecast point. A comprehensive review of electricity price forecasting approaches has been conducted by [4]. The electricity price forecasting literature is typically divided into five categories: (1) multi-agent or game theory models that attempt to simulate the whole operation phases of market agents; (2) fundamental methods that intentionally employ the physical and economic factors involved in electricity price forecasting; (3) reduced-form models that use statistical properties of electricity for risk and derivatives evaluation; (4) statistical models that is composed of multiple time series and econometric models; (5) artificial intelligence based methods that are especially used to deal with the non-linear data.
Chuntian Cheng et Al. [5] proposed a two-dimensional game model to study strategic bidding behaviors. In addition, this work demonstrated the noteworthy effects of market equilibrium (with varying market mechanism parameters) on electricity price and the power generation. The weak points of this work lie in that it is extremely difficult or even impossible to characterize many components involved, including the behaviors of players, their potential strategies/actions, their interaction ways, the set of payoffs. Generally, this methodology is more suitable for qualitative analysis than quantitative results.
As an extending of the fundamental market model, Ref. [6] proposed a novel hybrid approach, in which, to improve forecast accuracy, some statistical characteristics were used to recalibrate the forecasting results obtained from fundamental market price formation models. The weak points are the following: Considering the fundamental data often collected over long time intervals (such as weekly or monthly), pure fundamental models usually focus on medium-term forecasting rather than short-term.
Statistical models always estimate the current price through mathematically combining the previous prices and/or historical or current values of exogenous factors, typically including consumption and production values or weather conditions. Typical methods include similar-day and exponential smoothing methods, Regression models, AR (AutoRegressive)-type time series models, etc. However, the main disadvantage of this prediction paradigm is its limited ability to model the nonlinear behavior of electricity prices (usually occurred) and some related fundamental variables.
Through integrating the reduced-form models with statistical models, Ref. [7] proposed a Markov-switching GARCH (MS-GARCH) forecast model which could capture unique characteristics, such as consecutive spikes, and could incorporate the normal volatility regime and high volatility dynamics regime of daily electricity prices. The experimental results suggested that the MS-GARCH model achieved more accurate predictions than the conventional GARCH model. However, reduced-form models usually cannot provide accurate hourly price predictions and are, therefore, limited in practical applications.
Recently, because of its outstanding learning ability, especially the ability of modeling complex nonlinear patterns, deep learning has become one of the most widely used technologies in various fields, e.g., image recognition [8] and speech recognition [9].
Unlike feed-forward neural networks, RNNs (Recurrent neural networks) intentionally use their internal memory to process input sequences of arbitrary timing, which makes them suitable for handling time series data. That is, RNNs are sequence-based models and able to use previous information to connect with current tasks, which implies that past inputs of RNNs will have an impact on the output at the current moment. However, due to the problem of gradient vanishing, it is difficult for RNNs to capture long term dependencies and deal with sequences spanning a long interval [10]. To address the issue above, Hochreiter et Al. [11] proposed the long short-term memory (LSTM) RNN, an advanced RNN structure suitable for processing complex nonlinear time sequences and predicting important events with relatively long intervals and delays. Recently, RNN models have been successfully applied in machine translation [12].
Deep learning models are flexible and able to model complex and nonlinear problems, which makes them have the potential for short term predictions and be better alternatives to statistical models [4]. For forecasting day-ahead spot electricity prices, it is shown that three proposed deep learning models, i.e., the deep neural network (DNN) model and two hybrid models, including LSTM-DNN and the GRU (gated recurrent unit)-DNN, can obtain superior performance than all other machine learning and statistical methods. Compared with deep learning models, the traditional statistical approaches (e.g., ARIMA-GARCH) are unable to accommodate the complex nonlinear data relationship, can’t fit electricity prices with high volatility and uncertainty, and perform statistically significantly worse than deep learning models [13]. Interestingly, the results illustrate that the DNN model performs statistically better than hybrid deep learning models. But, in this work, the hybrid models simply separate and feed the data corresponding to future information (e.g., day-ahead forecasting) and historical information (e.g., past electricity prices) into two different neural networks. The weak point is obvious: If some past data are closely related to the future data, neither of these hybrid structures is capable of establishing appropriate relations between two networks, which leads to the worse performance than the traditional DNN model.
Nevertheless, all the above work with the exception of [13], ignored the influence of neighboring and connected markets on the electricity price forecast. Particularly, with different areas in the world, gradually enforcing a larger level of integration across national electricity markets, e.g., the European Union [14], it is possible that decisions and price strategies are simultaneously taken on several markets, based on available common information [15]. For example, through exploiting the price data of forward markets, the cross-market interactions of some major European electricity markets were analyzed [16], which illustrated an increasing integration over time. Especially, the German electricity market is the most integrated market, and as the common trend, German market behavior can provide signaling information for other regional markets [17]. In brief, due to the great possibility that decisions and price strategies can be simultaneously taken on several markets, through intentionally exploiting the commonly available information, it is most likely that neighboring markets can play an important role in improving forecasting accuracy.

1.2. Main Contributions

In this paper, unlike the existed deep learning-based electricity forecasting schemes that feed the historical and future electricity prices into two separate forward deep learning networks, and with intentionally taking into account the signaling effect of other integrated markets, we propose a Bidirectional RNN (LSTM) and Integrated Market based forecasting model (BRIM) for day-ahead electricity prices, and comprehensively evaluate its performance with real datasets in European markets. In detail, available data corresponding to past and future electricity prices are input into two-time directions of the BRIM model, instead of being separated into different neural networks. Therefore, even if some past data and day-ahead data are heavily related, our proposed model BRIM can build these relationships properly. In addition, considering the fact that the day-ahead auction price results of several inter-connected markets are actually revealed at different time, we intentionally exploit the relationship of these markets to improve the prediction accuracy of BRIM model, through utilizing the disclosed day-ahead prices of other connected exchange markets prior to the current market as the proper future price for the current market, and feeding this information into the backward LSTM neural network. In other words, we consider the influence of market integration to improve prediction accuracy.
In summary, our contributions are the following threefold.
  • Exploiting the idea of market integration (i.e., neighboring markets play a role in improving price forecasting accuracy) and utilizing the earlier announced electricity price of another inter-connected electricity market as the future price indicator of the market to be predicted;
  • Designing the bidirectional LSTM network structure, in which the historical price data are input into the conventional LSTM (forward LSTM), and the future price data are used for two purposes: one as the input features to the backward LSTM, and another as the input features to the forward LSTM.
  • Thorough experiments and comparisons with typical existing schemes are conducted to verify the prediction performance of our proposal, in terms of MAE (mean absolute error) and sMAPE (symmetric mean absolute percentage error). Furthermore, the Diebold-Mariano (DM) test is used to show the difference of our proposed BRIM model from other forecasting models, and indirectly demonstrates our forecasting model’s statistical significance.
The rest of this paper is organized as follows: Section 2 briefly summarizes the related work of electricity price forecasting and points out their weak points. Section 3 describes the proposed bidirectional LSTM and integrated market-based day-ahead electricity price forecasting model, BRIM. The thorough experimental results are provided and analyzed in Section 4. Finally, we briefly conclude this paper.

2. Related Work

2.1. Market Integration

Electricity is a standardized commodity that is usually cross-border traded. Especially Europe has witnessed the rapid market integration among countries, and the national market can’t be regarded as one isolated trading place. Market integration is conducive to enhance the balance between supply and demand, reduce the need for reserve capacity, and increase welfare through allocative efficiency [15]. Market integration mainly results from the sufficient interconnecting infrastructure between national electricity systems, sufficient incentives to improve cross border infrastructure, efficient allocation of existing capacities, and compatible market design between TSOs (Transmission System Operators) and/or spot market operators. As an example, the European Union is increasingly committed to establishing a single and integrated electricity market as part of a common European energy policy [18].
Since the price results of the day-ahead auctions for each market are revealed at different time points, it is natural and possible to use the relationship of these markets to improve the predictive performance of forecasting models.
Some research has been conducted to explore the relationship between various European electricity markets. The analysis on the interconnection relating to several spot markets has shown that in the European electricity markets, a significant degree of market integration has occurred, and the dynamics of spot price interaction begins to emerge plausible patterns [16].
For a rational decision-maker, the most efficient way to process and incorporate the information in her own decision is to consider all relevant information available. In [19], the authors have proven the potential integration and convergence trend among four European electricity markets by using multivariate co-integration techniques. Moreover, as the largest market in Central Europe, the German market seems to be the most integrated, and its behavior can effectively provide signaling information for other regional markets.
Based on the fact that the Energy Exchange Austria (EXAA) discloses day-ahead prices before most of the other European markets, Ref. [20] analyzed the relationship between EXAA day-ahead electricity price and other day-ahead electricity prices in Europe. The authors focus on these special markets that settle their prices after the EXAA, which makes traders able to include the EXAA price into their inference, that is, forecast the price of some other exchanges by incorporating the impact of the EXAA price. The experimental results illustrate that the proposed model utilizing the price of the EXAA significantly outperforms over its counterpart without the EXAA.
In a sense, the work above resembles one of the popular and typical statistical models in electricity price forecasting, the similar day method (i.e., searching the historical data in previous days that have characteristics similar to the predicted day, and using these historical values as forecasts for the predicted day), in that the earlier disclosed time series price of EXAA market is viewed as an external regressor (like the traditional historical price information available in the same market) to predict the price for the current market.

2.2. Deep Learning-Based Prediction Models

With the rapid development of deep learning in recent years, it has been extensively applied in various fields, including electricity-related research. Especially, in contrast to traditional machine learning tools that heavily rely on features defined by domain experts, deep learning algorithms can automatically and hierarchically extract features from raw data through multiple layers of nonlinear processing units, and effectively make predictions or take actions, according to some defined objectives.
Ref. [13] compared the performance of 27 state-of-the-art statistical methods and machine learning methods with four different deep learning models, e.g., DNN, LSTM-DNN, GRU-DNN, and convolutional neural network (CNN), for predicting electricity day-ahead prices. It was shown that deep learning models obtained higher predictive accuracy than machine learning and statistical methods.
LSTM is an advanced and one of the most popular structures of deep learning. To alleviate the high volatility and uncertainty caused by residents’ behaviors relative to aggregated loads, a multi-layer LSTM RNN-based framework was proposed in [21] to forecast electric loads of individual residential household. It was shown that this model could achieve the best forecasting performance in the dataset, compared with the simple back propagation neural network.
Adopting a time-varying fractional co-integration analysis, Ref. [17] confirmed that France and Belgium spot prices share strong convergent dynamics. Inspired by this finding, Ref. [22] proposed a deep neural network that takes into account market integration in France and Belgium markets to simultaneously predict electricity prices in these two connected markets. The proposed dual-market forecaster can further enhance predictive performance.
Future input information that comes later is often useful for forecasting as well. For RNN, this can be partially implemented through delaying the output with a certain time steps M to incorporate future information till x t c + M in prediction. In theory, the value of M could be very large to capture much future information available, but, practically, it is observed that predictive performance decreases if M is too large. The reason for this phenomenon may lie in that: with M becoming larger, RNN’s modeling power is increasingly used to memorize the input information up to the delayed time steps, leaving less modeling power to learn the predictive knowledge from different input vectors. To address this issue, Ref. [23] proposed a bidirectional RNN (BRNN) that can be trained using all past and future information available (with specific time steps), without limiting to only use a preset future frame input information.
For forecasting short-term energy load, Ref. [24] compared several different architectural variations of basic LSTMs, including sequence-to-sequence framework and bidirectional LSTMs. Experiments on real energy load data in the Italian energy market show that LSTMs can be successfully applied to energy load forecasting. Moreover, BRNNs are especially more effective than standard LSTM when the context of the input is intentionally utilized, that is, taking into consideration the seasonal information is important.
A deep stacked bidirectional and unidirectional LSTM RNN was proposed to forecast the network-wide traffic speed [25]. In particular, the bidirectional LSTMs can fully use the spatial correlation of the speeds in different locations and the temporal dependencies of the speed values to learn complex and comprehensive features. Compared with other classical and state-of-the-art models, the experiment results turn out that the proposed model is more efficient to learn spatial-temporal features, and can, therefore, achieve superior forecasting performance for the whole traffic network, in terms of accuracy and robustness.
Considering that the stacked architecture can enforce a deeper analysis on the training data to model more sophisticated data patterns, and bidirectional LSTMs have the ability to process and learn from data in the past and future time directions and combine forward and backward contextual information, Ref. [26] exploited the merits of both architectures, and similar to [25], for both short-term and long-term predictions of financial time series, bidirectional LSTM networks achieved better performance and convergence.
In brief, the bidirectional RNN architecture has been successfully utilized in several general time series forecasting. However, unlike speech recognition [27] or machine translation [28], where it is reasonable for bidirectional RNNs to make use of previous and future context (due to the fact that the whole utterances have already existed and can be used naturally), for general time series prediction, these bidirectional RNNs-related work actually only processes historical data in both directions without obtaining information from the real future input, since future context for the current output moment is usually not available.

3. Proposed BRIM Prediction Scheme

3.1. The LSTM Model

The architecture of LSTM block is formulated as the following equations:
Forget gate:
f t = σ ( W f x t + U f h t 1 + b f ) ,
Input gate:
i t = σ ( W i x t + U i h t 1 + b i ) ,
Output gate:
o t = σ ( W o x t + U o h t 1 + b o ) ,
Input cell state:
C ˜ t = tan h ( W c x t + U c h t 1 + b c ) ,
Memory cell state:
C t = f t C t 1 + i t C ˜ t ,
Hidden state:
h t = o t tan h ( C t ) ,
where W f ,     W i ,     W o , and   W c are weight matrices that link the input x t to the three gates and the input cell state;   U f ,     U i ,     U o , and   U c are weight matrices connecting the previous hidden state h t 1 to the three gates and the input cell state;   b f ,     b i ,     b o , and   b c are four bias vectors;   σ represents the sigmoid activation function, indicates the element-wise multiplication, and tan h stands for the tanh function. Figure 1 shows the LSTM block structure at a single time step.

3.2. The BRIM Framework

In our work, to fully exploit the effect of market integration and take advantage of more available features, we propose a bidirectional LSTM-based model to forecast spot electricity prices.
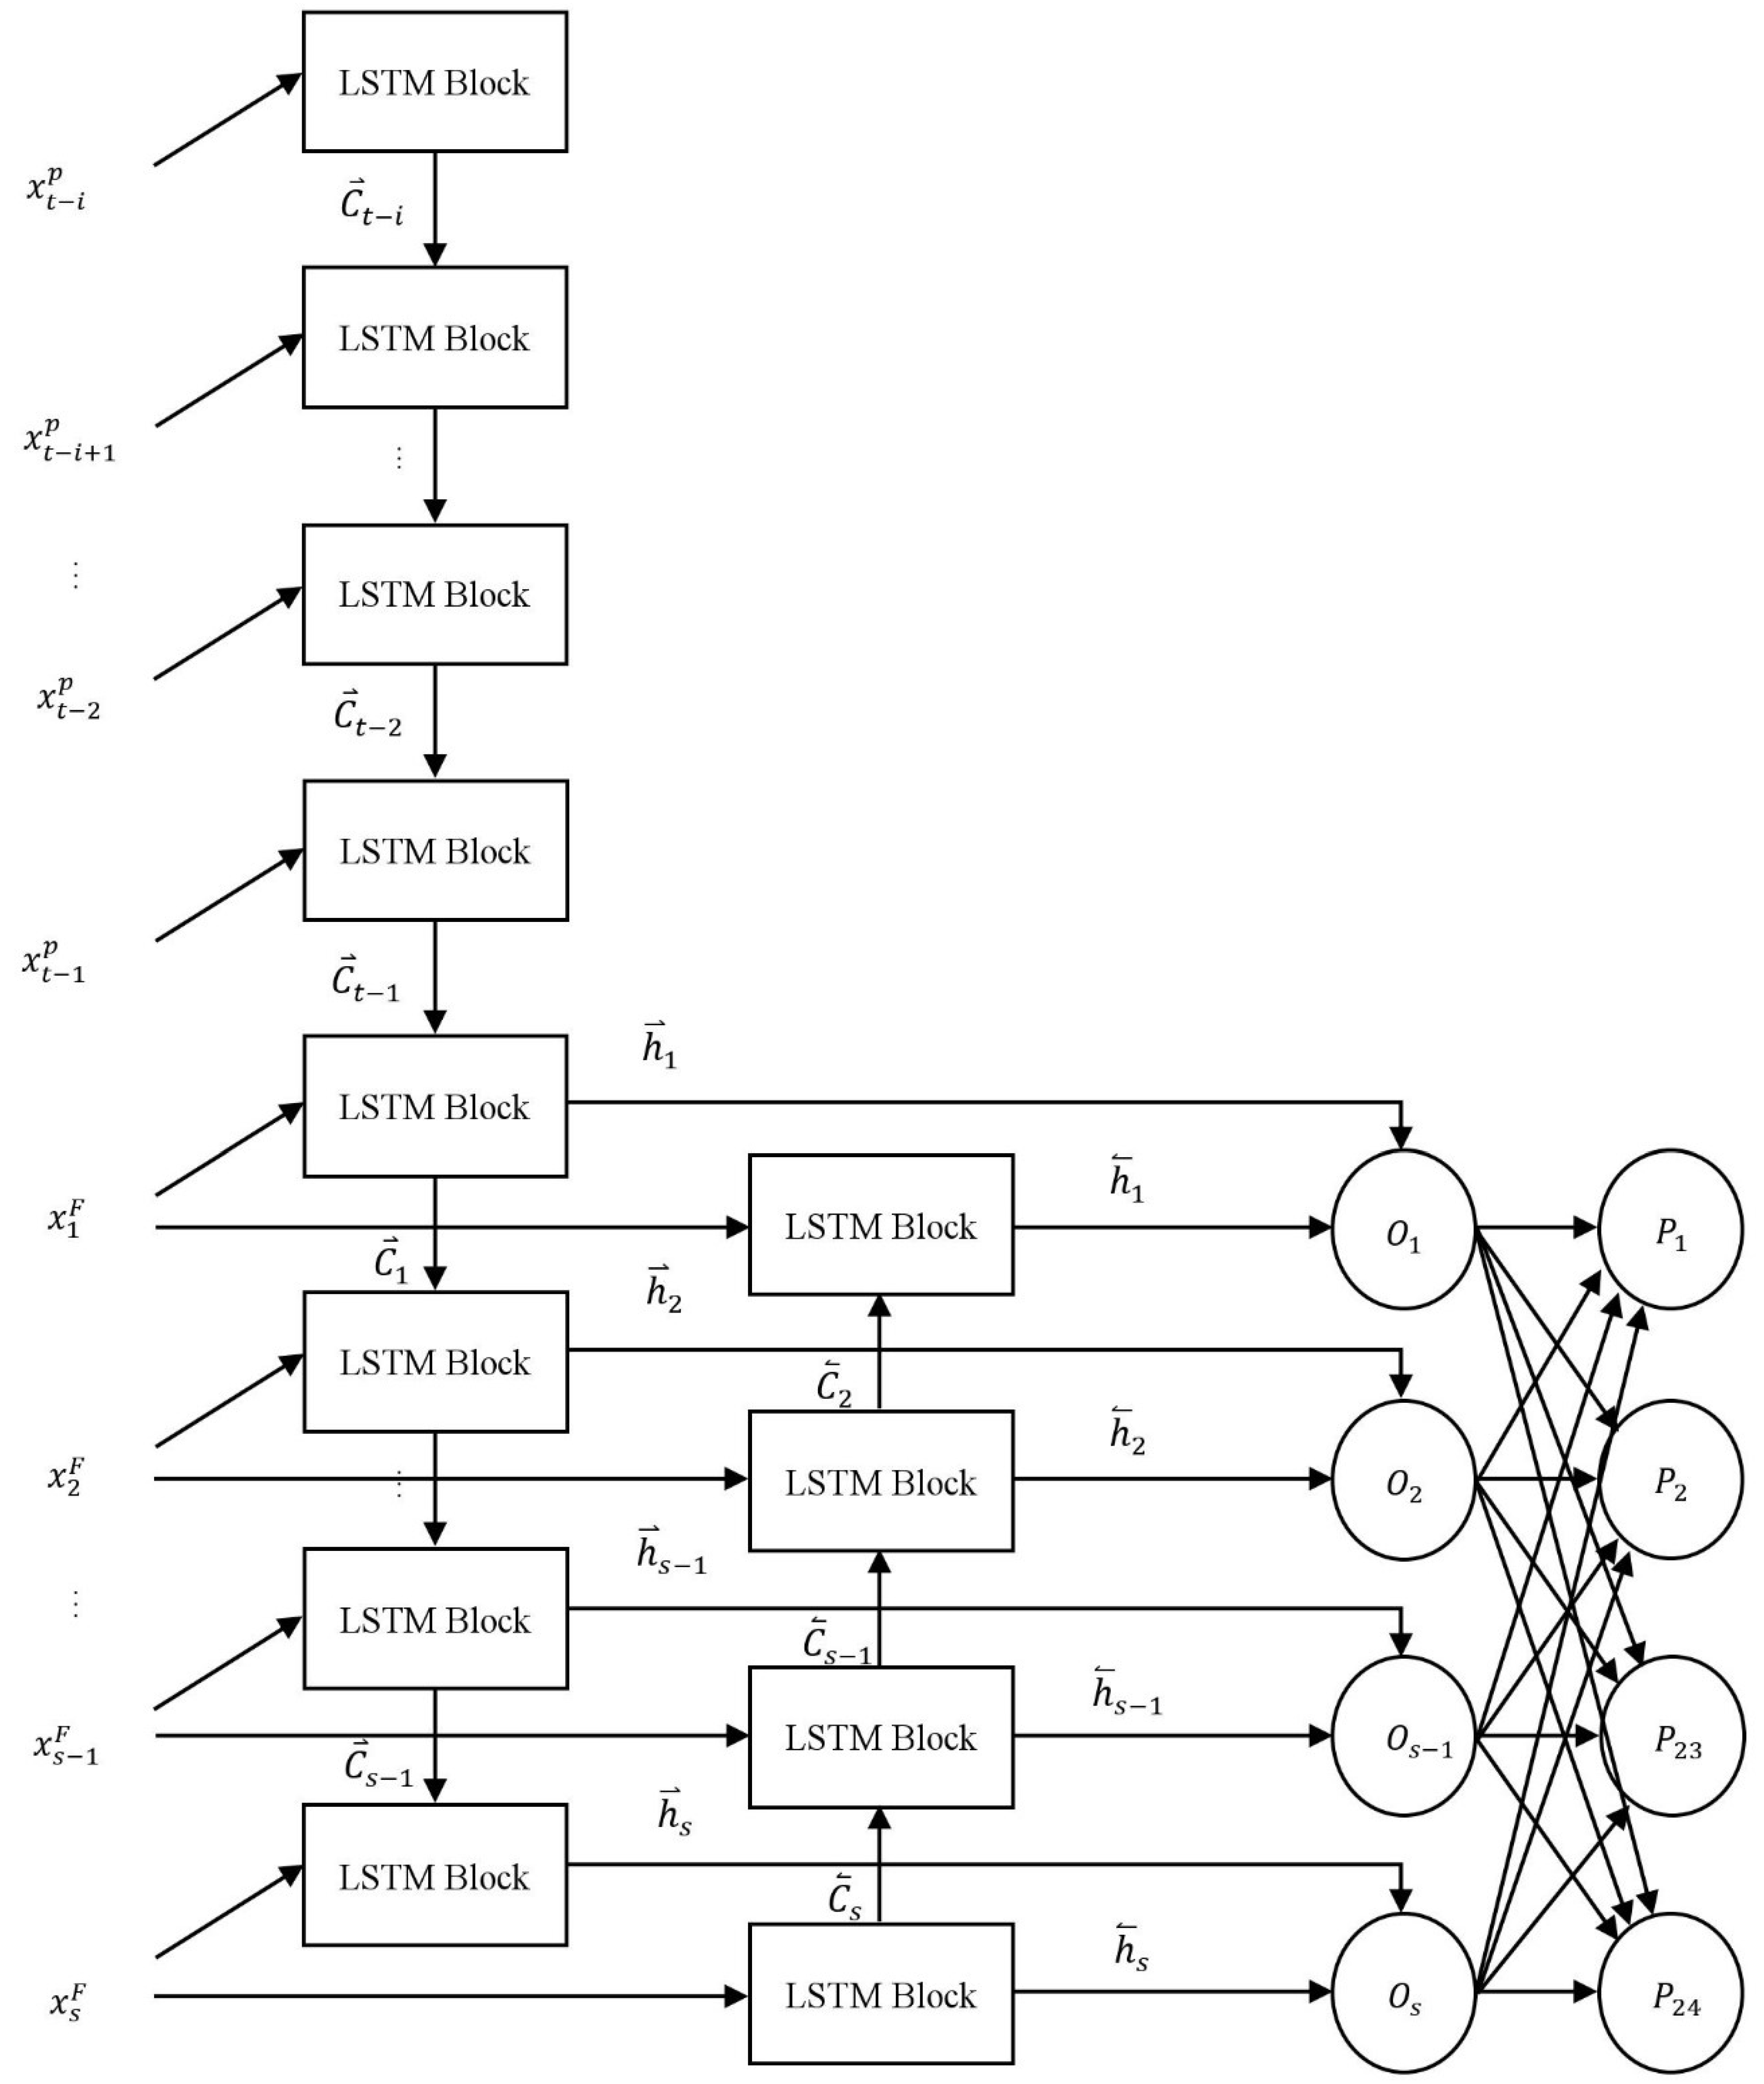
Figure 2 illustrates the model architecture of our proposed BRIM. First, historical electricity price data and available future information are concatenated into a time series. The connected sequence is then entered into the forward network and entered into the backward network after reversing. Finally, outputs from the forward network and backward network are combined and input to the output layer.
The detailed process is shown in Figure 3 below. We donate X p = [ x t i p ,   x t i + 1 p , , x t 2 p ,   x t 1 p ] T as electricity prices in the past i hour. We define that X F = [ x 1 F ,   x 2 F , ,   x s 1 F ,   x s F ] T is available future information in the future s hour, i.e., earlier announced price data from another inter-connected market. X = [ X P , X F ] and [ O 1 , O 2 , , O s ] T , respectively, represent the input and output of our proposed model. P = [ P 1 , P 2 , , P 23 , P 24 ] T represents the day ahead spot prices that are predicted by our scheme.
As mentioned above, the LSTM network can learn and model the sequential time data with relatively long intervals and delays in time sequences. The bidirectional LSTM architecture exploits all available data from forward and backward sequences in both time directions. It can be seen from Figure 3 that each output utilizes available past input information in the positive time direction, combing with data representing future information input in the negative time direction. In detail, the k t h output is determined by previous information in the past k + i 1 hours and available s k + 1 data representing future information. To a certain extent, the proposed model can solve the modeling power problem faced by the conventional RNN, for it is not needed to delay the output and can avoid the drawback of data being separated into different networks. Naturally, outputs can learn enough useful information from input data and properly build relationships between previous data and future data. Then, these outputs will be fed into a regular output layer that maps the bidirectional LSTM outputs to the forecasted 24 day-ahead prices.

4. Performance Evaluation

4.1. Dataset Description

In general, there are several classes of input variables influencing electricity prices. Forty variables are enumerated and used by various researchers [1]. The most widely used input variable in literature is the historical electricity prices.
According to the fact that German electricity market shows a common trend for other European electricity markets and provides signaling information in Central Europe, we use the data in the European Power Exchange (EPEX) and EXAA covering Germany to forecast day-ahead electricity prices in the EPEX. Just as described in [18], EXAA discloses the day-ahead prices at 10:20 pm, prior to the submission time point of the EPEX until 12:00 pm. Therefore, for forecasting the electricity price in EPEX, the day-ahead electricity prices in the EXAA become the available future information that is beneficial to improve predictive accuracy. The specific data used is following and the descriptive statistics of the dataset is given in Table 1.
  • The past prices X p = [ x t i p ,   x t i + 1 p , , x t 2 p ,   x t 1 p ] T in the EPEX-FR (France), representing past information.
  • The day-ahead prices X F = [ x 1 F ,   x 2 F , ,   x s 1 F ,   x s F ] T in the EXAA, representing future information.
Conventionally, the data are split into three sets:
  • Training set (from 26 December 2011 to 21 September 2016) is used to train forecasting models.
  • Validation set (from 22 September 2016 to 21 September 2017) is used for model selection.
  • Test set (from 22 September 2017 to 21 September 2018) is used to evaluate the model.
For deep learning models, data normalization is important, which can scale the data to fit into a small specific interval to ensure the modeling capability and convergence. In our work, all the data is normalized to the interval [−1, 1] via the following formula:
x n o r m a l i z e d = 2   ×   x r a w x m i n r a w x m a x r a w x m i n r a w   1 ,
where x r a w and x n o r m a l i z e d represent the raw data and the normalized data, respectively. Note that, all the normalized data are only used for training the parameters of the BRIM model, and raw data are used in evaluating the predictive performance. In addition, all the data are available from the following links: http://www.epexspot.com/en [29] and https://www.exaa.at/en [30].

4.2. Experimental Setup

The proposed BRIM and benchmark schemes are developed in python and deployed in a desktop PC with a 3.6 GHz Intel i9 processor, 16 GB of memory, and an NVIDIA GeForce RTX 2080 Ti GPU. The AR( p ) forecaster is modeled using the Statsmodels package [31]. The remaining deep learning schemes are built using the TensorFlow library [32].
In general, hyper-parameter tuning is critical to obtain the optimal forecasting performance. However, for the sake of conciseness and fair comparison, we set hyper-parameters as a certain ratio of those in the literature [13], which also works on forecasting spot electricity prices using deep learning, including LSTM. In our work, the sequence length of data consists of 1 week of past electricity prices in the EPEX and 24 day-ahead prices in the EXAA. The LSTM in both time directions has 47 hidden neurons, respectively. Moreover, the total number of epochs is set to 150 (refer to [21]). Hyper-parameter settings for the bidirectional LSTM-based model are summarized in Table 2.
Similar to the previous work [13,22], our proposed BRIM forecasting model is trained by optimizing the mean absolute error (MAE). In addition, the optimization problem is solved using Adam [33] that is a computationally efficient gradient-based optimization algorithm widely used in the field of machine learning.

4.3. Benchmark Schemes

In our experiments, we use the following four neural network architectures and three linear prediction models as benchmarks to evaluate the performance of our proposed BRIM model. Additionally, the setting method of hyper-parameters is the same as the previous section.
  • Unidirectional LSTM model using only past price sequences in the forward time direction, containing 41 neurons. It is named as Uni-LSTM1 in our experiments.
  • Unidirectional LSTM model using both past and future prices in the positive/forward time direction, containing 47 neurons. It is named as Uni-LSTM2 in our experiments.
  • DNN model proposed by [22]. This model is a simple extension to the traditional MLP (Multi-layer Perception), containing 239 in the first layer and 162 neurons in second hidden layers. It is named as DNN in our experiments.
  • LSTM-DNN model proposed by [13], containing 92 and 41 neurons in the DNN layer and LSTM layer, respectively. In detail, the past prices are processed by a forward LSTM, while the day-ahead prices representing future information are input into a DNN. Then, the outputs from these two separate networks are concatenated to determine the final prediction. It is named as LSTM-DNN in our experiments.
  • Persistent model, persistent EXAA-based model, and Univariate AR( p ) proposed by [20], respectively, abbreviated as naïve, naïve-EXAA, and AR( p ) in our experiments. In naïve mode, the electricity price is estimated to be the same as 168 h ago (usually representing one week). In naïve-EXAA model, since the EXAA day-ahead prices are released at an earlier point in time, it simply regards that the day-ahead electricity prices in the EPEX are the same as that in the EXAA. AR( p ) is the autoregressive process of order p , which is selected by minimizing the Akaike information criterion.

4.4. Experimental Results and Analysis

In order to compare the predictive performance of our proposed BRIM with other benchmark schemes, MAE and sMAPE are calculated on the out-of-sample data and used as performance metrics. These measures are defined as follows:
M A E = 1 n i = 1 n | P i A i | ,
s M A P E = 100 % n i = 1 n | P i A i | ( | P i | + | A i | ) / 2 ,
where P i is the predicted price, A i is the actual price, and n is the number of predicted hours.
The comparison of predictive accuracy of 8760 hours’ (one year) forecasts in the EPEX-FR is shown as follows.
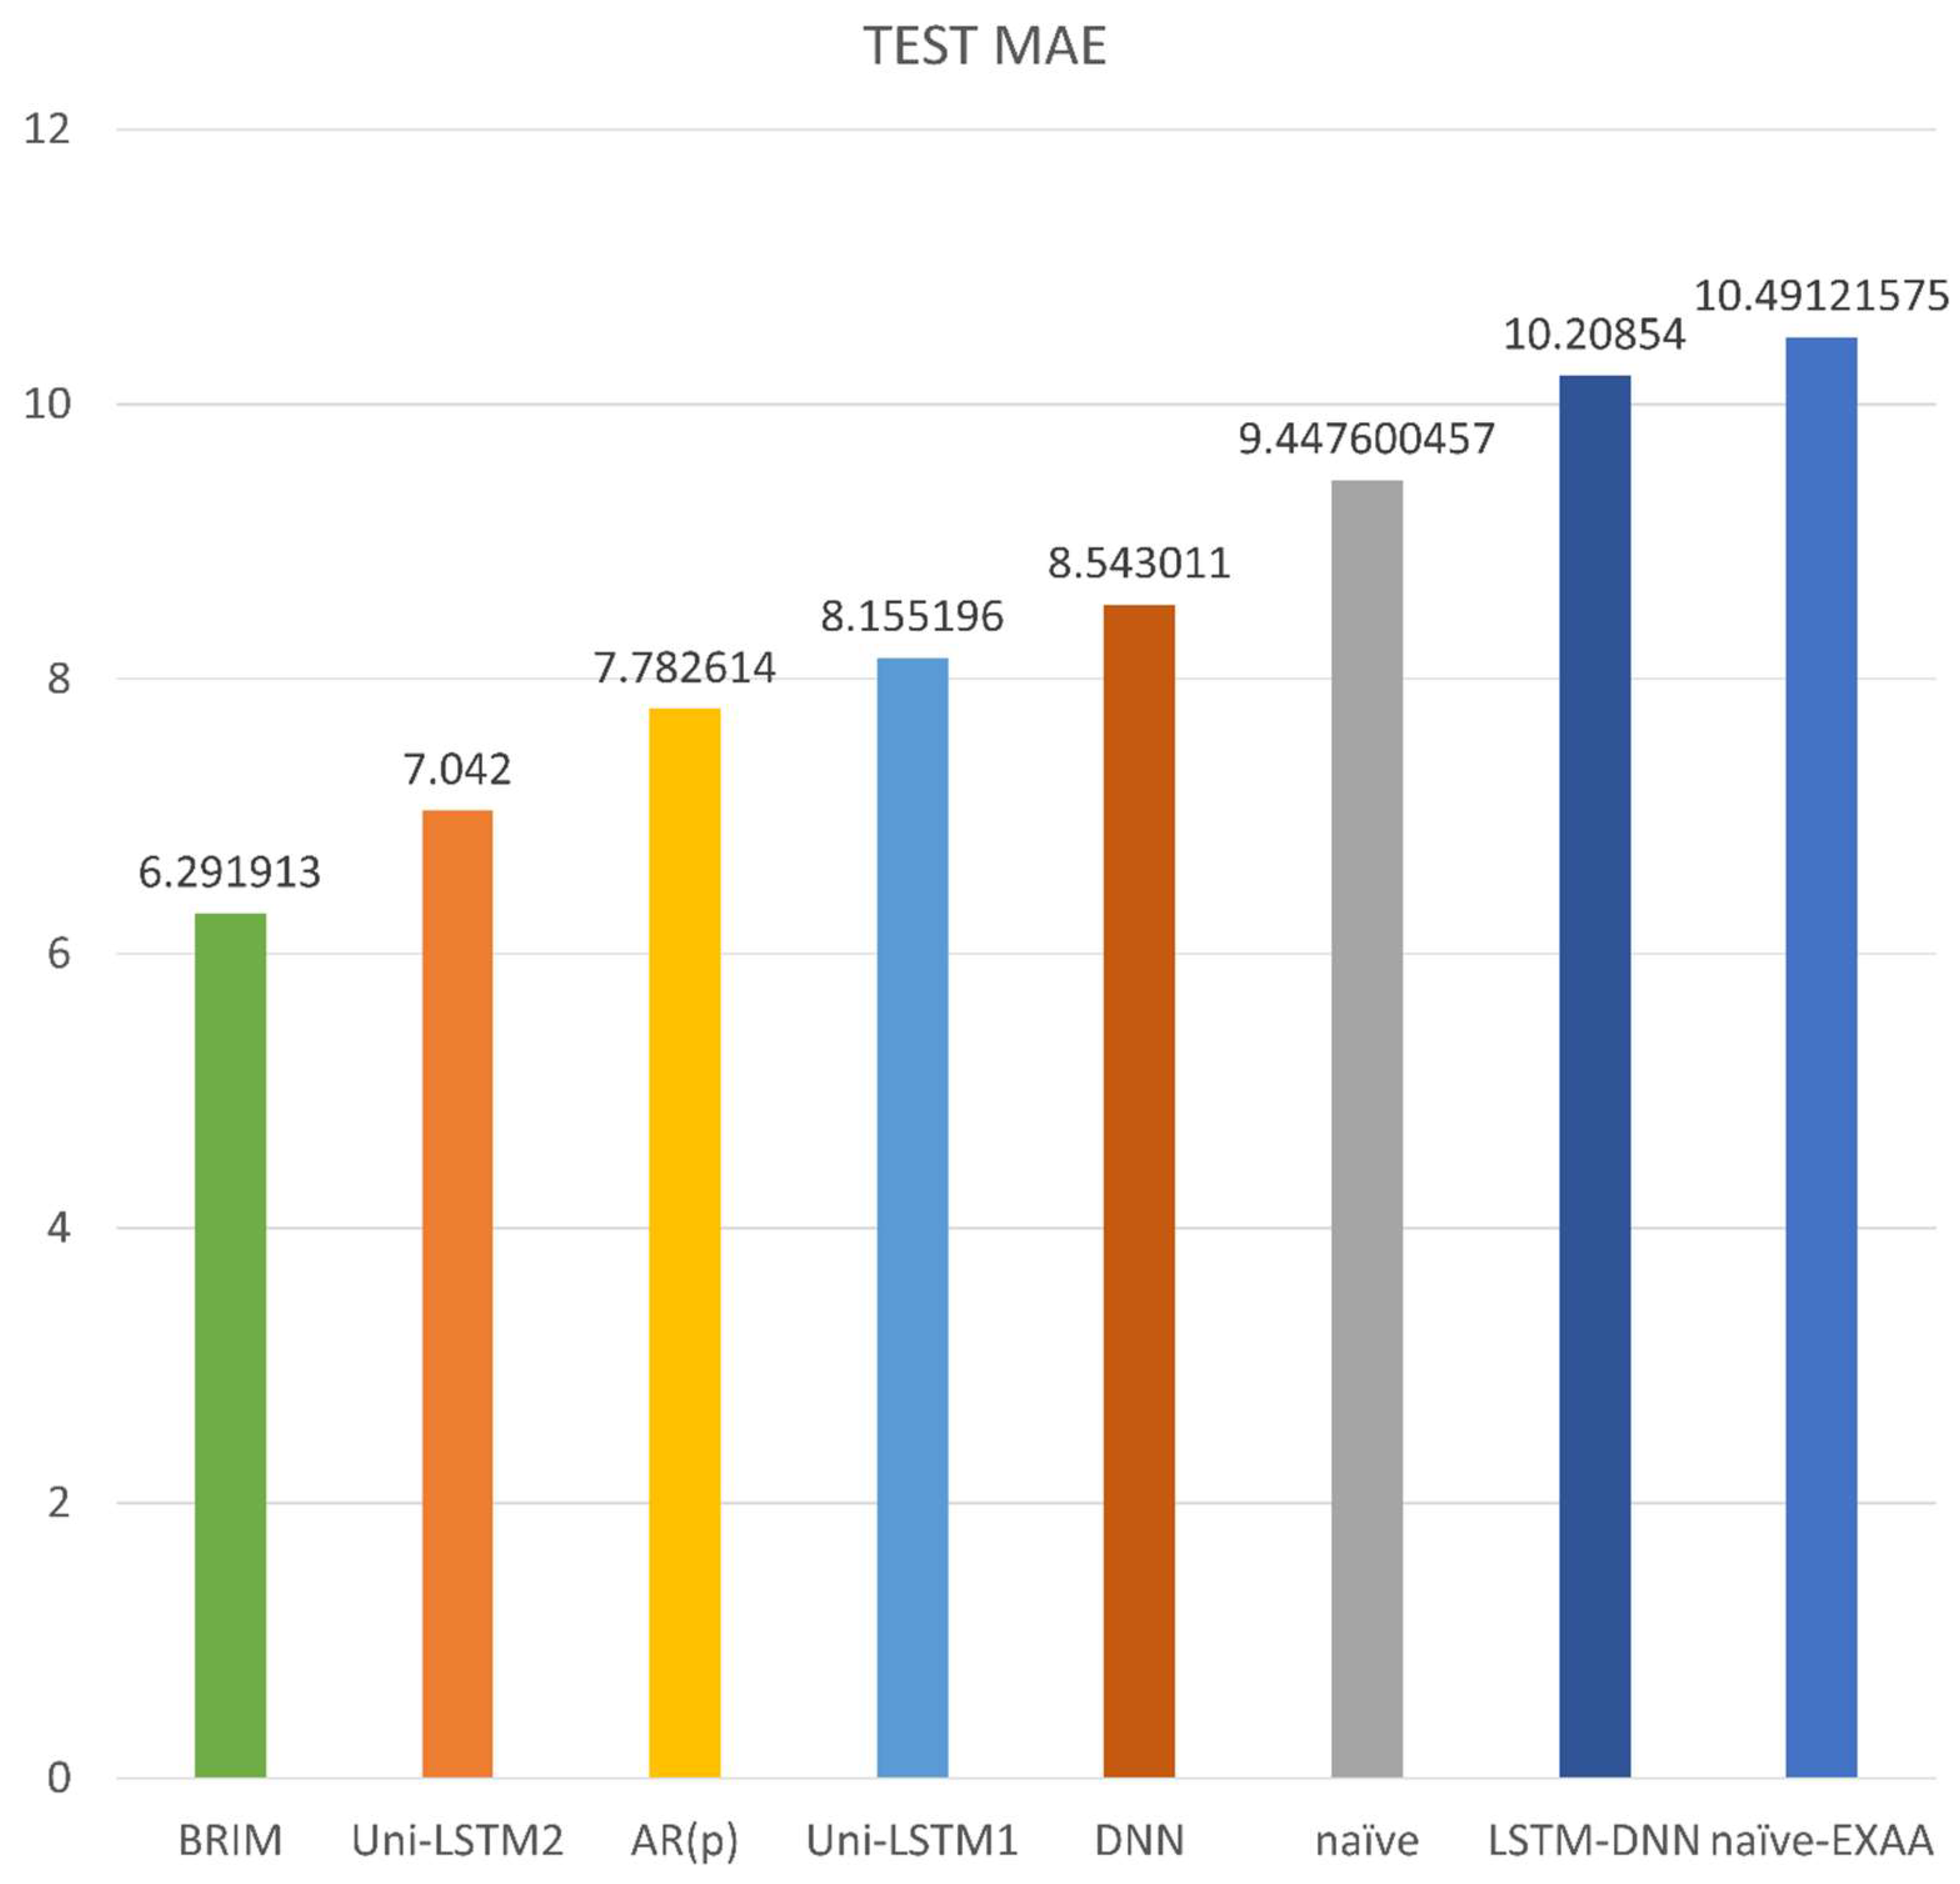
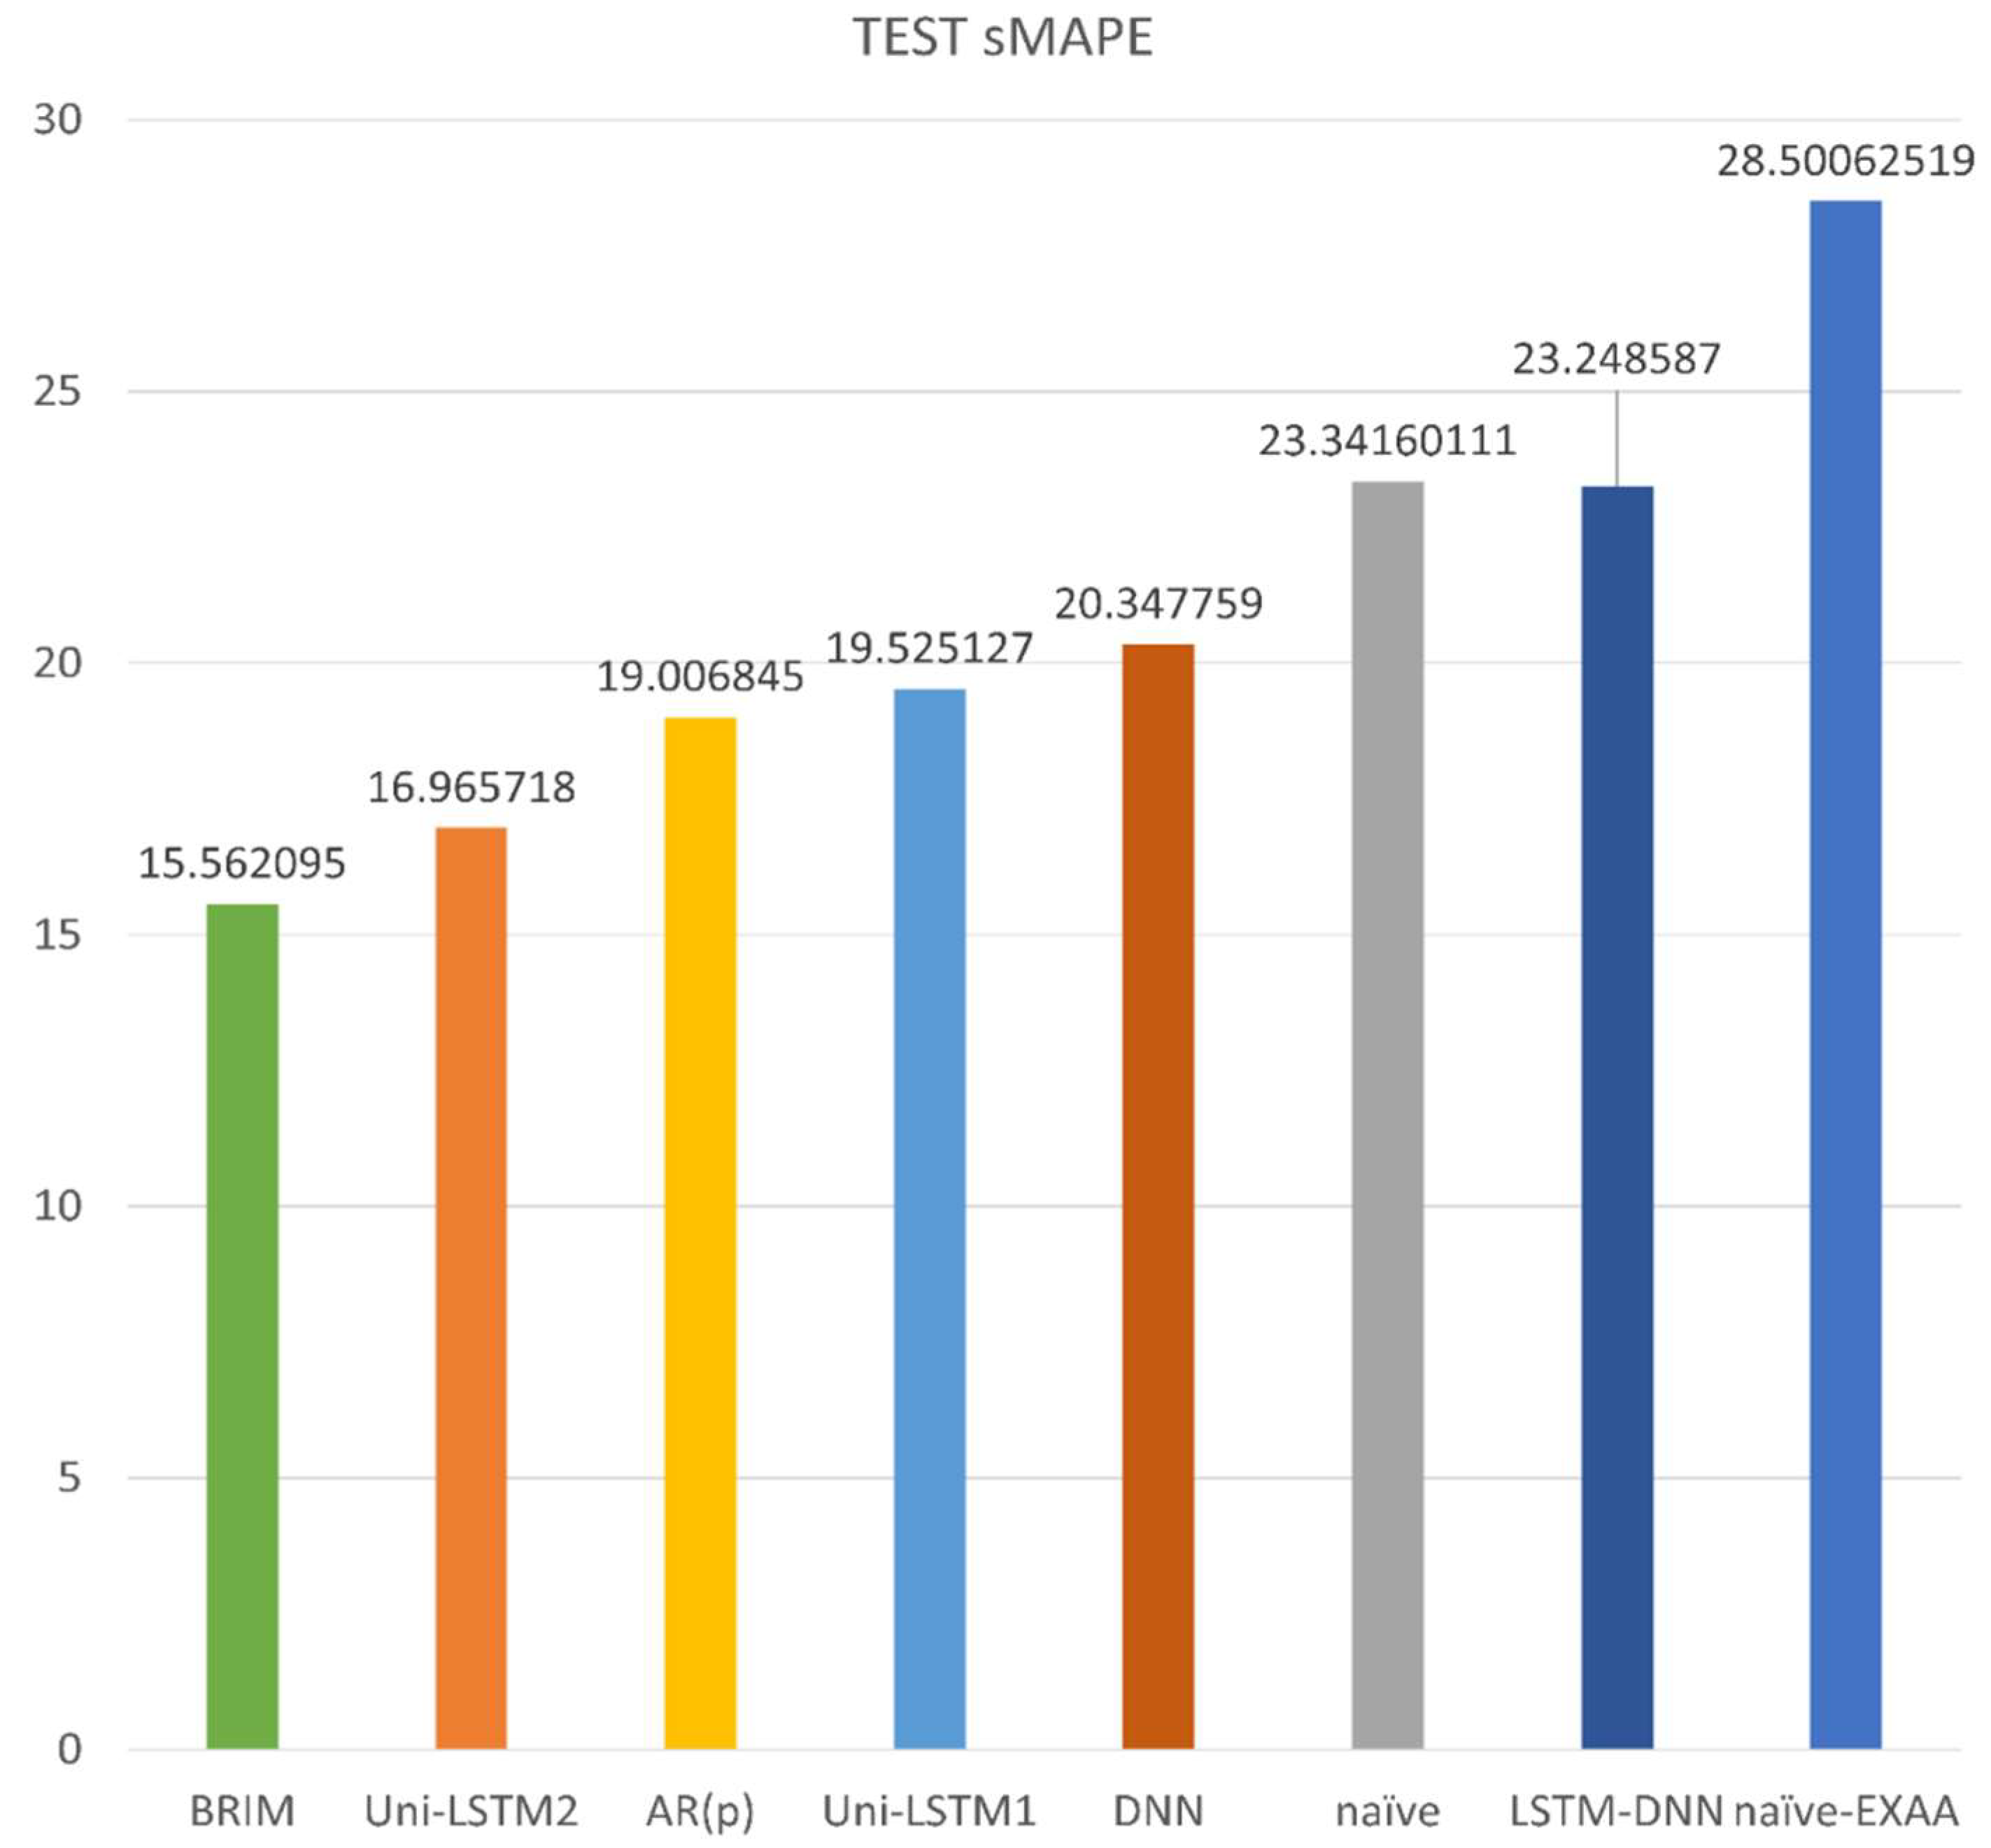
Figure 4 and Figure 5 present MAE and sMAPE values of various benchmark schemes on the test set, respectively. It is obvious that our proposed BRIM with 6.29 MAE and 15.56% sMAPE is significantly superior to all other benchmark schemes.
Specifically, MAE values of two persistent models (i.e., naïve model and naïve-EXAA model) are all larger than nine, and sMAPE values of them are larger than 20%, indicating the poor predictive accuracy of these simple benchmark schemes. As a conventional linear forecaster, the AR( p ) model outperforms both two naive models. Compared with the Uni-LSTM1, in spite of the same unidirectional LSTM structure, the Uni-LSTM2 model that takes into account the integrated market performs significantly better (i.e., MAE value drops by 1.11). It demonstrates that considering the impact of neighboring markets plays a key role in improving forecasting accuracy.
Although the DNN model uses data from neighboring markets, it performs poorly and ranks low, which implies that, compared with RNN structure, DNN is not a good choice for processing time series. The LSTM-DNN model separates the data corresponding to the past price and future information and separately feeds into DNN and LSTM, but its performance is even worse than the single DNN model. However, our proposed BRIM processes all the data from two-time directions in one network, which can effectively capture the variation in price and, therefore, build a more accurate forecaster.
By incorporating the future information in the EXAA (i.e., using market integration as a future price indicator), the naïve-EXAA scheme and the LSTM-DNN scheme obtain similar results in terms of MAE. However, the estimated sMAPE values of these schemes seem to be different because the day-ahead electricity prices in the French market are usually higher than that in the German market on the same day. For sMAPE, under-estimation brings a heavier penalty than overestimation; thus, the naive-EXAA scheme has a similar MAE value but much larger sMAPE value than the LSTM-DNN model.
In order to comprehensively compare our proposed BRIM with other benchmark schemes, experimental results are presented with respect to different seasons, weekdays, and weekends.
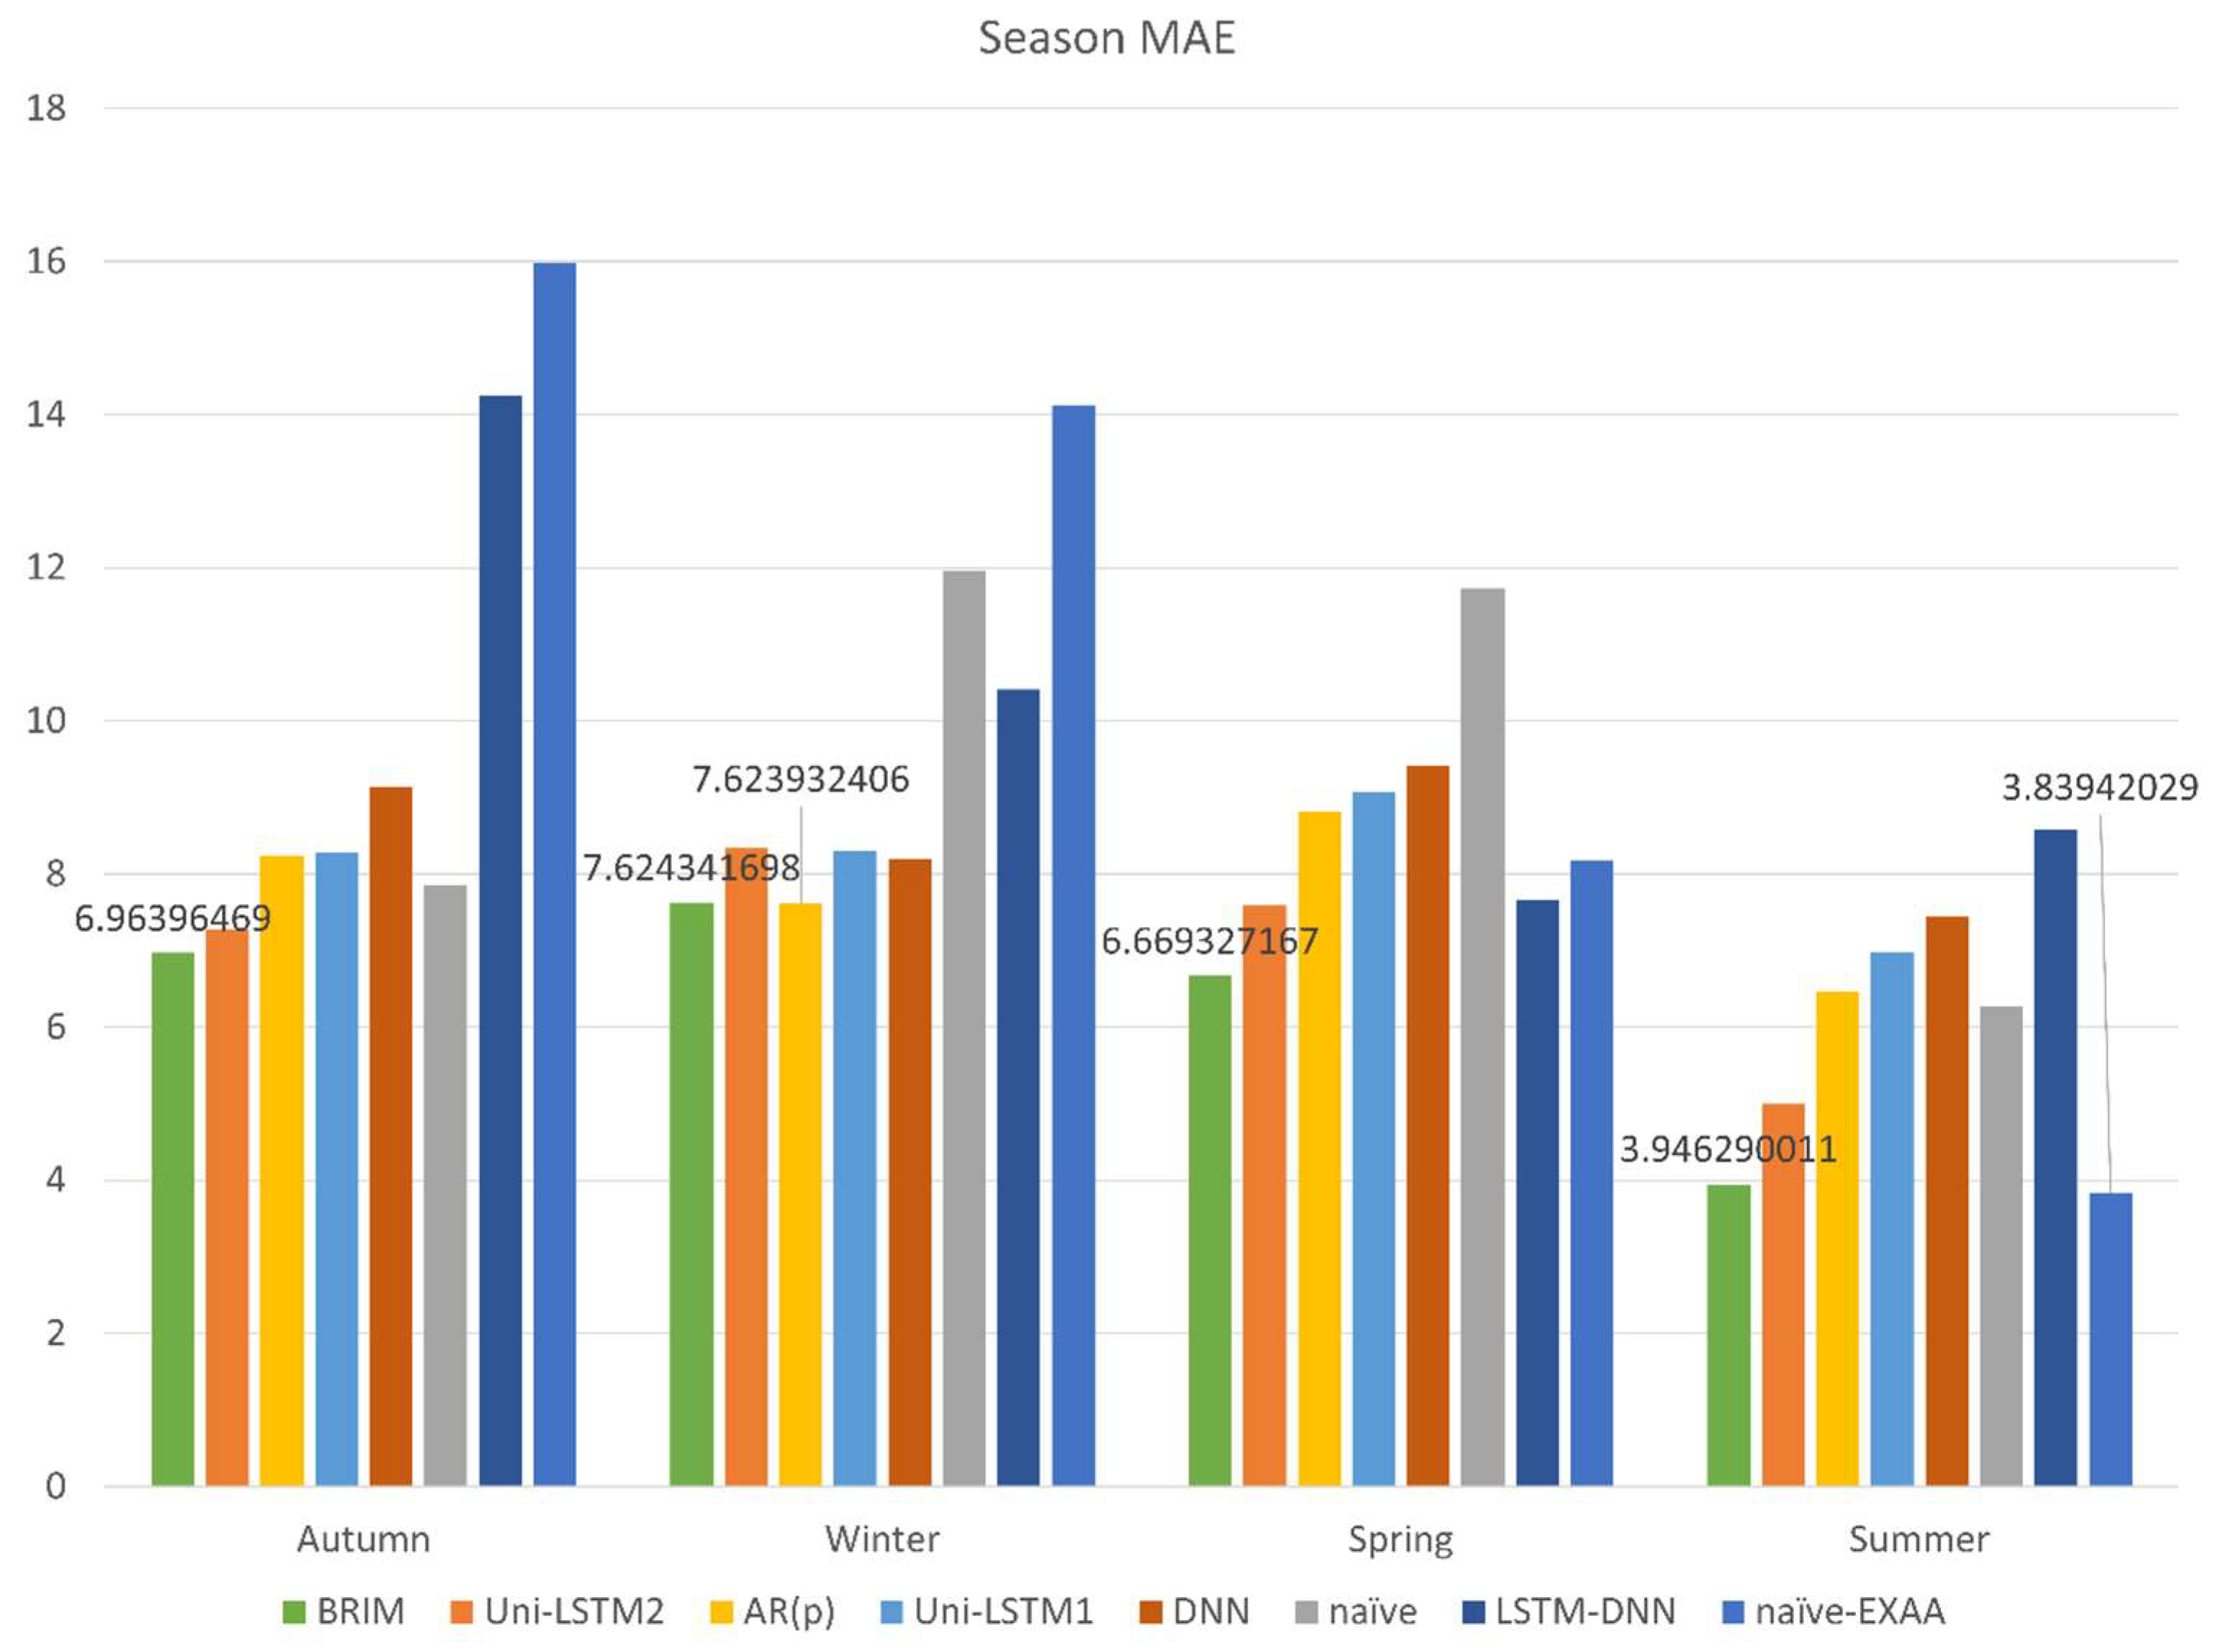
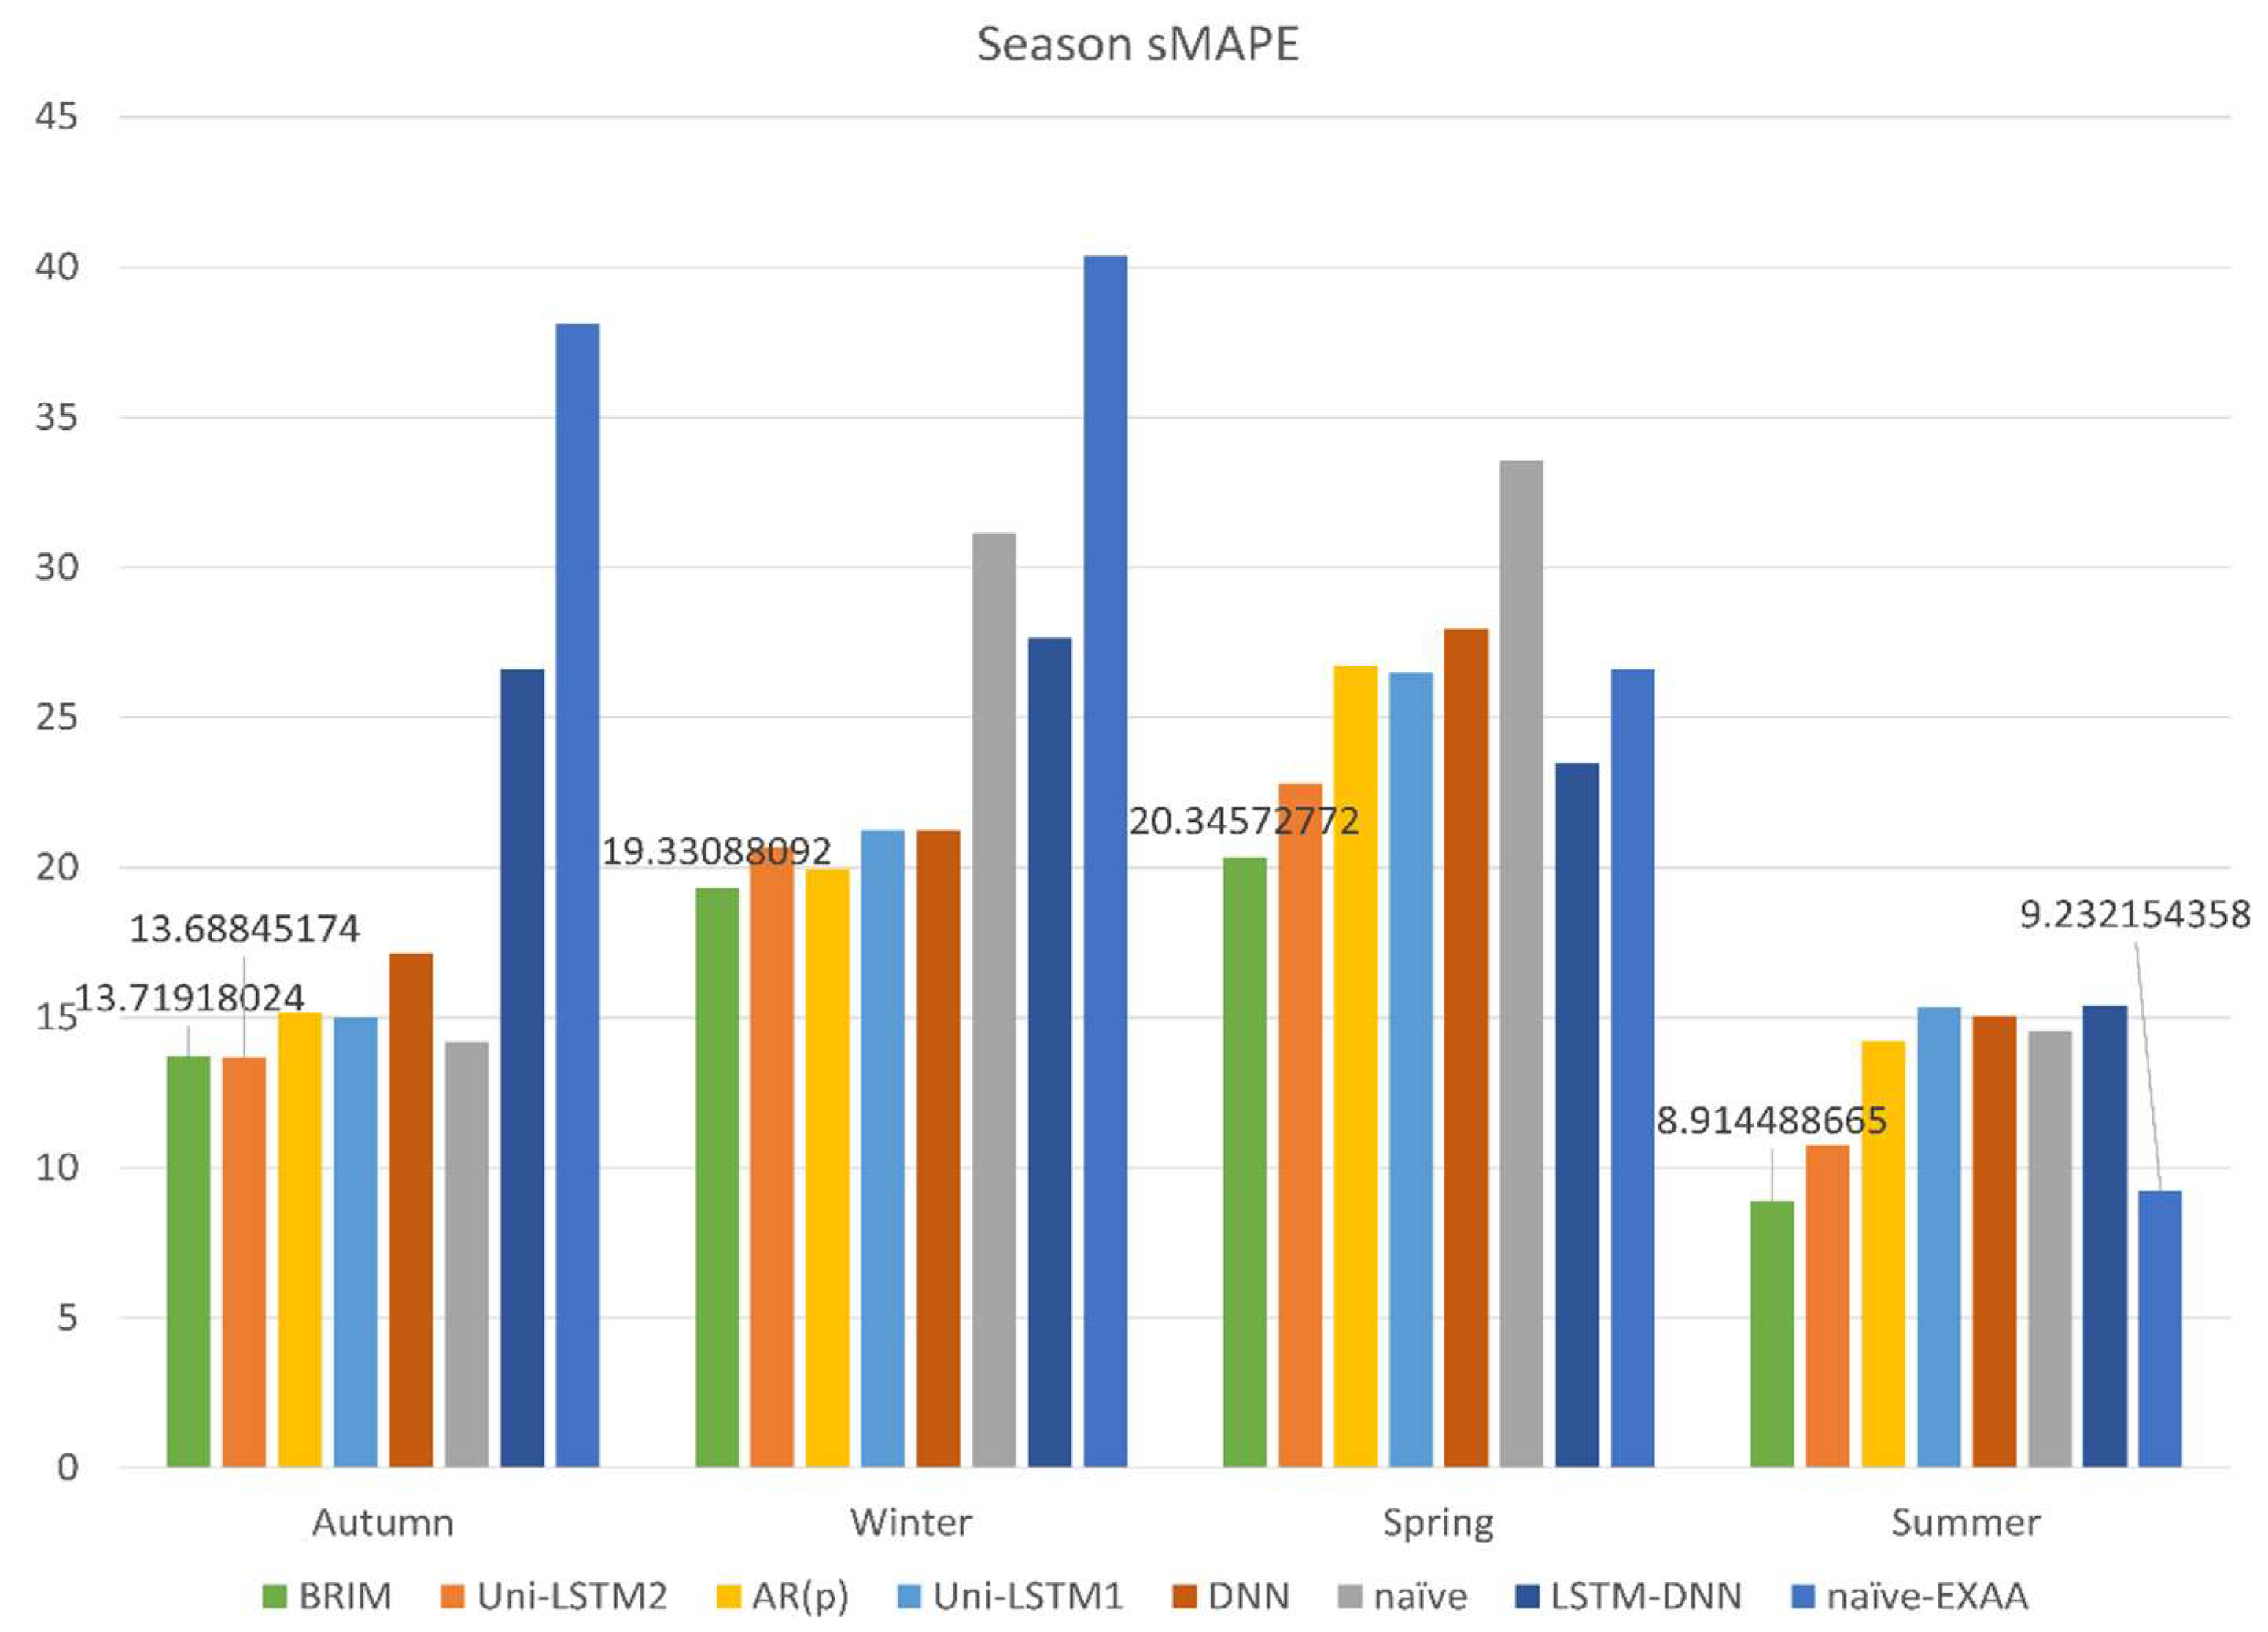
Figure 6 and Figure 7, respectively, provide the forecasting performance of the proposed model BRIM and other methods in four different seasons, in terms of MAE and sMAPE. Note that, the test set is from 22 September 2017 to 21 September 2018, and we divide the four seasons of the Northern Hemisphere according to the usual practice (i.e., spring is from March to May, summer is from June to August, autumn is from September to November, and winter is from December to February).
Specifically, as shown in Figure 6 and Figure 7, for autumn and spring price forecasting, the proposed BRIM outperforms other models in term of the MAE value, and for winter and summer forecasting, is slightly worse than the best scheme. Additionally, in terms of sMAPE, our BRIM scheme achieves the best performance in almost all seasons, which indicates the universality of our model. In particular, compared with the DNN structure, the Uni-LSTM2 scheme utilizing information from neighboring markets shows the superiority of predictive ability in four seasons, which reflects its advantage in processing time series. Moreover, in most comparisons, the LSTM structure that even does not utilize information from the neighboring market still performs better than the DNN, which demonstrates the importance of choosing the network structure for accurate prediction.
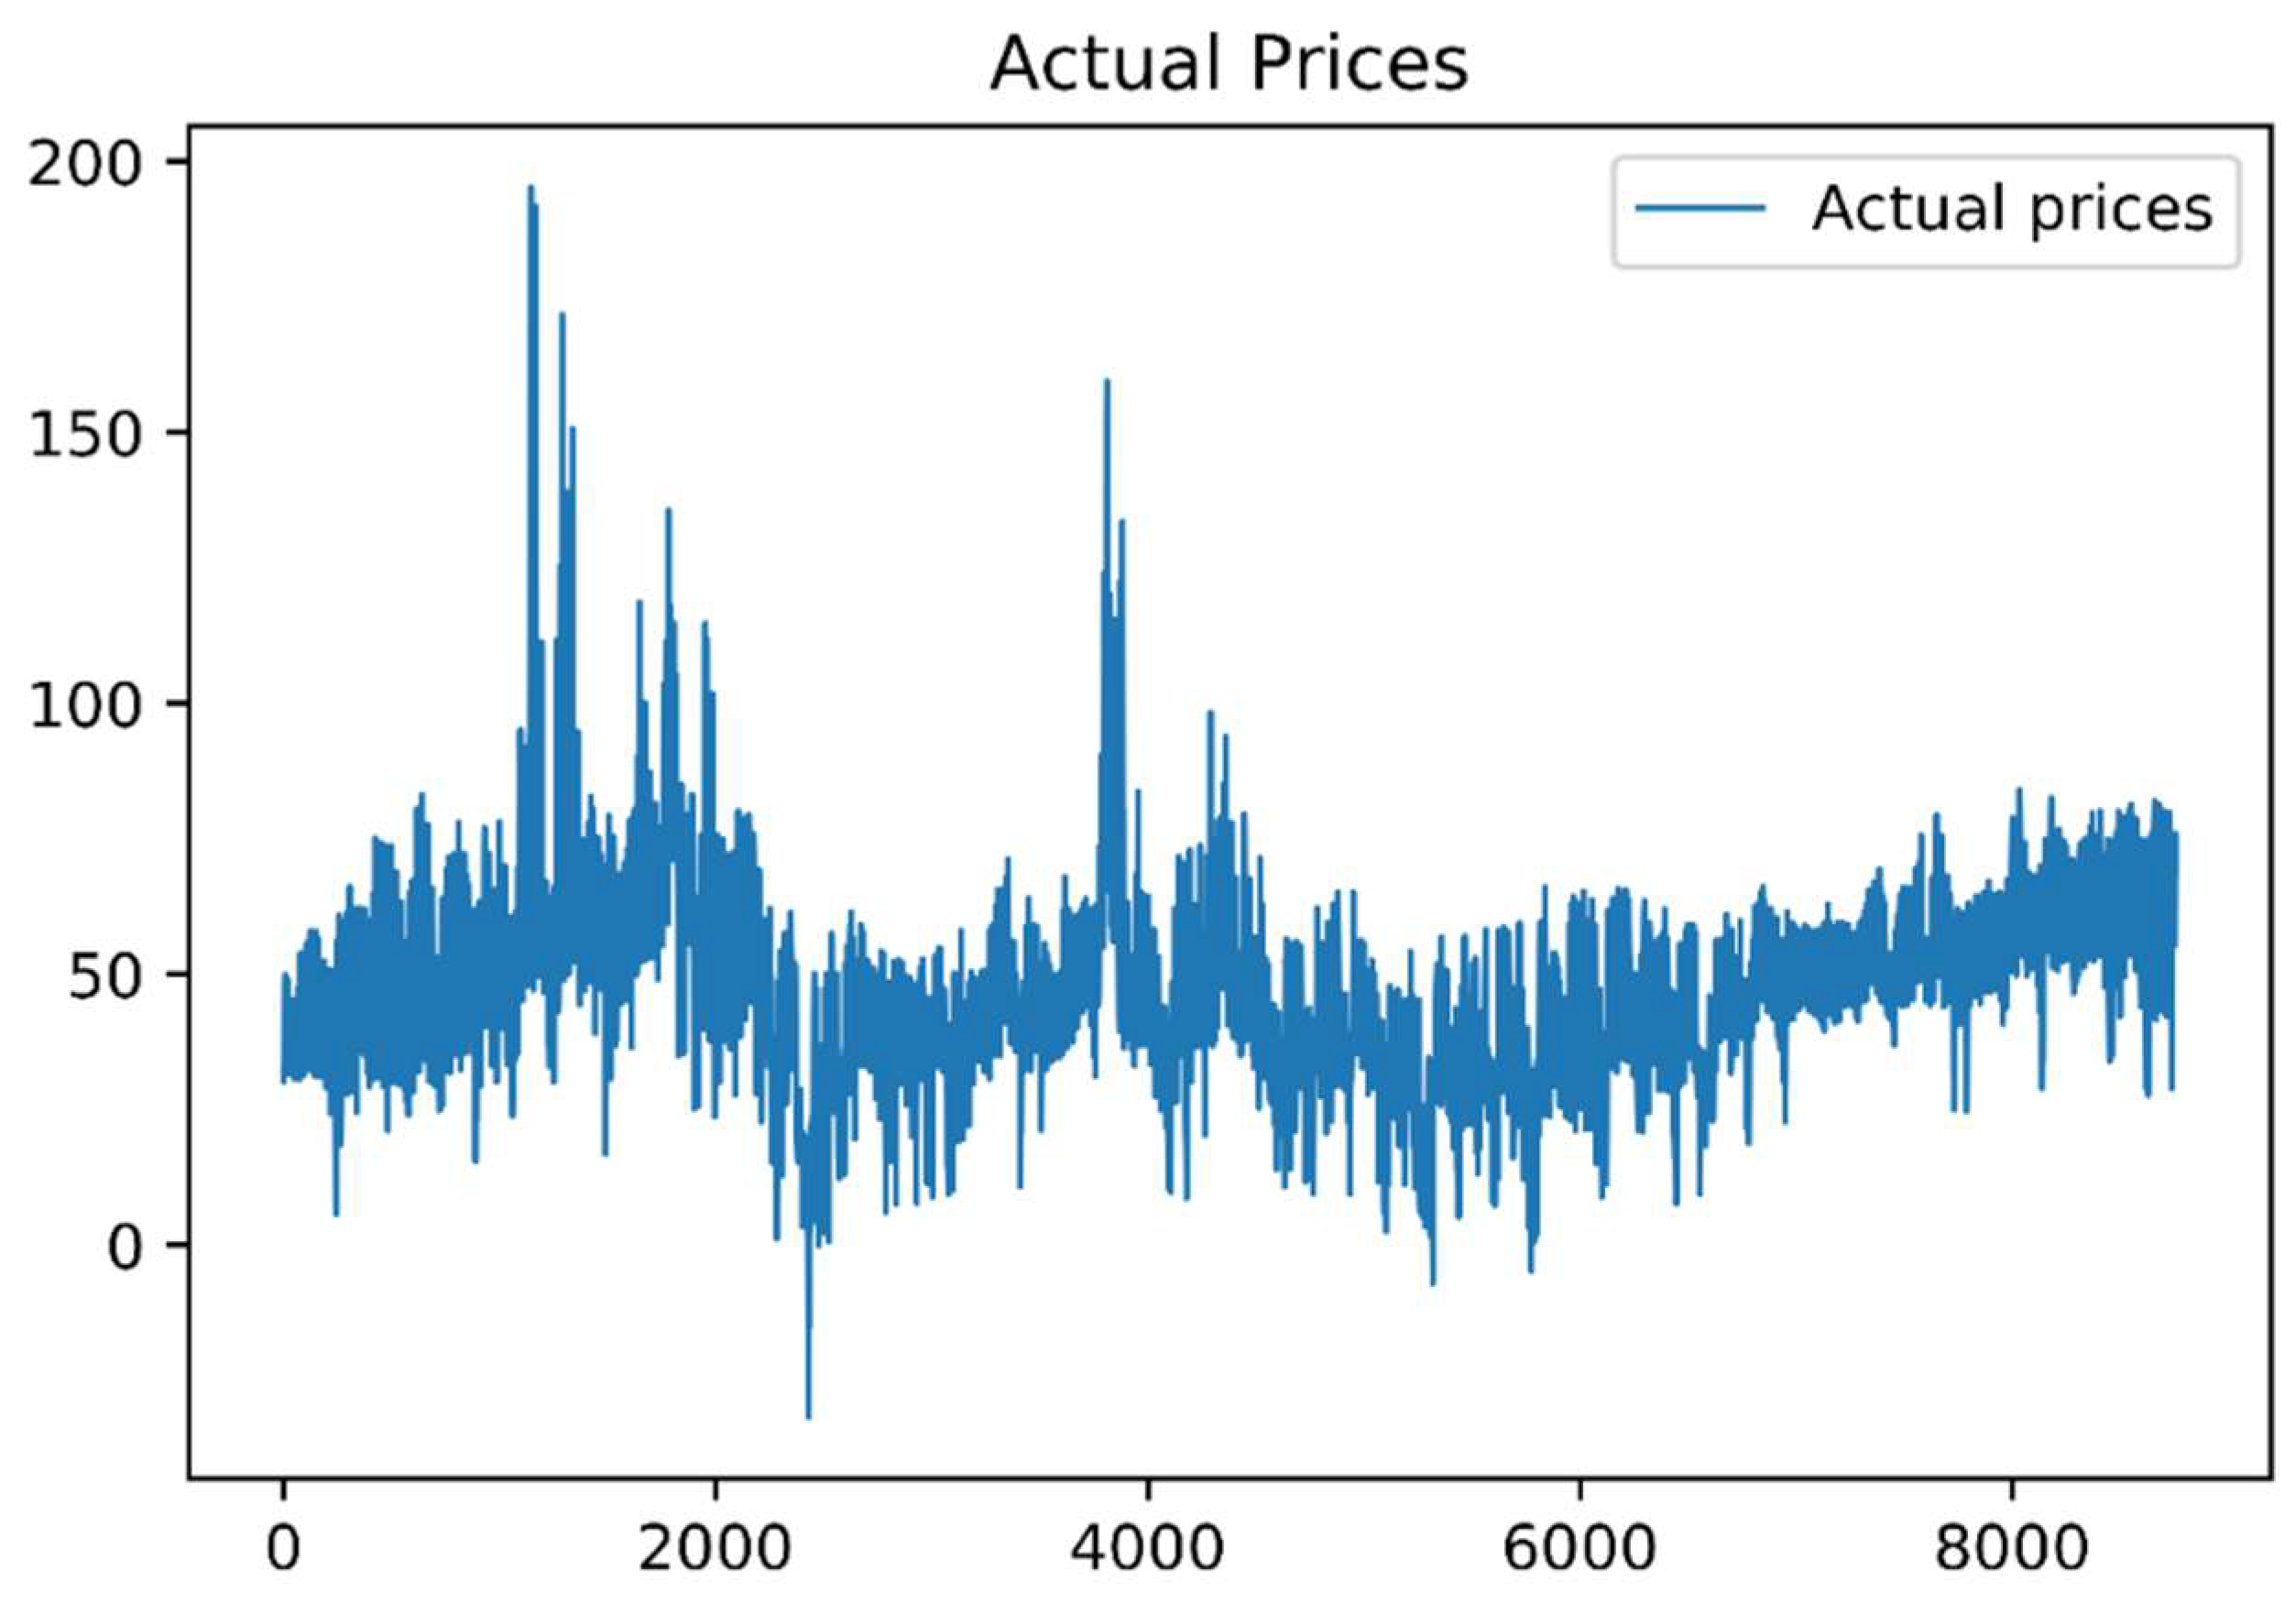
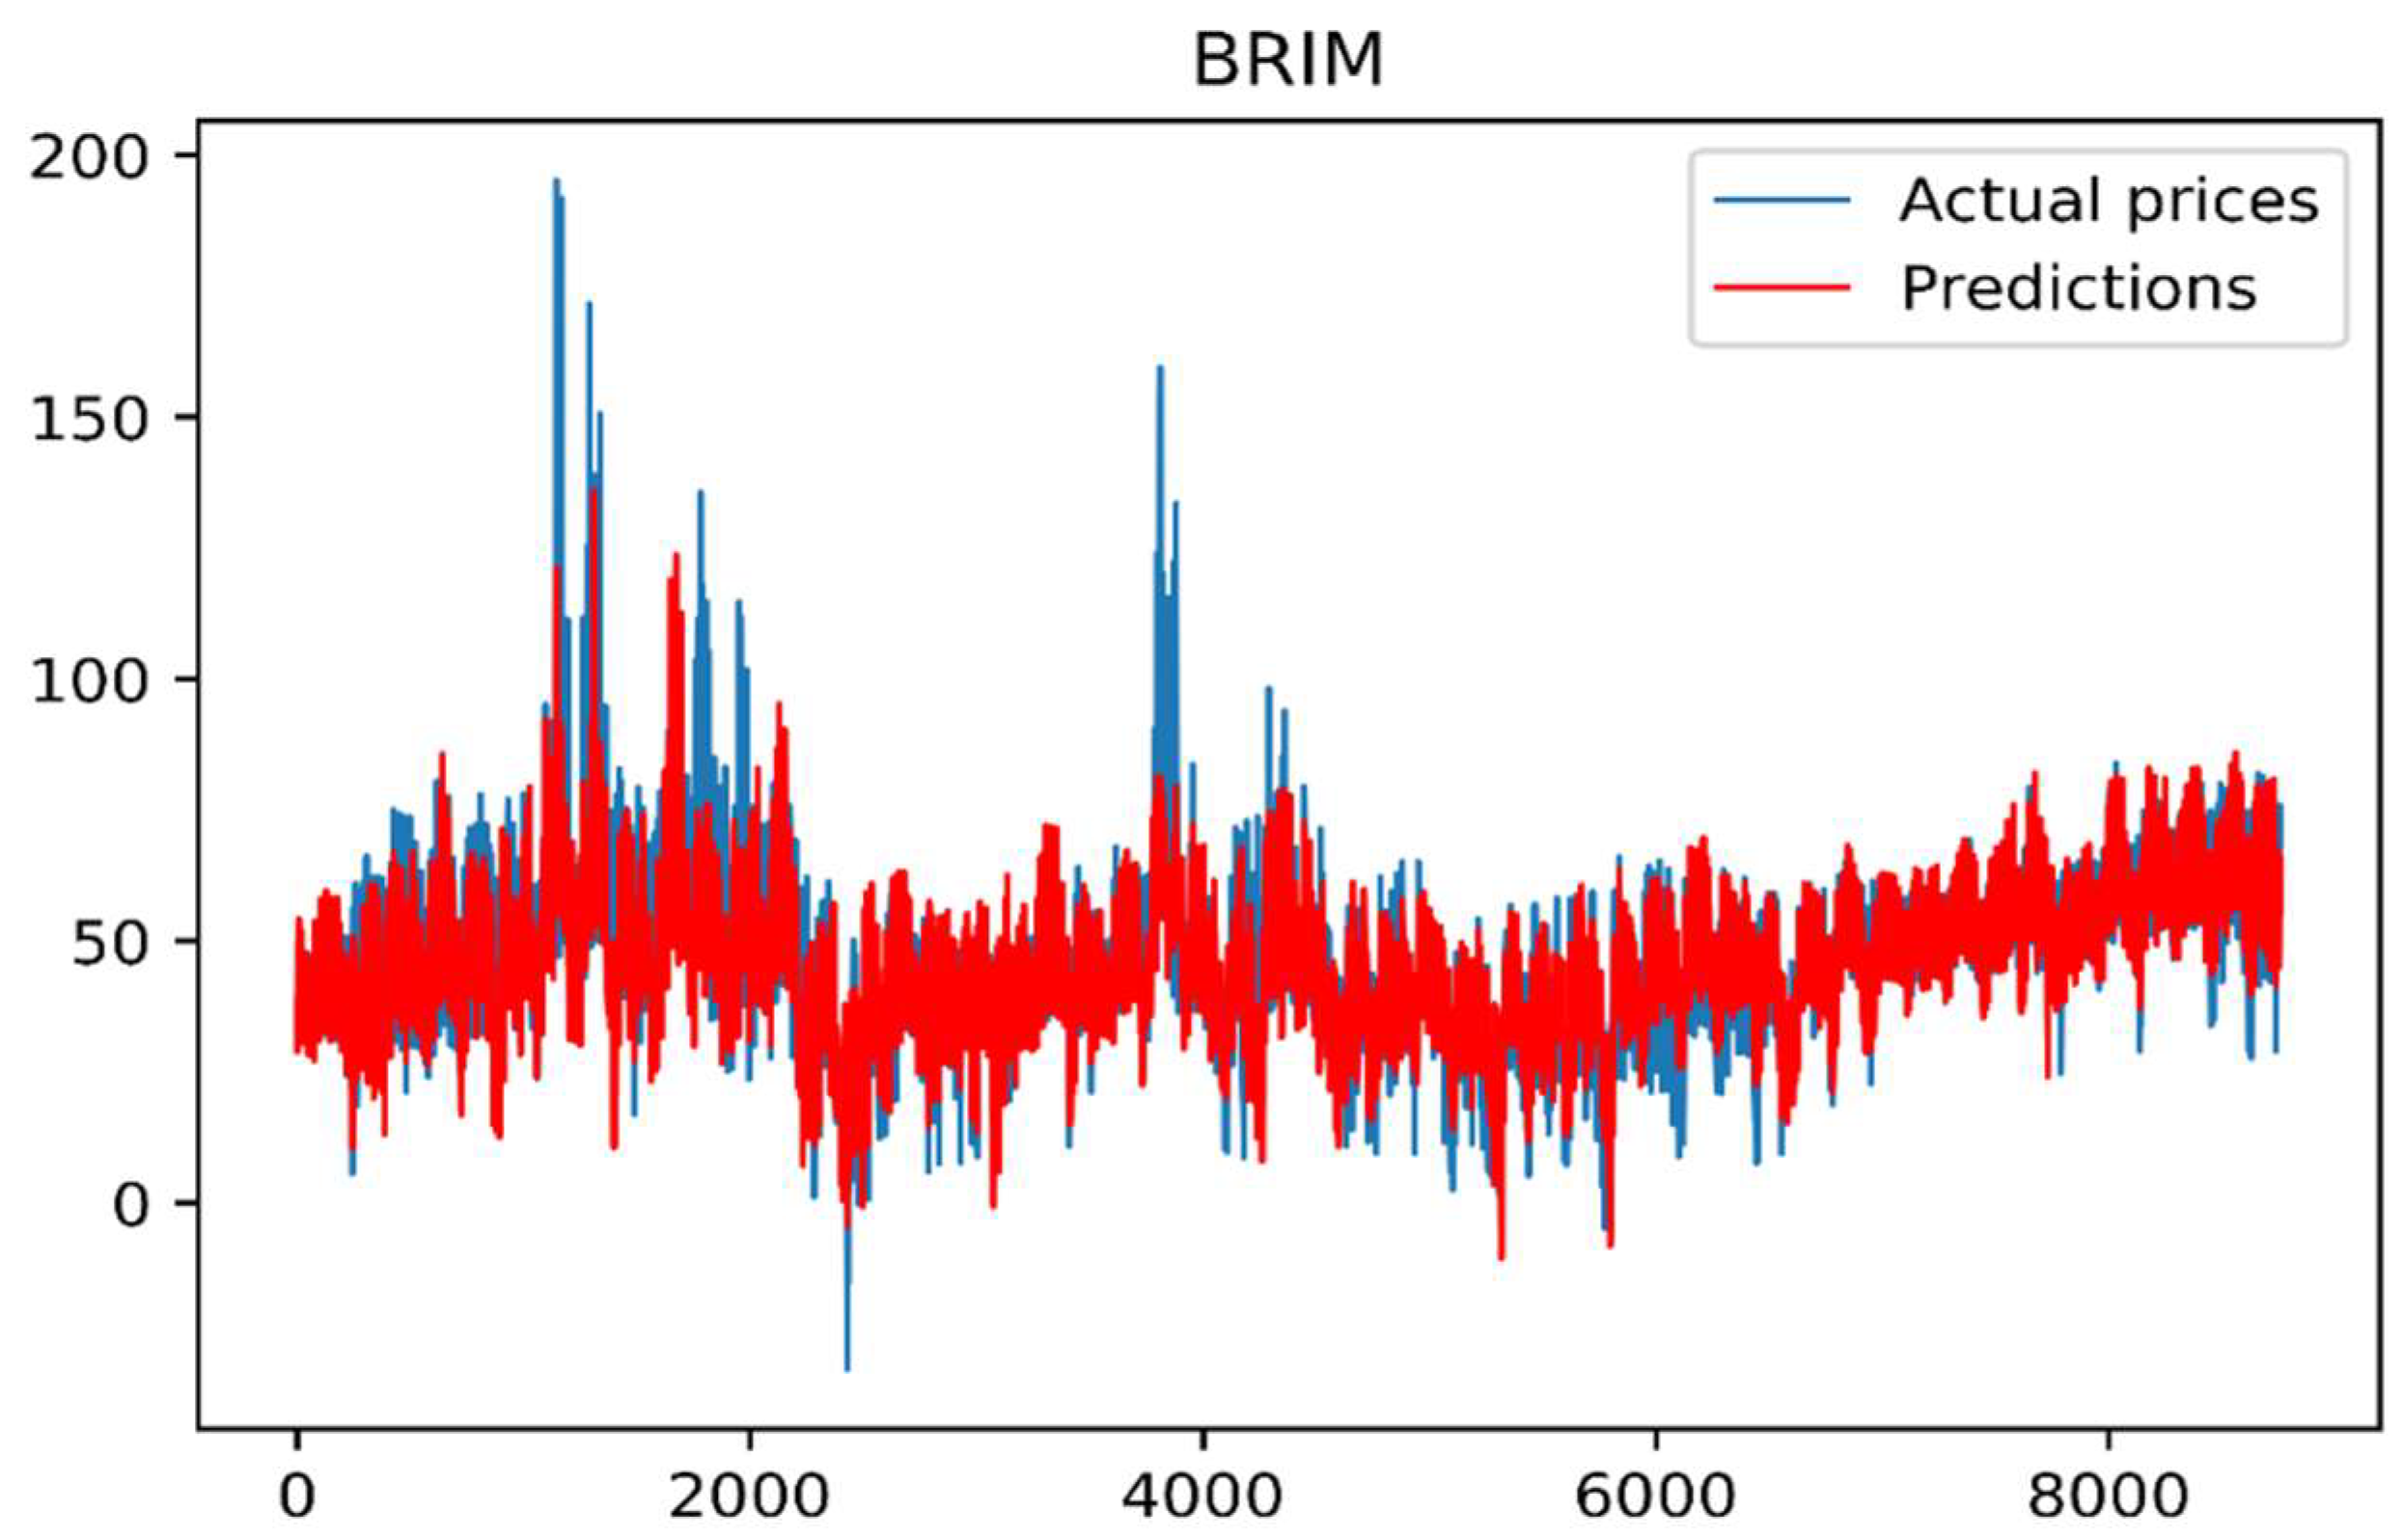
Interestingly, our scheme BRIM and most of the benchmark schemes show better predictive performance in summer than in the other three seasons, which is mainly caused by different volatility of various seasons. The underlying analysis is given as follows. The actual price curve and the predicted price curve using our proposed BRIM are both plotted to show the volatility and trends of price, shown in Figure 8 and Figure 9, respectively.
From Figure 8, it can be obviously seen that actual prices in summer (abscissa: 6049 to 8256) show lower volatility than the other three seasons. The prediction presented in Figure 9 indicates that the proposed BRIM can fit the actual curve well in summer with relatively stable prices. The winter (abscissa: 1681 to 3840) and spring (abscissa: 3841 to 6048) data intrinsically have high volatility and exist many irregular price spikes, which leads to the phenomenon that all forecasting schemes, including our proposed BRIM, have a worse performance for winter and spring than the prediction for summer.
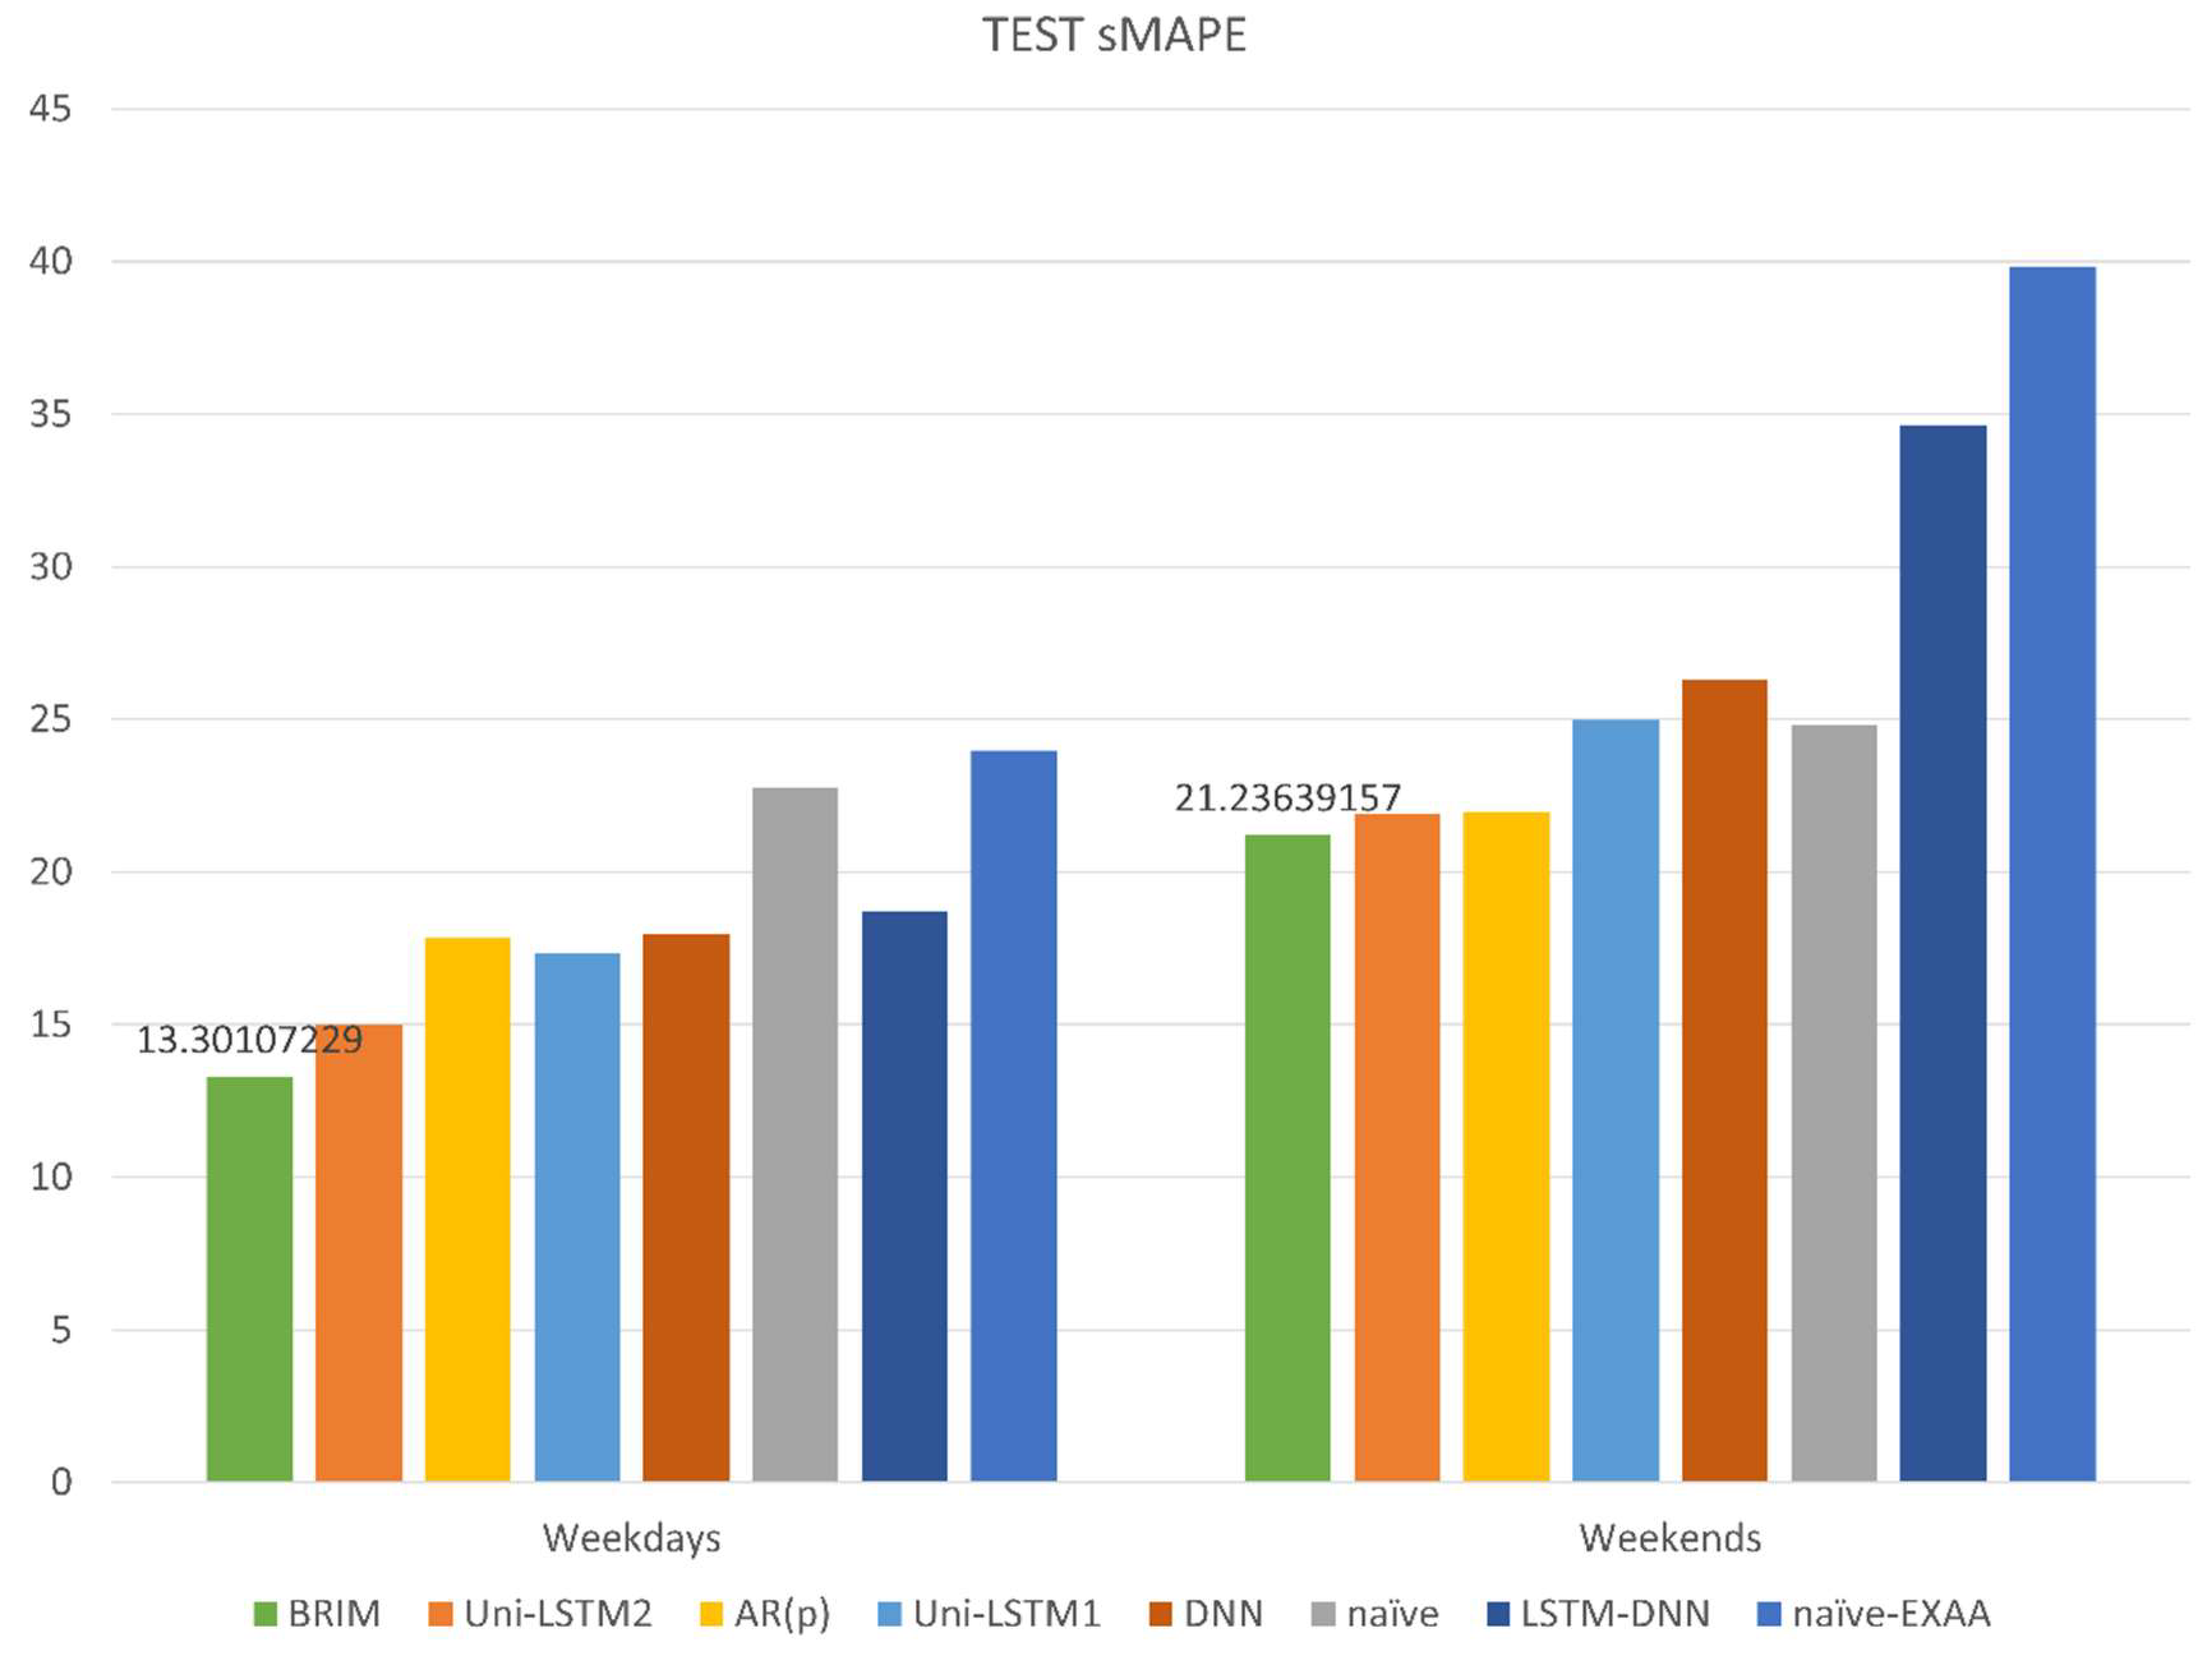
Forecasting results are graphically presented with respect to weekdays and weekends in Figure 10 and Figure 11. Two results can be inferred. Firstly, irrespective of weekends or weekdays price prediction, our proposed BRIM performs best. Secondly, compared with forecasting results on weekends, all the forecasters achieve higher predictive accuracy on weekdays. The reason is similar to the prediction of different season prices: weekends prices exhibit higher dynamics than weekdays data in general.
To further prove the effectiveness and significance of our proposed BRIM, we employ the Diebold-Mariano (DM) test [34] that can evaluate the statistical significance of forecasting accuracy of different models. The MAE and the mean squared error (MSE) are adopted as the loss function to build the loss differential, respectively. The DM test results are exhibited in the following Table 3.
According to the DM test results presented in Table 3, our proposed BRIM is indirectly superior to all other benchmark schemes at the 1% level of significance. By comparing two unidirectional LSTM structures, the one taking into consideration available future information shows statistically more accurate predictions than the one only utilizing past prices. It demonstrates the importance of information from an integrated market in improving forecasting accuracy. In addition, the Uni-LSTM2 model statistically significantly outperforms the DNN model, indicating the LSTM structure is better at dealing with time series data like electricity prices.

5. Conclusions

In this paper, a bidirectional recurrent neural network and integrated market-based forecasting model (BRIM) for day-ahead electricity prices are proposed. By comparison with benchmark schemes on real datasets of European markets, our proposal is shown to enhance the predictive performance. In particular, the bidirectional LSTM network structure, in which the available time series data corresponding to past and future electricity prices are input into forward and backward time directions of the model, turns out to statistically significantly outperform the unidirectional neural network structure and the hybrid LSTM-DNN structure that separates information into different neural networks. Moreover, the experiment conducted in the French market demonstrates the significance of taking into account future information in adjacent markets to improve forecasting accuracy.
Note that, due to the relatively easy accessibility of historical electricity price from public markets, this paper only utilizes the historical price to predict the future price. Intuitively, some exogenous variables, such as net load, generation from conventional generation units, import/export power, etc., are highly correlated with the price. Certainly, the effects of these factors have already indirectly reflected through the historical electricity price.
In future, more features affecting electricity prices will be taken into consideration to further improve the predictive accuracy of our scheme (if these features could be publicly accessed and used), and a feature selection process should be incorporated in our scheme [35]. But, the methodology of our scheme, combining the bidirectional recurrent neural network and integrated market to efficiently predict the electricity price, is still applicable.

Author Contributions

Conceptualization, Y.C. and Y.W.; Methodology, Y.C. and Y.W.; Software, Y.C.; Validation, Y.W., J.M. and Q.J.; Formal Analysis, Y.W. and Y.C.; Investigation, Y.W. and Q.J.

Funding

This research was funded by NSFC grant number 61801240 and QingLan Project of JiangSu Province. The APC was funded by QingLan Project of JiangSu Province.

Conflicts of Interest

The authors declare no conflict of interest.

References

  1. Aggarwal, S.K.; Saini, L.M.; Kumar, A. Electricity price forecasting in deregulated markets: A review and evaluation. Int. J. Electr. Power Syst. 2009, 31, 13–22. [Google Scholar] [CrossRef]
  2. Liu, B.; Nowotarski, J.; Hong, T.; Weron, R. Probabilistic load forecasting via quantile regression averaging on sister forecasts. IEEE Trans. Smart Grid 2017, 8, 730–737. [Google Scholar] [CrossRef]
  3. Ziel, F.; Steinert, R. Probabilistic mid-and long-term electricity price forecasting. Renew. Sustain. Energy Rev. 2018, 94, 251–266. [Google Scholar] [CrossRef]
  4. Weron, R. Electricity price forecasting: A review of the state-of-the-art with a look into the future. Int. J. Forecast. 2014, 30, 1030–1081. [Google Scholar] [CrossRef] [Green Version]
  5. Cheng, C.; Chen, F.; Li, G.; Tu, Q. Market equilibrium and impact of market mechanism parameters on the electricity price in yunnan’s electricity market. Energies 2016, 9, 463. [Google Scholar] [CrossRef]
  6. Bello, A.; Bunn, D.; Reneses, J.; Muñoz, A. Parametric density recalibration of a fundamental market model to forecast electricity prices. Energies 2016, 9, 959. [Google Scholar] [CrossRef]
  7. Cifter, A. Forecasting electricity price volatility with the markov-switching garch model: Evidence from the nordic electric power market. Electr. Power Syst. Res. 2013, 102, 61–67. [Google Scholar] [CrossRef]
  8. Krizhevsky, A.; Sutskever, I.; Hinton, G.E. Imagenet classification with deep convolutional neural networks. In Proceedings of the 25th International Conference on Neural Information Processing Systems, Lake Tahoe, NV, USA, 3–6 December 2012; pp. 1097–1105. [Google Scholar]
  9. Hinton, G.; Deng, L.; Yu, D.; Dahl, G.; Mohamed, A.R.; Jaitly, N.; Senior, A.; Vanhoucke, V.; Nguyen, P.; Kingsbury, B.; et al. Deep neural networks for acoustic modeling in speech recognition. IEEE Signal Process. Mag. 2012, 29, 82–97. [Google Scholar] [CrossRef]
  10. Bengio, Y.; Simard, P.; Frasconi, P. Learning long-term dependencies with gradient descent is difficult. IEEE Trans. Neural Netw. 1994, 5, 157–166. [Google Scholar] [CrossRef]
  11. Hochreiter, S.; Schmidhuber, J. Long short-term memory. Neural Comput. 1997, 9, 1735–1780. [Google Scholar] [CrossRef]
  12. Sutskever, I.; Vinyals, O.; Le, Q.V. Sequence to sequence learning with neural networks. In Proceedings of the 27th International Conference on Neural Information Processing Systems, Montreal, QC, Canada, 8–13 December 2014; MIT Press: Cambridge, MA, USA; pp. 3104–3112. [Google Scholar]
  13. Lago, J.; De Ridder, F.; De Schutter, B. Forecasting spot electricity prices: Deep learning approaches and empirical comparison of traditional algorithms. Appl. Energy 2018, 221, 386–405. [Google Scholar] [CrossRef]
  14. Jamasb, T.; Pollitt, M. Electricity market reform in the European Union: Review of progress toward liberalization & integration. Energy J. 2005, 26, 11–41. [Google Scholar]
  15. Gugler, K.; Haxhimusa, A.; Liebensteiner, M. Integration of European Electricity Markets: Evidence from Spot Prices. Energy J. 2018, 39, 41–67. [Google Scholar] [CrossRef]
  16. Bunn, D.W.; Gianfreda, A. Integration and shock transmissions across European electricity forward markets. Energy Econ. 2010, 32, 278–291. [Google Scholar] [CrossRef]
  17. De Menezes, L.M.; Houllier, M.A. Reassessing the integration of European electricity markets: A fractional cointegration analysis. Energy Econ. 2016, 53, 132–150. [Google Scholar] [CrossRef]
  18. Meeus, L.; Belmans, R. Electricity market integration in Europe. Revue E-Societe Royale Belge Des Electriciens 2008, 124, 5. [Google Scholar]
  19. Bollino, C.A.; Ciferri, D.; Polinori, P. Integration and convergence in European electricity markets. MPRA Pap. 2013. [Google Scholar] [CrossRef]
  20. Ziel, F.; Steinert, R.; Husmann, S. Forecasting day ahead electricity spot prices: The impact of the EXAA to other European electricity markets. Energy Econ. 2015, 51, 430–444. [Google Scholar] [CrossRef] [Green Version]
  21. Kong, W.; Dong, Z.Y.; Jia, Y.; Hill, D.J.; Xu, Y.; Zhang, Y. Short-term residential load forecasting based on LSTM recurrent neural network. IEEE Trans. Smart Grid 2019, 10, 841–851. [Google Scholar] [CrossRef]
  22. Lago, J.; De Ridder, F.; Vrancx, P.; De Schutter, B. Forecasting day-ahead electricity prices in Europe: The importance of considering market integration. Appl. Energy 2018, 211, 890–903. [Google Scholar] [CrossRef]
  23. Schuster, M.; Paliwal, K.K. Bidirectional recurrent neural networks. IEEE Trans. Signal Process. 1997, 45, 2673–2681. [Google Scholar] [CrossRef] [Green Version]
  24. Di Persio, L.; Honchar, O. Analysis of recurrent neural networks for short-term energy load forecasting. AIP Conf. Proc. 2017, 1906. [Google Scholar] [CrossRef]
  25. Cui, Z.; Ke, R.; Wang, Y. Deep bidirectional and unidirectional LSTM recurrent neural network for network-wide traffic speed prediction. arXiv 2018, arXiv:1801.02143. [Google Scholar]
  26. Althelaya, K.A.; El-Alfy, E.S.M.; Mohammed, S. Evaluation of bidirectional lstm for short-and long-term stock market prediction. In Proceedings of the 2018 9th International Conference on Information and Communication Systems (ICICS), Irbid, Jordan, 3–5 April 2018; pp. 151–156. [Google Scholar]
  27. Graves, A.; Mohamed, A.R.; Hinton, G. Speech recognition with deep recurrent neural networks. In Proceedings of the 2013 IEEE International Conference on Acoustics, Speech and Signal Processing, Vancouver, BC, Canada, 26–31 May 2013; pp. 6645–6649. [Google Scholar]
  28. Wu, Y.; Schuster, M.; Chen, Z.; Le, Q.V.; Norouzi, M.; Macherey, W.; Krikun, M.; Cao, Y.; Gao, Q.; Macherey, K.; et al. Google’s neural machine translation system: Bridging the gap between human and machine translation. arXiv 2016, arXiv:1609.08144. [Google Scholar]
  29. EPEX SPOT SE. Available online: http://www.epexspot.com/en/ (accessed on 24 September 2018).
  30. EXAA Energy Exchange Austria. Available online: https://www.exaa.at/en/ (accessed on 24 September 2018).
  31. Statsmodels. Available online: https://pypi.org/project/statsmodels/ (accessed on 25 July 2018).
  32. TensorFlow. Available online: https://pypi.org/project/tensorflow/ (accessed on 25 July 2018).
  33. Kingma, D.P.; Ba, J. Adam: A method for stochastic optimization. arXiv 2014, arXiv:1412.6980. [Google Scholar]
  34. Diebold, F.X.; Mariano, R. Comparing predictive accuracy. J. Bus. Econ. Stat. 1995, 13, 253–265. [Google Scholar]
  35. Abedinia, O.; Amjady, N.; Zareipour, H. A new feature selection technique for load and price forecast of electrical power systems. IEEE Trans. Power Syst. 2017, 32, 62–74. [Google Scholar] [CrossRef]
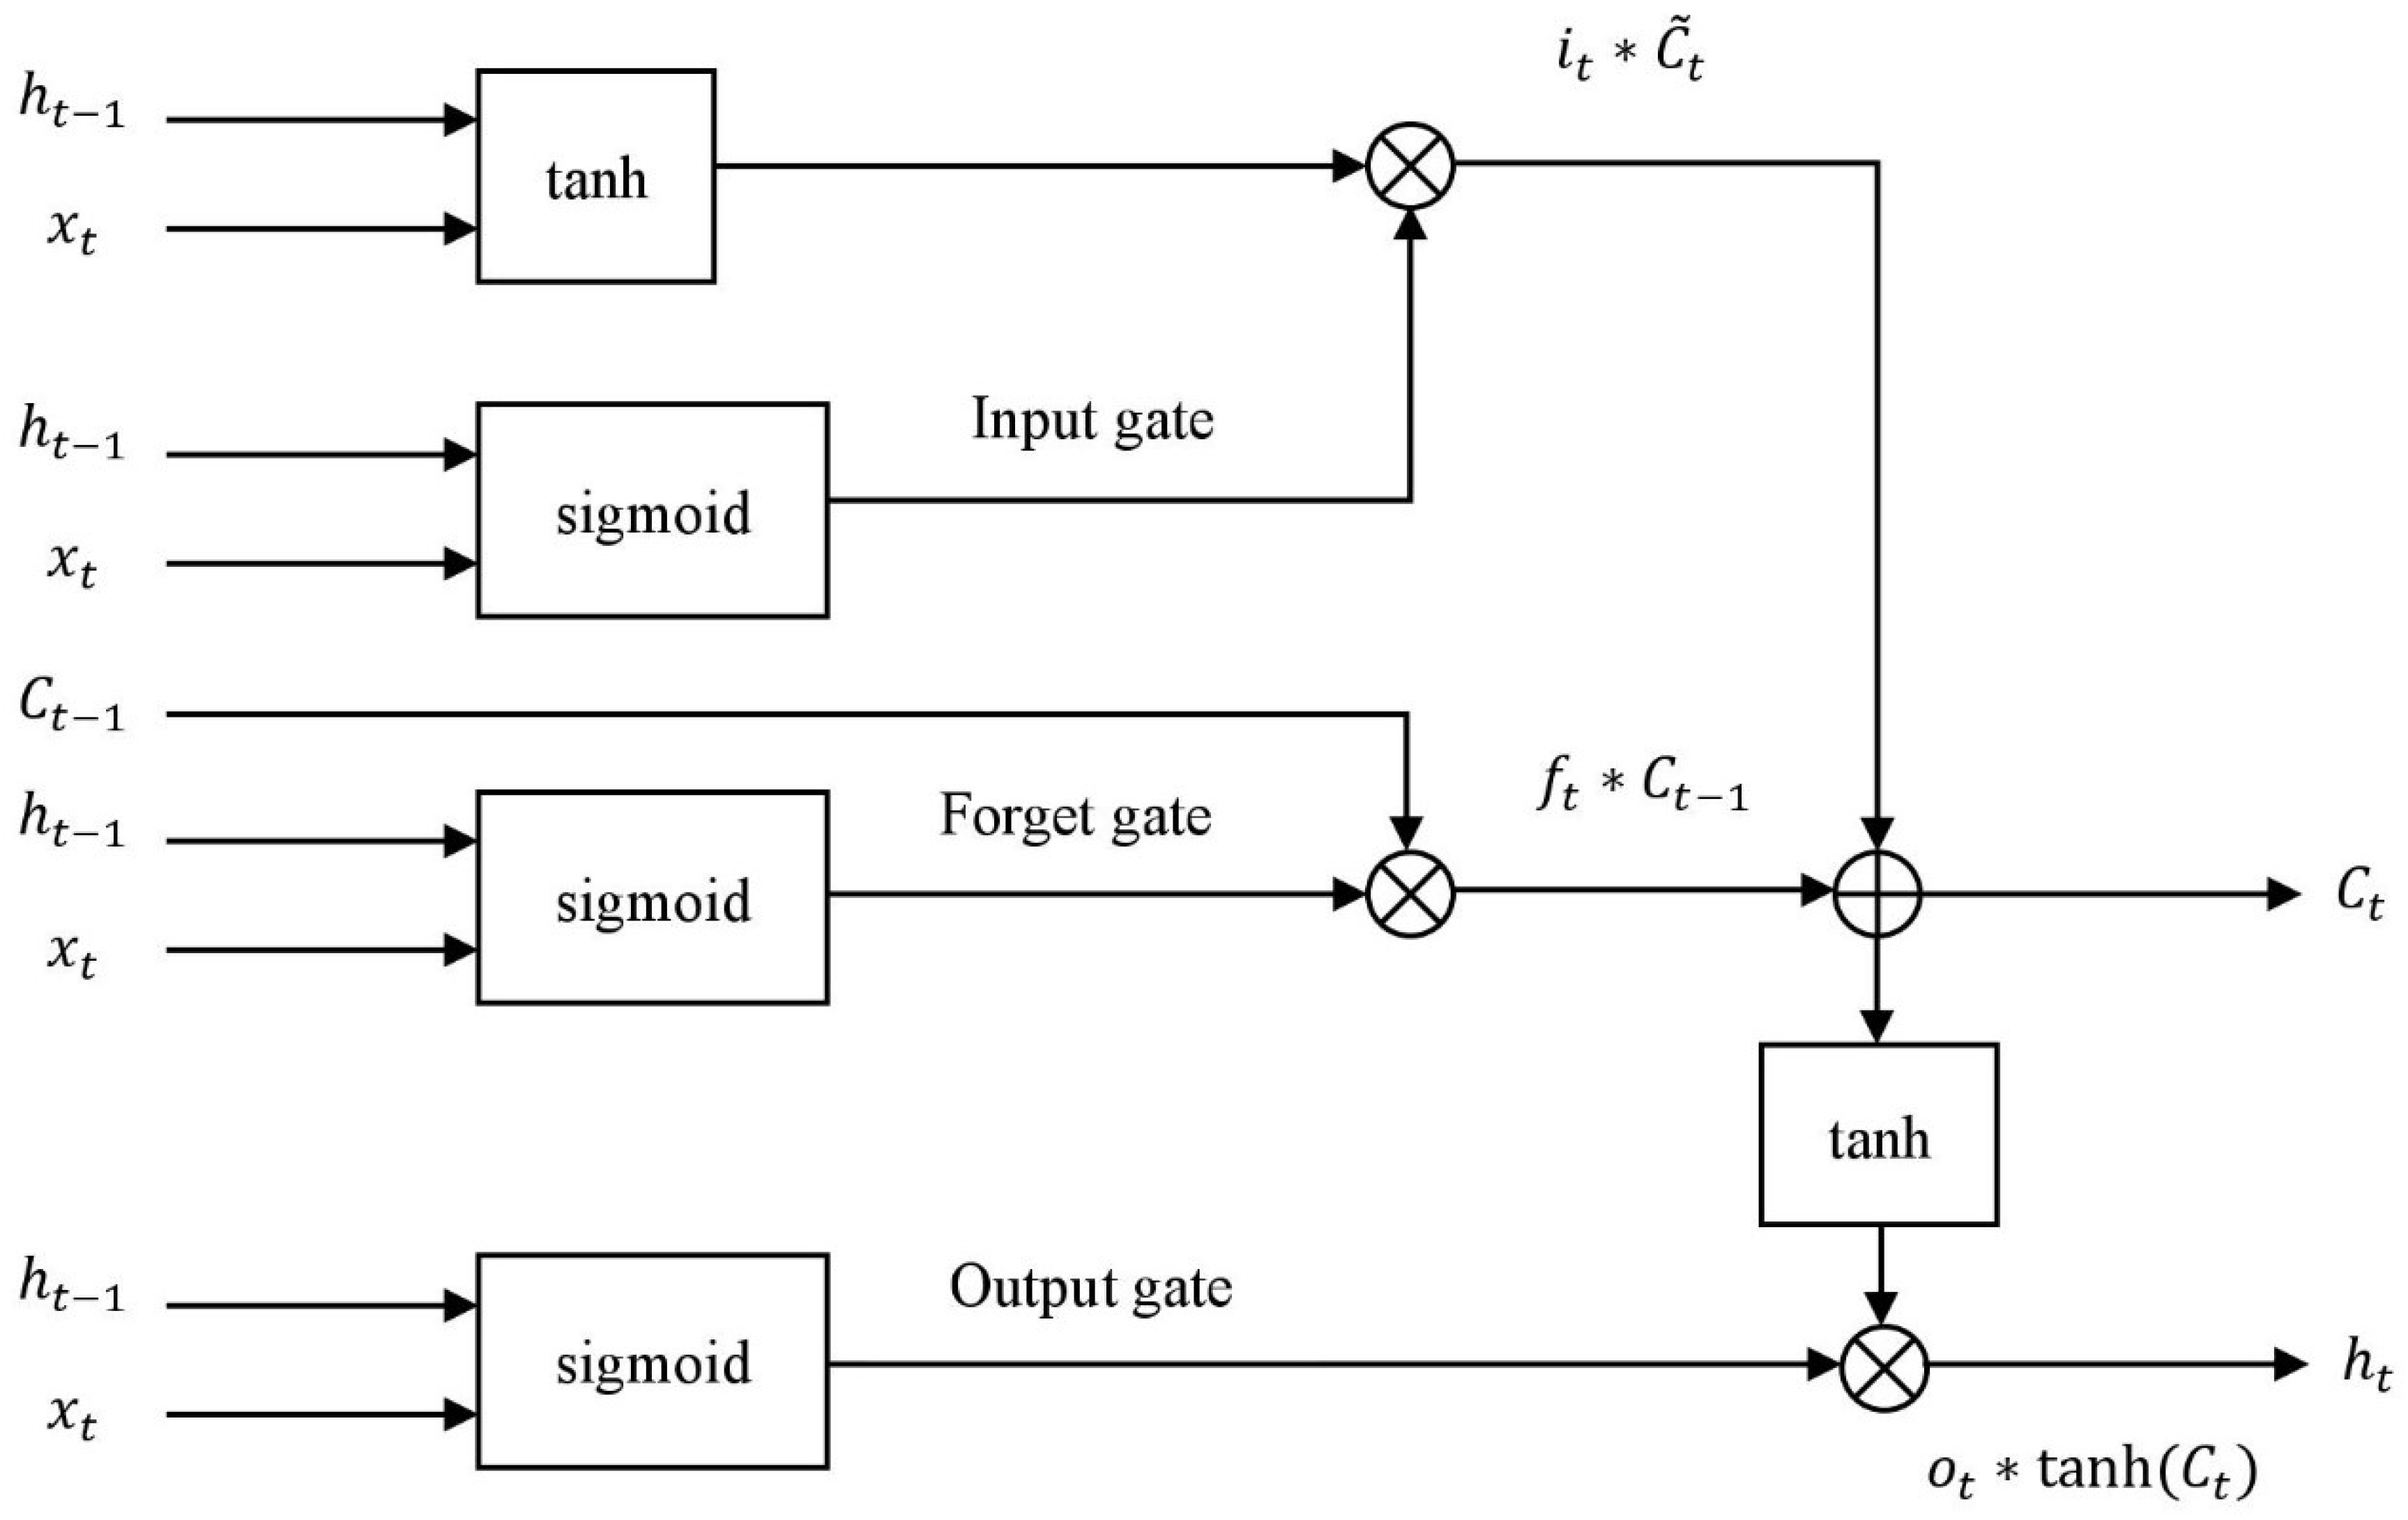
Figure 1. The basic structure of a long short-term memory (LSTM) block.
Energies 12 02241 g001
Figure 2. The model architecture of BRIM.
Energies 12 02241 g002
Figure 3. Bidirectional long short-term memory (LSTM) model for forecasting day-ahead prices.
Energies 12 02241 g003
Figure 4. Comparison of the predictive performance of BRIM with benchmark schemes in the European Power Exchange (EPEX)-FR by means of mean absolute error (MAE).
Energies 12 02241 g004
Figure 5. Comparison of the predictive performance of BRIM with benchmark schemes in the European Power Exchange (EPEX)-FR by means of symmetric mean absolute percentage error (sMAPE).
Energies 12 02241 g005
Figure 6. Comparison of predictive performance in four seasons by means of mean absolute error (MAE).
Energies 12 02241 g006
Figure 7. Comparison of predictive performance in four seasons by means of symmetric mean absolute percentage error (sMAPE).
Energies 12 02241 g007
Figure 8. Actual price curve on the test set (from 22 September 2017 to 21 September 2018, 8760 h).
Energies 12 02241 g008
Figure 9. Actual price curve and BRIM prediction curve on the test set.
Energies 12 02241 g009
Figure 10. Comparison of predictive performance on weekdays and weekends by means of mean absolute error (MAE).
Energies 12 02241 g010
Figure 11. Comparison of predictive performance on weekdays and weekends by means of symmetric mean absolute percentage error (sMAPE).
Energies 12 02241 g011
Table 1. Descriptive statistics of the dataset.
Data DivisionMeanMedianMAD 1StdMinMax
Training set38.9537.7913.1922.59−200.001938.50
Validation set45.7040.7615.3426.01−2.17874.01
Test set48.1647.8413.3817.67−31.82195.11
1 MAD (Mean Absolute Deviation).
Table 2. Hyper-parameter settings in our proposed BRIM.
Hyper-ParameterValue
Activation functionTanh
DropoutNo
RegularizationNo
Number of neurons47 (both forward and backward)
Sequence length1 week of past prices (previous 168 h of the EPEX) + 1 day of day-ahead prices (24 h of the EXAA)
Table 3. Results of the Diebold-Mariano (DM) test.
Contrast SchemesUni-LSTM2 and BRIMAR( p ) and BRIMUni-LSTM1 and BRIMDNN and BRIMNaïve and BRIMLSTM-DNN and BRIMNaïve-EXAA and BRIMUni-LSTM1 and Uni-LSTM2DNN and Uni-LSTM2
DM_A 16.590754.886796.584448.306366.78.490387.434474.521535.64248
p -value_A 4.63 × 10 11 1.04 × 10 6 4.83 × 10 11 1.13 × 10 16 2.21 × 10 11 2.40 × 10 17 1.15 × 10 13 6.22 × 10 6 1.73 × 10 8
DM_S 12.84793.292914.297825.012775.147056.677466.150963.811073.74367
p -value_S 4.61 × 10 3 9.95 × 10 4 1.74 × 10 5 5.47 × 10 7 2.07 × 10 7 2.58 × 10 11 8.04 × 10 10 1.39 × 10 4 1.83 × 10 4
1 DM_A and DM_S represent the DM test on the basis of mean absolute error (MAE) and mean squared error (MSE), respectively, considering serial correlation of order 23.