Predicting the Impact of Climate Change on Thermal Comfort in A Building Category: The Case of Linear-type Social Housing Stock in Southern Spain

 ,
,  ,
,  ,
, 


Abstract
1. Introduction
2. Materials and Methods
2.1. Building Category Characterization: The SLABE Method
2.2. Adaptive Comfort Standards
- From December to February (winter period), the adaptive thermal comfort standard defined in ISO-EN-15251 was applied (optimum comfort temperature (Tco) according to Equation (1)). This equation is only suited to naturally ventilated buildings, with low metabolic rate activities. The acceptability range defined is a temperature interval of ± 4 °C, associated to building category III (corresponding to PPD < 15%), which is defined only for existing buildings.where:TeR: running mean dry bulb outdoor temperature for today (Equation 2)where:Ted-1: daily mean dry bulb outdoor temperature for previous day;TeR-1: running mean dry bulb outdoor temperature for previous day;α: a constant between 0 and 1. Use of 0.8 is recommended.
- From March to November (summer, spring and autumn periods), the alternative adaptive thermal comfort standard defined by Barbadilla-Martín et al. for the Mediterranean climate was applied (Tco calculated following equation 3) [55]. This standard is only applicable to ‘Mixed Mode’ buildings, i.e., naturally ventilated buildings which also have an air conditioning system in occasional use. For this standard, the acceptability range defined is a temperature interval of ± 3.5 °C, corresponding to a predicted percentage of dissatisfied (PPD) under 20%. In Equation (3), TeR is the running mean dry bulb outdoor temperature for today (see also Equation (2)).
2.3. Environmental Assessment for Climatic Conditions of the Year 2050
2.4. Environmental and Energy Assessment of the ‘Best’ and the ‘Worst’ Case Study
3. Case Study
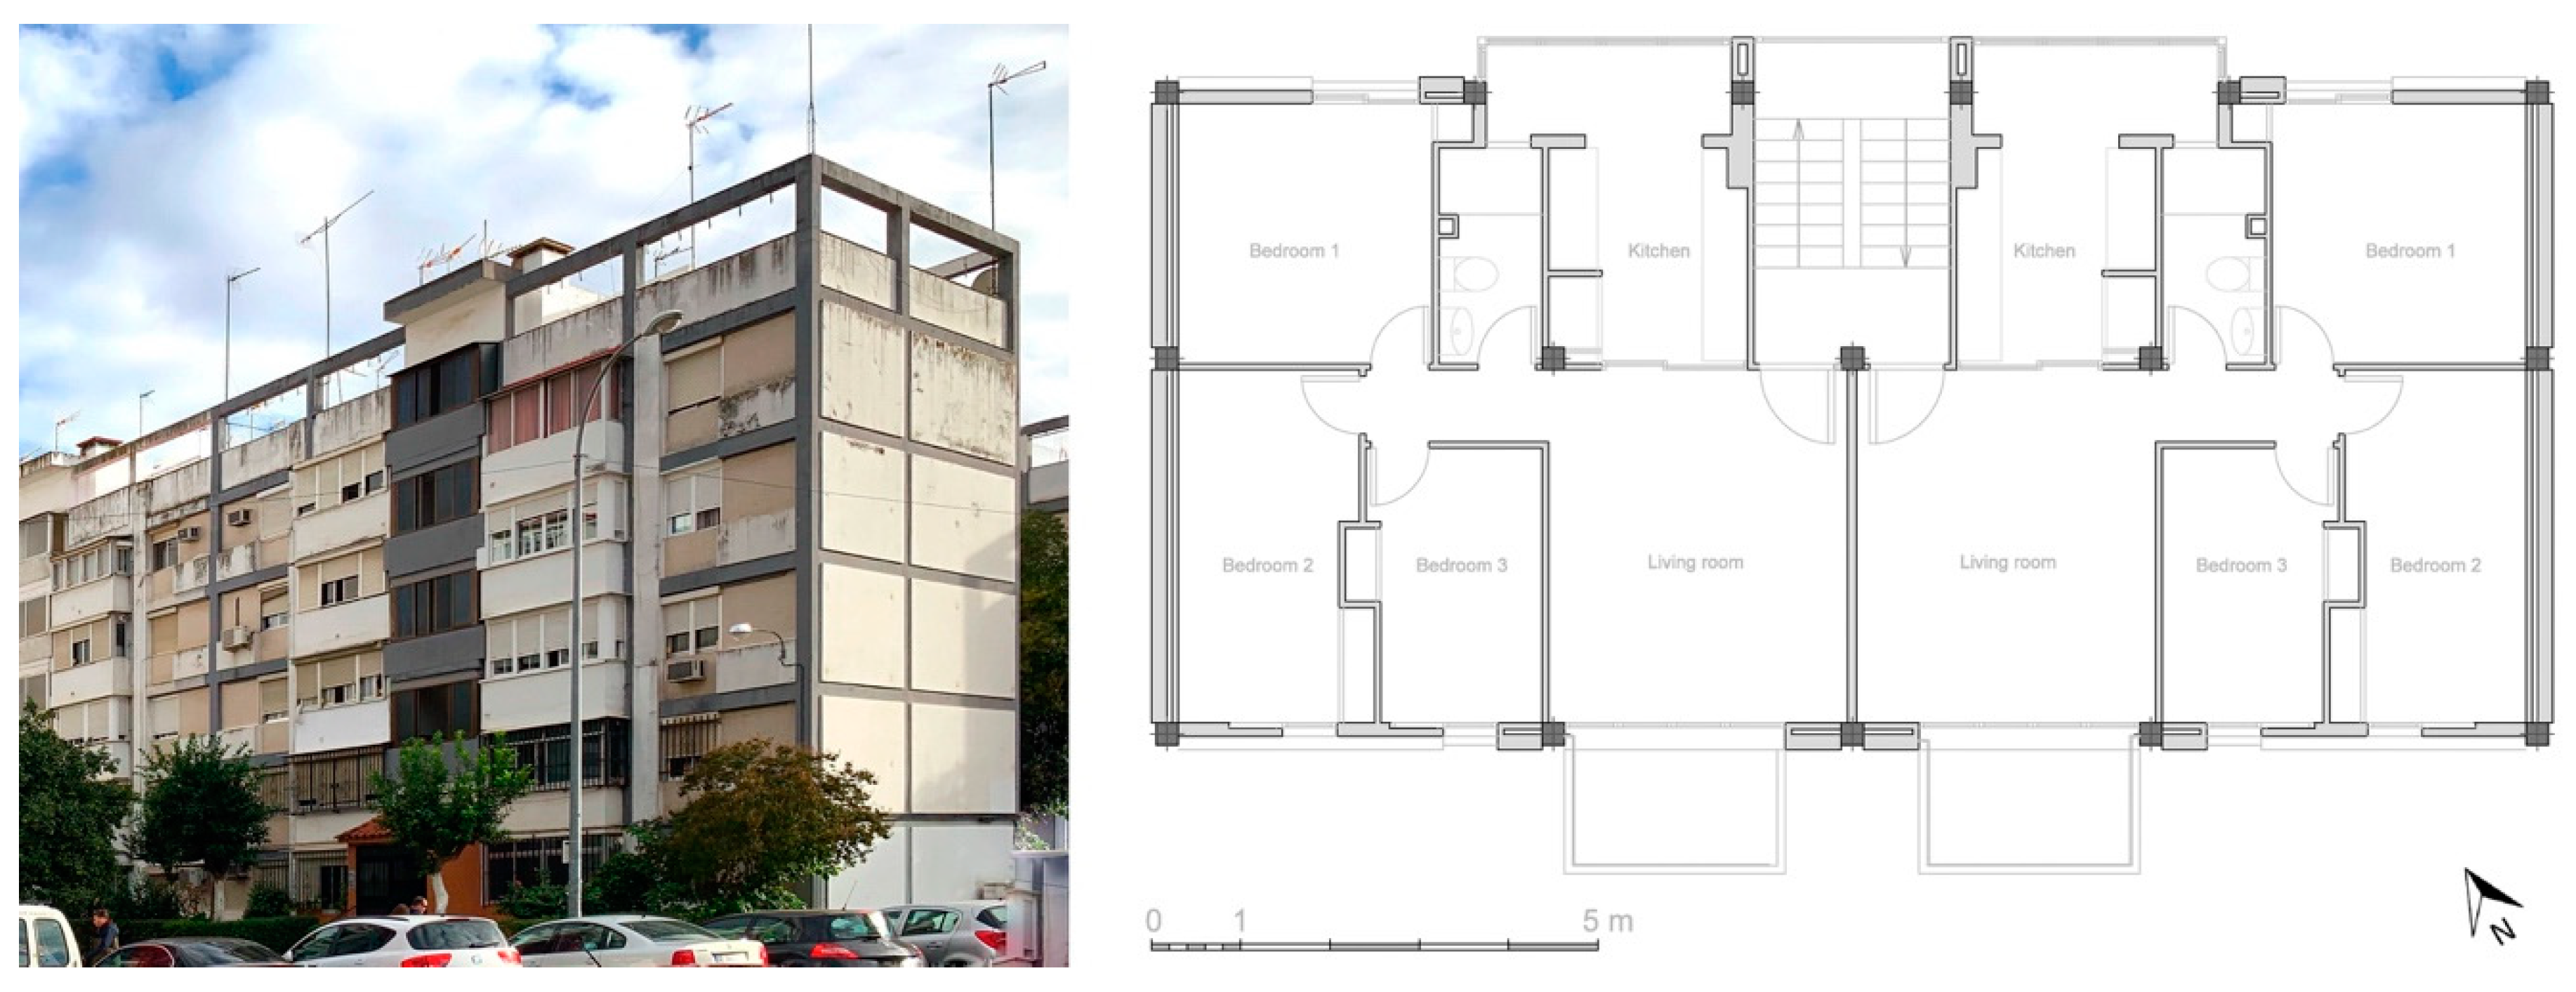
3.1. Definition of the Building Category Case Study

| Parameter | Building Category Stock | Distribution | ||
|---|---|---|---|---|
| General | - | Year of construction | 1940–1980 | |
| - | Typology | Linear | ||
| - | No. dwellings | 42140 | ||
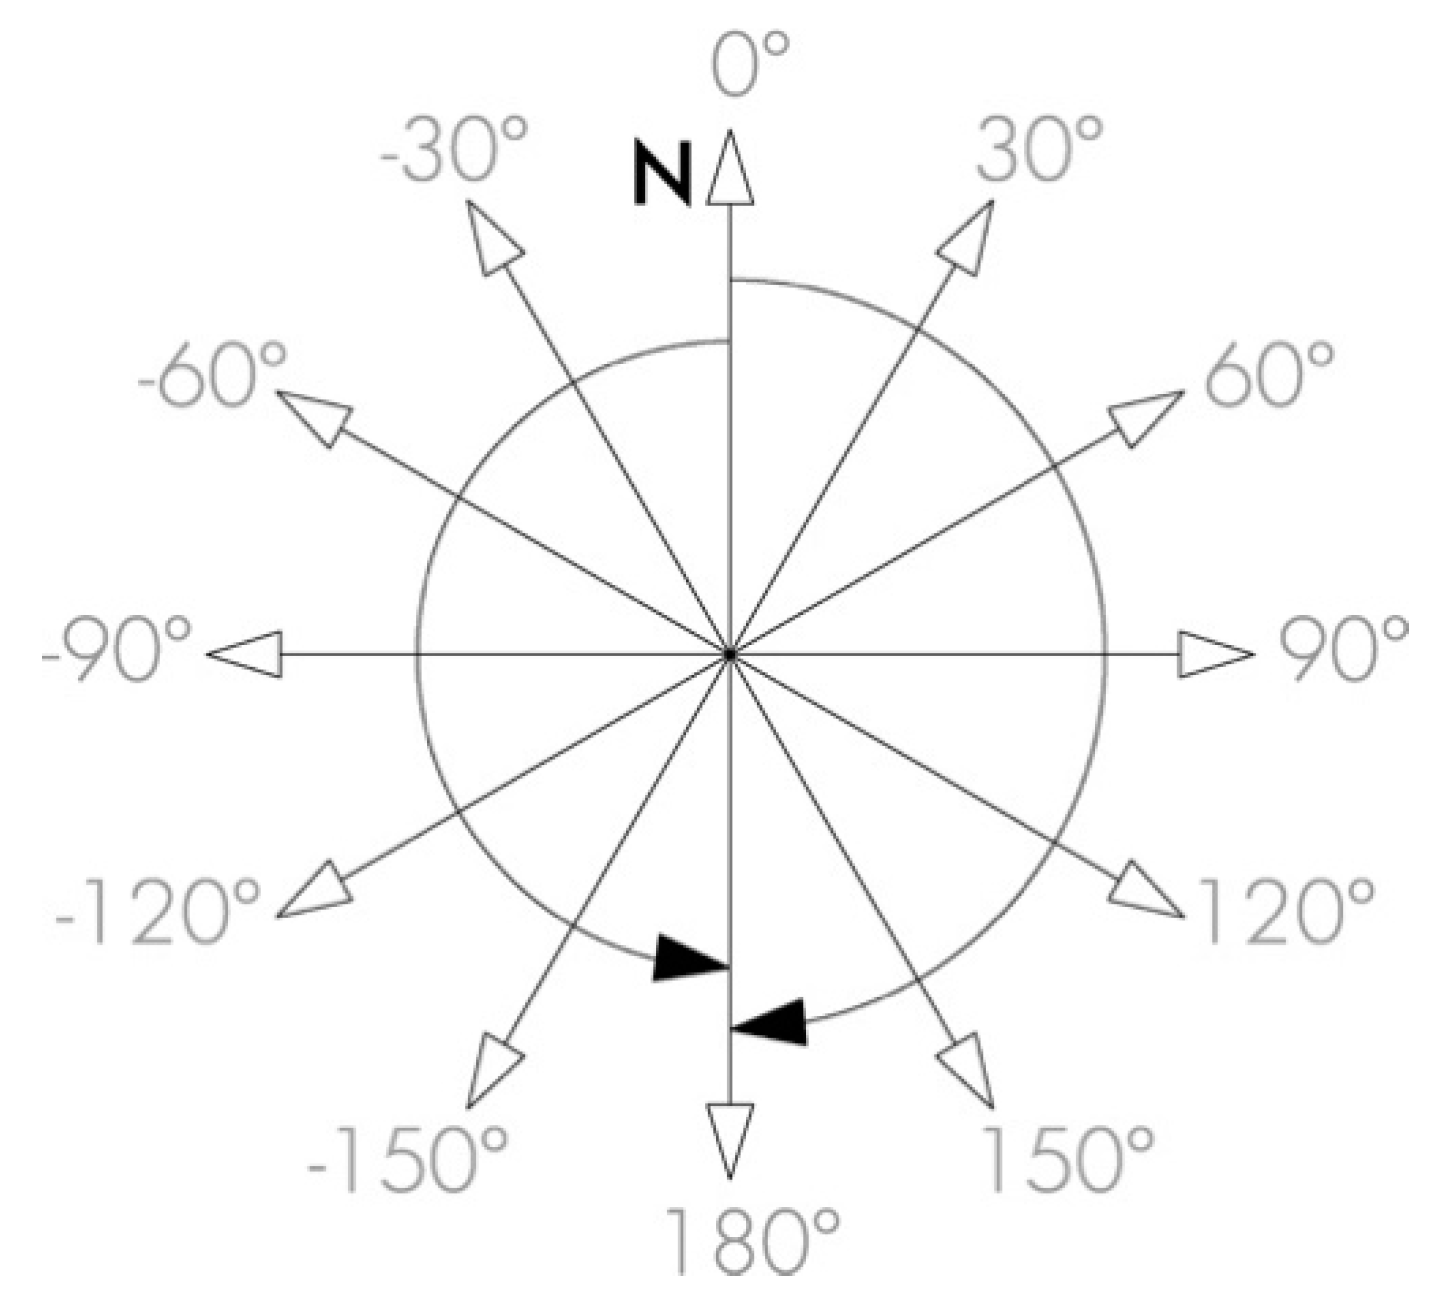
| Geometry | P1 | Orientation (Figure 3) | 0°–180° | Uniform |
| P2 | Area of each floor [m2] | 90–300 | Uniform | |
| P3 | Form ratio 1 | 1–5 | Uniform | |
| P4 | Floor height [m] | 2.4–3.5 | Uniform | |
| P5 | Window to wall ratio: S | 10%–40% | Uniform | |
| P6 | Window to wall ratio: E | 10%–40% | Uniform | |
| P7 | Window to wall ratio: N | 10%–40% | Uniform | |
| P8 | Window to wall ratio: W | 10%–40% | Uniform | |
| P9 | Number of stories | 3–7 | Uniform | |
| Envelope | P10 | Roof solar absorptance (a) | 0.1–0.9 | Normal |
| P11 | Façade solar absorptance (a) | 0.1–0.9 | Normal | |
| P12 | Floor thickness [m] | 0.15–0.30 | Normal | |
| P13 | Floor thermal conductivity [W/m K] | 0.70–1.80 | Normal | |
| Floor U value [W/m2 K] | 4.70–7.00 | Normal | ||
| P14 | Floor density [kg/m3] | 1500–1800 | Normal | |
| P15 | Floor specific heat [J/kg K] | 500–1500 | Normal | |
| P16 | Roof thickness [m] | 0.20–0.40 | Normal | |
| P17 | Roof thermal conductivity [W/m K] | 0.31–0.57 | Normal | |
| Roof U value [W/m2 K] | 1.25–2.40 | Normal | ||
| P18 | Roof density [kg/m3] | 1000–1800 | Normal | |
| P19 | Roof specific heat [J/kg K] | 500–1500 | Normal | |
| P20 | Façade thickness [m] | 0.10–0.35 | Normal | |
| P21 | Façade thermal conductivity [W/m K] | 0.19–0.46 | Normal | |
| Façade U value [W/m2 K] | 0.75–4.35 | Normal | ||
| P22 | Façade density [kg/m3] | 1000–3000 | Normal | |
| P23 | Façade specific heat [J/kg K] | 500–1500 | Normal | |
| P24 | Internal partitions thickness [m] | 0.07–0.24 | Normal | |
| P25 | Type of window glass | Single; Double | Uniform | |
| P26 | Type of window frame | Aluminium; Wood | Uniform | |
| Window U value [W/m2 K] | 2.80–5.70 | Uniform | ||
| Operation | P27 | People density [people/m2] | 0.01–0.15 | Normal |
| P28 | Infiltration rate [h-1] [65] | 0.3–1.0 | Normal | |
| P29 | Night-time natural ventilation rate [h-1] | 0; 2; 4; 6 | Uniform | |
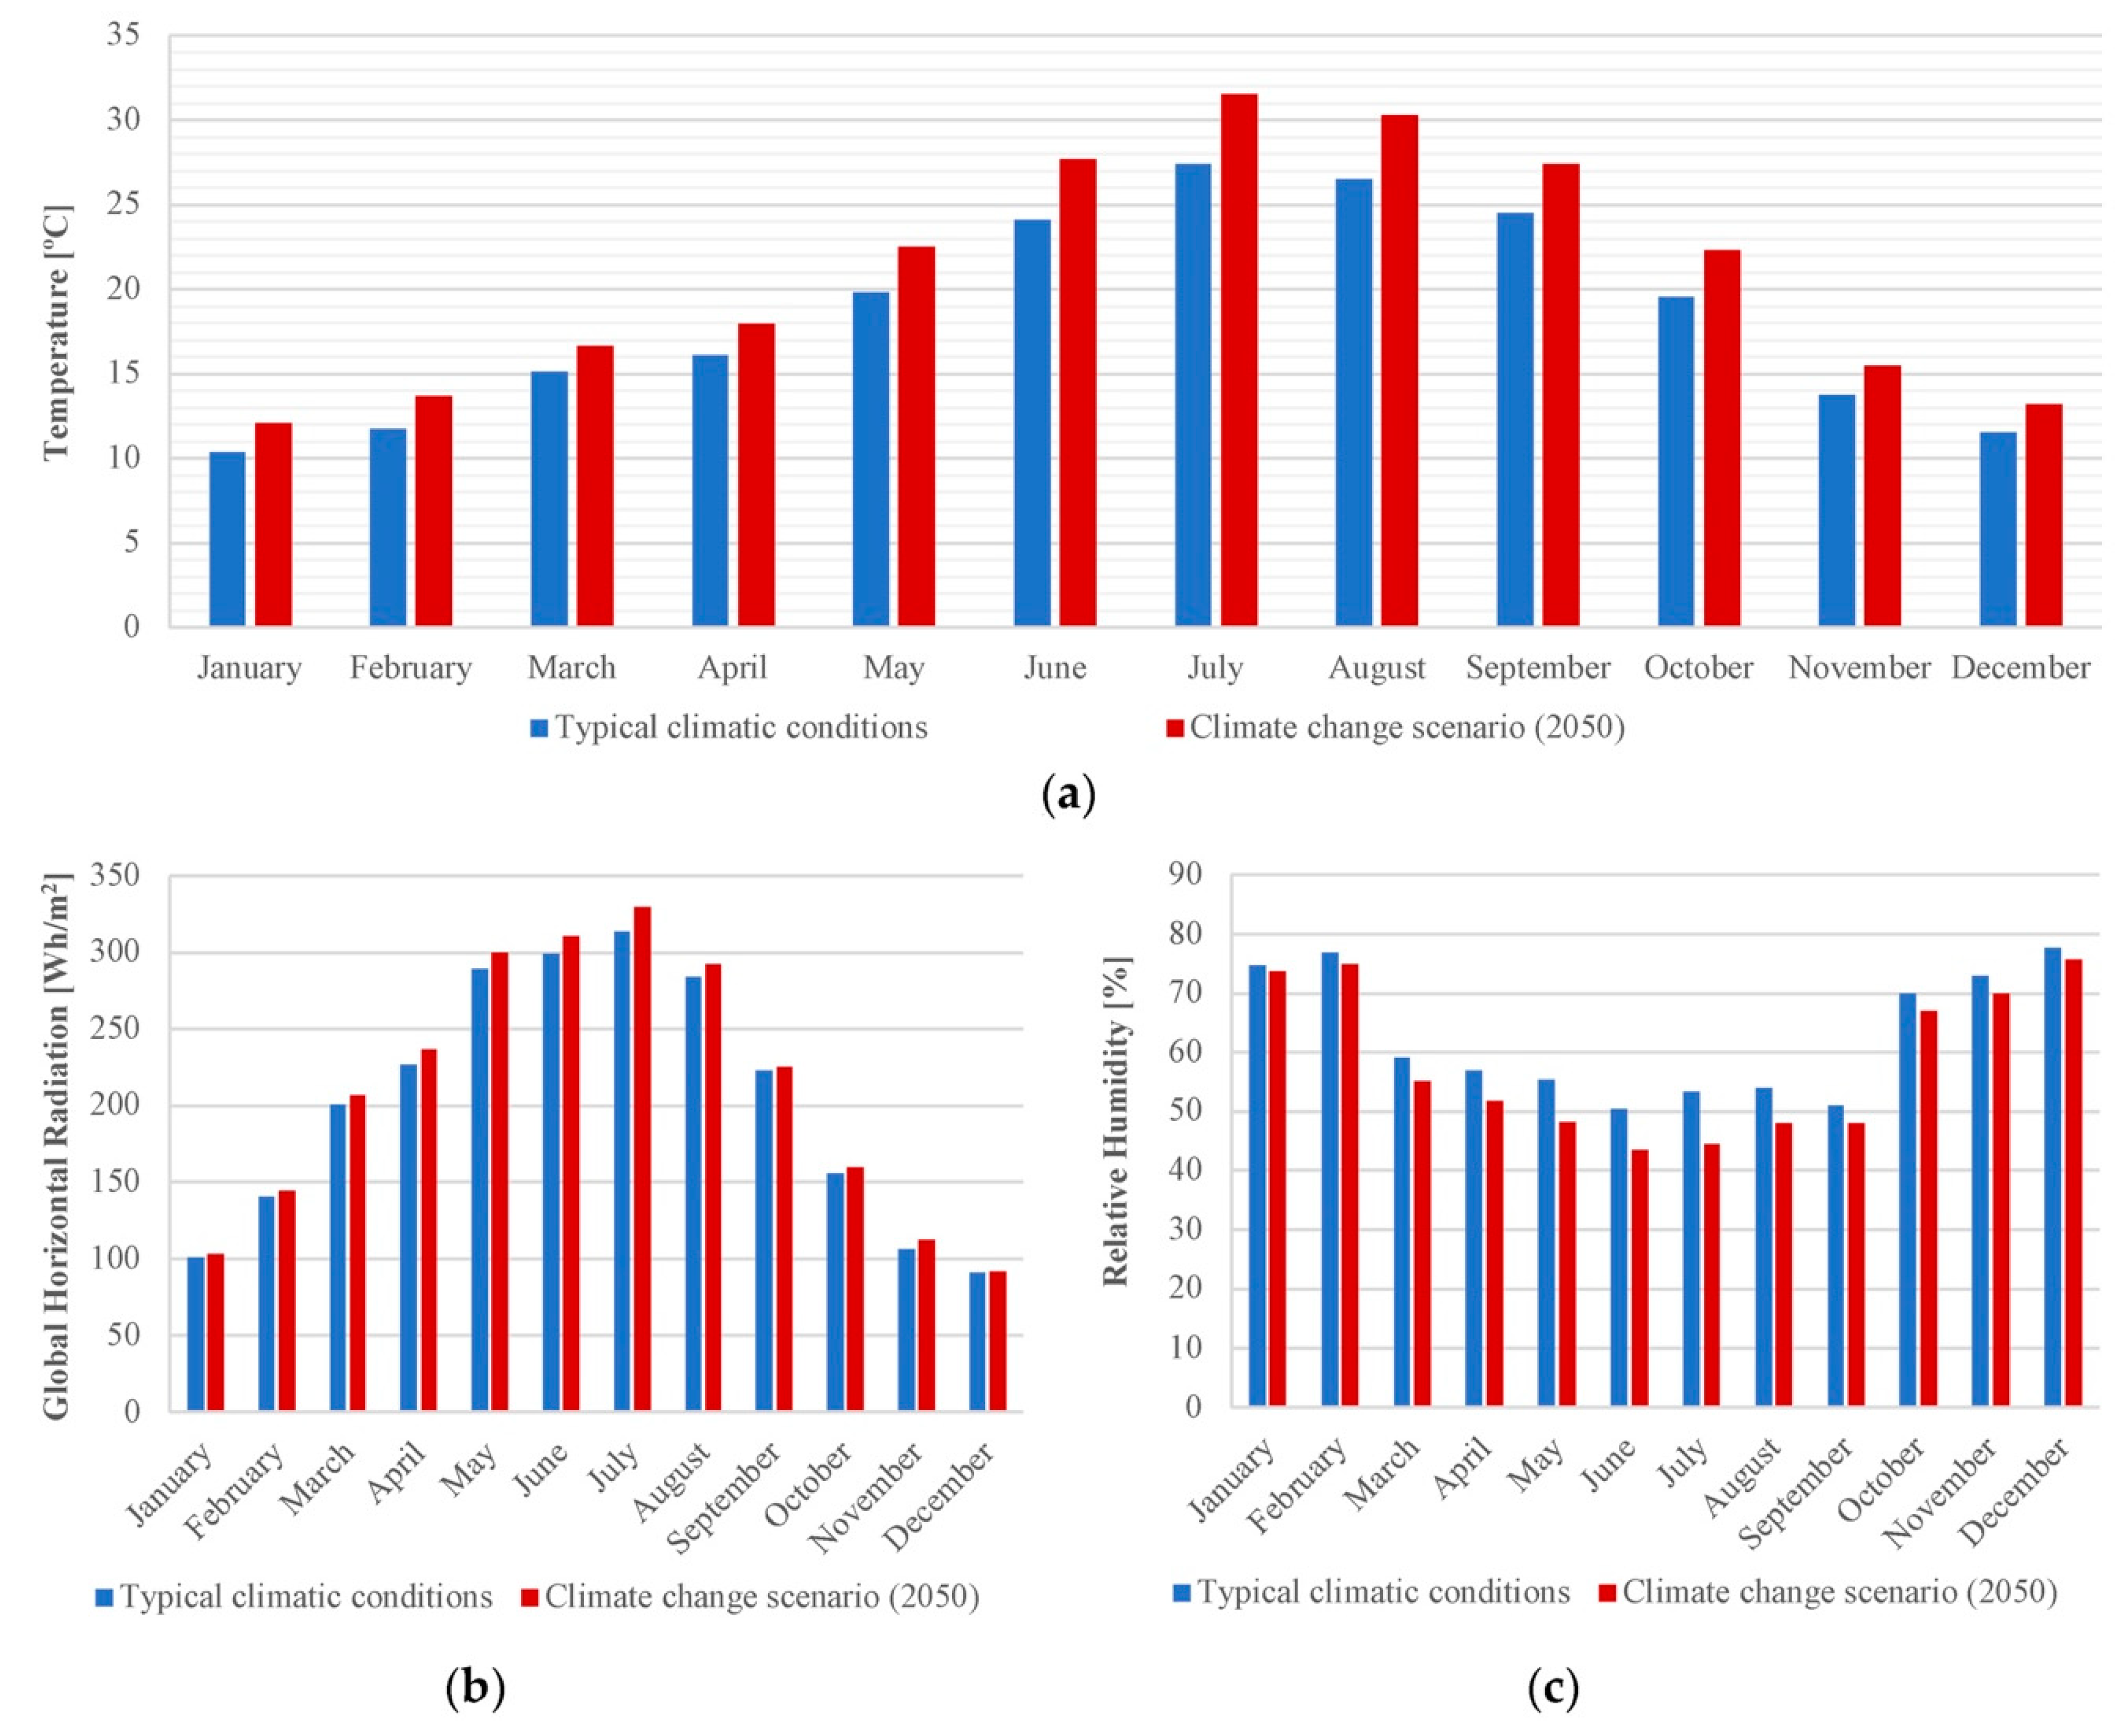
3.2. Climate Change Scenario (Year 2050)
4. Results
4.1. Environmental Assessment of the Building Category
4.2. Environmental Assessment of the ‘Best’ and the ‘Worst’ Case Study
4.3. Energy Assessment of the ‘Best’ and the ‘Worst’ Case Study
5. Discussion
6. Strengths and Limitations
7. Conclusions
Supplementary Materials
Author Contributions
Funding
Conflicts of Interest
Nomenclature
| DH | Annual percentage of discomfort hours |
| DHh | Percentage of discomfort hours (heating period) |
| DHc | Percentage of discomfort hours (cooling period) |
| HVAC | Heating, ventilating and air conditioning |
| IPCC | Intergovernmental Panel on Climate Change |
| N | Sample size (number of cases) |
| PMV | Predicted mean vote |
| PPD | Predicted percentage of dissatisfied |
| SA | Sensitivity analysis |
| SLABE | Simulation-based large-scale uncertainty/sensitivity analysis of building energy performance |
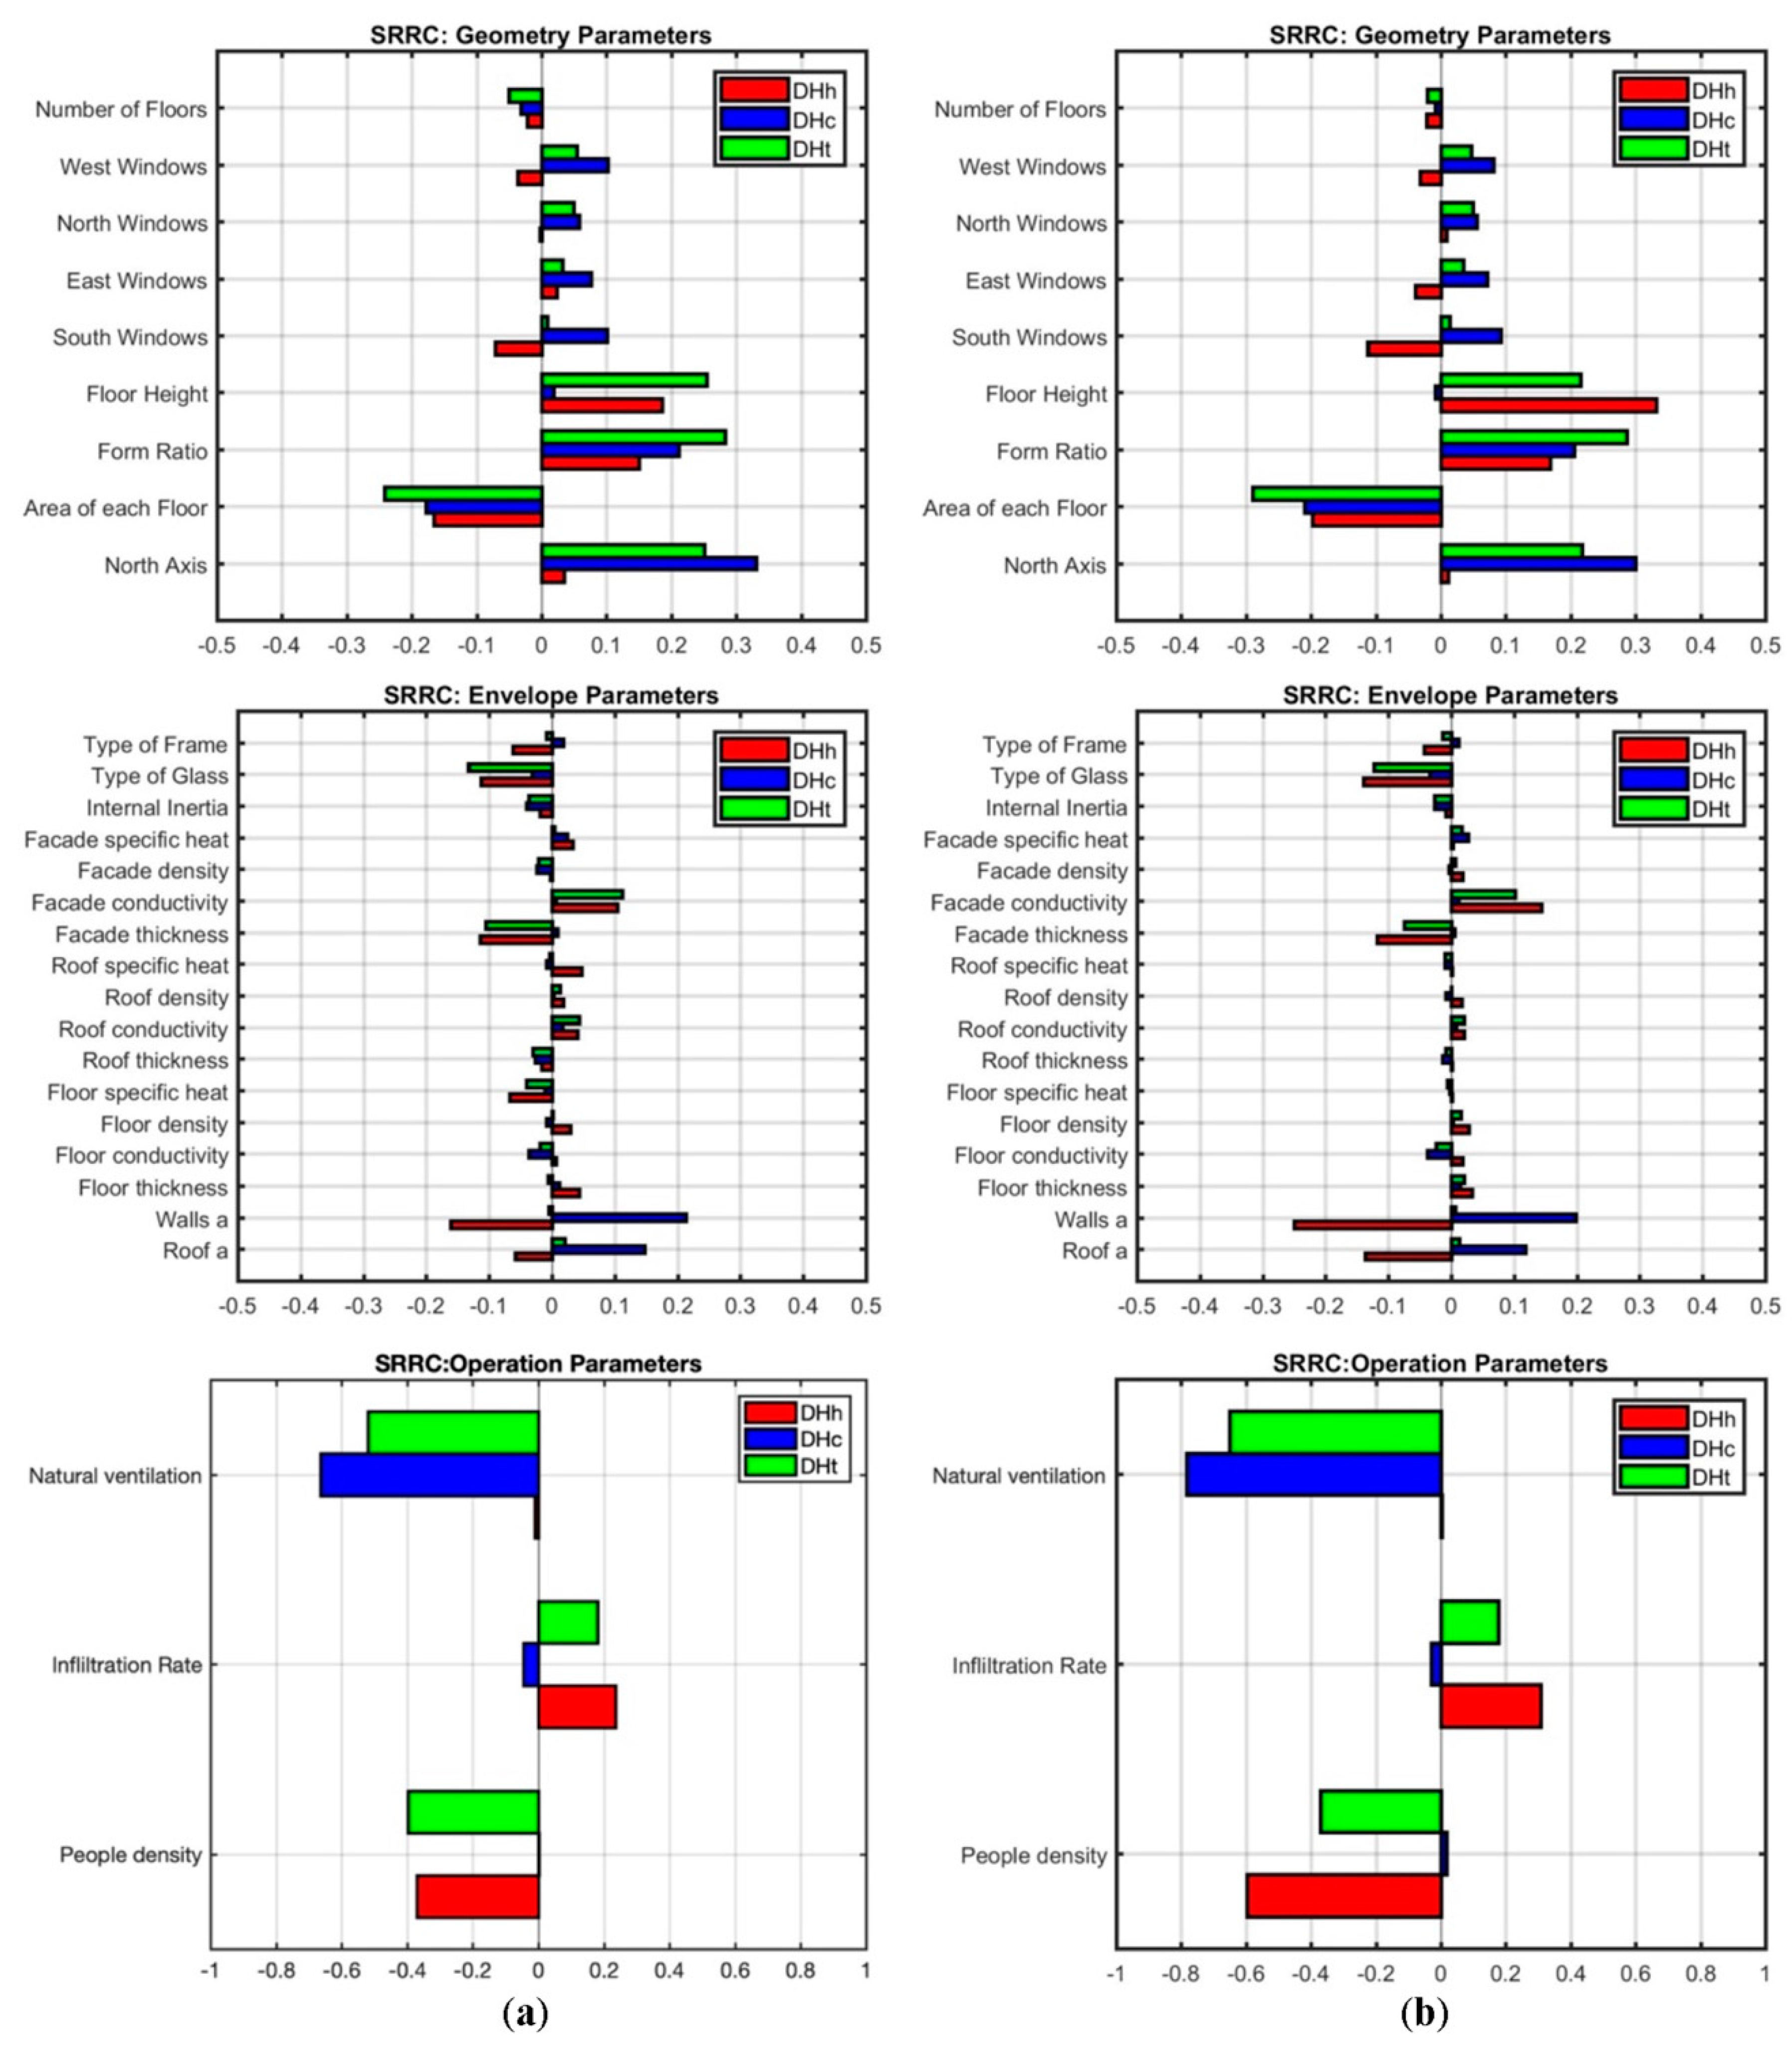
| SRRC | Standardized rank regression coefficient |
| Tco | Optimum comfort temperature [ºC] |
| U | Thermal transmittance [W/m2 K] |
| UA | Uncertainty analysis |
References
- Eurostat. Final Energy Consumption by Sector. 2015. Available online: http://ec.europa.eu/eurostat/statistics-explained/index.php/Consumption_of_energy#Consumption (accessed on 19 March 2019).
- Intergovernmental Panel on Climate Change (IPCC). Available online: https://www.ipcc.ch/ (accessed on 19 March 2019).
- IPCC. Special Report on Emissions Scenarios (SRES); Nakicenovic, N., Swart, R., Eds.; Cambridge University Press: Cambridge, UK, 2000; Available online: https://www.ipcc.ch/report/emissions-scenarios/ (accessed on 19 March 2019).
- Andrić, I.; Koc, M.; Al-Ghamdi, S.G. A review of climate change implications for built environment: Impacts, mitigation measures and associated challenges in developed and developing countries. J. Clean. Prod. 2019, 211, 83–102. [Google Scholar] [CrossRef]
- Li, D.H.W.; Yang, L.; Lam, J.C. Impact of climate change on energy use in the built environment in different climate zones—A review. Energy 2012, 42, 103–112. [Google Scholar] [CrossRef]
- Santamouris, M. Cooling the buildings—Past, present and future. Energy Build. 2016, 128, 617–638. [Google Scholar] [CrossRef]
- Kapsomenakis, J.; Kolokotsa, D.; Nikolaou, T.; Santamouris, M.; Zerefos, F.C. Forty years increase of the air ambient temperature in Greece: The impact on buildings. Energy Convers. Manag. 2013, 74, 353–365. [Google Scholar] [CrossRef]
- Suárez, R.; Escandón, R.; López-Pérez, R.; León-Rodríguez, Á.L.; Klein, T.; Silvester, S. Impact of climate change: Environmental assessment of passive solutions in a single-family home in Southern Spain. Sustainability 2018, 10, 2914. [Google Scholar] [CrossRef]
- Ministerio de Vivienda. Código Técnico de la Edificación (CTE) Documento Básico de Ahorro de Energía (DB-HE). 2013. Available online: http://www.codigotecnico.org/images/stories/pdf/ahorroEnergia/DBHE.pdf (accessed on 6 March 2019).
- Santamouris, M.; Kolokotsa, D. On the impact of urban overheating and extreme climatic conditions on housing, energy, comfort and environmental quality of vulnerable population in Europe. Energy Build. 2015, 98, 125–133. [Google Scholar] [CrossRef]
- Coley, D.; Kershaw, T. Changes in internal temperatures within the built environment as a response to a changing climate. Build. Environ. 2010, 45, 89–93. [Google Scholar] [CrossRef]
- The European Platform against Poverty and Social Exclusion: A European Framework for Social and Territorial cohesion. In Communication from the Commission to the European Parliament, the Council, the European Economic and Social Committee and the Committee of the Regions; European Commission: Brussels, Belgium, 2010.
- Sanchez-Guevara, C.; Núñez-Peiró, M.; Taylor, J.; Mavrogianni, A.; Neila, J. Assessing population vulnerability towards summer energy poverty: Case studies of Madrid and London. Energy Build. 2019, 190, 132–143. [Google Scholar] [CrossRef]
- Sepasgozar, S.M.E.; Blair, J. Measuring non-road diesel emissions in the construction industry: A synopsis of the literature. Int. J. Constr. Manag. 2019. [Google Scholar] [CrossRef]
- Ascione, F.; Bianco, N.; De Masi, R.F.; Mauro, G.M.; Vanoli, G.P. Resilience of robust cost-optimal energy retrofit of buildings to global warming: A multi-stage, multi-objective approach. Energy Build. 2017, 153, 150–167. [Google Scholar] [CrossRef]
- Spanish Statistics National Institute. Censos de Población y Viviendas. 2011. Available online: http://www.ine.es/censos2011/tablas/Inicio.do (accessed on 19 March 2019).
- Di Pilla, L.; Desogus, G.; Mura, S.; Ricciu, R.; Di Francesco, M. Optimizing the distribution of Italian building energy retrofit incentives with Linear Programming. Energy Build. 2016, 112, 21–27. [Google Scholar] [CrossRef]
- Calama-González, C.M.; Suárez, R.; León-Rodríguez, Á.L.; Domínguez-Amarillo, S. Evaluation of thermal comfort conditions in retrofitted facades using test cells and considering overheating scenarios in a Mediterranean climate. Energies 2018, 11, 788. [Google Scholar] [CrossRef]
- Ascione, F.; Rossi, F.; Vanoli, G.P. Energy retrofit of historical buildings: Theoretical and experimental investigations for the modelling of reliable performance scenarios. Energy Build. 2011, 43, 1925–1936. [Google Scholar] [CrossRef]
- Escandón, R.; Silvester, S.; Konstantinou, T. Evaluating the environmental adaptability of a nearly zero energy retrofitting strategy designed for Dutch housing stock to a Mediterranean climate. Energy Build. 2018, 169, 366–378. [Google Scholar] [CrossRef]
- Sunikka-Blank, M.; Galvin, R. Introducing the prebound effect: The gap between performance and actual energy consumption. Build. Res. Inf. 2012, 40, 260–273. [Google Scholar] [CrossRef]
- Guerra-Santín, O.; Itard, L. Occupants’ behaviour: Determinants and effects on residential heating consumption. Build. Res. Inf. 2010, 38, 318–338. [Google Scholar] [CrossRef]
- Kavgic, M.; Mavrogianni, A.; Mumovic, D.; Summerfield, A.; Stevanovic, Z.; Djurovic-Petrovic, M. A review of bottom-up building stock models for energy consumption in the residential sector. Build. Environ. 2010, 45, 1683–1697. [Google Scholar] [CrossRef]
- Kragh, J.; Wittchen, K.-B. Development of two Danish building typologies for residential buildings. Energy Build. 2014, 68, 79–86. [Google Scholar] [CrossRef]
- Streicher, K.N.; Padey, P.; Parra, D.; Bürer, M.C.; Patel, M.K. Assessment of the current thermal performance level of the Swiss residential building stock: Statistical analysis of energy performance certificates. Energy Build. 2018, 178, 360–378. [Google Scholar] [CrossRef]
- Dascalaki, E.G.; Droutsa, K.; Gaglia, A.G.; Kontoyiannidis, S.; Balaras, C.A. Data collection and analysis of the building stock and its energy performance—An example for Hellenic buildings. Energy Build. 2010, 42, 1231–1237. [Google Scholar] [CrossRef]
- Theodoridou, I.; Papadopoulos, A.M.; Hegger, M. Statistical analysis of the Greek residential building stock. Energy Build. 2011, 43, 2422–2428. [Google Scholar] [CrossRef]
- Swan, L.G.; Ugursal, V.I. Modeling of end-use energy consumption in the residential sector: A review of modeling techniques. Renew. Sustain. Energy Rev. 2009, 13, 1819–1835. [Google Scholar] [CrossRef]
- US Department of Energy. Energy Efficiency and Renewable Energy Office, Building Technology Program, EnergyPlus 8.0.0. Available online: https://energyplus.net/ (accessed on 6 March 2019).
- ESP-r. Available online: http://www.esru.strath.ac.uk/Programs/ESP-r.htm (accessed on 6 March 2019).
- TRNSYS. Transient System Simulation Program; University of Wisconsin: Madison, WI, USA, 2000. [Google Scholar]
- Wang, D.; Landolt, J.; Mavromatidis, G.; Orehounig, C.; Carmeliet, J. CESAR: A bottom-up building stock modelling tool for Switzerland to address sustainable energy transformation strategies. Energy Build. 2018, 169, 9–26. [Google Scholar] [CrossRef]
- Penna, P.; Prada, A.; Cappelletti, F.; Gasparella, A. Multi-objectives optimization of energy saving measures in existing buildings. Energy Build. 2015, 95, 57–69. [Google Scholar] [CrossRef]
- Li, Y.F.; Ng, S.H.; Xie, M.; Goh, T.N. A systematic comparison of metamodeling techniques for simulation optimization in decision support systems. Appl. Soft. Comput. 2010, 10, 1257–1273. [Google Scholar] [CrossRef]
- Melo, A.P.; Cóstola, D.; Lamberts, R.; Hensen, J.L. Development of surrogate models using artificial neural network for building shell energy labeling. Energy Policy 2014, 69, 457–466. [Google Scholar] [CrossRef]
- Santamouris, M. On the energy impact of urban heat island and global warming on buildings. Energy Build. 2014, 82, 100–113. [Google Scholar] [CrossRef]
- Escandón, R.; Ascione, F.; Bianco, N.; Mauro, G.M.; Suárez, R.; Sendra, J.J. Thermal comfort prediction in a building category: Artificial neural network generation from calibrated models for a social housing stock in Southern Europe. App. Thermal Eng. 2019, 150, 492–505. [Google Scholar] [CrossRef]
- Mauro, G.M.; Hamdy, M.; Vanoli, G.P.; Bianco, N.; Hensen, J.L.M. A new methodology for investigating the cost-optimality of energy retrofitting a building category. Energy Build. 2015, 107, 456–478. [Google Scholar] [CrossRef]
- Helton, J.C.; Johnson, J.D.; Sallaberry, C.; Storlie, C.B. Survey of sampling-based methods for uncertainty and sensitivity analysis. Reliab. Eng. Syst. Saf. 2006, 91, 1175–1209. [Google Scholar] [CrossRef]
- Hopfe, C.J.; Hensen, J.L. Uncertainty analysis in building performance simulation for design support. Energy Build. 2011, 43, 2798–2805. [Google Scholar] [CrossRef]
- Conraud, J. A Methodology for the Optimization of Building Energy, Thermal, and Visual Performance. Master Thesis, Concordia University, Montreal, QC, Canada, 2008. [Google Scholar]
- MATLAB®–MATrixLABoratory; 7.10.0.; MathWorks: Natick, MA, USA, 2010.
- Nguyen, A.T.; Reiter, S.; Rigo, P. A review on simulation-based optimization methods applied to building performance analysis. Appl. Energy 2014, 113, 1043–1058. [Google Scholar] [CrossRef]
- Tian, W. A review of sensitivity analysis methods in building energy analysis. Renew. Sustain. Energy Rev. 2013, 20, 411–419. [Google Scholar] [CrossRef]
- Fanger, P.P. Thermal Comfort: Analysis and Applications on Environmental Technology; Danish Technical Press: Copenhagen, Denmark, 1970. [Google Scholar]
- ISO. Standard ISO 7730:2005, Moderate Thermal Environments Determination of the PMV and PPD Indices and Specification of the Conditions for Thermal Comfort; International Organization for Standardization (ISO): Geneva, Switzerland, 2005. [Google Scholar]
- Humphreys, M.A. Field studies of thermal comfort compared and applied. Build. Serv. Eng. 1976, 44, 5–27. [Google Scholar]
- Moujalled, B.; Cantin, R.; Guarracino, G. Comparison of thermal comfort algorithms in naturally ventilated office buildings. Energy Build. 2008, 40, 2215–2223. [Google Scholar] [CrossRef]
- Djongyang, N.; Tchinda, R.; Njomo, D. Thermal comfort: A review paper. Renew. Sustain. Energy Rev. 2010, 14, 2626–2640. [Google Scholar] [CrossRef]
- Escandón, R.; Suárez, R.; Sendra, J.J. On the assessment of the energy performance and environmental behaviour of social housing stock for the adjustment between simulated and measured data: The case of mild winters in the Mediterranean climate of Southern Europe. Energy Build. 2017, 152, 418–433. [Google Scholar] [CrossRef]
- Escandón, R.; Suárez, R.; Sendra, J.J. Field assessment of thermal comfort conditions and energy performance of social housing: The case of hot summers in the Mediterranean climate. Energy Policy 2019, 128, 377–392. [Google Scholar] [CrossRef]
- ASHRAE. Thermal Environmental Conditions for Human Occupancy. In Standard 55-2010; American Society of Heating, Refrigerating and Air Conditioning Engineers: Atlanta, GA, USA, 2010. [Google Scholar]
- European Committee for Standardization (CEN). Indoor environmental input parameters for design and assessment of energy performance of buildings-addressing indoor air quality, thermal environment, lighting and acoustics. In Standard EN 15251; CEN: Brussels, Belgium, 2007. [Google Scholar]
- European Committee for Standardization (CEN). CEN/TC 156. prEN 16798-1:2015. Energy Performance of Buildings—Part 1: Indoor Environmental Input Parameters for Design and Assessment of Energy Performance of Buildings Addressing Indoor Air Quality, Thermal Environment, Lighting and Acoustics—Module M1–6; CEN: Brussels, Belgium, 2015. [Google Scholar]
- Barbadilla-Martín, E.; Salmerón, J.M.; Guadix, J.; Aparicio-Ruiz, P.; Brotas, L. Field study on adaptive thermal comfort in mixed mode office buildings in southwestern area of Spain. Build. Environ. 2017, 123, 163–175. [Google Scholar] [CrossRef]
- University of Southampton. Climate Change World Weather File Generator for World-Wide Weather Data–CCWorldWeatherGen. Available online: http://www.energy.soton.ac.uk/ccworldweathergen/ (accessed on 16 February 2019).
- Belcher, S.E.; Hacker, J.N.; Powell, D.S. Constructing design weather data for future climates. Build. Serv. Eng. Res. Technol. 2005, 26, 49–61. [Google Scholar] [CrossRef]
- EnergyPlus Weather Database. Available online: https://energyplus.net/weather (accessed on 16 February 2019).
- Jentsch, M.F.; James, P.A.B.; Bourikas, L.; Bahaj, A.S. Transforming existing weather data for worldwide locations to enable energy and building performance simulation under future climates. Renew. Energy 2011, 55, 514–524. [Google Scholar] [CrossRef]
- IPCC Data distribution Centre. Available online: http://www.ipcc-data.org/ (accessed on 16 February 2019).
- Domínguez, S.; Sendra, J.J.; Fernández-Agüera, J.; Escandón, R. La Construcción de la Vivienda Social en Sevilla y su Catalogación: 1939–1975; Editorial de la Universidad de Sevilla: Sevilla, Spain, 2017. [Google Scholar]
- R&D&i Project REFAVIV. Available online: http://proyectorefaviv.ietcc.csic.es/ (accessed on 6 March 2019).
- Sech-Spahousec Project—Analysis of the Energy Consumption in the Spanish Households. Available online: https://www.idae.es/uploads/documentos/documentos_Informe_SPAHOUSEC_ACC_f68291a3.pdf (accessed on 6 March 2019).
- AEMET. Agencia Estatal de Meteorología de España. Available online: http://www.aemet.es/es/serviciosclimaticos/datosclimatologicos/valoresclimatologicos?l=5783&k=and (accessed on 6 March 2019).
- Fernández-Agüera, J.; Domínguez-Amarillo, S.; Sendra, J.J.; Suárez, R.; Oteiza, I. Social housing airtightness in Southern Europe. Energy Build. 2019, 183, 377–391. [Google Scholar] [CrossRef]
- Yildiz, Y.; Korkmaz, K.; Göksal Özbalta, T.; Durmus Arsan, Z. An approach for developing sensitive design parameter guidelines to reduce the energy requirements of low-rise apartment buildings. Appl. Energy 2012, 93, 337–347. [Google Scholar] [CrossRef]
- Pierangioli, L.; Cellai, G.; Ferrise, R.; Trombi, G.; Bindi, M. Effectiveness of passive measures against climate change: Case studies in Central Italy. Build. Simul. 2017, 10, 459–479. [Google Scholar] [CrossRef]
- Cellura, M.; Guarino, F.; Longo, S.; Tumminia, G. Climate change and the building sector: Modelling and energy implications to an office building in southern Europe. Energy Sustain. Develop. 2018, 45, 46–65. [Google Scholar] [CrossRef]
- Pérez-Andreu, V.; Aparicio-Fernández, C.; Martínez-Ibernón, C.; Vivancos, J.L. Impact of climate change on heating and cooling energy demand in a residential building in a Mediterranean climate. Energy 2018, 165, 63–74. [Google Scholar] [CrossRef]
- Barbosa, R.; Vicente, R.; Santos, R. Climate change and thermal comfort in Southern Europe housing: A case study from Lisbon. Build. Environ. 2015, 92, 440–451. [Google Scholar] [CrossRef]
- Dino, I.G.; Akgül, C.M. Impact of climate change on the existing residential building stock in Turkey: An analysis on energy use, greenhouse gas emissions and occupant comfort. Renew. Energy 2019, 141, 828–846. [Google Scholar] [CrossRef]
- Ozarisoy, B.; Elsharkawy, H. Assessing overheating risk and thermal comfort in state-of-the-art prototype houses that combat exacerbated climate change in UK. Energy Build. 2019, 187, 201–217. [Google Scholar] [CrossRef]
- Hamdy, M.; Carlucci, S.; Hoes, P.J.; Hensen, J.L.M. The impact of climate change on the overheating risk in dwellings—A Dutch case study. Build. Environ. 2017, 122, 307–323. [Google Scholar] [CrossRef]
- Pezeshki, Z.; Soleimani, A.; Darabi, A. Application of BEM and using BIM database for BEM: A review. J. Build. Eng. 2019, 23, 1–17. [Google Scholar] [CrossRef]
- Crawley, D.B.; Lawrie, L.K.; Winkelmann, F.C.; Buhl, W.F.; Huang, Y.J.; Pedersen, C.O.; Strand, R.K.; Liesen, R.J.; Fisher, D.E.; Witte, M.J.; et al. EnergyPlus: Creating a new-generation building energy simulation program. Energy Build. 2001, 33, 319–331. [Google Scholar] [CrossRef]
- ASHRAE. ASHRAE Guideline 14-2014: Measurement of Energy, Demand and Water Savings; American Society of Heating, Refrigerating and Air Conditioning Engineers: Atlanta, GA, USA, 2014. [Google Scholar]
- CIBSE. Use of Climate Change Scenarios for Building Simulation: The CIBSE Future Weather Years—CIBSE TM48; The Chartered Institution of Building Services Engineers: London, UK, 2009. [Google Scholar]
- Ascione, F. Energy conservation and renewable technologies for buildings to face the impact of the climate change and minimize the use of cooling. Sol. Energy 2017, 154, 34–100. [Google Scholar] [CrossRef]


| Seville: Climate Characteristics | |
|---|---|
| Altitude [m] | 34 |
| Latitude | 37º 25’ 0’’ N |
| Longitude | 5º 52’ 45’’ W |
| Average temperature [°C] | 19.2 |
| Average maximum daily temperature [°C] | 25.4 |
| Average minimum daily temperature [°C] | 13.0 |
| 99% winter design temperature (annual) [°C] | 4.5 |
| Winter mean DTR [°C] | 12.9 |
| 1% summer design temperature (annual) [°C] | 37.6 |
| Summer mean DTR [°C] | 17.4 |
| Average relative humidity [%] | 59 |
| Average daily global irradiation [kWh/m2] | 5.23 |
| Average hours of sunlight | 2917 |
| Pattern | Schedule | |
|---|---|---|
| 0:00–8:00 h | 8:00–0:00 h | |
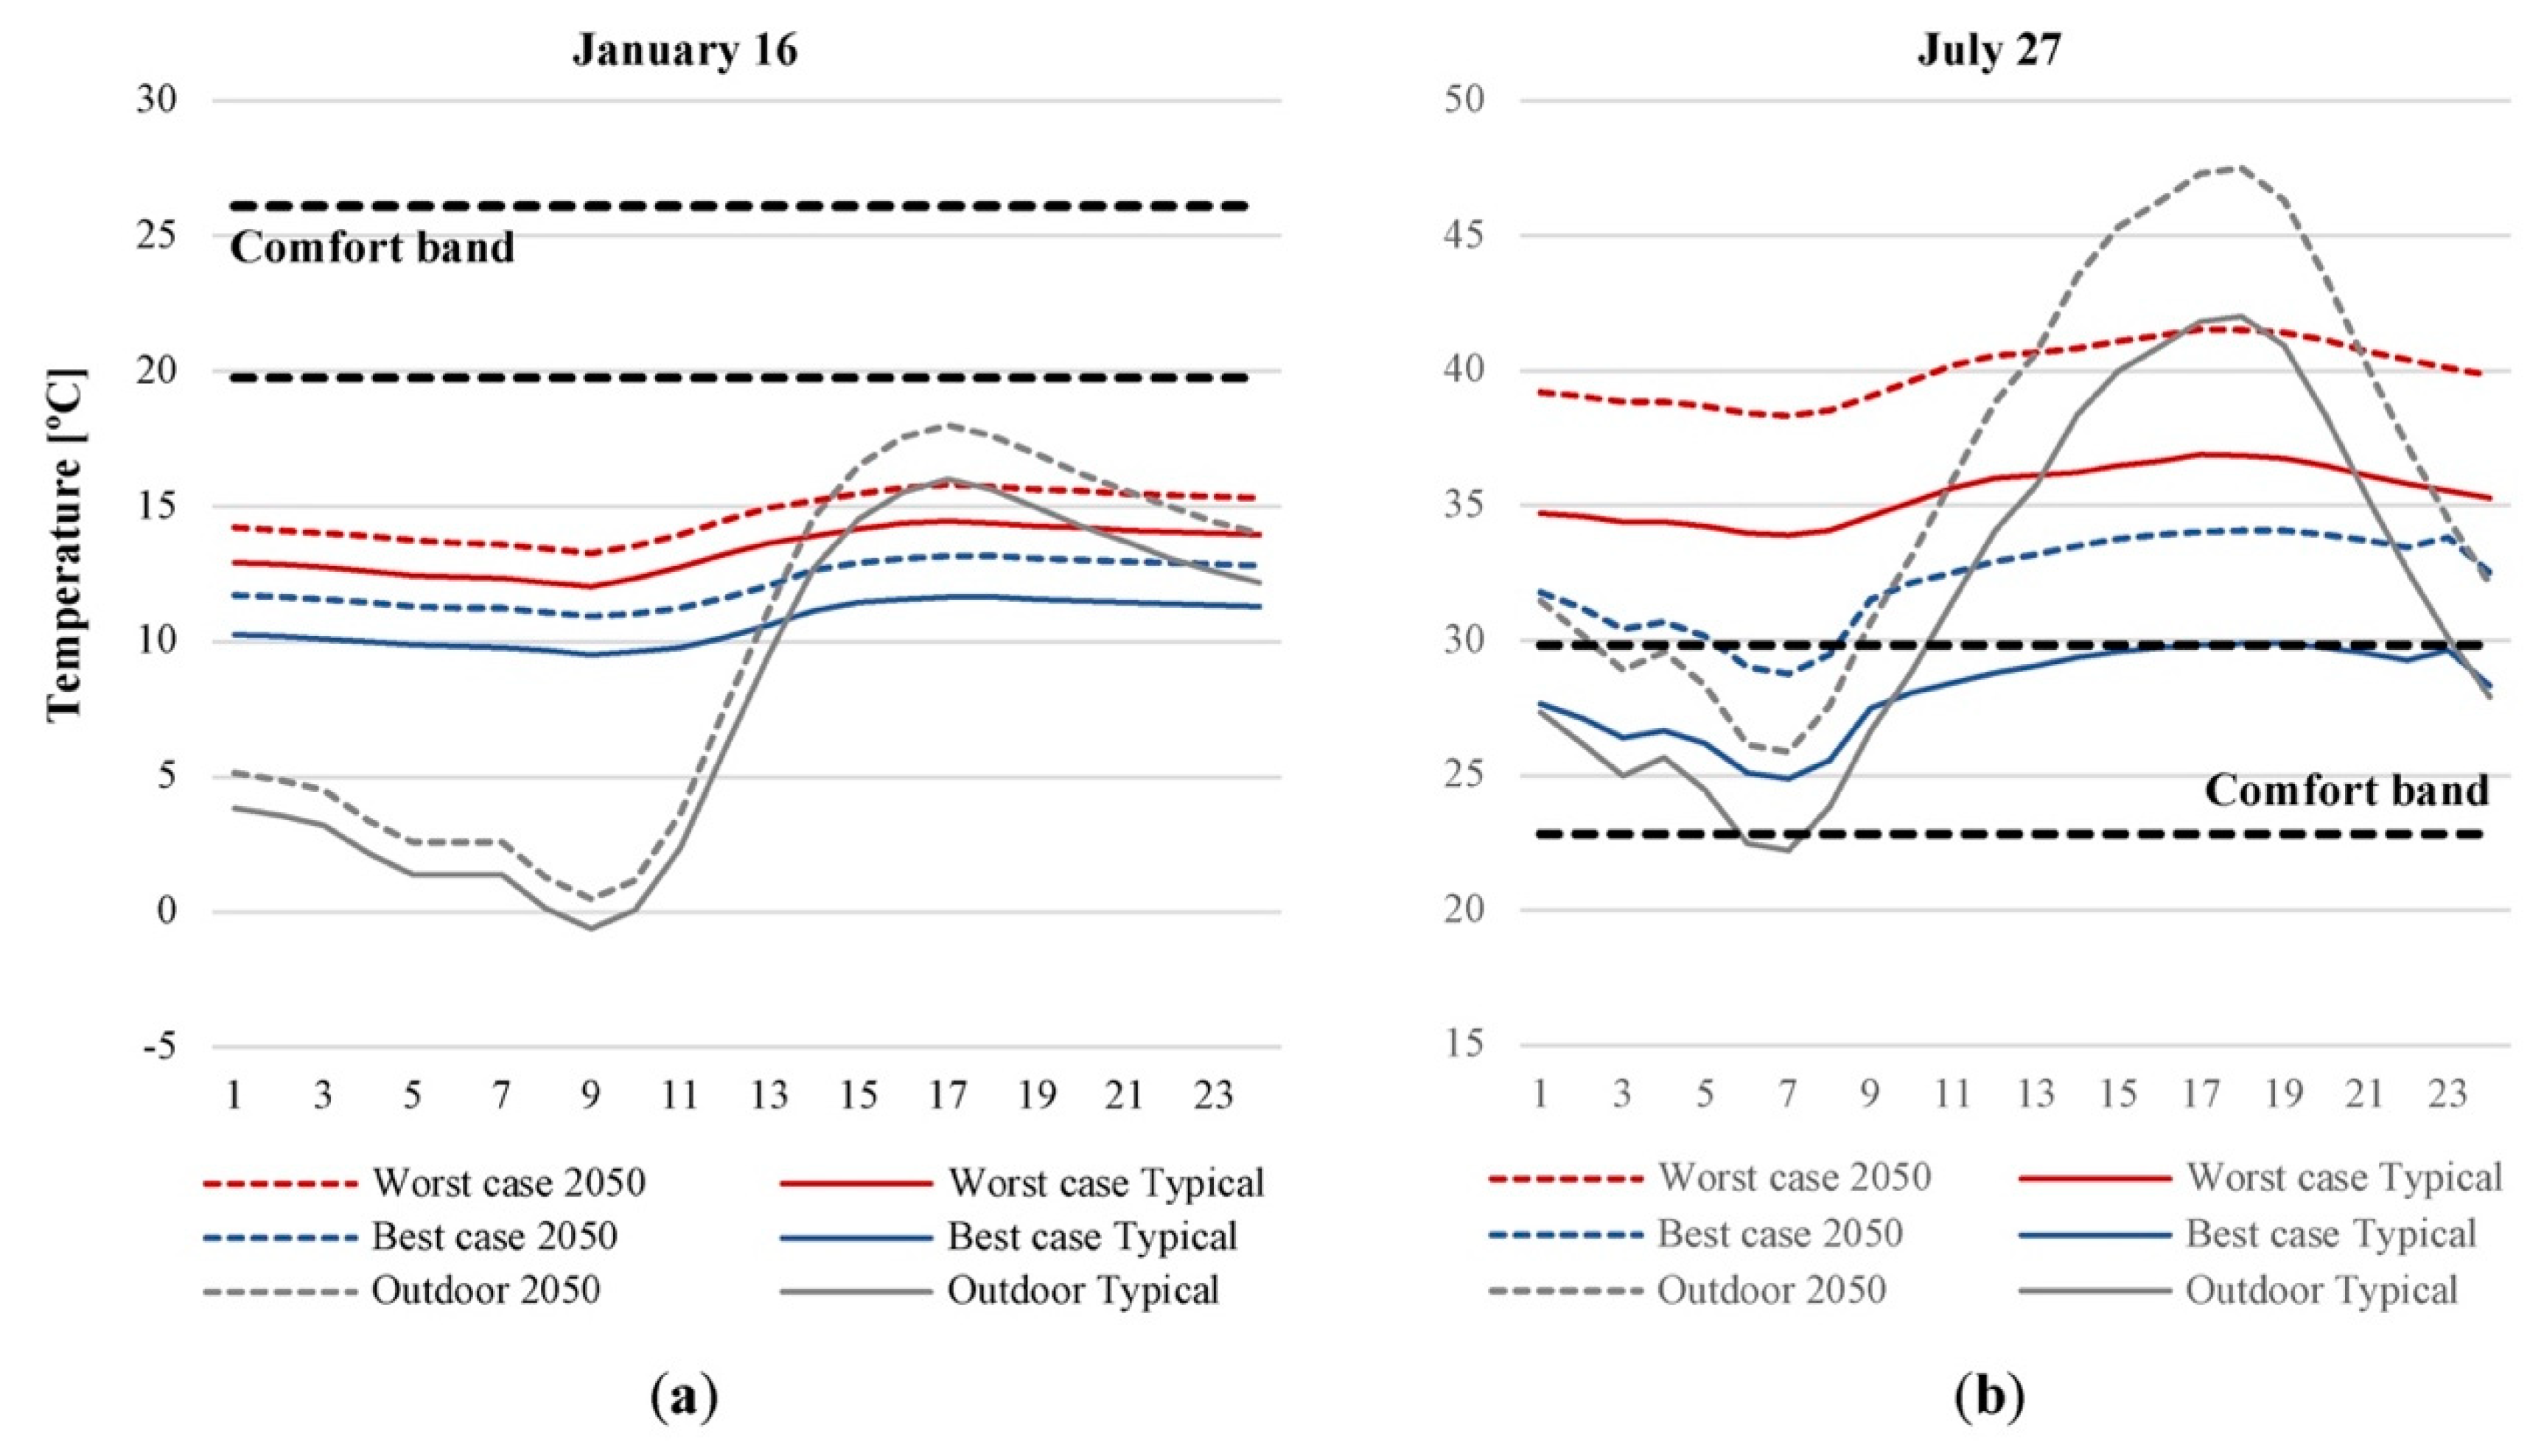
| Heating | 17 °C | 20 °C |
| Cooling | 27 °C | 25 °C |
| Title | Title | Typical Climatic Conditions | 2050 Climate Scenario |
|---|---|---|---|
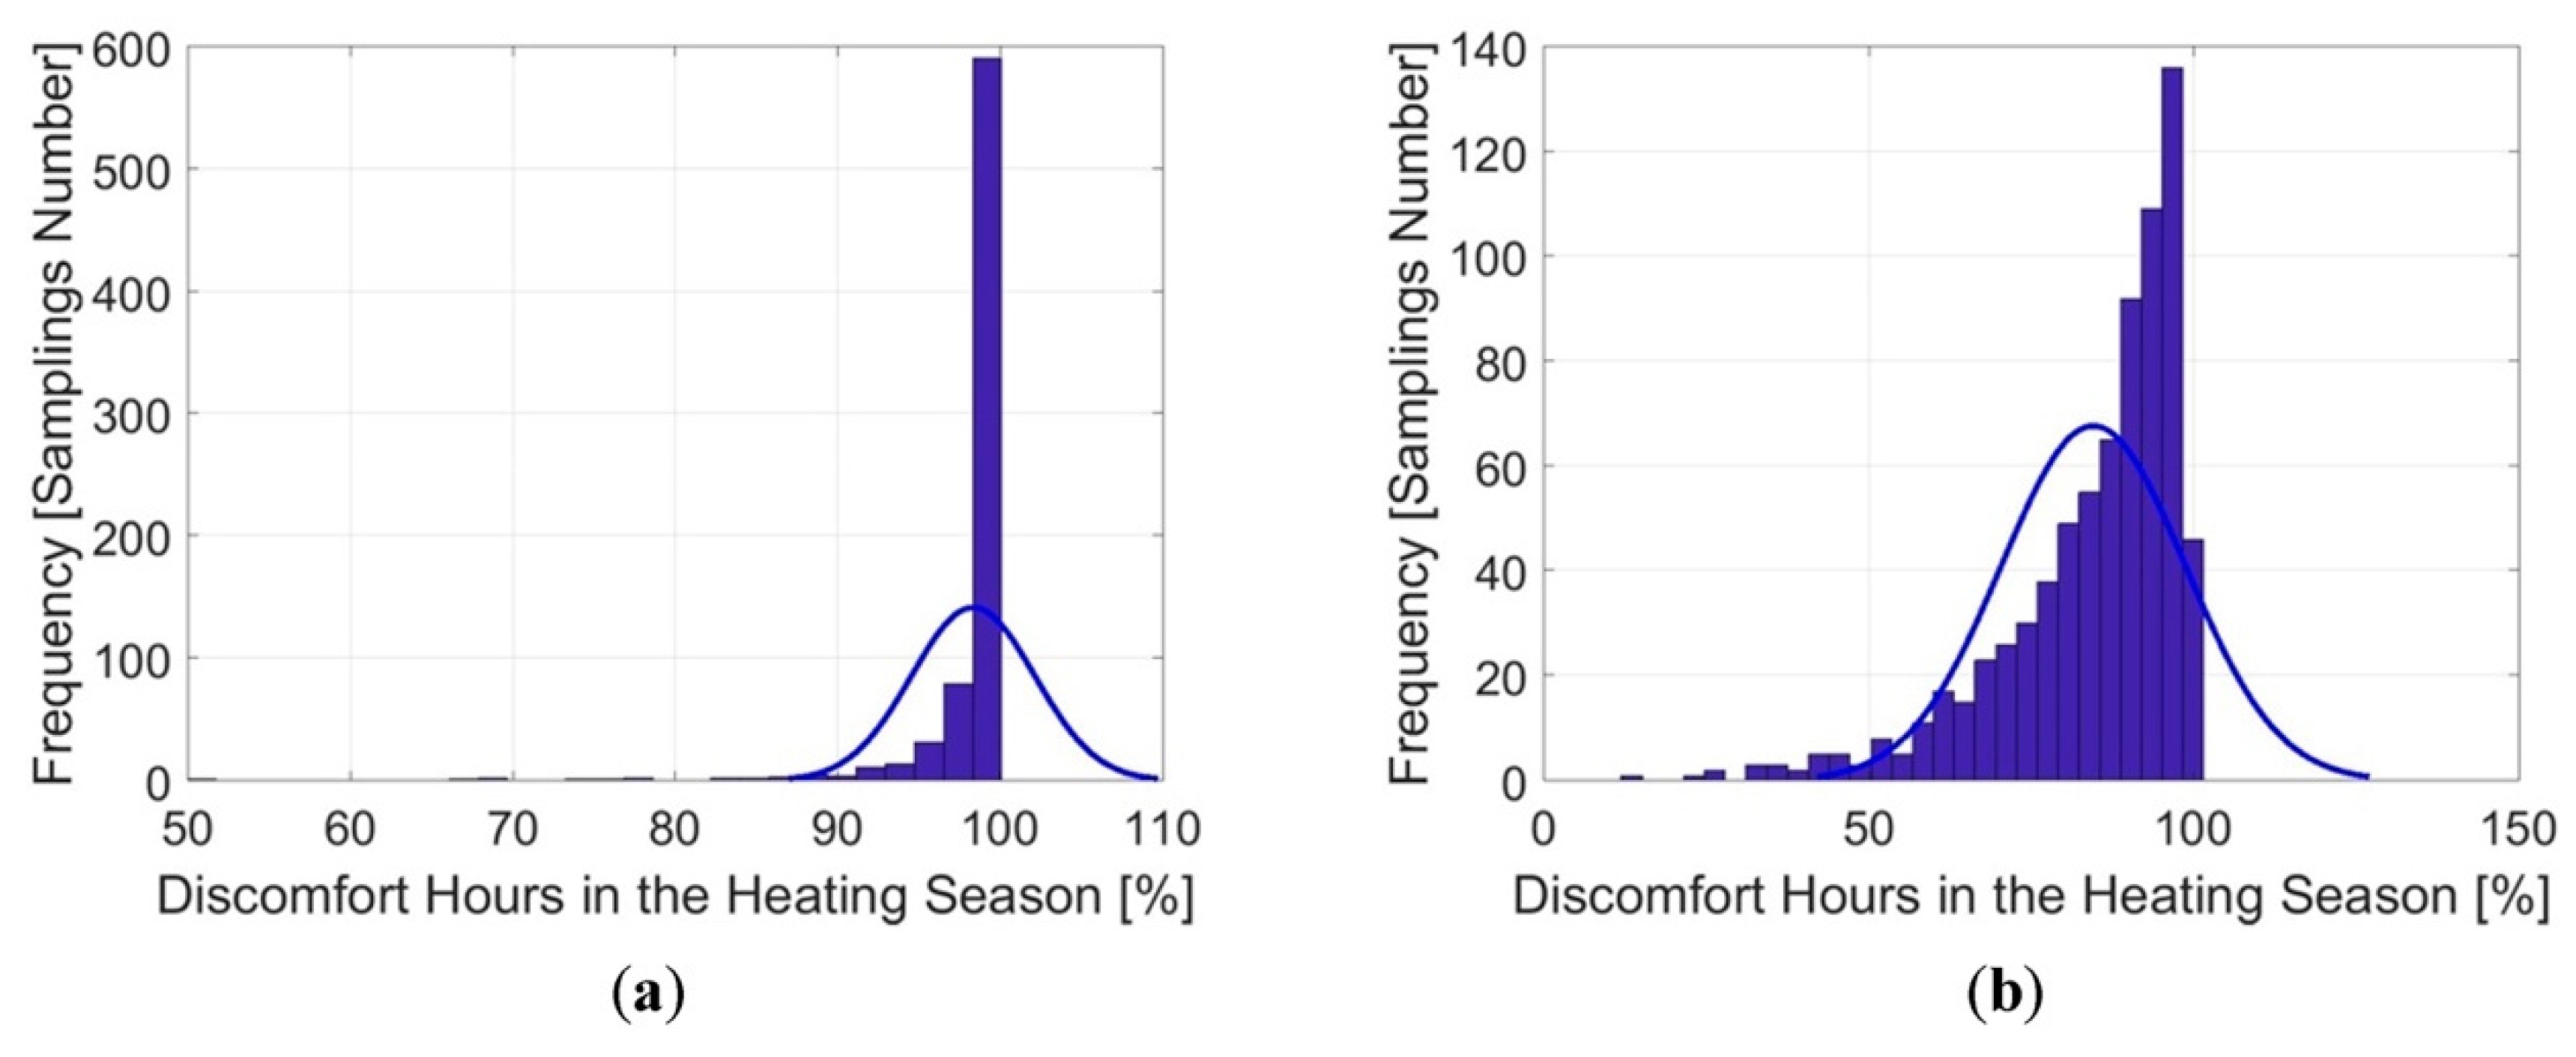
| DHh [%] | Average value | 98.3 | 84.6 |
| Maximum value | 100 | 100 | |
| Minimum value | 85 | 25 | |
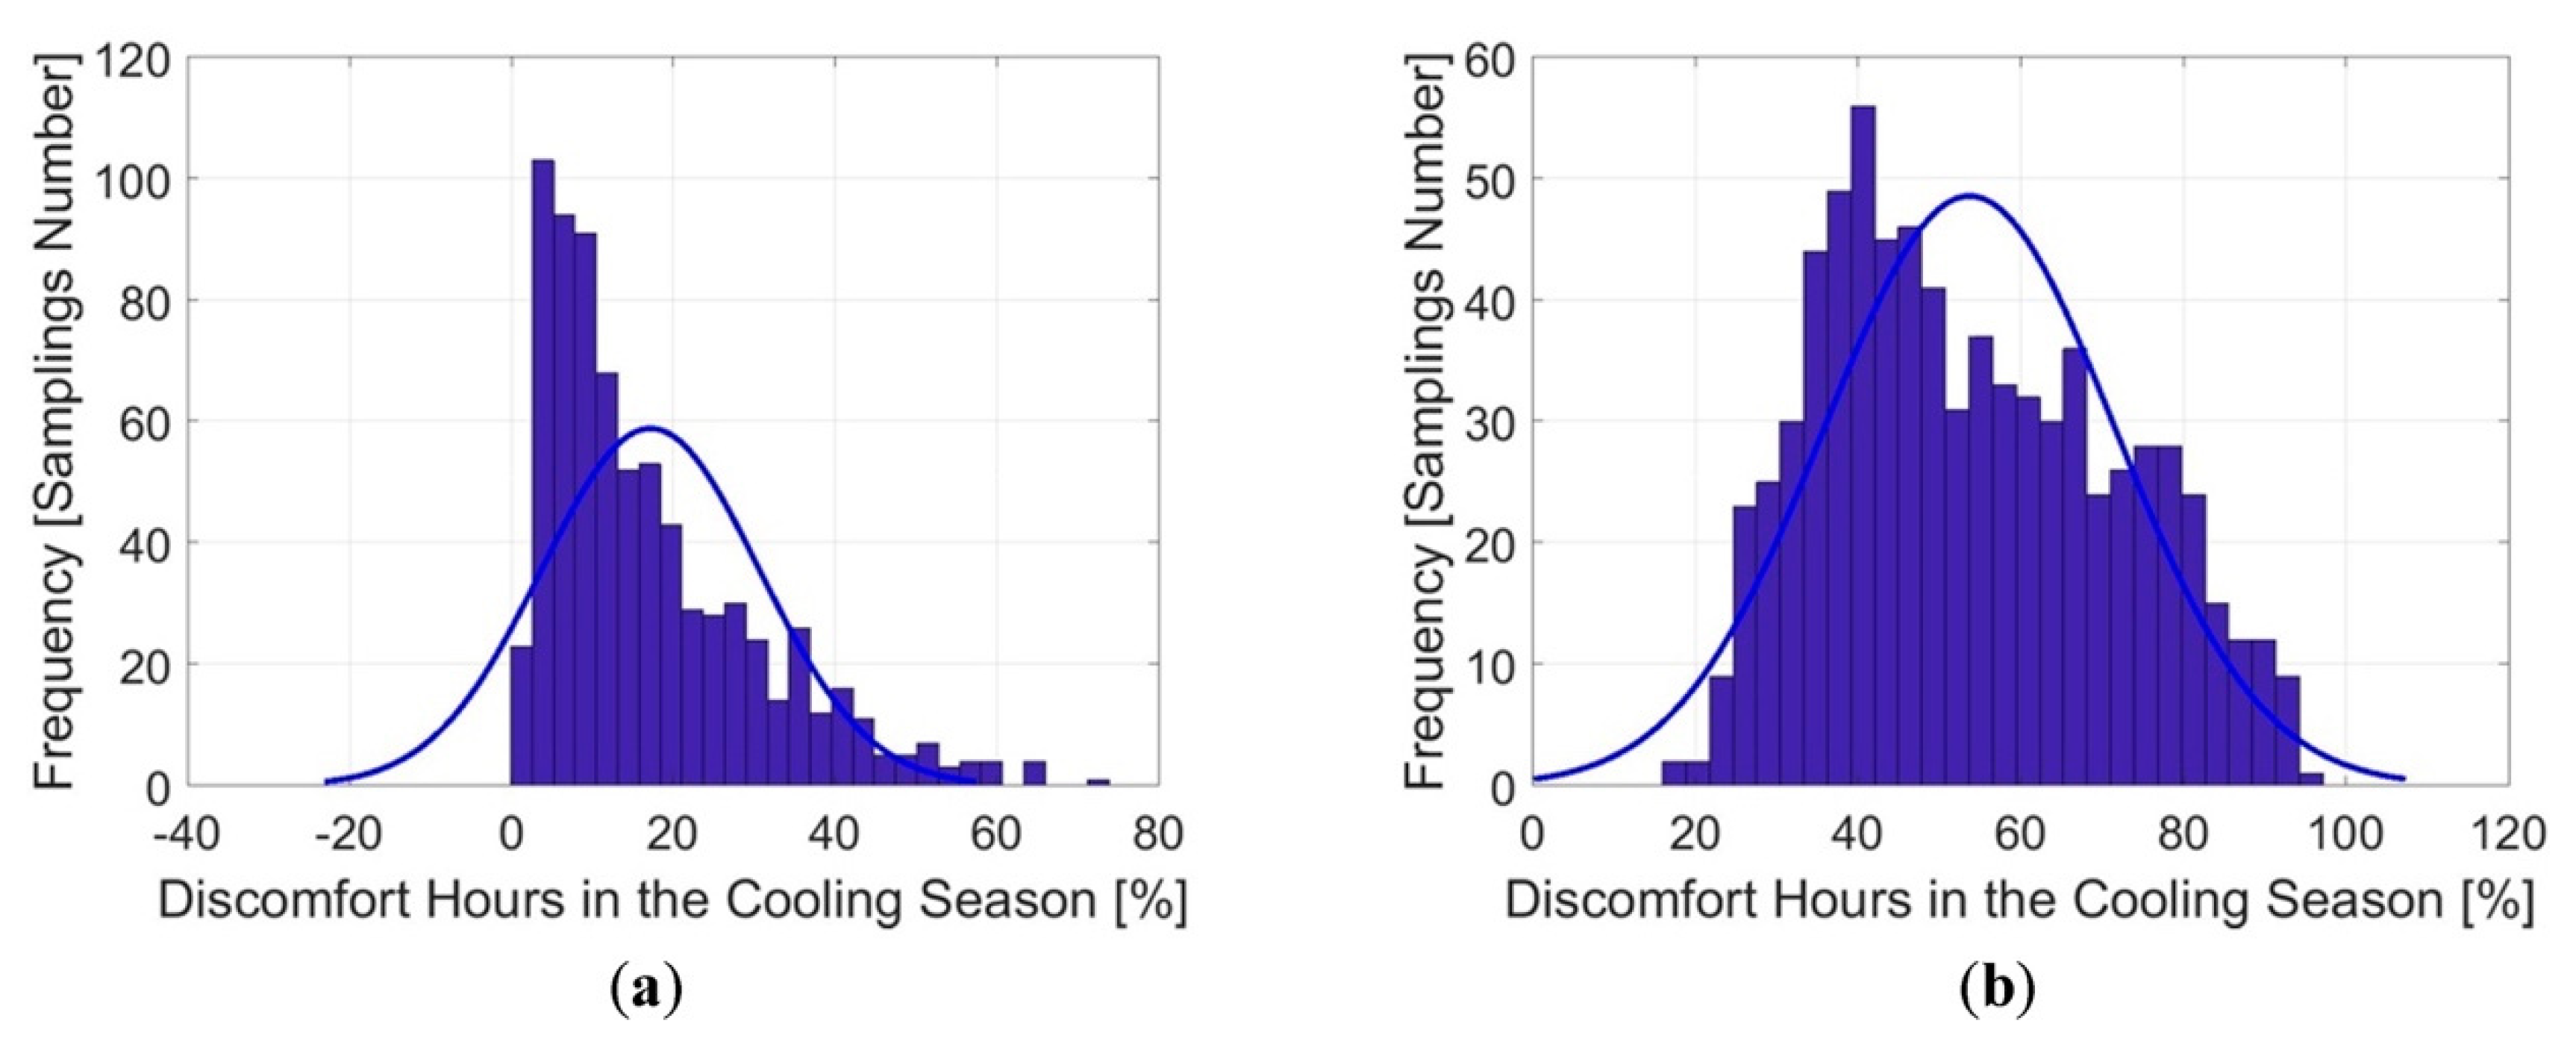
| DHc [%] | Average value | 17.2 | 53.8 |
| Maximum value | 74 | 97 | |
| Minimum value | 0 | 18 | |
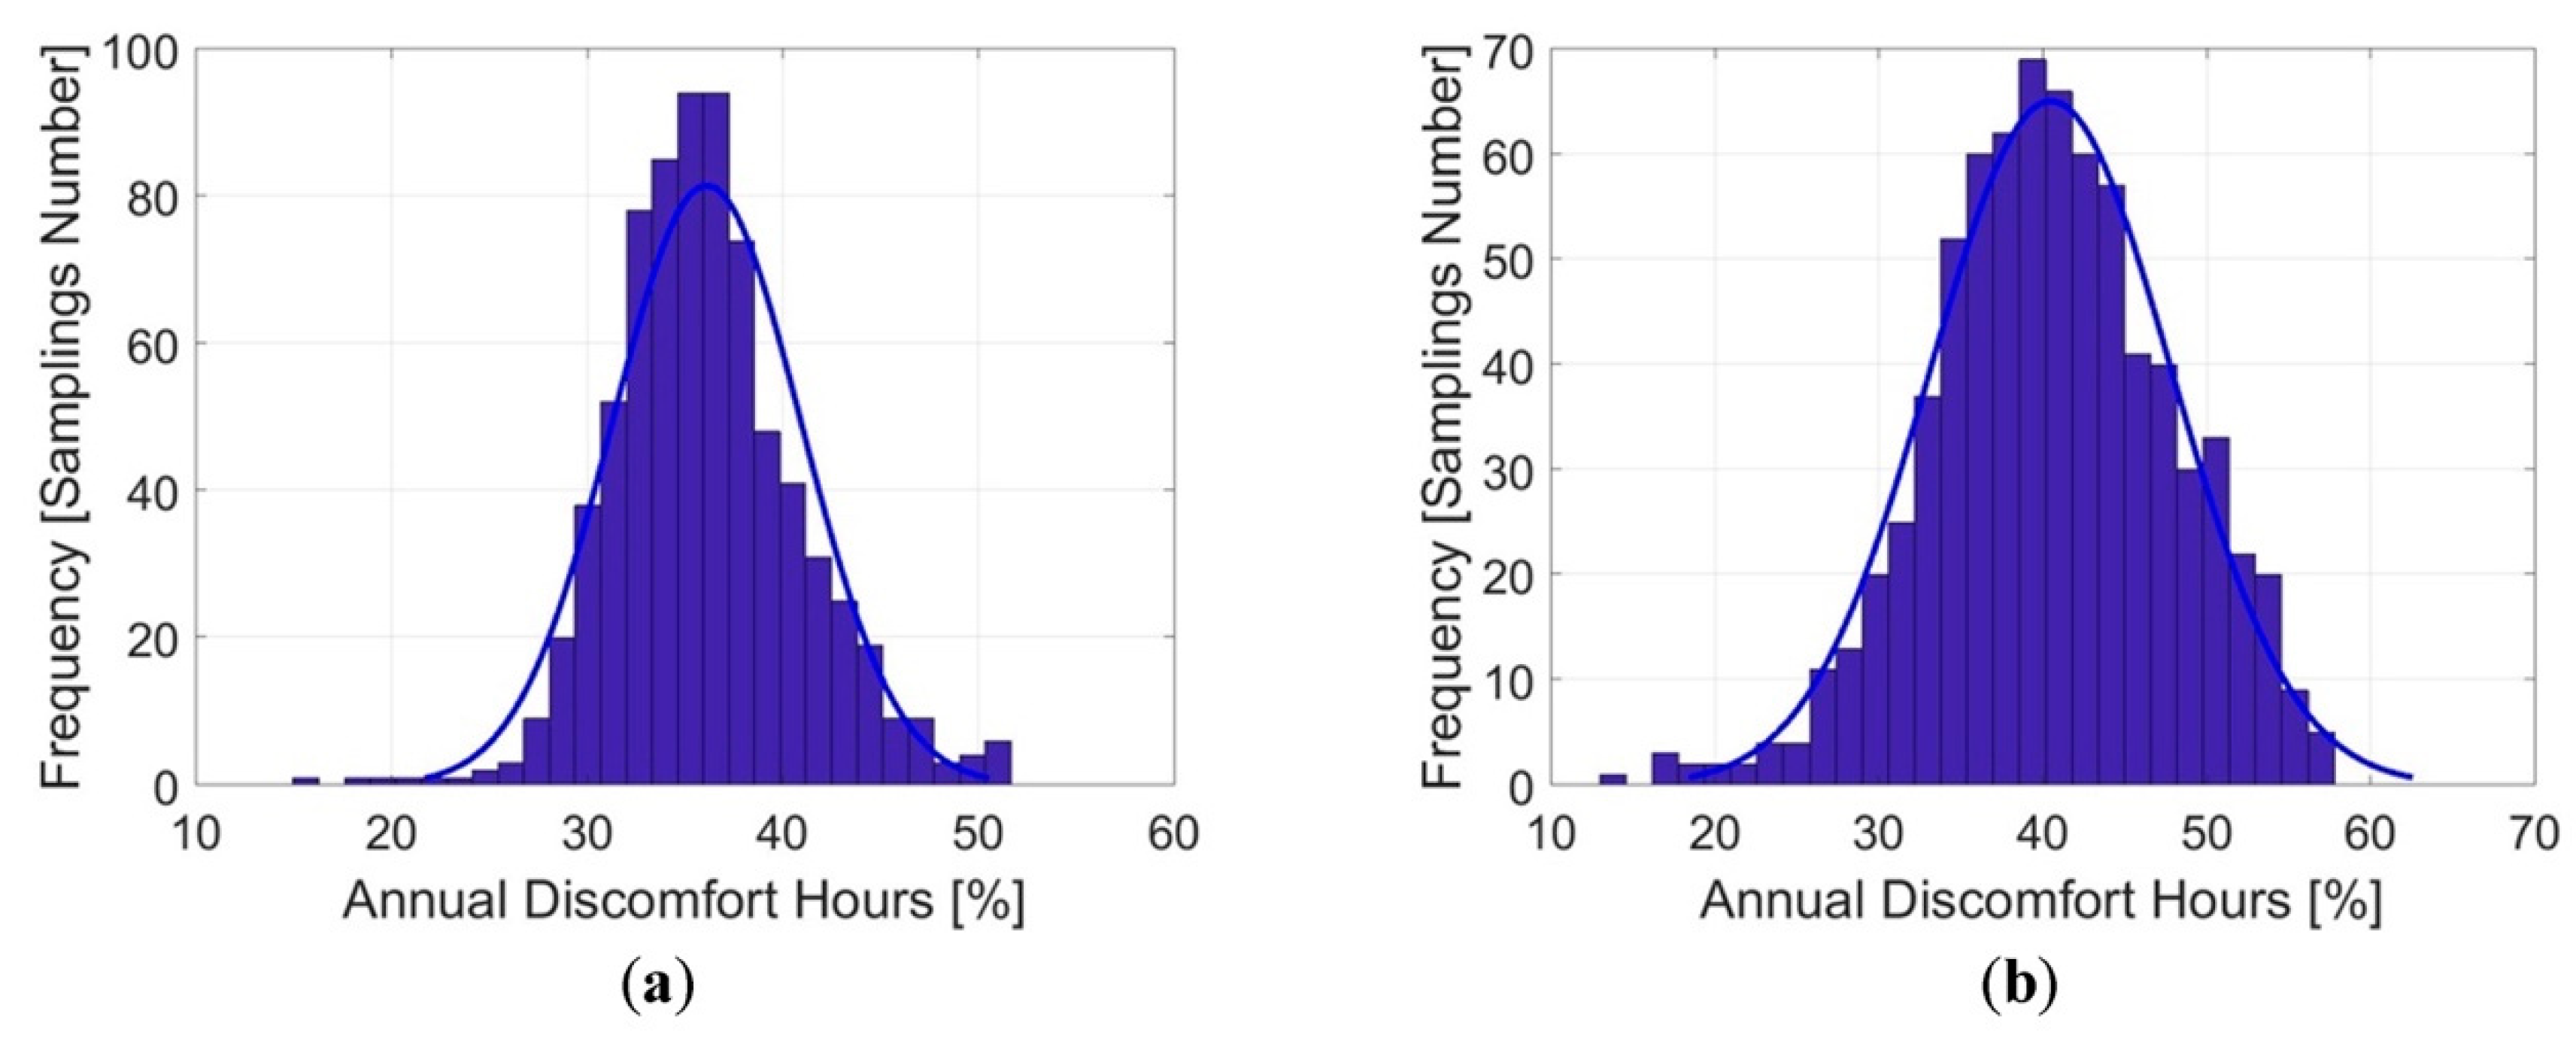
| DH [%] | Average value | 36.1 | 40.5 |
| Maximum value | 52 | 58 | |
| Minimum value | 20 | 15 |
| Significant Parameters | ‘Best Case’ | ‘Worst Case’ | Building Category | ||
|---|---|---|---|---|---|
| Geometry | P1 | Orientation (North Axis) | 0° | 90° | 0°–180° |
| P2 | Area of each floor [m2] | 273 | 114 | 90–300 | |
| P3 | Form ratio 1 | 2.4 | 2.1 | 1–5 | |
| P4 | Floor height [m] | 2.6 | 3.1 | 2.4–3.5 | |
| Envelope | P10 | Roof solar absorptance (a) | 0.3 | 0.4 | 0.1–0.9 |
| P11 | Façade solar absorptance (a) | 0.6 | 0.5 | 0.1–0.9 | |
| P20 | Façade thickness [m] | 0.24 | 0.27 | 0.10–0.35 | |
| P21 | Façade thermal conductivity [W/m K] | 0.25 | 0.30 | 0.19–0.46 | |
| Façade U value [W/m2 K] | 1.04 | 1.11 | 0.75–4.35 | ||
| P25 | Type of window glass | Double | Single | Single; Double | |
| Window U value [W/m2 K] | 3.10 | 5.00 | 2.80–5.70 | ||
| Operation | P27 | People density [people/m2] | 0.01 | 0.03 | 0.01–0.15 |
| P28 | Infiltration rate [h-1] | 0.6 | 0.5 | 0.3–1.0 | |
| P29 | Night-time natural ventilation rate [h-1] | 6 | 0 | 0; 2; 4; 6 | |
© 2019 by the authors. Licensee MDPI, Basel, Switzerland. This article is an open access article distributed under the terms and conditions of the Creative Commons Attribution (CC BY) license (http://creativecommons.org/licenses/by/4.0/).
Share and Cite
Escandón, R.; Suárez, R.; Sendra, J.J.; Ascione, F.; Bianco, N.; Mauro, G.M. Predicting the Impact of Climate Change on Thermal Comfort in A Building Category: The Case of Linear-type Social Housing Stock in Southern Spain. Energies 2019, 12, 2238. https://doi.org/10.3390/en12122238
Escandón R, Suárez R, Sendra JJ, Ascione F, Bianco N, Mauro GM. Predicting the Impact of Climate Change on Thermal Comfort in A Building Category: The Case of Linear-type Social Housing Stock in Southern Spain. Energies. 2019; 12(12):2238. https://doi.org/10.3390/en12122238
Chicago/Turabian StyleEscandón, Rocío, Rafael Suárez, Juan José Sendra, Fabrizio Ascione, Nicola Bianco, and Gerardo Maria Mauro. 2019. "Predicting the Impact of Climate Change on Thermal Comfort in A Building Category: The Case of Linear-type Social Housing Stock in Southern Spain" Energies 12, no. 12: 2238. https://doi.org/10.3390/en12122238
APA StyleEscandón, R., Suárez, R., Sendra, J. J., Ascione, F., Bianco, N., & Mauro, G. M. (2019). Predicting the Impact of Climate Change on Thermal Comfort in A Building Category: The Case of Linear-type Social Housing Stock in Southern Spain. Energies, 12(12), 2238. https://doi.org/10.3390/en12122238