Abstract
Based on the urban shantytown renovation project in Hongguang Town, Helan County, Ningxia, in Northwest China, the influence of fly ash and silica fume admixture on the mechanical properties of Self-compacting Concrete (SCC) was tested and analyzed in this work. The experimental tests including compressive strength, splitting strength, triaxial strength and an ultrasonic nondestructive test. Furthermore, the Back Propagation (BP) neural network algorithms were established. The results show that there is an obvious difference between the development law of compressive strength of SCC and that of ordinary concrete. The splitting pressure ratio of SCC is 1/10 to 1/8, while that of ordinary concrete is 1/13 to 1/10. Moreover, the peak strain, peak stress and initial stiffness of SCC increase with the increase of the confining pressure when compressed from three directions. In addition, the ultrasonic amplitude of SCC can reflect the changing laws of its compressive strength. As a conclusion, the addition of fly ash and silica fume increases the splitting pressure ratio of SCC. More importantly, the compressive strength formula for SCC with silica fume and a low content of fly ash is proposed, and the model equation between the amplitude and compressive strength is given. This study provides a reference for the mixture ratio of fly ash and silica fume in the application of SCC.
1. Introduction
As a major coal producer, China uses coal as its primary fuel for electricity production. During recent decades, the rapid development of the power industry has led to an increase in the total amount of fly ash, which is expected to reach 400 million tons by 2020 [1]. Fly ash and silica fume were once considered industrial wastes, which not only harm the environment but also cause secondary pollution such as land occupation [2]. Golewski considers that using fly ashes cement binder causes a lot of benefits—both from the point of view of ecology and sustainable construction [3]. With the in-depth research of reactive powder concrete (RPC), the RPC has been well-developed and has been promoted in different applications, such as municipal works, roads and bridges [3,4,5,6,7,8,9,10,11,12,13,14,15,16]. However, limited research on adding reactive powder to self-compacting concrete has been done. Self-compacting concrete refers to a kind of concrete with a high fluidity, uniformity and stability, which can flow under its deadweight and fill space without external vibration during pouring [17,18]. Compared with ordinary concrete, SCC has better properties in terms of realizing labor-saving concrete pouring to improve the quality and speed of construction, and in terms of upgrading the living environment of surrounding residents with reduced noises. Moreover, it also helps solve the steel tube vibration problem during construction [18,19,20]. Previous research [21,22,23,24,25] studied the effects of different amounts of steel fibers and polypropylene fibers on the mechanical properties of self-compacting reactive powder concrete. In particular, fewer examples of conventional triaxial testing on SCC mixed with fly ash and silica fume were reported. For instance, Farnam [26] studied the mechanical properties of 4 kinds of mortar-impregnated concrete specimens with varied steel fiber contents (0%, 2%, 5%, and 10%) under 4 sorts of confining pressures, and Giorgio proposed a micromorphic, non-linear 3D model [27]. In addition, the implementation of the national capacity-reduction policy and the clean utilization of coal make fly ash a prominent resource at present. Therefore, there is still large space for the research on SCC with fly ash and silica fume. Based on the urban shantytown renovation project in Hongguang Town, Ningxia, we used fly ash as an admixture for SCC in this work. There are many non-destructive methods used for analysing the concrete structure, such as the Digital Image Correlation (DIC) method [28] and the Ultrasound method. The amplitude was measured by ultrasonic wave, and the relationship between amplitude and compressive strength was established in this work. Furthermore, the relationship between the fly ash and silica fume content and the mechanical properties of SCC were studied in this work.
2. Materials and Mix Proportion
2.1. Materials
10 groups of C40 SCC were prepared with fly ash as the main parameter according to the Technical specification for application of self-compacting concrete. The materials that were used for concrete are as follows:
- Cement: P•O 42.5R Ordinary Portland Cement from Ningxia Horse Racing India Cements Limited. The performance of measured cement is shown in Table 1. Table 2 shows the chemical compositions of P•O 42.5R Ordinary Portland Cement.
 Table 1. Physical indexes of cement.
Table 2. Chemical composition of Cement.
Table 1. Physical indexes of cement.
Table 2. Chemical composition of Cement. - Fly ash: The Grade II fly ash was produced by Yinchuan Xixia Thermal Power Plant. Various performance tests of the fly ash are shown in Table 3. Table 4 shows the chemical compositions of Grade II fly ash.
Table 3. Physical indexes of fly ash.
Table 4. Chemical composition of fly ash.
- Silica fume: Local silica fume in Yinchuan was used, and its chemical composition and physical properties are shown in Table 5.
Table 5. Chemical composition and physical indexes of silica fume.
- Stone: Continuously graded Helan Mountain crushed stone in Yinchuan was adopted.
- Sand: Well graded local medium sand, with a fineness module 2.6, apparent density 2678 kg/m3, and bulk density 1680 kg/m3, was adopted.
- Water reducer: Polycarboxylic acid high-efficiency retarding water reducer with a water reducing rate of 30% was used, and its performance conforms to the provisions of GB8076-2008 Concrete Admixture. The chemical formula is shown in Figure 1.
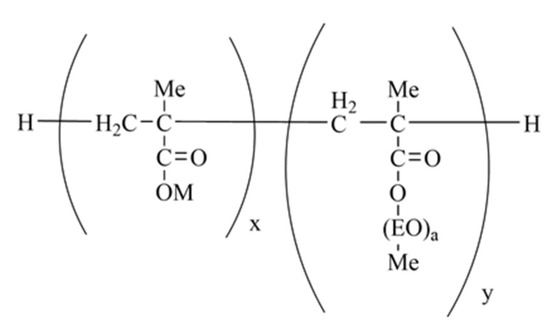 Figure 1. The molecular formula of polycarboxylic acid.
 - Water: Tap water.
2.2. Mix Proportion
Table 6.
Mix Proportion of Self-compacting Concrete (SCC) (kg/m3).
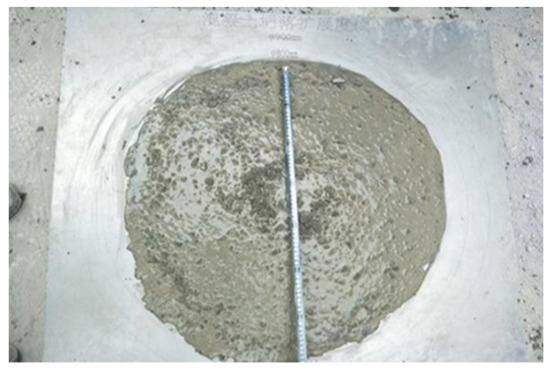
Figure 2.
The Extent of Self-compacting Concrete (SCC).
3. Results and Discussion
3.1. The Fluidity Analysis of SCC
As shown in Table 7, the fluidity of SCC shows a trend of increasing before decreasing with the increase of the fly ash content. The proposed main reasons could be: First, the activity of fly ash is low, and it is considered to be inert material in the early stage of hydration. Since the particle size of fly ash is smaller than that of cement, it can fill the space in cement, resulting in the release of more free water and achieving the effect of a water reduction. Second, with a high potential on the surface, fly ash can adsorb water reducer, generating a self-repulsion effect, which not only reduces the number of flocs, but also releases free water wrapped in the flocculation structure at the same time, thus improving the fluidity of slurry. Third, the fly ash plays a ball effect in the form of spherical glass with a smooth surface. Those spherical balls can be filled among cement particles, thus improving the fluidity of SCC [29]. However, when the content of fly ash reaches 40%, the fluidity of concrete decreases, which is mainly caused by the decrease of the filling water volume and the increase of water on the surface. As a consequence, the viscosity of the cement paste increased. This phenomenon can be illustrated by the Bingham fluid Equation (1) [30]:
where τ is the concrete shear stress Pa; τ0 is the yield shear stress Pa; ηp is the plastic viscosity coefficient Pa s; and is the shear deformation rate.
Table 7.
Performance indexes of self-compacting concrete.
According to rheological principle, only with a suitable viscosity can concrete obtain a better homogeneity, achieve a better flow speed and expansion degree. However, the fluidity of concrete will decrease with an exorbitant viscosity and yield stress [31]. Therefore, the fluidity of concrete is best when the content of fly ash is at 30%.
3.2. Compressive Strength Test of SCC
The test was completed on a 1000 kN Microcomputer controlled electro-hydraulic servo universal testing machine (SHT4106, Jinan, China). Ten different mix proportions were used in the test, including five double-adding ones with 4% silica fume and 0%, 10%, 20%, 30%, and 40% fly ash respectively in weight, and five single-adding ones with 0%, 10%, 20%, 30%, and 40% fly ash respectively. Each group had three test pieces with sizes of 100 mm × 100 mm × 100 mm, and the obtained compressive strength and growth rate are shown in Figure 3. According to the result, the 3d compressive strengths of the double-adding and single-adding SCC test pieces are weaker than that of normal concrete (FSCC0) in a standard curing condition. The 7d compressive strength of the double-adding concrete exceeded that of the normal concrete in a standard curing condition. When the content of fly ash reached 30%, the compressive strength of the concrete increased the most, rising to 55.58 MPa. Generally, the strength of SCC increased first and then decreased with an increasing fly ash content. Owing to the relatively low strength of fly ash and the slow pozzolanic reaction rate in the early stage, its secondary reaction lagged behind that of cement and silica fume, resulting in a slower concrete setting. Due to the great pozzolanic activity of the amorphous SiO2, the addition of silica fume significantly improved the strength of SCC. On the one hand, the pozzolanic reaction made the cementitious phase of C–S–H grow rapidly, improving the strength of cement-based materials; on the other hand, the silica fume promoted the conversion of CH crystals into C–S–H gels. The obtained structure of cement stone were filled with gels, and the unreacted CH layered crystals grew alternately among the C–S–H gels. The chemical filling significantly improved the compactness of the cement stone structure, thus improving the mechanical properties of the cement-based materials. That is:
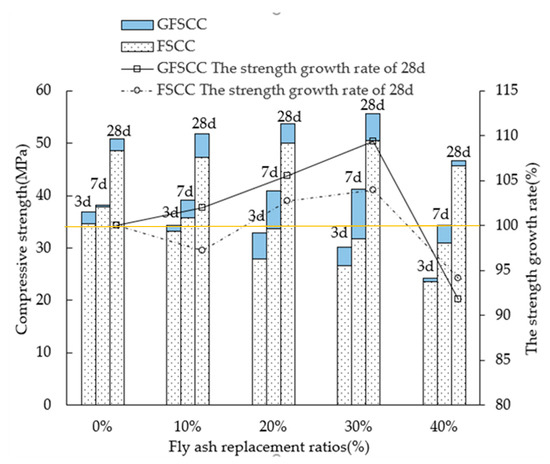
Figure 3.
Compressive strength and growth rate of SCC.
As shown in Figure 3, the strength of SCC mixed with the mineral additions of 7d and 28d is different from the ordinary concrete, which decreases with the addition of fly ash. The strength of SCC reaches the maximum and exhibits the best performance when the fly ash content of SCC is 30%. With the increase of the fly ash content, the performance of SCC is not obviously improved, indicating that excessive fly ash will lead to a reduction of the SCC strength. In Figure 4, MATLAB was used to fit the strength formula of double-adding silica fume-fly ash at different ages.
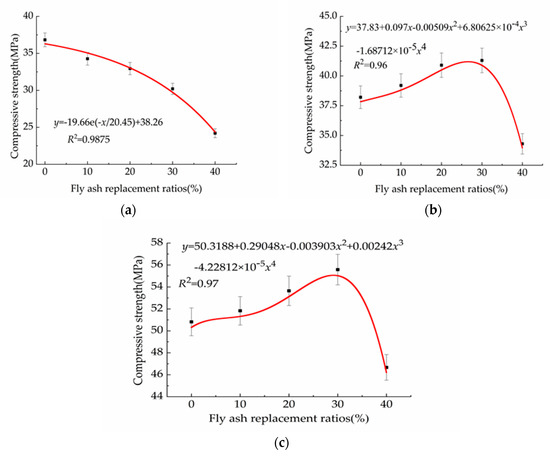
Figure 4.
(a) Compressive strength fitting equation of 3d; (b) Compressive strength fitting equation of 7d; and (c) Compressive strength fitting equation of 28d.
Figure 4a is compressive strength fitting equation of 3d. Figure 4b is compressive strength fitting equation of 7d. The compressive strength of 28d SCC in Figure 4c was predicted by BP neural network algorithms. The nonlinear relationship between the age and compressive strength was described by a two-layer BP network structure, as shown in Figure 5. As shown in Figure 5, the substitution rate of the fly ash and cement quantity are set as X, which is the input value of the variable BP neural network algorithms, and the 28d strength is set as the output T of the network. The calculated and predicted values were shown in Table 8. All of the obtained error values are under 5%, indicating that the formula can describe the compressive strength of 28d SCC well.
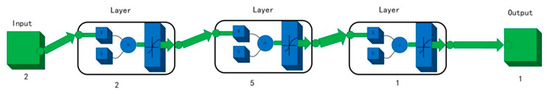
Figure 5.
Structural diagram of the BP neural network.
Table 8.
Forecast results.
Due to the unique development of the compressive strength of SCC, the regular formula of the ordinary concrete strength with age development fn = f28lgn/lg28 is no longer applicable. The development law of the compressive strength formula proposed by the European Code is:
where t1 refers to 1 day; S refers to the type constant of cement, 0.2 for early strength cement, 0.25 for ordinary cement, and 0.38 for slow hard cement; fcu, 28 refers to the compressive strength of 28d concrete.
According to the results of the compressive strength test, the preliminary compression map of the compressive strength of SCC was first illustrated based on the improved formula of the European code. The result is shown in Figure 6.
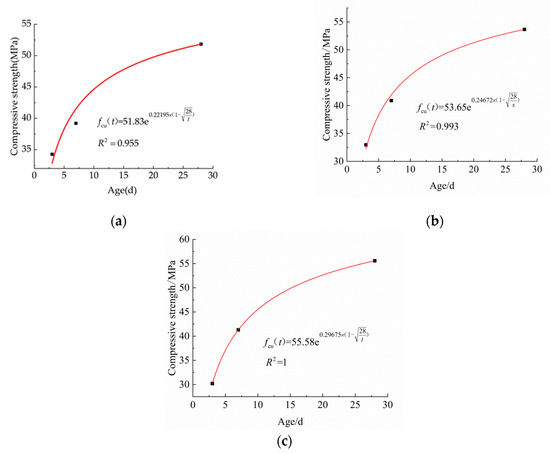
Figure 6.
These are the modified formulas of the compressive strength of SCC with the low fly ash and silica fume content. (a) Fitting formula with a fly ash replacement rate of 10%; (b) Fitting formula with a fly ash replacement rate of 20%; and (c) Fitting formula with a fly ash replacement rate of 30%.
From the regression curve in Figure 6, the regression coefficient a in the SCC with a low content of fly ash and silica fume has a certain relationship with its compressive strength. Figure 7 shows the regression analysis carried out by using the data in Table 9.
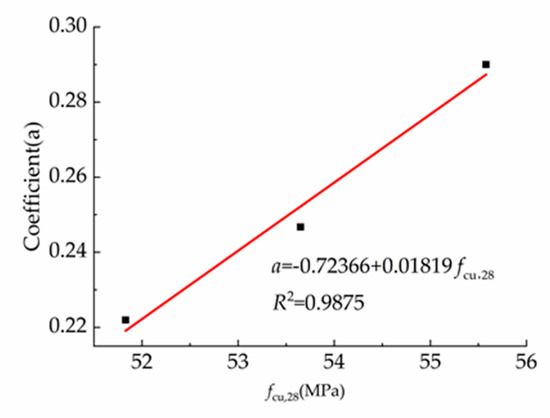
Figure 7.
The relationship between the compressive strength and coefficient a.
Table 9.
Relationship between the coefficient a and the compressive strength.
As a result, Equation (5) was obtained from Figure 7:
a = −0.7233 + 0.01819 fcu,28
Substituting Equation (5) into Equation (4), the equation for calculating the compressive strength with the age of SCC containing silica fume and fly ash was obtained as below:
3.3. Splitting Tensile Strength Analysis of SCC
The test was completed on a 1000 kN Microcomputer controlled electro-hydraulic servo universal testing machine (SHT4106, Jinan, China). As shown in Figure 8, the splitting tensile strength, growth rate, and the changing trend of the splitting tensile strength are similar to its compressive strength property, as discussed above.
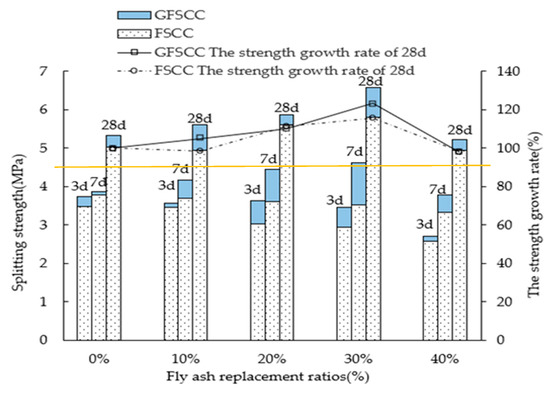
Figure 8.
The strength and growth rate.
Since the compressive strength is usually used as the most basic strength index value, the relationship between the splitting tensile strength and compressive strength also attracts attention. At present, the commonly used formula for the splitting tensile strength of ordinary concrete in China is as follows (7):
The relationship between the splitting tensile strength and compressive strength of SCC is shown in Figure 9.
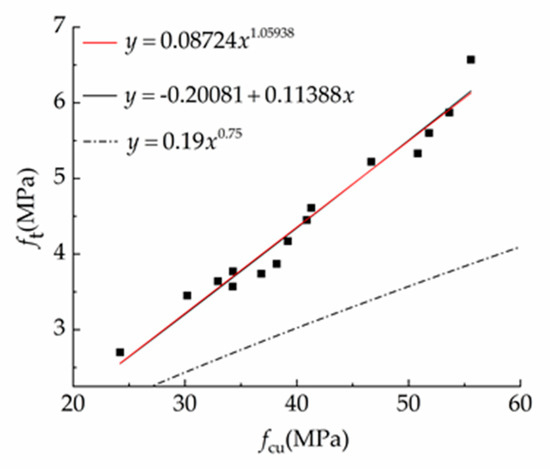
Figure 9.
The relationship between the splitting strength and compressive strength of SCC.
The experimental data was regressed according to the linear function and the power function respectively.
The linear function and power function have good statistical results. Equations (8) and (9) are recommended for SCC to predict its splitting tensile strength at different ages in order to guide the production and construction of SCC.
The splitting pressure ratio is the ratio of the splitting tensile strength to the compressive strength. As shown in Table 10, the splitting tensile strength of SCC increases with the increase of its compressive strength. The splitting pressure ratio of SCC is 1/8–1/10, while that of ordinary concrete is about 1/10–1/13. Therefore, the splitting tensile strength of SCC is higher than that of ordinary concrete. The reason for this is that a mineral admixture is added into SCC, and the adhesion between the section of cement stone and hydrated calcium silicate is enhanced after the vitreous hydration.
Table 10.
The splitting pressure ratio.
3.4. Routine Triaxial Test of SCC
In order to analyze the ductility of SCC, triaxial tests were carried out. The test was completed on a rock triaxial (creep) tester (YY-RBSZ-1000, Jiangsu, China), as shown in Figure 10. Each group had three test pieces with sizes of φ50 mm × 100 mm. The actual stress in the pressure chamber is formed by the superposition of the stress difference q exerted by the plunger and the confining pressure p. Suppose the load measured by the load sensor is F and the section area of the sample is A, the stress difference is q = F/A. The axial compressive stress on the sample is recorded as σ1, and the two lateral pressures as σ2 and σ3, respectively. The test loading path is shown in Figure 11, and the test can be divided into 5 stages:
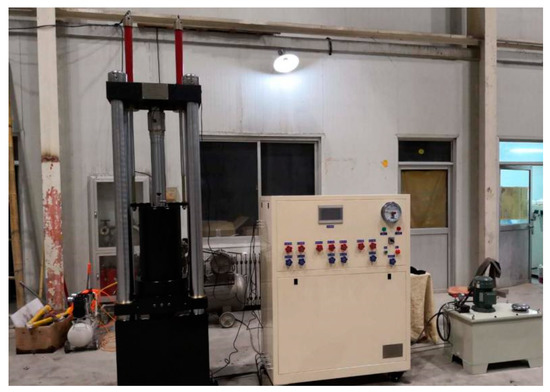
Figure 10.
Rock triaxial (creep) tester.
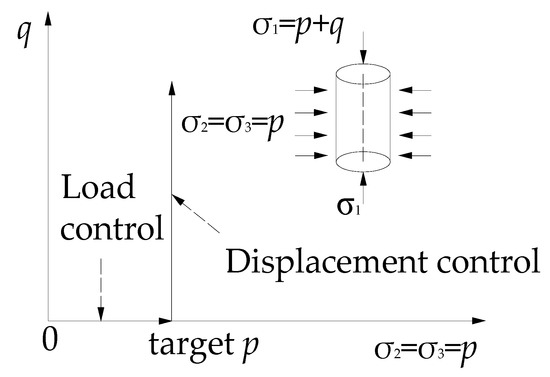
Figure 11.
Test loading path.
- (1)
- In the preloading stage, the loading table is manually controlled to apply a load of about 0.5 MPa on the pressure chamber to adjust the angle between the upper and lower pressure heads.
- (2)
- In the stage of increasing the confining pressure, the confining pressure is increased to the design value at a speed of 0.1 MPa/s.
- (3)
- Keep the confining pressure unchanged until the deformation is stable. The purpose is to release the viscoplastic deformation between the heat shrinkable tube and the test piece, to prevent the inclusion of this deformation into the later measurement results.
- (4)
- Keep the confining pressure stable and then apply an axial compressive with a loading displacement rate of 0.002 mm/s, and a sampling frequency of 3 Hz.
- (5)
- The unloading starts after the curve has a descending section.
In the test, the confining pressure values are 0, 5, 10 and 15 MPa, respectively.
3.4.1. Failure Mode Test of SCC
The test shows that the failure mode of the specimen is related to the confining pressure value. As shown in Figure 12, under uniaxial compression (σ2 = σ3 = 0), a vertical crack parallel to the loading direction appears in the middle of the specimen. With the increasing of the loading, one or several main cracks penetrated and destroyed the specimen. When the confining pressure values are changed to σ2 = σ3 = 5 MPa and σ2 = σ3 = 10 MPa, the initial crack is no longer a vertical crack but an inclined one at 25 degrees to the vertical loading direction, and the failure surface is mainly the shear failure of the cement mortar. When the confining pressure value is σ2 = σ3 = 15 MPa, the middle part of the specimen slightly bulged, and the oblique cracks penetrated through the whole specimen with an oblique crack angle of about 45 degrees. The coarse aggregate on the shear flour was sheared, and the crushed cement mortar powder was found on the failure surface.
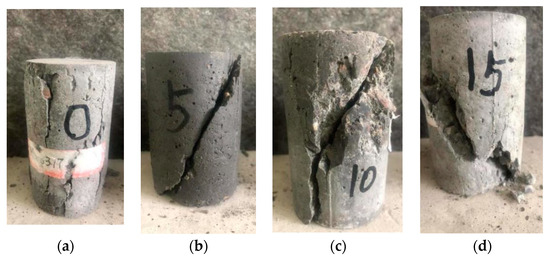
Figure 12.
(a) σ2 = σ3 = 0 MPa; (b) σ2 = σ3 = 5 MPa; (c) σ2 = σ3 = 10 MPa; and (d) σ2 = σ3 = 15 MPa.
Figure 13 shows the full-scale curve of the stress-strain curve for a fly ash replacement rate of 30% and a silica fume replacement rate of 4%. It can be seen from the figure that under the triaxial load, the stress-strain curve of SCC changes significantly with the different confining pressure values: when the confining pressure value is σ2 = σ3 = 0, the peak strain, peak stress and initial stiffness of the SCC stress-strain curve are all smaller than those of the specimens under the triaxial compression, and the curve drops steeply after reaching the peak stress. While the confining pressure value is above 0, the peak strain, peak stress and initial stiffness of the specimen increase with the increasing of the confining pressure value, and the curve decreases gently after reaching the peak stress, exhibiting a good ductility.
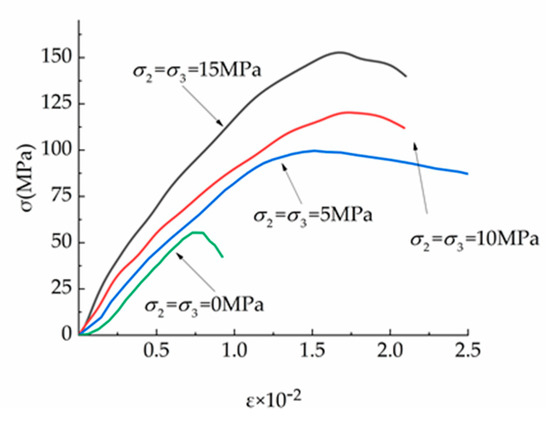
Figure 13.
Stress-strain curve of SCC.
3.4.2. Compressive Strength Criteria
The Mohr-Coulomb compressive strength criterion is used to describe the compressive strength law of the SCC samples.
The Mohr-Coulomb criterion can be expressed as:
In this formula, represents the uniaxial compressive strength; represents the triaxial compressive strength, and the K value of ordinary concrete with different strengths is obtained through previous research [32]; it ranges from 2.6 to 5.3. The K value of SCC is 6.23, which is different from that of ordinary concrete, and the revised Mohr-Coulomb criterion is shown in Figure 14.
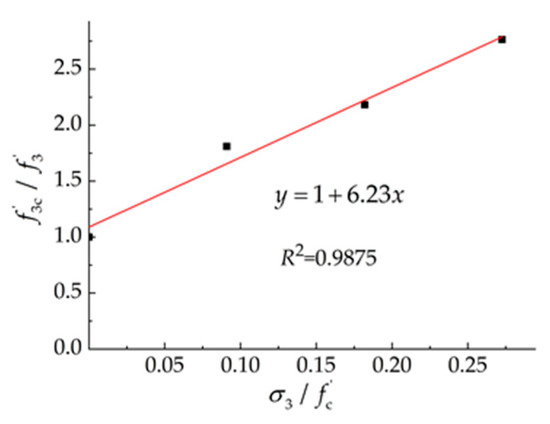
Figure 14.
Mohr-Coulomb criterion.
3.5. Ultrasonic Testing
The ultrasonic test of concrete was carried out on a NM-4A nonmetallic ultrasonic testing analyzer that was manufactured by a Concrete Company in Beijing. Five measuring points are arranged on each side during the ultrasonic test, as shown in Figure 15. During the detection, the coupling agent should be evenly coated on the probe, and the probe should be centered on the measuring point. In addition, the transmitting and receiving transducers need to be kept on the same line, and the measuring points of the test block should take the average value of 10 groups. The spectrum-amplitude diagram obtained by performing a Fast Fourier Transform is based on the measured sound wave which is shown in Figure 16. It can be seen from the spectrogram that, as the SCC intensity increases, the obtained amplitude conversion is higher. As a result, the relationship between the intensity and amplitude was obtained, providing reliable guidance for engineering applications. The fitting curve is shown in Figure 17.
y = −104.1135 + 4.1639x R2 = 0.94
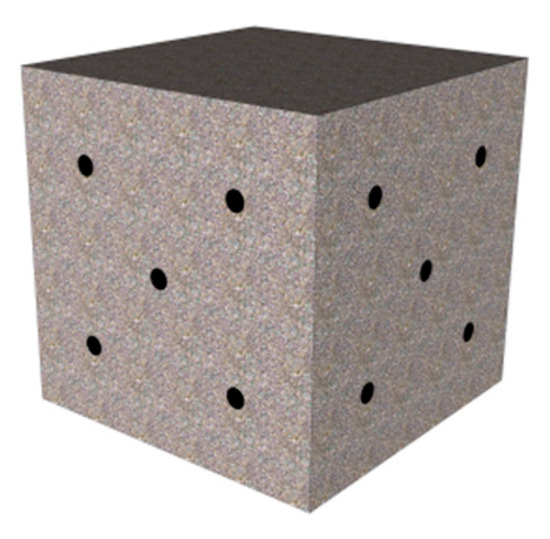
Figure 15.
Measuring points.
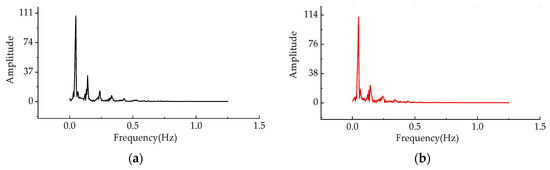
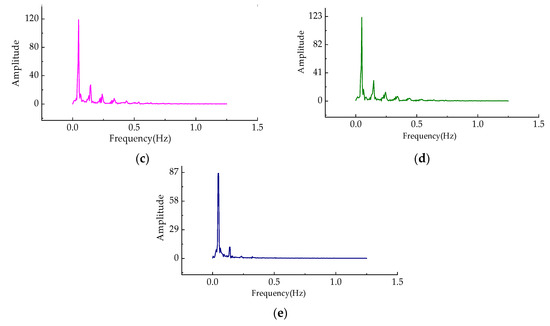
Figure 16.
The diagram of GFSCC. (a) The spectrum-amplitude diagram of GFSCC0; (b) The spectrum-amplitude diagram of GFSCC10; (c) The spectrum-amplitude diagram of GFSCC20; (d) The spectrum-amplitude diagram of GFSCC30; and (e) The spectrum-amplitude diagram of GFSCC40.
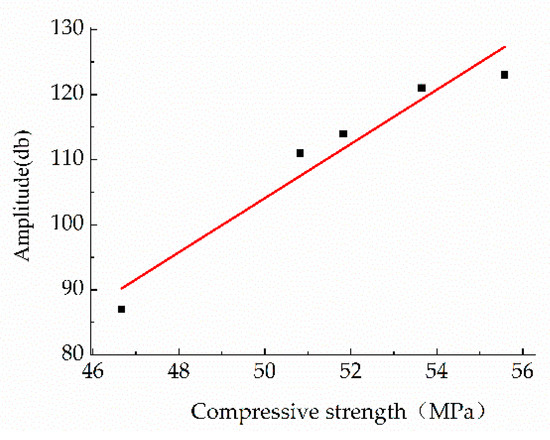
Figure 17.
The fitting curve between the intensity and amplitude.
4. Conclusions
In this work, the compressive strength, splitting strength, triaxial compressive strength and ultrasonic nondestructive testing of SCC were tested, respectively. From the obtained results, the conclusions can be summarized as follows:
- (1)
- The fluidity of double-adding SCC with silica fume and fly ash is better than that of single-adding with fly ash, and the optimal doping amount is 4% of silica fume and 30% of fly ash.
- (2)
- The development law of the compressive strength of SCC is different from that of ordinary concrete. The compressive strength formula of SCC applicable for double-adding with silica fume and a low content of fly ash is given in this paper.
- (3)
- The ratio of the splitting tensile strength to the cube compressive strength of SCC is about 1/8–1/10, while that of ordinary concrete is about 1/10–1/13, indicating that SCC has a higher splitting tensile strength than ordinary concrete.
- (4)
- Based on the test data, the failure criterion of Mohr-Coulomb, applicable for SCC with silica fume and fly ash, is given.
- (5)
- The amplitude of an ultrasonic wave can reflect the strength of concrete. The model equation between the amplitude and the compressive strength is established in this work.
Author Contributions
H.L. and H.S. incepted the original idea and designed the experiment. J.T. analyzed the date. Q.Y.wrote the paper. Q.W. revised the paper.
Funding
This research was supported in part by Major (key) project of key research and development plan in Ningxia Hui Autonomous Region (2018BEG02009), The Funding Project of First-Class Discipline Construction of University in Ningxia (Domestic First-Class Discipline Construction) under Grant NXYLXK2017A03, The “Yangtze River Scholars and Innovation Team Development Program” Innovation Team of the Ministry of Education funded the project (IRT1067), Ningxia University Funded Project (NGY2018051) and Ningxia Hui Autonomous Region Special Funding Project for Foreign Science and Technology Cooperation (2018BFH03002) and Ningxia University Postgraduate Innovation Project Funding Scheme.
Conflicts of Interest
The authors declare no conflict of interest.
References
- Liu, X.; Wang, H.; Liu, L. Development and utilization of fly ash resources. Inorg. Chem. Ind. 2018, 50, 12–14. [Google Scholar]
- Misra, A. Stabilization characteristics of clays using class C fly ash. Transp. Res. Rec. J. Transp. Res. Board 1998, 1611, 46–54. [Google Scholar] [CrossRef]
- Golewski, G.L. The influence of microcrack width on the mechanical parameters in concrete with the addition of fly ash: Consideration of technological and ecological benefits. Constr. Build. Mater. 2019, 197, 849–861. [Google Scholar] [CrossRef]
- Golewski, G.L.; Sadowski, T. Macroscopic Evaluation of Fracture Processes in Fly Ash Concrete. Solid State Phenom. 2016, 254, 188–193. [Google Scholar] [CrossRef]
- Richard, P.; Cheyrezy, M. Reactive powder concrete with high ductility and 200–800 MPa compressive strength. ACI SP 1994, 144, 507–518. [Google Scholar]
- Richard, P.; Cheyrezy, M. Composition of reactive powder concretes. Cem. Concr. Res. 1995, 25, 1501–1511. [Google Scholar] [CrossRef]
- Liu, S.; Sun, W. Preparation and durability of a high performance concrete with natural ultra-fine particles. J. Chin. Ceram. Soc. 2003, 31, 1080–1085. [Google Scholar]
- Yao, Z.; Zhou, J. Study on Fracture Energy of Reactive Powder Concrete Reinforced by Steel-Polypropylene Hybrid Fiber. J. Build. Mater. 2005, 4, 356–360. [Google Scholar]
- Ju, Y.; Jia, Y. Microscopic mechanism of strengthening and toughening of reactive powder concrete steel fiber. Sci. China Ser. E Technol. Sci. 2007, 11, 1403–1416. [Google Scholar]
- Yazıcı, H. The effect of silica fume and high-volume Class C fly ash on mechanical properties, chloride penetration and freeze–thaw resistance of self-compacting concrete. Constr. Build. Mater. 2007, 22, 456–462. [Google Scholar] [CrossRef]
- Licheng, W.U.; Zhe, W.; Di, L. Effect of Confining Pressure and Steel Fiber Volume Content on Mechanical Property of Reactive Powder Concrete. J. Build. Mater. 2018, 21, 208–215. [Google Scholar]
- Abed, M.; Nasr, M.; Hasan, Z. Effect of silica fume/binder ratio on compressive strength development of reactive powder concrete under two curing systems. MATEC Web Conf. 2018, 162, 02022. [Google Scholar] [CrossRef][Green Version]
- Williams, P.N.; Mathias, F.; Urs, M. Analysis of the Flexural Behavior of Textile Reinforced Reactive Powder Concrete Sandwich Elements Using Optical Measurements. In Proceedings of the 18th International Conference on Experimental Mechanics, Brussels, Belgium, 1–5 July 2018; Volume 2, p. 393. [Google Scholar]
- Flansbjer, M.; Portal, N.W.; Vennetti, D. Composite Behaviour of Textile Reinforced Reactive Powder Concrete Sandwich Façade Elements. Int. J. Concr. Struct. Mater. 2018, 12, 71. [Google Scholar] [CrossRef]
- Scerrato, D.; Giorgio, I.; Della Corte, A. Towards the design of an enriched concrete with enhanced dissipation performances. Cem. Concr. Res. 2016, 84, 48–61. [Google Scholar] [CrossRef]
- Asteray, D.B.; Odhiambo, O.W.; Muse, S.S. Mechanical and microstructural properties of recycled reactive powder concrete containing waste glass powder and fly ash at standard curing. Cogent Eng. 2018, 5, 1464877. [Google Scholar]
- Su, N.; Hsu, K.C. A simple mix design method for self-compacting concrete. Cem. Concr. Res. 2001, 31, 1799–1807. [Google Scholar] [CrossRef]
- Okamura, H.; Ozawa, K. Self-compacting high performance concrete. Struct. Eng. Int. 1996, 6, 269–270. [Google Scholar] [CrossRef]
- Choi, Y.W.; Kim, Y.J. An experimental research on the fluidity and mechanical properties of high-strength lightweight self-compacting concrete. Cem. Concr. Res. 2006, 36, 1595–1602. [Google Scholar] [CrossRef]
- Brouwers, H.J.H. Self-Compacting Concrete: Theoretical and experimental study. Cem. Concr. Res. 2005, 35, 2116–2136. [Google Scholar] [CrossRef]
- Zhong, S.Y.; Wang, Y.M. Effect of fibers on strength of self-compacting reactive powder concrete. J. Build. Mater. 2008, 11, 522–527. [Google Scholar]
- Sahmaran, M.; Yurtseven, A.; Yaman, I.O. Workability of hybrid fiber reinforced self-compacting concrete. Build. Environ. 2005, 40, 1672–1677. [Google Scholar] [CrossRef]
- Sahmaran, M.; Yaman, I.O. Hybrid fiber reinforced self-compacting concrete with a high-volume coarse fly ash. Constr. Build. Mater. 2007, 21, 150–156. [Google Scholar] [CrossRef]
- Corinaldesi, V.; Moriconi, G. Durable fiber reinforced self-compacting concrete. Cem. Concr. Res. 2004, 34, 249–254. [Google Scholar] [CrossRef]
- Grünewald, S.; Walraven, J.C. Parameter-study on the influence of steel fibers and coarse aggregate content on the fresh properties of self-compacting concrete. Cem. Concr. Res. 2001, 31, 1793–1798. [Google Scholar] [CrossRef]
- Farnam, Y.; Moosavi, M. Behaviour of Slurry Infiltrated Fibre Concrete (SIFCON) under triaxial compression. Cem. Concr. Res. 2010, 40, 1571–1581. [Google Scholar] [CrossRef]
- Giorgio, I.; Scerrato, D. Multi-scale concrete model with rate-dependent internal friction. Eur. J. Environ. Civ. Eng. 2016, 21, 1–9. [Google Scholar] [CrossRef]
- Golewski, G.L. Measurement of fracture mechanics parameters of concrete containing fly ash thanks to use of Digital Image Correlation (DIC) method. Measurement 2019, 135, 96–105. [Google Scholar] [CrossRef]
- Lin, Z. Summary of recent research on self-compacting concete. Concrete 2016, 9, 97–99. [Google Scholar]
- Wu, Z.; Lian, H. High Performance Concrete; China Railway Publishing House: Beijing, China, 1999; pp. 185–188. [Google Scholar]
- Huang, W.; Guo, G. Dosage of fly ash on properties of C30 self-compacting concrete. Concrete 2015, 4, 119–122. [Google Scholar]
- Ren, G.M.; Wu, H.; Fang, Q. Triaxial compressive behavior of UHPCC and applications in the projectile impact analyses. Constr. Build. Mater. 2016, 113, 1–14. [Google Scholar] [CrossRef]


© 2019 by the authors. Licensee MDPI, Basel, Switzerland. This article is an open access article distributed under the terms and conditions of the Creative Commons Attribution (CC BY) license (http://creativecommons.org/licenses/by/4.0/).