Article

Scenario Analysis in the Electric Power Industry under the Implementation of the Electricity Market Reform and a Carbon Policy in China

Electrical and Electronic Engineering School, North China Electric Power University, Beijing 102206, China
*
Author to whom correspondence should be addressed.
Energies 2019, 12(11), 2152; https://doi.org/10.3390/en12112152
Submission received: 7 May 2019 / Revised: 28 May 2019 / Accepted: 31 May 2019 / Published: 5 June 2019

Abstract

:
In China, electricity market reform was first implemented in 2015. At the same time, the national carbon market was built, along with the electricity industry, which was considered a breakthrough. Some key considerations for the future development of China’s electricity system include the implementation of demand-side measures in order to adjust the peak-to-valley difference and the economic dispatch of increasing intermittent renewable energy and traditional energy in the process of power marketization with the implementation of a carbon policy. This paper examines the impact of policies on electricity generation by modelling the evolution process of power marketization and the economic dispatch of generation technologies over a sixteen-year period beginning in 2020. We model four potential influencing factors of government policy: (1) the demand response mode; (2) power marketization process; (3) capacity adjustment of thermal power units; and (4) carbon taxes, which vary in terms of their timing and amount. This model assesses the impact of these influencing factors on the competition between electricity generators using a range of output variables, including generation portfolios, electricity prices, capacity factors, CO2 emissions, etc. The results show that the new round of electricity market reforms has had a positive impact on renewable energy generation. The influence of carbon policy is evident in the promotion, transformation and elimination of thermal units, and an indirect increase in renewable energy generation.

1. Introduction

China has been the world’s largest energy consumer over the past 20 years, and it is also the main source of global energy growth. With the large-scale development of clean energy and the increasing proportion of electricity with respect to energy consumption, the role of power systems in the energy system is becoming increasingly critical. The transformation of power generation is of great significance to China’s goal of achieving energy transformation and carbon emission reduction targets [1]. The electricity demand in China increased from 4977 TW h in 2012 to 6308 TW h in 2017 and is expected to reach 10,500 TW h by 2035. At the end of 2017, the installed capacity of coal-fired power was 1020 GW, accounting for 58% of the total installed capacity in China. The installed capacity of renewable energy was 650 GW, accounting for 36.6% of the total. In terms of power generation, coal-fired power generated 4200 TWh, accounting for 67% of the total [2,3]. The unique power supply structure determines the high carbon emissions characteristic of China’s power industry. China has become the largest carbon dioxide emitting region in the world, contributing more than 28% of global CO2 emissions. The electricity sector accounts for 43% of carbon emissions in China. The increase of electricity demand will lead to an increase in coal-fired power generation, thus raising carbon emissions [4]. China announced ambitious clean energy development targets and carbon mitigation goals in the Paris Agreement [5]. As a major contributor to carbon emissions, the electricity sector needs to establish more aggressive low-carbon power regulations in order to encourage power generation with low- and zero-carbon emissions.
With the shifting patterns of electricity demand and growing environmental awareness, the development of China’s electricity sector is a comprehensive and complex subject, which includes sustainable, clean energy development and carbon mitigation requirements. China’s current electricity system lacks flexibility in power demand, generation and pricing. For example, the wholesale generation rates in China have historically been loosely based on the average cost. The lack of flexibility affects renewable energy integration and CO2 emissions reduction on a large scale at an acceptable level of cost and reliability. Thermal power generation still accounts for a large proportion of China’s power generation structure [6]. Electricity market reform was implemented in 2015 with the aim to form a mechanism for the determination of prices by the market gradually, and to encourage the development of sustainable clean energy and consequently optimize the power structure [7]. In addition, China’s carbon trading, as well as various fiscal and taxation policies have an important impact on the production costs of the power industry. In December 2017, China proposed to launch the national carbon emission trading market in the electricity sector and to strengthen coordination with relevant measures, such as electricity reform, which will increase the production cost of thermal power generation enterprises [8]. By changing the comprehensive cost comparison between renewable power generation and thermal power generation, the government can control the development of sustainable, clean energy on the macro level. Under these circumstances, studying the impact of China’s electricity market reform and carbon policy in relation to the planning and economics of the electricity sector is of great significance.
There are many studies that focus on the long-term transformation of China’s power sector. In the past, studies have suggested various pathways on different scales, and with different considerations, in China’s power sector. Experts in the electricity market have been working hard to find possible pathways towards achieving a balance between reliable, affordable and clean power systems. Cai et al. [9] proposed pathways for China’s power sector up to 2030 in three policy scenarios, which are drawn from energy conservation and CO2 reduction policies. Using an Excel-based “Energy Optimization Calculator”, Sithole et al. [10] developed a policy-informed optimal electricity generation scenario in order to assess the sector’s transition in 2050. A multi-region optimization planning model [11,12,13,14,15] was applied to analyze the energy transition pathway in the electricity sector. Li et al. [16] introduced a dynamic computable general equilibrium (CGE) model to simulate the impact on the electric power industry under the implementation of a national carbon trading market in China. Dai et al. [17] proposed the composition of China’s power capacity in 2020, 2030 and 2050 in three scenarios, with different power demands and carbon caps, using the market allocation model (MARKAL). Wu et al. [18] used the long-range energy alternatives planning (LEAP) model in order to simulate pathways for China’s power sector under different scenarios and analyzed carbon emissions and intensity until 2030. Yuan et al. [19] established newly developed multi-level perspective (MLP) transitions, with three lines of thought and five transition pathways, in order to study the transition to low-carbon power systems in China. Adelman et al. [20] examined the interaction between price competition and policy in four Independent System Operator (ISO) markets by modeling the economic dispatch of generation technologies and the evolution of generation resources over a sixteen-year period. Considering the integration of variable renewable energy generation brings significant uncertainty for the operation of power systems. Najafi et al. [21] proposed an improved stochastic scheduling model in order to strategically operate a power system by concentrating solar power plants under high renewable energy penetrations. Lu et al. [22] proposed an information gap decision theory-based model for energy hub management, which considers the uncertainty in electricity market prices and wind turbine generation, and whereby the demand response is added to increase the flexibility of the decisions. Carbon emissions reduction is one of the most challenging issues in our emission-constrained world. Cheng et al. [23] proposed a novel analytical model for carbon emissions flow in a multiple energy system to analyze the flow of carbon emissions across different energy systems during the conversion process. Pourakbari et al. [24] allocated the carbon footprint among consumers, as well as the transmission loss, via a tracing method. Cheng et al. [25] proposed a bi-level expansion planning model of multiple energy systems that considers the carbon emission constraints under a decentralized approach, and a case study based on the model is implemented in Northern China. In order to better determine the planning and operation plan for renewable energy, Home et al. [26] proposed a multi-stage convex distribution system planning model to find the best reinforcement plan over a specified horizon. This strategy determines planning actions, such as the reinforcement of existing substations and the siting and sizing of renewable and dispatchable distributed generation units.
The contributions of this paper are as follows: (1) this paper considers the significance of changes in the electricity market reform and carbon policy, and models four potential pathways of policies for long-term energy transformation; (2) the methodology innovatively analyses two dispatching modes under the power market reform process, including a planned dispatch mode and economic dispatch mode; (3) Moreover, this paper models the electricity generation mix which meets the hourly electricity demand over the next 16 years, from 2020 to 2035, in order to provide deeper insight into the future development of China’s electricity sector.
The rest of this paper is organized as follows: Section 2 describes the structure and assumptions of the model, including the “equal shares” dispatch model and “economic optimization” dispatch model. Section 3 introduces data inputs and four types of policy scenario under the power marketization process and carbon policy. Section 4 discusses the results of the analysis. Section 5 concludes the paper and presents some policy implications.

2. Methodology

2.1. Structure and Assumptions

There are two possible policies that tend to promote low-carbon development in the electricity sector and transform electricity generation in an economical way. One trend is towards the process of electricity marketization by introducing competition and market pricing in the electricity system. With the new round of electricity market reform, the power industry has gradually shifted from the “equal shares” electricity generation of the regulated system to wholesale power markets [27,28]. On the one hand, electricity generation plants that formerly guaranteed a positive return on investment, under the old regulated system, now compete on prices within the competitive electricity market. On the other hand, the large-scale development of renewable energy may damage the status of coal-fired power units in the competitive electricity market in the future. As the spot price of electricity market is determined by the marginal cost, renewable generation units such as wind turbines and solar photovoltaics will have a dominant position in electricity market bidding due to their zero marginal cost [29,30]. The second aims at the implementation of a national carbon market, which represents a breakthrough for the electricity sector. The addition of a carbon price to the traditional thermal unit generation cost, which makes coal-fired power plants much less competitive, will drive rapid growth in renewable and gas-fired generation, supplanting coal-fired power and producing significant environmental benefits [31,32,33,34].
In order to obtain a detailed strategy of electricity market reform and carbon policy in the electricity sector during the planning horizon, all possible actions of the power sector are considered, year by year, in the model. The model constraints are summarized as follows: (1) the future power demand, under different demand response scenarios for each hour in the planning horizon, is satisfied; (2) the generation dispatch follows the electricity allocation between planned generation and market generation under the electricity marketization during the planning horizon; (3) the reserve capacity of coal-fired and gas-fired units, under the electricity marketization during the planning horizon, is considered, and (4) the power sector pays the carbon cost of thermal power units under the implementation of the carbon market.
An illustrative model structure of power generation economic analysis is presented in Figure 1, including the data input, model design scenarios, objective functions and model output. The data input requires data on the detailed composition of the power sector at the beginning of the planning horizon, predicted power demand, future installed capacity development plan, CO2 prices, as well as the technological and fuel parameters, considered over the planning horizon. The modus of China’s future electricity generation is divided into two parts, under electricity marketization, in this model: the first part is the “equal shares” dispatch generation for the planned electricity sector, whereby all types of power generation technologies comply with the “equal shares” electricity generation rules; the second part entails the “economic optimization” dispatch generation for the electricity market sector, which is under an economic optimization algorithm that selects the lowest-cost option for electricity generation. The output of the model can provide detailed information about the pathway of China’s power sector under different policy scenarios over the planning horizon, including the power generation profiles, capacity factors of various power generation technologies, market price on an hourly basis, costs and revenues of various generation technologies, CO2 emissions, etc.
The model divides power plants into seven different electricity generation technology categories: coal, gas, hydroelectric (HD), nuclear (NU), wind (WD), solar photovoltaic (PV) and biomass (BM). As the availability of different technologies varies between seasons and within one day, we need to analyze the future capacity factors and power generation curves of different technologies based on their technical characteristics in order to meet the hourly electricity demand [35,36]. The availability of coal, gas and NU could be considered reliable, dependable, and could be dispatched over 8760 h. The assumption is that the fuel supply to these technologies is secure and constant, and that their operation is therefore not affected by temporal conditions. For modelling purposes, these technologies do not create intermittent and uncertainty problems, and the upper limit of generation outputs of coal, gas and NU are therefore stable in the electricity generation dispatch to meet the hourly power demand. In reality, no plant is 100% reliable and unplanned outages can occur that require system operators in order to correct them. To solve this problem, certain proportions of spare capacity for coal and gas technologies are set to ensure power system reliability. HD and BM technologies are considered to have certain intermittent and uncertainty factors, and the availability of those technologies varies in different seasons but not within one day. Therefore, the upper limit of HD and BM generation is set according to seasons. WD and PV technologies were found to display a relatively high degree of intermittent and uncertainty dispatch characteristics, and the availability of those technologies vary between both seasons and day diurnal periods [37]. Therefore, the future hourly power generation curve of WD and PV technologies should be simulated by referring to China’s typical 8760 h generation curve and the predicted installed capacity of those technologies.
Considering that China’s power generation installed capacity may not meet the power demand in certain peak periods, it is important to introduce a backup “Big Margin(BIGM)” technology in order to accommodate short-term capacity shortages. When power consumption peaks, and the existing power units cannot meet the power demand, “BIGM” is used to fill in short-term gaps between supply and demand. Given ongoing concerns about the ability of price signals to ensure supplies at high levels of reliability, this assumption is commonly used in models of this type [20,38]. The generation cost of BIGM is set at 1 RMB/kWh above the most expensive available technology. The number of hours served by BIGM will affect the annual market clearing price, which means that the greater number of hours, the higher the price.
By determining the future electricity generation dispatch mode, the model can better reflect the power generation technology structure under electricity marketization and the carbon policy. Further, combining the temporal features of different technologies can provide optimal pathways for technology deployment over the planning period.

2.2. Mathematical Formulation

The Chinese electricity sector’s current modus operandi is composed of two parts: one is the original planned power generation mode, which operates under the “equal shares” dispatch, whereby the power generation of a given technology is determined by its annual operation hours and installed capacity in order to ensure adequate revenues to recover their fixed costs. Moreover, the wholesale generation price of this part has historically been calculated loosely according to average costs, such as the benchmark pricing of thermal generators. Considering economic and environmental factors in the development of the electricity sector, the other part, which is the marketization power generation mode, was proposed. In this part, generation technologies are dispatched in order to satisfy hourly demand, from the lowest to the highest marginal cost [39]. With the advancement of power marketization, the proportion of the marketization of electricity generation will increase, year by year, during the planning horizon. As the proportion of various generation technologies under the original planned power generation mode is relatively fixed, in this section we focused on the analysis of the “economic optimization” dispatch model in the electricity market during the planning horizon [40,41,42].
In this section, methodologies used to implement the dispatch generation model are presented. For example, different types of electricity generation costs, which are desirable for satisfying the demand at the lowest possible cost, are defined and discussed; the objective functions which solve the economic optimization dispatch problem are listed, and measurement factors for the economy and environment in the electricity market are also discussed. All variables are denoted by lower-case characters, and parameters are denoted by upper-case ones, which are assigned to values in the case study. Four variables, including n , t , m and j , stand for the generation technology type, year, demand response mode and hour, respectively. The key methodologies are divided into four modules [11,12,13,14,15].
Module 1: Electricity generation allocation forecasting
The planned electricity generation and marketization electricity generation constitute the total electricity generation:
P D t , m = P P D t , m + M P D t , m
where P D t , m is the total power demand in the t th year under demand response mode m ; P P D t , m is the planned power demand in the t th year under demand response mode m ; and M P D t , m is the marketization power demand in the t th year under demand response mode m .
The planned power generation is determined by the annual operation hours and installed capacity of each electricity generator.
p p g n , t , m = O H n × t i c n , t n = 1 N O H n × t i c n , t × P P D t , m
where p p g n , t , m is the planed power generation of type n generation technology in year t under demand response mode m ; O H n is the annual operational hours of power plants of type n generation technology; t i c n , t , m is the planed power generation of type n generation technology in year t under demand response mode m ; and N is the total number of generation technologies.
Module 2: The “economic optimization” electricity generation dispatch in the electricity market
At the highest level, “economic optimization” dispatch calculates the hourly market price for wholesale electricity by placing each generation technology in direct competition with all others in the electricity system. Each generation technology has two primary cost categories: One is the capital investment cost and the other is the power generation costs. Formally, we express the capital investment cost as:
(1) Capital investment cost for the generation technologies in the planning horizon
Π C A P n = t = 1 T n R n ¯ ( 1 + i ) t
where C A P n is the capital cost of generation technology n during the planning horizon; R n ¯ is the equivalent uniform annual payment; i is the discount rate for the capital cost; and T n is the expected technical lifetime of the power technology of type n . Solving R n ¯ :
R n ¯ = Π C A P n × [ t = 1 T n 1 ( 1 + i ) t ] 1
The factor on the right side of the capital investment cost in Equation (4) is the capital recovery factor (CRF) and can be simplified as follows.
C R F n = [ t = 1 T n 1 ( 1 + i ) t ] 1 = i ( 1 + i ) T n ( 1 + i ) T n 1
(2) Power generation costs for generation technologies in the planning horizon
Power generation costs are directly associated with the electricity generation, consisting of variable generation costs, fixed generation, operating and maintenance costs and other generation costs, and variable generation costs are divided into fuel cost, operation and maintenance cost, and emissions cost. The variable fuel cost ( v f c n , t ) is calculated using the fuel price and the amount of fuel consumed:
v f c n , t = F C R n , t × F P t
where FCRn,t is the consumption rate of fuel by generation technology of type n in the year t for 1 kWh of electricity; and F P t is the price of fuel by generation technology of type n in the year t .
The variable operation and maintenance costs of generation technology n in the year t ( v o m c n , t ) are related to non-fuel expenses, such as water consumption, waste expenses, etc., which vary with the electricity power output. The variable emission costs ( v e c n , t ), which are the environmental fees of CO 2 pollutants, are calculated as:
v e c n , t = C E I n × F C R n , t × C P t
where C E I n is the CO 2 emission intensity of fuel by generation technology of type n ; FCRn,t is the consumption rate of fuel by generation technology of type n in the year t for 1 kWh of electricity; and C P t is the CO 2 emission price in the year t .
(3) Dispatch price for generation technologies in the planning horizon
In the “economic optimization” dispatch model in the electricity market, various generation technologies bid their dispatch price based on its marginal cost in order to encourage a greater contribution of electricity from renewable generation technologies, which have a zero-marginal cost. The marginal cost is calculated as:
m c n , t = v o m c n , t 1000 + v f c n , t + v e c n , t
where m c n , t is the marginal cost of generation technology n in the year t ; and v o m c n , t is the variable operation and maintenance costs of type n generation technology during year t .
Various generation technologies are dispatched to satisfy demand, from the lowest to the highest dispatch price, which are determined by the marginal cost, and the highest of the dispatched prices, from online generation technologies, sets the market price for all other generation technologies. Therefore, the market price in the t th year is defined as:
m p t = max ( d p n , t ) = max ( m c n , t )
where m p t is the market price in the year t ; and d p n , t is the dispatch price in the year t . The market price depends on the price of the most expensive generator online, which in turn depends on the hourly demand and the availability of each technology.
(4) “Economic optimization” electricity generation dispatch model description
The electricity market satisfied demand at the minimum cost possible by using “economic optimization” dispatch to choose the cheapest technologies, without exceeding their maximum capacity. The second constraint limits the generation to the maximum capacity available of each generation technology. We make additional simplifying assumptions for the “economic optimization” electricity generation dispatch model. Sub-regional differences in electricity generation and demand and bulk power transfers between regions are ignored. Moreover, the order of the dispatch prices can be further simplified by assuming that they are constant over the year, as relative efficiencies between technologies do not change frequently, and the fuel prices are correlated in the short run. While these assumptions undoubtedly cause the model to depart from real-word dispatch patterns on an hour-by-hour basis, aggregated annually, the results of our simulation are consistent with the dispatch and capacity decisions generated using more industry-standard models. The algorithm has the following functional form [20]:
min ( j = 1 J n = 1 N m p t , j × m p g n , t , m , j )
Subject to:
n = 1 N m p g n , t , m , j = M P D t , m , j
0 m p g n , t , m , j m i c n , t , m , j
where J is the total number of hours in the generation window (8760 h for a year); m p g n , t , m , j is market power generation of type n generation technology in hour j of year t under demand response mode m ; and m i c n , t , m , j is the market installed capacity of type n generation technology in hour j of year t under demand response mode m .
Module 3: Metrics of electricity market to compare electric generation technologies
This work uses a set of costs, including the annual levelized cost of electricity and the annual levelized avoided cost of the electricity, revenues and capacity factors of generation technologies, as metrics to compare the different generation technologies, and calculates the annual market price to evaluate the impact of “economic optimization” dispatch on the electricity sector.
The annual levelized cost of electricity of generation technology n in year t ( l c o e n , t ) can be calculated as:
l c o e n , t = Π C A P n × C R F n + f o m c n , t 8760 × m c f n , t + v o m c n , t 1000 + v f c n , m , t + v e c n , m , t
where f o m c n , t is the fixed operating and maintenance costs of type n generation technology during year t ; and m c f n , t is the market capacity factor of generation technology n during year t .
The annual levelized avoided cost of electricity of generation technology n in year t ( l a c e n , t ) can be calculated as:
l a c e n , t = j = 1 8760 m p g n , t , m , j × m p t , j j = 1 8760 m p g n , t , m , j
The annual revenue of generation technology n in year t can be calculated as:
r e v e n u e n , t = l a c e n , t × 8760 × m c f n , t × m i c n , t , m
The capacity factor of generation technology n in year t can be expressed as:
m c f n , t = j = 1 8760 m p g n , t , m , j m i c n , t , m × 8760
The annual average electricity market price of generation technology n in year t ( m p t , m ¯ ) can be calculated as:
m p t , m ¯ = j = 1 8760 ( m p t , j × M P D t , m , j ) j = 1 8760 M P D t , m , j
Module 4: Total CO 2 emissions, intensity and revenue for the electricity sector in year t in the planning horizon.
The annual total CO 2 emissions during the planning horizon are proportional to the fuel consumption as well as the CO 2 emission intensity of each type of fuel. Therefore, the annual total CO 2 emissions of the electricity sector in year t are calculated as follows:
c e t , m = n = 1 N ( p p g n , t , m + m p g n , t , m ) × C E I n × F C R n , t
where c e t , m is the total carbon emissions during year t under demand response mode m ; C E I n is the CO 2 emissions intensity of fuel by generation technology n ; and F C R n , t is the consumption rate of fuel by generation technology n in year t for 1 kWh of electricity.
The annual CO 2 intensity ( c e i t , m ) is carbon emissions generated by 1 KW of electricity in the total electricity sector, and it is calculated as:
c e i t , m = c e t , m P D t , m
The carbon market assumes that a Cap and Trade-like policy for CO 2 emissions, and the vast majority of CO 2 allowances issued by the Chinese agency are distributed by CO 2 allowance auctions. Proceeds from the auctions are returned to the electricity market and have been primarily invested in consumer benefit programs: energy efficiency, renewable energy, etc. The total CO 2 emissions are calculated, and a CO 2 price is assumed for each year in the period under study. The annual CO 2 revenue ( c e r t , m ) for the electricity sector in year t is calculated as follows:
c e r t , m = c e t , m × C P t

3. Case Study and Discussion

The methodologies discussed in Section 2 have been applied in a case study for the planning of China’s power sector over the period between 2020 and 2035. Considering the electricity market reform and carbon emissions reduction, four types of policy are examined. The key parameter data, including a future power demand growth forecast, the future technology capacity planning, as well as technological and economical parameters, are also given in this section.

3.1. Scenario Analysis Approach

We consider 2020–2035 to be the total planning horizon, and accordingly study the impact of a new round of power market reform and carbon policy on the power structure transformation and economics of the power industry, as well as the carbon emissions reduction results. Four types of policy are examined: (1) the business as usual (BAU) and aggressive (AG) electricity demand side response; (2) moderate (MO), BAU and AG power marketization process; (3) BAU and AG reserve capacity adjustment of thermal power units, and (4) MO and BAU carbon policy. The total number of scenarios is 24. They are developed in this study to indicate the development situations of China’s power sector and its carbon reduction results.
(1) Demand response
With the implementation of a new round of electricity reform policies in 2015, China’s power market model has been improved continuously, and the role of the demand response in the competitive electricity market has been gradually recognized. We introduce a demand response in the power market competition through price signals and an incentive mechanism to achieve the goal of reducing the peak-to-valley difference in the electricity sector [43].
We forecast power demand data based on the future power demand forecast data and historical hourly load data given by the power planning department. Detailed temporal divisions are as follows. Each year was divided into 8760 h, and a day was then distributed into three periods: low-demand load period (0:00–8:00), medium-demand load period (8:00–16:00) and high-demand load period (16:00–24:00) [20].
The demand response is divided into two modes, which are the BAU demand response mode and the AG demand response mode. Based on the principle of controlling a single variable, the total annual electricity demand is the same in both modes. In the BAU demand response scenario, the growth rate during the high-demand load period is three times that of the low-demand load period. While in the AG demand response scenario, the growth rate during the high-demand load period is 1.5-fold that of the low-demand load period. We design the power demand curve(hourly) under the BAU and AG demand response scenarios between 2020 and 2035.
(2) Power marketization process
China launched a new round of power market reforms in 2015, “the 2018 National Electricity Market Transaction Information Brief Analysis” issued by the China Electricity Council pointed out that the national power consumption totaled 684.9 billion kWh, of which the total electricity consumption in the electricity market was 205.44 billion kWh, accounting for 30.2% of the total electricity consumption. Based on the current electricity market share in China’s electricity sector and the implementation of China’s power reform policy in the future, we forecast the proportion of the planned electricity part and market electricity part in the total electricity consumption of the electricity sector during the period between 2019 and 2035 [44].
The electricity market reform policy is divided into three modes: MO, BAU and AG. Firstly, we assume that the electricity market share of the three modes is the same in 2019, that is, the market electricity generation accounts for 30% of the total electricity generation. With the different modes of electricity market reform policy, the shares of planned generation and market generation are shown in Table 1. The MO mode of electricity market reform policy means that the electricity sector will maintain the existing electricity market transactions and the market generation share will remain unchanged at 30% of the total social electricity consumption. The BAU policy will continue to promote the implementation of the reform policy on the basis of the existing power market transactions, and the market share will reach 60% by 2035, while the planned generation share will be 40% by 2035. Further, the average annual growth rate of the planned generation share is −3%. The AG mode increases market transactions to achieve the ideal level of electricity marketization, that is, the electricity market share will reach 90% by 2035. While the planned generation share will decline to 10% by 2035, the average annual growth rate of the planned generation part is −11%. Under the implement of the AG mode, the electricity marketization for all types of user in the whole society will basically be realized.
(3) Thermal unit reserve capacity adjustment
With the improvement of China’s electricity marketization, the units dispatch will become more flexible and economical. The power economic dispatch, based on the electricity market, may lose a certain requirement of power system safety and reliability to achieve the power system economic maximization. For example, we can adjust the reserve capacity to dispatch thermal power units more economically [45].
Under the electricity market economic dispatch, two modes of the reserve capacity of thermal power units are assumed, namely the BAU mode and AG mode. As shown in Table 2, in the BAU mode, the reserve capacity of coal-fired units is 20%, and that of gas-fired units is 10%; in the AG mode, the reserve capacity of coal-fired is 10% and that of gas-fired units is 5%.
(4) Carbon policy
Based on a study of the historical carbon price, the results of carbon emissions reduction and future emissions reduction targets of the carbon market, the carbon price is added to the thermal power generation cost in the electricity market, that is, the pressure of carbon emissions reduction is partly transferred to the power generation market bidding. In order to stimulate the decarbonization of the power sector, the rising carbon price during the planning horizon reflects the tightening of carbon emissions reduction targets [46].
We assumed that the national carbon market, which represents a breakthrough for the electricity sector, was assumed to be implemented with an initial price set at 50 RMB/t CO 2 in 2020, and two carbon price paths were designed that vary in timing and amount until 2035. As shown in Table 3, the MO carbon policy means that carbon prices remain at 50 RMB/t. Considering inflation and the government’s ambition of mitigating carbon emissions, in the BAU carbon policy, the annual growth of the CO 2 price is assumed to be 30 RMB/t, with a final price of 530 RMB/t CO 2 by 2035.

3.2. Data

Data inputs included the power demand forecasts, future capacity mix of power technologies, technological and economical parameters, including costs and features of generation technologies, as well as the costs and consumption rate of fuels.

3.2.1. Power Demand

China’s power demand is influenced by population growth and economic development among other factors. However, the detailed prediction of power demand is not the focus of this paper. In this study, the forecast of power demand is based on the energy demand forecasting model, which used the Long-range Energy Alternatives Planning System (LEAP)model by the State Grid Energy Research Institute [47]. China’s power demand will continue to grow in the future, with the growth rate gradually slowing, and will enter the stage of growth saturation around 2035. Furthermore, the total annual electricity demand is divided into 8760 h, representing the demand load variation between seasons and within diurnal periods based on historical data; the prediction is given in Table 4.

3.2.2. Future Capacity Mix of Power Technologies

In the case study, the generation technologies in the electricity sector are subdivided into coal power, gas power, hydropower, nuclear power, wind power, solar PV and biomass power. Thus, the total generation of the power industry is an aggregate of seven generation technologies. The forecast of the capacity mix of power technologies in China’s electricity sector is also obtained from the State Grid Energy Research Institute, and Table 5 shows the future capacity mix of generation technologies in the power industry.

3.2.3. Technological and Economical Parameters

The model contains many parameters in this case study, and the values of most parameters were obtained from publicly available literature [2,3,4], with only a few of them with future estimations obtained by heuristics.
(1) Capital cost for the construction of power technologies
Capital cost for the construction of power technology of type n in year t is represented by C A P n , t , and it is assumed that the C A P n , t of all types of power plants will gradually increase or decrease due to technological advances and environmental protection. Except for hydropower plants and nuclear plants, other power plants will drop in costs as the technology improves. Considering environmental protection and immigration, the hydropower and nuclear plants will increase slowly with time. Table 6 presents the forecasted capital expenditures until 2035 for power technologies.
(2) Expected lifetimes of power technologies
The expected lifetimes of power technology of type n is represented as T n , and the expected lifetime of each type of power technology is assumed to retain a constant value over the planning horizon, which is shown in Table 7.
(3) Annual operational time of power technologies
The annual operational time of power technologies of type n is represented by O H n . It is assumed that the O H n of each type of generation technology retains the same number as the real annual operating time of plants of the same type in China’s planned power sector over the horizon, as shown in Table 8.
(4) Operation-and-Maintenance costs of power technologies
The annual operation and maintenance costs of power technologies are divided into two parts: The variable operation and maintenance costs of generation technology n in year t , which are represented as v o m c n , t , and the fixed operating and maintenance costs, which are represented by f o m c n , t . v o m c n , t is expected to remain constant during the planning period, and f o m c n , t is expected to change in the future according to C A P n . Detailed data are listed in Table 9.
(5) Fuel consumption rates of power technologies
The fuel consumption rates of power technology n in year t are represented by FCRn,t, and it is assumed that the FCRn,t of both coal and gas power decreases linearly in the planning horizon. Detailed data for each year over the planning horizon are listed in Table 10.
(6) Fuel price
The average coal price was estimated to be 600 RMB/tce, based on the actual coal price of each region, and the annual increase in the coal price was assumed to be 4%. Similarly, the average price of natural gas was estimated to be 2.154 RMB/m3, and the annual growth rate of the gas price was assumed to be 4%.
(7)  CO 2 emissions intensity of fuel
The CO 2 emissions intensity of fuel by generation technology n in period t is represented by C E I n , and it is constant for each fuel. For coal, the C E I n is 2.7812 kg- CO 2 /kg-coal. For natural gas, the C E I n is 2.19362 kg- CO 2 /Nm3-ng.

4. Results and Discussion

Based on the models, data inputs and four types of policy scenario provided in Section 2 and Section 3, the best development paths for the power sector in each scenario are obtained. The focus of this research was to gain insights into the impact of introducing an electricity reform policy and carbon policy on the future trends of the power industry. Firstly, the impact of the future demand curve of different demand side responses, under the electricity market reform, on future electricity dispatch is discussed. Then, the future power generation structure and carbon emission reduction effects are compared under the various electricity marketization ratio mode. Moreover, as the marketization process progresses, the thermal power generation scenario, the units of which may reduce the spare capacity and turn to the pursuit of greater economic profit, is also discussed. In addition, the role of carbon policy in the elimination and transformation of thermal power units in the future is analyzed. Finally, several key output variables for each of the four policy scenarios are compared.

4.1. The Impact of the Demand Response

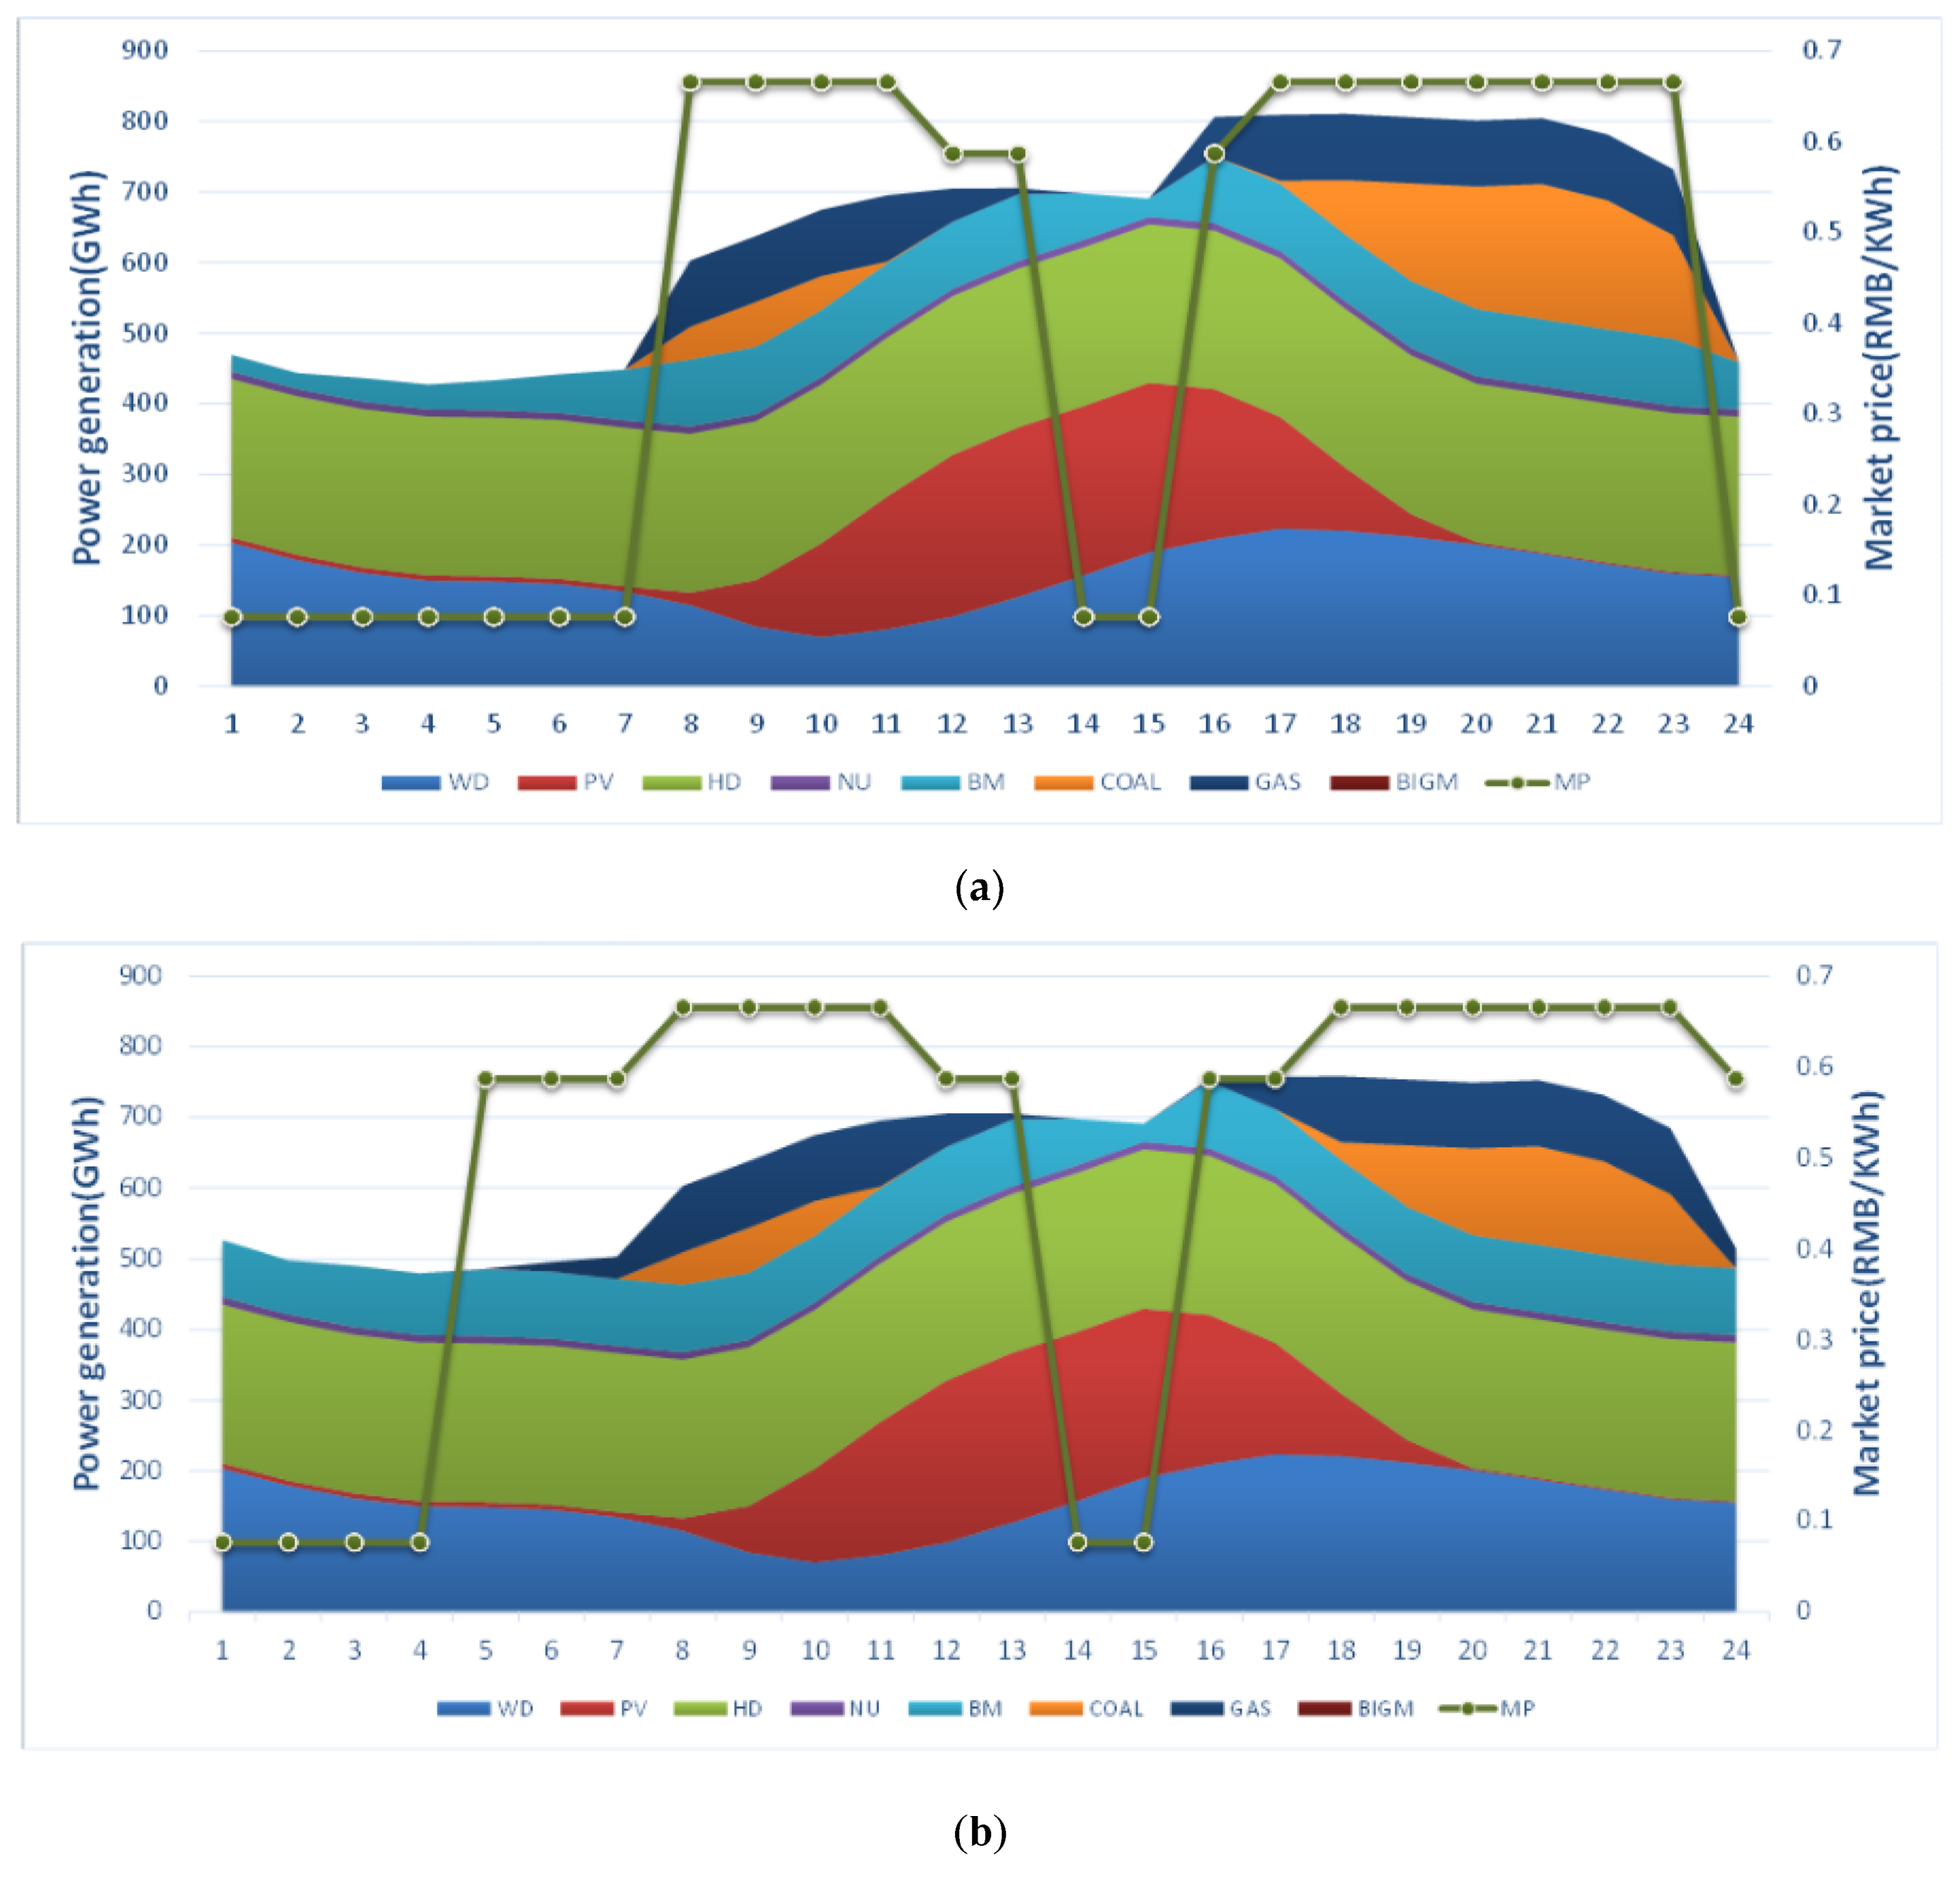
In order to study the impact of the demand response on the power industry, Figure 2 provides a comparison of the power generation dispatch curves and market transaction price for atypical days under the demand responses of the BAU mode and AG modes. Renewable energy units are preferentially scheduled due to their low marginal price in the electricity market. However, due to their insufficient installed capacity, the dispatch thermal power units still need to meet the demand of the whole society most of time.
The demand response reduces the peak-to-valley difference of the power consumption. The increase of the power consumption during the low valley period makes the renewable energy capacity insufficient to meet the electricity demand, and the power dispatch in the low valley period is closer to thermal power units, so the demand response has increased the transaction price in the electricity market during the low electricity valley period to a certain extent. At the same time, the demand side response also reduces power consumption during the peak period. As shown in Table 11, compared to the BAU demand response mode, the number of hours for high-cost BIGM in annual power dispatching are reduced by 82 h in the AG demand response mode in 2035. Thus, the demand response plays a role in hourly smoothing the price of electricity.
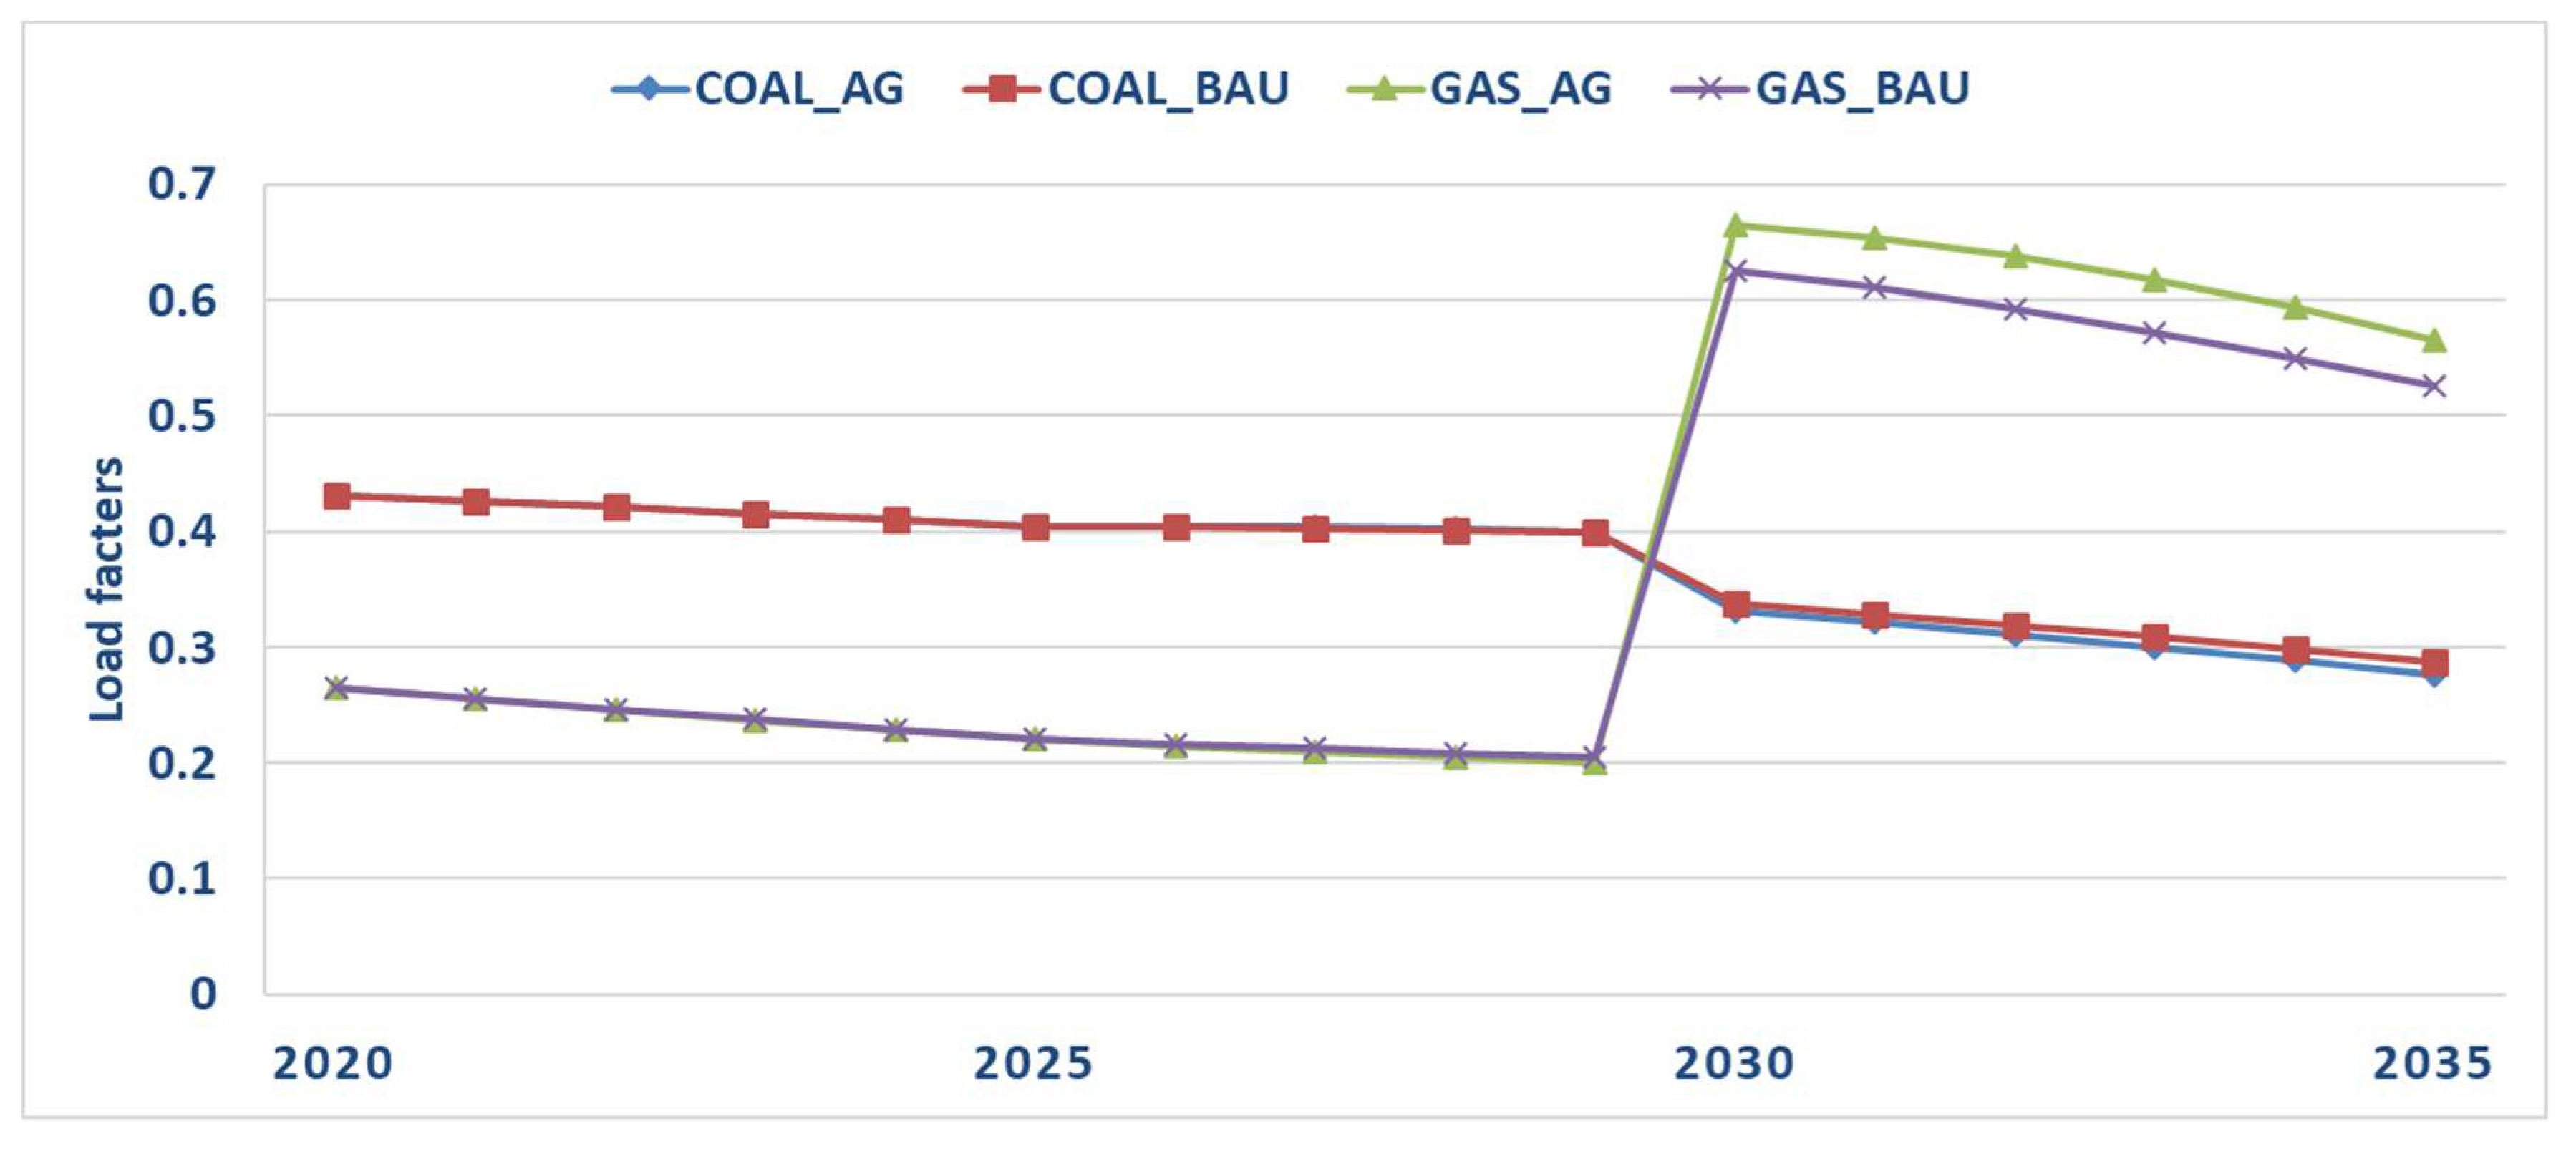
Comparing the capacity factors of various power technologies in the demand response of BAU and AG modes, the capacity factors of WD, PV, HD, BM and NU are very similar in the two modes, which is because the technologies are dispatched in order, from the cheapest to the most expensive, until the demand is met, so that non-fossil energy units are fully scheduled. In contrast, the capacity factors of coal and gas are relatively large in the two modes. As shown in Figure 3, with the advancement of power marketization, the proportion of non-fossil energy dispatch is increased, while the capacity factor of thermal power units declines. Due to China’s carbon policy, the marginal cost of coal-fired units will be higher than that of gas-fired units after 2030. And the gas units are dispatched preferentially, so the capacity factor of gas-fired units suddenly increases by 0.420, while that of coal-fired units suddenly decreases by 0.062 in the BAU mode. Since the demand response increases the electricity consumption during the valley period, the market dispatches more transactions to the gas units. Therefore, the gas unit capacity factor under the AG scenario will be 0.039 larger than that under the BAU scenario in 2030. However, due to the limited capacity of gas-fired units, they are not able to meet the whole electricity market dispatching hourly, so the remaining electricity is partially supplemented by coal-fired units. The implementation of the demand response reduces the user’s electricity consumption during peak hours, so the power generation of coal-fired units is reduced, and the capacity factor is lower in the AG scenario.

4.2. The Impact of Electricity Marketization Process

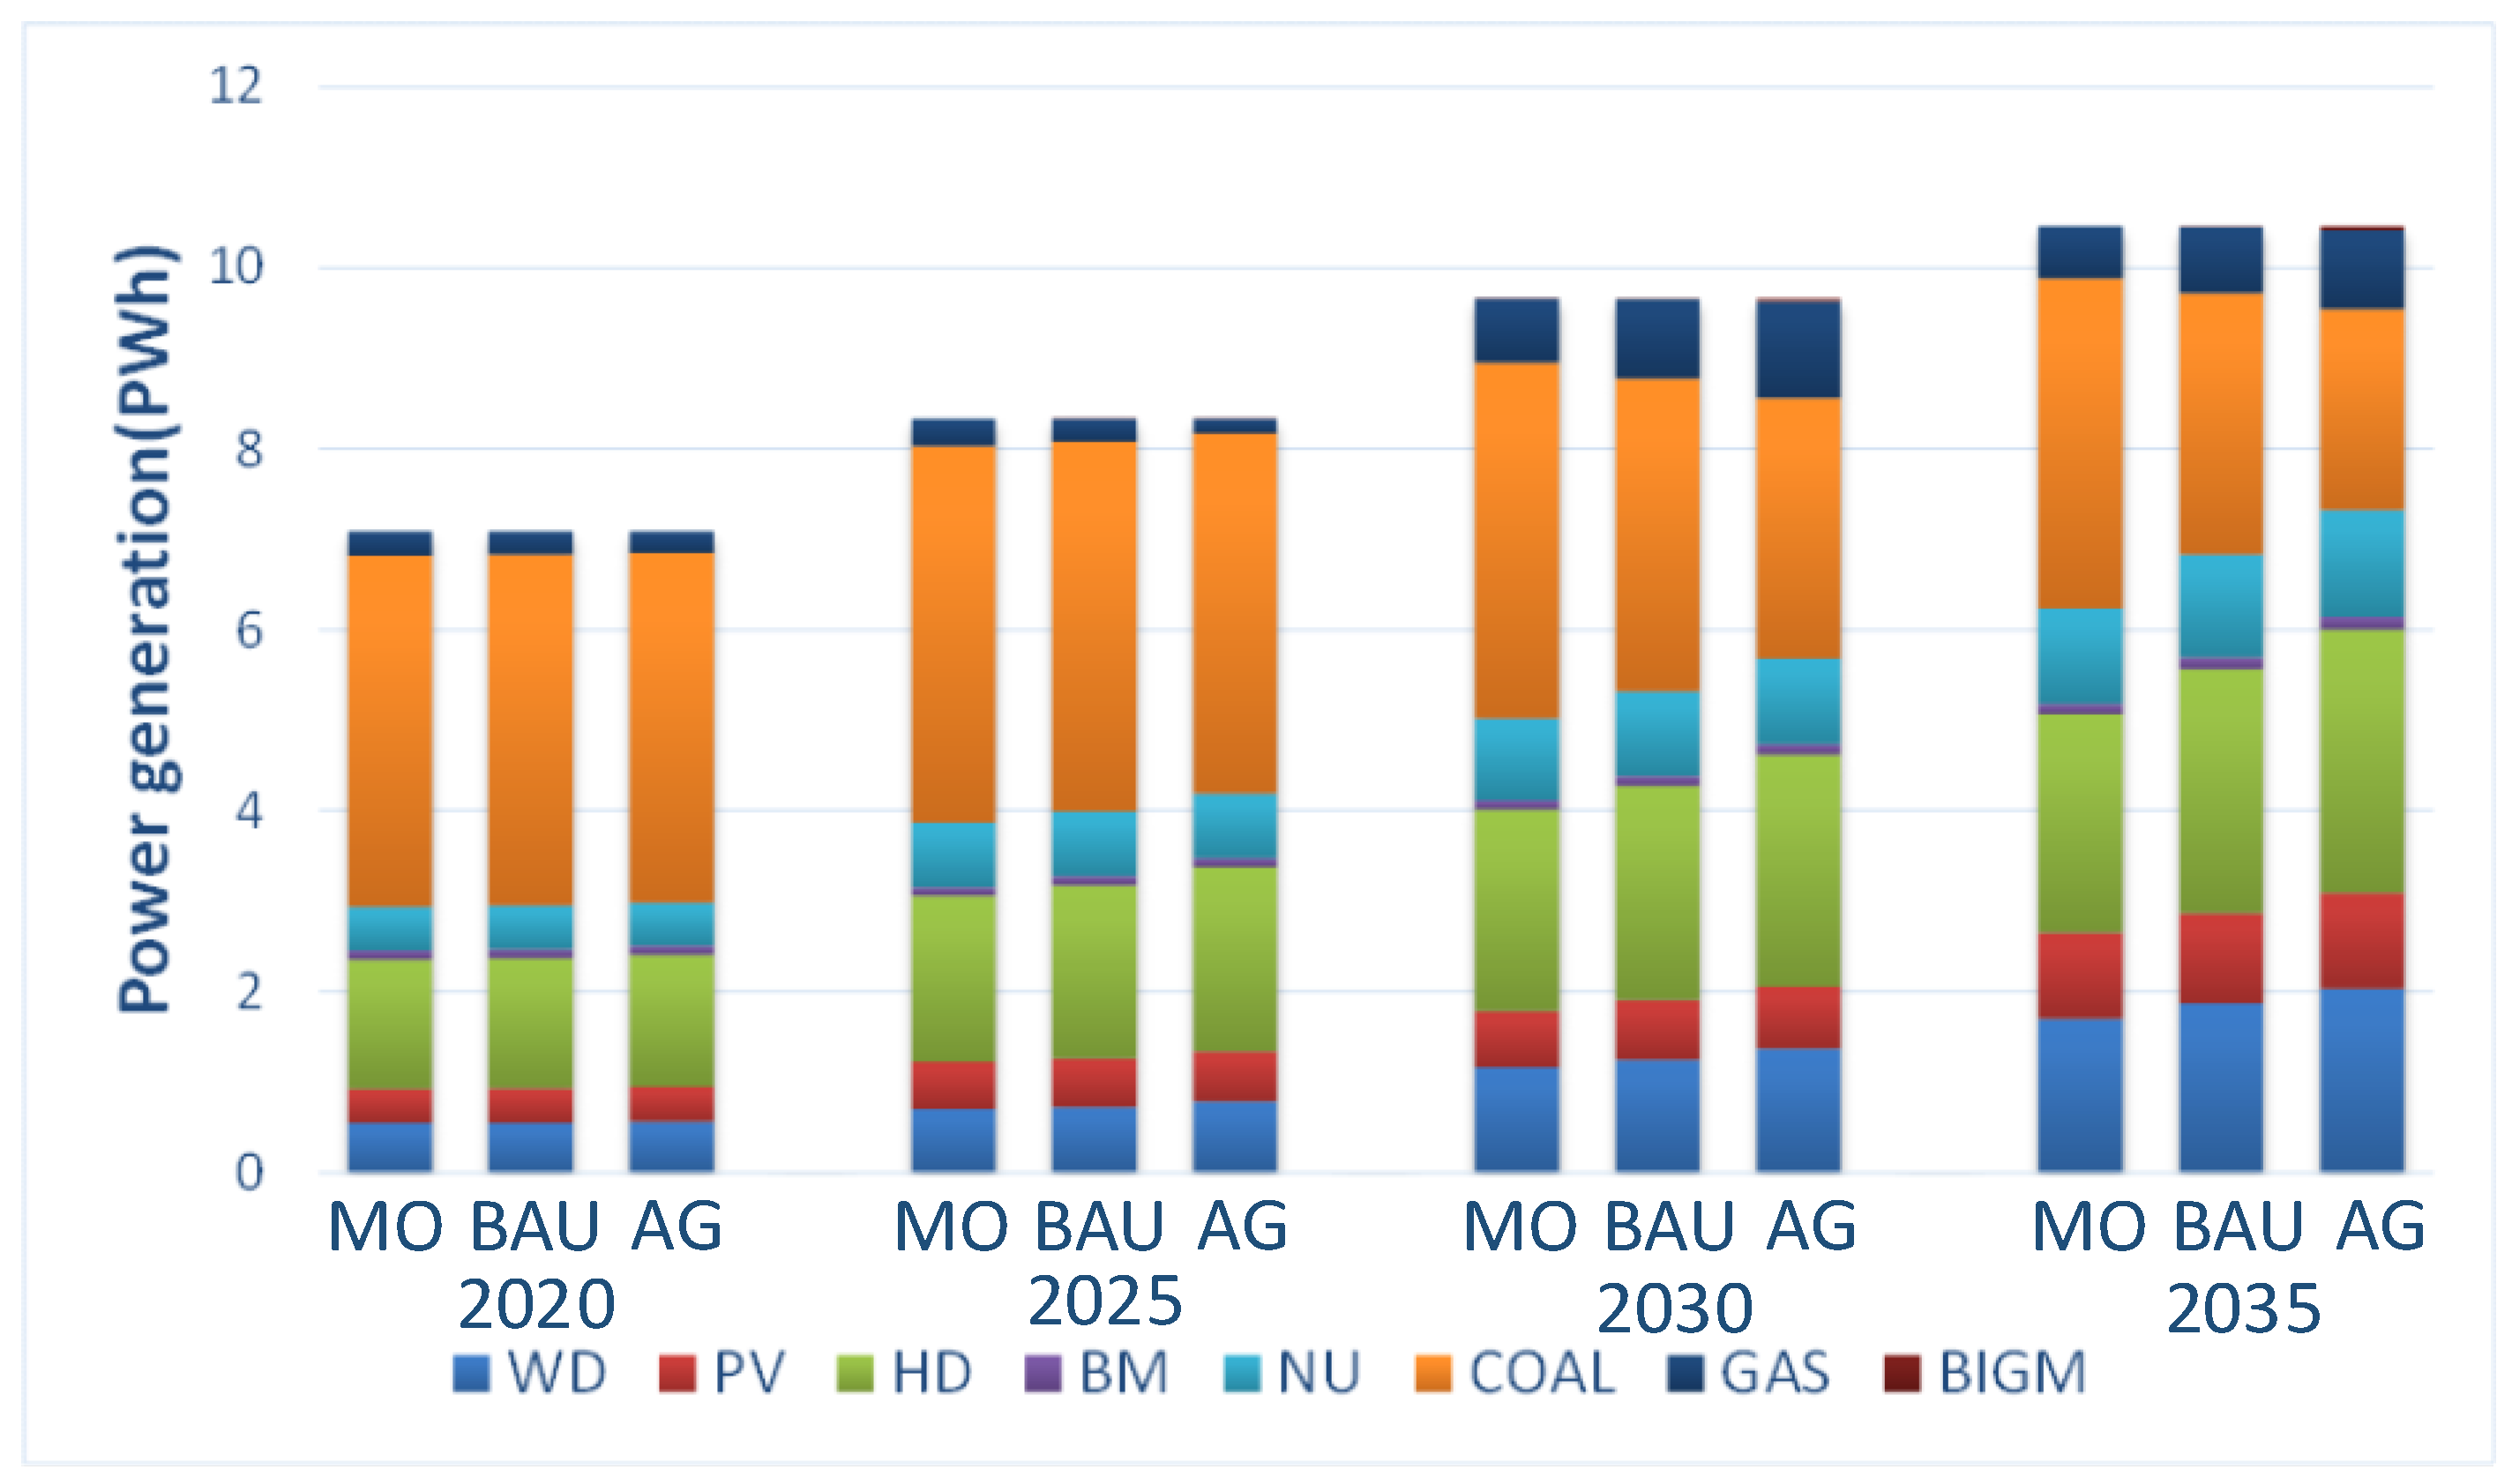
The power generation structure under different power marketization scenarios is shown in Figure 4. During the planning period, the proportion of non-fossil energy power generation is increasing. By 2025, the non-fossil energy generation accounts for 46.3%, 47.8% and 50.3% of total power generation in the MO, BAU and AG scenarios, respectively, and the gap between non-fossil energy generation in different scenarios is increasing. The higher the marketization ratio, the greater the proportion of non-fossil energy. As the electricity market adopts the economic dispatch mode, the generation technologies are dispatched, from a low to a high marginal cost, until the power demand is met. Non-fossil energy generates electricity with priority due to its low marginal cost, while the thermal power units are finally scheduled due to its high marginal cost, so the proportion of thermal power generation reduces with the electricity marketization process. In 2030, as the carbon price changes the scheduling order of the thermal power units, the gas-fired units take precedence over the coal-fired units to generate electricity. Therefore, the proportion of gas-fired power generation increases significantly, and the proportion of coal-fired power generation decreases during the 2030–2035 period.
In order to meet the commitments of the Paris Agreement, the government implemented a series of policies in order to improve the energy structure, reduce coal consumption and increase clean energy supply. Therefore, in future power generation installation plans for the power industry, the proportion of thermal plants installed capacity is reduced, while the proportion of renewable energy installed capacity is continuously increasing. As the proportion of non-fossil energy installed capacity increases, it can meet the demand for electricity in more time, that is, it can provide the base load demand, thus greatly inhibiting the power generation of thermal plants. In the BAU mode, the proportion of gas-fired power generation decreased from 9.1% to 6.9%, and the proportion of coal-fired power generation decreased from 35.8% to 27.7% between 2030 and 2035. Moreover, the comparison of the electricity generation structure under three electricity marketization modes shows that the implementation of power marketization plays a more significant role in promoting the proportion of non-fossil energy generation.
The future development of renewable energy is shown in Table 12 under the MO scenario, in which the electricity market ratio is unchanged during the planning horizon, and the proportion of RES power generation increases due to the expansion of the installed capacity of renewable energy. Comparing the RES share under moderate, BAU, and aggressive electricity marketization scenarios over the planning horizon, renewable energy is preferentially scheduled, as its marginal cost is close to zero in the electricity market. Comparing with the MO and AG scenarios in 2035, the electricity market share increases from 30% to 90%, and the RES share increased by 2.06%. Thus, the advancement of the electricity marketization process increases the proportion of renewable energy, and the proportion changes in the three scenarios can be seen more and more obviously during the planning horizon.
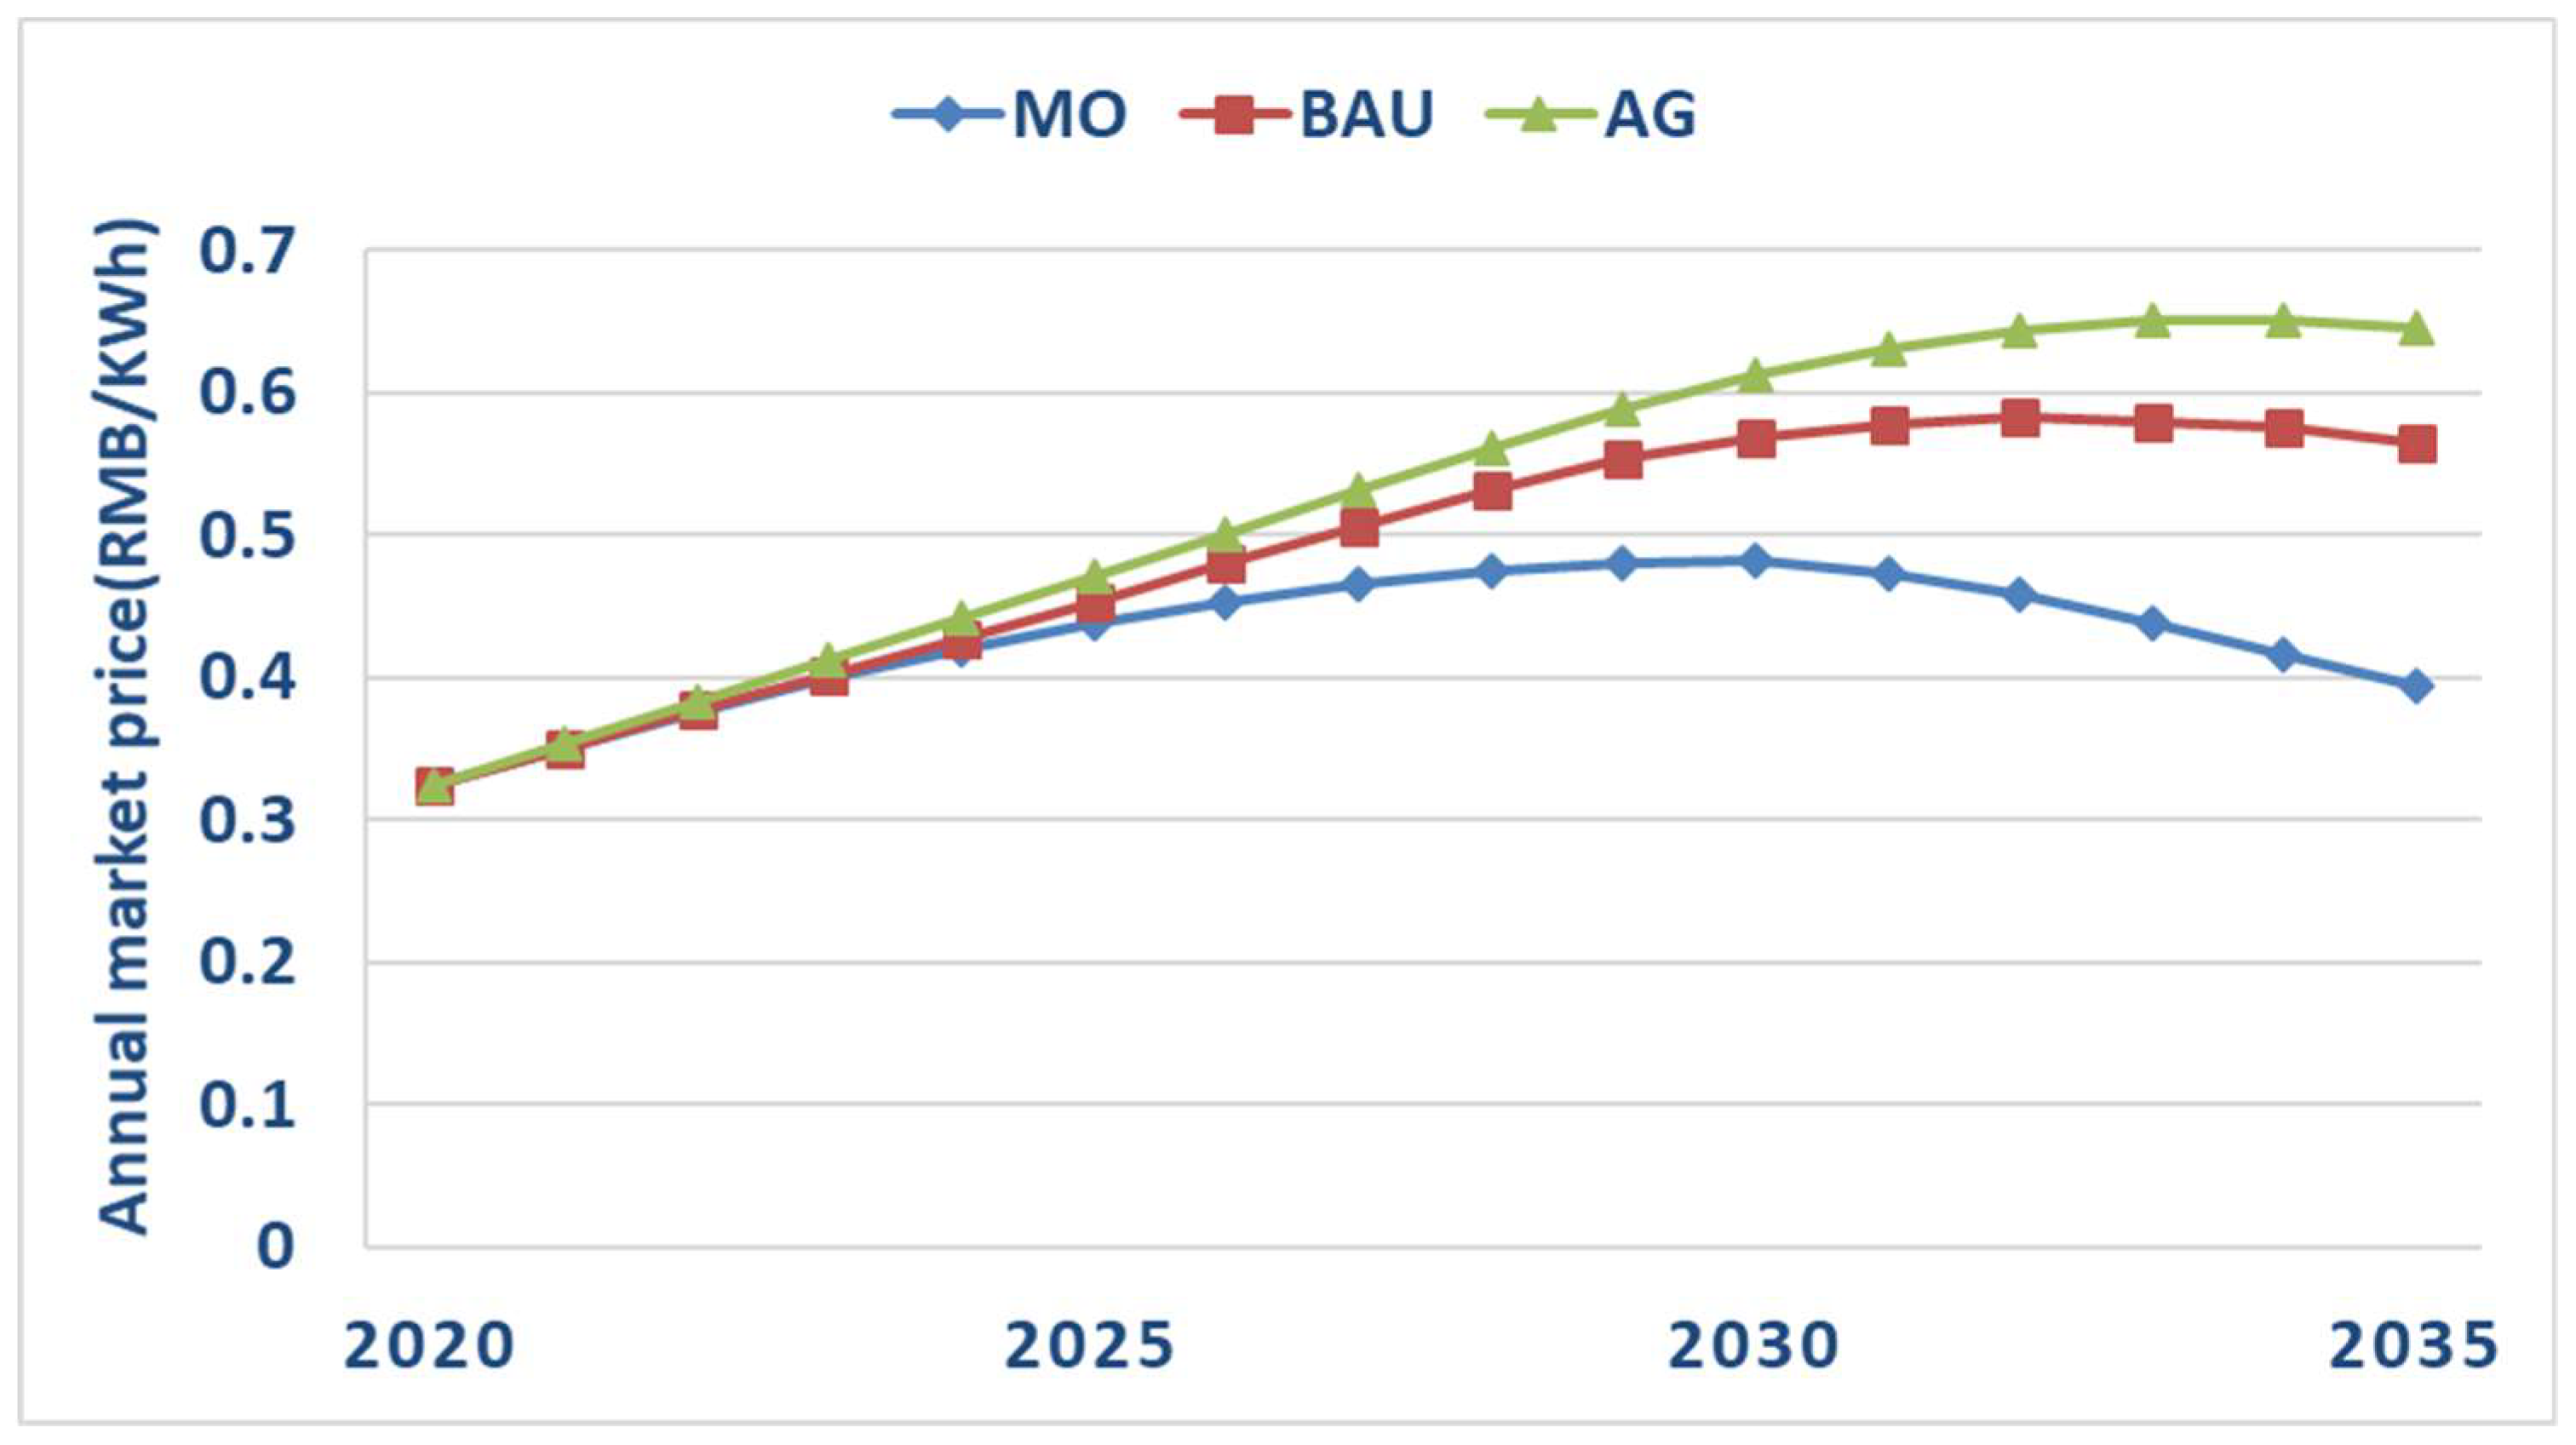
The annual average electricity market price under the MO, BAU and AG electricity marketization scenarios during 2020–2035 is illustrated in Figure 5. In the MO mode, that is, when the electricity market share remains at 30%, the annual average electricity price in the electricity market starts at 0.32 RMB/kWh, grows slowly to 0.48 RMB/kWh in 2030, and then decreases to 0.39 RMB/kWh. This is due to the implementation of the BAU carbon policy. The growing carbon price will increase the marginal cost of the thermal power units, which, in turn, leads to an increase in the average annual electricity price of the electricity market. However, with the continuous expansion of renewable energy installed capacity in the planning horizon, a larger proportion of renewable units are preferentially dispatched and used as the base load, and this will suppress the thermal power generation. As the thermal power units reduce the power generation and turn to take on more peaking, the annual electricity market prices will fall.
Comparing the three power marketization scenarios, the annual average electricity price increases with the rising market share in the same year, which is caused by the call for more thermal power units with a high marginal cost in the electricity market. As shown in Table 13, the annual operating hours of coal, gas and BIGM increase with the degree of marketization. A further analysis of the different electricity distribution methods of the planned part and market part in the electricity sector, which influences the annual average electricity price, is discussed. The planned electricity is distributed according to the annual operating hours of power technologies, as shown in Table 3, and this determines the higher power generation of thermal power units in the planned electricity part. The electricity market part is based on an economic dispatch according to the marginal cost of power technologies, from low to high. Therefore, the thermal power units with a high marginal cost are less dispatched. However, with the promotion of a market-oriented reform process, the electricity demand in the electricity market is increasing, non-fossil energy cannot meet the electricity demand most of the time, more and more thermal power units need to generate electricity in the market part, and the number of hours that BIGM needs to be called for to peak in the event of a shortage of electricity is increasing. That is, the number of hours of thermal power units in the market part will increase with the expansion of the electricity market, and the electricity prices will rise accordingly. Furthermore, as the proportion of renewable energy installed capacity increases continuously during the planning horizon, more and more renewable units with a low marginal cost are preferentially called for, and that makes the annual average electricity price in the electricity market decline. However, the higher the degree of power marketization, the slower this turning point appears.
The load factors for technologies under different power marketization scenarios is shown in Figure 6. Compared with the regulated “equal shares” electricity generation dispatch mode, the capacity factors of non-fossil energy are generally increasing with the implementation of the electricity market, and the greater degree of marketization, the more obvious the increase in the capacity factors, while the capacity factors of thermal power units decrease significantly. In particular, the capacity factor of gas-fired units suddenly increases in 2035, because the carbon policy changed the scheduling order of the thermal power units, and gas-fired units were superior to coal-fired units.
With the electric power market system developing and modifying quickly, coal consumption has been reduced, promoting the transformation toward clean energy and playing a positive role in promoting carbon emissions reduction. As shown in Table 14, it is obvious that the AG electricity marketization scenario results in the lowest CO2 emission rate (210.00 gCO2/kWh), with the BAU scenario a close second (259.39 gCO2/kWh) and MO scenario third (315.16 gCO2/kWh) in 2035. In the case of the MO scenarios, with a constant market share, carbon emissions first grow slowly and then decline. On the one hand, this is because the rising proportion of renewable energy installed capacity suppresses the thermal power generation. On the other hand, the carbon price changes the dispatching order of thermal power units, and gas-fired units have priority in generating electricity, compared with coal-fired units, after 2030. With the improvement of the marketization scenarios in the same year, the total carbon emissions and carbon emission intensity of the electricity sector both decreased, and with the expansion of marketization, the effect of carbon emissions reduction has become increasingly obvious during the planning horizon, so that the carbon emissions reduction target is further realized.

4.3. The Impact of Thermal Unit Reserve Capacity Adjustment

A comparison of the load factors for thermal power units, under the BAU and AG scenarios, is shown in Table 15. The reduction of the thermal unit reserve capacity increases the load factor of the preferentially scheduled thermal power units. Therefore, the load factor of the coal-fired units increased before 2030; and after 2030, the load factor of gas-fired units increased. Moreover, the power generation cost of thermal power units decreases as its load factor increases.
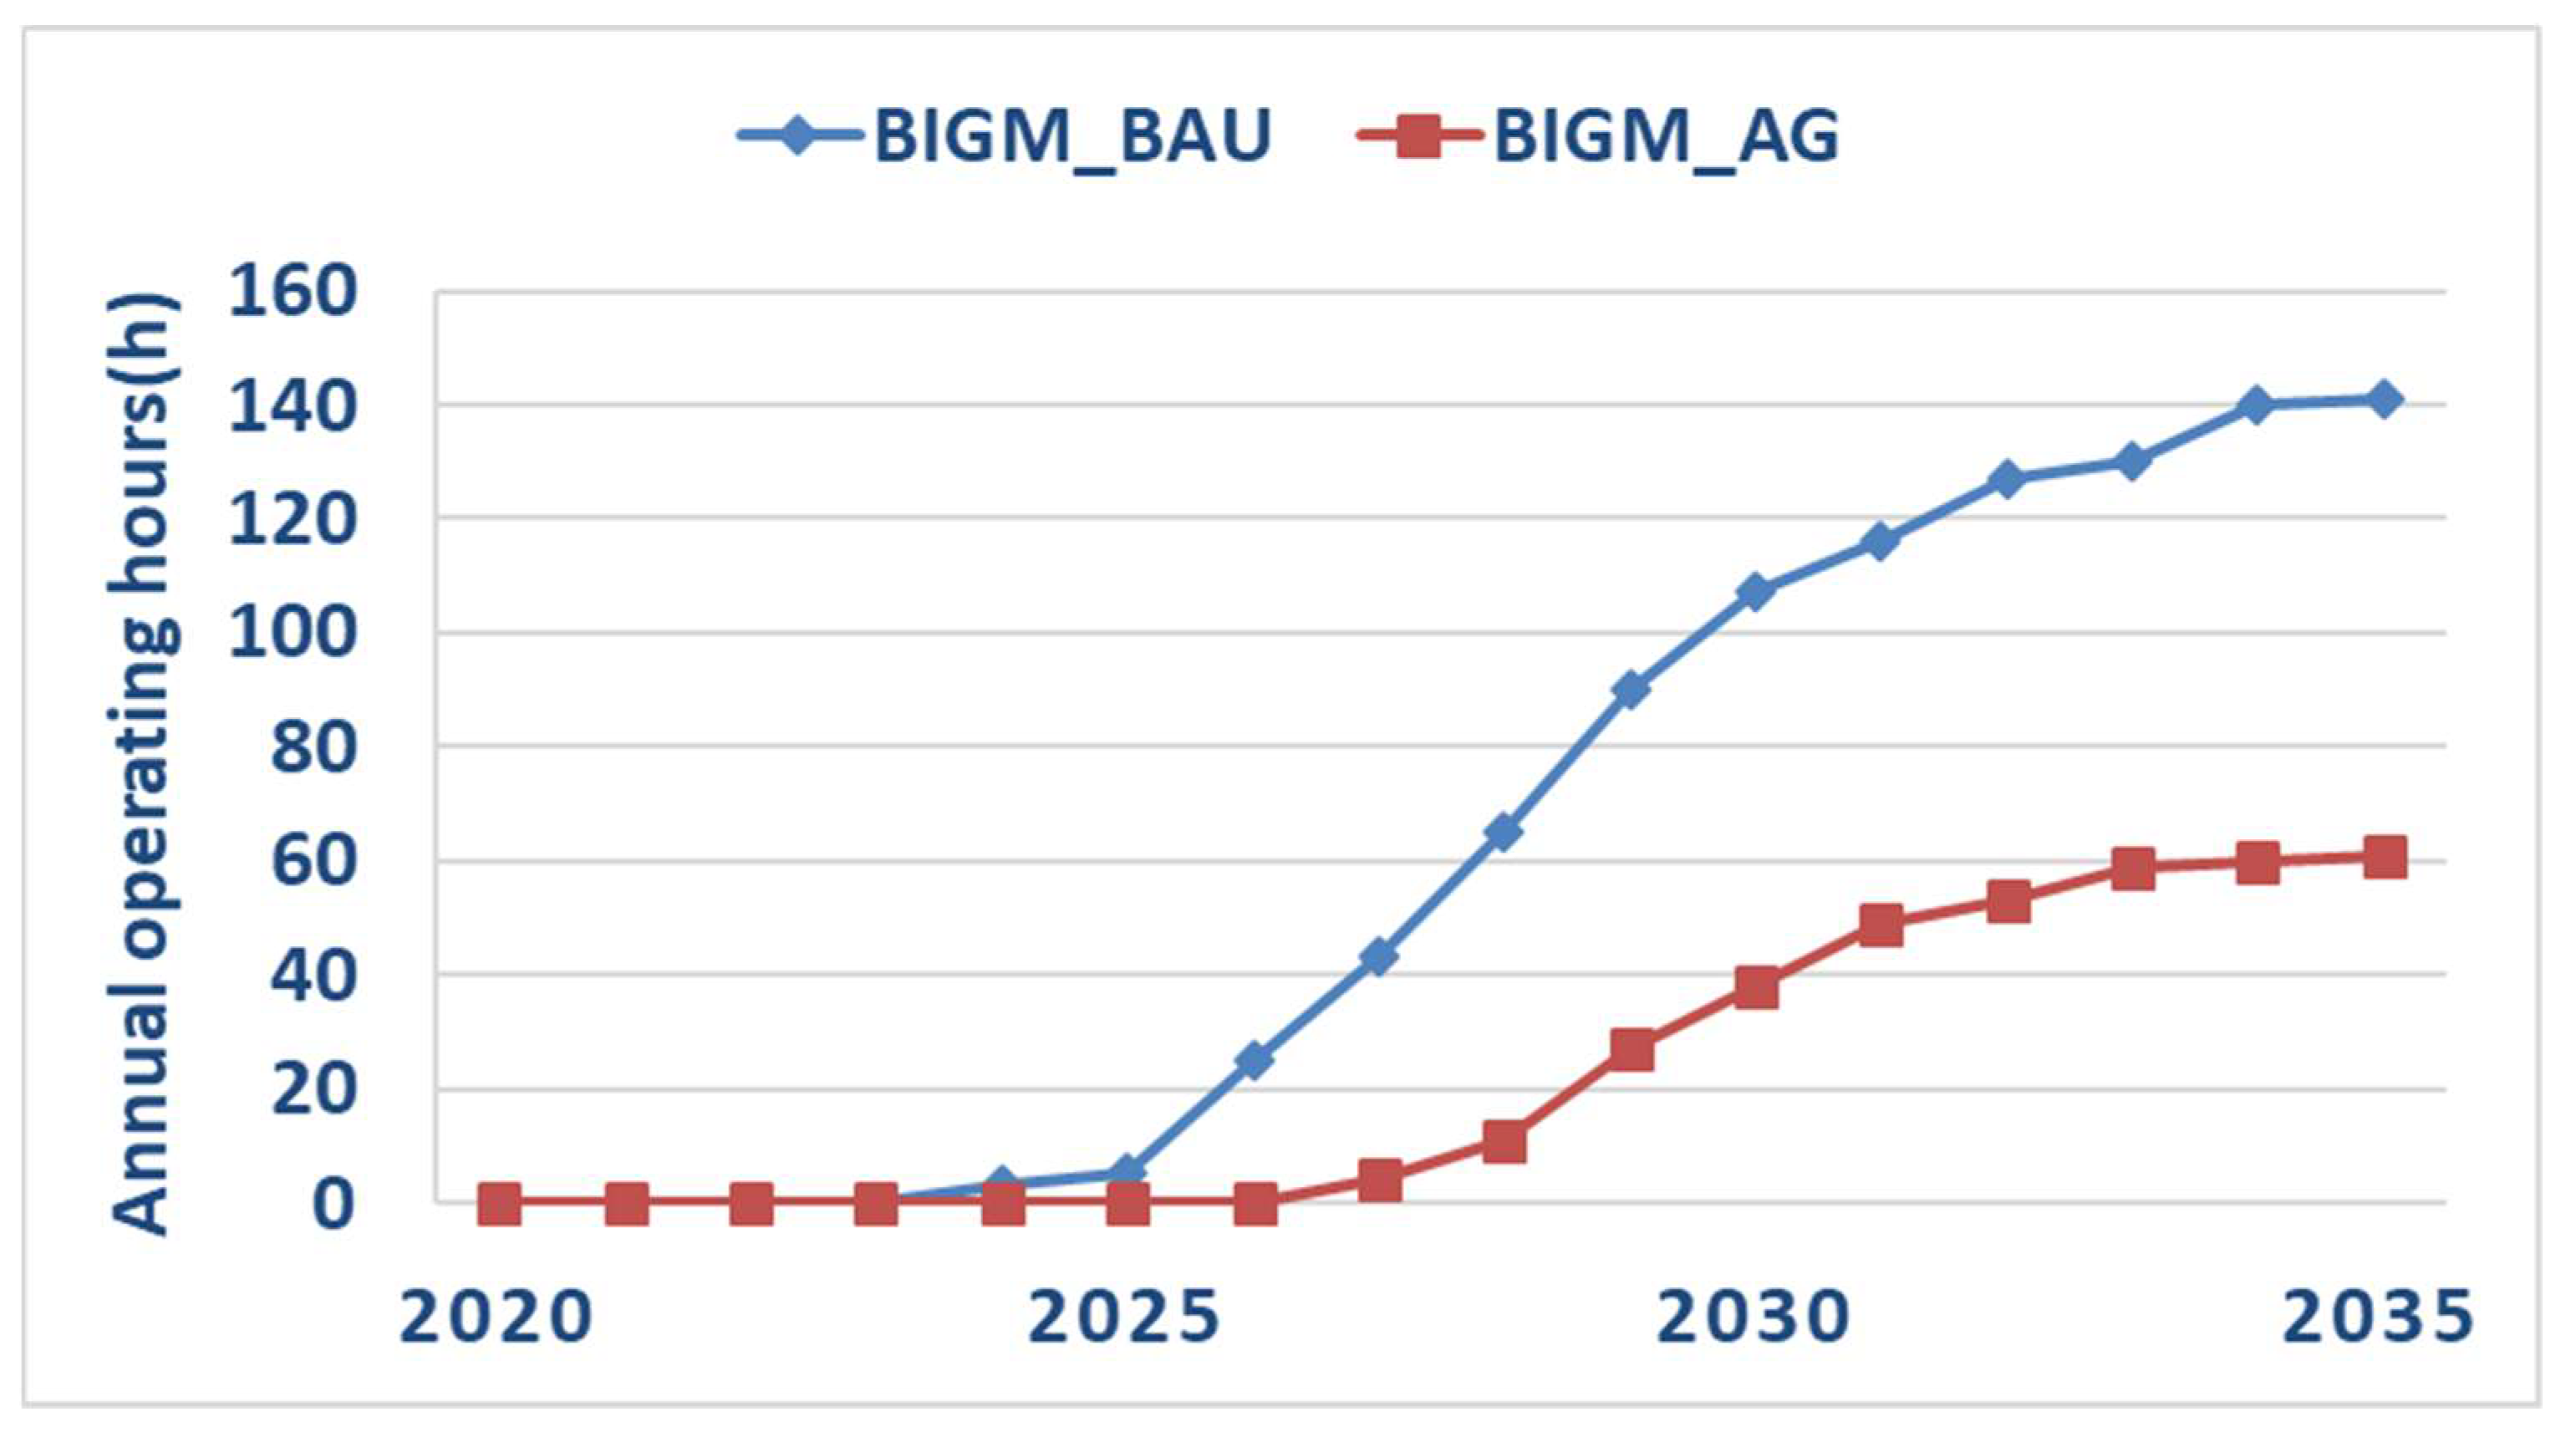
As shown in Figure 7, the number of hours for calling high-cost BIGM is 141 h in the MO reserve capacity adjustment scenario and 61 h in the AG scenario in 2035. As the reserve capacity of thermal power units is reduced, thermal power units can generate more electricity during the peak period in the electricity market. Thus, compared to the BAU scenario, the utilization hours of BIGM are greatly reduced in the AG scenario, which means that the shortage of electricity has been released. Moreover, as shown in Figure 8, the annual average electricity price also decreases with the reduction in the number of hours of BIGM.

4.4. The Impact of Carbon Policy

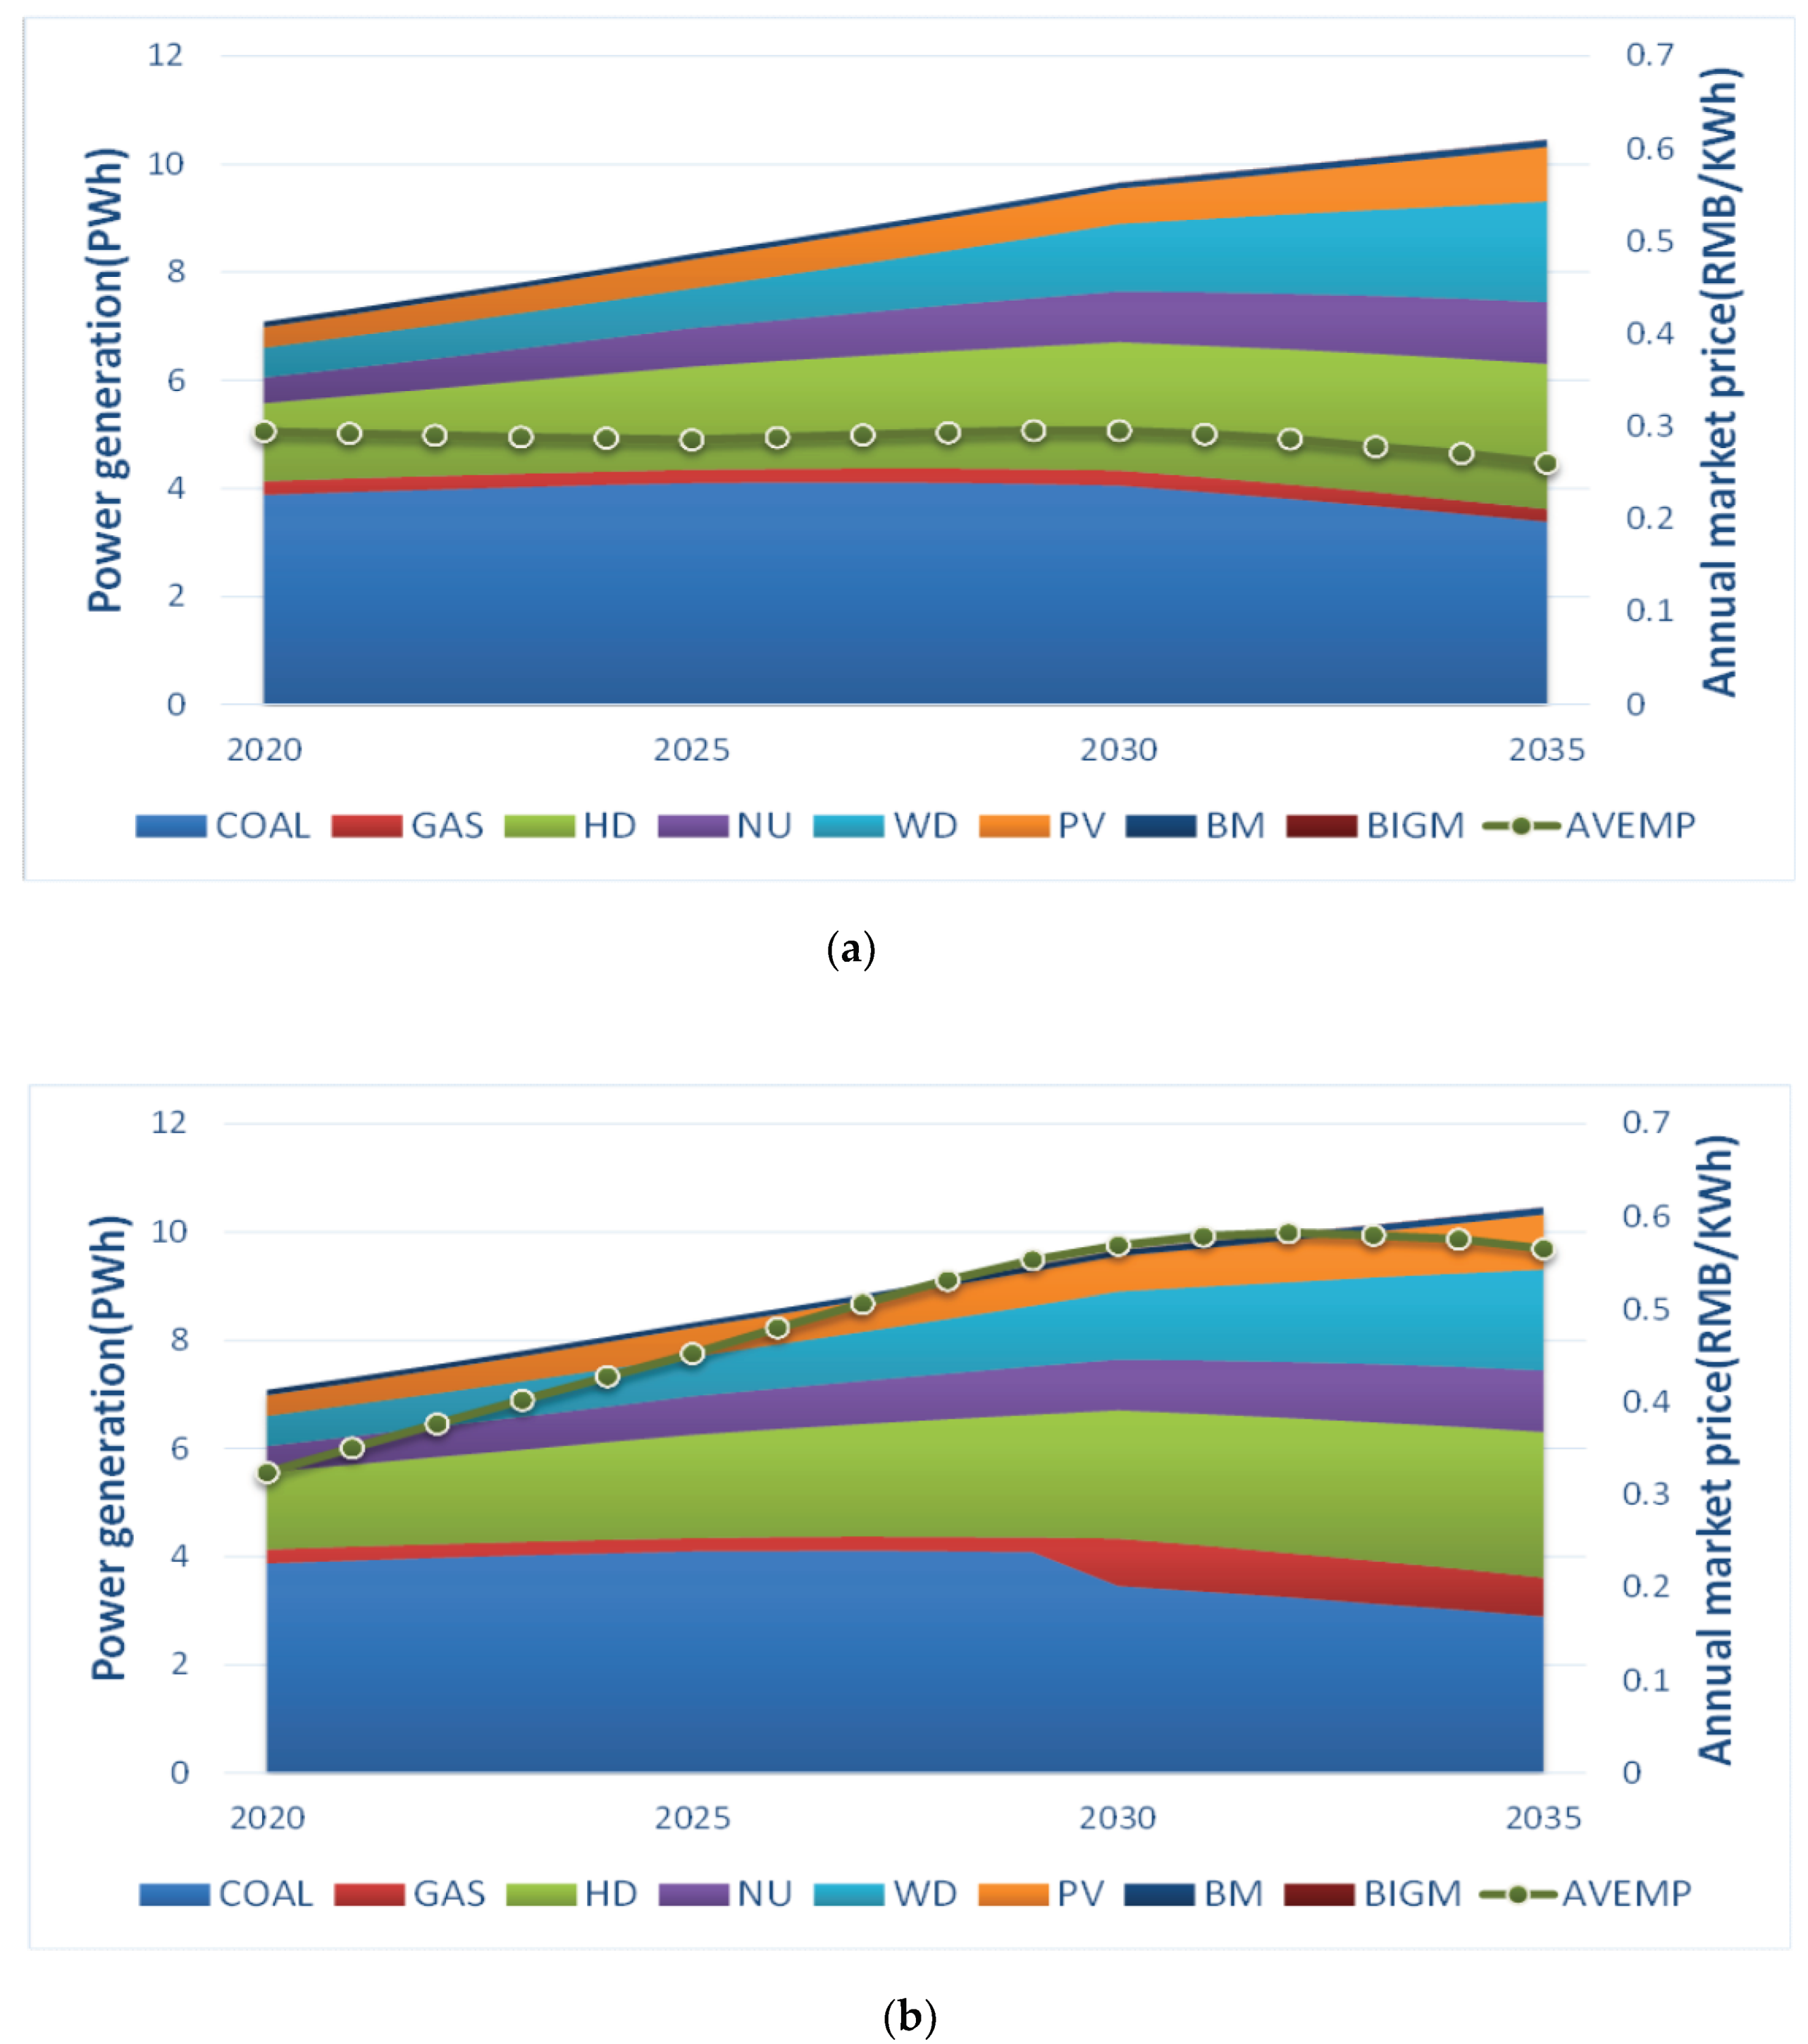
China’s electricity generation mix and market average electricity price, under the two carbon policies, are shown in Figure 9. It can be seen that non-fossil energy generation continues to increase over time, especially for renewable energy generation, while the power generation of thermal power units gradually slows down and then shows a downward trend after 2030. In MO carbon policy, the annual power generation of coal-fired units is 3.38 PWh in 2035, while in the AG mode, part of the coal-fired generation is displaced by the gas-fired units, and the annual power generation of the coal-fired units is 2.90 PWh. As the renewable energy with a low marginal cost is being more often scheduled to generate electricity in the planning horizon, under the MO carbon policy scenario, the carbon price remains unchanged, and the average annual electricity price in the electricity market shows a downward trend in the fluctuation. Under the BAU carbon policy scenario, the rising carbon price directly increases the marginal cost of the thermal power units, which leads to an increase in the annual average electricity price. While with the increasing proportion of renewable energy installed capacity and power marketization under the BAU electricity market scenario, renewable energy with a low marginal cost has an inhibitory effect on the rise of the electricity price, as a result, the annual average electricity declined after 2032.
A comparison of the carbon emissions, intensity and revenue in the electricity sector, under two carbon policy scenarios, is shown in Table 16. Since the specific classification and internal transformation of coal-fired units are not considered, the carbon price only affects the order of coal and gas. In 2030, the carbon price changes the original order of coal-fired units and gas-fired units, and the gas-fired units are prioritized. The gas-fired units displace part of the coal-fired generation and the carbon emissions reduction occurs thereafter. The revenue from the carbon market is used to transform and eliminate old inefficient thermal power units, implement carbon emissions reduction technologies, encourage energy efficiency management and so on, thus contributing to the realization of carbon emissions reduction targets.

4.5. The Comparison of the Scenerios

Table 17 and Table 18 below display several key output variables for each of the four policy scenarios in 2035. For the demand response policy rows, the BAU and AG columns in the table correspond to the business as usual and aggressive demand response modes, respectively. For the power marketization process scenarios, the values in the MO, BAU and AG columns correspond to the moderate, business as usual, and aggressive power marketization policies, respectively. For the reserve capacity adjustment of thermal power unit scenarios, the values displayed in the BAU and AG columns correspond to the business as usual and aggressive reserve capacity adjustment policies, respectively. For the carbon policy scenarios, the values displayed in the MO and BAU columns correspond to the moderate and aggressive carbon taxes, respectively. Correspondingly, all of the outcomes in the table, associated with a given type of policy scenario are based on the BAU mode of the other three types of policy scenario.
The broad trends observed in Table 17 and Table 18 are consistent with the analysis in the above four sections. As discussed fully in the subsections above, four types of policy have reduced coal consumption, promoted the transformation of clean energy, and played a positive role in the promotion of carbon emissions reduction. The most striking results involve the power marketization process and carbon policy. Compared to the other three types of policies, the influence of the power marketization process on renewable energy addition is most notable. As the electricity market process mode transfers from the MO to AG mode, the proportion of renewable energy increases from 25% to 30%, and carbon emissions reduction decreases by 1099.92 Mt. The superiority of carbon taxes over the other three types of policy effectively changes the scheduling sequence of coal-fired power units and gas-fired power units. As the carbon policy mode changes from the MO to BAU mode, the coal capacity factor decreases from 34% to 29%, while the gas capacity factor increases from 17% to 53%. Coal-fired generation is effectively shut down under the BAU carbon policy scenario.

5. Conclusions

This paper established a load dispatch model based on “equal shares” in the planned electricity part and economic dispatch in the electricity market part. Overall, with consideration of the four influence factors of the demand response, electricity marketization process, thermal power units reserve capacity and carbon policy in relation to China’s future electricity sector, the optimal development path of China’s electricity sector in 2020–2035 is simulated by setting two or three different scenarios for each type of influencing factor. The conclusions drawn from the analysis are as follows:
(1) Demand response plays a role in reducing the peak-to-valley difference of power demand. The positive demand response reduces the frequency of thermal power unit generation in the peak period and avoids the shortage of electricity in the future.
(2) With the advancement of the power marketization process, the power supply of various technologies transforms from the “equal shares” mode to the economic dispatch mode, which is based on a marginal cost, from low to high, so that the proportion of renewable energy generation continues to increase. China’s power marketization process promotes the goal of reducing coal consumption, accelerating energy transformation, and promoting clean energy development.
(3) The economic concept of China’s power market changes the reserve capacity of thermal power units. The thermal power units abandon certain safety requirements and turn to pursue economic optimization. Furthermore, the thermal power units that have a lower marginal cost are preferentially dispatched in order to generate more electricity, which drives down the total cost of power generation.
(4) The carbon policy leverages the competitive dynamics of the wholesale electricity market. While the carbon price has no emissions reduction effect in the planned electricity part, with the electricity marketization process, it changes the marginal cost of various types of thermal power units, effectively changes the scheduling order in the electricity market, and better promotes the generation of gas-fired units and advanced coal-fired units. Meanwhile, the revenues obtained in the carbon market are used for the elimination and transformation of old and inefficient thermal power units and energy efficiency management. Thus, the carbon market promotes the realization of clean energy transformation and carbon emissions reduction targets.
In the long run, as renewable penetration increases, the maintenance of a reliable supply will require the availability of fast-ramping resources in order to address decreases in wind and solar generation, and thermal generation, especially gas-fired generation, may be the most economic fast-ramping resource available. Thus, thermal power units are still required to generate electricity in the future, but they are mainly responsible for peak shaving. The process of power marketization accelerates the pace of the structural adjustment of power generation technology and stimulates the improvement of the ratio of clean energy with a large capacity and high efficiency units. Moreover, the marketization of the power industry will drive the development of the demand response and the adjustment of the reserve capacity for thermal power units, which will greatly reduce the peak electricity shortage and stabilize the market electricity price in the future. While a positive carbon policy can effectively reduce the carbon emissions of the competitive wholesale electricity market, the electricity price is slightly higher, while the carbon emissions revenues from the power industry will have a certain feedback in response to the elimination of old thermal power units and the energy efficiency management. Therefore, the focus of China’s future power industry planning should be to accelerate the pace of power marketization and to formulate a sound carbon policy to reduce coal consumption, accelerate energy transformation, and promote clean energy consumption.

Author Contributions

Conceptualization, P.W.; Writing-Original Draft Preparation, M.L.

Funding

This research received no external funding.

Conflicts of Interest

The authors declare no conflict of interest.

References

  1. China Low Carbon Development Report in 2017. Available online: http://hbw.chinaenvironment.com/zxxwlb/index_54_94219.html (accessed on 9 February 2019).
  2. National Bureau of Statistics of China (NBSC). 2013–2017 China Energy Statistical Yearbook; China Statistics Press: Beijing, China, 2017.
  3. China Electric Council (CEC). 2013–2017 China’s Electric Power Industry Statistical Yearbook; China’s Electric Power Press: Beijing, China, 2017. [Google Scholar]
  4. China Electricity Yearbook Editorial Board. 2013–2017 China Electric Power Yearbook; China Electric Power Press: Beijing, China, 2017. [Google Scholar]
  5. Opportunities, Challenges and Countermeasures for China to Implement the Paris Agreement. Available online: https://www.sohu.com/a/150121338_714210 (accessed on 16 February 2019).
  6. Lin, K.-C.; Purra, M.M. Transforming China’s electricity sector: Politics of institutional change and regulation. Energy Policy 2019, 124, 401–410. [Google Scholar] [CrossRef]
  7. Zeng, M.; Yang, Y.; Wang, L.; Sun, J. The power industry reform in China 2015: Policies, evaluations and solutions. Renew. Sustain. Energy Rev. 2016, 57, 94–110. [Google Scholar] [CrossRef]
  8. The Implementation of National Carbon Market in China. Available online: https://www.sohu.com/a/211653530_611233 (accessed on 23 February 2019).
  9. Cai, W.; Wang, C.; Wang, K.; Zhang, Y.; Chen, J. Scenario analysis on CO2 emissions reduction potential in China’s electricity sector. Energy Policy 2007, 35, 6445–6456. [Google Scholar] [CrossRef]
  10. Sithole, H.; Cockerill, T.T.; Hughes, K.J.; Ingham, D.B.; Ma, L.; Porter, R.T.J.; Pourkashanian, M. Developing an optimal electricity generation mix for the UK 2050 future. Energy 2016, 100, 363–373. [Google Scholar] [CrossRef] [Green Version]
  11. Guo, Z.; Ma, L.; Liu, P.; Jones, I.; Li, Z. A long-term multi-region load-dispatch model based on grid structures for the optimal planning of China’s power sector. Comput. Chem. Eng. 2017, 102, 52–63. [Google Scholar] [CrossRef]
  12. Zhang, D.; Liu, P.; Ma, L.; Li, Z.; Ni, W. A multi-period modelling and optimization approach to the planning of China’s power sector with consideration of carbon dioxide mitigation. Comput. Chem. Eng. 2020, 37, 227–247. [Google Scholar] [CrossRef]
  13. Guo, Z.; Cheng, R.; Xu, Z.; Liu, P.; Wang, Z.; Li, Z.; Jones, I.; Sun, Y. A multi-region load dispatch model for the long-term optimum planning of China’s electricity sector. Appl. Energy 2017, 185, 556–572. [Google Scholar] [CrossRef]
  14. Cheng, R.; Xu, Z.; Liu, P.; Wang, Z.; Li, Z.; Jones, I. A multi-region optimization planning model for China’s power sector. Appl. Energy 2015, 137, 413–426. [Google Scholar] [CrossRef]
  15. Wang, C.; Ye, M.; Cai, W.; Chen, J. The value of a clear, long-term climate policy agenda: A case study of China’s power sector using a multi-region optimization model. Appl. Energy 2014, 125, 276–288. [Google Scholar] [CrossRef]
  16. Li, W.; Zhang, Y.-W.; Lu, C. The impact on electric power industry under the implementation of national carbon trading market in China: A dynamic CGE analysis. J. Clean. Prod. 2018, 200, 511–523. [Google Scholar] [CrossRef]
  17. Dai, Y.; Hu, X.; Jiang, K.; Xu, H.; Zhu, Y.; Bai, Q. Low Carbon Development Pathway for China towards 2050 Scenario Analysis on Energy Demands and Carbon Emissions; Science and Technology Press: Beijing, China, 2009. (In Chinese) [Google Scholar]
  18. Wu, Q.; Peng, C. Scenario analysis of carbon emissions of China’s electric power industry up to 2030. Energies 2016, 9, 988. [Google Scholar] [CrossRef]
  19. Yuan, J.; Xu, Y.; Hu, Z. Delivering power system transition in China. Energy Policy 2012, 50, 751–772. [Google Scholar] [CrossRef]
  20. Adelman, D.E.; Spence, D.B. U.S. climate policy and the regional economics of electricity generation. Energy Policy 2018, 120, 268–275. [Google Scholar] [CrossRef]
  21. Najafi, A.; Marzband, M.; Mohamadi-Ivatloo, B.; Contreras, J.; Pourakbari-Kasmaei, M.; Lehtonen, M.; Godina, R. Uncertainty-Based Models for Optimal Management of Energy Hubs Considering Demand Response. Energies 2019, 12, 1413. [Google Scholar] [CrossRef]
  22. Lu, Z.; Zhang, N.; Wang, Q.; Du, E.; Kroposki, B.; Hodge, B.-M.; Kang, C.; Xia, Q. Operation of a High Renewable Penetrated Power System With CSP Plants: A Look-Ahead Stochastic Unit Commitment Model. IEEE Trans. Power Syst. 2018, 34, 140–151. [Google Scholar]
  23. Cheng, Y.; Zhang, N.; Wang, Y.; Yang, J.; Kang, C.; Xia, Q. Modeling Carbon Emission Flow in Multiple Energy Systems. IEEE Trans. Smart Grid 2018, 3053, 1–13. [Google Scholar] [CrossRef]
  24. Pourakbari-Kasmaei, M.; Mantovani, J.R.S.; Rashidinejad, M.; Habibi, M.R.; Contreras, J. Carbon footprint allocation among consumers and transmission losses. In Proceedings of the 2017 IEEE International Conference on Environment and Electrical Engineering and 2017 IEEE Industrial and Commercial Power Systems Europe (EEEIC/I&CPS Europe), Milan, Italy, 6–9 June 2017; pp. 1–6. [Google Scholar]
  25. Cheng, Y.; Zhang, N.; Lu, Z.; Kang, C. Planning Multiple Energy Systems towards Low-Carbon Society: A Decentralized Approach. IEEE Trans. Smart Grid 2018, 11, 1–6. [Google Scholar] [CrossRef]
  26. Home-Ortiz, J.M.; Melgar-Dominguez, O.D.; Pourakbari-Kasmaei, M.; Mantovani, J.R.S. A stochastic mixed-integer convex programming model for long-term distribution system expansion planning considering greenhouse gas emission mitigation. Int. J. Electr. Power Energy Syst. 2019, 108, 86–95. [Google Scholar] [CrossRef]
  27. Gnansounou, E.; Dong, J. Opportunity for inter-regional integration of electricity markets: The case of Shandong and Shanghai in East China. Energy Policy 2004, 32, 1737–1751. [Google Scholar] [CrossRef]
  28. Wang, Q.; Chen, X. China’s electricity market-oriented reform: From an absolute to a relative monopoly. Energy Policy 2012, 51, 143–148. [Google Scholar] [CrossRef]
  29. Mou, D. Understanding China’s electricity market reform from the perspective of the coal-fired power disparity. Energy Policy 2014, 74, 224–234. [Google Scholar] [CrossRef]
  30. Zhang, S.; Andrews-Speed, P.; Li, S. To what extent will China’s ongoing electricity market reforms assist the integration of renewable energy? Energy Policy 2018, 114, 165–172. [Google Scholar] [CrossRef]
  31. Zhou, K.L.; Li, Y.W. Carbon finance and carbon market in China: Progress and challenges. J. Clean. Prod. 2019, 214, 536–549. [Google Scholar] [CrossRef]
  32. Dormady, N. Carbon Auction Revenue and Market Power: An Experimental Analysis. Energies 2016, 9, 897. [Google Scholar] [CrossRef]
  33. Liu, Z.; Zheng, W.; Qi, F.; Wang, L.; Zou, B.; Wen, F.; Xue, Y. Optimal dispatch of a virtual power plant considering demand response and carbon trading. Energies 2018, 11, 1488. [Google Scholar] [CrossRef]
  34. Benavides, C.; Gonzales, L.; Diaz, M.; Fuentes, R.; García, G.; Palma-Behnke, R.; Ravizza, C. Correction to The impact of a carbon tax on the Chilean electricity generation sector. Energies 2015, 8, 6247–6248. [Google Scholar] [CrossRef]
  35. Zhou, Z.; Zhang, J.; Liu, P.; Li, Z.; Georgiadis, M.C.; Pistikopoulos, E.N. A two-stage stochastic programming model for the optimal design of distributed energy systems. Appl. Energy 2013, 103, 135–144. [Google Scholar] [CrossRef]
  36. Huber, M.; Roger, A.; Hamacher, T. Optimizing long-term investments for a sustainable development of the ASEAN power system. Energy 2015, 88, 180–193. [Google Scholar] [CrossRef]
  37. Li, F.-F.; Qiu, J. Multi-objective optimization for integrated hydro–photovoltaic power system. Appl. Energy 2016, 167, 377–384. [Google Scholar] [CrossRef]
  38. Milligan, M.; Frew, B.A.; Bloom, A.; Ela, E.; Botterud, A.; Townsend, A.; Levin, T. Wholesale electricity market design with increasing levels of renewable generation: Revenue sufficiency and long-term reliability. Electr. J. 2016, 29, 26–38. [Google Scholar] [CrossRef] [Green Version]
  39. Kahrl, F.; Williams, J.; Ding, J.H.; Hu, J.F. Challenges to China’s transition to a low carbon electricity system. Energy Policy 2011, 39, 4032–4041. [Google Scholar] [CrossRef]
  40. Excel Model for Electric Market. Available online: https://repositories.lib.utexas.edu/bitstream/handle/2152/40929/CUEVASTHESIS-2016.pdf?Sequence=1&isAllowed=y (accessed on 9 October 2018).
  41. Zarnikau, J. Successful renewable energy development in a competitive electricity market: A Texas case study. Energy Policy 2011, 39, 3906–3913. [Google Scholar] [CrossRef]
  42. Hui, J.; Cai, W.; Wang, C.; Ye, M. Analyzing the penetration barriers of clean generation technologies in China’s power sector using a multi-region optimization model. Appl. Energy 2017, 185, 1809–1820. [Google Scholar] [CrossRef]
  43. Parrish, B.; Gross, R.; Heptonstall, P. On demand: Can demand response live up to expectations in managing electricity systems? Energy Res. Soc. Sci. 2019, 51, 107–118. [Google Scholar] [CrossRef]
  44. The Analysis of National Electricity Market Transaction in 2018. Available online: http://www.cec.org.cn/guihuayutongji/dianligaige/2019-03-04/189190.html (accessed on 5 March 2019).
  45. Naranjo Palacio, S.; Kircher, K.J.; Zhang, K.M. On the feasibility of providing power system spinning reserves from thermal storage. Energy Build. 2015, 104, 131–138. [Google Scholar] [CrossRef]
  46. Khanna, N.Z.; Zhou, N.; Fridley, D.; Ke, J. Quantifying the potential impacts of China’s power-sector policies on coal input and CO2 emissions through 2050: A bottom-up perspective. Util. Policy 2016, 41, 128–138. [Google Scholar] [CrossRef]
  47. Outlook for China Power Development for 2050. Available online: http://kns.cnki.net/KCMS/detail/detail.aspx?dbcode=CJFQ&dbname=CJFDLAST2018&filename=ZGLN201803007&uid=WEEvREdxOWJmbC9oM1NjYkZCbDdrdWdYWlUycFVQNS80OFQybzBwMDh3USs=$R1yZ0H6jyaa0en3RxVUd8df-oHi7XMMDo7mtKT6mSmEvTuk11l2gFA!!&v=MDIzNDNIWUxHNEg5bk1ySTlGWTRSOGVYMUx1eFlTN0RoMVQzcVRyV00xRnJDVVJMT2ZZdVpzRnlIbVVickxQeXI= (accessed on 9 February 2019).
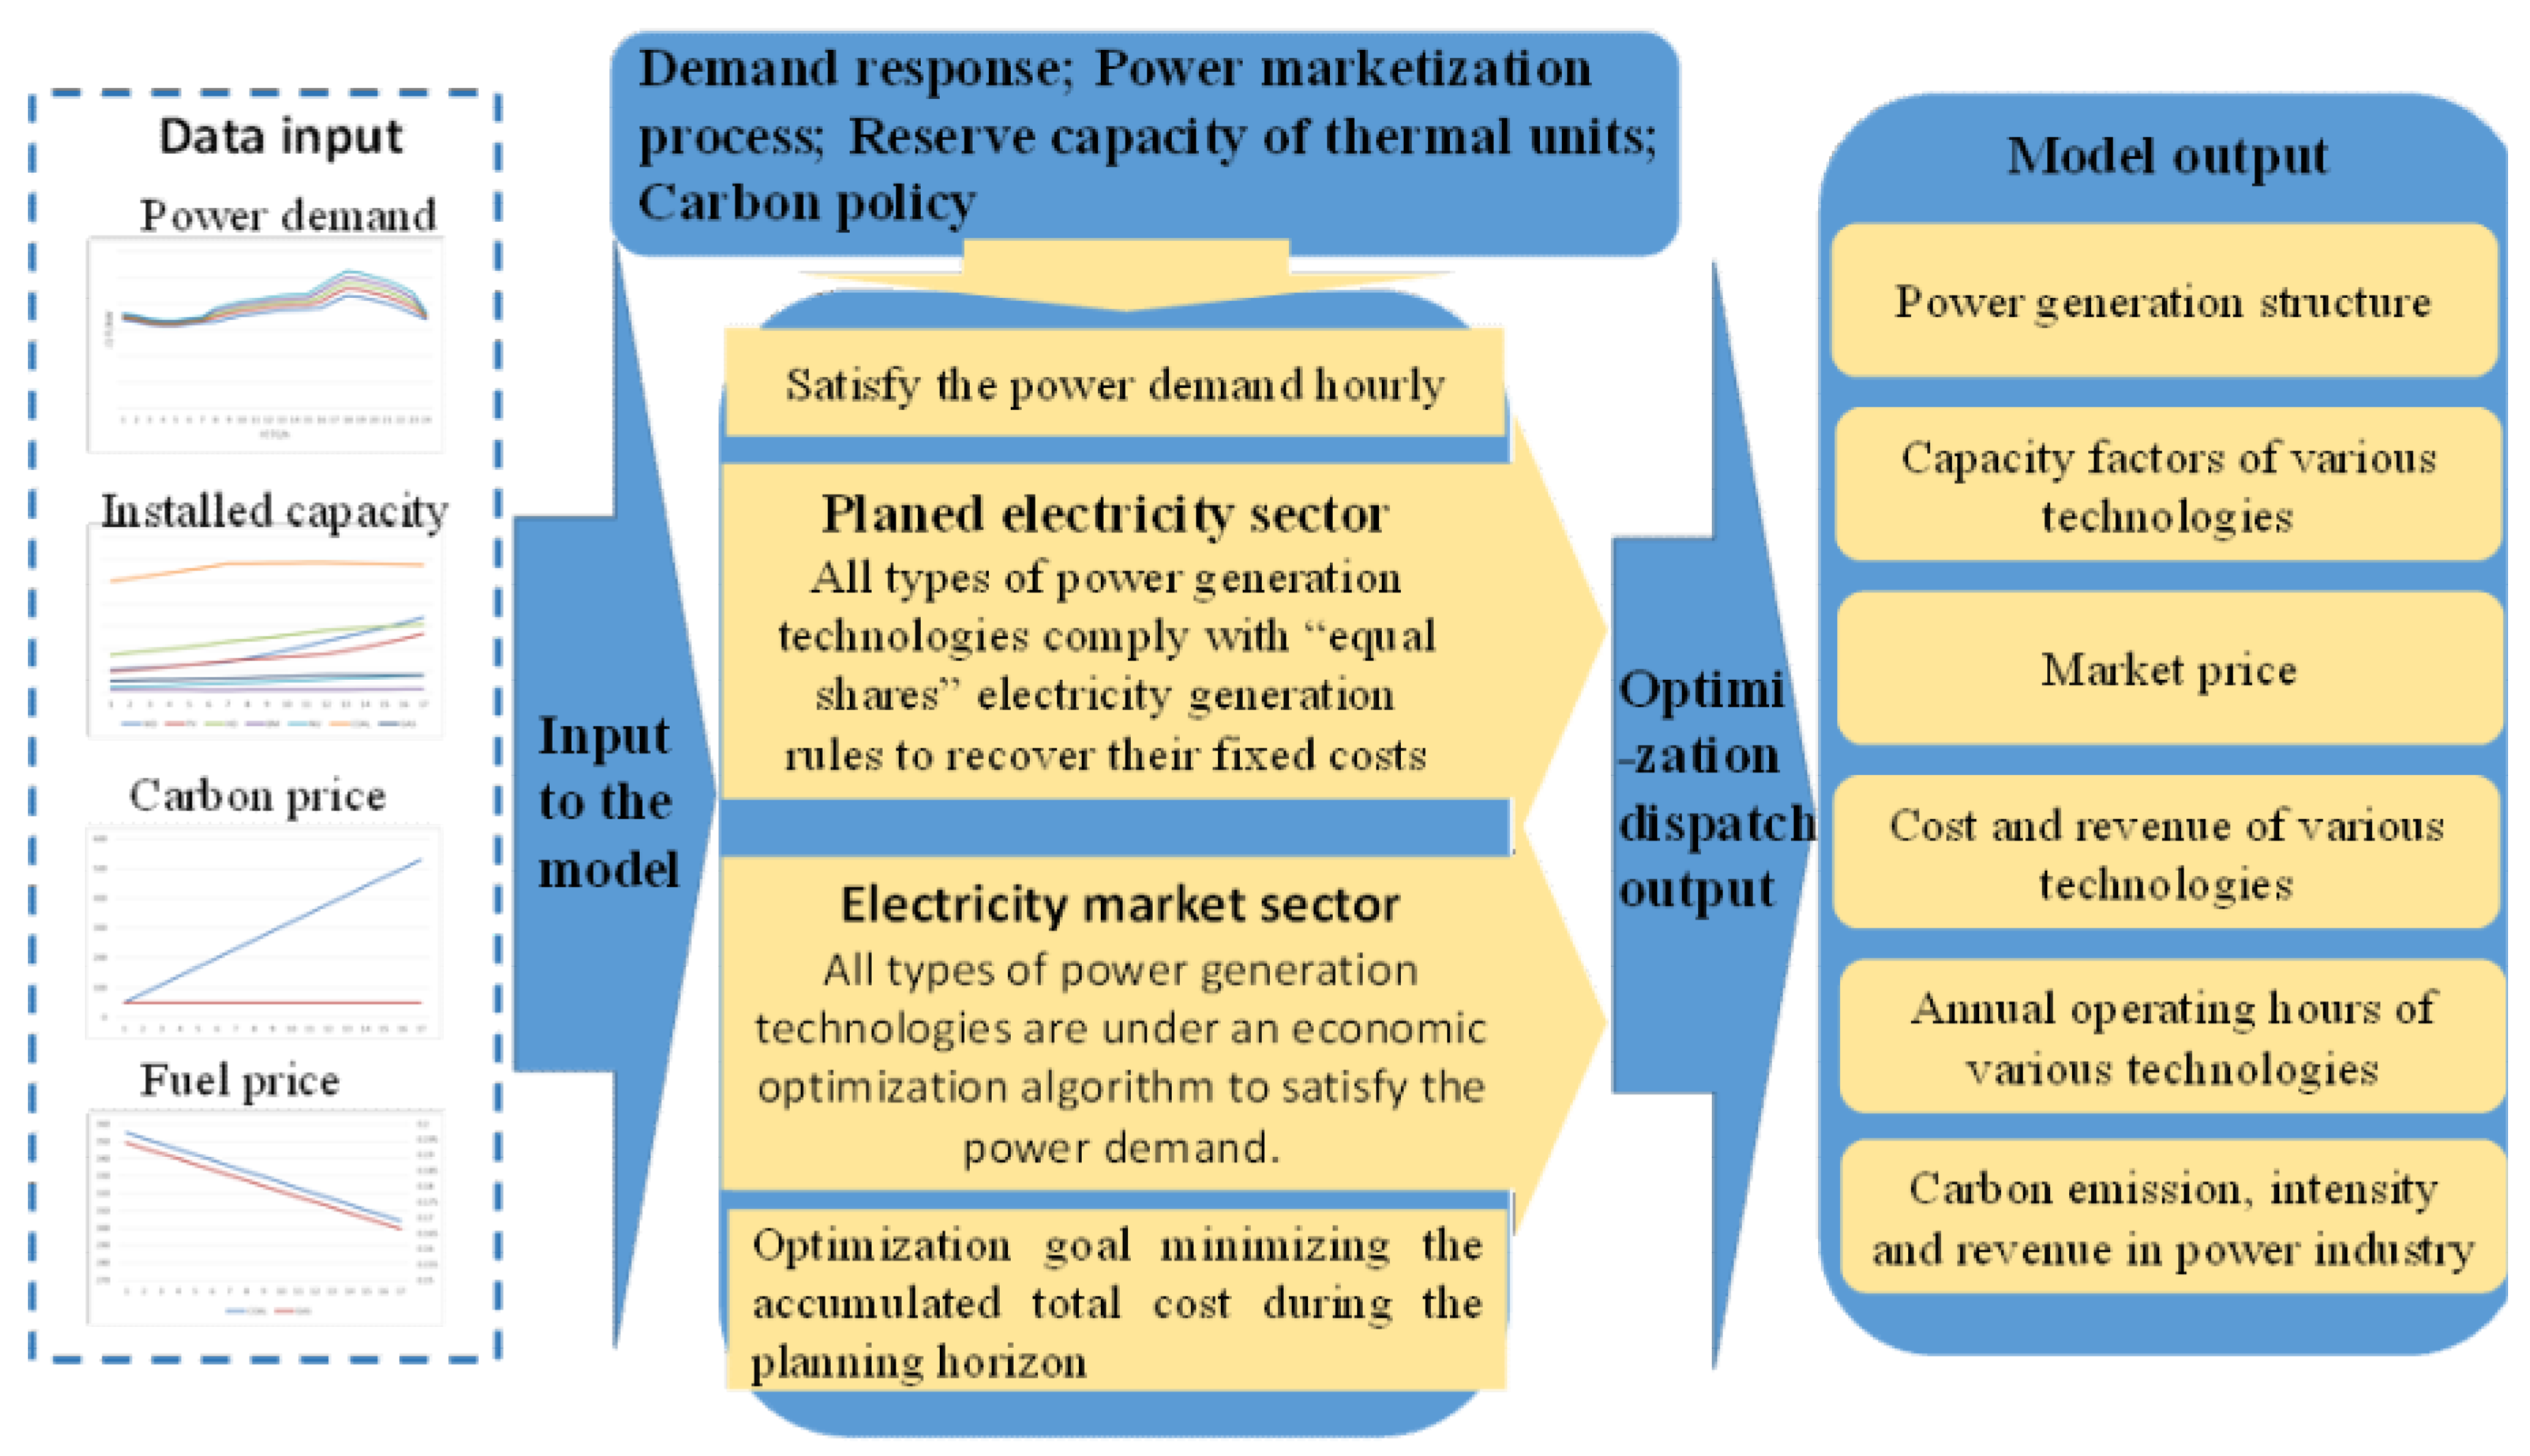
Figure 1. An illustrative structure of the model.
Energies 12 02152 g001
Figure 2. Power generation profiles of China’s electricity market part in a non-typical day during the planning horizon under two demand response scenarios: (a) The BAU demand response scenario; and (b) the AG demand response scenario.
Energies 12 02152 g002
Figure 3. Load factors for the technologies of coal and gas under the BAU and AG demand response scenarios.
Energies 12 02152 g003
Figure 4. Comparison of the national electricity generation structure over the planning horizon under the MO, BAU and AG electricity marketization scenarios.
Energies 12 02152 g004
Figure 5. Comparison of the annual average electricity market price over the planning horizon under the MO, BAU and AG electricity marketization scenarios.
Energies 12 02152 g005
Figure 6. Load factors for the technologies in the total electricity power industry under the planned power generation and the three electricity marketization policies (MO, BAU and AG). (a) Load factors in 2025; (b) Load factors in 2035.
Energies 12 02152 g006
Figure 7. Comparison of the annual operating hours of BIGM under the BAU and AG reserve capacity adjustment scenarios.
Energies 12 02152 g007
Figure 8. Comparison of the annual market price under the BAU and AG reserve capacity adjustment scenarios.
Energies 12 02152 g008
Figure 9. Comparison of China’s electricity generation mix and annual market price between the BAU and aggressive carbon policy scenarios. (a) MO carbon policy scenario; (b) BAU carbon policy scenario.
Energies 12 02152 g009
Table 1. The shares of planned generation and market generation under the moderate (MO), business as usual (BAU and aggressive (AG) electricity marketization scenarios.
Scenario2020202520302035
PlanMarketPlanMarketPlanMarketPlanMarket
MO70%30%70%30%70%30%70%30%
BAU68%32%57%43%48%52%40%60%
AG62%38%34%66%18%82%10%90%
Table 2. The reserve capacity of coal-fired units and gas-fired units under the BAU and AG reserve capacity adjustment scenarios.
ScenarioCOALGAS
BAU20%10%
AG10%5%
Table 3. The carbon price under the MO and BAU carbon policy scenarios
Scenario2020202520302035
MO50505050
BAU80230380530
Table 4. Prediction of the total power demand between 2019 and 2035.
2020
(TWh)
2020–2025
Growth Rate (%)
2025
(TWh)
2025–2030
Growth Rate (%)
2030
(TWh)
2030–2035
Growth Rate (%)
2035
(TWh)
Power demand7085.63.3%8334.53.0%9661.91.6%10460.1
Table 5. Prediction of the installed generation capacity, by technology type, between 2019 and 2035.
Technology Type2020
(GW)
2020–2025
Growth Rate (%)
2025
(GW)
2025–2030
Growth Rate (%)
2030
(GW)
2030–2035
Growth Rate (%)
2035
(GW)
COAL10280.02411590.0021170−0.0041149
GAS1110.0311290.044160−0.005156
HD3600.0514610.0405610.021621
NU610.081900.0591200.059160
WD2200.0502810.1084690.077681
PV2100.0672900.0383490.088531
BM30−0.007290.013310.05240
TOTAL20200.03824390.03228600.0313338
Table 6. Capital cost for the power technologies construction over the planning horizon.
Technology TypeUnitCOALGASHDNUWDPVBM
C A P n , t RMB/kW9000295413,78013,662750065007840
Annual increasing rate%−3−30.110−4−5−2
Table 7. Expected technical lifetimes of the power technologies of all types.
Technology TypeCOALGASHDNUWDPVBM
T n (years)30307060202020
Table 8. Annual operating time of the power technologies of all types.
Technology TypeCOALGASHDNUWDPVBM
O H n (h)5031400034297924209717003372
Table 9. Operation-and-Maintenance costs for the power technologies over the planning horizon.
Technology TypeUnitCOALGASHDNUWDPVBM
v o m c n , t RMB/MWh35351270070
f o m c n , t RMB/kW-year31570580700580515560
Annual increasing rate%−3−30.110−4−5−2
Table 10. Fuel consumption rates of the generation technologies over the planning horizon.
Fuel consumption Rate20192035
COAL (kgce/kWh)2940.1855
GAS (m3/kWh)271.4431830.183
Table 11. BIGM annual operating hours under two demand response scenarios.
Scenario2020202520302035
BAU005359
AG05107141
AG vs BAU055482
Table 12. Comparison of the RES share of the total electricity generation over the planning horizon under the MO, BAU, AG electricity marketization scenarios.
Scenario2020202520302035
MO13.07%14.68%18.52%25.38%
BAU13.15%15.18%19.68%27.45%
AG13.35%16.06%21.21%29.51%
Table 13. Comparison of the annual operating hours of COAL, GAS and BIGM in the electricity market part under the MO, BAU and AG electricity marketization scenarios.
ScenarioCOALGASBIGM
MOBAUAGMOBAUAGMOBAUAG
20208738875087580012000
20258328873187581622210582
20304416613170426693827886843107267
20352820462954624190634772370141316
Table 14. Comparison of the CO2 emissions in the electricity industry under the MO, BAU and AG electricity marketization scenarios.
ScenarioCarbon Intensity (gCO2/kWh)CO2 Emissions (Mt)
MOBAUAGMOBAUAG
2020552.22550.65547.013912.793901.703875.89
2025481.18471.36454.174010.383928.583785.30
2030391.21353.21308.013779.873412.682975.94
2035315.16259.39210.003296.552713.262196.63
Table 15. Comparison of the load factors for coal and gas between the BAU and AG reserve capacity adjustment scenarios.
ScenarioCOALGAS
BAUAGBAUAG
20200.43040.43040.26500.2650
20250.40350.40370.22150.2199
20300.33730.33500.62520.6455
20350.28780.28610.52560.5430
Table 16. Comparison of the CO2 emissions and revenues between the MO and BAU carbon policy scenarios.
ScenarioCarbon intensity (gCO2/kWh)CO2 emissions (Mt)
BAUMOBAU vs MOBAUMOBAU vs MO
2030353.21384.34−31.133412.683713.58−300.9
2035259.39281.81−22.422713.262947.75−234.49
ScenarioCarbon price (RMB/t)CO2 revenue (billion RMB)
BAUMOBAU vs MOBAUMOBAU vs MO
2030380503301296.821856.791111.14
2035530504801438.031473.871290.64
Table 17. RES and CO2 emissions in 2035.
ScenarioRESCO2 Emissions (Mt)
MOBAUAGMOBAUAG
Demand response 27%27% 2713.262636.67
Power marketization process25%27%30%3296.552713.262196.63
Reserve capacity adjustment of thermal power units 27%27% 2713.262708.11
Carbon policy27%27% 2947.752713.26
Table 18. Gas & coal capacity factors in 2035.
ScenarioGas capacity FactorGoal capacity Factor
MOBAUAGMOBAUAG
Demand response 53%57% 29%28%
Power marketization process42%53%63%36%29%22%
Reserve capacity adjustment of Thermal power units 53%54% 29%29%
Carbon policy17%53% 34%29%