1. Introduction
The first studies on fuel poverty were developed at the end of the 1970s and beginning of the 1980s in the United Kingdom, defining the concept as the inability to afford adequate warmth at home [
1,
2]. Since then, this problem has become a focus for social policies with many lessons learnt nowadays, such us the recognition of fuel prices and low incomes as constituent factors and energy inefficiency of households as the final real cause [
3]. Although some solutions have been discussed, this social problem is still growing in many countries [
4].
Energy poverty and fuel poverty are often confused in the literature, but some differences can be highlighted. For example, energy poverty has often been defined as a lack of access to modern energy services—which mostly occurs in developing countries—whereas fuel poverty focuses on the issues of affordability (the energy services are accessible but the problem is to be able to pay for their costs), something that occurs mostly in relatively wealthy countries [
5]. Therefore, in Europe this issue is linked to the affordability problem. In fact, one could say that the different Member States of the EU understand energy poverty as the “impossibility (or difficulty) of households to access the basic energy services so as to ensure decent living conditions at a fair price in relation with income levels” [
6].
Nevertheless, there is still no consensus on what actually constitutes energy poverty. The concept has been recently included in the EU legislation (Directive 2009/72/CE or the more recent decisions and reports, such as Opinion 2014/C174/04 or Resolution 2012/2103(INI)), but there is neither an agreed definition nor a single plan of action to tackle the problem [
7,
8]. Such task has been passed on to the governments of the EU Member States, allowing for solutions adapted to national and local conditions. Still, a difference is made by the European Commission related to the energy sources: energy poverty is a narrower concept than fuel poverty, since fuel poverty covers all energy sources and not only electricity and gas [
9]. Knowing the differences, in this paper we will refer to this issue using the term energy poverty, understood as the problem of affordability of domestic energy consumption and covering all energy sources (electricity, natural gas, liquefied petroleum gas, oil, coal, district heating and other solid fuels).
The Canary Islands is a European outermost region with some special characteristics compared to mainland Spain. The first special characteristic is its geographical isolation (2000 km from the Spanish mainland and 100 km from the Moroccan coast, see
Figure 1). For this reason, the archipelago is more energy dependent than Spain, affecting its economic development (in 2016, the energy dependence reached 98.6% in the Canary Islands, 25% more than Spain) [
10,
11]. Secondly, the Canarian mild climate significantly reduces the expenditure on air-conditioning and heating compared to mainland Spain, and consequently the households’ energy expenditure. For example, the average temperature during year 2017 in the Canary Islands was 20.4 °C, whereas in mainland Spain it was 16.1 °C [
12]. Thirdly, poverty levels in the Canary Islands are relatively higher than in the country. In fact, the Canary Islands had one of the highest rates of poverty in the national autonomous context even before the last economic crisis. A situation that the economic crisis, at least during the hardest years, continued to worsen, as the results of the “at risk of poverty or social exclusion indicator” (AROPE) has exposed [
13]. All of these demarcate a situation in which the results of the indicators for the Canary Islands are less robust and where distinguishing between poverty and energy poverty is more complicated than doing so in Spain.
Although there are some works that study energy poverty in Spain, none of them considers the special case of the Canary Islands [
14,
15,
16]. Aristondo and Onaindia [
14] measure energy poverty in Spain between 2004 and 2015, making a classification according to population density and regions, and using the Spanish survey on Income and Living conditions. They conclude that the levels of energy poverty in Spain are higher in rural areas than in densely populated areas; and the levels are higher in Southern regions than in Northern ones. This study considers the Canaries as one of the regions most affected by energy poverty in 2015, despite being “integrated by densely populated areas” and having “a humid and dry subtropical climate”. They use a quantitative methodology but not income–expenditure based, which is the choice by Romero et al. [
16], whereas the two alternatives are used in the analysis by Phimister et al. [
15].
In this paper, energy poverty in the Canary Islands is measured and compared to Spain (where “Spain” refers to the whole Spanish territory, including all 17 autonomous communities, except the autonomous cities of Ceuta and Melilla). Moreover, an indicator is proposed that might be able to overcome some of the major problems that affect current indicators for a correct comparison—the Compound Energy Poverty Indicator (CEPI). In order to do this, we start by conducting a quantitative analysis based on the so-called income-based energy poverty indicators [
17] calculated from the Spanish Household Budget Survey (EPF) data in the period 2006–2016 [
18]. For this study, we consider the EPF to be the best available database providing a comparison between the energy poverty in Canary Islands and Spain. The lack of robustness observed in the obtained results leads us to propose a new indicator to quantify the energy poverty rate in the Canary Islands, with results that explain the impact of the economic crisis and taking into account not only one threshold for the energy expenditure but also another one for the income.
The contribution of this work is twofold. Firstly, from an empirical perspective, energy poverty in the Canary Islands is measured for the first time. Secondly, CEPI takes into account the special features of the Canaries according to their singularities as recommended by the European Union. Therefore, CEPI could be used in territories with similar circumstances in order to recommend energy policy actions. This work should be considered as a first step in the use of the energy poverty index that we propose; and its generalization should be ratified in future research.
The structure of this work is as follows: In
Section 2 a literature review is presented about energy poverty indicators.
Section 3 describes the database used, pointing out the specificities regarding income and households’ energy expenditure in the Canary Islands compared to Spain. Next, the indicators to be calculated later are briefly defined.
Section 4 focuses on presenting the results obtained for the Canaries using the poverty and energy poverty indicators, and contrasting them with national values. In
Section 5 a specific indicator (Compound Energy Poverty Indicator, CEPI) is proposed to measure energy poverty in the Canaries.
Section 6 summarises the main conclusions.
2. Literature Review
Once energy poverty has been defined in the previous section, we have to deal with the problem of how to measure it, as it is a complex concept of a multidimensional nature. There are different methodologies and indicators proposed in the literature. Some are subjective and qualitative approaches based on personal or third parties’ perceptions of affordable warmth at home (the temperature indicators); whereas others calculate objective and quantitative indicators (according to Heindl’s classification, [
17]).
The temperature indicators were used in the first studies conducted in the United Kingdom when the concept of energy poverty was linked to the incapacity of households to keep an adequate temperature in the house. They are no longer in use mainly due to the lack of consensus on establishing the reference thermal threshold. On the other hand, within the objective and quantitative methodology, these are the most widely used European income-based indicators. The other choice in this methodology would be the non-income–expenditure-based indicators, which consist in the direct observation of the phenomenon, through surveys, on the perception of the household’s members about their home condition and the living conditions of their household. Ideally, according to Heindl [
17], all these indicators should be taken into account when addressing the study of energy poverty in a country, but the group of income-based indicators somehow incorporates, at least partly, the others, being more informative about all aspects of energy poverty [
16].
The percentage of households below the poverty limit is taken into consideration in order to measure poverty rates to compare the two phenomena. The at-risk-of-poverty threshold is set at 60% of the national median equivalised disposable income after social transfers [
19]. Relative poverty has been an academic topic of discussion thoroughly addressed during the second half of the 20th century [
20,
21,
22]. In general, the discussion has been focused on the consideration of individuals in persistent poverty as those who did not earn enough to cover their subsistence needs. More recently; however, the poverty ratio has been better defined as those individuals whose income is below 60% of the median of the region or country. This poverty line is defined as the "economic distance" based on years of measurement of the thresholds of poverty and income in the United Kingdom mainly, without forgetting other European countries and the United States [
23]. Finally, this standard has been endorsed by organizations such as the Organisation for Economic Co-operation and Development (OECD), the European Union or UNICEF, as well as serving as the basis for numerous scientific articles and reports [
17,
19]).
As we have already anticipated, in this work we use the income-based indicators considering the available database for their correct estimation (EPF). These indicators are the most widely used European indicators. These are:
10% Indicator: This was the first indicator used to measure energy poverty [
2]. It considers households to be energy poor if their expenditure on energy is not below 10% of their annual income. This indicator has the advantage of being easy to calculate and understand, and also of being relatively versatile from a pragmatic point of view. However, it is too sensitive to energy prices, lacks reference to household income and the choice of a 10% threshold is arbitrary [
24]. Moreover, under this method, an important number of households could be accounted as energy poor when their large fuel costs correlate with a high income.
Double Median Expenditure (2M): According to this indicator, energy poor households are those whose energy expenditure is higher than or equal to double the median share of households’ energy expenditure (for the first time in [
24]). Share is understood as the quotient of energy consumption divided by household income. This indicator and their variations, all known as 2M indicators, have been revived by the literature due to their statistical interest and their potential to complement the information provided by the 10% rule [
25].
LIHC (Low Income/High Cost): For a household to be energy poor according to this indicator proposed by Hills [
26], it must meet two conditions: (i) to have an energy expenditure higher than the median of all households’ energy expenditure, and (ii) to have a net income, energy expenditure and housing deducted, lower than 60% of the median of all households’ net income (energy expenditure and housing deducted). Both LIHC and 2M indicators take, as a threshold, a measure of central position in the whole of the population, which is an actual inequality measure. The LIHC indicator corrects a gap in the coverage of the 2M and 10% indicators, as it considers not only one threshold for the energy expenditure but also another one for the income; this allows for a distinction between energy poverty and monetary poverty. However, it becomes more complex [
16].
AFCP (After Fuel Cost Poverty): This indicator, also proposed by Hills [
26], defines energy poverty as the situation in which the household net income (energy expenditure and housing deducted) is lower than 60% of all households’ net income median (energy expenditure and housing deducted). AFCP only considers one threshold for income (the same as LIHC). The main advantage of this indicator is that it acknowledges housing costs but has the disadvantage of classifying practically all households with very low income as energy poor, regardless of their energy needs [
27].
MIS (Minimum Income Standard): A household is energy poor according to the MIS if its net income (energy expenditure and housing deducted) is lower than the social insertion basic income or the minimum income allowance (RMI), defined as the “necessary income level to enjoy an acceptable life standard” by Bradsahw et al. [
28]. This indicator is robust with regard to the objective of measuring energy poverty based on income, providing a measurement of energy poverty easily adaptable to different socioeconomic contexts. Despite the fact that it could be one of the most accurate alternatives, it is also the most costly and complicated since the estimation of RMI requires an immense amount of specific data. In particular, it cannot be calculated with the data from the EPF survey. The availability of objective data to determine the RMI in Spain is technically difficult [
16,
29].
The requirements to be met by households to be energy poor, according to each indicator, are summarised in
Table 1.
3. Data Description
The Spanish Household Budget Survey (EPF) was used for the period 2006–2016 in order to calculate the income-based indicators for Spain and the Canaries. The EPF is an annual database on Spanish households, general living conditions, and nature and purpose of the household’s expenditure on consumption, which refers to the monetary and non-monetary flow allocated by the household to specific goods and services, self-supply, allowances and account assignments on indirect expenses [
18]. It is annually conducted by the National Institute of Statistics (INE) since 1997. The data collection method was mixed—direct annotation at home and interviews—and the survey was subject to several quality evaluation controls, which incorporated the requirements and methodological changes of the statistical office of the EU (Eurostat).
This was a representative and very reliable survey from a statistical point of view, covering the whole country. It collected a total sample of in between 22,000 and 24,000 households per year in all Spain, which means a total of 237,957 households for the period 2006–2016. For the autonomous region of the Canary Islands, the sample was usually between 800 and 1000 surveys per year, reaching a total of 10,316 observations for the same period of study.
The two main variables for the calculation of the indicators were income and energy expenditure per household, which were both annual. Energy expenditure included the spending of the main household on electricity, natural gas, municipal gas, and liquid and solid fuels, among others (transportation expenses excluded). These two variables are observed in
Table 2. The average household income in Spain was 13.0% higher than in the Canaries, considering the mean of all the annual percentage increases during the period of study. In fact, Canary Islands had high levels of poverty rates, as it is shown in
Section 4, being one of poorest Spanish Autonomous Regions.
On the other hand, during the analysed period, energy expenditure was on average 43.2% lower in the Canary Islands than in Spain. This difference in expenditure could be explained due to climatic reasons, because of the islands’ geographical location (see
Figure 1). For instance, during year 2017, the average number of days per month when the temperature was under 0 °C in Spain was 4.23, whereas in the Canary Islands it was 0.62. Respectively, the average number of days per month when the temperature surpasses 30 °C in Spain was 10.8, and 3.9 for the Canary Islands [
12]. The fact that cold in winter is not at all significantly extreme reduces the use of heating, as already mentioned in
Section 1. Likewise, the islands maintain milder temperatures in the summer, which means that households spend less in air conditioning [
30]. Based on the results of the characterization report of final energy consumption in the Canary Islands, the percentage of households with air conditioning (heating and cooling) in 2006 was 3.0%, whereas it reached 42.0% in Spain [
31]. More recent data indicates that there were 3.6% of households with heating in the Canary Islands compared to 69.8% of households in the Iberian Peninsula [
18].
From a first analysis of both variables in the Canary Islands and Spain, it is observed that the income of the average household was significantly higher in Spain than in the Canaries, whereas the average energy expenditure was far lower in the islands than in the country. Moreover, based on the available data, it is verified that the Canary Islands is the Spanish Autonomous Region where this latter fact is evidenced in a more extreme manner. As it is shown in
Table 3, Canary Islands was the Autonomous Region with the lowest energy expenditure (−41.9%) and with the third lowest household incomes (−11.8%) compared to Spain. The second and third Autonomous Region with the lowest energy expenditure were the Valencian Community (−14.7%) and Andalusia (−14.2%). In order to evaluate if significant differences exist between household incomes and energy expenditures both in Spain and the Canaries, a hypothesis testing of the difference between two populations’ averages is performed [(H
0:
ĒSpain − ĒCanaries = 0; H
A:
ĒSpain ≠
ĒCanaries) and (H
0:
Ħ Spain − Ħ Canaries = 0; H
A:
Ħ Spain ≠
Ħ Canaries)]. Both tests conclude that there is enough statistical evidence to reject the null hypothesis (
p = 0.000). Thus, the average household income between Spain and Canaries for the period is significantly different. Secondly, in the comparison between energy expenditure, we can test that the null hypothesis of equal means is rejected (
p = 0.000) with t = −28.334. Consequently, the average energy expenditure between Spain and the Canaries for the period was significantly different.
4. Empirical Results of Poverty and Energy Poverty: A comparison of Canary Islands–Spain
In this section, calculations of the indicators for both poverty and energy poverty in the islands were compared to the Spanish values. Then, an analysis was conducted in which the different indicators for poverty and energy poverty were combined to obtain relevant information in order to understand the proposed indicator in
Section 4.
4.1. Poverty Rates
As it can be seen in
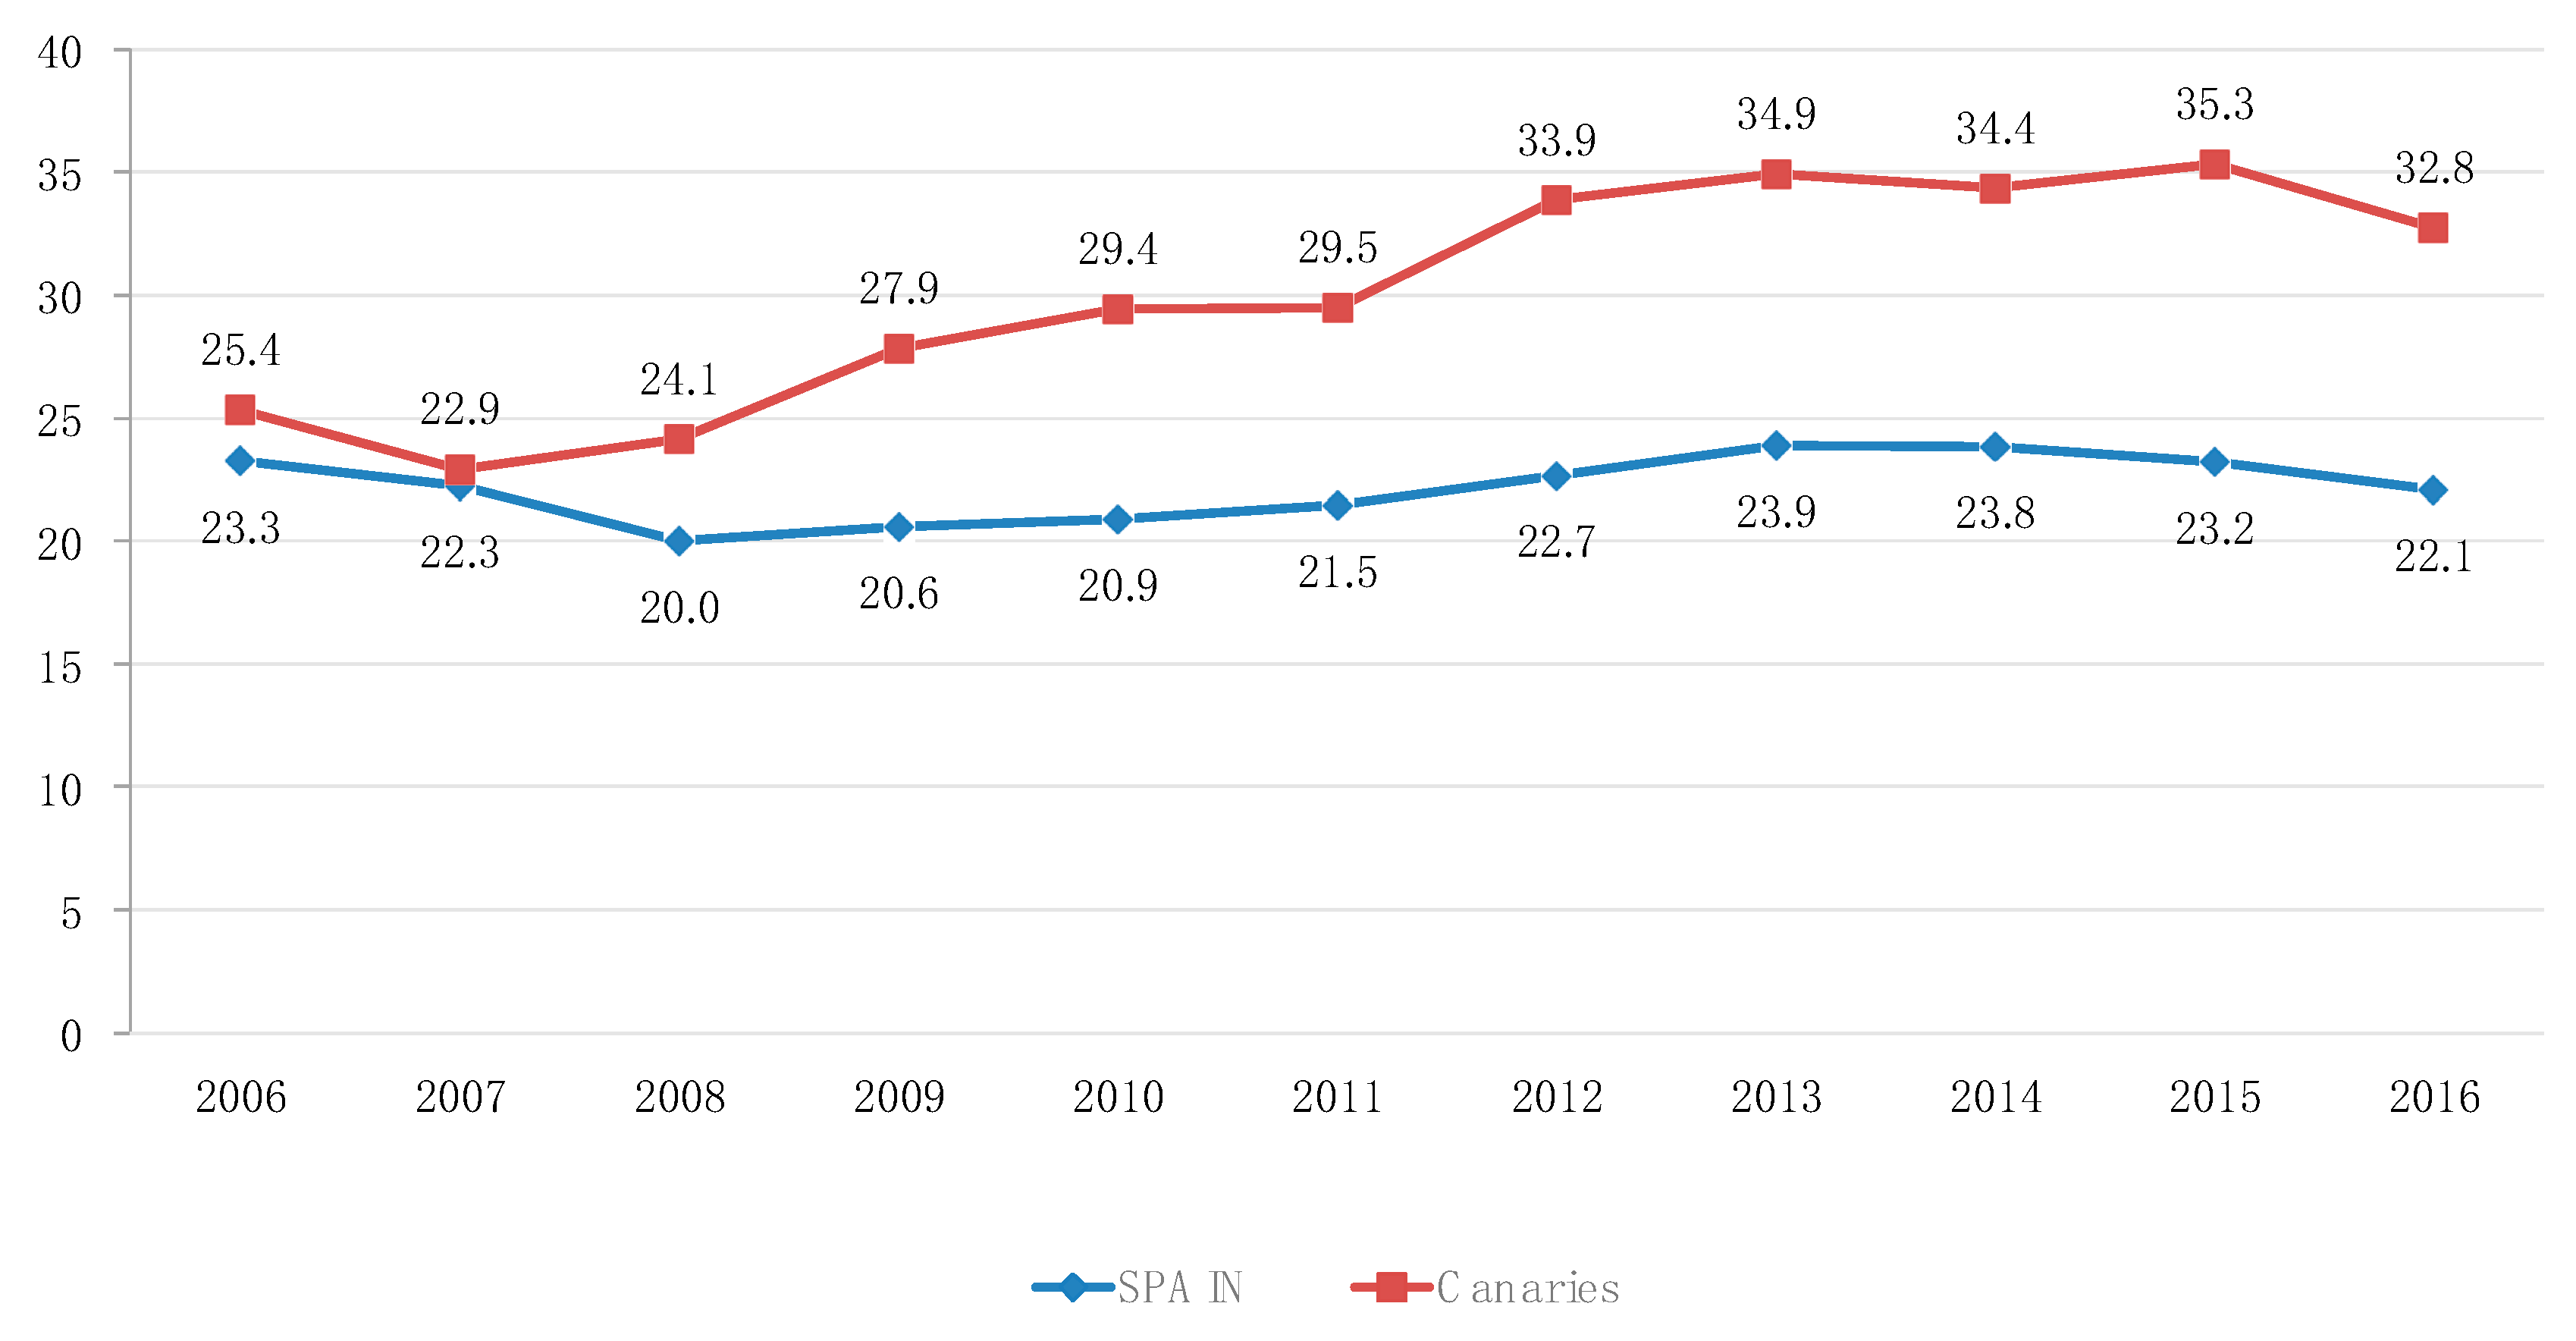
Figure 2, the poverty rate in the Canary Islands presented an increasing behaviour in the 11 years of the analysed historic data, rising by 7.4 net percentage points between 2006 and 2016, with a maximum of 35.3% in 2015. This trend reversed in 2016, whose value improved with respect to the previous four years.
In the Canary Islands this rate seemed to have been affected by the economic crisis that started in 2008. However, the Spanish average remained around 22.0% for the whole period, with a maximum in 2013 and a minimum in 2008. At the beginning of the period, the Canaries region was very close to the national average value, but the average of the last six years was 10.6 percentage points above the rate in Spain (with an average of 22.9%).
4.2. Energy Poverty
The income-based indicators are calculated for both territories, Canary Islands and Spain, with results summarised in
Table 4. It is confirmed that AFCP was the indicator that provides a higher percentage of households considered energy poor, followed by the double median expenditure 2M, the 10% threshold and the LIHC, in this order.
According to these results, the Canaries presented much lower energy poverty levels than Spain for the 10%, 2M and LIHC indicators, but significantly higher in the cases of the AFCP and MIS. The Canaries was above the Spanish average for AFCP and MIS indicators with an average difference of 4.2 percentage points, whereas it was below for LIHC, 2M and 10% indicators with an average difference of −7.0 percentage points. This difference could be due to the fact that in both AFCP and MIS, the net income per household carried a lot of weight when it came to determining whether a household is energy poor. In the Canary Islands, income was low in comparison with Spain, as it was already said in
Section 2. On the contrary, for the first three indicators, household energy expenditure carried more weight, a variable in which the Canaries were below the Spanish mean, as it is observed for the study sample from the results summarised in
Table 1. Thus, the lack of robustness is observed; it is clear that the analysis for the Canaries is completely different depending on the energy poverty indicators used. Generally, the results for Spain were comparable and coincide widely with those by Romero et al. [
16,
25].
At this point, poverty and energy poverty, that are closely related, can be compared for Spain and the Canaries. In order to see if households below the poverty threshold (60% of the median of household annual income) are also suffering from energy poverty, the poverty rate is compared with the AFCP indicator. They were easily comparable, as they are both defined with a threshold for the income (60% of the household’s net annual income median, energy expenditure and housing deducted in the case of the AFCP).
In
Figure 3, it is observed how, in Spain, 18.1% of the sampled households are both poor and energy poor (for the data pool 2006–2016, of a total of 237,957 households). This percentage increases to 24.0% in the Canary Islands (over the total of 10,316 observations in the Canaries for the period of study 2006–2016). In the islands there was a higher level of poverty but there was a significant number of households that, despite being poor, were not energy poor (6.6% > 4.9%). The opposite occurs in Spain where, being the level of poverty lower, there were more households which are not poor but are energy poor (5.4% > 3.8%). Thus, in the Canaries (more than in Spain), households identified as poor widely coincide with those identified as energy poor according to the AFCP indicator.
A more in-depth comparison is done by combining the energy poverty indicators 10%, LIHC and AFCP. It is worth mentioning that the AFCP indicator includes the LIHC indicator, as the condition on net incomes is the same for both. It is observed that, in Spain, 6.5% of the households’ sample were energy poor according to the three selected indicators at the same time. In the Canaries; however, only 2.1% of households comply with the three selected indicators at the same time.
In short, the relation between poverty and energy poverty in the Canaries behaves differently than in Spain. Furthermore, as commented above, very different results are obtained for the Canary Islands depending on the energy poverty indicator being used. A representative indicator for the islands should include the common behaviour of all the indicators. Additionally, it should consider the already mentioned specificities of the archipelago related to lower energy expenditure and higher poverty rates compared to Spain.
5. Proposing an Energy Poverty Indicator for the Canary Islands
As we have seen, energy poverty is very much conditioned by poverty; a fact that affects, more sharply, the Canary Islands. The AFCP indicator in the islands reflects a lower income level than in the country, that is, more poverty level than energy poverty level. For this reason, the AFCP indicator is considered to be a necessary condition for households which are susceptible of being energy poor, but not enough to measure energy poverty in the Canary Islands.
In order to consider the role of energy expenditure, which is significantly lower in the Canaries than in Spain, another threshold is set: the minimum of the 10% and LIHC thresholds. That is, energy poor households according to the LIHC indicator (represented by areas 1 and 3 in
Figure 4) and those households that spend over 10% of their income on energy (represented by area 2 in
Figure 4). As shown in
Table 3, taking into account all the indicators, there are three options for the energy expenditure threshold; that is, 10
%·I,
2 ME/I or
ME. The election has been to consider the minimum of these three, which means the minimum between the energy expenditure of all households’ median and 10% of the household income (adding area 2 to the initial LIHC circle). Area 2 can be of significance for low-income areas that have, at the same time, a moderate energy expenditure, such as the case of the Canary Islands.
As explained in
Figure 4, two areas are excluded, demarcated by numbers 4 and 5. Area 4 is excluded because these households have a medium to high income, so they are not poor; even spending on energy equal or more than 10% of their income, they have the capacity to do it. Area 5 is excluded because these households have low energy expenditure, below the established threshold.
Our proposed “Compound Energy Poverty Indicator” (CEPI) is defined as follows (Equation 1): (i) Households whose net income (energy expenditure and housing deducted) is below 60% of the national median for the whole households, and (ii) whose energy expenditure is either higher than the energy expenditure of all households’ median, or not lower than 10% of their income.
That is, using the same notation of
Section 2, a household is said to be energy poor if it meets the two following conditions:
where
I’ = I −
E −
H denotes the net income, energy expenditure and housing deducted,
E denotes the energy expenditure, and
MI’, ME denotes the medians of
I’, E for the whole of all households. Our proposal takes as reference, both for income and energy expenditure, the median of the whole Spanish household (national threshold) in line with the international consensus (Eurostat).
Therefore, energy-poor households according to CEPI are those which are energy-poor according to the LIHC indicator plus the ones which, being energy-poor according to AFCP, spend no less than 10% of their income in energy.
Measurement of Energy Poverty Using the CEPI
The results obtained for the CEPI in Spain and in the Canary Islands from 2006 to 2016 are shown in
Figure 5. The Canaries presented values below the national ones for all years. The resulting rates for LIHC were lower than for CEPI, both for Spain (8.9% vs 10.8%, average of the whole period, years 2006–2011) and for the Canary Islands (3.09% vs 6.4%). This significant difference was due to the addition of those households that are energy poor according to AFCP (low income) and spend no less than 10% in energy, precisely the area number 2, depicted in green colour in
Figure 4. A remarkable result was that the value of area 2 was much more important in the Canary Islands. In some years CEPI was more than double of LIHC, while in Spain the difference never exceeded 30%. This means that measuring energy poverty using CEPI includes a group of households that has a great weight in the particular circumstances of the archipelago.
The results of the CEPI showed a more reliable characterisation of energy poverty in the archipelago. First, before the crisis of 2008, despite the lower income level of families in the Canaries, the lesser need for expenditure meant a lower level of energy poverty than in Spain. However, the greater effect of the crisis, which slowed down the process of economic convergence in the Canaries, meant a very strong increase in general poverty that eventually affected energy poverty in the Canaries (in a way that it almost reached average national values).
These CEPI results measuring energy poverty seemed to be much more coherent than the resulting ones from the indicators considered individually, which showed little robust results depending on the calculation method used. In
Figure 6 it is observed the other tools’ tendencies (according to
Table 4), which add graphic support to our argument. CEPI was not only a more accurate equation, but it also overcame some of the major problems that affect current indicators: Canary Islands were more energy poor than Spain according to AFCP, since this indicator was measuring mainly income poverty. On the contrary the islands’ energy poverty rates according to LIHC were the lowest of all indicators. The 10% indicator kept the same tendency as Spain, without representing how the crisis had affected the Canary Islands (as the results of the AROPE indicator has exposed in [
13]). Finally, although this is not the case for 2M, as already mentioned in
Section 2, it had the disadvantage of not setting an income threshold.
6. Conclusions
The policies for relieving fuel poverty in Spain have been basically the same for the whole territory, and consisted of introducing an allowance to pay for fuel costs: the social bonus, established in 2009 and regulated by the Royal Decree 897/2017 [
32]. This bonus was put in place as an additional protection for the right to electricity supply, and aimed at improving the ability of households to meet the cost of their basic energy needs, but it did not consider the rest of energy sources. However, the new Spanish National Strategy against Energy Poverty for the 2019–2024 period [
33] has been recently published following the Royal Decree 15/2018, of October the 5th [
34]. This strategy incorporates the climatic variability existing in Spain, through the differentiation of climatic zones. It recognizes that Spain has a pronounced climatic diversity, as a consequence of its geographical location and orography. In particular, it acknowledges that the Canary Islands climatic conditions do not conform to the peninsular. For all these reasons, it is pertinent to obtain an indicator of energy poverty in the Canary Islands that reflects its singularities. A task that has been carried out in this work.
In this study, Canary Islands’ energy poverty is analysed and a specific way to measure it is proposed. To achieve that, a previous quantitative analysis has been conducted using different income-based indicators and contrasting the results with the Spanish situation. This analysis confirms that the archipelago presents some characteristics that make necessary the introduction of a new robust indicator to measure energy poverty. The elements on which these specificities in the Canaries are based are: a greater poverty rate, and some geographical and weather conditions that result in a lower energy expenditure. From a combination of different income-based indicators, a new one that we call the Compound Energy Poverty Indicator (CEPI) is proposed. CEPI shows the special features of the Canaries according to their singularities, as recommended by the European Union and the new Spanish National Strategy against Energy Poverty. The evolution of this indicator shows the greater impact of the 2008 economic crisis on the Canary Islands compared to Spain, increasing in a way that it almost reached the national rates at the end of the period.
The development of a comprehensive, systematic and coordinated strategy in the Canaries to assess the energy poverty incidence, understanding its nature and identifying the most exposed groups, would not be possible without a proper indicator. Using CEPI instead of LIHC leads to the inclusion of a group of households that have a great weight in the particular circumstances of the archipelago. This last finding has important implications for the design of energy policies since it allows the regional authorities to identify the energy poor households in the islands in a precise way. Otherwise, they could be left out of the social bonus. The measures related to the social bonus imply a reduction in prices but should be complemented by actions of energy efficiency applied by consumers themselves. However, this type of actions requires collaboration between the public sector and the energy services companies together with campaigns to disseminate information on best practices.
From the results of this study, some future lines of research could be developed. In the first place, it would be extremely interesting to establish a comparison between the CEPI results in the Canary Islands and the other EU’s outermost regions with similar special characteristics (e.g., Martinique, Guadeloupe or Reunion Island). In this sense, this work would be a first step for a later generalization in the use of CEPI. Secondly, it is necessary to ponder on the limitations of this new measure based only on income–expenditure. It would be very useful to add the dimensions included in the new Spanish National Strategy against Energy Poverty (2019–2024) [
33], considering the study of the living conditions of households in order to complement the multidimensional nature of energy poverty. In this sense, we point out the usefulness of having more complete databases so as to avoid the overvaluation of energy poverty. Finally, the study of the determinants of energy poverty that could allow for the identification of vulnerable households remains a pending task for future works.


