Article

Simulation Study of CO2 Huff-n-Puff in Tight Oil Reservoirs Considering Molecular Diffusion and Adsorption

1
School of Energy Resources, China University of Geosciences (Beijing), Beijing 100083, China
2
Beijing Key Laboratory of Unconventional Natural Gas Geology Evaluation and Development Engineering, China University of Geosciences (Beijing), Beijing 100083, China
3
School of Information Technology and Management, University of International Business and Economics, Beijing 100029, China
*
Author to whom correspondence should be addressed.
Energies 2019, 12(11), 2136; https://doi.org/10.3390/en12112136
Submission received: 21 April 2019 / Revised: 20 May 2019 / Accepted: 28 May 2019 / Published: 4 June 2019
(This article belongs to the Special Issue Enhanced Oil Recovery 2019)

Abstract

:
CO2 injection has great potentials to improve the oil production for the fractured tight oil reservoirs. However, Current works mainly focus on its operation processes; full examination of CO2 molecular diffusion and adsorption was still limited in the petroleum industry. To fill this gap, we proposed an efficient method to accurately and comprehensively evaluate the efficiency of CO2-EOR process. We first calculated the confined fluid properties with the nanopore effects. Subsequently, a reservoir simulation model was built based on the experiment test of the Eagle Ford core sample. History matching was performed for the model validation. After that, we examined the effects of adsorption and molecular diffusion on the multi-well production with CO2 injection. Results illustrate that in the CO2-EOR process, the molecular diffusion has a positive impact on the oil production, while adsorption negatively impacts the well production, indicating that the mechanisms should be reasonably incorporated in the simulation analysis. Additionally, simulation results show that the mechanisms of molecular diffusion and adsorption make great contributions to the capacity of CO2 storage in tight formations. This study provides a strong basis to reasonably forecast the long-term production during CO2 Huff-n-Puff process.

1. Introduction

Unconventional reservoirs are always characterized by low permeability and porosity, which requires the techniques of hydraulic fracturing for the economic development [1,2,3,4]. Current studies show that the oil recovery after primary production is less than 10% [2], and tremendous amount of oil reserves in the tight formations. Hence, CO2-EOR process has big potentials 2-EOR process [5].
Recently, researchers have proved the great success of CO2 injections in tight oil reservoirs theoretically and experimentally, which is beneficial to relieve global warming as well [6,7,8,9]. Due to the favorable injectivity and miscible displacement, CO2-EOR performs better than water flooding at the pressure higher than MMP. CO2-EOR includes two common scenarios: continuous CO2 injection and CO2 Huff-n-Puff process. In the huff-n-puff process, the production well is first transferred to the CO2 injection well, stimulating the region near the fractures, after shut-in period, it is converted back to production. Zuloaga-Molero et al. [10] compared the efficiency of these two CO2 injection scenarios in the Bakken formation, concluding that oil production is higher in CO2 Huff-n-Puff process than CO2 flooding in the low-permeability formation. Sanchez Rivera [11] investigated the main operation parameters during the CO2 Huff-n-Puff process and evaluated their impacts on the CO2-EOR performance. According to the work by Hawthorne et al. [6], the CO2 injection in tight oil reservoirs is defined as the following conceptual steps: CO2 first flows into and through the fractures; then it diffuses into the matrix and oil moves out of pores through swelling and reduced viscosity; finally, the oil will be driven into the fractures and the wellbore with the CO2 pressure gradient. Recently, Janiga et al. [12] developed a data-driven model of huff-n-puff process using genetic programming. They optimized the huff-n-puff process with the laboratory data providing the good input data. Wan et al. [13] applied the NMR measurements to investigate the N2 huff-n-puff efficiency at different cycles, illustrating NMR technique can well investigate the cyclic N2 injection.
From the literature survey, the physical mechanisms i.e., nanopore effects, molecular diffusion, and adsorption influence the effectiveness of CO2-EOR process. Hoteit [14,15] has pointed out that the mechanism of molecular diffusion plays a more important role in tight oil reservoirs than viscous forces and gravity drainage. Nanopores exist in the shale and tight formations; hence, high capillary pressure in nanopores will result in the unique fluid and interaction characteristics [16,17,18]. Additionally, Sapmanee [19] pointed out that fluid properties and flow conditions in confined pores should be modified due to pore proximity effects. Zhang et al. [20] modified van der Waals equation of state to investigate the CO2 storage process in the fractured nanopores considering adsorption, concluding that phase behavior of CO2 streams in fractured nanopores differs from bulk phases. Zhang et al. [21] applied the PR-EOS to evaluate solubility parameter in nanoscale and applied it to calculate the MMP in the CO2 injection.
Kang et al. [22] studied CO2 adsorption on two Barnett shale samples, pointing out that adsorption of CO2 is 5–10 times greater than CH4, releasing the adsorbed CH4 in the matrix. Cipollar et al. [23] and Yang et al. [24] performed numerical studies to investigate the adsorption on the oil production. However, molecular diffusion was not included in their models. In the model built by Clarkson and Haghshenas [25] and Haghshenas et al. [26], they conducted the simulation of CO2 Enhanced Recovery accounting for the fluid adsorption and diffusion, but the nanopore effects were neglected. Yu et al. [7] calculated the contributions of CO2 molecular diffusion in improving the oil production in the Middle Bakken formations, concluding that large molecular diffusion leads to high incremental oil recovery. However, adsorption and nanopore effects were neglected in their study. In order to handle the adsorption of multi-components, Yang et al. [27] extended the Langmuir model and applied it to investigate primary production and CO2-EOR process considering the gas adsorption. Results show that multi-component adsorption behavior slightly increases the oil recovery in the primary production but more complex in the CO2-EOR process. Wan and Mu [28] concluded that the nanopore effect impacts the recovery of Eagle Ford shale gas condensate reservoir during the CO2 cyclic injection. However, the molecular diffusion and adsorption were not considered. Zhang et al. [9] designed a sensitivity analysis of the effect of diffusion mechanism on the incremental oil recovery factor. They pointed out that the molecular diffusion has positive impacts on the performance of CO2-EOR process in the tight oil reservoirs. However, their studies did not include the adsorption mechanism. Sun et al. [29] and Wang and Yu [30] used compositional model to investigate the CO2-EOR with complex fracture geometries, but the nanopore effects and the adsorption were not considered. Czarnota et al. [31] studied the mass transfer between CO2 and oil phase and applied the acoustic pulse-echo technique to accurately examine the oil volume expansion factor, which is important during the CO2-EOR process.
In this work, we presented a useful approach to efficiently determine the effects of molecular diffusion and adsorption on the CO2 Huff-n-Puff process effectiveness in the tight reservoirs. We first introduced the calculation of the fluid properties shifts considering the nanopore confinement. Then, A 3D reservoir model was built with the characterized properties from the Eagle Ford formation. Subsequently, history matching was conducted including the nanopore effects. After that, we performed the simulation studies of different CO2-EOR process, including five cycles in 15 years. Each cycle includes one-month injecting, one-month soaking, followed by one year of back production. The well performance in different scenarios was compared to determine the contributions of the molecular diffusion and adsorption on the increment of oil production. CO2 storage capacity considering the diffusion and adsorption was also analyzed. The simulation results indicate that the mechanisms of nanopore effect, molecular diffusion, and adsorption impact the well production in the tight oil reservoirs.

2. Methodology

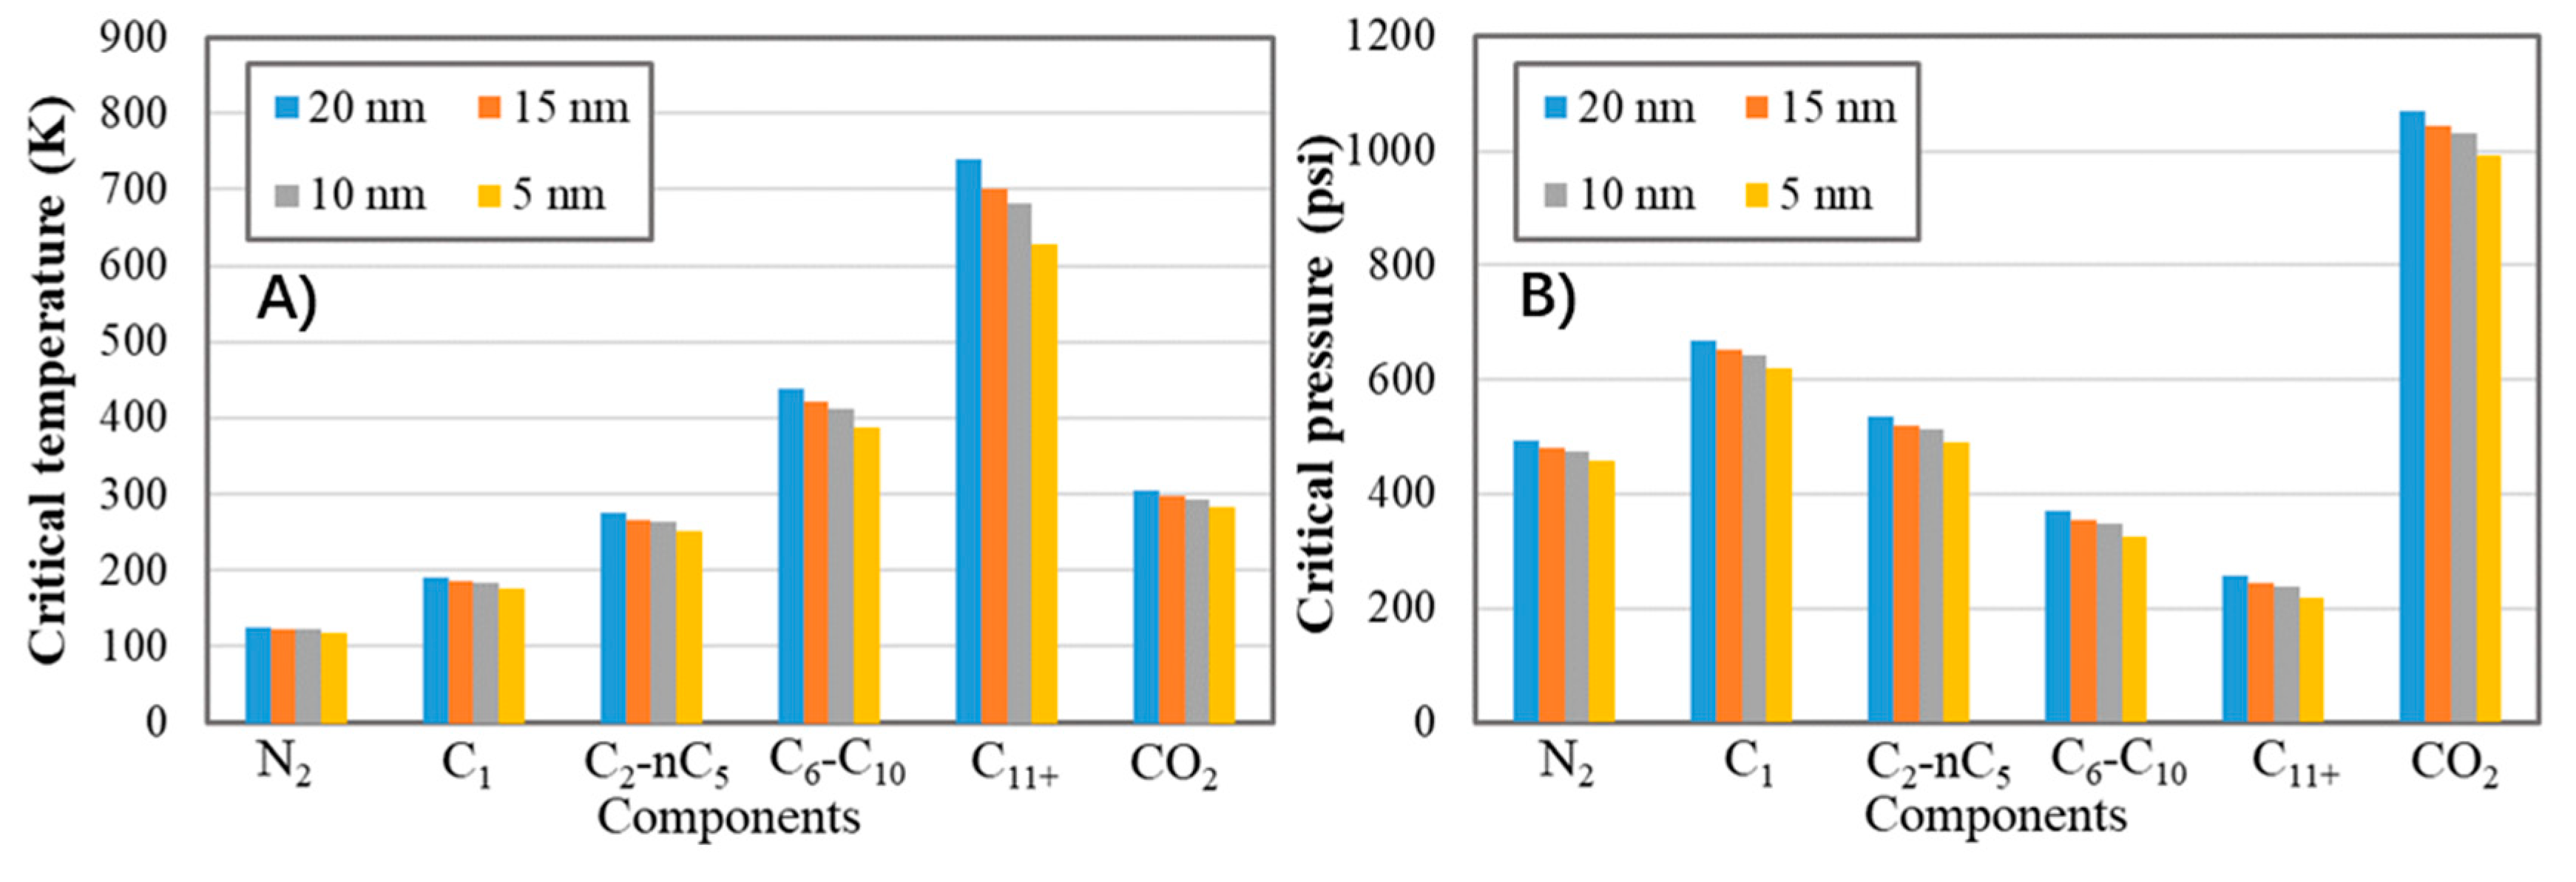
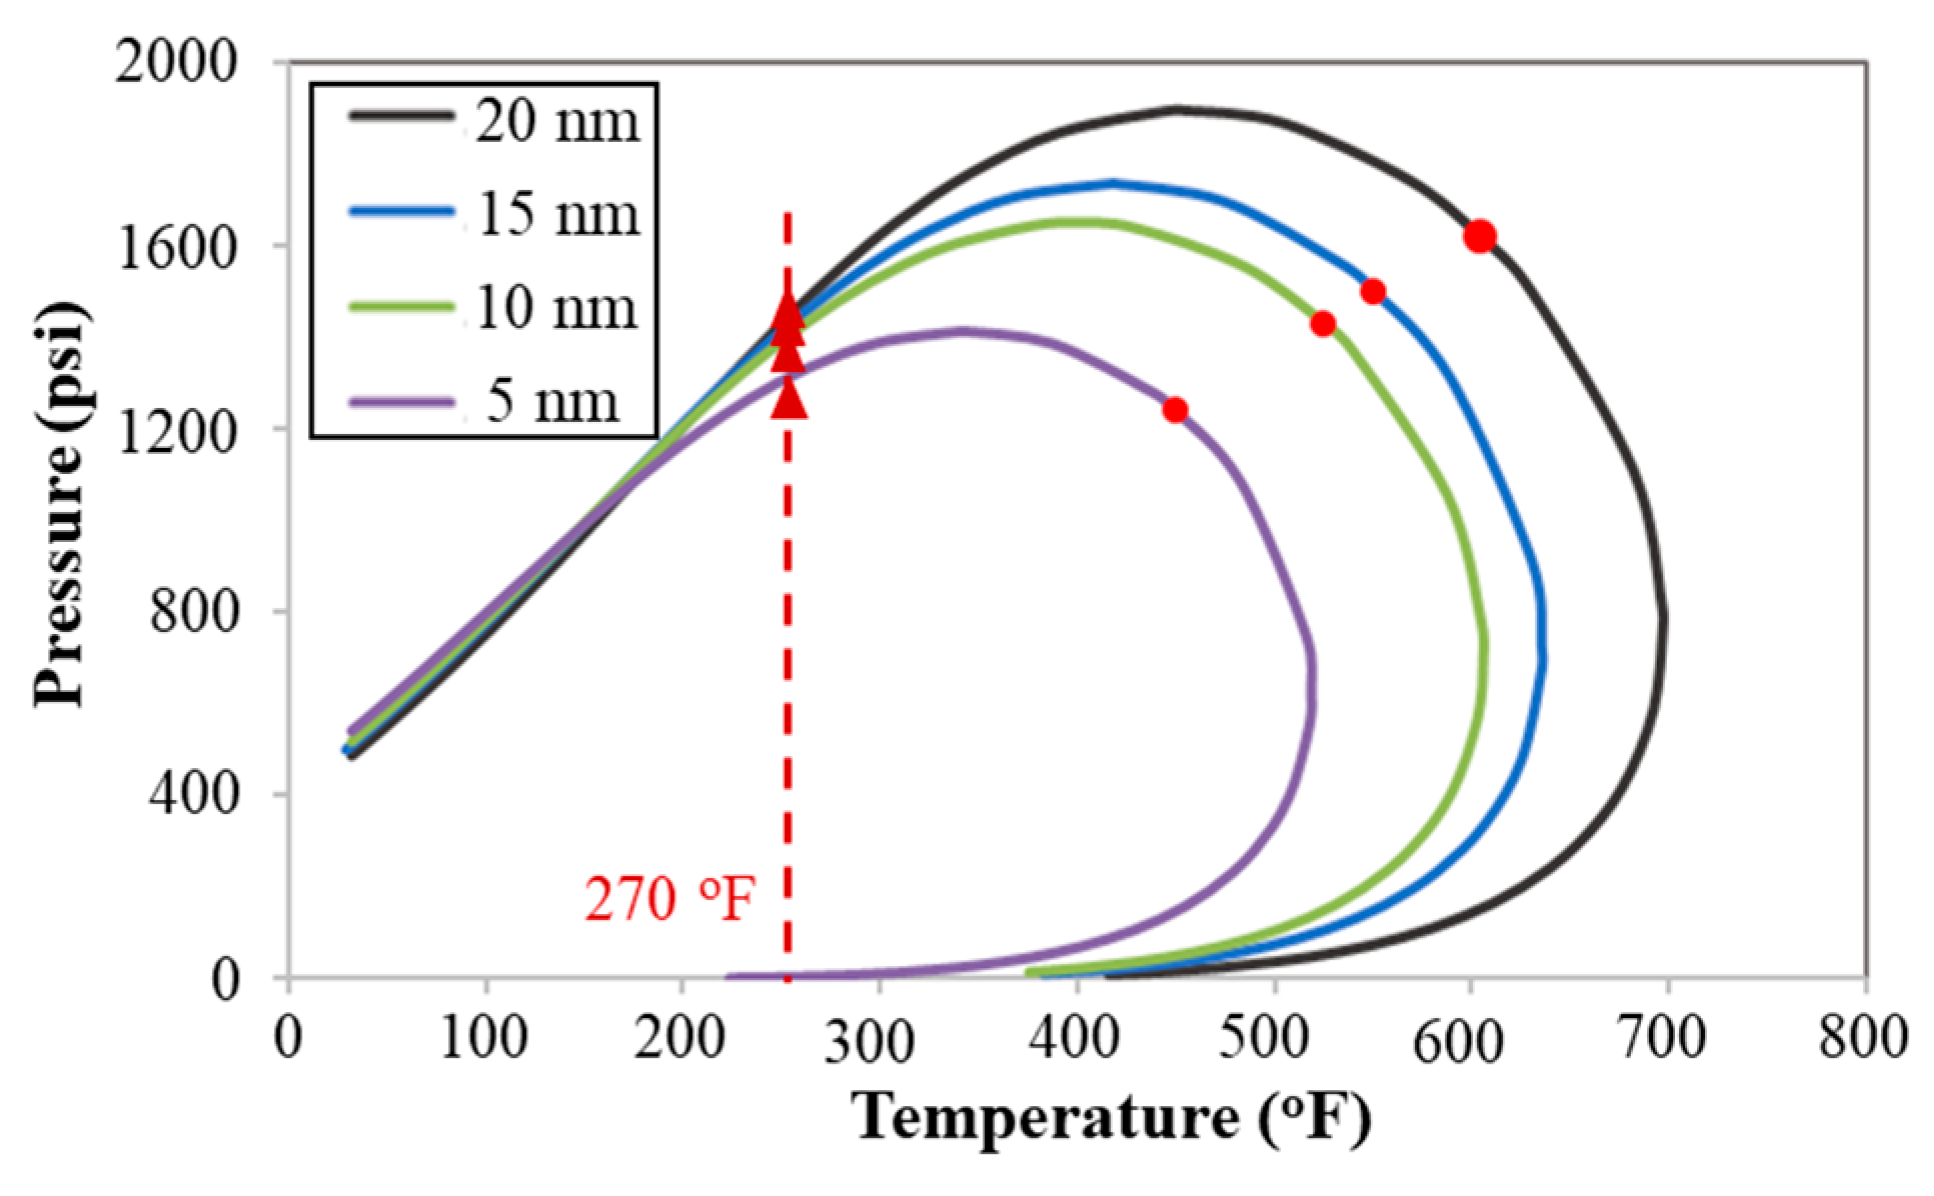
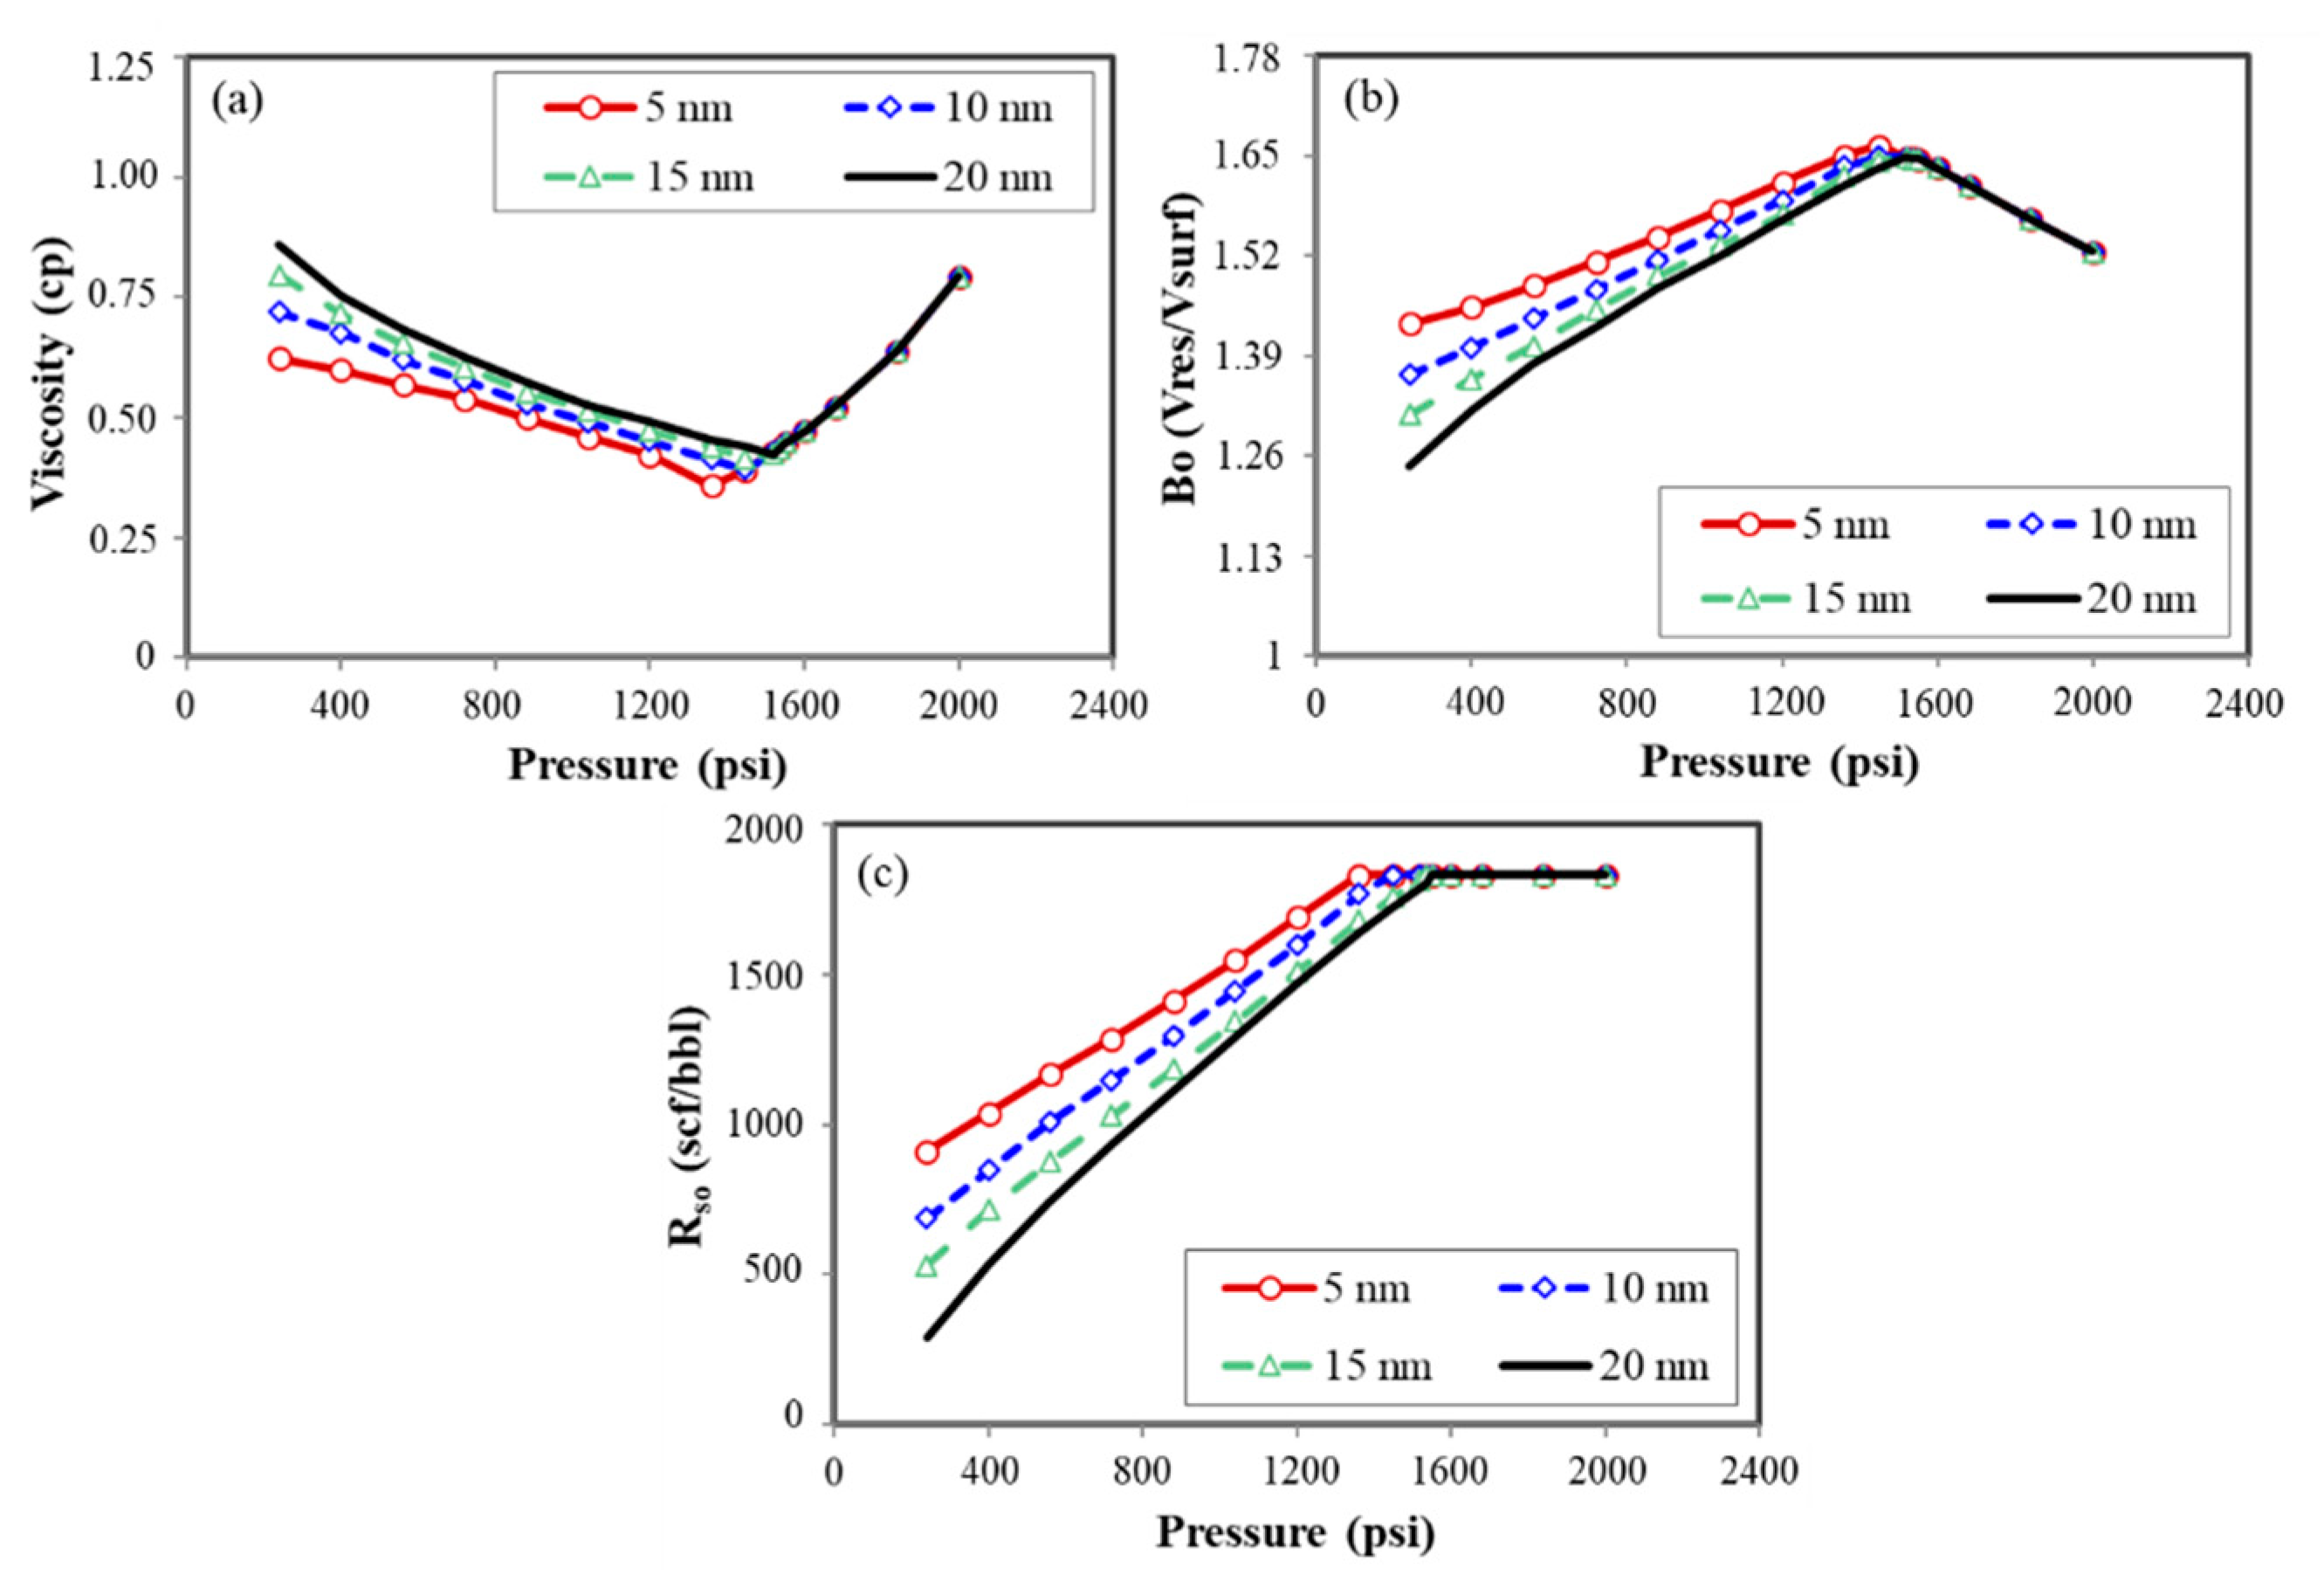
2.1. Critical Property Shifts in Nanopores

As reported, the fluid PVT properties is significantly influenced for the pore size of 10 nm or less because of the surface-molecule interactions [32,33]. In this approach, only critical temperatures and pressures in nanopores are considered, which are calculated by the correlations published by Singh et al. [34], as presented in Equations (1)–(3).
Δ T c * = T c b T c p T c b = 0.9409 σ L J r p 0.2415 ( σ L J r p ) 2
Δ P c * = P c b P c p P c b = 0.9409 σ L J r p 0.2415 ( σ L J r p ) 2
σ L J = 0.244 T c b P c b 3
where rp is the pore-throat radius. Tcb, Tcp, Δ T c * are the critical temperature in the bulk phase, critical temperature in the confined phase, and relative critical temperature shift, respectively. Pcb, Pcp, and Δ P c * are the critical pressure in the bulk phase, critical pressure in the confined phase, and relative critical pressure shift, respectively. σ L J is the Lennard-Jones size parameter (collision diameter). Reid et al. [35] have summarized the critical properties of pure component in their work.

2.2. Flow Governing Equations

With the typical fluid and reservoir properties, a reservoir simulation model was proposed using CMG [36]. For component i, the total mass balance in different phases can be evaluated as follows [37]:
t ( ϕ l = 1 N p ρ l S l w i l ) + ( l = 1 N p ρ l w i l u l ϕ ρ l S l K ¯ ¯ i l w i l ) r i = 0 ,    i = 1 , , N p
where ρ l is density, wil is mass fraction of component i. S l is the saturation. The subscript “l” represents the phase l. Np is number of phases. ul is velocity in Darcy’s flow, and ϕ represents the porosity. ri is mass rate as source or sink term in the injection or production.
K ¯ ¯ i l is the dispersivity coefficient of component i in the phase l, which is expressed as
K ¯ ¯ i l = D ¯ ¯ i l τ + α ¯ l | u ¯ l | ϕ S l
In Equation (5), we applied the Sigmund’s work to calculate the diffusion coefficient of component i ( D ¯ ¯ i l ), which is valid for both oil and gas phases [38,39]. τ is tortuosity. α ¯ l is the dispersivity coefficient of phase l.
ul is described as
u ¯ l = k ¯ ¯ μ l ( ¯ p l ρ l g ¯ )
where pl is pressure and μ l is the viscosity. k ¯ ¯ is permeability tensor. The subscript “l” represents the phase l. Pl is the pressure of phase l. The partial differential equations are solved by the CMG-GEM numerical reservoir simulator [36].
Yu and Sepehrnoori [40] have optimized the well spacing and pointed out that four horizontal wells are often drilled in the area of 1 mile × 2 miles. Luo et al. [41] found that the number of perforation stages is averagely 30 for each long lateral. Hence, we set a simulation model in the field scale, with the dimension of 10,560 ft, 5280 ft, and 40 ft in x, y, and z direction, respectively. The grid size is 40 × 40 × 40 ft. Four horizontal wells are zipper patterns with lateral length of 9280 ft and well spacing of 1360 ft. There are 30 hydraulic fractures along each well, as shown in Figure 1. The fracture spacing is 320 ft, and fracture height is assumed equal to the reservoir thickness. Parameters of reservoir and fracture are reasonably set for this field-scale case study, as summarized in Table 1 [42]. We used the local grid refinement (LGR) to describe the flow between the matrix and fractures. The grid of each block containing hydraulic fracture is set as 7 × 1 × 1. It should be noted that stress-sensitivity is neglected in this study.
Since the detailed fluid composition data for the Eagle Ford well is not available, we assumed six pseudo-components to represent the typical fluid in this study: CO2, N2, C1, C2-C5, C6-C10, and C11+, respectively. Detailed composition and properties can be found in our previous work [43]. After tuning, oil gravity is 40 °API, GOR is 1900 scf/stb, and Bo is 1.65 rb/stb, which agree well with the properties measured by Orangi et al. [44]. We implement these properties into the PR-EOS [45]. Flash calculations are performed to determine the oil properties under the reservoir temperature of 270 °F. Details can be found in our previous work [46].

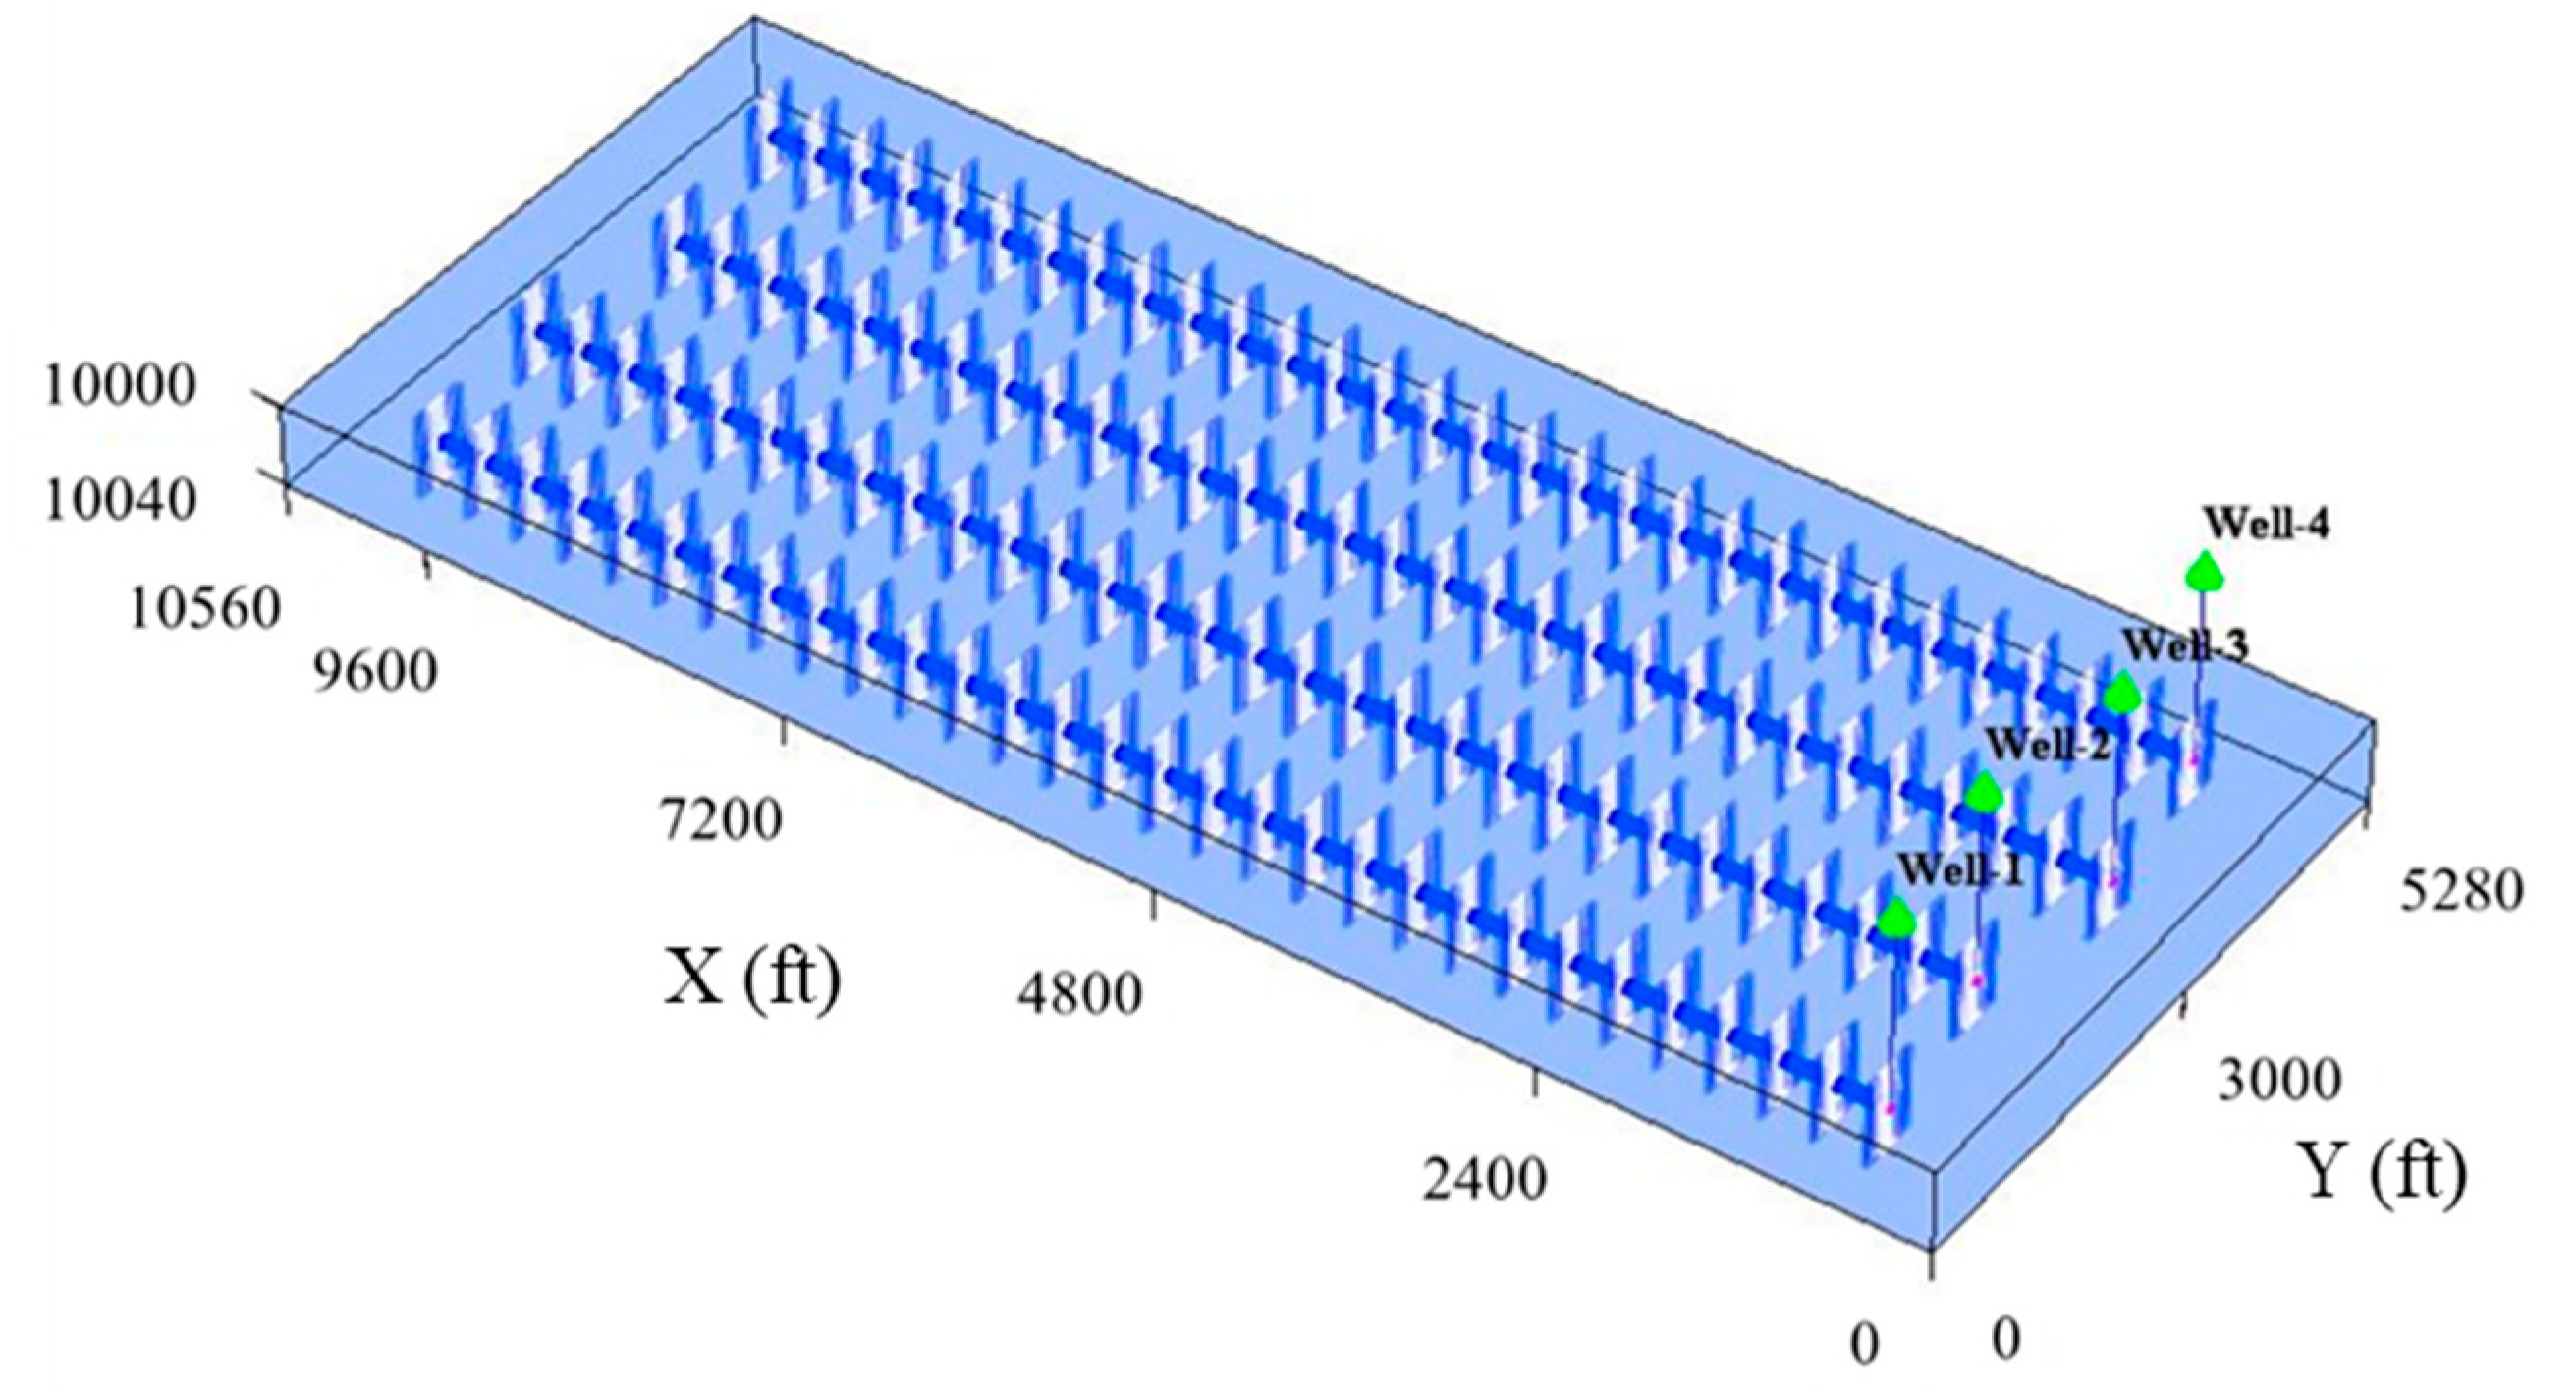
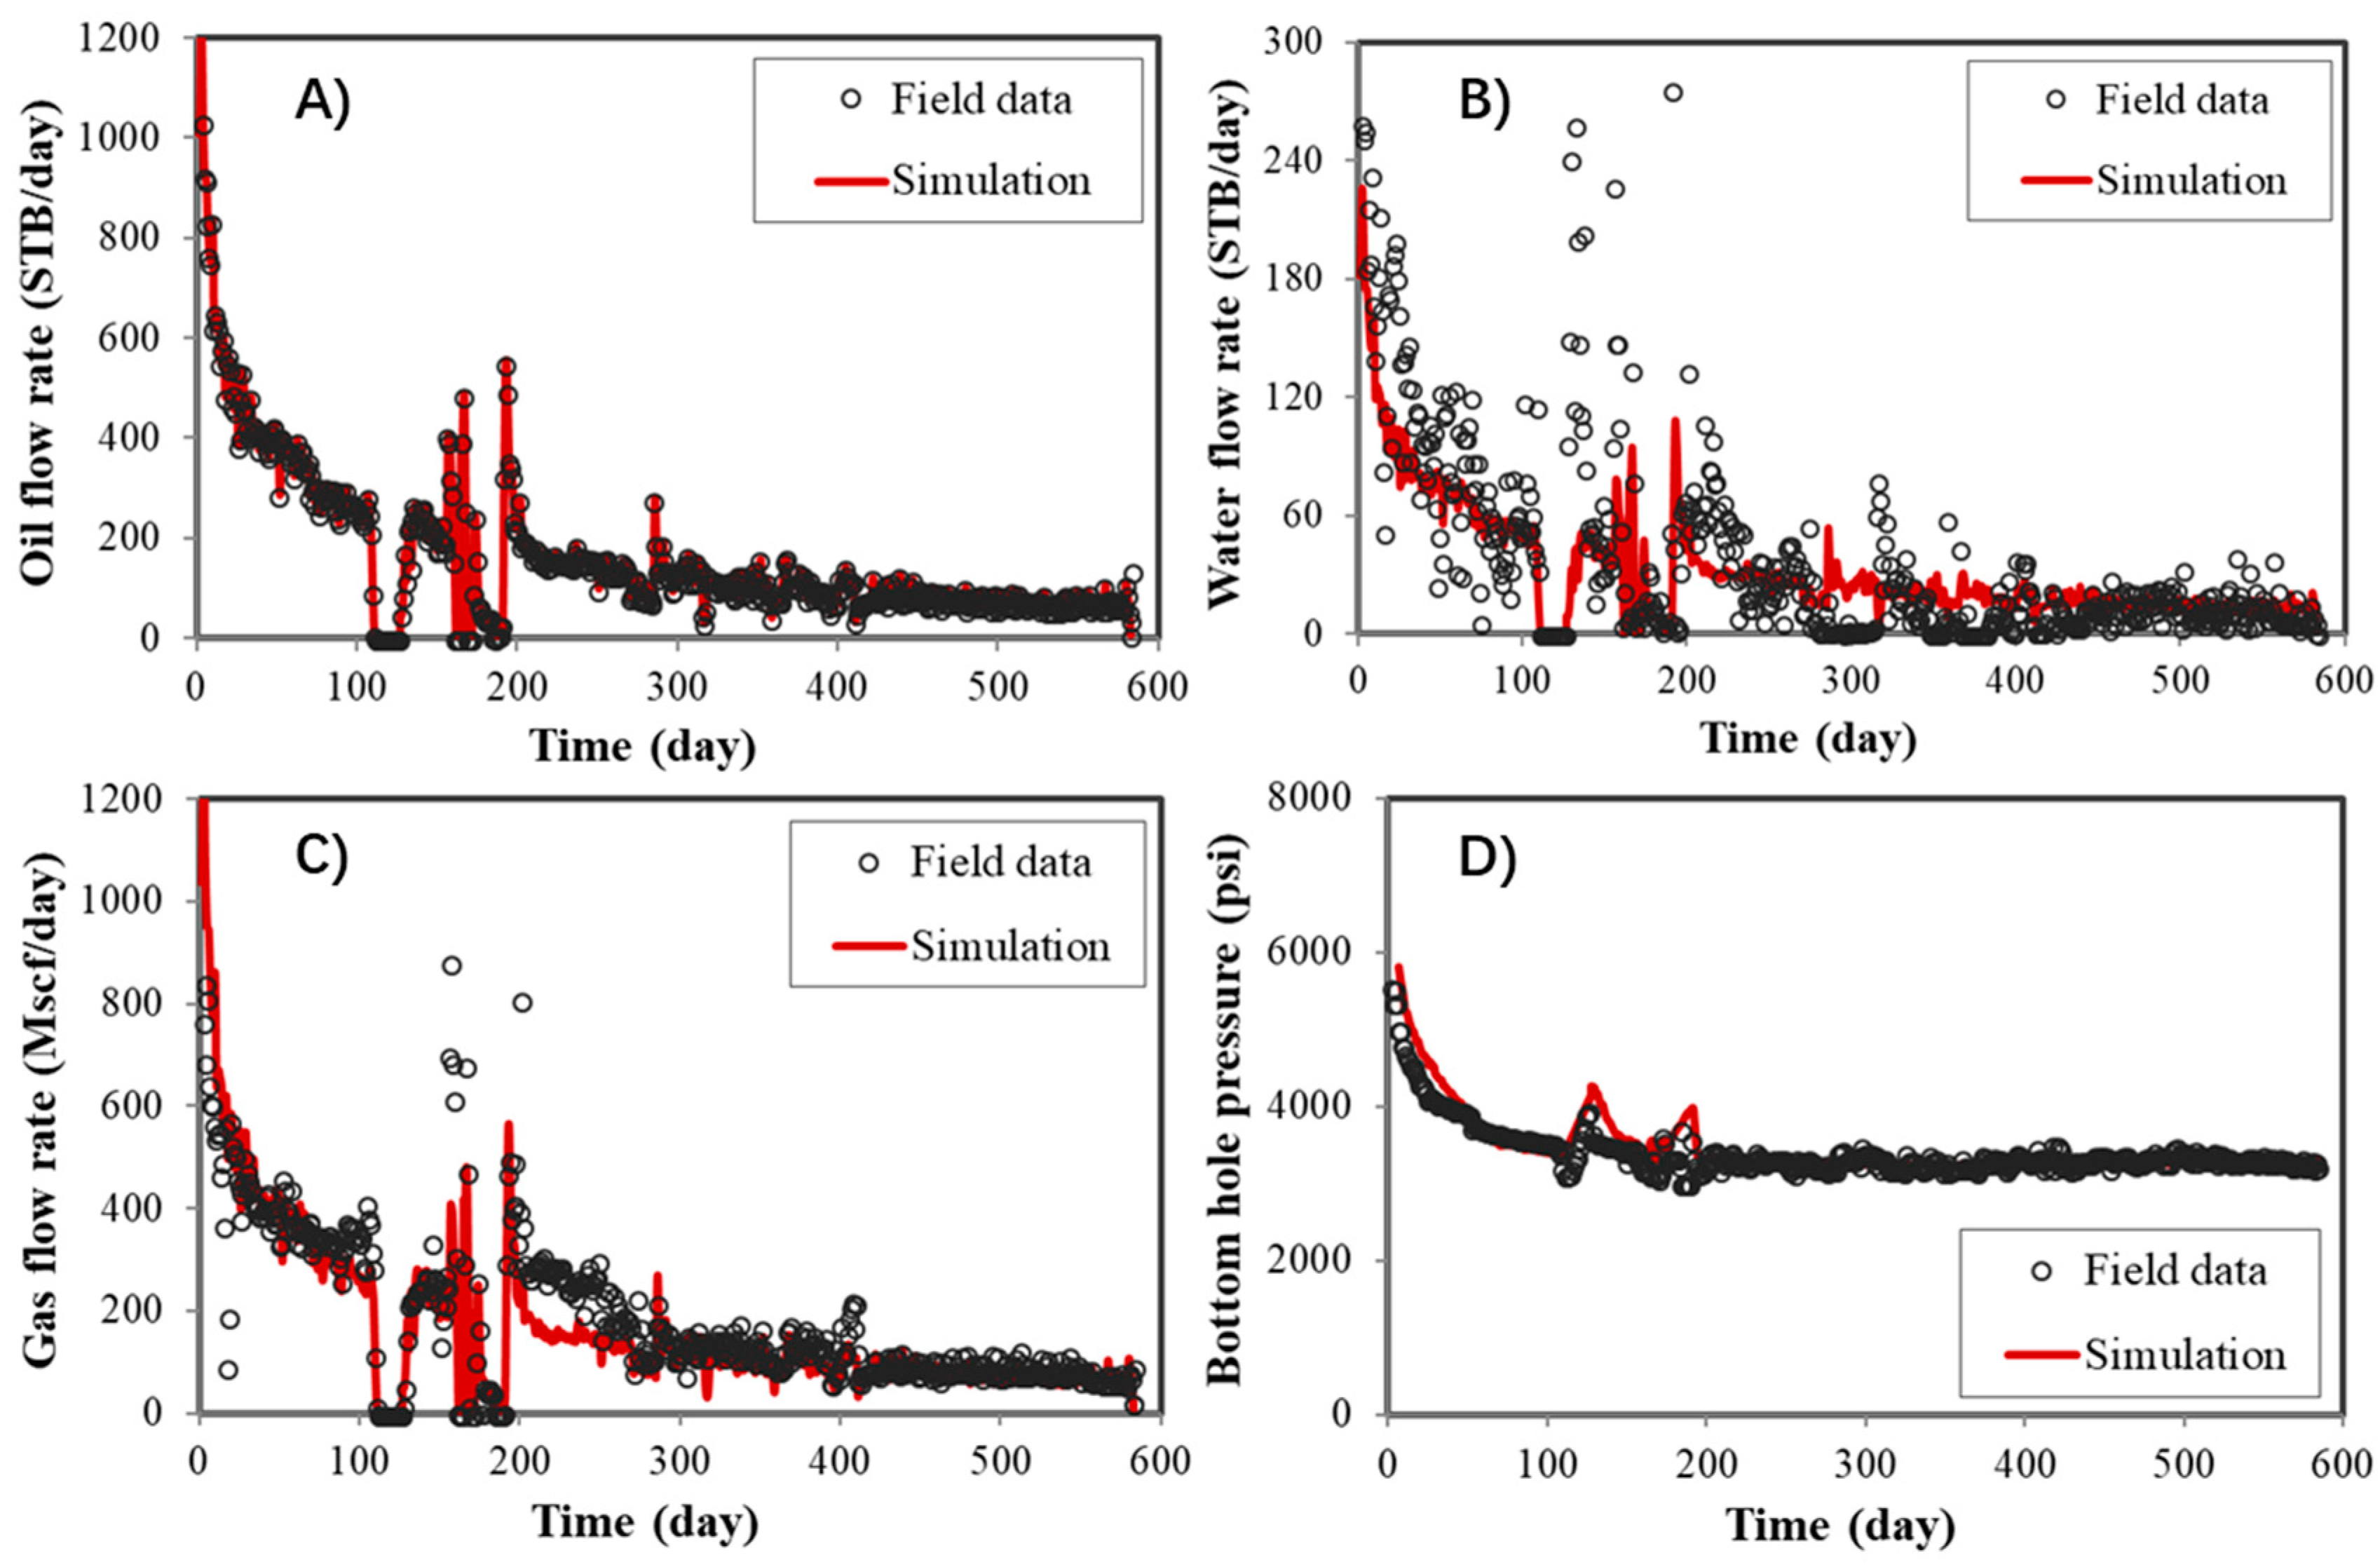
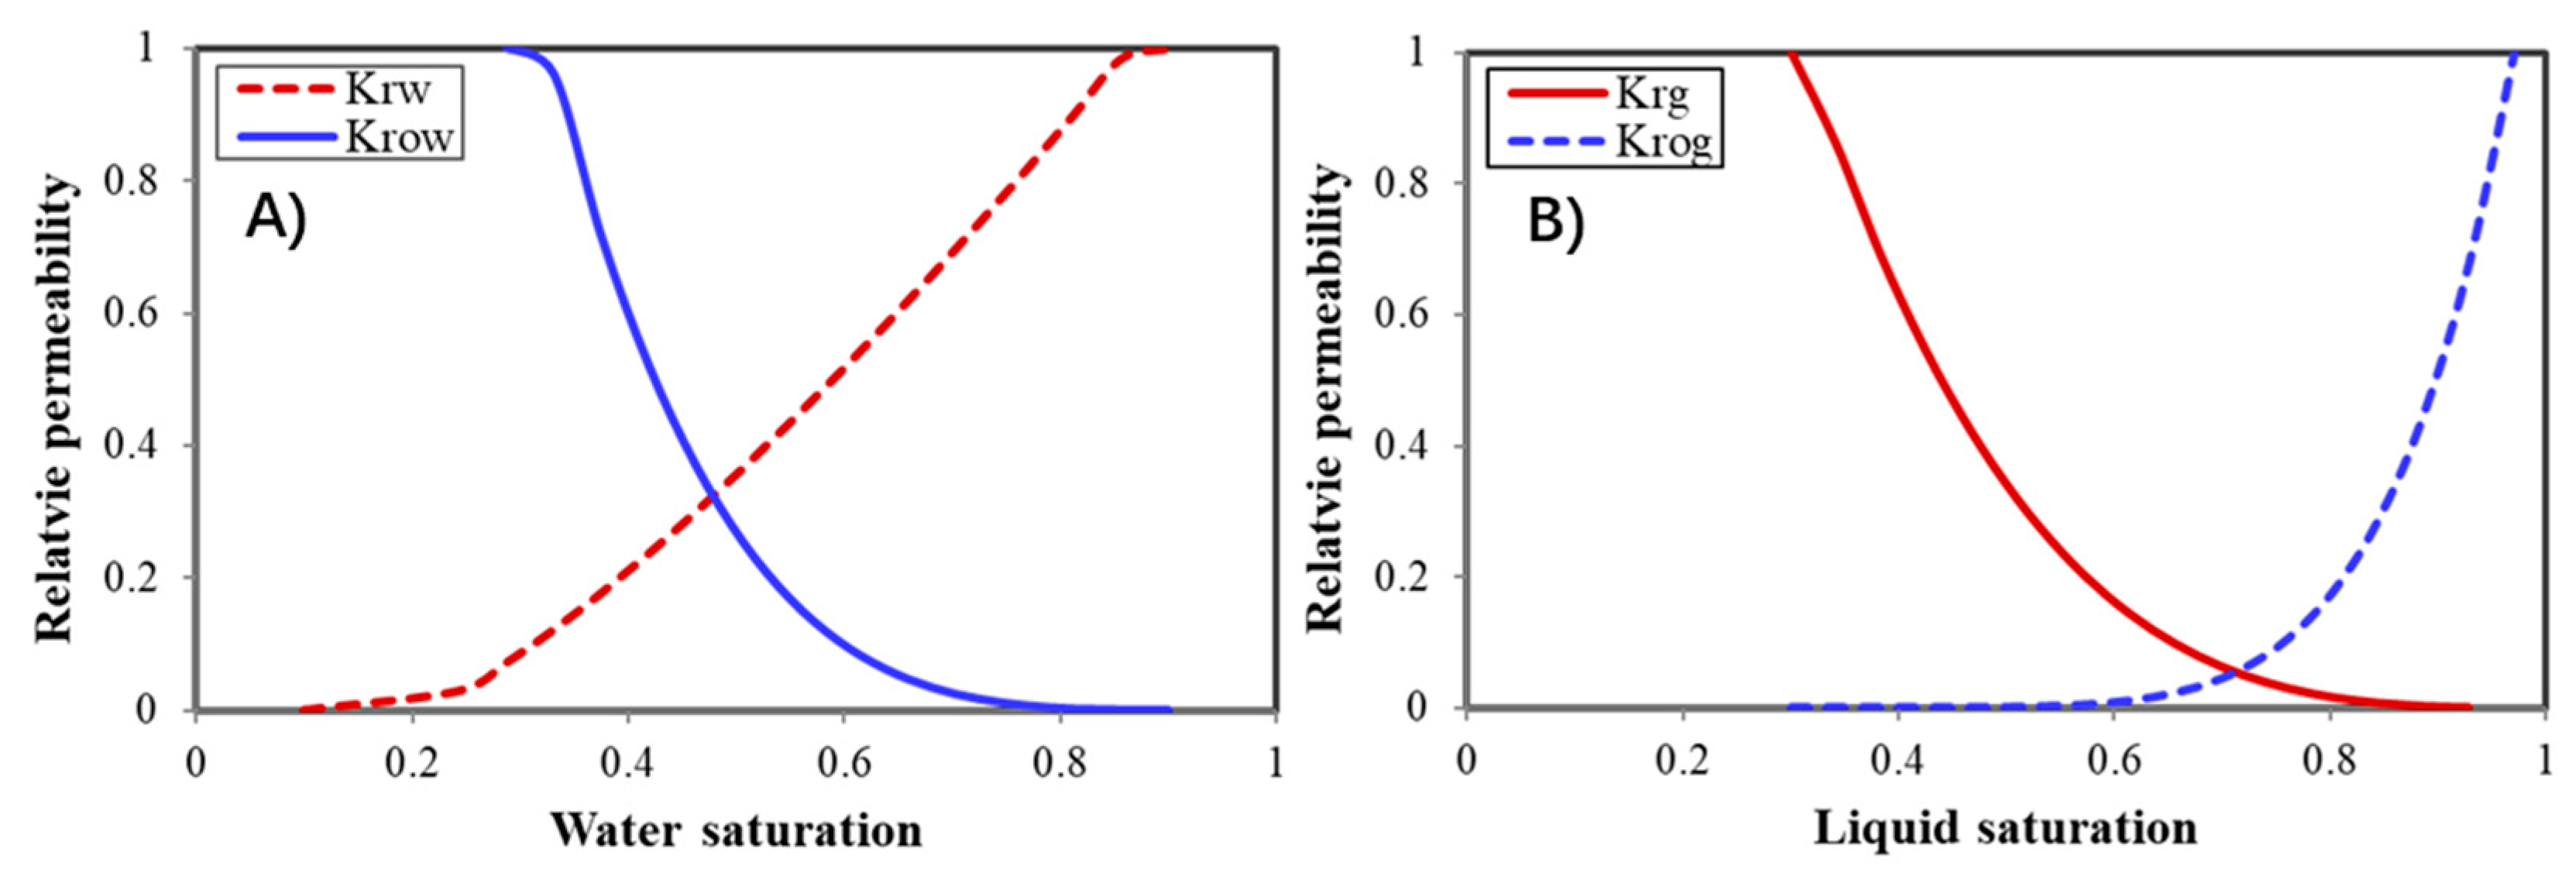
2.3. History Matching with An Actual Well from Eagle Ford Tight Oil Reservoir

In order to validate the reservoir simulation model, history matching was performed using the production data of a well from the Eagle Ford tight oil reservoir [47]. According to the experimental data on the Eagle Ford cores, the percentage of pores less than 20 nm takes around 80% in total [48]. Hence, the nanopore effects should be considered in the reservoir simulation. Sensitivity analysis of region numbers was also conducted, and division of four regions was finally decided: less than 5 nm, 5–10 nm, 10–20 nm, and larger than 20 nm, representing the pore size distribution of Eagle Ford formation. The contribution of each region is 42%, 27%, 13%, and 18% in total, respectively. Each gridblock has its own region and each region has its PVT properties. The values of critical properties for different pore sizes were calculated using Equations (1)–(3), as displayed in Figure 2.
The phase diagrams for different pore sizes are presented in Figure 3. As shown, the two-phase region becomes smaller and the bubble point pressure decreases at the temperature of 270 °F.
The nanopore effects on gas- oil ratio, formation volume factor, and viscosity are shown in Figure 4. With the suppression of pore size, viscosity decrease, formation volume factor and gas- oil ration will increase. It should be noted we applied the compositional reservoir simulator to investigate the CO2 Huff-n-Puff process.
In order to implement the effect of pore size in the compositional simulation, we calculated the critical temperature and pressure of different components under different pore sizes using Equations (1)–(3). Then, keyword “EOSSET” was used to input the PVT properties and “EOSTYPE” was used to assign the regions for all grids in the CMG input file. After that, we run the CMG-GEM simulator to obtain the results of CO2-EOR process.
In this section, we include the different pore size regions with different confined fluid properties to consider the nanopore effects on the history matching, which can obtain a more reasonable simulation model [49]. The diffusion and adsorption were not considered in the history matching process. During the history matching, the simulation constraint input is the oil flow rate, as shown in Figure 5A, while the water flow rate, gas flow rate, and BHP are considered as the history-matching parameters. The black circle represents the field data, while the red line is the simulation results. We tuned the parameters of fracture half-length, fracture conductivity, and relative permeability curves to obtain good results.
As presented in Figure 5B–D, the simulation results show great agreements with the actual production data. Additionally, based on the good agreements, the fracture conductivity and fracture half-length are reset as 48 mD-ft and 220 ft, respectively. Figure 6 presented the determined water-oil and liquid-gas relative permeability curves. The relative permeability curves remain the same in all grids in the following cases, and the non-Darcy effect is neglected.

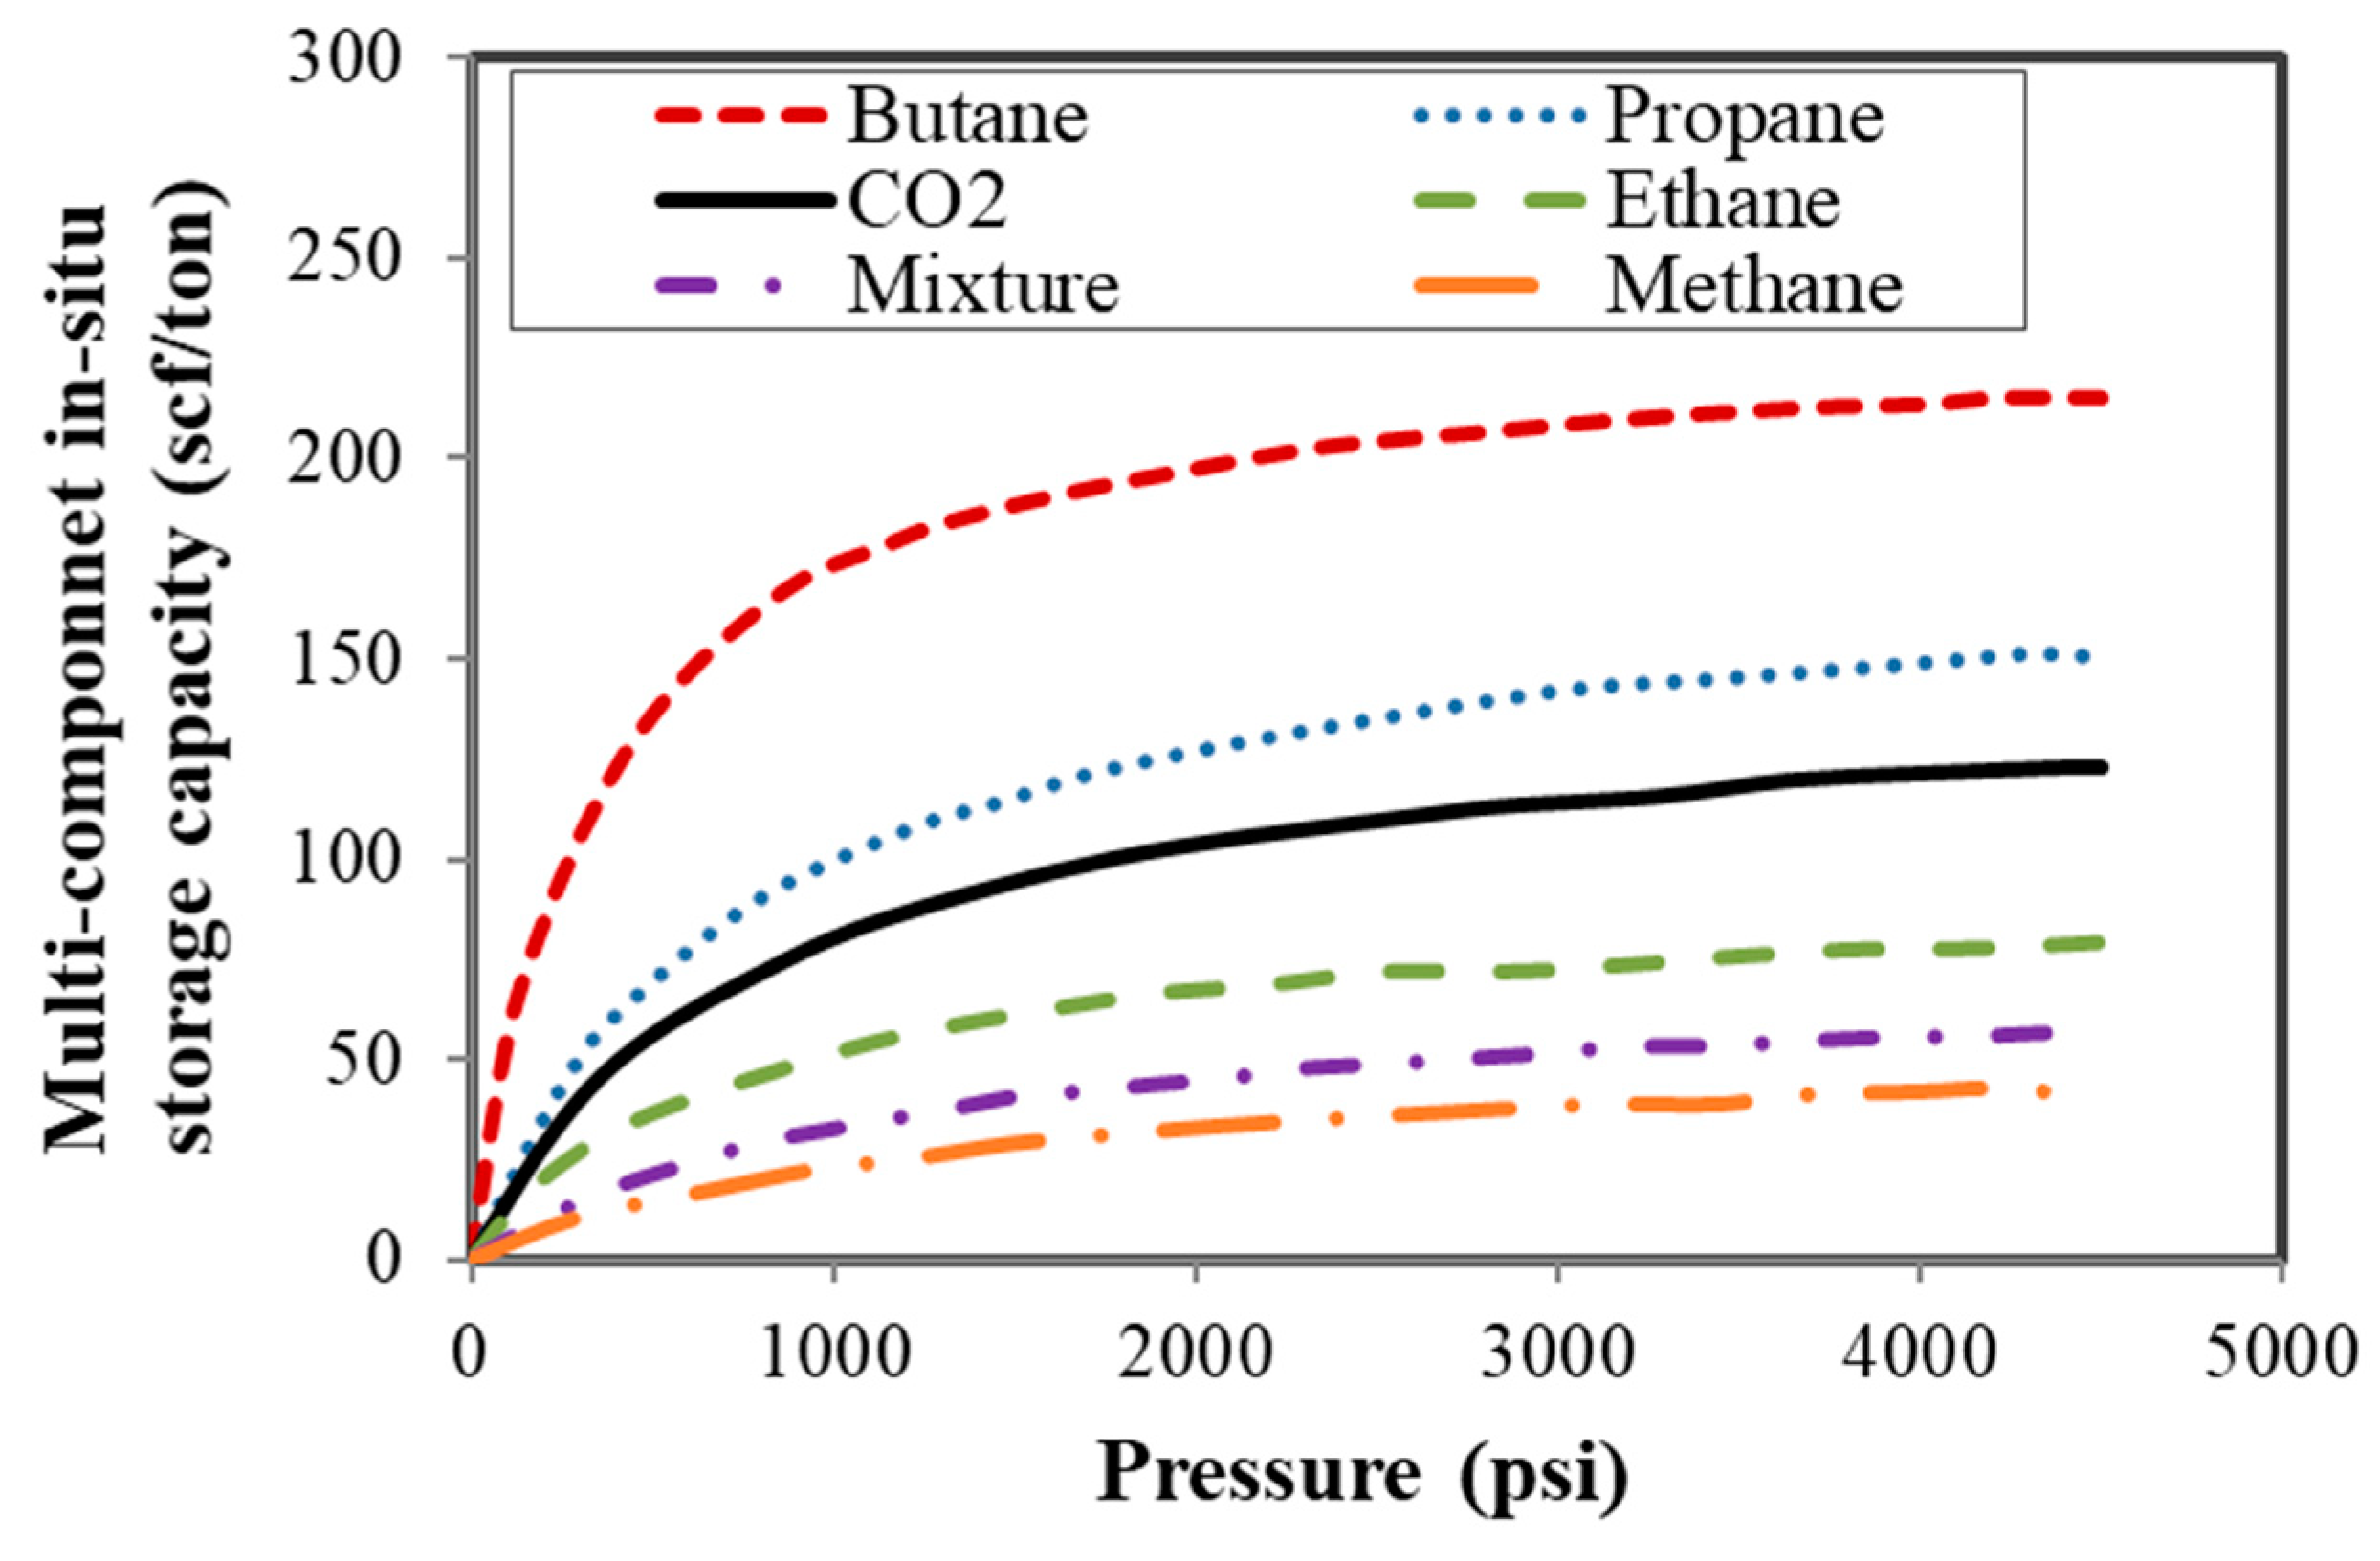
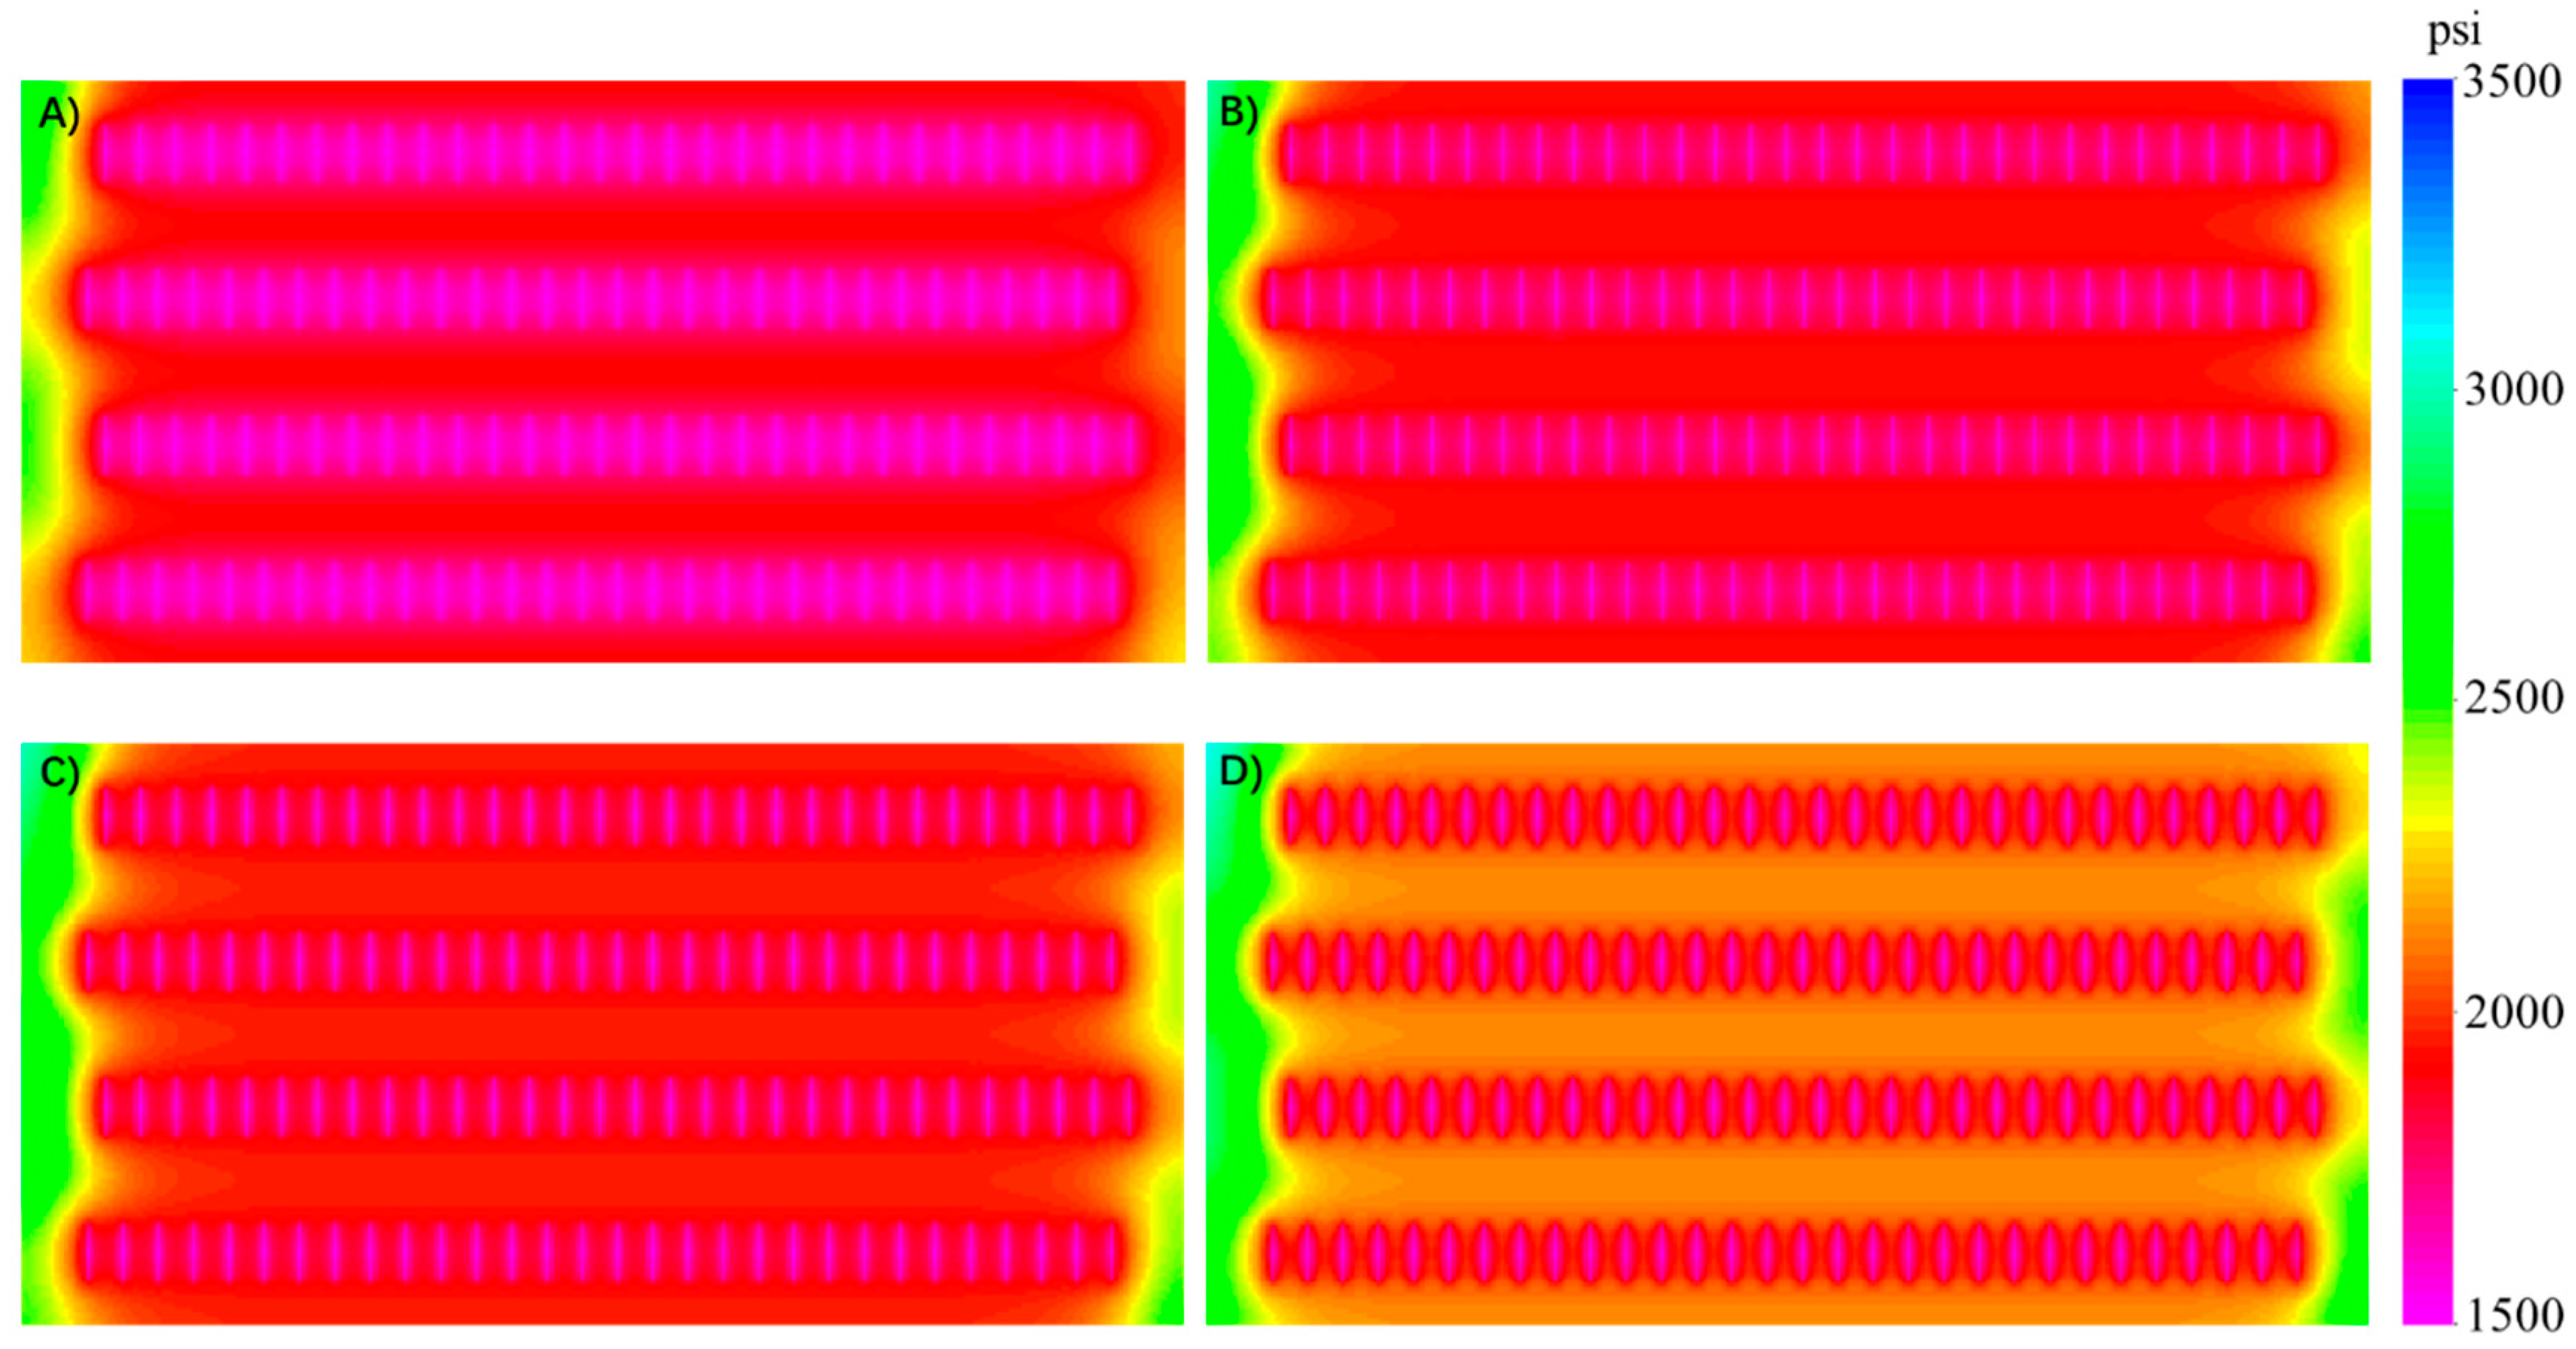
3. Results and Discussion

In this study, the molecular diffusion and adsorption of CO2 were both included in the reservoir simulation model. All reservoir properties keep the same as the reservoir model in Table 1 and history matching results. All models are assumed as no flow boundary condition. Mohebbinia et al. [50] stated that molecular diffusion transportation is important in tight rocks. According to the previous study, the range of measured CO2 diffusion coefficients in Decane is about 1.97 × 10⁻⁵ to 1.26 × 10⁻⁴ cm2/s when the temperature is 100 °F and pressure is up to 850 psi [51]. Kumar and Mittal [52] presented that diffusion coefficient of CO2 at the super-critical condition is much higher than that under the liquid condition. Since we have performed the sensitivity analysis of diffusion coefficients ranging from 0.0001 to 0.01 cm2/s [43], in this study, we set the CO2 diffusion coefficients of 0.001 cm2/s in this study. Reasonable measurement of CO2 diffusion coefficients should be conducted in the further study. The original data from Ambrose et al. [53] was applied to investigate the effect of adsorption. As shown in Figure 7, CO2 has a larger adsorption than the light components (Methane and Ethane). Hence, the diffusion coefficients and adsorption of other components are equal to zero [54]. It should be noted that the adsorption in this study is assumed as single layer and only CO2 adsorption is considered. The Langmuir model is applied to evaluate the mechanism of adsorption in this model.
We performed four cases to compare the effectiveness of CO2-EOR process. Different mechanisms are shown in Table 2.
Case A is set as the base case, in which primary depletion of the wells was investigated for 15 years. In the other three cases of CO2 Huff-n-Puff process, the four horizontal wells experience five cycles. The wells experience three years of primary depletion at the beginning, then they are converted to injection wells and begin one-month CO2 injection. Afterwards, the wells are shut in for one-month soaking. During this soaking time, CO2 diffuses into the matrix and contact with oil. Finally, the horizontal wells are put back to production again. A new cycle will repeat after one-year production. The CO2 injection rate of in the process is set as 5000 Mscf/day. Figure 8 illustrates the three stages of CO2 Huff-n-Puff process: CO2 injection, soaking period, and back production. According to the practical production history, BHP is constrained as 2000 psi in the Huff-n-Puff scenarios.
We evaluated the well performance at the end of production time, and the oil recovery factors of different scenarios are shown in Figure 9. Compared the base case (Case A) and Case B, the CO2 EOR process contributes to the incremental oil recovery of 0.7%. Considering the CO2 molecular diffusion (Case C), the oil recovery is 4.8% higher than that of the base case.
Figure 10 displays the oil viscosity and the swelling factor under different CO2 concentrations. In this study, oil swelling factor is defined as “the volume of the oil after CO2 injection divided by the volume of the oil before CO2 injection into the cell” [55]. As shown, the oil viscosity decreases and the swelling factor with the increase of the CO2 concentrations, indicating that the CO2 injection is beneficial for the oil swelling and increment of oil production. Additionally, the oil viscosity and swelling factor will further decrease for smaller pore sizes.
Figure 11 displays the CO2 distribution in Case B and Case C. As shown in Figure 11A, without considering the molecular diffusion, the CO2 molecules just penetrate into the matrix near the hydraulic fractures instead of moving into the matrix. Therefore, CO2 EOR process cannot be efficient as expected. When the molecular diffusion is considered, as shown in Figure 11B, it performs as the main driven force in the CO2 EOR process, promoting more CO2 molecules moving from hydraulic fractures to the matrix and mixing with the oil phase. CO2 would swell more oil and reduce oil viscosity, leading to the larger amount of oil production. Therefore, molecular diffusion is a significant mechanism during CO2 injection, which should be included in evaluating the performance of cyclic CO2 injection.
As presented in Figure 9, the ultimate oil recovery in Case D, which considering molecular diffusion and adsorption performs 2.1% higher than the base case (Case A) with primary production at the end of simulation, but 2.7% lower than Case C (only includes molecular diffusion), indicating that adsorption has negative influence on the well performance. The reason may be that the adsorption potential of methane and ethane is lower than CO2, resulting in desorption during the CO2-EOR process. However, the heavy components are not desorbed even with the CO2 injection. Hence, consideration of adsorption leads to less hydrocarbon production and smaller increase in the oil recovery.
The distribution of CO2 mole fraction clearly illustrates the impact of adsorption mechanism. Compared Figure 12 with Figure 11B, CO2 molecules do not move from fractures into matrix as far as the case only including the molecular diffusion (Case C). Less CO2 molecules will move into the oil phase, resulting in the weak oil mobility. Additionally, adsorption would decrease the injected volume of CO2 diffusing into shale oil because some portion of injected CO2 has been adsorbed into the surface. Therefore, the adsorption performs a negative effect on the CO2-EOR process.
The impacts of molecular diffusion and adsorption on the cumulative CO2 backflow was compared as shown in Figure 13. The black line represents the total CO2 injection volume. According to the simulation results in Figure 13, around 79% of injected CO2 will be produced back at the end of simulation time without molecular diffusion and adsorption (Case B). While about 67% of injected CO2 will flow back after 15 years only with molecular diffusion (Case C). Hence, molecular diffusion leads to large amount of CO2 trapping in the tight formations. Additionally, a better mixture of CO2 molecules and oil phase generates, resulting in higher cumulative oil production. If adsorption is considered (Case D), the cumulative CO2 backflow decreases to 59%. The mechanism of adsorption is positive to the CO2 storage, leading to more CO2 molecules trapped and less backflow to the ground after soaking. Since no CO2 molecules are injected in the primary production case (Case A), the percentage of CO2 backflow and relative CO2 storage are 0.
The difference of the average reservoir pressure is depicted in Figure 14. As shown, the average reservoir pressure of the base case with the primary production is the lowest. When the molecular diffusion and adsorption are included, the average reservoir pressure increases. The pressure of the case C with only molecular diffusion is higher, leading to the largest increment of oil production.
Figure 15 presented the pressure distribution after 15-year production. As shown, the pressure of the grid near the hydraulic fracture drops quickly. The pressure in Case C (Figure 15D) is higher than other cases. Molecular diffusion accelerates the pressurized CO2 molecules to diffuse from the fractures to the tight formations and light and intermediate hydrocarbons are extracted from the oil. Considering adsorption would decrease the injected volume of CO2 diffusing into the tight oil; therefore, the pressure in Case D is a little higher than Case C, as displayed in Figure 15C,D. It also implies that neglecting the molecular diffusion and adsorption will underestimate the well performance in the tight oil reservoirs. Therefore, these mechanisms should be reasonably included in the investigation of CO2-EOR process.

4. Conclusions

In this study, we proposed a useful compositional approach to simulate the CO2-EOR process in the Eagle Ford formation. Physical mechanisms of molecular diffusion and adsorption were accurately examined in this typical model. The conclusions from this study are obtained as follows:
(1)
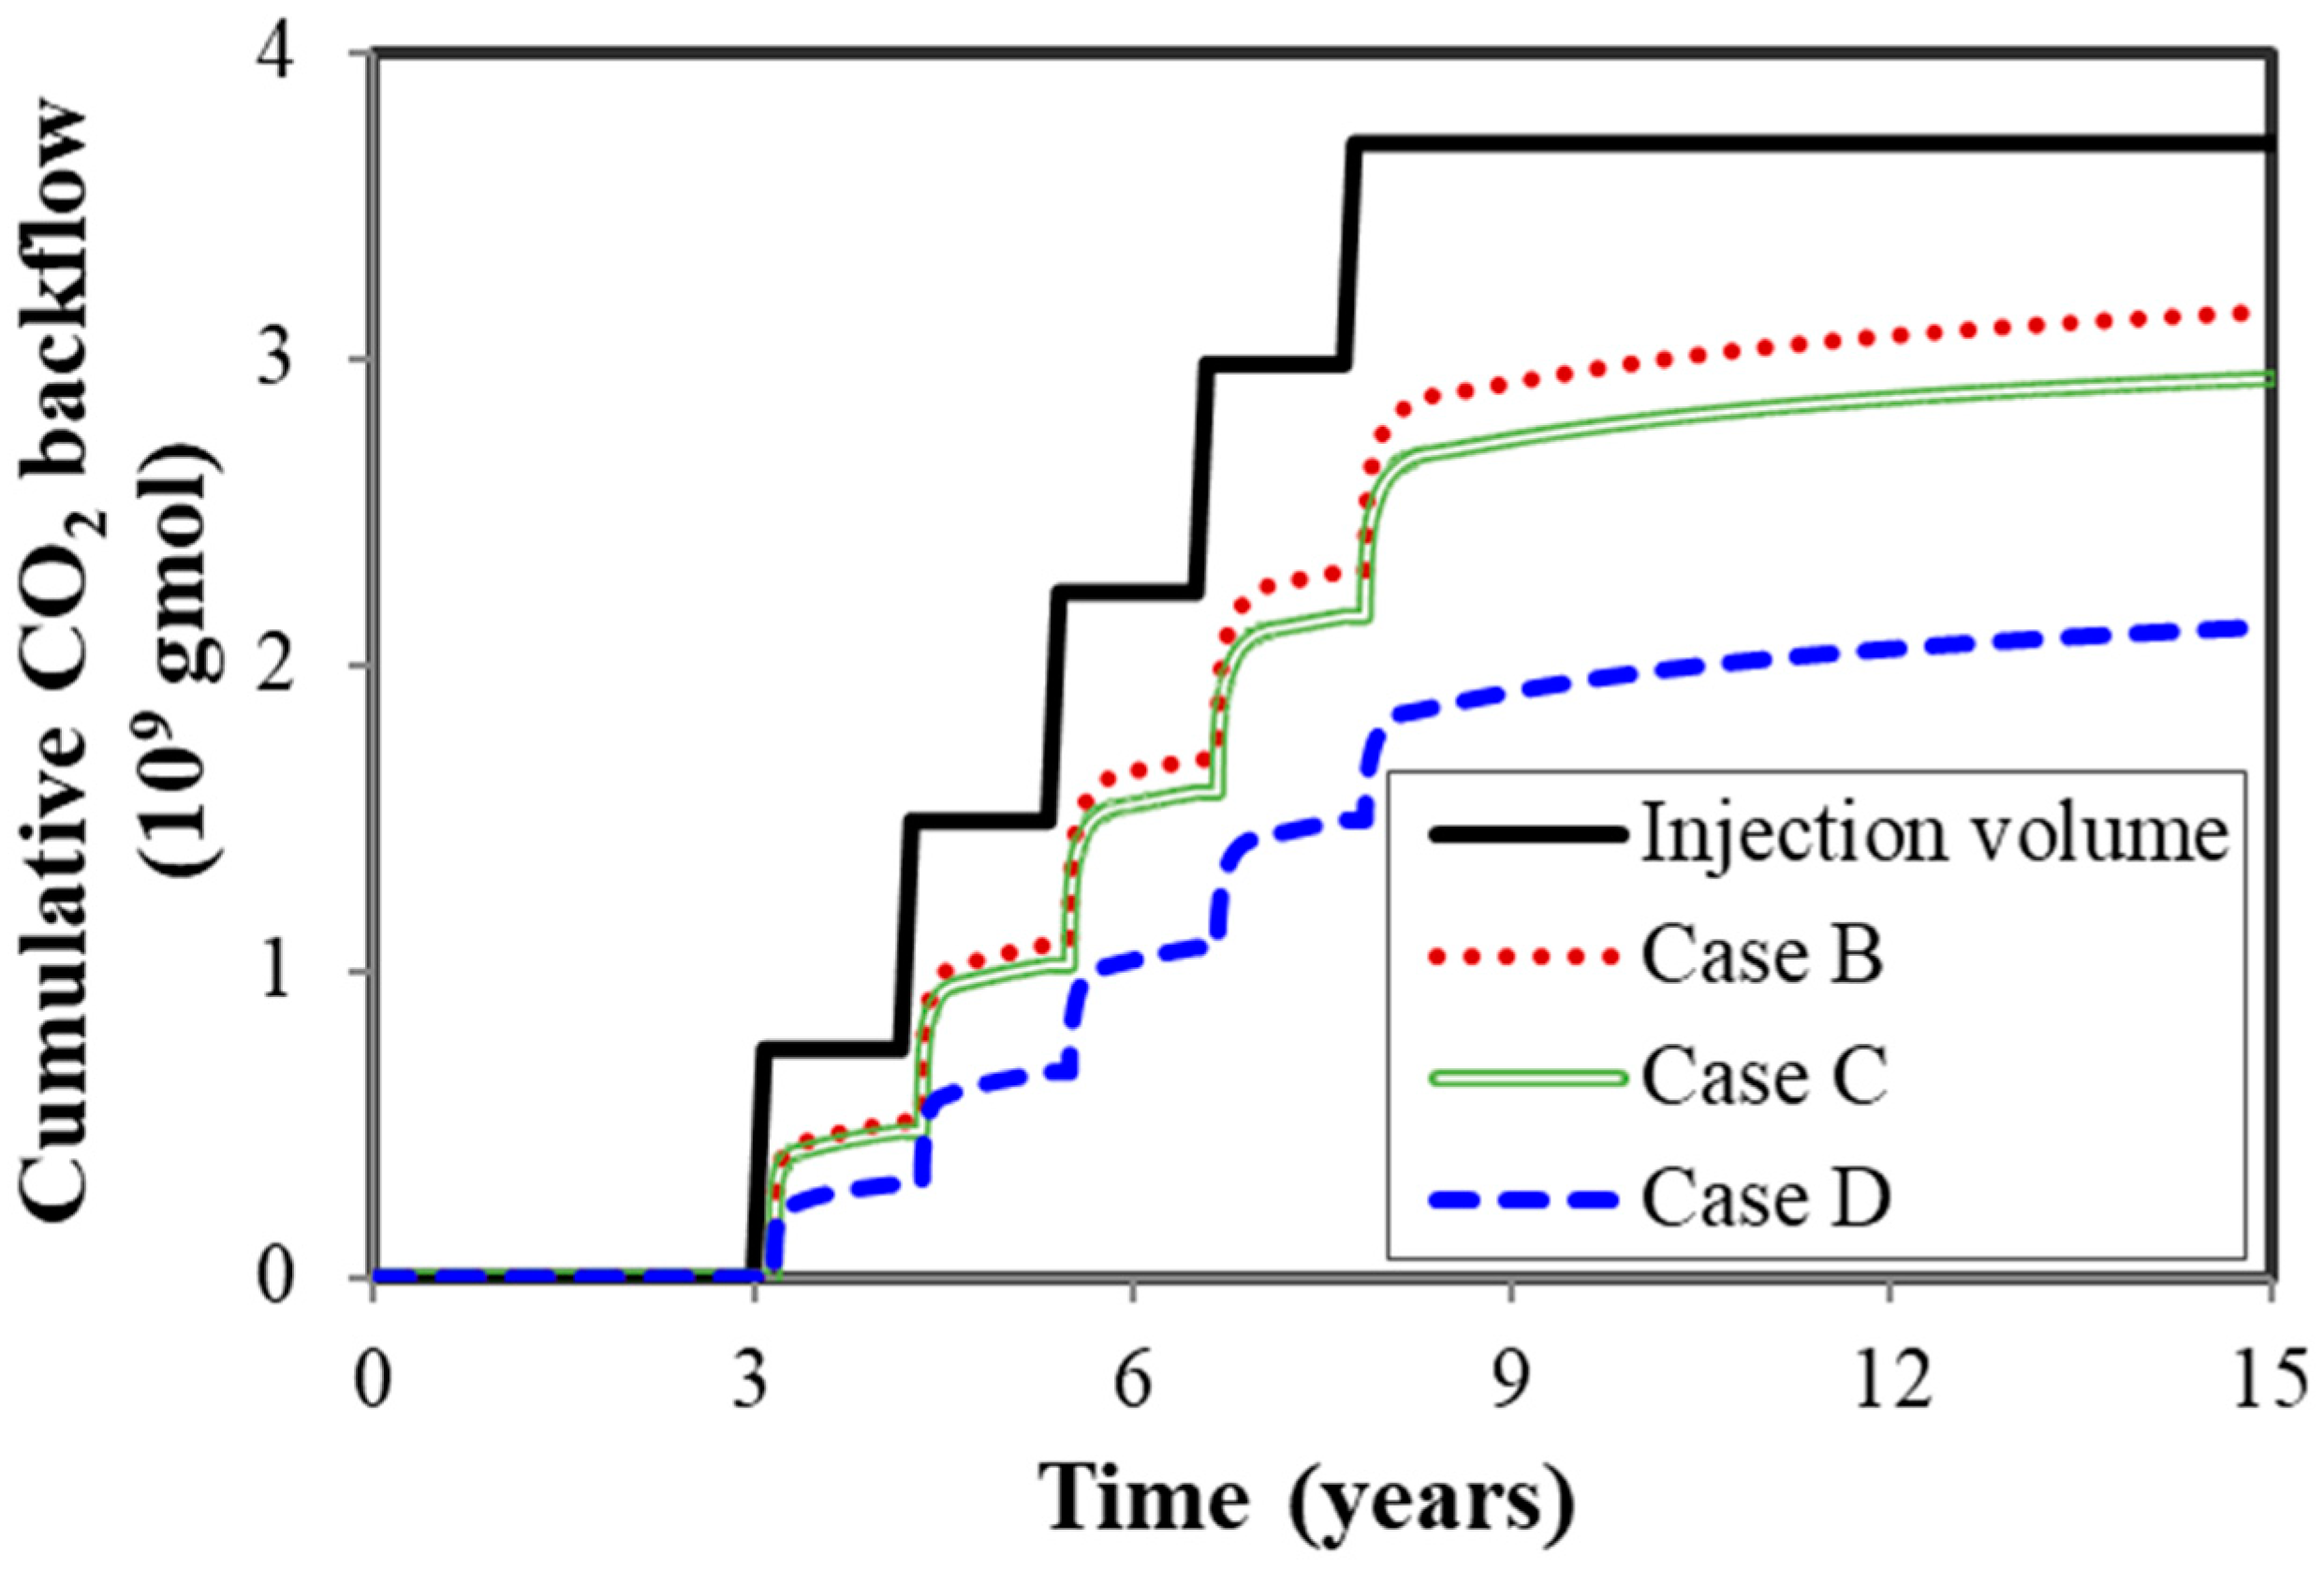
Simulation results illustrate that CO2 molecules move from fractures to matrix with the mechanism of CO2 molecular diffusion, which can efficiently improve the oil recovery factor in the CO2-EOR process. The oil recovery increases by 4.8% with the diffusion coefficient of 0.001 cm2/s compared to the base case.
(2)
Compared to the case with molecular diffusion, the mechanism of adsorption influences CO2 penetration into the matrix, performing a negative influence on the incremental oil recovery of the CO2 Huff-n-Puff process. In this study, the increment of oil recovery is 2.1% considering both molecular diffusion and adsorption, 2.7% lower than the case only including the molecular diffusion.
(3)
Results indicate that molecular diffusion and adsorption will decrease the cumulative CO2 backflow in the simulation of CO2-EOR process. For this typical reservoir, the cumulative CO2 backflow decreases to 59%. Hence, these mechanisms should be properly considered in the analysis.

Author Contributions

Conceptualization, Y.Z. and Q.Z.; methodology and investigation Y.Z.; writing—original draft preparation, Y.Z.; writing—review and editing, J.H. and Q.Z.; project administration, J.H.; funding acquisition, Y.Z., and J.H.

Funding

This research was funded by “National Natural Science Foundation of China, grant number 51804282”, “National Science and Technology Major Project of China, grant number 2017ZX05009-005”, “Fundamental Research Funds for the Central Universities, grant number 2652017294, 2652018209 and CXTD10-05 in UIBE”, and “PetroChina Innovation Foundation (2017D-5007-0312)”.

Acknowledgments

We would like to appreciate Computer Modeling Group Ltd. for providing the CMG software for this investigation.

Conflicts of Interest

The authors declare no conflict of interest.

References

  1. Salahshoor, S.; Fahes, M.; Teodoriu, C. A review on the effect of confinement on phase behavior in tight formations. J. Nat. Gas Sci. Eng. 2018, 51, 89–103. [Google Scholar] [CrossRef]
  2. Liu, P.; Zhang, X.; Wu, Y.; Li, X. Enhanced oil recovery by air-foam flooding system in tight oil reservoirs: Study on the profile-controlling mechanisms. J. Pet. Sci. Eng. 2017, 150, 208–216. [Google Scholar] [CrossRef]
  3. Liao, K.; Zhang, S.; Ma, X.; Zou, Y. Numerical investigation of fracture compressibility and uncertainty on water-loss and production performance in tight oil reservoirs. Energies 2019, 12, 1189. [Google Scholar] [CrossRef]
  4. Bai, J.; Liu, H.; Wang, J.; Qiao, G.; Peng, Y.; Gao, Y.; Yan, L.; Chen, F. CO2, Water and N2 injection for enhanced oil recovery with spatial arrangement of fractures in tight-oil reservoirs using Huff-’n-puff. Energies 2019, 12, 823. [Google Scholar] [CrossRef]
  5. Sheng, J.J. Critical review of field EOR projects in shale and tight reservoirs. J. Pet. Sci. Eng. 2017, 159, 654–665. [Google Scholar] [CrossRef]
  6. Hawthorne, S.B.; Gorecki, C.D.; Sorensen, J.A.; Steadman, E.N.; Harju, A.J.; Melzer, S. Hydrocarbon mobilization mechanisms from upper, middle, and lower Bakken reservoir rocks exposed to CO2. In Proceedings of the SPE Unconventional Resources Conference, Calgary, AB, Canada, 5–7 November 2013. [Google Scholar]
  7. Yu, W.; Lashgari, H.R.; Wu, K.; Sepehrnoori, K. CO2 injection for enhanced oil recovery in Bakken tight oil reservoirs. Fuel 2015, 159, 354–363. [Google Scholar] [CrossRef]
  8. Ren, B.; Ren, S.; Zhang, L.; Chen, G.; Zhang, H. Monitoring on CO2 migration in a tight oil reservoir during CCS-EOR in Jilin Oilfield China. Energy 2016, 98, 108–121. [Google Scholar] [CrossRef]
  9. Zhang, Y.; Yu, W.; Li, Z.; Sepehrnoori, K. Simulation study of factors affecting CO2 Huff-n-Puff process in tight oil reservoirs. J. Pet. Sci. Eng. 2018, 163, 264–269. [Google Scholar] [CrossRef]
  10. Zuloaga-Molero, P.; Yu, W.; Xu, Y.; Sepehrnoori, K.; Li, B. Simulation Study of CO2-EOR in Tight Oil Reservoirs with Complex Fracture Geometries. Sci. Rep. 2016, 6, 33445. [Google Scholar] [CrossRef] [PubMed]
  11. Sanchez Rivera, D. Reservoir Simulation and Optimization of CO2 Huff-and-Puff Operations in the Bakken Shale. Master’s Thesis, The University of Texas at Austin, Austin, TX, USA, 2014. [Google Scholar]
  12. Janiga, D.; Czarnota, R.; Stopa, J.; Wojnarowski, P. Huff and puff process optimization in micro scale by coupling laboratory experiment and numerical simulation. Fuel 2018, 224, 289–301. [Google Scholar] [CrossRef]
  13. Wan, T.; Zhang, Y.; Wang, W.; Jiang, J. Pore-scale analysis of gas huff-n-puff enhanced oil recovery and waterflooding process. Fuel 2018, 215, 561–571. [Google Scholar] [CrossRef]
  14. Hoteit, H. Modeling diffusion and gas-oil mass transfer in fractured reservoirs. J. Pet. Sci. Eng. 2013, 105, 1–17. [Google Scholar] [CrossRef]
  15. Hoteit, H.; Firoozabadi, A. Compositional modeling by the combined discontinuous Galerkin and mixed method. SPE J. 2006, 11, 19–34. [Google Scholar] [CrossRef]
  16. Nojabaei, B.; Johns, R.T.; Chu, L. Effect of capillary pressure on phase behavior in tight rocks and shales. SPE Res. Eval. Eng. 2013, 16, 281–289. [Google Scholar] [CrossRef]
  17. Sandoval, D.; Yan, W.; Michelsen, M.L.; Stenby, E.H. Phase envelope calculations for reservoir fluids in the presence of capillary pressure. In Proceedings of the SPE Annual Technical Conference and Exhibition, Houston, TX, USA, 28–30 September 2015. [Google Scholar]
  18. Zhang, Y.; Di, Y.; Yu, W.; Sepehrnoori, K. A comprehensive model for investigation of CO2-EOR with nanopore confinement in the Bakken tight oil reservoir. SPE Res. Eval. Eng. 2019, 22, 122–136. [Google Scholar] [CrossRef]
  19. Sapmanee, K. Effects of Pore Proximity on Behavior and Production Prediction of Gas/Condensate. Master’s Thesis, University of Oklahoma, Norman, OK, USA, 2011. [Google Scholar]
  20. Zhang, K.; Jia, N.; Liu, L. CO2 storage in fractured nanopores underground: Phase behaviour study. Appl. Energy 2019, 238, 911–928. [Google Scholar] [CrossRef]
  21. Zhang, K.; Jia, N.; Li, S. Millimeter to nanometer-scale tight oil–CO2 solubility parameter and minimum miscibility pressure calculations. Fuel 2018, 220, 645–653. [Google Scholar] [CrossRef]
  22. Kang, S.M.; Fathi, E.; Ambrose, R.J.; Akkutlu, I.Y.; Sigal, R.F. CO2 Storage Capacity of Organic-Rich Shales. In Proceedings of the SPE Annual Technical Conference and Exhibition, Florence, Italy, 19–22 September 2010. [Google Scholar]
  23. Cipollar, C.L.; Lolon, E.P.; Erdle, J.C.; Rubin, B. Reservoir modeling in shale-gas reservoirs. SPE Res. Eval. Eng. 2010, 12, 638–653. [Google Scholar] [CrossRef]
  24. Yang, S.; Chen, Z.; Wei, Y.; Wu, K.; Shao, L.; Wu, W. A simulation model for accurate prediction of uneven proppant distribution in the Marcellus Shale coupled with reservoir geomechanics. In Proceedings of the SPE Eastern Regional Meeting, Morgantown, WV, USA, 13–15 October 2015. [Google Scholar]
  25. Clarkson, C.R.; Haghshenas, B. Modeling of supercritical fluid adsorption on organic-rich shales and coal. In Proceedings of the SPE Unconventional Resources Conference, The Woodlands, TX, USA, 10–12 April 2013. [Google Scholar]
  26. Haghshenas, B.; Qanbari, F.; Clarkson, C.R. Simulation of enhanced recovery using CO2 in a liquid-rich western Canadian unconventional reservoir: Accounting for reservoir fluid adsorption and compositional heterogeneity. In Proceedings of the SPE Unconventional Resources Conference, Calgary, AB, Canada, 15–16 February 2017. [Google Scholar]
  27. Yang, S.; Wei, Y.; Chen, Z.; Wu, W.; Xu, J. Effects of multicomponent adsorption on enhanced shale reservoir recovery by CO2 injection coupled with reservoir geomechanics. In Proceedings of the SPE Low Perm Symposium, Denver, CO, USA, 5–6 May 2016. [Google Scholar]
  28. Wan, T.; Mu, Z. The use of numerical simulation to investigate the enhanced Eagle Ford shale gas condensate well recovery using cyclic CO2 injection method with nano-pore effect. Fuel 2018, 233, 123–132. [Google Scholar] [CrossRef]
  29. Sun, R.; Yu, W.; Xu, F.; Pu, H.; Miao, J. Compositional simulation of CO2 Huff-n-Puff process in Middle Bakken tight oil reservoirs with hydraulic fractures. Fuel 2019, 236, 1446–1457. [Google Scholar] [CrossRef]
  30. Wang, L.; Yu, W. Mechanistic simulation study of gas Puff and Huff process for Bakken tight oil fractured reservoir. Fuel 2019, 239, 1179–1193. [Google Scholar] [CrossRef]
  31. Czarnota, R.; Janiga, D.; Stopa, J. Acoustic investigation of CO2 mass transfer into oil phase for vapor extraction process under reservoir conditions. Int. J. Heat Mass Transf. 2018, 127, 430–437. [Google Scholar] [CrossRef]
  32. Diaz Campos, M.; Akkutlu, I.Y.; Sigal, R.F. A molecular dynamics study on natural gas solubility enhancement in water confined to small pores. In Proceedings of the SPE Annual Technical Conference and Exhibition, New Orleans, LA, USA, 4–7 October 2009. [Google Scholar]
  33. Devegowda, D.; Sapmanee, K.; Civan, F.; Sigal, R.F. Phase behavior of gas condensates in shales due to pore proximity effects: Implications for transport, reserves and well productivity. In Proceedings of the SPE Annual Technical Conference and Exhibition, San Antonio, TX, USA, 8–10 October 2012. [Google Scholar]
  34. Singh, S.K.; Sinha, A.; Deo, G.; Singh, J.K. Vapor-liquid phase coexistence, critical properties, and surface tension of confined alkanes. J. Phys. Chem. C 2009, 113, 7170–7180. [Google Scholar] [CrossRef]
  35. Reid, R.C.; Prausnitz, J.M.; Poling, B.E. The Properties of Gases and Liquids; McGraw Hill: New York, NY, USA, 1987. [Google Scholar]
  36. CMG. GEM-GEM User’s Guide; Computer Modeling Group Ltd.: Calgary, AB, Canada, 2012. [Google Scholar]
  37. Lashgari, H.R. Development of a Four-Phase Thermal-Chemical Reservoir Simulator for Heavy Oil. Ph.D. Thesis, The University of Texas at Austin, Austin, TX, USA, 2014. [Google Scholar]
  38. Sigmund, P.M. Prediction of Molecular Diffusion at Reservoir Conditions. Part II—Estimating the Effects of Molecular Diffusion and Convective Mixing in Multicomponent Systems. J. Can. Pet. Technol. 1976, 15, 53–62. [Google Scholar] [CrossRef]
  39. Nghiem, L.X.; Kohse, B.F.; Sammon, P.H. Compositional simulation of the vapex process. In Proceedings of the Canadian International Petroleum Conference, Calgary, AS, Canada, 4–8 June 2000. [Google Scholar]
  40. Yu, W.; Sepehrnoori, K. Optimization of well spacing for Bakken tight oil reservoirs. In Proceedings of the Unconventional Resources Technology Conference, Denver, CO, USA, 25–27 August 2014. [Google Scholar]
  41. Luo, S.; Wolff, M.; Ciosek, J.M.; Rasdi, M.F.; Neal, L.; Arulampalam, P.; Willis, S.K. Probabilistic reservoir simulation workflow for unconventional resource play: Bakken case study. In Proceedings of the SPE EUROPEC/EAGE Annual Conference and Exhibition, Vienna, Austria, 23–26 May 2011. [Google Scholar]
  42. Condon, S.M.; Dyman, T.S. Geologic Assessment of Undiscovered Conventional Oil and Gas Resources in the Upper Cretaceous Navarro and Taylor Groups, Western Gul Province; Texas: USGS Digital Data Series; USGU: Reston, VG, USA, 2006.
  43. Zhang, Y.; Di, Y.; Shi, Y.; Hu, J. Cyclic CH4 injection for enhanced oil recovery in the Eagle Ford shale reservoirs. Energies 2018, 11, 3094. [Google Scholar] [CrossRef]
  44. Orangi, A.; Nagarajan, N.R.; Honarpour, M.M.; Rosenzweig, J.J. Unconventional shale oil and gas-condensate reservoir production, impact of rock, fluid, and hydraulic fractures. In Proceedings of the SPE Hydraulic Fracturing Technology Conference and Exhibition, The Woodlands, TX, USA, 24–26 January 2011. [Google Scholar]
  45. Peng, D.Y.; Robinson, D.B. A new two-constant equation of state. Ind. Eng. Chem. Fundam. 1976, 15, 59–64. [Google Scholar] [CrossRef]
  46. Zhang, Y.; Lashgari, H.R.; Di, Y. Capillary pressure effect on phase behavior of CO2/hydrocarbons in unconventional reservoirs. Fuel 2017, 197, 575–582. [Google Scholar] [CrossRef]
  47. Yu, W.; Zhang, Y.; Varavei, A.; Sepehrnoori, K.; Zhang, T.; Wu, K.; Miao, J. Compositional simulation of CO2 Huff-n-Puff in Eagle Ford tight oil reservoirs with CO2 molecular diffusion, nanopore confinement and complex natural fractures. In Proceedings of the SPE Improved Oil Recovery Conference, Tulsa, OK, USA, 14–18 April 2018. [Google Scholar]
  48. Sanaei, A.; Jamili, A.; Callard, J.; Mathur, A. Production modeling in the Eagle Ford gas condensate window: Integrating new relationships between core permeability, pore size, and confined PVT properties. In Proceedings of the SPE Western North American and Rocky Mountain Joint Meeting, Denver, CO, USA, 16–18 April 2014. [Google Scholar]
  49. Zhang, Y.; Yu, W.; Di, Y.; Sepehrnoori, K. Investigation of nanopore confinement on fluid flow in tight reservoirs. J. Pet. Sci. Eng. 2017, 150, 265–271. [Google Scholar] [CrossRef]
  50. Mohebbinia, S.; Wong, T. Molecular diffusion calculations in simulation of gasfloods in fractured reservoirs. In Proceedings of the SPE Reservoir Simulation Conference, Montgomery, AL, USA, 20–22 February 2017. [Google Scholar]
  51. Renner, T.A. Measurement and correlation of diffusion coefficients for CO2 and rich-gas applications. SPE Res. Eng. 1988, 3, 517–523. [Google Scholar] [CrossRef]
  52. Kumar, P.; Mittal, K.L. Handbook of Microemulsion Science and Technology, 1st ed.; CRC Press: New York, NY, USA, 1999. [Google Scholar]
  53. Ambrose, R.J.; Hartman, R.C.; Akkutlu, I.Y. Multi-component sorbed-phase considerations for shale gas-in-place calculations. In Proceedings of the SPE Production and Operations Symposium, Oklahoma City, OK, USA, 27–29 March 2011. [Google Scholar]
  54. Alfarge, D.; Wei, M.; Bai, B. Mechanistic study for the applicability of CO2-EOR in unconventional liquids rich reservoirs. In Proceedings of the SPE Improved Oil Recovery Conference, Tulsa, OK, USA, 14–18 April 2018. [Google Scholar]
  55. Habibi, A.; Yassin, M.R.; Dehghanpour, H.; Bryan, D. CO2-oil interactions in tight rocks: An experimental study. In Proceedings of the SPE unconventional resources conference, Calgary, AB, Canada, 15–16 February 2017. [Google Scholar]
Figure 1. Simulation model for the field-scale study including 4 horizontal wells.
Energies 12 02136 g001
Figure 2. The critical properties of different components under different sizes. (A) Critical temperatures; (B) Critical pressure.
Energies 12 02136 g002
Figure 3. P-T phase diagrams of different pore sizes.
Energies 12 02136 g003
Figure 4. PVT properties of the fluid in the Eagle Ford formation. (a) Oil viscosity; (b) Bo; (c) GOR.
Energies 12 02136 g004
Figure 5. Results of history matching. (A) Oil flow rate; (B)Water flow rate; (C) Gas flow rate; (D) Bottom hole pressure.
Energies 12 02136 g005
Figure 6. Relative permeability curves from history matching results. (A) Water-oil; (B) Liquid-gas.
Energies 12 02136 g006
Figure 7. Isothermal adsorption of different components from Ambrose et al. Reprint with permission [53]; 2011; Society of Petroleum Engineers.
Energies 12 02136 g007
Figure 8. Scenarios of CO2 Huff-n-Puff process. (A) CO2 injection; (B) Soaking period; (C) Back production.
Energies 12 02136 g008
Figure 9. Oil recovery factors in different cases.
Energies 12 02136 g009
Figure 10. Oil viscosity and swelling factor under different CO2 concentrations.
Energies 12 02136 g010
Figure 11. Comparisons of distribution of CO2 mole fraction with and without molecular diffusion. (A)Without molecular diffusion (Case B); (B)With molecular diffusion (Case C).
Energies 12 02136 g011
Figure 12. Distribution of CO2 mole fraction for the case with molecular diffusion and adsorption.
Energies 12 02136 g012
Figure 13. Comparisons of CO2 storage capacity in different scenarios.
Energies 12 02136 g013
Figure 14. Average pressure of different scenarios.
Energies 12 02136 g014
Figure 15. Difference of pressure distribution in different scenarios. (A) Case A; (B) Case B; (C) Case D; (D) Case C.
Energies 12 02136 g015
Table 1. Properties of reservoir and fracture from the Eagle Ford formation.
ParametersValueUnit
Initial reservoir pressure7500psi
Reservoir temperature270°F
Production time15years
Matrix porosity12%-
Total compressibility1 × 10−6psi−1
Matrix permeability0.001mD
Initial water saturation17%-
Fracture height40ft
Fracture spacing320ft
Fracture half-length
(HM parameter)
220ft
Fracture conductivity
(HM parameter)
48mD-ft
Table 2. Physical mechanisms in different cases.
CaseCO2 Huff-n-PuffMolecular DiffusionAdsorption
Case ANNN
Case BYNN
Case CYYN
Case DYYY

