Abstract
Past experience of gas production from methane-hydrate-bearing sediments indicates that sand migration is a major factor restricting the production of gas from methane-hydrate reservoirs. One important geotechnical aspect of sand migration is the influence of grain detachment on the existing stresses. This paper focuses on understanding and quantifying the nature of this aspect using different approaches, with a focus on discrete element method (DEM) simulations of sand detachment from hydrate-bearing sand samples. The investigation in the paper reveals that sand migration affects isotropic and deviatoric stresses differently. In addition, the existence of hydrate moderates the magnitude of stress relaxation. Both of these features are currently missing from continuum-based models, and therefore, a new constitutive model for stress relaxation is suggested, incorporating the research findings. Model parameters are suggested based on the DEM simulations. The model is suitable for continuum mechanics-based simulations of gas production from hydrate reservoirs.
1. Introduction
One of the most substantial fossil candidates for fulfilling the increasing global energy demand is methane-hydrate (MH). The exact amount of methane gas in MH reservoirs is still unknown, but recent estimates range from – under STP conditions [1,2,3,4,5]. MH is an ice-like solid, stable under high pressure and low-temperature conditions, and consequentially, is found mostly in permafrost and deep ocean floors [6,7]. In nature, MH is typically hosted in highly-porous sediments such as sands and clays, rather than in a bulk form [8]. MH within sandy sediments is of great engineering interest, as high permeability constitutes a critical factor for viable gas production [9]. Therefore, significant research effort has been placed on sites in which MH is abundant in sands [10,11,12,13].
MH has attracted research interest in a range of engineering and scientific fields, among which are geophysical exploration [14,15,16,17]; environmental impact [7,18,19]; geohazards (e.g., slope stability, dissociation-induced tsunami events, deep-water mud volcanoes) [20,21,22,23]; mechanical property evaluation [24,25,26,27,28]; macro- and micro-mechanical constitutive modeling [29,30,31,32,33,34,35]; thermo-hydro-chemical-mechanical (THCM) formulations for simulation of gas production and the associated difficulties [36,37,38,39,40,41,42,43,44,45,46,47].
Three methods have been proposed for MH production: depressurization, thermal injection, and replacement. A few production tests have been performed using these three methods. Among the notable field tests, the depressurization method was used in Alaska North Slope, at 2007 [48]; at the permafrost Mallik, Canada, at 2007 and 2008 [49]; in Nankai Trough, at 2013 [50]. The thermal injection technique was used at the Mackenzie River Delta (Canada) at 2002 [51]. The CO exchange method was used in the Ignik Sikumi well in Alaska at 2012 [52]. In general, the depressurization method is considered the most economical [53,54], but it appears to be accompanied by geotechnical difficulties. For example, the tests in Mallik and Nankai Trough were interrupted in the early stages by an excessive sand production. These difficulties have led to the conclusion that a better understanding of the sand migration phenomenon in hydrate-bearing sands is a prerequisite for successful future production of gas from MH reservoirs [55,56].
Sand migration in MH-bearing sediments has been incorporated in the formulation of Uchida et al. [44], complementing the thermo-hydro-chemical-mechanical (THCM) model of Klar et al. [42]. The model of Uchida et al. [44] involves a series of rationally derived analytical expressions, but the specific values of the coefficients involved in each expression were guessed, without any proper experimental support or fundamental analysis. Cohen et al. [57] have made the first steps towards the quantification of the parameters considering a hydrate-free material and a simple primitive-cube grain arrangement. Furthermore, they have developed a simple elastic expression of an ideal isotropic case. Uchida et al. [58] have incorporated some of these findings in the simulations of sand migration in hydrate-bearing sediments interbedded with mud layers, during gas production.
Broadly, several aspects related to sand migration were included in the formulation of the model of Uchida et al. [44]; for example, the flow gradient leading to grain detachment and grain settlement, the effect of shear strain on the detachment potential, and the effect of grain detachment on the stresses. The current paper focuses on the topic of stress reduction due to sand migration, with the aim of evaluating the correctness of the model of Uchida et al. [44] and establishing the values of coefficients under complex loading conditions and hydrate existence. For this aim, a micromechanical investigation is performed using the recently-developed cohesionless model of Cohen and Klar [35].
The paper is composed of four main sections. First, the existing models for coupling grain detachment and stress relaxation are briefly presented, and a new model is suggested, for which a calibration of the parameters is required. Secondly, the evaluation of the parameters for an elastic linear solid is performed. Then, artificial DEM samples are generated, and the phenomenon of stress relaxation is examined for different densities and hydrate saturation. Finally, conclusions and recommendations are drawn.
2. Sand Migration Effect on Stresses
It is assumed that sand production is accompanied by the removal of material that constitutes the soil skeleton, which can affect the stress state. For constrained conditions (that is, zero strains), the removal of material leads to stress reduction, while for unconstrained conditions (that is, fixed stresses), this leads to deformation (development of strains). In a general boundary value problem, it may lead to stress redistribution accompanied by displacements. When formulating a strain controlled stress–strain relation, the former condition should be considered. In the continuum formulation of Uchida et al. [44], the stress reduction due to sand migration was represented by:
where are the components of the effective stress tensor, is the intact solid mass, and is a proportionality coefficient assumed to govern the phenomenon. The specific value of was never evaluated by Uchida et al. [44], but instead, a value of 1.0 was arbitrarily selected for the sake of sensitive analysis, acknowledging the need for further fundamental research on the topic. In Uchida et al. [58], a value of two was used based on the limited results of Cohen et al. [57].
Equation (1) infers that all components of the tensor are equally affected by grain detachment. For the ideal case of loads carried by force chains of a primitive cube sample, this assumption is correct (if the inter-particle friction is neglected). In this particle arrangement, each grain is part of three perpendicular chains, and a grain removal will cause the failure of these chains, as shown by Cohen et al. [57]. Furthermore, an area ratio, rather than a volumetric ratio, governs the stress change, and Equation (1) becomes:
where is the mass of a single particle. This relation, however, is a function of the size of the sample and cannot be implemented in a continuum-based finite element formulation. Additionally, the assumption that the chains are of the length of the sample is not correct for random samples. Furthermore, the equal influence of grain disappearance on all the components of the stress tensor may be true for specific conditions, but the general situation is such that grain detachment can have a different effect on spherical and deviatoric stresses.
Moreover, the presence of methane-hydrate in the pores may affect the mechanism of stress relaxation caused by sand migration, and the above expression (Equation (1)) cannot depict such a dependency. Aiming for a more general constitutive relation between grain detachment and stress relaxation, the following relation is suggested herein:
where is the Kronecker delta, and are the mean stress and the components of the deviatoric stress tensor, respectively, and are the spherical and deviatoric relaxation coefficients for clean sand, and and are the hydrate saturation influence on the spherical and deviatoric stress relaxation (compared to clean sand soils). The above term degenerates into Equation (1) when and . These coefficients may be a function of the soil mechanical properties and load characteristics. The values of the four coefficients of Equation (3) (, , , and ) are evaluated in the following sections using different analytical and numerical approaches.
3. Elasticity-Based Stress Relaxation
This section presents a stress relaxation term based on the theory of elasticity. It extends the preliminary investigation of Cohen et al. [57] to include deviatoric stresses. For completeness, the expressions of Cohen et al. [57] are also presented.
Stress relaxation can be quantified for the case of a linear elastic continuum using the governing equations of equilibrium and the constitutive model. In the case of isotropic stress acting on a sphere, the solution of the radial displacement has the form of . The disappearance of material can be modeled as the formation of a single spherical void within a concentric sphere of material. The boundary conditions are the fixed outer boundary of the representative sphere (located at R) and the inner cavity (with radius ) relaxed from the initial isotropic stress () to zero (see Figure 1a), and the final expression obtained for small cavities is (further details are provided in [57]):
where is Poisson’s ratio. For larger cavities, the expression is no longer valid. However, its violation is minor, as shown in Figure 1b, which is based on the general expression (given in [57]).
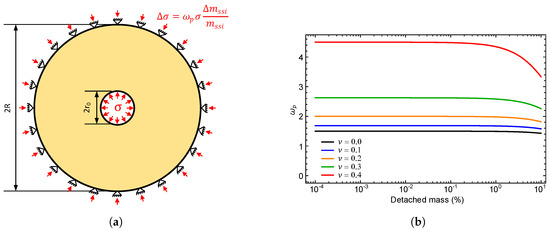
Figure 1.
Linear elastic approach for evaluating spherical stress relaxation: (a) illustration of the analytical boundary value problem; (b) as a function of detached mass (colors represent different Poisson’s ratio).
The above expression is suitable for purely spherical stress. For determining the change of the deviatoric stresses () a finite differences scheme (FLAC3D) was used to obtain the values. A uniaxial loading case was considered in the simulation to represent the deviatoric loading. The value of the stress relaxation was evaluated by numerical simulations on a cube with a cubic cavity, loaded on the internal horizontal faces by normal stress, representing the effect of the disappearance of the initial stresses on the cavity, due to the cavity formation. Motion was blocked at the external faces (Figure 2a). Due to the superposition principle, the reactions at the external faces had the same value (and opposite sign) of the change on the stresses caused by sand detachment.
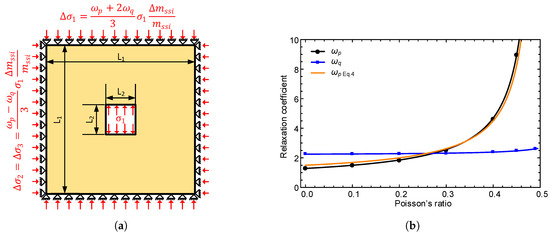
Figure 2.
Linear elastic approach for evaluating spherical and deviatoric stress relaxation: (a) illustration of the numerical boundary value problem; (b) results of and (dots = numerical values, orange line = analytical solution for ).
The ratio between the cavity width () and the external cube width () was set to (a small cavity in terms of the analytic solution of ). The results for different values of Poisson’s ratio can be seen in Figure 2b. The numerical results for agree well with the expression derived from the continuum equations. As can be seen, for a Poisson’s ratio smaller than 0.3, the values of and are rather similar and revolve around two (the value taken by Uchida et al. [58], based on [57], in their recent simulations). Considering that the effective stress formulation is associated with a Poisson’s ratio smaller than 0.3 (as larger values are usually kept for total stress analysis, with 0.5 being the value of undrained conditions), the similarity between and implied that the suggestion of Uchida et al. [44] for a single parameter ( in [44]) is sufficient. This, however, may not always be the case, as discussed and shown in the following section.
4. Random DEM Model
The conceptual models presented earlier are important for recognizing the two mechanisms governing the stress relaxation due to cavity formation: relaxation of a continuous solid (elastic model) and the reduction of forces caused by a chain collapse (chain model). However, both models misrepresent a real granular matter with random geometry. On one hand, the elastic approach does not include the soil limited strength, plastic flow, and the possibility of local collapse. On the other hand, the chain approach describes a non-realistic case where the length of the chains is equal to the length of the sample.
In order to investigate the mechanisms of stress relaxation due to sand migration in MH sediments through a more realistic representation, a DEM formulation for the soil solid particles was developed and implemented within the numerical scheme of PFC3D [59]. A preliminary investigation of DEM clean sand random samples was performed by Cohen et al. [57]. The analysis is extended here for the general stress state and for MH-bearing sediments.
4.1. Clean Sand Skeleton
4.1.1. Analysis and Results
The sand skeleton was composed of 12,000 spherical particles with diameters ranging from 0.15 mm–0.25 mm (following a uniform distribution), with the interparticle friction coefficient of , in a cubic region, limited by six rigid frictionless walls. In the first stage, the spheres were randomly generated without any overlap, with high porosity. Secondly, by free fall, the structure reached equilibrium. This free fall sample was defined as the most loose sample (porosity of ). It is believed that the desired parameters ( and ) are a function of the porosity. Hence, the phenomenon of sand migration needs to be analyzed in specimens with different densities. For creating denser numerical samples, a dynamic mechanism was implemented to compact the specimens to different porosities (ranging from ). A denser sample was obtained by temporarily reducing the interparticle friction, and was defined as the densest sample ().
Once the system reached the desired isotropic stress (1 MPa), deviatoric stress was applied, and the boundary particles (i.e., in contact with the walls) were fixed. A random particle was then deleted for simulating sand migration. Stress relaxation was quantified as the mean change of the unbalanced force on the boundary particles. This procedure was executed repeatedly, between 20 and 200 times (depending on the stability of the sample), and each time, an additional random particle was removed.
Another parameter that may affect the nature of stress relaxation is the mobilized strength. A local collapse of chain forces can be more eminent if the specimen is close to failure. For testing the influence of the mobilized strength on the measured parameters, samples with different stress ratios were tested. The stresses (before grain removal) and were maintained constant (1 MPa), and increased from 1 MPa to the strength of the sample, by increments of 0.25 MPa.
Figure 3 shows the results of the numerical simulations for both spherical and deviatoric stress relaxation as a function of grain detachment for 28 DEM samples, combining five different porosities and different stress ratios. Fitted linear trend lines are also shown in the figure, determined by the stress change ( and ) for 0.6% of detached mass (), except in cases where the sample collapsed earlier (i.e., 20% stress relaxation). The slopes of these lines represent the fitted coefficients and .
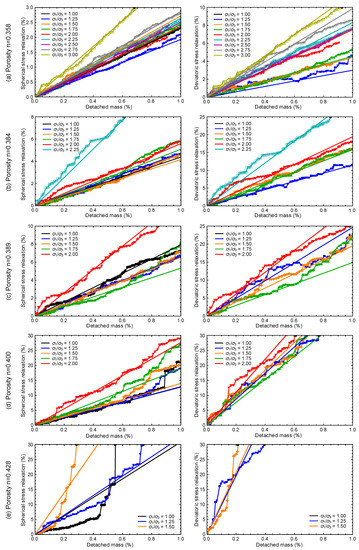
Figure 3.
Spherical and deviatoric stress relaxation for various porosity. Colors represent different principal stress ratios (dots = DEM results, lines = fitted linear relations).
4.1.2. Discussion
The agreement between the fitted lines and the DEM data in Figure 3 supports the hypotheses of a linear proportionality between the relative stress relaxation and the relative detached mass.
Based on the results, it may be said that the spherical stress relaxation coefficient () was indifferent to the stress ratio (), and the deviatoric relaxation coefficient () slightly increased with the stress ratio for the denser samples. However, no significant and consistent correlation with the mobilized strength was found. Hence, both parameters and may be considered constants for each density and are not a function of the mobilized strength, unless the sample is close to failure. These parameters were evaluated by averaging the linear fit coefficients of the other simulations (Figure 4). It should be mentioned that the most loaded sample of each porosity presented an intensified stress relaxation, probably due to the proximity to failure, and for this reason, these simulations were not considered in the averaging process.
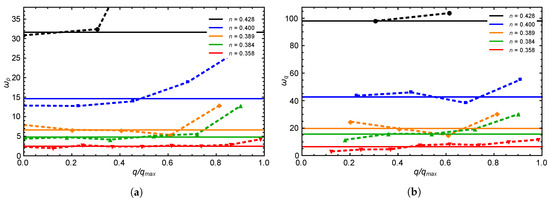
Figure 4.
Spherical and deviatoric stress relaxation as a function of mobilized strength: (a) values of as a function of ; (b) values of as a function of . Colors represent different porosities (dots = DEM results linked by dashed lines, continuous line = fitted constant values).
When presenting the parameters as a function of the relative density (), the linear-constant behavior suggested in Cohen et al. [57] was maintained, as can be seen in Figure 5. This linear-constant behavior has been attributed to the transition from the elastic solution, adequate for dense soils, to the chain model that governs the behavior of loose soils. The fitted -dependent values are:
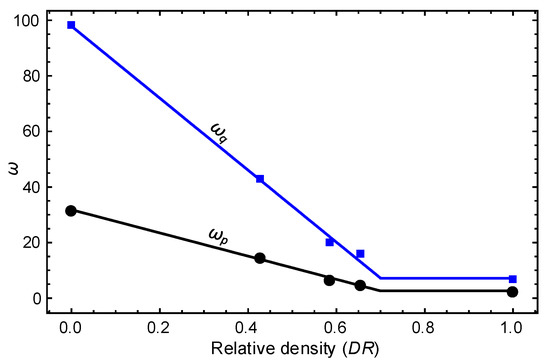
Figure 5.
Stress relaxation coefficients as a function of the relative density (dots = DEM simulations, lines = suggested relation).
4.2. Hydrate-Bearing Sediments
4.2.1. Analysis and Results
Hydrate found within the soil skeleton affects both the stiffness and the strength of the soil. Triaxial tests of natural and artificial hydrate-bearing sediments show that as hydrate saturation rises, the samples become stiffer and stronger. In addition, the volumetric behavior is influenced by MH saturation: MH-bearing specimens are more dilative than clean sand samples when subjected to shearing (e.g., [25,60]).
For examining the MH influence on stress relaxation, the DEM numerical analyses need to be extended for representing MH sediments. DEM models for MH can roughly be divided into three categories: (1) models where the hydrate is represented as particles seeded in the pores within the sand and hydrate is not part of the soil skeleton and, consequentially, there is no effect on the stiffness and a small effect on the strength were obtained (e.g., [61]); (2) models in which the hydrate is represented by bonding sand particles and the bond properties (e.g., strength, stiffness) are a function of the hydrate saturation, without a real volume of hydrate (e.g., [32,62]); (3) models in which the hydrate particles are bonded to sand particles, with a considerable effect on initial stiffness and volumetric dilatancy (e.g., [30,63]). Recent studies indicate that the contribution of the hydrate to the strength of the soil is mostly of a frictional nature, rather than cohesive [26,60,64]. For this reason, in this study, a particular procedure is used for seeding the MH particles after the sand skeleton is stable, following the methodology developed by Cohen and Klar [35]. In this approach, hydrate particles are precisely positioned within the sand skeleton such that they contribute to the behavior in a frictional manner. This is performed by searching for couples of sand particles for which their distance is smaller than the diameter of the MH particle imagined to be positioned in their vicinity. After defining a local cylindrical coordinate system, an MH particle is precisely positioned to be in contact with at least two sand particles and without any overlap with the existing particles (Figure 6a). This formulation is able to reproduce the MH saturation effect on the stress—strain and volumetric response even for minute deformations, without bonding sand particles. This procedure may be repeated for all couples of sand particles, resulting in “rings” of MH around sand contacts. A typical cubic sample of MH-bearing sand is presented in Figure 6b (sand represented by orange, MH by blue). The MH influence on the soil response in this formulation has been proven to be a function of a “participation factor”, the amount of MH particles that may be part of the soil skeleton relative to the overall amount of MH particles that can be seeded around the sand–sand contacts. Further details of the DEM formulation and analyses of the influence of the inter-particle friction coefficient and MH size on the macro stress-strain response are provided in Cohen and Klar [35]. Table 1 presents the properties of the soil and hydrate particles. The Hertz–Mindlin nonlinear formulation [65] was adopted for the constitutive contact model (force–displacement behavior). The elastic parameters of the solid hydrate material are based on [24].
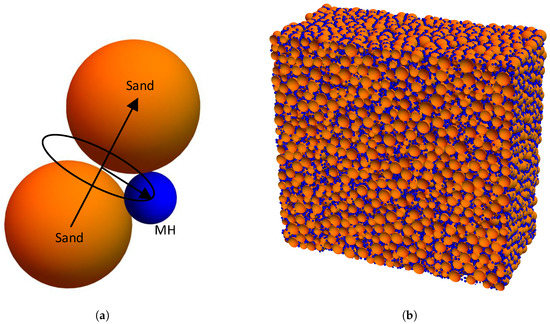
Figure 6.
Hydrate seeding procedure: (a) schematic seeding position of a single methane-hydrate (MH) particle; (b) a typical MH cube sample (cross-section at the middle of a cube).

Table 1.
Material properties.
The aforementioned procedure for modeling grain detachment for the clean sand soils was implemented for the MH numerical specimens. That is, after the soil was loaded and the boundaries were fixed (macro strain set to zero), sand particles were repeatedly deleted and the soil stress relaxation was calculated after each grain removal. Note that hydrate formation is considered to occur after isotropic stress has developed and before grain detachment (assuming hydrate formation occurred after soil existence). Deviatoric stresses, if they exist, would develop after hydrate formation, but before sand migration (assuming that they would develop due to the construction of the well and the production of gas).
Cohen and Klar [35] have introduced the concept of the participation factor to represent the mechanical contribution of the hydrate particles to the soil stiffness and strength, as part of the statistical interplay between the hydrate particle location and the soil skeleton. A 100% participation factor indicates that all hydrate particles affect the mechanical behavior, while 0% indicates that none contribute to the mechanical response. In the current work, two different participation factors are considered, of 35% and 70%, and are labeled as “70%MH” and “35%MH” in the figures. The triaxial numerical tests and the secant modulus for clean sand and “70%MH” samples are presented in Figure 7a,b, respectively.
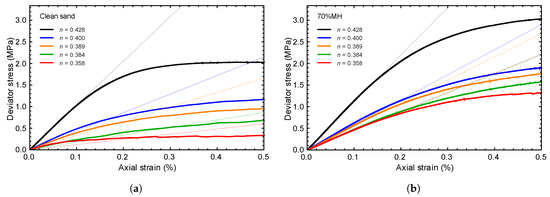
Figure 7.
Stress-strain curves: (a) clean sands; (b) “70%MH” samples. Colors represent different porosities (thin lines = a linear relation based on ).
The hydrate influence on stress relaxation was quantified by comparing the stress change for MH bearing samples and stress change for clean sand samples of an equal void ratio. In terms of Equation (3), the parameters and are equal to the ratio of the spherical and deviatoric stress relaxation of clean sand and MH samples, for the same value of detached relative mass. It should be noted that the relative detached mass is defined as the mass of the deleted particles divided by the mass of the sand particles; that is, the total intact mass is composed of sand exclusively, without including the mass of hydrate particles.
The spherical stress relaxation of MH samples with different porosities is shown in Figure 8a as a function of the relaxation of clean sand caused by the same value of relative detached mass. In this presentation, the slope of the lines is equal to .
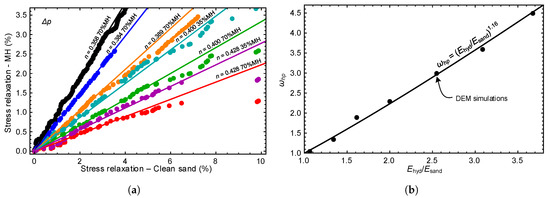
Figure 8.
Hydrate influence on spherical stress relaxation: (a) comparison of stress relaxation in clean sand samples and MH samples under equal detached mass. Colors represent different porosity and MH participation factors (dots = DEM simulations, lines = fitted linear relations); (b) as a function of the stiffness ratio of hydrate-bearing sediment to clean sand (dots = DEM simulations, line = fitted function).
In denser samples, the effect of the hydrate presence within the pores was less significant. This may be because the value of quantifies the contribution of hydrate to soil stability, preventing local collapse, while dense soils are naturally more stable than loose soils.
However, presenting as a function of the relative density or the degree of saturation may be misleading, since the hydrate’s influence on the soil properties may be a function of the hydrate morphology and the host properties, i.e., two samples with the same and hydrate saturation degree may be differently influenced by MH if they are composed of different hydrate morphologies. It is suggested that the stiffness ratio of hydrate-bearing sediment to clean sand () captures more effectively the contribution of the hydrate to the mechanical response. Therefore, a correlation between and the relative increase in the material stiffness was investigated. A power-law was found to fit the relation between the MH effect on stress relaxation () and MH effect on the stiffness () well, as can be seen in Figure 8b, where is the secant Young’s modulus under 50% strength mobilization. When a clear failure was not observed, the failure stress was defined under the axial strain of 3%. Note that for clean sand the value of was one by definition. The fitted expression for is:
Figure 9a presents the value of as a function of the detached mass for six simulations (each of which contained two simulations, one for a hydrate sample and the other for clean sand). The values were compared with those obtained by Equation (7) (horizontal lines) based on the stiffness ratio. The apparent increase of for large values of detached mass related to partial collapses of the clean sand samples, compared to the MH samples. This increase was more substantial for the loose samples, where the hydrate contribution for the stability was crucial. In the case of a total collapse of the clean sand sample, tended to infinity.
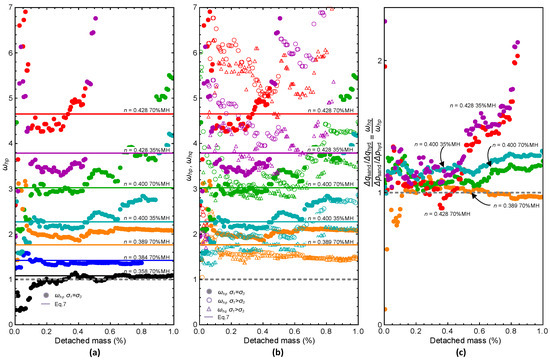
Figure 9.
Comparison between spherical and deviatoric influence of MH on stress relaxation. Colors represent different porosity and MH participation factors: (a) spherical relaxation (dots = DEM results, lines = Equation (7)); (b) spherical and deviatoric relaxation, represented by circles and triangles, respectively; samples stressed isotropically and deviatorically are marked by filled and hollow markers, respectively (dots = DEM results, lines = Equation (7)); (c) ratio of to .
The influence of MH on the deviatoric stresses was also calculated. The results are presented in Figure 9b, together with the influence on the spherical stress, for comparison.
4.2.2. Discussion
The results indicate that the mechanical influence of hydrate on the stress relaxation for spherical and deviatoric stresses is rather similar, such that for practical purposes, . The ratio for five DEM configurations is presented in Figure 9c and is close to 1.0. Consequently, a single parameter can be used for describing the influence of MH on the stress relaxation (i.e., ), and Equation (3) degenerates to:
When the new coefficient is calculated as a function of the ratio, based on the results of and for both isotropically- and deviatorically-loaded DEM samples, it results in a rather uniform relation, which could be represented by a power-law. The results and the fitted power-law are presented in Figure 10, where is:
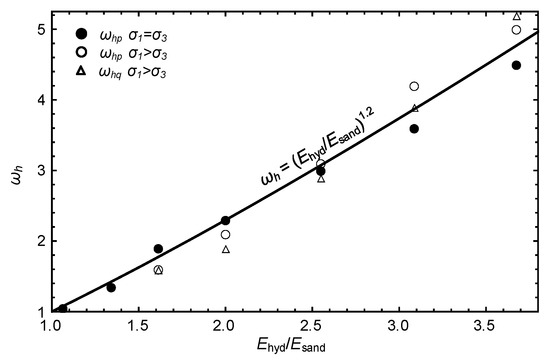
Figure 10.
Fitted value of and as a function of the stiffness ratio (circles = spherical relaxation of DEM; triangles = deviatoric relaxation of DEM; filled and hollow markers represent samples isotropically and deviatorically loaded, respectively; line = power-law fit for ).
The exponent value was found to be rather similar to that obtained from purely spherical stress relaxation, 1.2 instead of 1.16.
5. Conclusions
Recent difficulties in gas production from hydrate-bearing sediments suggest that sand migration may hinder gas production and may jeopardize wellbore stability. This suggests that numerical formulations of gas production from hydrate-bearing sediments should be enriched with geomechanically-based sand migration models. This paper presented a new formulation for calculating the sand production effects on the existing stresses, with the aim of offering a calibrated continuum-based constitutive model for the stress relaxation. The model parameters were evaluated by a series of DEM simulations in which sand particles were removed for representing sand detachment. Various densities and hydrate conditions were evaluated in the study to relate stress relaxation with hydrate presence and soil relative density.
It was found that stress relaxation was more substantial for loose samples, and deviatoric stresses were affected more intensively than spherical stress when sand detachment occurred. Samples containing MH in the pore space presented a lower stress relaxation, apparently due to the positive influence of MH on soil stability. It was found that the hydrate presence moderates the deviatoric and spherical stress relaxation in a similar manner, allowing for a three-parameter model for the stress relaxation. The parameters were calibrated as a function of the relative density and the stiffness increase factor due to hydrate presence.
While the paper provided a constitutive law and parameters for continuum-based formulations, further study is warranted, to relate flow condition and grain detachment. Extension to more realistic cases incorporating various hydrate morphologies and non-spherical particles could be considered a logical step towards expansion of the work, as well as incorporation of the intermediate stress (or Lode angle). These can be achieved using similar tools to those presented in the paper. For example, critical flow gradients may be established by semi-coupled analyses in which forces are applied to grains, based on relative velocity (considering the fluid velocity as an independent decoupled parameter) and fundamental relations such as that of Ergun [66]. Representation of the grading curve of specific sands and mixed hydrate particle size distribution may help to evaluate different morphologies and grain arrangements. Complex stress conditions may be used based on iterative macro- and micro-analyses, where stress conditions from THCM analyses are extracted and applied to a representative microscale DEM sample. Each of these steps constitutes a major challenge by itself and is beyond the scope of the current fundamental study.
Author Contributions
Funding acquisition, A.K. and K.Y.; investigation, E.C. and A.K.; methodology, E.C. and A.K.; software, E.C.; supervision, A.K.; writing, original draft, E.C. and A.K.; writing, review and editing, K.Y.
Funding
This research was supported by the Research Consortium for Methane Hydrate Resources in Japan (MH21) and the Ministry of Economic, Trade and Industry (METI), through Japan Oil, Gas and Metals National Corporation (JOGMEC) and the Technion—Israel Institute of Technology (Technion Project Number 2020489). The authors are grateful for the financial support for this project.
Conflicts of Interest
The authors declare no conflicts of interests.
References
- Milkov, A.V. Global estimates of hydrate-bound gas in marine sediments: How much is really out there? Earth-Sci. Rev. 2004, 66, 183–197. [Google Scholar] [CrossRef]
- Klauda, J.B.; Sandler, S.I. Global Distribution of Methane Hydrate in Ocean Sediment. Energy Fuels 2005, 19, 459–470. [Google Scholar] [CrossRef]
- Archer, D.; Buffett, B.; Brovkin, V. Ocean methane hydrates as a slow tipping point in the global carbon cycle. Proc. Natl. Acad. Sci. USA 2009, 106, 20596–20601. [Google Scholar] [CrossRef] [PubMed]
- Boswell, R.; Collett, T.S. Current perspectives on gas hydrate resources. Energy Environ. Sci. 2011, 4, 1206–1215. [Google Scholar] [CrossRef]
- Johnson, A.H. Global resource potential of gas hydrate–a new calculation. Nat. Gas Oil 2011, 304, 285–4541. [Google Scholar]
- Englezos, P.; Kalogerakis, N.; Dholabhai, P.; Bishnoi, P. Kinetics of formation of methane and ethane gas hydrates. Chem. Eng. Sci. 1987, 42, 2647–2658. [Google Scholar] [CrossRef]
- Kvenvolden, K.A.; Rogers, B.W. Gaia’s breath—Global methane exhalations. Mar. Pet. Geol. 2005, 22, 579–590. [Google Scholar] [CrossRef]
- Waite, W.F.; Stern, L.A.; Kirby, S.H.; Winters, W.J.; Mason, D.H. Simultaneous determination of thermal conductivity, thermal diffusivity and specific heat in sI methane hydrate. Geophys. J. Int. 2007, 169, 767–774. [Google Scholar] [CrossRef]
- Sung, W.M.; Huh, D.G.; Ryu, B.J.; Lee, H.S. Development and application of gas hydrate reservoir simulator based on depressurizing mechanism. Korean J. Chem. Eng. 2000, 17, 344–350. [Google Scholar] [CrossRef]
- Dallimore, S. Overview of science program, JAPEX/JNOC/GSC Mallik 2L-38 gas hydrate research well. In Scientific Results from Japex/JNOC/GSC Mallik 2L-38 Gas Hydrate Research Well; Geological Survey of Canada: Ottawa, ON, Canada, 1999. [Google Scholar]
- Collett, T. Growing interest in gas hydrates. Oilfield Rev. 2000, 12, 43–57. [Google Scholar]
- Uchida, T.; Tsuji, T. Petrophysical Properties of Natural Gas Hydrates-Bearing Sands and Their Sedimentology in the Nankai Trough. Resour. Geol. 2004, 54, 79–87. [Google Scholar] [CrossRef]
- Dallimore, S.R.; Collett, T.S. Scientific Results from the Mallik 2002 Gas Hydrate Production Research Well Program, Mackenzie Delta, Northwest Territories, Canada; Geological Survey of Canada: Ottawa, ON, Canada, 2005. [Google Scholar]
- Hyndman, R.; Spence, G. A seismic study of methane hydrate marine bottom simulating reflectors. J. Geophys. Res. Solid Earth 1992, 97, 6683–6698. [Google Scholar] [CrossRef]
- Nur, A. BSR and methane hydrates: New challenges for geophysics and rock physics. In Proceedings of the Offshore Technology Conference, Houston, TX, USA, 6–9 May 1996. [Google Scholar]
- Andreassen, K.; Mienert, J.; Bryn, P.; Singh, S.C. A double gas-hydrate related bottom simulating reflector at the Norwegian continental margin. Ann. N. Y. Acad. Sci. 2000, 912, 126–135. [Google Scholar] [CrossRef]
- Yuan, J.; Edwards, R. The assessment of marine gas hydrates through electrical remote sounding: Hydrate without a BSR? Geophys. Res. Lett. 2000, 27, 2397–2400. [Google Scholar] [CrossRef]
- Archer, D. Methane hydrate stability and anthropogenic climate change. Biogeosciences 2007, 4, 521–544. [Google Scholar] [CrossRef]
- Koh, C.A.; Sloan, E.D. Natural gas hydrates: Recent advances and challenges in energy and environmental applications. AIChE J. 2007, 53, 1636–1643. [Google Scholar] [CrossRef]
- Milkov, A. Worldwide distribution of submarine mud volcanoes and associated gas hydrates. Mar. Geol. 2000, 167, 29–42. [Google Scholar] [CrossRef]
- Grozic, J. Interplay between gas hydrates and submarine slope failure. In Submarine Mass Movements and Their Consequences; Springer: Dordrecht, The Netherlands, 2010; pp. 11–30. [Google Scholar]
- Mascle, J.; Mary, F.; Praeg, D.; Brosolo, L.; Camera, L.; Ceramicola, S.; Dupre, S. Distribution and geological control of mud volcanoes and other fluid/free gas seepage features in the Mediterranean Sea and nearby Gulf of Cadiz. Geo-Mar. Lett. 2014, 34, 89–110. [Google Scholar] [CrossRef]
- Yelisetti, S.; Spence, G.D.; Riedel, M. Role of gas hydrates in slope failure on frontal ridge of northern Cascadia margin. Geophys. J. Int. 2014, 199, 441–458. [Google Scholar] [CrossRef]
- Shimizu, H.; Kumazaki, T.; Kume, T.; Sasaki, S. Elasticity of single-crystal methane hydrate at high pressure. Phys. Rev. B 2002, 65, 212102. [Google Scholar] [CrossRef]
- Masui, A.; Haneda, H.; Ogata, Y.; Aoki, K. Effects of Methane Hydrate Formation On Shear Strength of Synthetic Methane Hydrate Sediments. In International Society of Offshore and Polar Engineers; International Society of Offshore and Polar Engineers: Seoul, Korea, 2005. [Google Scholar]
- Pinkert, S. Rowe’s Stress-Dilatancy Theory for Hydrate-Bearing Sand. Int. J. Geomech. 2016, 17, 06016008. [Google Scholar] [CrossRef]
- Yoneda, J.; Masui, A.; Konno, Y.; Jin, Y.; Kida, M.; Katagiri, J.; Nagao, J.; Tenma, N. Pressure-core-based reservoir characterization for geomechanics: Insights from gas hydrate drilling during 2012–2013 at the eastern Nankai Trough. Mar. Pet. Geol. 2017, 86, 1–16. [Google Scholar] [CrossRef]
- Choi, J.H.; Dai, S.; Lin, J.S.; Seol, Y. Multi-Stage Triaxial Tests on Laboratory-Formed Methane Hydrate-Bearing Sediments. J. Geophys. Res. Solid Earth 2018. [Google Scholar] [CrossRef]
- Soga, K.; Lee, S.; Ng, M.; Klar, A. Characterisation and engineering properties of methane hydrate soils. Charact. Eng. Prop. Nat. Soils 2006, 4, 2591–2642. [Google Scholar]
- Jung, J.W.; Santamarina, J.C.; Soga, K. Stress-strain response of hydrate-bearing sands: Numerical study using discrete element method simulations. J. Geophys. Res. (Solid Earth) 2012, 117, B04202. [Google Scholar] [CrossRef]
- Uchida, S.; Soga, K.; Yamamoto, K. Critical state soil constitutive model for methane hydrate soil. J. Geophys. Res. Solid Earth 2012, 117. [Google Scholar] [CrossRef]
- Jiang, M.; Zhu, F.; Liu, F.; Utili, S. A bond contact model for methane hydrate-bearing sediments with interparticle cementation. Int. J. Numer. Anal. Methods Geomech. 2014, 38, 1823–1854. [Google Scholar] [CrossRef]
- Lin, J.S.; Seol, Y.; Choi, J.H. An SMP critical state model for methane hydrate-bearing sands. Int. J. Numer. Anal. Methods Geomech. 2015, 39, 969–987. [Google Scholar] [CrossRef]
- Sánchez, M.; Gai, X.; Santamarina, J.C. A constitutive mechanical model for gas hydrate bearing sediments incorporating inelastic mechanisms. Comput. Geotech. 2017, 84, 28–46. [Google Scholar] [CrossRef]
- Cohen, E.; Klar, A. A cohesionless micromechanical model for gas hydrate-bearing sediments. Granul. Matter 2019, 21, 36. [Google Scholar] [CrossRef]
- Moridis, G.J. Numerical studies of gas production from methane hydrates. In Proceedings of the SPE Gas Technology Symposium, Society of Petroleum Engineers, Calgary, AL, USA, 30 April–2 May 2002. [Google Scholar]
- Klar, A.; Soga, K. Coupled deformation-flow analysis for methane hydrate production by depressurized wells. In Proceedings of the 3rd Biot Conference on Poromechanics, Oklahoma City, OK, USA, 25–27 May 2005. [Google Scholar]
- Rutqvist, J.; Moridis, G.J. Coupled hydrologic, thermal and geomechanical analysis of well bore stability in hydrate-bearing sediments. In Proceedings of the Offshore Technology Conference, Houston, TX, USA, 5–8 May 2008. [Google Scholar]
- Kurihara, M.; Sato, A.; Funatsu, K.; Ouchi, H.; Yamamoto, K.; Numasawa, M.; Ebinuma, T.; Narita, H.; Masuda, Y.; Dallimore, S.R.; et al. Analysis of production data for 2007/2008 Mallik gas hydrate production tests in Canada. In Proceedings of the International Oil and Gas Conference and Exhibition in China, Society of Petroleum Engineers, Beijing, China, 8–10 June 2010. [Google Scholar]
- Klar, A.; Soga, K.; Ng, M. Coupled deformation–flow analysis for methane hydrate extraction. Geotechnique 2010, 60, 765–776. [Google Scholar] [CrossRef]
- Janicki, G.; Schlüter, S.; Hennig, T.; Lyko, H.; Deerberg, G. Simulation of methane recovery from gas hydrates combined with storing carbon dioxide as hydrates. J. Geol. Res. 2011, 2011, 462156. [Google Scholar] [CrossRef]
- Klar, A.; Uchida, S.; Soga, K.; Yamamoto, K. Explicitly Coupled Thermal Flow Mechanical Formulation for Gas-Hydrate Sediments. SPE J. 2013, 18, 196–206. [Google Scholar] [CrossRef]
- Gupta, S.; Helmig, R.; Wohlmuth, B. Non-isothermal, multi-phase, multi-component flows through deformable methane hydrate reservoirs. Comput. Geosci. 2015, 19, 1063–1088. [Google Scholar] [CrossRef]
- Uchida, S.; Klar, A.; Yamamoto, K. Sand production model in gas hydrate-bearing sediments. Int. J. Rock Mech. Min. Sci. 2016, 86, 303–316. [Google Scholar] [CrossRef]
- Qorbani, K.; Kvamme, B.; Kuznetsova, T. Using a reactive transport simulator to simulate CH4 production from bear island basin in the Barents Sea utilizing the depressurization method. Energies 2017, 10, 187. [Google Scholar] [CrossRef]
- Sánchez, M.; Santamarina, C.; Teymouri, M.; Gai, X. Coupled Numerical Modeling of Gas Hydrate-Bearing Sediments: From Laboratory to Field-Scale Analyses. J. Geophys. Res. Solid Earth 2018, 123, 10–326. [Google Scholar] [CrossRef]
- Yan, C.; Li, Y.; Cheng, Y.; Wang, W.; Song, B.; Deng, F.; Feng, Y. Sand production evaluation during gas production from natural gas hydrates. J. Nat. Gas Sci. Eng. 2018, 57, 77–88. [Google Scholar] [CrossRef]
- Hunter, R.B.; Collett, T.S.; Boswell, R.; Anderson, B.J.; Digert, S.A.; Pospisil, G.; Baker, R.; Weeks, M. Mount Elbert Gas Hydrate Stratigraphic Test Well, Alaska North Slope: Overview of scientific and technical program. Mar. Pet. Geol. 2011, 28, 295–310. [Google Scholar] [CrossRef]
- Dallimore, S.R.; Wright, J.F.; Nixon, F.M.; Kurihara, M.; Yamamoto, K.; Fujii, T.; Fujii, K.; Numasawa, M.; Yasuda, M.; Imasato, Y.; et al. Geologic and Porous Media Factors Affecting the 2007 Production Response Characteristics of the Jogmec/Nrcan/Aurora Mallik Gas Hydrate Production Research Well. In Proceedings of the 6th International Conference on Gas Hydrates, Vancouver, BC, Canada, 6–10 July 2008. [Google Scholar]
- Yamamoto, K.; Terao, Y.; Fujii, T.; Ikawa, T.; Seki, M.; Matsuzawa, M.; Kanno, T. Operational overview of the first offshore production test of methane hydrates in the Eastern Nankai Trough. In Proceedings of the Offshore Technology Conference, Houston, TX, USA, 5–8 May 2014. [Google Scholar]
- Hancock, S.; Collett, T.; Dallimore, S.; Satoh, T.; Inoue, T.; Huenges, E.; Henninges, J.; Weatherill, B. Overview of thermal-stimulation production-test results for the JAPEX/JNOC/GSC et al. Mallik 5L-38 gas hydrate production research well. Bull.-Geol. Surv. Can. 2005, 585, 135. [Google Scholar]
- Schoderbek, D.; Farrell, H.; Howard, J.; Raterman, K.; Silpngarmlert, S.; Martin, K.; Smith, B.; Klein, P. ConocoPhillips Gas Hydrate Production Test; Technical Report; National Energy Technology Laboratory: Pittsburgh, PA, USA; Morgantown, WV, USA, 2013. [Google Scholar]
- Moridis, G.J.; Reagan, M.T. Strategies for Gas Production from Oceanic Class 3 Hydrate Accumulations; Technical Report; Ernest Orlando Lawrence Berkeley National Laboratory: Berkeley, CA, USA, 2007. [Google Scholar]
- Klar, A.; Deerberg, G.; Janicki, G.; Schicks, J.; Riedel, M.; Fietzek, P.; Mosch, T.; Tinivella, U.; De La Fuente Ruiz, M.; Gatt, P.; et al. Marine Gas Hydrate Technology: State of the Art and Future Possibilities for Europe. Final Report of WG2 of COST Action ES 1405. 2019. Available online: http://oceanrep.geomar.de/46367/ (accessed on 28 May 2019).
- Uchida, S.; Klar, A.; Charas, Z.; Yamamoto, K. Thermo-Hydro-Mechanical Sand Production Model in Hydrate-Bearing Sediments. In Proceedings of the EAGE International Workshop on Geomechanics and Energy—The Ground as Energy Source and Storage, Lausanne, Switzerland, 26–28 November 2013; pp. 1–11. [Google Scholar]
- Lee, J.; Ahn, T.; Lee, J.; Kim, S. Laboratory test to evaluate the performance of sand control screens during hydrate dissociation process by depressurization. In Proceedings of the ISOPE Ocean Mining Symposium, Szczecin, Poland, 22–26 September 2013; pp. 150–153. [Google Scholar]
- Cohen, E.; Klar, A.; Uchida, S.; Yamamoto, K. Micromechanical investigation of sand production in gas hydrate-bearing sediments. In Proceedings of the 9th International Conference on Gas Hydrates, Denver, CO, USA, 25–30 June 2017; p. 1652. [Google Scholar]
- Uchida, S.; Lin, J.S.; Myshakin, E.M.; Seol, Y.; Boswell, R. Numerical simulations of sand migration during gas production in hydrate-bearing sands interbedded with thin mud layers at site NGHP-02-16. Mar. Pet. Geol. 2018. [Google Scholar] [CrossRef]
- Itasca. PFC3D Ver. 4.0- User Manual; Itasca: Minneapolis, MN, USA, 2008. [Google Scholar]
- Hyodo, M.; Yoneda, J.; Yoshimoto, N.; Nakata, Y. Mechanical and dissociation properties of methane hydrate-bearing sand in deep seabed. Soils Found. 2013, 53, 299–314. [Google Scholar] [CrossRef]
- Brugada, J.; Cheng, Y.P.; Soga, K.; Santamarina, J.C. Discrete element modelling of geomechanical behaviour of methane hydrate soils with pore-filling hydrate distribution. Granul. Matter 2010, 12, 517–525. [Google Scholar] [CrossRef]
- Shen, Z.; Jiang, M. DEM simulation of bonded granular material. Part II: Extension to grain-coating type methane hydrate bearing sand. Comput. Geotech. 2016, 75, 225–243. [Google Scholar] [CrossRef]
- Yu, Y.; Cheng, Y.P.; Xu, X.; Soga, K. Discrete element modelling of methane hydrate soil sediments using elongated soil particles. Comput. Geotech. 2016. [Google Scholar] [CrossRef]
- Chaouachi, M.; Falenty, A.; Sell, K.; Enzmann, F.; Kersten, M.; Haberthür, D.; Kuhs, W.F. Microstructural evolution of gas hydrates in sedimentary matrices observed with synchrotron X-ray computed tomographic microscopy. Geochem. Geophys. Geosyst. 2015, 16, 1711–1722. [Google Scholar] [CrossRef]
- Cundall, P.A. Computer Simulations of Dense Sphere Assemblies. Stud. Appl. Mech. 1988, 20, 113–123. [Google Scholar] [CrossRef]
- Ergun, S. Fluid flow through packed columns. Chem. Eng. Prog. 1952, 48, 89–94. [Google Scholar]
© 2019 by the authors. Licensee MDPI, Basel, Switzerland. This article is an open access article distributed under the terms and conditions of the Creative Commons Attribution (CC BY) license (http://creativecommons.org/licenses/by/4.0/).