Abstract
We mainly aimed to determine how alternative liquid fuels affect the exhaust particle size distributions (PSD) emitted by a medium-speed diesel engine. The selected alternative fuels included: circulation-origin marine gas oil (MGO), the 26/74 vol. % blend of renewable naphtha and baseline low-sulfur marine light fuel oil (LFO), and kerosene. PSDs were measured by means of an engine exhaust particle sizer from the raw exhaust of a four-cylinder, turbocharged, intercooled engine. During the measurements, the engine was loaded by an alternator, the maximum power output being set at 600 kW(e) at a speed of 1000 rpm. The partial loads of 450, 300, 150 and 60 kW(e) were also used for measurements. At each load, the PSDs had a distinct peak between 20 and 100 nm regardless of fuel. Relative to the other fuels, circulation-origin MGO emitted the lowest particle numbers at several loads despite having the highest viscosity and highest density. Compared to baseline LFO and kerosene, MGO and the blend of renewable naphtha and LFO were more beneficial in terms of total particle number (TPN). Irrespective of the load or fuel, the TPN consisted mainly of particles detected above the 23 nm size category.
1. Introduction
Medium-speed diesel engines are largely used for power generation on land and sea. In addition to base load and peak shaving, combustion engines are used to stabilize the electricity grid in the case of sudden peak power demands if the energy production is widely based on the renewable sources. Small amounts of harmful pollutant emissions may be generated due to the combustion of either liquid or gaseous fuel in the engine cylinder. Gaseous and particulate emissions are regulated worldwide to inhibit the effects of pollutants on the ambient air quality, human health, and climate change.
For stationary engines of generating sets above 560 kW, the emission regulations of non-road mobile machinery (NRMM) must be met. In the newest Stage V, the NRMM set of regulation includes limits for exhaust particle number (PN) emissions [1]. The PN emission limitation will also be applied to inland waterway vessels when the regulation comes gradually into effect within 2019–2020.
The effect of the high sulfur content and other fuel characteristics on the particle emissions of medium-speed diesel engines have been reported [2,3]. Diesel engine exhaust contains particles that usually form a bimodal size distribution: one mode consists of nucleation particles (mean diameter under 50 nm) and the other of accumulation particles (50–500 nm) [4,5,6,7,8]. When either the fuel or the remnants of lubricating oil do not burn completely during combustion, accumulation mode particles form in the cylinder. The majority of the nucleation mode particles are thought to form when the exhaust gas mixes with the ambient air [6,9].
Clean renewable fuels are one material that can be used to reduce exhaust pollutants below the legislation limits, simultaneously increasing the sustainability of combustion-based power generation. We concentrated on determining the effects of three fuel options on the particulate number (PN) emissions of a medium-speed diesel engine intended for power plants and marine applications. Of the fuels, marine gas oil (MGO) was a product of the circulation economy. Naphtha was a residue of the manufacturing process of renewable diesel. Wood and forest residues formed the feedstock and the process used crude tall oil (CTO) as the raw material. Kerosene-based Jet A-1 fuel, used widely in commercial aviation, has properties similar to diesel fuel oils (DFO) or low-sulfur light fuel oil (LFO). Thus, kerosene was selected for investigation. The interest in studying jet fuels has increased after the U.S. Army Single Fuel Forward Policy was introduced. The aircraft gas turbine engines are now fueled by kerosene-based Jet Propellant 8 (JP-8) fuel, which has been the low-sulfur substitute for JP-4. Regarding fuel properties, JP-8 is similar to Jet A-1 [10].
The PN has earlier been reported to significantly decrease when using low-sulfur marine fuels instead of heavy fuel oil (HFO) [3,11,12]. Anderson et al. [11] determined how distillate fuels affect the exhaust particle size distribution (PSD) of a marine high-speed diesel engine in laboratory conditions. Zetterdahl et al. [3] investigated the number of particles emitted with low sulfur residual marine fuel oil on-board a ship. Sarvi et al. [2] studied the differences in the PSDs when LFO and HFO were used in a medium-speed diesel engine.
Nabi et al. [13] investigated how two low-sulfur fuels, MGO and regular on-road diesel fuel, affect the PN emissions from a marine high-speed diesel engine. As a preparative investigation for the present study, Ovaska et al. [14] studied the effects of circulation-origin MGO, a blend of renewable naphtha and marine LFO, and kerosene on the exhaust PSDs of a high-speed diesel engine. The blend was found to decrease the accumulation mode particles. However, combustion in a marine medium-speed engine differs from that in a smaller high-speed engine. Medium-speed engines are operated at lower engine speeds and higher air-to-fuel ratios. Lower engine speed allows more time for fuel to combust, which promotes soot oxidation. Compared to the emission limitation intended for road vehicles at some loads, the use of the LFO fuel in a marine engine may result in much lower specific mass emissions of particles [12].
Despite the sustainable and affordable alternative liquid fuels are needed for the reduction of exhaust pollutants from compression ignited (CI) engines, the technical compatibility of the alternative fuel has to be assessed [15]. Especially for marine applications where alternative fuel options are used, fuel must be compatible with the other systems. Kerosene-based jet fuel has typically lower viscosity and cetane number compared to LFO or MGO used in the CI engines in marine and land-use applications. Ignition delay is extended by a low cetane number. Thus, the cetane number affects the combustion timing. Due to the extended delay, changes in cold-starting performance, combustion noise level, and exhaust emissions are expected. Low fuel viscosity may worsen the fuel injection system performance, which leads to fuel pump wear and fuel leakage [10].
Poor lubricity is characteristic, for example, for neat naphtha, and thus it may be assumed to cause problems in the entire engine fuel system. The lubricity features of naphtha can be improved by blending. However, use of blended fuels by the marine or power plant operators requires accurate knowledge of the physical and chemical properties of the blends. The blend stability and the compatibility issues with the engine and lubricants have to be carefully assessed to avoid operational problems such as carbon deposition, lubricating oil dilution, piston ring sticking, or injector nozzle choking [16,17,18].
This paper presents how the selected alternative fuels affected the PSD of the medium-speed experimental engine. The main aim was to determine the effect of two completely novel fuel options: circulation-origin MGO and a blend of renewable naphtha and marine LFO. Both meet the sustainability and affordability goals set by the ship owners. Along with these fuels, the other studied low-sulfur fuels were LFO (baseline) and kerosene. Alongside the exhaust particle number and size distributions, gaseous emissions and basic engine performance were determined. The engine was loaded by an alternator, with a maximum power output set to 600 kW(e) at a speed of 1000 rpm. Partial loads were also used for the measurements. The default engine control parameters were kept constant during the experiments. No parameter optimization was applied with the studied fuels.
2. Materials and Methods
The experimental measurements were performed at the University of Vaasa (UV) at the Internal Combustion Engine (ICE) laboratory of Vaasa Energy Business Innovation Centre (VEBIC), Finland.
2.1. Engine and Fuels
The experiments were performed with a medium-speed diesel engine connected to an alternator on a common base-frame. The engine was a turbocharged, intercooled (air-to-water), 4-cylinder engine, not equipped with any exhaust gas after-treatment devices. The engine specifications are provided in Table 1. In addition to baseline LFO, the effects of naphtha-LFO blend, MGO, and kerosene on the exhaust PSD were investigated (Table 2).

Table 1.
Engine specifications.
Table 2.
Fuel specifications.
The naphtha content in the naphtha-LFO blend was 26 vol. %. The naphtha was a side-product of wood-based renewable diesel production. The MGO was a Finnish marine fuel produced from recycled lubricating oils. The kerosene was Jet A-1 type aviation fuel. The baseline LFO was light fuel oil with low sulfur content of below 1 wt.%, fulfilling the ISO 8217:2017(E) standard requirements as did the other fuels regarding sulfur [19]. For the fuels, kinematic viscosity at 40 °C, density, cetane number, sulfur content, and the contents of carbon and hydrogen were analyzed by the fuel laboratory of the University of Vaasa, Vaasa, Finland.
2.2. Analytical Instruments
In this study, particles ranging from 5.6 to 560 nm were recorded using an engine exhaust particle sizer (EEPS). The adopted measurement instruments for gaseous emissions and combustion analysis are listed in Table 3.
Table 3.
Measuring equipment for gaseous emissions.
The analyzers were calibrated manually once a day according to the manufacturers’ instructions prior to the measurements. The sample flow rate was adjusted to 5.0 L/min for the EEPS. In the data processing, the “SOOT” inversion was applied [20]. The arrangement of the test bench with auxiliary systems and measurement devices is depicted in Figure 1.
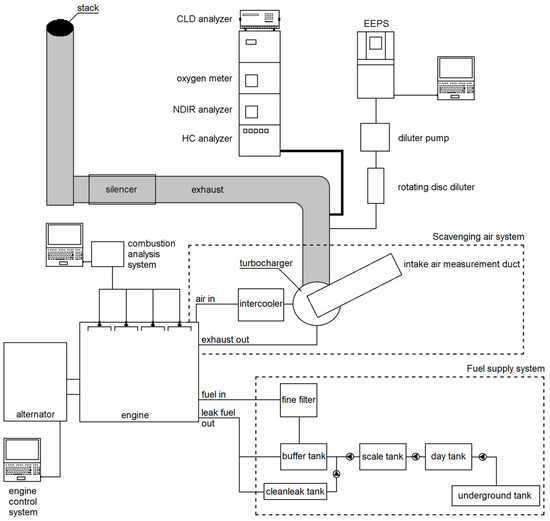
Figure 1.
Experimental set-up.
The exhaust sample was first diluted with ambient air in a rotating disc diluter (RDD) (model MD19-E3, Matter Engineering AG, Wohlen, Switzerland). During the measurements, the dilution ratio in the RDD was a constant 60. The exhaust aerosol sample was passed through the RDD, which maintained dilution air at 150 °C. The diluted sample (5 L/min) was further diluted using purified air with a dilution ratio of 2 to fit the sample volume flow to measurable for the EEPS. Thus, the total dilution ratio used in PSD measurements was 120.
The particle number (PN) was recorded consecutively three times. Each recording was one minute long, after which the averaged interval of 2 seconds was used when the data were stored. The uncertainty of the PN measurement was approximated by calculating the standard deviation of the PN averages, taken from each one-minute recording. By means of the extended measurement period of eight minutes, the stability of the PN measurement was monitored.
Total particle number (TPN, from 5.6 to 560 nm) was calculated from the PN recordings by adding the PN concentrations indicated in the size bins of the EEPS spectrometer during the one averaging interval. For the presented TPN results of this paper, the average of PN sums was calculated. The averages of the normalized PN concentrations (dN/dlogDp, where N is particle concentration and Dp the mobility diameter of a particle) were calculated from each bin in order to illustrate the PSDs. The calculated TPN averages and the averages of the normalized PN concentrations were multiplied by the total dilution ratio of the exhaust sample to present the corresponding concentrations in the raw exhaust.
The sensor data were collected and the engine control parameters were applied via engine management software. By using the software, the temperatures of cooling water, intake air, and exhaust gas, plus the pressures of the intake air and exhaust gas were recorded. Cylinder pressure and heat release were also monitored simultaneously from all four cylinders.
Emissions of total hydrocarbons (HC), nitrogen oxides (NOx), and carbon monoxide (CO), plus oxygen content were also measured on dry basis. Based on the measured HC, NOx, and CO concentrations, the brake-specific emissions of HC, NOx, and CO were calculated according to the ISO 8178 standard [21].
2.3. Experimental Matrix and Running Procedure
The engine was loaded by the alternator, the maximum power output being set to 600 kW(e) at a speed of 1000 rpm. The speed was kept constant. The measurements were also recorded at the partial loads of 450, 300, 150, and 60 kW(e). Mainly, the procedure followed the D2 test cycle of the ISO 8178-4 standard. The only controllable variable regarding the engine loading was the power output of the alternator due to the test installation. The output of the test installation was measured as net electric power downstream the frequency converter used to control the engine-driven generator set. We used the net electric power as the most accurate measure of the produced output.
At each load point, recordings were collected after the engine had stabilized, i.e., the temperatures of coolant water, intake air, and exhaust were stable. The length of the measurement period was not tied to a certain time.
Despite the PN and PSD, all measurement values were recorded once at each load point.
3. Results
3.1. Particle Size Distributions
With all fuels at different loads, a bimodal shape was detected for the distributions. One low peak was detected at a particle size of ca. 10 nm and the maximum within the range of 30 to 100 nm. The accumulation mode peaks were normally higher by two orders of magnitude compared to the nucleation mode peaks.
Figure 2 shows the PSDs at full load. The highest peak was detected with LFO. Below a particle size of 50 nm, the naphtha-LFO blend generated the lowest PN, and LFO or kerosene the highest. In the range of 85 to 200 nm, kerosene emitted the fewest particles whereas the order of other fuels varied. For all fuels, the peak PN was detected at different particle size bins.
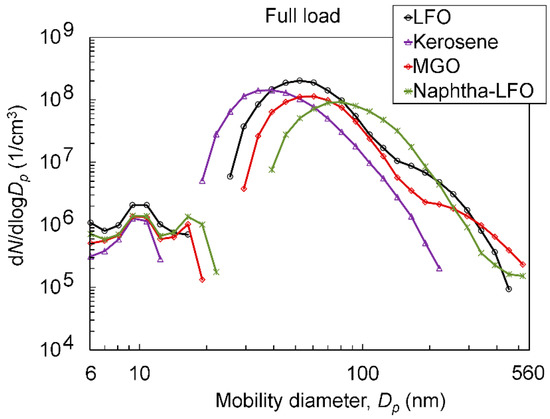
Figure 2.
Exhaust particle size distributions (PSD) at full load.
Both at 75% and half loads, one distinct peak was observed between 20 and 50 nm regardless of fuel (Figure 3 and Figure 4). The detected PN was the lowest for naphtha-LFO between 20 and 35 nm. From 35 to 100 nm, the lowest PN was recorded for MGO.
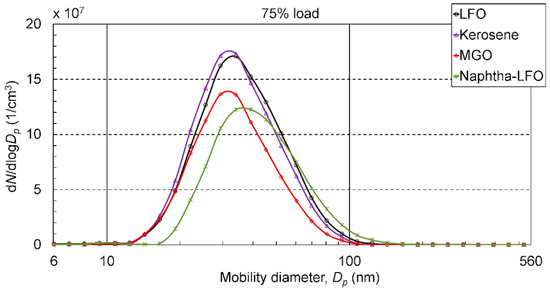
Figure 3.
Exhaust PSDs at 75% load.
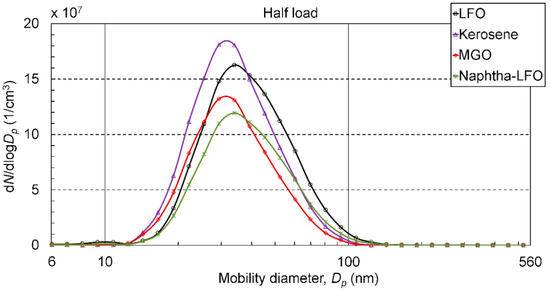
Figure 4.
Exhaust PSDs at half load.
At 75% load, the lowest peak of the distributions was produced by naphtha-LFO. The blend, kerosene, and baseline LFO peaked at the size bin of 34 nm, whereas MGO peaked at 29.4 nm. The greatest peak was recorded with kerosene at 29.4 nm, but the maximum of LFO was almost as high.
At half load, again, naphtha-LFO showed the lowest peak. With naphtha-LFO (34 nm), MGO (29.4 nm), and LFO (34 nm), the PN peaked at the same size bins as at 75% load.
Figure 5 illustrates the PSDs for the 25% load. Again, one distinct peak was detected between 20 and 50 nm regardless of fuel. From the size category of 35 nm and larger, the lowest PN was produced by MGO and the greatest by kerosene. The lowest peak out of the distributions was produced by MGO at the size bin of 29.4 nm and the highest peak was produced by kerosene at 39.2 nm. Between MGO and kerosene, LFO peaked at 34 nm, and naphtha-LFO at the same size bin as kerosene.
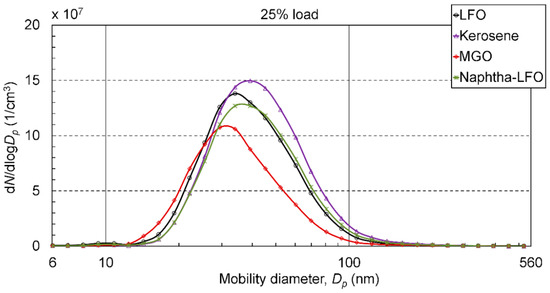
Figure 5.
Exhaust PSDs at 25% load.
At 10% load, the detected PN was the lowest for naphtha-LFO between the size categories of 20 and 30 nm (Figure 6). From the size category of 29 nm and larger, the lowest PN was detected for MGO. The recorded distribution for MGO peaked again at the size of 29.4 nm, the peak also being the lowest. The second lowest peak was for naphtha-LFO at 45.3 nm, for LFO at 39.2 nm, and then for kerosene at 34 nm.
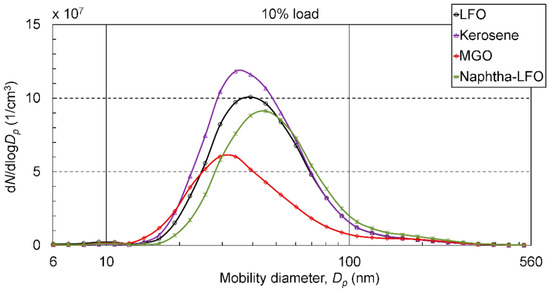
Figure 6.
Exhaust PSDs at 10% load.
For all loads, the lowest peak was usually measured for MGO or naphtha-LFO, and the highest for kerosene. The positions of the peaks varied but MGO often showed a peak at lower particle size than the other fuels.
3.2. Total Particle Number Emissions
Figure 7 depicts the total particle number (TPN, from 6 to 560 nm) for all engine loads. In total, MGO and naphtha-LFO emitted fewer particles than LFO and kerosene. By far the highest TPN for kerosene was observed at half load, for MGO at 75% load, and for the blend at 25% load.
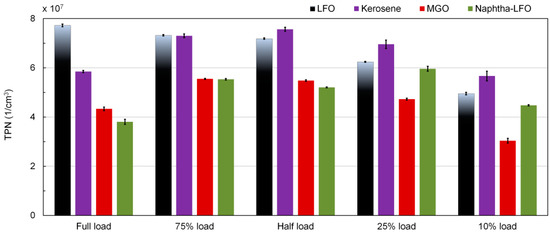
Figure 7.
Total particle number (TPN) at different engine loads.
At full load, the blend produced the lowest TPN, whereas baseline LFO produced the highest. At 75% load, the lowest (almost equal) particle numbers were measured for MGO and naphtha-LFO. LFO and kerosene emitted the highest TPNs. As at full load, the blend produced the lowest TPN at half load; the highest TPN was detected with MGO. At 25% and 10% loads, MGO produced the lowest TPN, whereas kerosene the highest.
At full load, kerosene produced the fewest particles at sizes greater than 70 nm. The highest PN was observed with LFO at around 50 nm. The maximum PN was detected with kerosene at the size of 40 nm, whereas with naphtha-LFO, the maximum was detected at 80 nm.
At both 75% and half loads, naphtha-LFO emitted the least particles within 15–35 nm, but between 40 and 100 nm, MGO was the most favorable. At half load, the particle numbers above 40 nm were the highest with LFO. Now, the maximum PN of fuels varied between 25 and 40 nm. MGO produced the lowest and kerosene the highest PN from 30 nm onward. As at 25% load, MGO was clearly the most favorable at 35–100 nm. Irrespective of load, the blend often generated the least PN at approx. 25 nm, but compared to LFO, it produced more particles at the 100 nm size category.
Table 4 lists the shares of the particles detected above the size category of 23 nm. In this study, the TPN consisted mainly of the particles above this size category. For all fuels, the share of particles larger than 23 nm was the highest at full load, being always higher than 95%. Regarding all loads, the lowest average share of the particles above 23 nm was detected with kerosene, and the highest share with naphtha-LFO.
Table 4.
Shares of the particles detected above the size category of 23 nm.
3.3. Gaseous Emissions
Although the gaseous emissions of HC, NOx, and CO, and oxygen content were measured, any relationship between the PN emission and gaseous emissions, e.g., NOx–PM trade-off, were not investigated. Calculated for each fuel at full load, the brake specific emissions of HC, NOx and CO are presented as supportive background information for the test engine emission levels in Table 5. The HC emission varied from 0.34 to 0.40 g/kWh, NOx from 15.1 to 16.3 g/kWh, and CO from 0.37 to 0.40 g/kWh. The naphtha-LFO blend produced the lowest HC emissions and kerosene the highest NOx emission. The high NOx levels indicated that the engine was tuned to high efficiency and low fuel consumption. Consequently, smoke and PM were inherently low.
Table 5.
Brake specific emissions of hydrocarbons (HC), nitrogen oxides (NOx), and carbon monoxide (CO) at full load with different fuels.
The oxygen content of the engine exhaust is presented in Figure 8. The oxygen content was almost equal for all fuels.
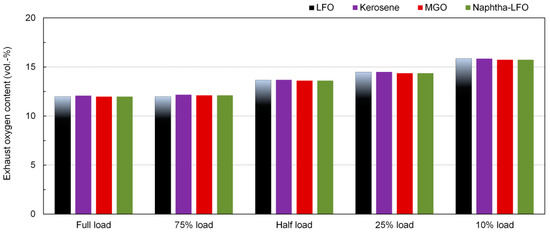
Figure 8.
Dry exhaust oxygen content at different engine loads for studied fuels.
4. Discussion
The formation of exhaust particles depends on several issues related to fuel injection and combustion. The physical properties of the liquid fuel tend to control fuel spray characteristics, whereas the fuel composition determines the pathways of chemical reactions during combustion [22]. Besides the fuel sulfur content, fuel characteristics, such as the fuel density [23,24], viscosity [25,26], cetane number [27,28], and fuel contents of aromatic compounds [29], influence particle formation.
All alternative fuels selected for this study had fairly good quality in terms density and viscosity. If the fuel viscosity is extremely low or high, poor fuel injection and increased fuel consumption result. Due to low fuel viscosity, the fuel injection system performance can deteriorate and fuel pump wear and leakage through the nozzle sealing may occur [10,30]. Higher fuel viscosity may lead to incomplete combustion due to less favorable fuel atomization, and the soot emission may increase [13,31]. In this study, kerosene had the lowest kinematic viscosity at 40 °C (0.99 mm2/s), whereas the blend was the second lowest (1.77 mm2/s), and MGO the highest (3.74 mm2/s). At 40 °C, the viscosity of LFO (3.12 mm2/s) was between the blend and MGO.
High fuel density may deteriorate fuel spray formation during fuel injection. As a result, fuel burns incompletely and high emissions may occur [30]. At 15 °C, the density was the lowest for kerosene (787 kg/m3), second lowest for naphtha-LFO blend (810 kg/m3), and the highest for MGO (838 kg/m3). The density of reference fuel LFO (836 kg/m3) was almost equal to that of MGO.
Kerosene-based jet fuel typically has lower viscosity and cetane number compared to LFO or MGO used in CI engines in marine and land-use applications. The higher the cetane number, the shorter the ignition delay plus advanced combustion. Cold-starting performance, combustion noise level, and exhaust emissions may change due to the extended delay [10,13,31].
In this study, MGO emitted the lowest PN at several loads despite its highest viscosity and density. The cetane number, viscosity, and density of MGO were, however, within an appropriate range for a CI engine.
The lowest density and viscosity of kerosene may explain the favorable PN result at full load, although the cetane number was the lowest and the sulfur content the highest. The high sulfur content of kerosene may still be the most evident reason for the high PN result at all part loads. All fuel properties, presented in Table 2, including cetane number, density, sulfur content, and kinematic viscosity, were the second lowest for naphtha-LFO. Therefore, naphtha-LFO emitted the lowest TPN at full and half loads and always lower TPN than neat LFO.
In this study, the detected PSDs were bimodal but the peak at a particle size of ca. 10 nm was rather low compared to the maximum within 30–100 nm.
No consistent conclusions could be drawn concerning the particle numbers under the size category of 20 nm for the following reasons. First, mobility particle size spectrometers, as EEPS, have been found to be best for measuring particle numbers within the size range of 20 to 200 nm [32]. Outside this size range, increased uncertainties may exist, as described by Wiedensohler et al. [33]. Second, the complex nature of nucleation mode PN has to be considered. The engine parameters [34], fuel and lubricating oil characteristics [35], and exhaust after-treatment [36] are not the only factors that influence the formation of the nucleation mode PN. The dilution conditions, such as dilution ratio, temperature, and relative humidity of the dilution air [37], also affect the formation. Rönkkö et al. [6] reported that nucleation mode PN formation was insensitive to the fuel sulfur content, dilution air temperature, and relative humidity of ambient air.
Figure 9 illustrates the actual TPN versus the measurement time at full load. Each fuel had a stable TPN level over the extended measurement period of eight minutes. Thus, during data curation, the arithmetic mean was calculated over each measured dataset by means of EEPS, including each fuel at each load, to describe the variation in the PN during the measurements.
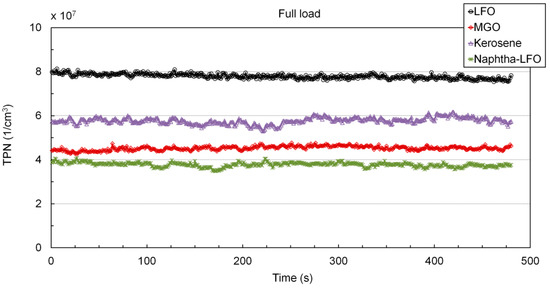
Figure 9.
The actual TPN during eight-minute measurement time at full load.
For full load, Figure 10 illustrates the variation in the PN between three consecutive one-minute EEPS scans. The average values, shown in Figure 10, were calculated from the recordings of four EEPS measurement channels. As shown, the average PNs remained almost constant in relation to time.
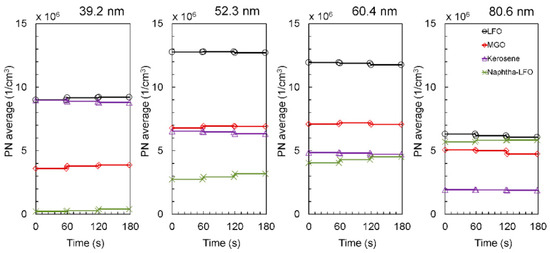
Figure 10.
The average particle number between the three consecutive one-minute EEPS scans at the four channels.
In future studies, engine parameters should be optimized because no parameter optimization was applied to any fuels in this study. The fuels were first chosen for comparison without any modifications. Further experiments for different operational conditions should be designed to obtain a wider viewpoint on the NOx and particulate matter (PM) emissions. Those studies should also include the effects of the humidity of the supplied air [38].
5. Conclusions
The current study determined the effects of three fuel options on PN emissions of a medium-speed diesel engine. The fuels were circulation-economy-derived MGO, a blend of renewable naphtha and low-sulfur LFO, and kerosene. Neat LFO formed the baseline. The engine was run at five alternator output loads at a constant engine speed. The PN was measured by means of an EEPS analyzer.
Based on the results, the following conclusions could be drawn:
- (1)
- Bimodal PSDs were detected for all fuels and loads. However, the peak of the nucleation mode particles was always lower by two orders of magnitude than that of larger particles.
- (2)
- Circulation-economy-based MGO emitted the lowest PN at several loads despite its slightly higher viscosity, density, and sulfur content.
- (3)
- In terms of TPN, MGO and the blend of renewable naphtha and LFO were more beneficial compared to LFO. At full, 75%, and half loads, the blend emitted clearly fewer particles than LFO, but at low loads, the difference in TPN was smaller.
- (4)
- For all fuels within the entire load range, the share of particles larger than 23 nm was high—80–99%. The highest load-averaged share was measured for the naphtha-LFO blend.
- (5)
- Compared with the other fuels, the NOx emissions were slightly higher with kerosene. The blend generated the lowest HC.
Author Contributions
Conceptualization, T.O., S.N., K.P., T.A., and K.S.; methodology, S.N., T.O., and S.H.; software, T.O.; validation, K.P., T.A., and S.N.; formal analysis, T.O. and K.S.; investigation, T.O., K.S., and S.H.; resources, S.N., K.P., and T.A.; data curation, T.O.; writing—original draft preparation, T.O. and S.N.; writing—review and editing, T.O., S.N., and K.S.; visualization, T.O.; supervision, S.N.; project administration, S.N.; funding acquisition, K.P., T.A., and S.N.
Funding
This project received funding from the European Union’s Horizon 2020 research and innovation programme under grant agreement No. 634135 (Hercules-2).
Acknowledgments
This project received funding from the European Union’s Horizon 2020 research and innovation programme under grant agreement No. 634135 (Hercules-2). The authors wish to thank Olav Nilsson, Saana Hautala, Kirsi Spoof-Tuomi, Janne Suomela, Antti Niemi, and Antti Kiikeri for their assistance during the measurement campaigns. In addition, the authors express their gratitude to Krister Ekman from Turku University of Applied Sciences for his assistance during the measurements.
Conflicts of Interest
The authors declare no conflict of interest. The funders had no role in the design of the study; in the collection, analyses, or interpretation of data; in the writing of the manuscript, or in the decision to publish the results.
Nomenclature
| Symbol | |
| Dp | mobility diameter of a particle |
| dN/dlogDp | normalized particle number concentration, 1/cm3 |
| N | particle concentration |
| Abbreviations | |
| ASTM | American Society for Testing and Materials |
| CO | Carbon Monoxide |
| CTO | Crude Tall Oil |
| EEPS | Engine Exhaust Particle Sizer |
| DMX | Distillate marine fuel category ISO-F-DMX |
| EN | European Standard |
| HC | Hydrocarbon |
| HFID | Heated Flame Ionization Detection |
| HFO | Heavy Fuel Oil |
| ICE | Internal Combustion Engine |
| ISO | International Organization for Standardization |
| LFO | Light Fuel Oil |
| MGO | Marine Gas Oil |
| NDIR | Non-Dispersive Infra-Red |
| NOx | Nitrogen Oxides |
| NRMM | Non-Road Mobile Machinery |
| PN | Particle Number |
| PM | Particulate Matter |
| PSD | Particle Size Distribution |
| RDD | Rotating Disc Diluter |
| TPN | Total Particle Number |
| UV | University of Vaasa |
| VEBIC | Vaasa Energy Business Innovation Centre |
References
- EU Regulation 2016/1628. Regulation of the European Parliament and of the Council on Requirements Relating to Gaseous and Particulate Pollutant Emission Limits and Type-Approval for Internal Combustion Engines for Non-Road Mobile Machinery. Available online: http://data.europa.eu/eli/reg/2016/1628/oj (accessed on 16 January 2019).
- Sarvi, A.; Lyyränen, J.; Jokiniemi, J.; Zevenhoven, R. Particulate emissions from large-scale medium-speed diesel engines: 1. Particle size distribution. Fuel Process. Technol. 2011, 92, 1855–1861. [Google Scholar] [CrossRef]
- Zetterdahl, M.; Moldanová, J.; Pei, X.; Pathak, R.K.; Demirdjian, B. Impact of the 0.1% fuel sulfur content limit in SECA on particle and gaseous emissions from marine vessels. Atmos. Environ. 2016, 145, 338–345. [Google Scholar] [CrossRef]
- Kittelson, D.B. Engines and nanoparticles: A review. J. Aerosol Sci. 1998, 29, 575–588. [Google Scholar] [CrossRef]
- Rönkkö, T.; Virtanen, A.; Vaaraslahti, K.; Keskinen, J.; Pirjola, L.; Lappi, M. Effect of dilution conditions and driving parameters on nucleation mode particles in diesel exhaust: Laboratory and on-road study. Atmos. Environ. 2006, 40, 2893–2901. [Google Scholar] [CrossRef]
- Rönkkö, T.; Virtanen, A.; Kannosto, J.; Keskinen, J.; Lappi, M.; Pirjola, L. Nucleation mode particles with a nonvolatile core in the exhaust of a heavy duty diesel vehicle. Environ. Sci. Technol. 2007, 41, 6384–6389. [Google Scholar] [CrossRef] [PubMed]
- Filippo, A.D.; Maricq, M.M. Diesel nucleation mode particles: Semivolatile or solid? Environ. Sci. Technol. 2008, 42, 7957–7962. [Google Scholar] [CrossRef]
- Lähde, T.; Rönkkö, T.; Virtanen, A.; Solla, A.; Kytö, M.; Söderström, C.; Keskinen, J. Dependence between nonvolatile nucleation mode particle and soot number concentrations in an EGR equipped heavy-duty diesel engine exhaust. Environ. Sci. Technol. 2010, 44, 3175–3180. [Google Scholar] [CrossRef] [PubMed]
- Nousiainen, P.; Niemi, S.; Rönkkö, T.; Karjalainen, P.; Keskinen, J.; Kuuluvainen, H.; Pirjola, L.; Saveljeff, H. Effect of Injection Parameters on Exhaust Gaseous and Nucleation Mode Particle Emissions of a Tier 4i Nonroad Diesel Engine. Available online: https://dx.doi.org/10.4271/2013-01-2575 (accessed on 15 April 2019).
- Fernandes, G.; Fuschetto, J.; Filipi, Z.; Assanis, D.; McKee, H. Impact of military JP-8 fuel on heavy-duty diesel engine performance and emissions. Proc. Inst. Mech. Eng. Part D J. Automobile Eng. 2007, 221, 957–970. [Google Scholar] [CrossRef]
- Anderson, M.; Salo, K.; Hallquist, Å.M.; Fridell, E. Characterization of particles from a marine engine operating at low loads. Atmos. Environ. 2015, 101, 65–71. [Google Scholar] [CrossRef]
- Ntziachristos, L.; Saukko, E.; Lehtoranta, K.; Rönkkö, T.; Timonen, H.; Simonen, P.; Karjalainen, P.; Keskinen, J. Particle emissions characterization from a medium-speed marine diesel engine with two fuels at different sampling conditions. Fuel 2016, 186, 456–465. [Google Scholar] [CrossRef]
- Nabi, M.N.; Brown, R.J.; Ristovski, Z.; Hustad, J.E. A comparative study of the number and mass of fine particles emitted with diesel fuel and marine gas oil (MGO). Atmos. Environ. 2012, 57, 22–28. [Google Scholar] [CrossRef]
- Ovaska, T.; Niemi, S.; Sirviö, K.; Nilsson, O.; Portin, K.; Asplund, T. Effects of alternative marine diesel fuels on the exhaust particle size distributions of an off-road diesel engine. Appl. Therm. Eng. 2019, 150, 1168–1176. [Google Scholar] [CrossRef]
- Jääskeläinen, S. Alternative Transport Fuels Infrastructure—Finland’s National Plan; Publications of the Ministry of Transport and Communications: Helsinki, Finland, 2017. Available online: https://julkaisut.valtioneuvosto.fi/bitstream/handle/10024/80230/Report%205-2017.pdf?sequence=1 (accessed on 15 April 2019).
- Patel, P.D.; Lakdawala, A.; Chourasia, S.; Patel, R.N. Bio fuels for compression ignition engine: A review on engine performance, emission and life cycle analysis. Renew. Sust. Energ. Rev. 2016, 65, 24–43. [Google Scholar] [CrossRef]
- Sirviö, K.; Heikkilä, S.; Hiltunen, E.; Niemi, S. Kinematic viscosity studies for medium-speed CI engine fuel blends. Agronomy Res. 2018, 16, 1247–1256. [Google Scholar]
- Sirviö, K. Issues of various alternative fuel blends for off-road, marine and power plant diesel engines. Ph.D. Thesis, University of Vaasa, Vaasa, Finland, 15 June 2018. [Google Scholar]
- ISO 8217:2017(E). Petroleum Products. Fuels (class F). Specifications of Marine Fuels; ISO: Geneva, Switzerland, 2017. [Google Scholar]
- Wang, X.; Grose, M.A.; Caldow, R.; Osmondson, B.L.; Swanson, J.J.; Chow, J.C.; Watson, J.G.; Kittelson, D.B.; Li, Y.; Xue, J.; et al. Improvement of Engine Exhaust Particle Sizer (EEPS) Size Distribution Measurement – II. Engine Exhaust Aerosols. J. Aerosol Sci. 2016, 92, 83–94. [Google Scholar] [CrossRef]
- EN ISO, 8178-2:2008. Reciprocating Internal Combustion Engines. Exhaust Emission Measurement; Part 2: Measurement of Gaseous and Particulate Exhaust Emissions under Feld Conditions; ISO: Geneva, Switzerland, 2008. [Google Scholar]
- Eastwood, P. Particulate Emissions from Vehicles; John Wiley & Sons Ltd: Chichester, UK, 2008; p. 494. [Google Scholar]
- Bach, F.; Tschöke, H.; Simon, H. Influence of Alternative Fuels on Diesel Engine Aftertreatment. In Proceedings of the 7th International Colloquium Fuels of the TAE Technische Akademie, Esslingen, Germany, 10–11 January 2009; p. 685. [Google Scholar]
- Szybist, J.P.; Song, J.; Alam, M.; Boehman, A.L. Biodiesel combustion, emissions and emission control. Fuel Process. Technol. 2007, 88, 679–691. [Google Scholar] [CrossRef]
- Mathis, U.; Mohr, M.; Kaegi, R.; Bertola, A.; Boulouchos, K. Influence of diesel engine combustion parameters on primary soot particle diameter. Environ. Sci. Technol. 2005, 39, 1887–1892. [Google Scholar] [CrossRef]
- Tsolakis, A. Effects on particle size distribution from the diesel engine operating on RME-biodiesel with EGR. Energy Fuels 2006, 20, 1418–1424. [Google Scholar] [CrossRef]
- Alrefaai, M.M.; Peña, G.D.G.; Raj, A.; Stephen, S.; Anjana, T.; Dindi, A. Impact of dicyclopentadiene addition to diesel on cetane number, sooting propensity, and soot characteristics. Fuel 2018, 216, 110–120. [Google Scholar] [CrossRef]
- Li, R.; Wang, Z.; Ni, P.; Zhao, Y.; Li, M.; Li, L. Effects of cetane number improvers on the performance of diesel engine fuelled with methanol/biodiesel blend. Fuel 2014, 128, 180–187. [Google Scholar] [CrossRef]
- Violi, A.; Voth, G.A.; Sarofim, A.F. The relative roles of acetylene and aromatic precursors during soot particle inception. P. Combust. Inst. 2005, 30, 1343–1351. [Google Scholar] [CrossRef]
- Hissa, M.; Sirviö, K.; Niemi, S. Combustion property analyses with variable liquid marine fuels in combustion research unit. Agronomy Res. 2018, 16, 1032–1045. [Google Scholar]
- Kegl, B.; Kegl, M.; Pehan, S. Green diesel engine. In Biodiesel Usage in Diesel Engines; Springer: London, UK, 2013; p. 263. [Google Scholar]
- Wiedensohler, A.; Birmili, W.; Nowak, A.; Sonntag, A.; Weinhold, K.; Merkel, M.; Wehner, B.; Tuch, T.; Pfeifer, S.; Fiebig, M.; et al. Mobility particle size spectrometers: harmonization of technical standards and data structure to facilitate high quality long-term observations of atmospheric particle number size distributions. Atmos. Meas. Tech. 2012, 5, 657–685. [Google Scholar] [CrossRef]
- Wiedensohler, A.; Wiesner, A.; Weinhold, K.; Birmili, W.; Hermann, M.; Merkel, M.; Müller, T.; Pfeifer, S.; Schmidt, A.; Tuch, T.; et al. Mobility particle size spectrometers: Calibration procedures and measurement uncertainties. Aerosol Sci. Technol. 2018, 52, 146–164. [Google Scholar] [CrossRef]
- Lähde, T.; Rönkkö, T.; Happonen, M.; Söderström, C.; Virtanen, A.; Solla, A.; Kytö, M.; Rothe, D.; Keskinen, J. Effect of fuel injection pressure on a heavy-duty diesel engine nonvolatile particle emission. Environ. Sci. Technol. 2011, 45, 2504–2509. [Google Scholar] [CrossRef]
- Vaaraslahti, K.; Keskinen, J.; Giechaskiel, B.; Solla, A.; Murtonen, T.; Vesala, H. Effect of lubricant on the formation of heavy-duty diesel exhaust nanoparticles. Environ. Sci. Technol. 2005, 39, 8497–8504. [Google Scholar] [CrossRef]
- Maricq, M.M.; Chase, R.E.; Xu, N.; Laing, P.M. The effects of the catalytic converter and fuel sulfur level on motor vehicle particulate matter emissions: light duty diesel vehicles. Environ. Sci. Technol. 2002, 36, 283–289. [Google Scholar] [CrossRef]
- Mathis, U.; Ristimaki, J.; Mohr, M.; Keskinen, J.; Ntziachristos, L.; Samaras, Z.; Mikkanen, P. Sampling conditions for the measurement of nucleation mode particles in the exhaust of a diesel vehicle. Aerosol Sci. Technol. 2004, 38, 1149–1160. [Google Scholar] [CrossRef]
- Chybowski, L.; Laskowski, R.; Gawdzińska, K. An overview of systems supplying water into the combustion chamber of diesel engines to decrease the amount of nitrogen oxides in exhaust gas. J. Mar. Sci. Technol. 2015, 20, 393–405. [Google Scholar] [CrossRef]
© 2019 by the authors. Licensee MDPI, Basel, Switzerland. This article is an open access article distributed under the terms and conditions of the Creative Commons Attribution (CC BY) license (http://creativecommons.org/licenses/by/4.0/).