Article

Optimization of an Organic Rankine Cycle System for an LNG-Powered Ship

1
Department of Chemical Engineering, Hongik University, Seoul 04066, Korea
2
R&D Center, Gas Technology Compression Company, Changwon 52032, Korea
3
Department of Chemical and Biological Engineering, Sookmyung Women’s University, Seoul 04310, Korea
*
Author to whom correspondence should be addressed.
Energies 2019, 12(10), 1933; https://doi.org/10.3390/en12101933
Submission received: 30 April 2019 / Revised: 11 May 2019 / Accepted: 14 May 2019 / Published: 20 May 2019
(This article belongs to the Special Issue Applications for the Organic Rankine Cycle)

Abstract

:
Recovering energy from waste energy sources is an important issue as environmental pollution and the energy crisis become serious. In the same context, recovering liquefied natural gas (LNG) cold energy from an LNG-powered ship is also important in terms of energy savings. To this end, this study investigated a novel solution for a LNG-powered ship to recover LNG cold energy. Six different organic Rankine cycle (ORC) systems (three for high-pressure dual-fuel engines and three for medium-pressure dual-fuel engines) were proposed and optimized; nine different working fluids were investigated; annualized costs for installing proposed ORC systems were estimated based on the optimization results. In addition, a sensitivity analysis was performed to identify the effect of uncertainties on the performance of the ORC systems. As a result, the ORC system for the medium-pressure engines with direct expansion, multi-condensation levels, and a high evaporation temperature exhibited the best performance in terms of exergy efficiency, net power output and actual annualized cost. These results demonstrate the possibility of replacing a typical LNG supply system with an ORC system.

1. Introduction

As environmental pollution and the energy crisis become serious, the use of natural gas comes into the spotlight. Natural gas is mainly composed of methane; it produces lower carbon dioxide, SOx (sulfur oxides), and NOx (nitrogen oxides) than any other fossil fuel [1,2,3]. Therefore, natural gas is considered the cleanest fuel among various fossil fuels, such as gasoline, diesel, kerosene, and coal.
As a result, there is growing interest in liquefied natural gas (LNG)-powered ships to suppress vessel emissions. Because the International Maritime Organization (IMO) has established emission control areas (ECAs) and issued strong regulations on emissions from ships, LNG-powered ships equipped with LNG fuel supply systems are attracting attention as a powerful alternative to comply with regulations [4,5,6].
The LNG fuel supply system uses seawater to vaporize LNG because LNG-powered ships use natural gas as their main fuel. However, because natural gas liquefaction processes consume a lot of energy [7,8], it is not desirable to waste the cold energy stored in LNG. Consequently, research on the recovery of cold energy stored in LNG is important.
One efficient way to recover energy from waste heat sources is the organic Rankine cycle (ORC). When recovering energy from low-grade heat sources, an ORC system is more efficient than a conventional Rankine cycle [9,10]; this is because the ORC system uses an organic working fluid (WF) with a low boiling point [11]. When recovering energy from a cold source, the ORC system is also an efficient option because the organic WF has a low freezing point and a low boiling point.
There are many studies on the recovery of cold energy from LNG using an ORC system. Astolfi et al. studied the ORC system to recover the cold energy at LNG regasification terminals [12]. They investigated 2 cycle configurations and 11 WFs using a simulation and concluded that light hydrofluorocarbons (R32 and R41) were the most suitable WFs. They also studied the dependence between the ORC power output and seawater temperature and found that more power production occurs at high seawater temperatures. Liu and Guo proposed a novel cryogenic power cycle to recover cold energy from LNG [13]. They proposed a mixture of tetrafluoromethane (CF4) and propane (C3H8) as the WF and adopted a vapor absorption process to enhance the efficiency of the ORC system. Bao et al. investigated seven cycle configurations to recover cold energy from LNG using propane as the WF [14]. They optimized each cycle using three different objective functions and concluded that the combined cycle (direct expansion + ORC system) systems are the most efficient in recovering cold energy from LNG. Bao et al. also proposed a superstructure for the three-stage ORC system for LNG cold energy recovery [15]. They optimized the three-stage condensation ORC system with 12 different WFs and found that the arrangement of the compression process is not important, whereas that of the expansion process has a significant effect on the cycle performance. Tomków and Cholewiński proposed an ORC system coupled with an absorption cycle using a mixture of ethane and krypton as the WF [16]. They concluded that the proposed cycle had the best performance compared to a simple ORC system and a Brayton cycle. Lee studied a cascade Rankine cycle and concluded that the cascade cycle, which uses ethane and propane as the WF, was the optimal cascade cycle for cold energy recovery from LNG [17]. Le et al. also studied an ORC system and found that pressure and thermal energy recovery through a combination of direct expansion and an ORC system using propane as the WF gives the best performance [18].
However, there have been few studies on an ORC system for an LNG-powered ship. As mentioned before, the purpose of the LNG-powered ship is to reduce pollutant emissions, but disposal of LNG cold energy is against this purpose. Major ship engine manufacturers provide their own LNG fuel supply systems [19,20], which need to be improved in a more efficient way in terms of energy savings.
Therefore, it is important to investigate the possibility of replacing a typical LNG fuel supply system with an ORC system. The main challenges of this problem are:
  • ORC systems should be applicable to both high-pressure and medium-pressure dual-fuel engines.
  • A configuration of an ORC system should be simple because the available space is small.
  • ORC systems should be more economical than a typical LNG fuel supply system. To this end, ORC systems should have high exergy efficiency and net power output.
To address these challenges, in this study, a novel solution to recover LNG cold energy for an LNG-powered ship was investigated. To accomplish this, six different ORC systems are proposed (three for high-pressure dual-fuel engines and three for medium-pressure dual-fuel engines), and the simulation model for each ORC system is developed using a commercial simulation tool. Second, nine WFs are selected based on previous studies, and the proposed ORC systems are optimized based on an exergy analysis using a particle swarm optimization (PSO) algorithm. Third, the equipment costs are estimated to compare the installation costs of an LNG fuel supply system and an ORC system. Finally, a sensitivity analysis is performed to identify the effect of uncertainties on the performance of the ORC system.
The rest of this paper is organized as follows. Details on simulation, optimization and economic models are given in Section 2, results and discussion are summarized in Section 3, and finally conclusions are provided in Section 4.

2. Methods

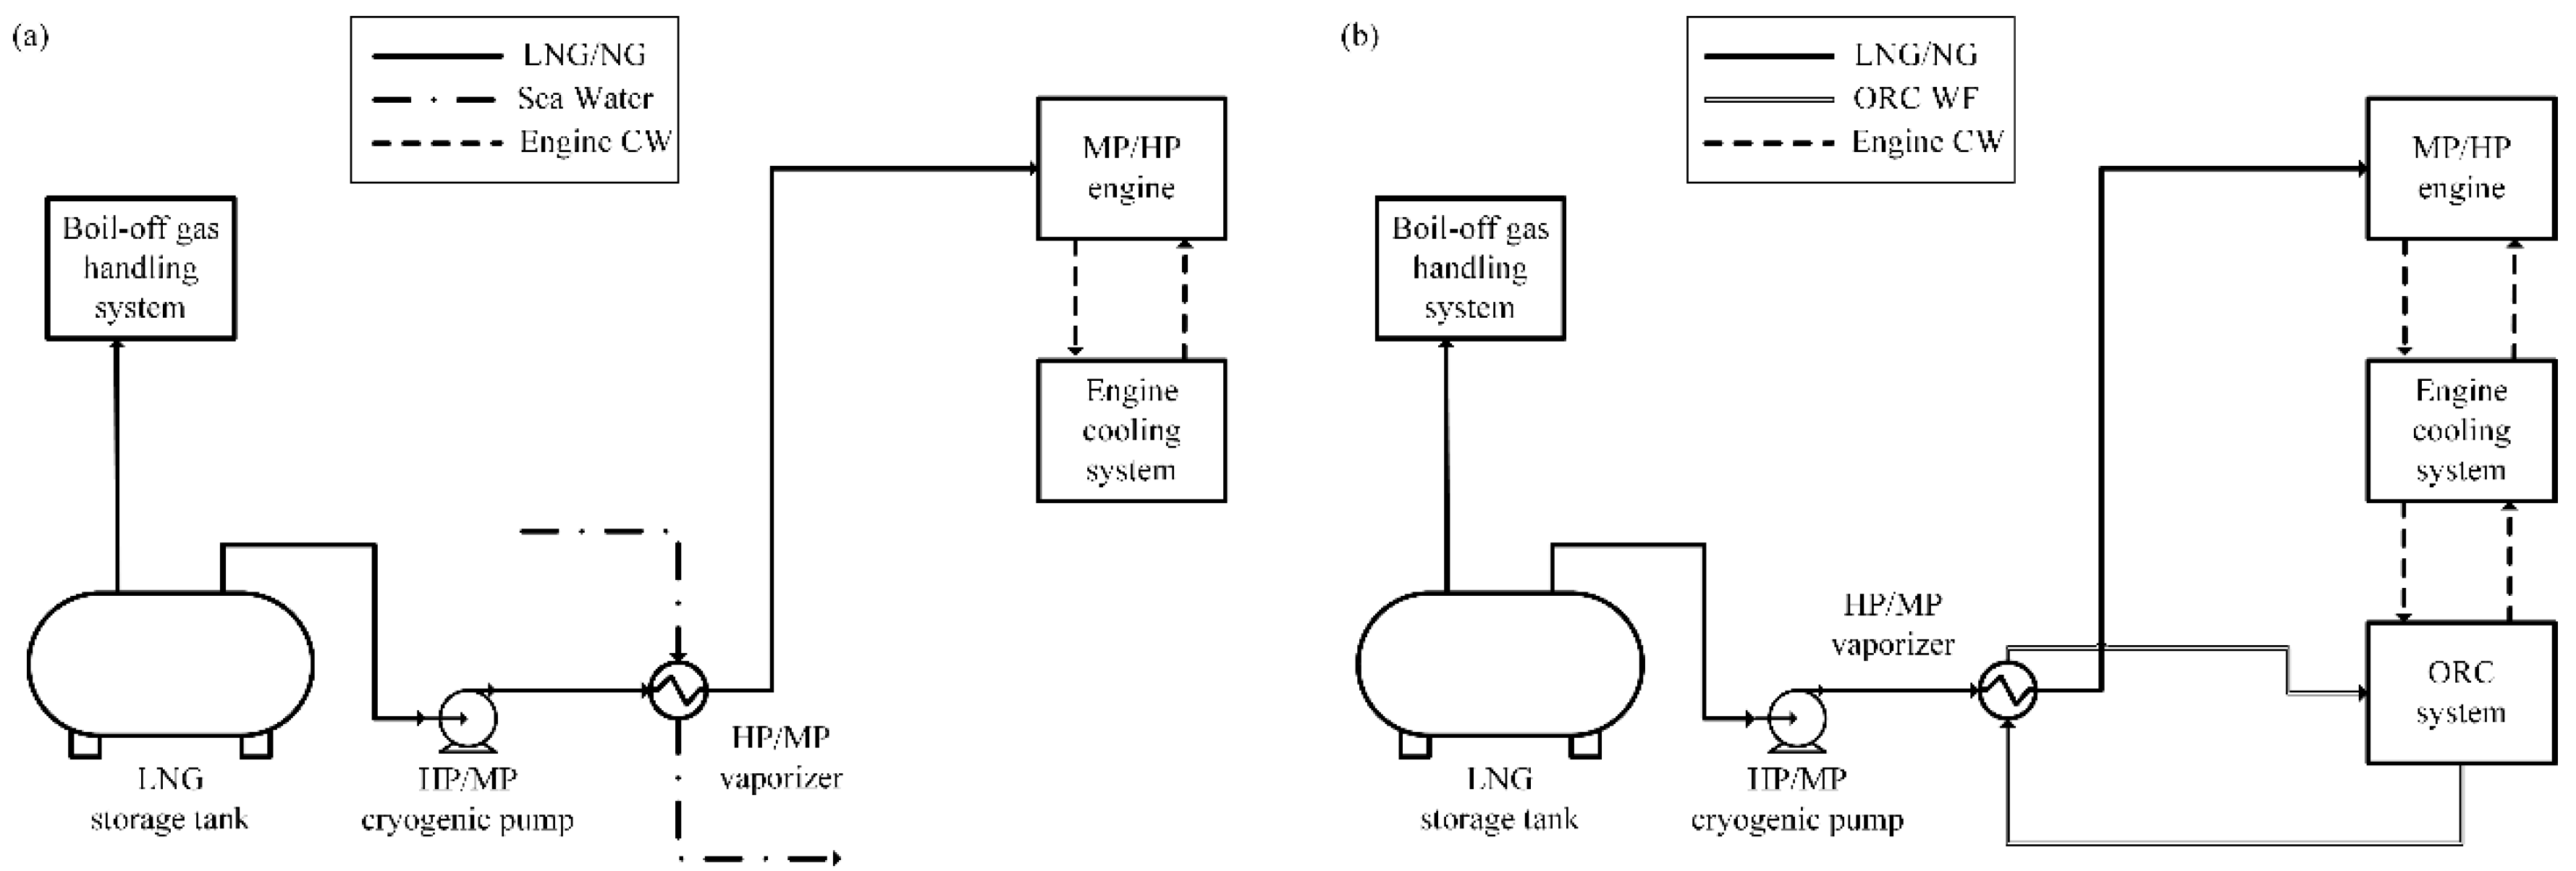
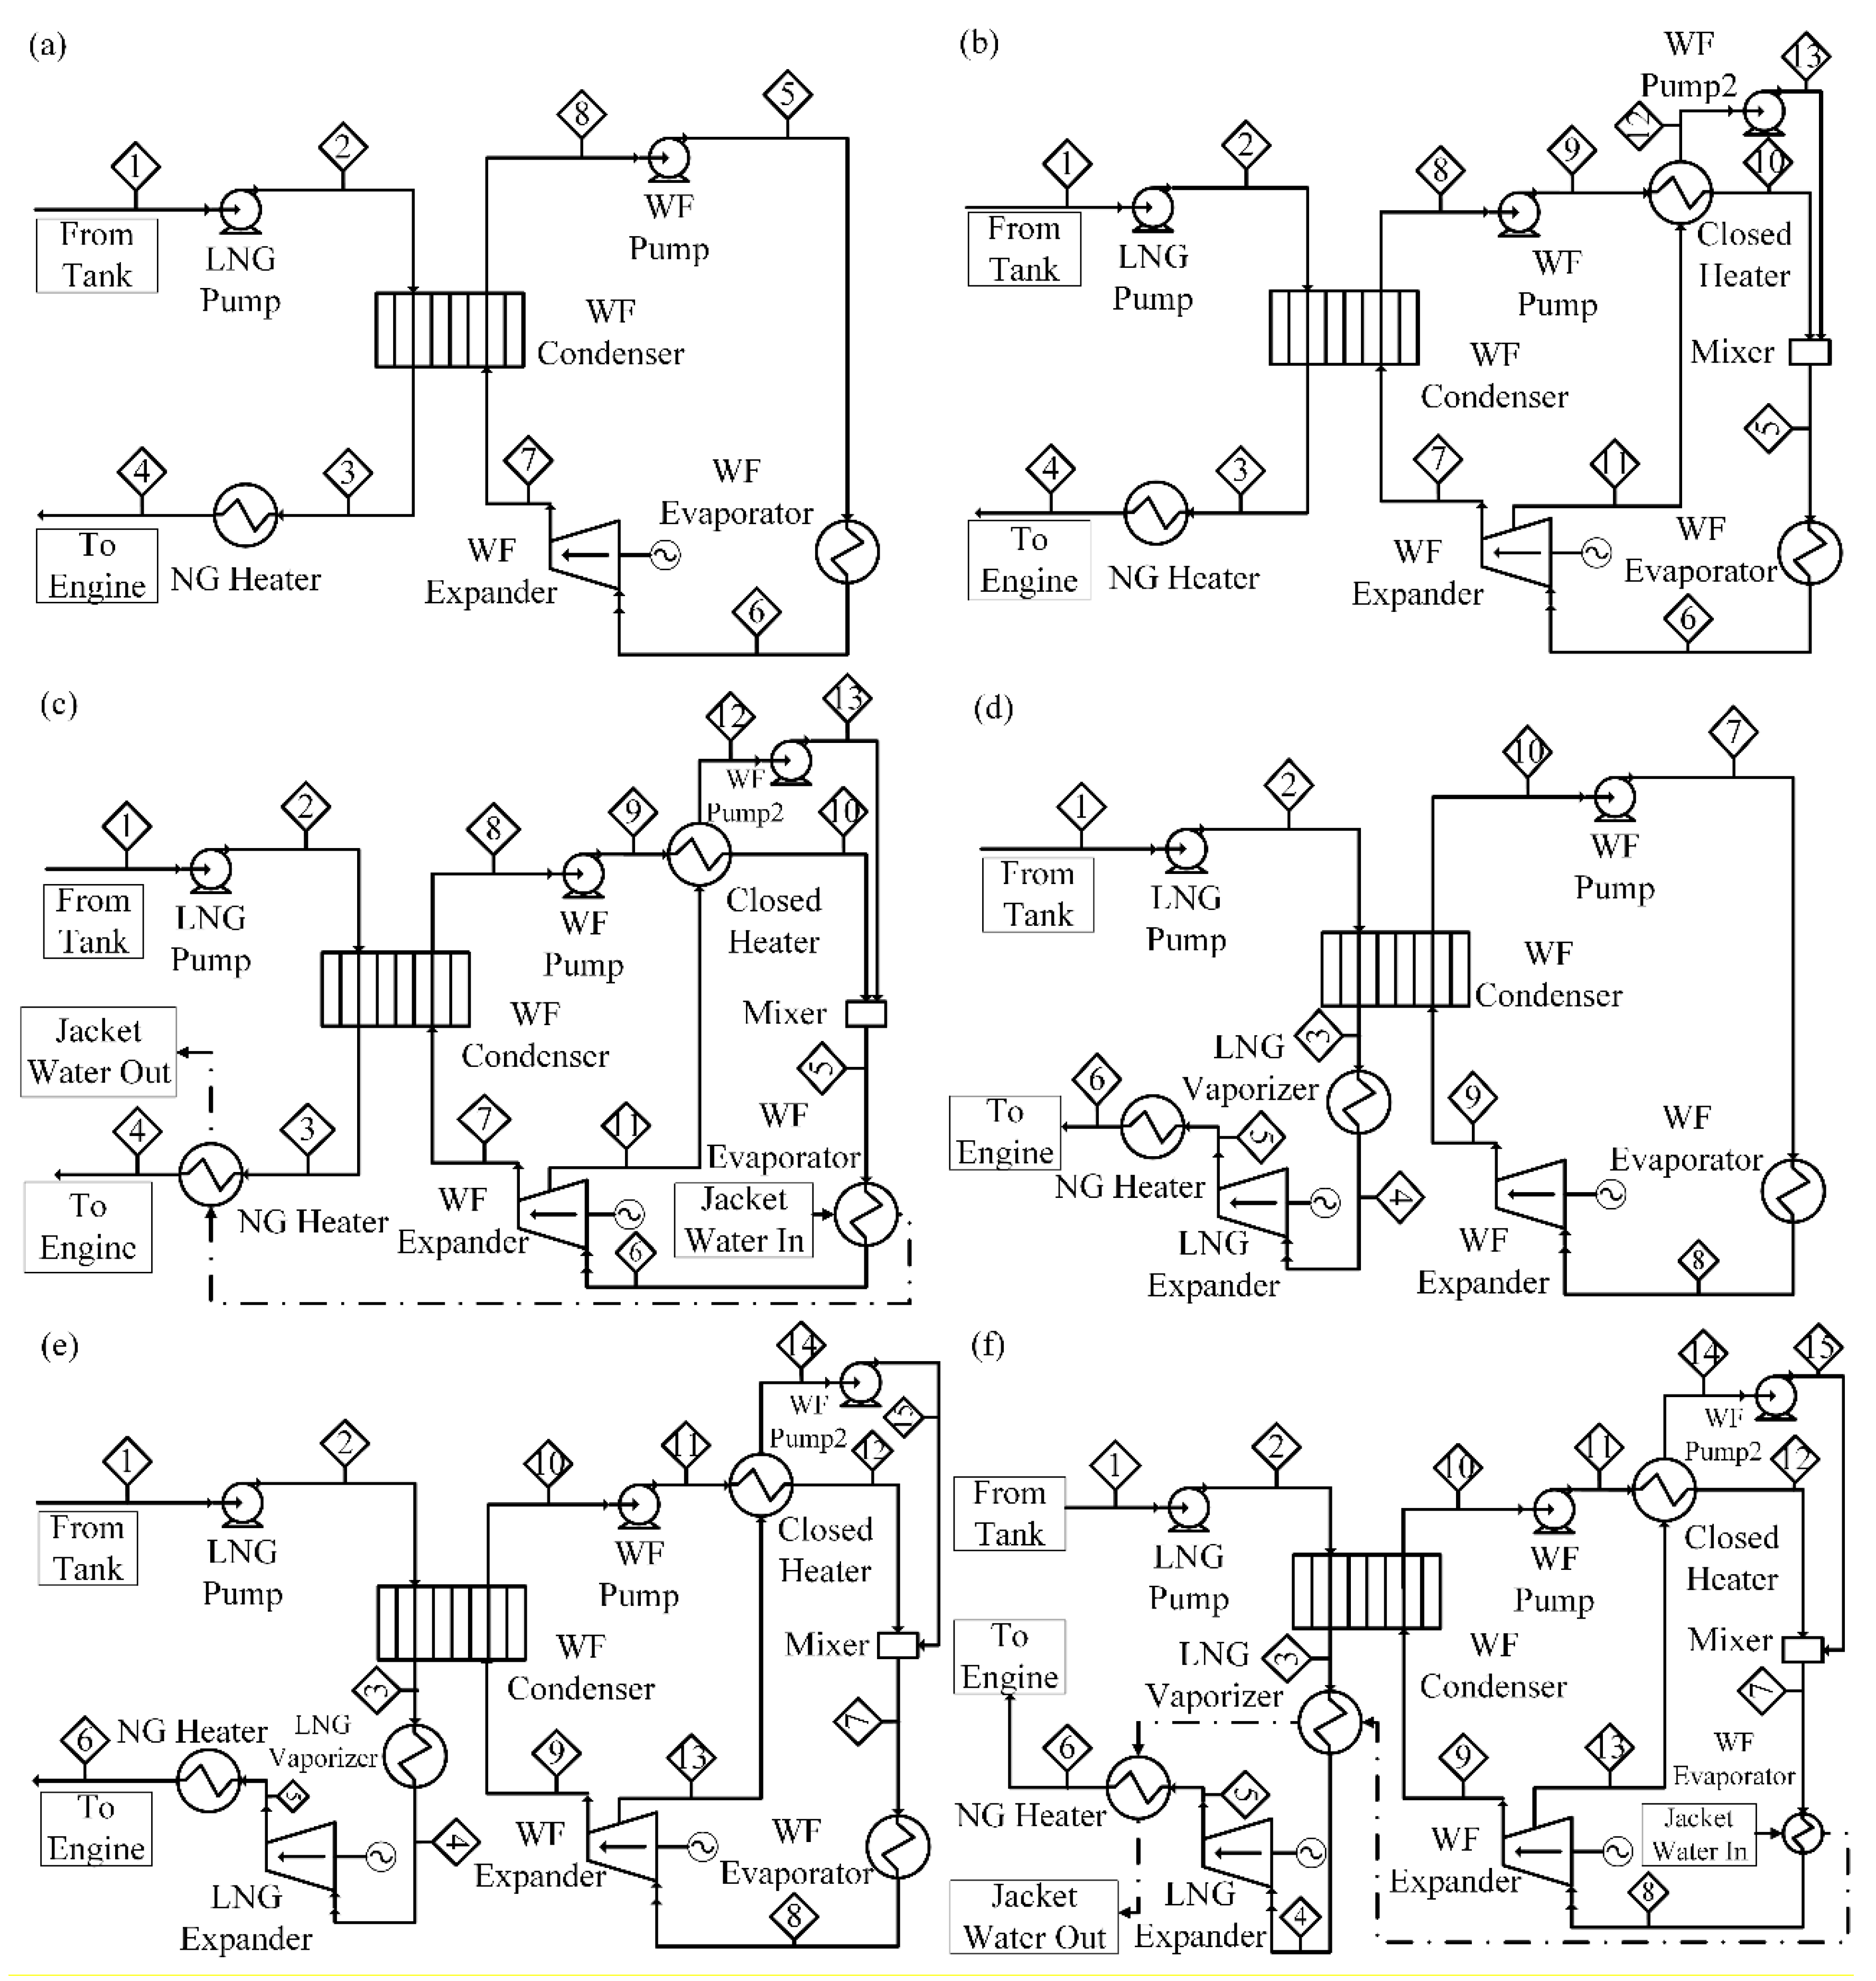
2.1. System Description

LNG-powered ships use dual-fuel engines that can operate on both marine diesel oil (MDO) and natural gas. Dual-fuel engines typically use natural gas as a primary fuel and MDO as a backup fuel [21]. Dual-fuel engines can be classified as high-pressure (~300 bar) engine systems and medium-pressure (~17 bar) engine systems, and both use an LNG fuel supply unit to supply natural gas to the engine system. A schematic of a typical fuel supply unit of an LNG-powered ship is shown in Figure 1. Figure 1a shows a typical LNG fuel supply unit and Figure 1b shows the LNG fuel supply unit proposed in this study, which is integrated with an ORC system and does not use seawater for the vaporizer. In the fuel supply unit, as shown in Figure 1, there are no significant differences between the medium-pressure engine system and the high-pressure engine system, except for the difference in engine pressure.
In this study, six ORC systems are defined to explore the possibility of replacing the LNG fuel supply unit for a high-pressure dual-fuel engine system and a medium-pressure dual-fuel engine system. A schematic of each ORC system is shown in Figure 2. Figure 2a is a simple ORC system, which we call Type (A), consisting of a WF pump, a WF evaporator, a WF expander, a WF condenser, an LNG pump, and a natural gas (NG) heater. In this system, LNG is pressurized up to 300 bar by the LNG pump, evaporated in the WF condenser, heated by the NG heater, and then fed to the high-pressure dual-fuel engine system. In the WF cycle, WF is at a saturated liquid state (stream 8), pressurized by the WF pump, vaporized and super-heated by the WF evaporator, depressurized by the WF expander, and then cooled by the WF condenser. Figure 2b is an ORC system with a closed-feed organic-fluid heater (CFOH). This system is more efficient than a simple ORC system because it can effectively reduce exergy losses [22]. In this system, the saturated liquid stream 8 is pressurized by the WF pump and then heated by stream 11, which is extracted from the WF in the closed heater. Stream 12 is at a saturated liquid state, pressurized by WF pump 2, and then mixed with stream 10 in the mixer. The mixed stream 5 is vaporized by the WF evaporator. Figure 2c is also an ORC system with a CFOH. However, in this case the heat source of the WF evaporator is the engine jacket water instead of seawater. As mentioned previously, using the engine jacket water instead of seawater can increase cycle efficiency, owing to higher evaporation temperatures.
Figure 2d is a simple ORC system with an LNG expander for the medium-pressure engine system. The natural gas pressure at the engine inlet (stream 6) is approximately 17 bar, which is much lower than that of shown in Figure 2a (~300 bar). Consequently, an expander is added to utilize the advantages of pressurized LNG. Figure 2e is an ORC system with an LNG expander and a CFOH, and Figure 2f is an ORC system, the same as Figure 2e except using engine jacket water as the heat source of the WF evaporator and the LNG vaporizer.

2.2. Simulation Model

All ORC systems described in Section 2.1 were simulated using the commercial simulation software ASPEN V10.0. A target power output of 12,000 kW of the dual-fuel engine is assumed.
All parameter and decision variables were identified through a degree-of-freedom analysis. Table 1 summarizes all the decision variables for optimization and Table 2 lists all parameters and assumptions used in this study.
The selection of the WF is very important because it is a major factor in the ORC system. In this study, nine WFs were selected based on previous studies [10,13,14,16,26,27]. Table A1. lists all WFs investigated in this study.

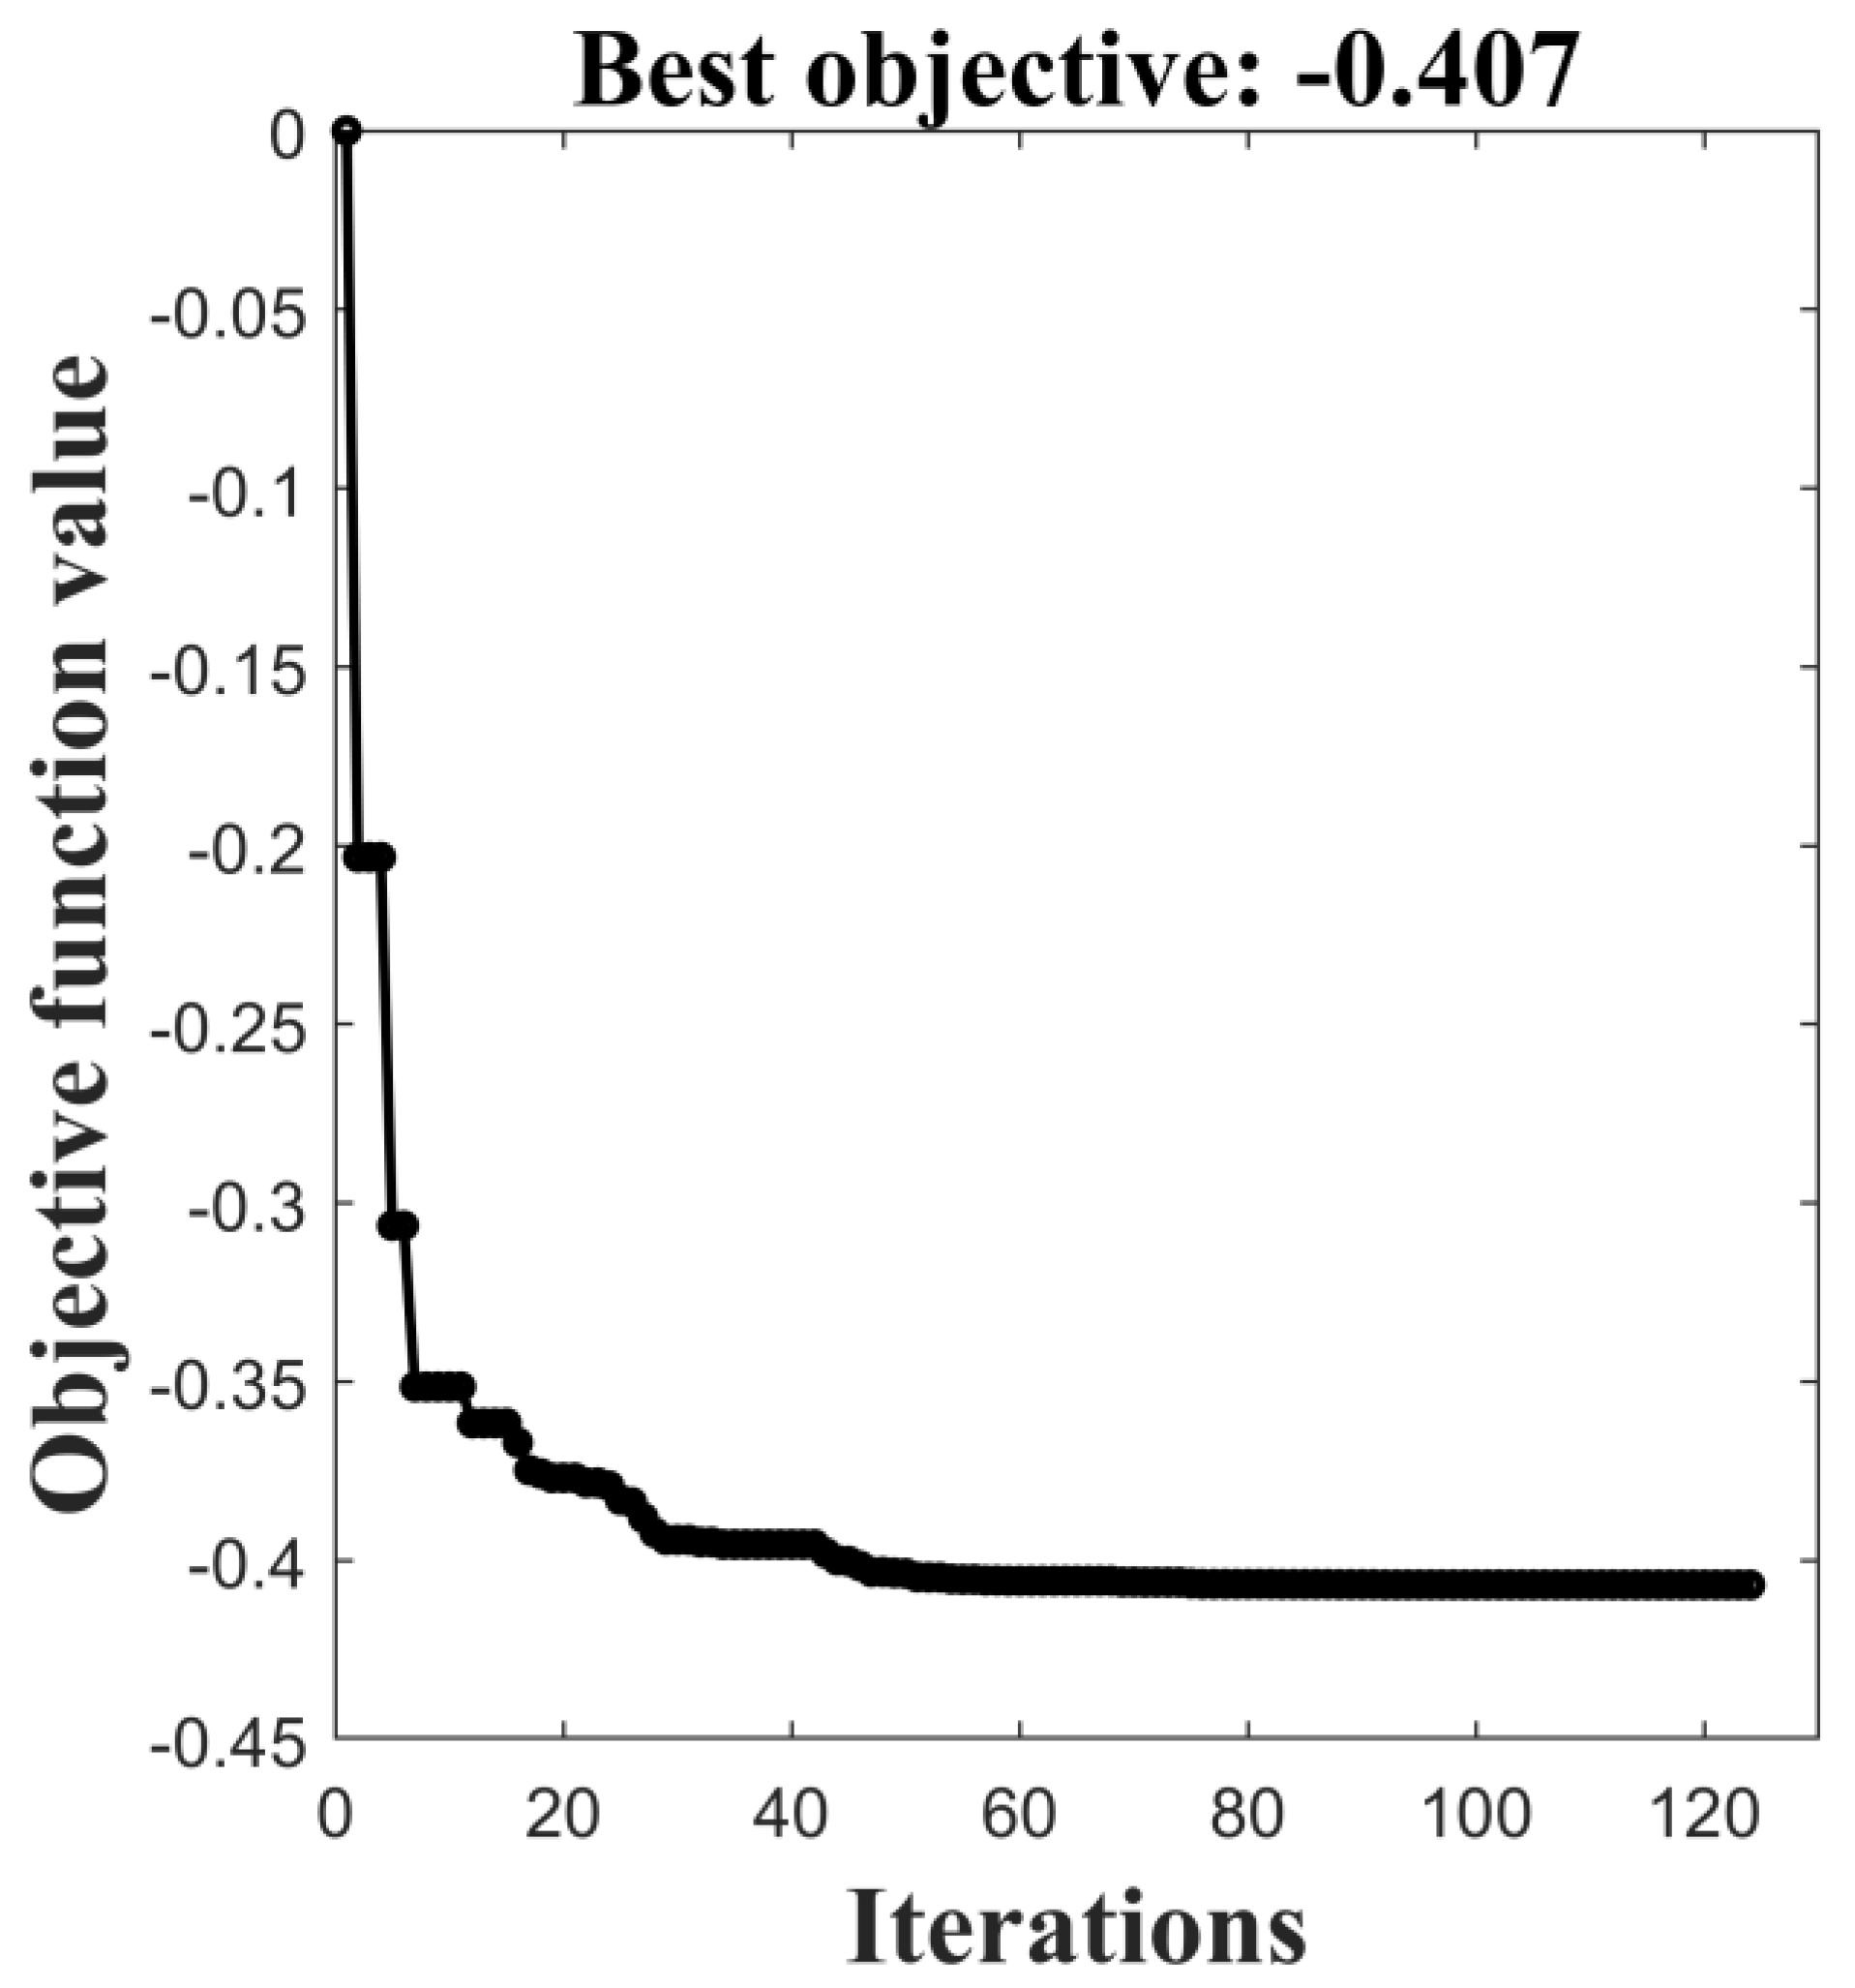
2.3. Optimization Framework

To formulate the objective function for optimization, the exergy potential was used. The exergy potential (Ex) can be calculated as follows:
Ex = h x h 0 T 0 · ( s x s 0 )
The total exergy provided to the ORC system by LNG streams can be calculated as follows:
Ex = Ex LNG Ex NG
where ExLNG is the exergy of the LNG feed stream from the LNG storage tank and ExNG is the exergy of the NG stream fed to the engine.
The net power produced by the system and the process exergy efficiency can be formulated as follows:
W net =   W turbine   W pump
ψ ex = W net Ex
Finally, the optimization problem can be defined as follows:
Maximize   ψ ex = Minimize   ( ψ ex )
subject to
v f   a t   t h e   o u t l e t   o f   e x p a n d e r s = 1
v f   a t   t h e   i n l e t   o f   p u m p s = 0
MITA   of   all   heat   exchangers   2   K
Minimum internal temperature approach ( MITA )   of   all   heat   exchangers   2   K , (8)
Temp .   at   the   outlet   of   the   WF   evaporator   296   K   for   Types   ( a ) ,   ( b ) ,   ( c ) ,   ( d )
Temp .   at   the   outlet   of   the   WF   evaporator   351   K   for   Types   ( c ) ,   ( f )
Equations (6)–(10) are the process constraints for reliable optimization results. Equations (6) and (7) protect the expanders or pumps from damage that may be caused by liquid droplets or vapors [25]. Equations (8)–(10) ensure a practical heat exchanger area. The right-hand side of Equation (9) is 296 K because Type (a), (b), (d), and (e) systems use seawater as the heat source for the WF evaporator. The right-hand side of Equation (10) is 351 K because Type (c) and (f) systems use engine jacket water as the heat source for the WF evaporator.
The formulated optimization problem is a non-linear problem owing to the non-linearity between the decision variables and the net power produced (Wnet) by the system. To solve the optimization problem, the simulation model was connected to MATLAB using a component object model (COM) interface [28] (pp. 523–544), and the solution was found using the PSO algorithm [29,30,31,32,33,34] in MATLAB. The setting parameters of the PSO algorithm are listed in Table A2. All simulations and optimization are performed on a computer with Intel quad-core processors (4.2 GHz) and 16 GB RAM.

2.4. Cost Estimation

Because actual systems can be realized when they are economically feasible, cost estimation can provide valuable insights into the proposed ORC system [14,35]. In this study, to verify the advantages of installing the proposed ORC system, the actual annualized costs of ORC systems were estimated based on previous research data [25].
P C c o n d e n s e r =   37940 * A 0.5155 * C E P C I 2017 C E P C I 1998     ,
P C h e a t e r   =     ( 198.36 * A + 52635 ) * C E P C I 2017 C E P C I 1998   ,
P C t u r b i n e   =     ( 0.17 * W t u r b i n e 2 + 309.13 * W t u r b i n e + 33516 ) * C E P C I 2017 C E P C I 1998   ,
P C p u m p   =   ( 11974 *   W w f p u m p 0.502 ) * C E P C I 2017 C E P C I 1998   ,
P C c w p u m p   =   ( 52.02 * V c w + 22746 ) * C E P C I 2017 C E P C I 1998   ,
P C c w t o w e r   =     ( 112.23 * V c w + 56221 ) * C E P C I 2017 C E P C I 1998   ,
where CEPCI1998 = 436 and CEPCI2017 = 672, respectively. C E P C I 2017 C E P C I 1998 is used to adjust the cost to US dollars in 2017 because the equipment costs in previous research were based on data in 1998. For the sake of convenience, PCLNGpump was assumed to be the same as PCpump, and PCvaporizer was assumed to be the same as PCcondenser.
In addition, the following additional costs were also considered [36]:
P i p i n g   c o s t = 0.4 *   i P C i       ,
F i x e d   c a p i t a l   c o s t = i P C i + P i p i n g   c o s t   ,
i   { c o n d e n s e r ,   h e a t e r ,   t u r b i n e , p u m p ,   c o o l i n g   w a t e r   p u m p ,   c o o l i n g   w a t e r   t o w e r } E n g i n e e r i n g   a n d   S u p e r v i s i o n   c o s t : 0.12 * F i x e d   c a p i t a l   c o s t
M a i n t e n a n c e   c o s t : 0.06 * F i x e d   c a p i t a l   c o s t ,
The simplified annualized cost (SAC) can be estimated by the following Equation:
S A C = F i x e d   c a p i t a l   c o s t + E n g i n e e r i n g   a n d   S u p e r v i s i o n   c o s t + M a i n t e n a n c e   c o s t L i f e   t i m e   o f   e q u i p m e n t       .    
The ORC systems can reduce the electricity generation costs of ships by reducing the consumption of other fuels such as marine diesel oil and heavy fuel oil for generators. Therefore, possible cost savings can be estimated as follows:
C o s t   s a v i n g s = p r o d u c e d   e l e c t r i c i t y   ( k W ) * o p e r a t i o n   h o u r s   ( h r y e a r ) * e l e c t r i c i t y   g e n e r a t i o n   c o s t   ( U S   d o l l a r s k W h ) .
Finally, the actual annualized cost (AAC) can be estimated as follows:
A A C = S A C C o s t   s a v i n g s .

3. Results and Discussion

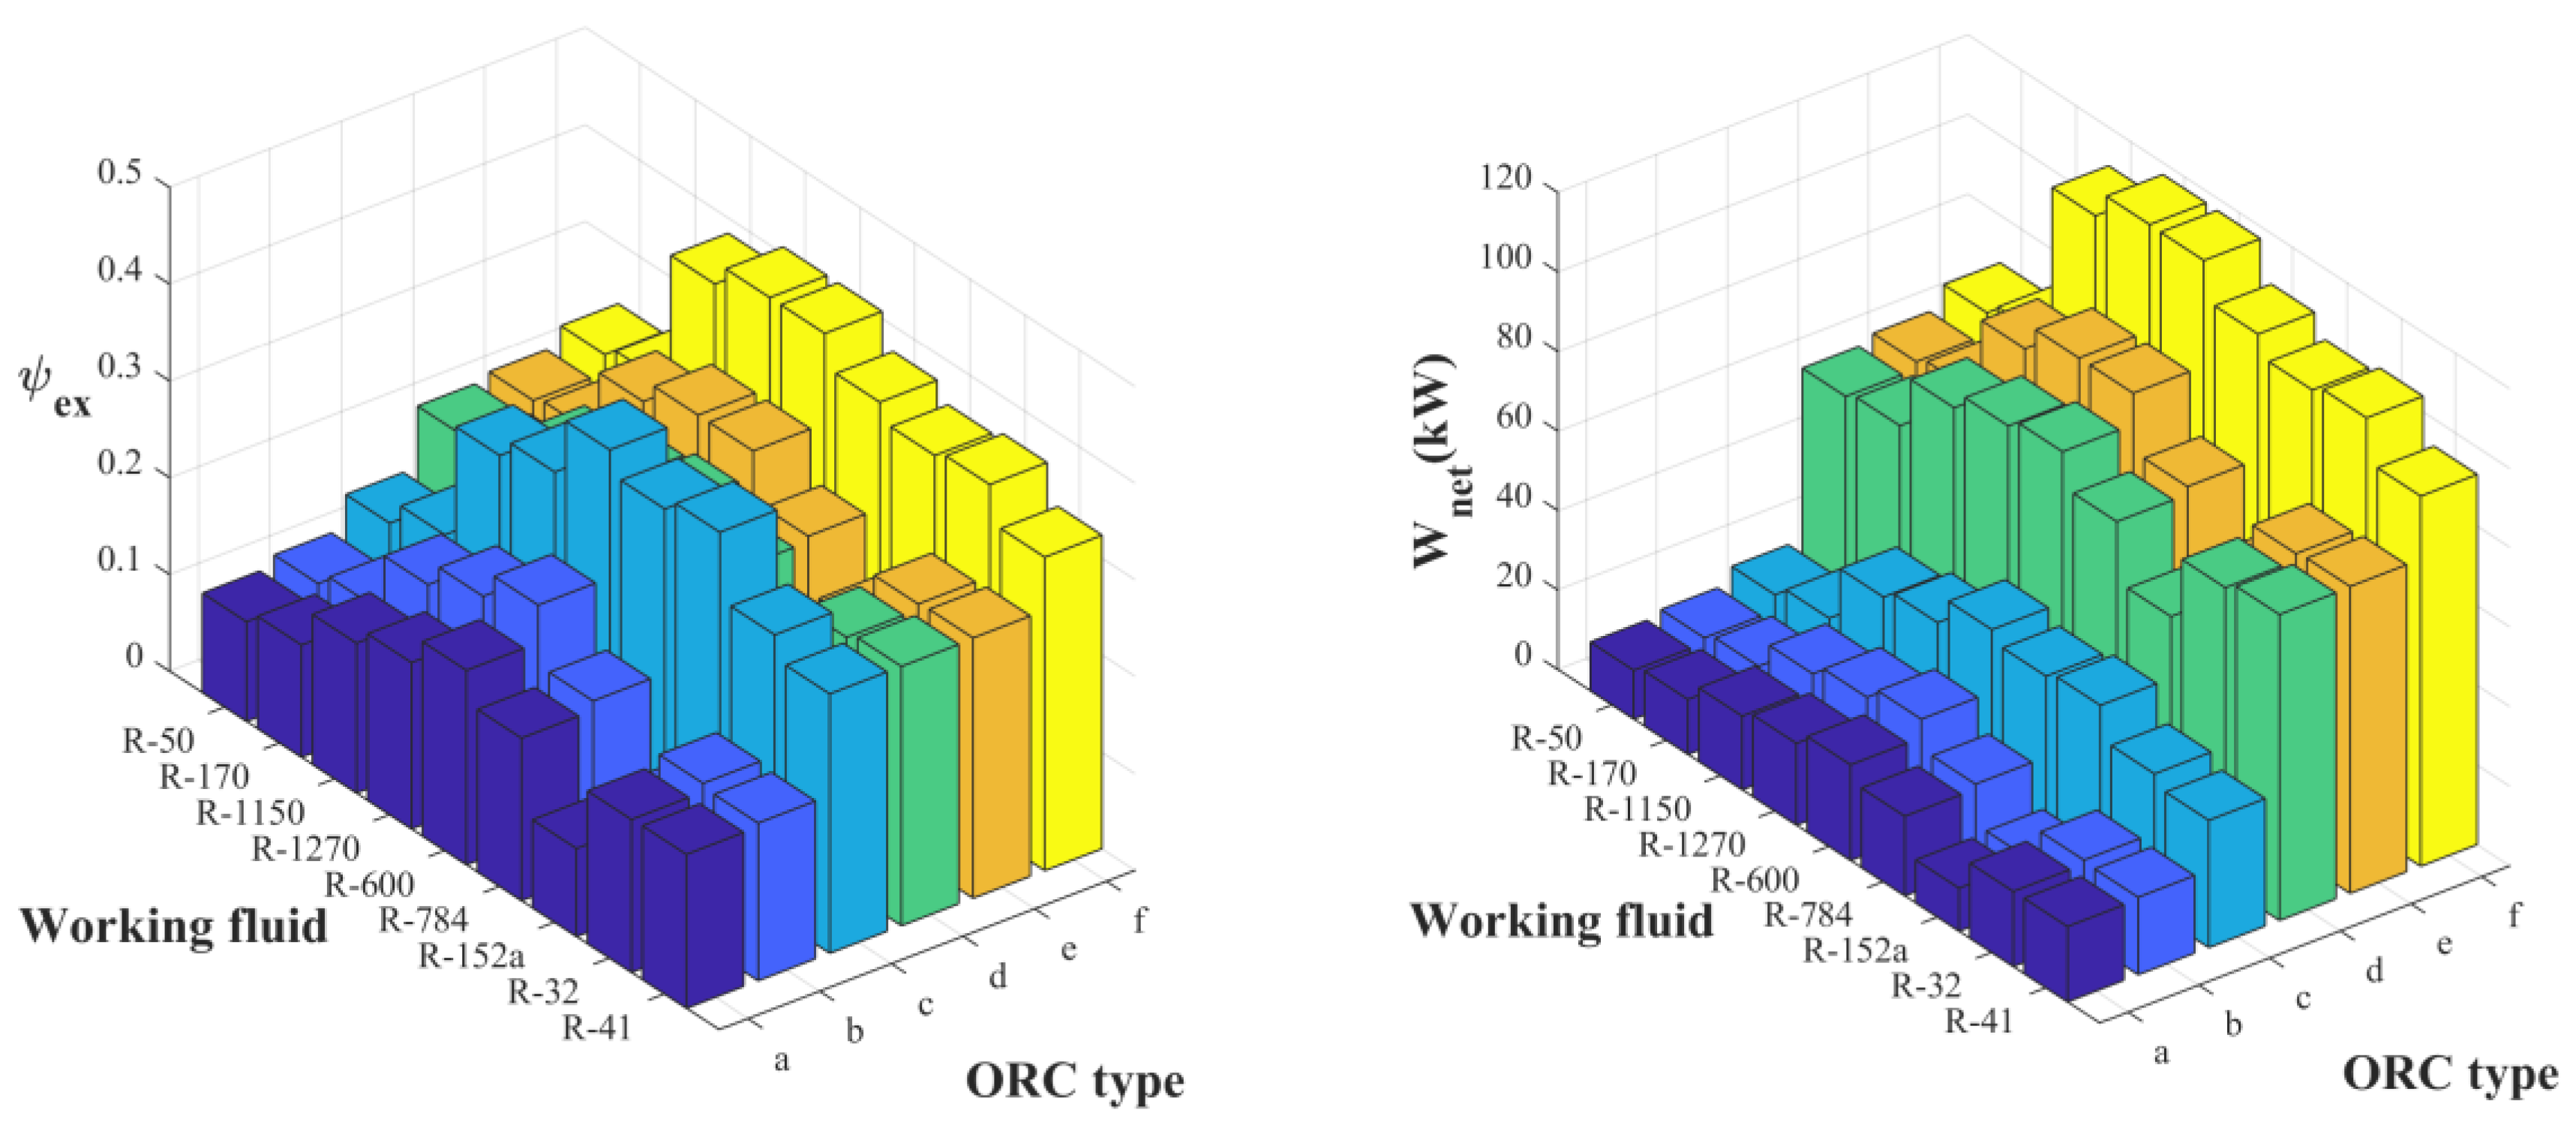
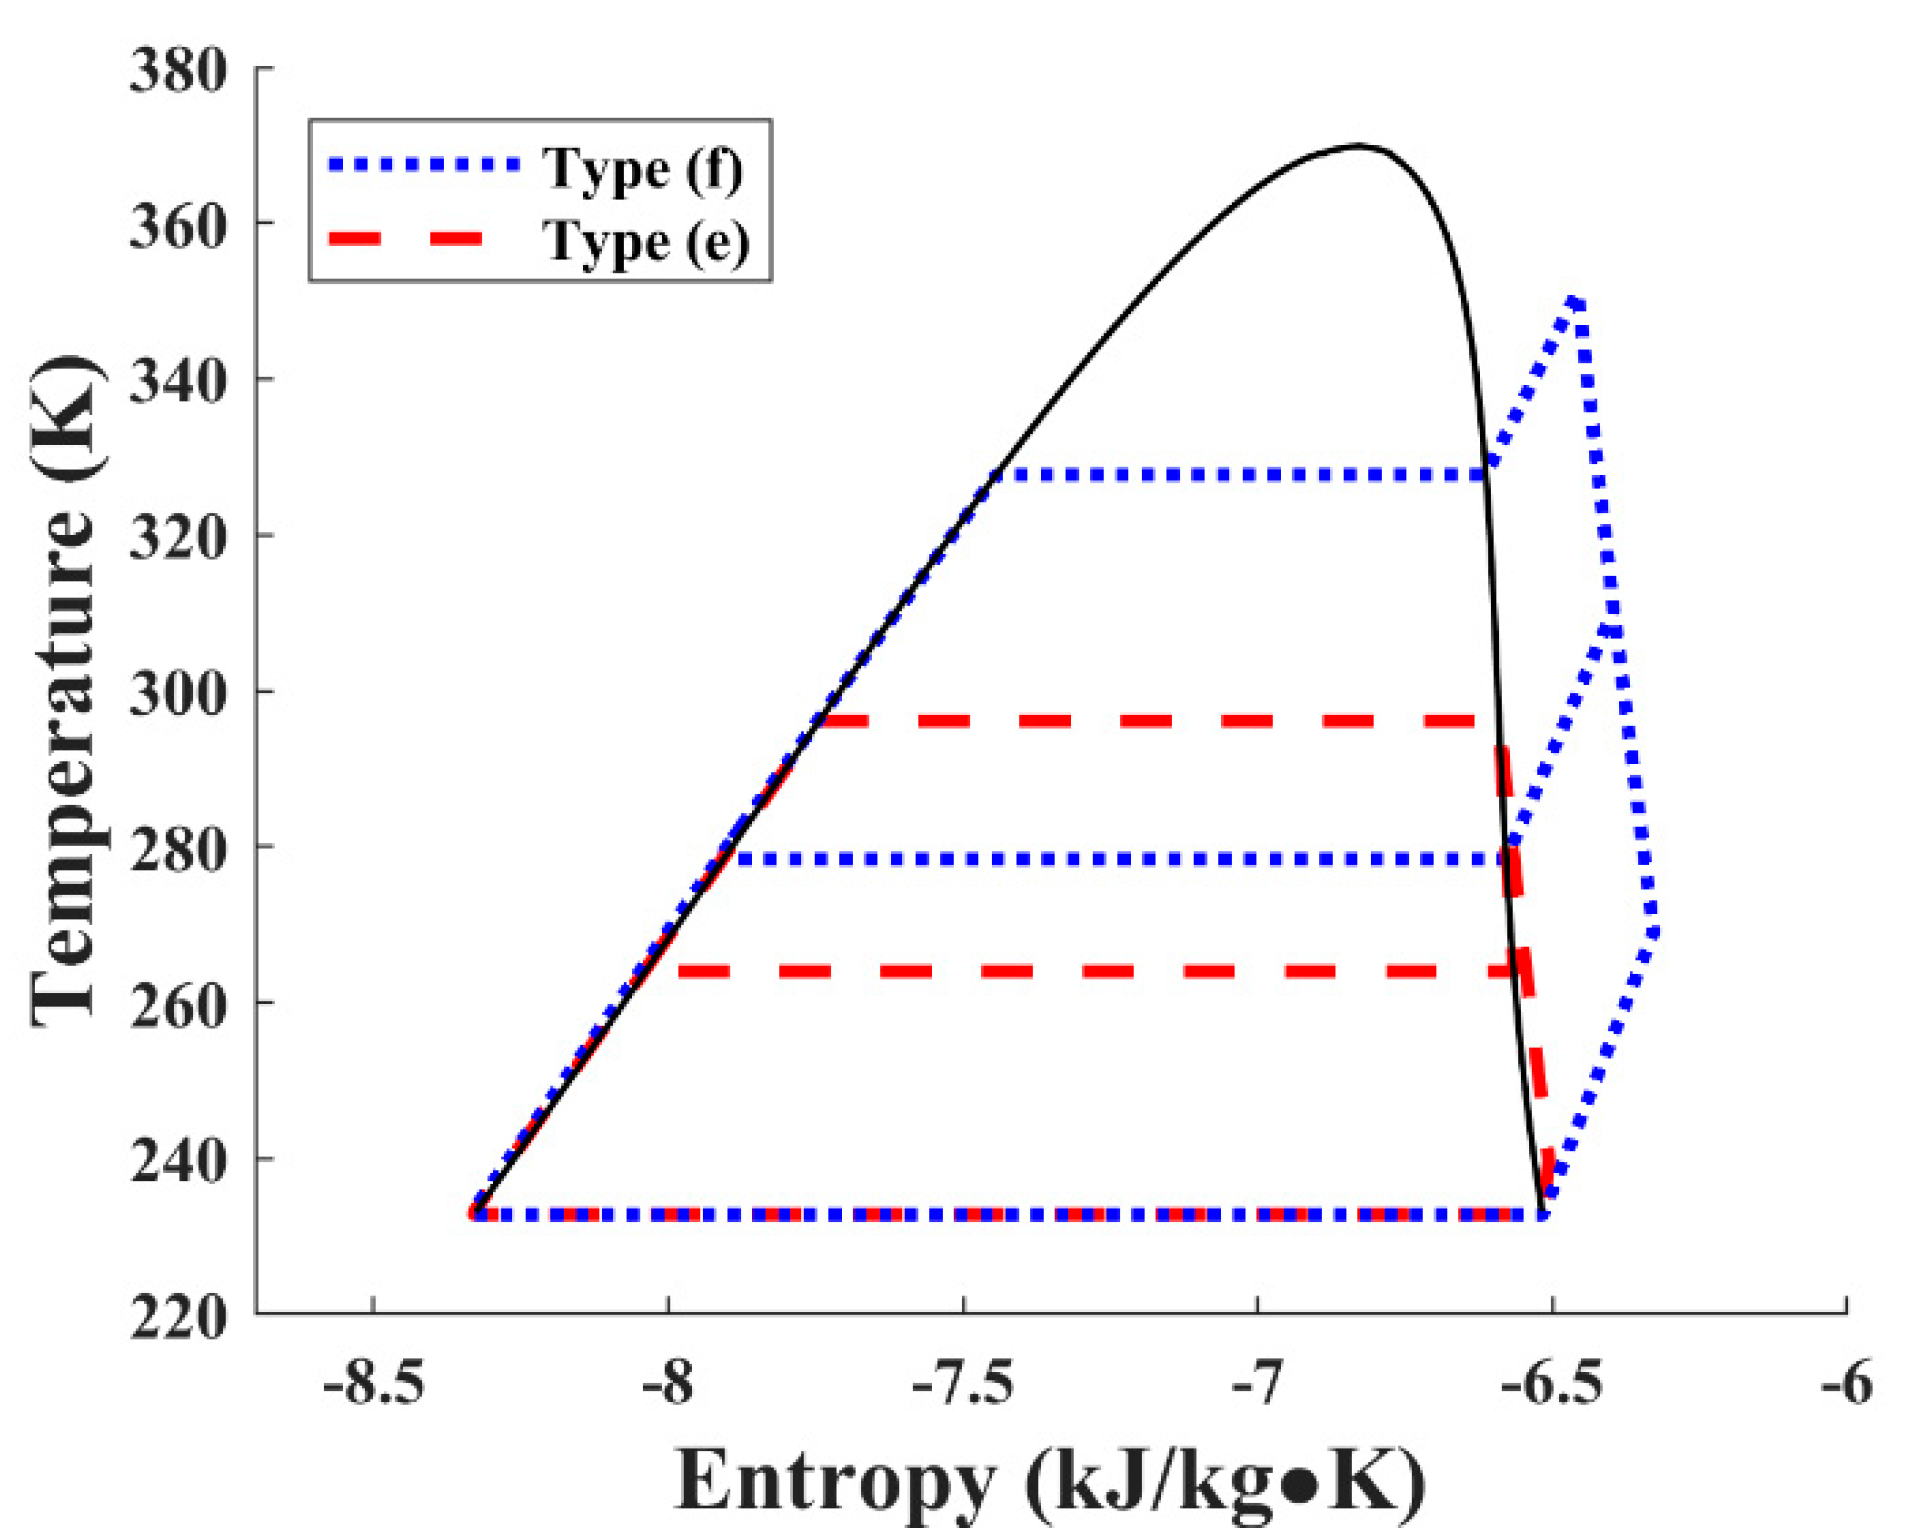
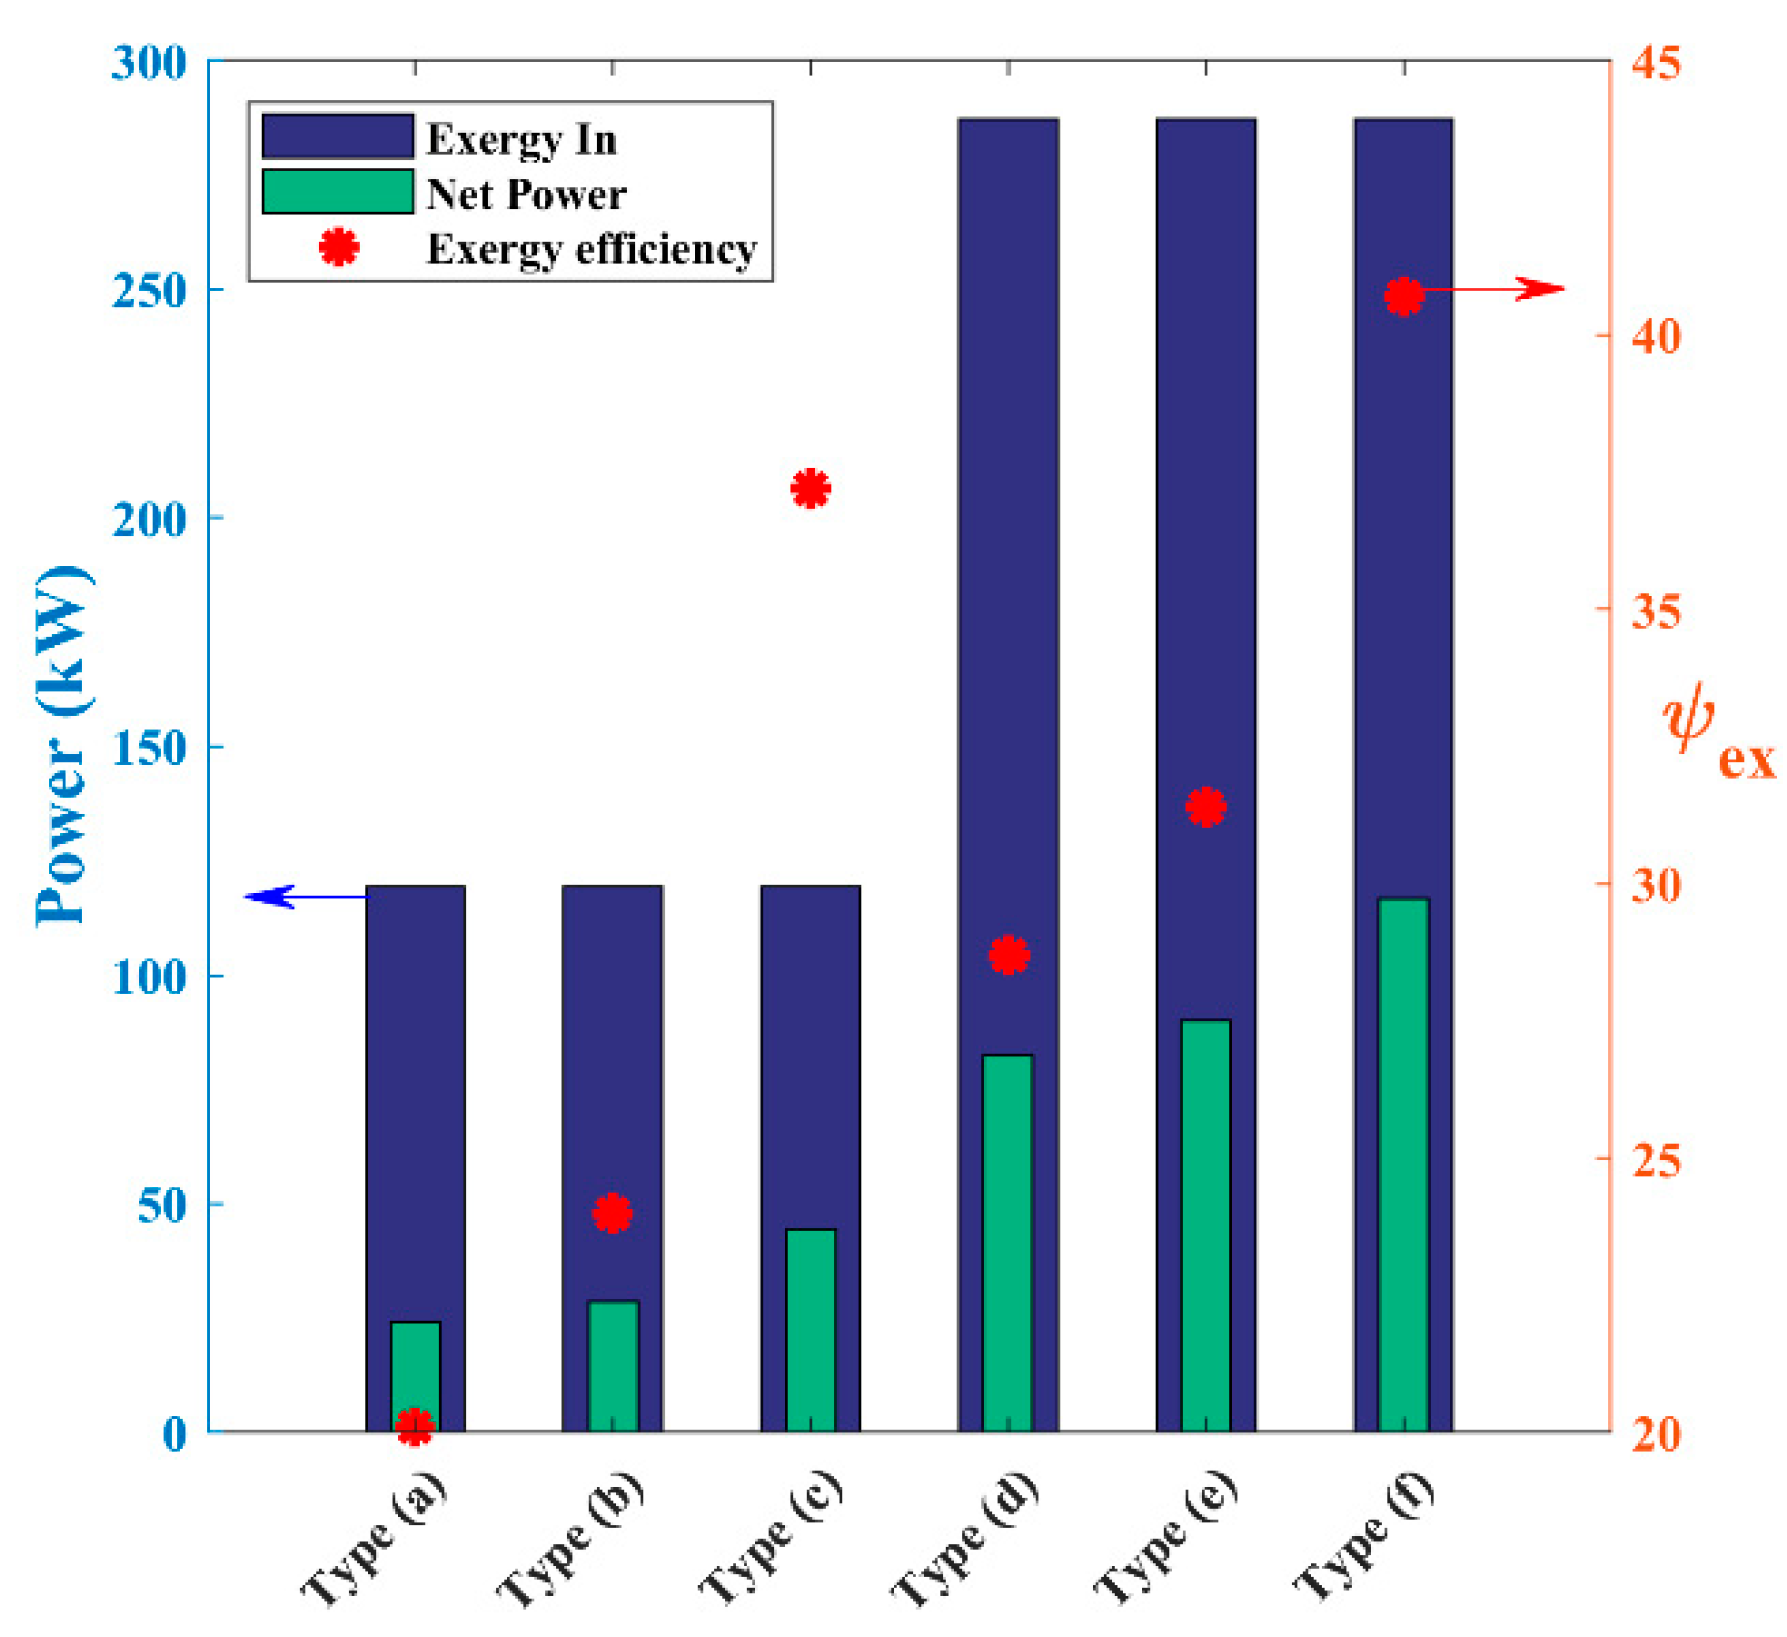
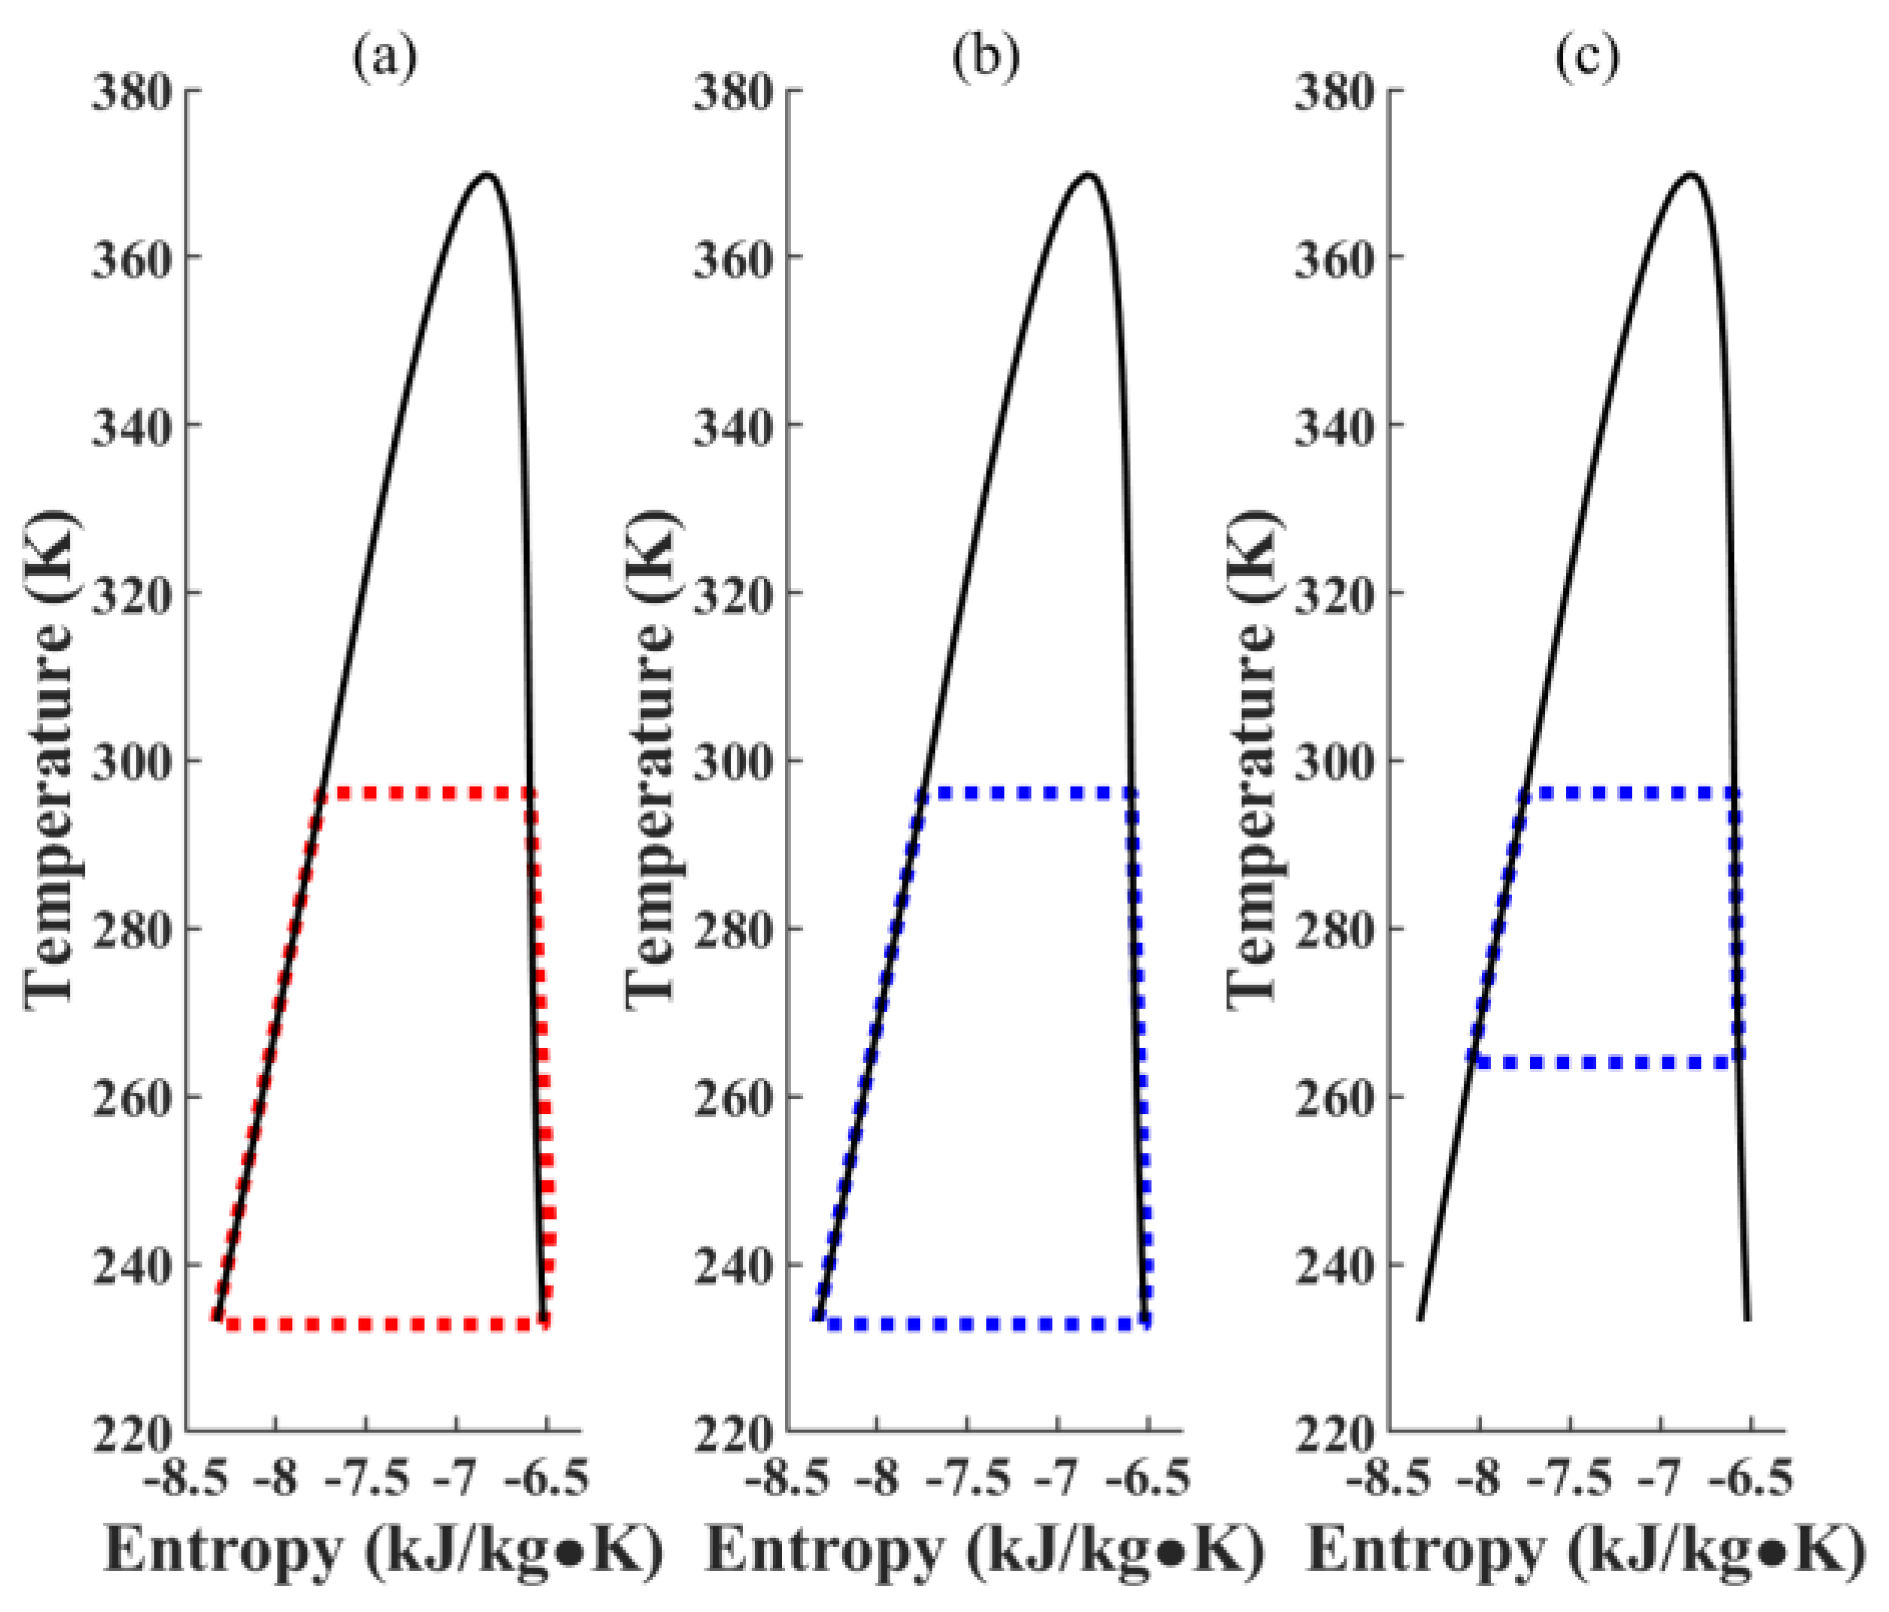
3.1. Optimization Results

The convergence curve for the Type (f) system (see Figure 2f) when the WF is propane is shown in Figure 3 and the optimized objective function values and the net power output of each cycle are summarized in Figure 4. Details on the best decision variables for each type are given in Table 3.
The best exergy efficiency of 40.7% and the highest power output of 116.8 kW were found in Type (f) when the WF is propane. Regardless of ORC types, propane always exhibits the highest exergy efficiency and the highest net power output over other WFs. In Type (e) and Type (f), ethane exhibits almost the same WF performance as propane. However, because of its lower boiling point, the storage of ethane is more problematic than propane.
As shown in Figure 4, the ORC systems for medium-pressure dual-fuel engines (Types (d), (e), and (f)) tend to show better performance. This is because the medium-pressure engines, which operate at approximately 17 bar, can utilize the direct expansion of the pressurized LNG stream. In contrast, the ORC systems for high-pressure dual-fuel engines (Types (a), (b), and (c)) have no opportunity to exploit the direct expansion of the pressurized LNG stream because of the high engine operating pressure (approximately 300 bar).
Regarding the exergy efficiency, Type (c) (a high-pressure engine) and Type (f) (a medium-pressure engine) show the highest exergy efficiency, at 37.2% and 40.7%, respectively, and both cases use engine jacket water as the heat source of the WF evaporator. As shown in Figure 5, a high evaporation temperature leads to a large area on a temperature-entropy diagram, which means high exergy efficiency. Consequently, Type (c) and Type (f) perform better than other Types because they have a higher evaporation temperature (353 K, the temperature of engine jacket water, compared to 298 K, the temperature of seawater).
Regarding the net power output, medium-pressure engine ORC systems produce more electricity than high-pressure engine ORC systems. The medium-pressure engine ORC systems have additional exergy because they can utilize the exergy of the pressurized LNG stream owing to the intermediate engine operating pressure. Consequently, more electricity can be generated for medium-pressure engine ORC systems because of more available exergy even if it has lower exergy efficiency than high-pressure engine ORC systems. As shown in Figure 6, the amount of exergy supplied to high-pressure engine ORC systems is 287.1 kW, which is much higher than the amount of exergy (119.5 kW) supplied to medium-pressure engine ORC systems. Consequently, the amounts of electricity produced by Type (d), (e) and (f) (82.4 kW, 90.2 kW, and 116.8 kW, respectively) are also much higher than those produced by Type (a), (b) and (c) (24.1 kW, 28.7 kW, and 44.4 kW, respectively), even with low exergy efficiency.
In addition, ORC systems with multi-condensation levels (Type (b) and Type (e)) show better performance than ORC systems with a single-condensation level (Type (a) and Type (d)), at the same heat source temperature. As shown in Figure 7, the reversible work of Type (d) and Type (e) is almost the same (Figure 7a,b). However, ORC Type (e) has additional reversible work (Figure 7c) owing to separated condensation levels. As a result, Type (e) can produce more electricity (90.2 kW) than Type (d) (82.4 kW), but the difference is not significant due to the small additional reversible work (please see Figure 7c).

3.2. Cost Estimation Results

For the comparison purpose, the cost of installing LNG fuel supply systems which consist of an LNG pump, an LNG vaporizer, a cooling water pump, and a cooling water tower (please refer to Figure 1a) are also estimated. The required data for the cost estimation was obtained by the simulation and are summarized in Table A3.
The estimation results of SAC and AAC based on the optimization results are summarized in Table 4. As shown in Table 4, in terms of SAC, the ORC systems are more expensive than LNG fuel supply systems due to their complexity. In addition, the SAC of ORC systems also tends to increase from Type (a) to Type (f) as complexity increases.
However, in terms of AAC, ORC type (f) seems to be the most profitable systems among the proposed system. Generally, the ORC systems for medium-pressure dual-fuel engines seem to be more profitable than LNG fuel supply systems except for ORC type (e). It is noteworthy that ORC Type (b) and (e) are less profitable than ORC Type (a) and (d) due to their complexity. Therefore, in the case of using seawater as the heat source of the WF evaporator, a simple ORC system is better than a complex ORC system in terms of profit.

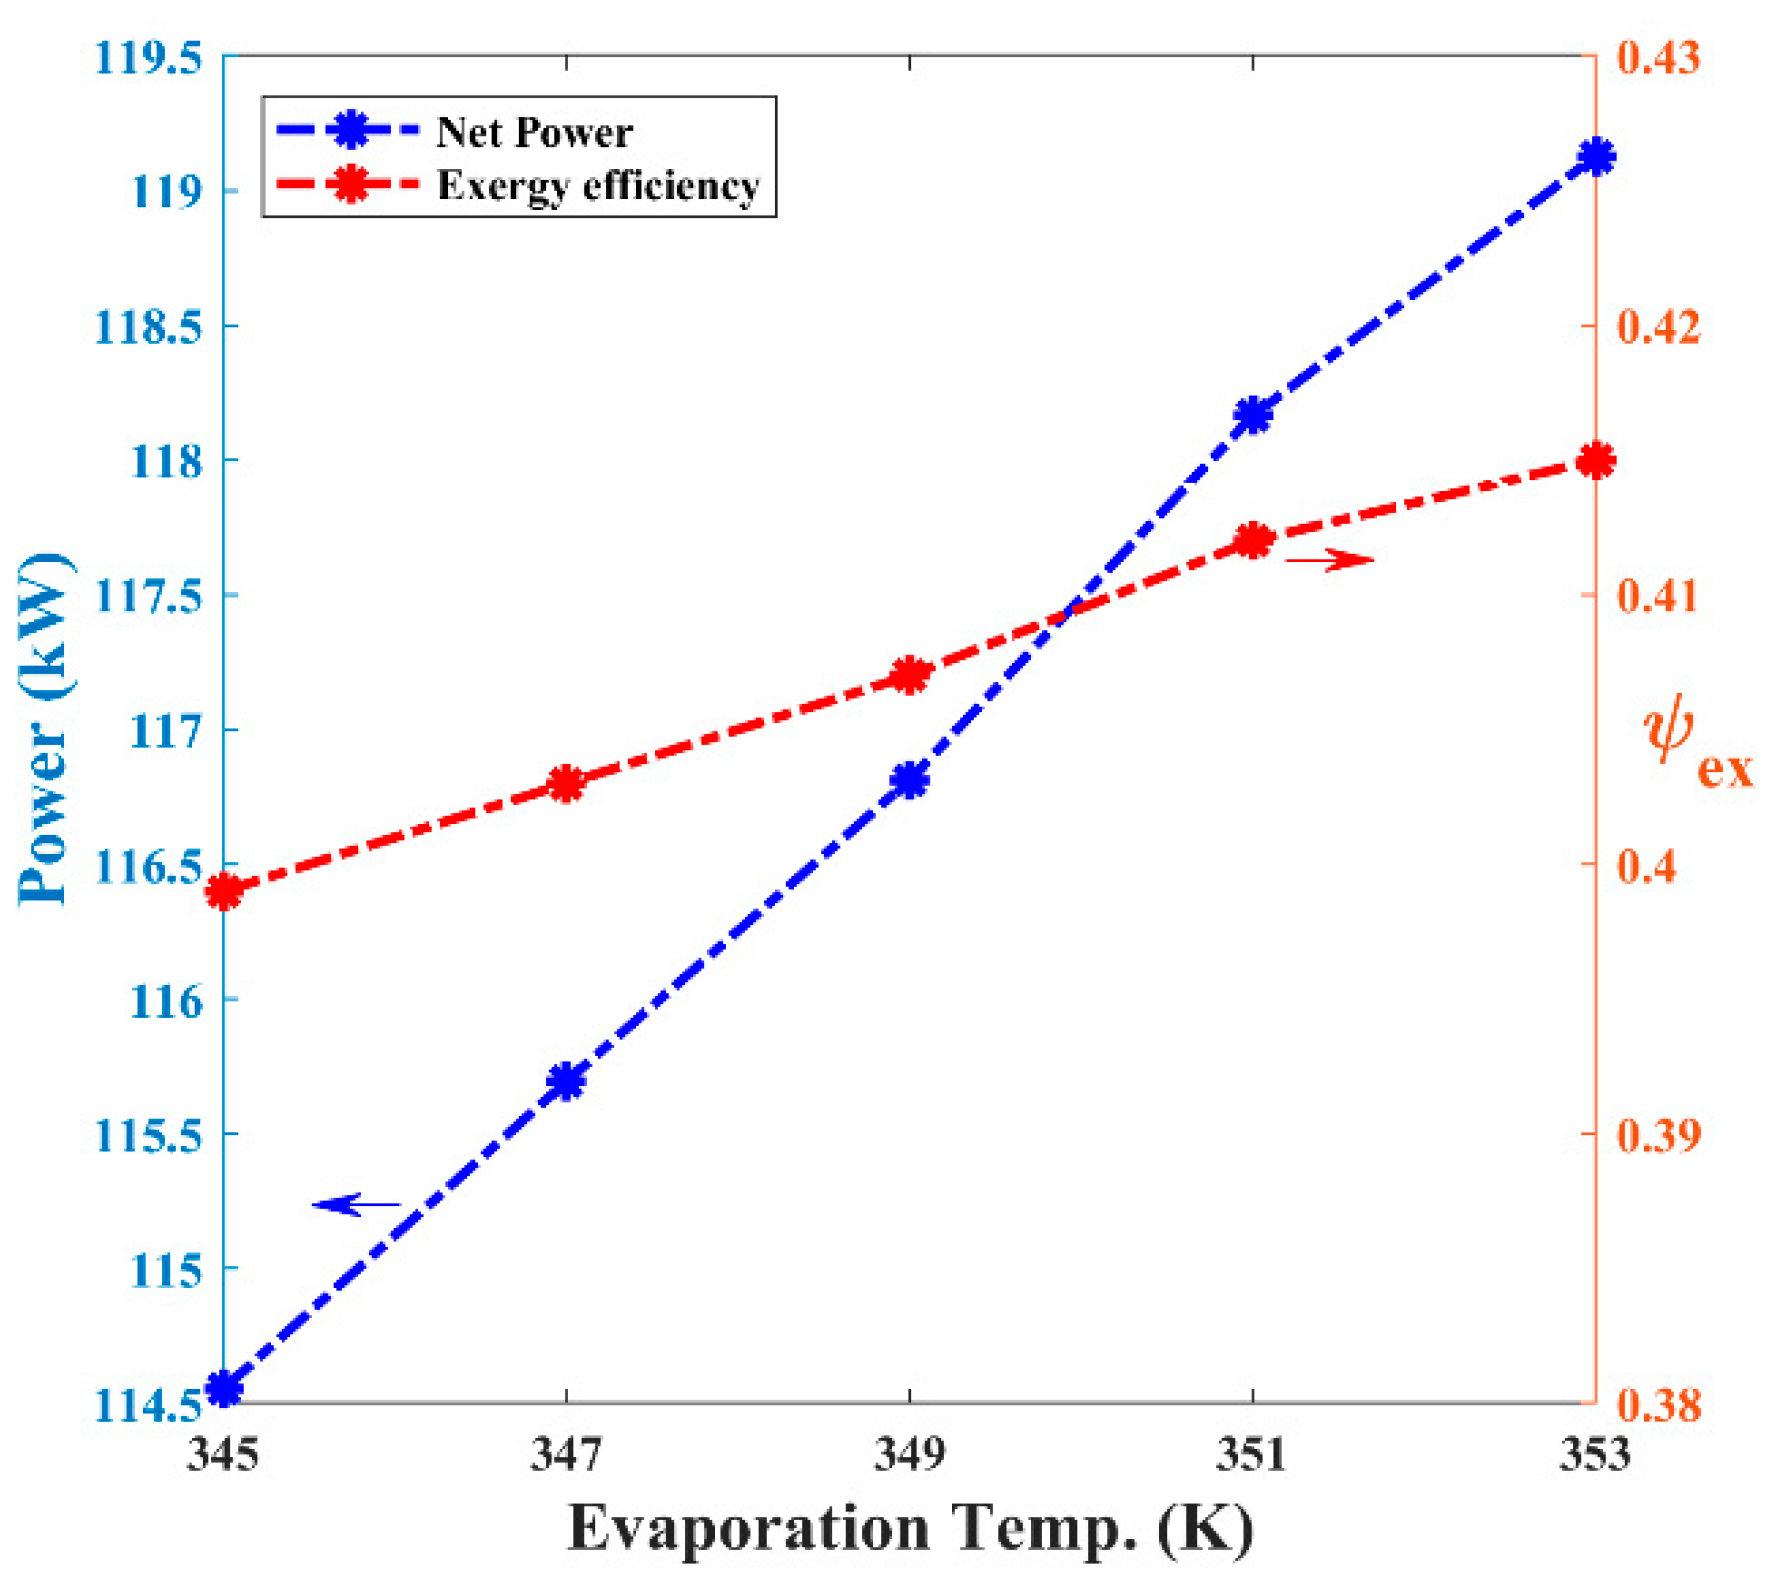
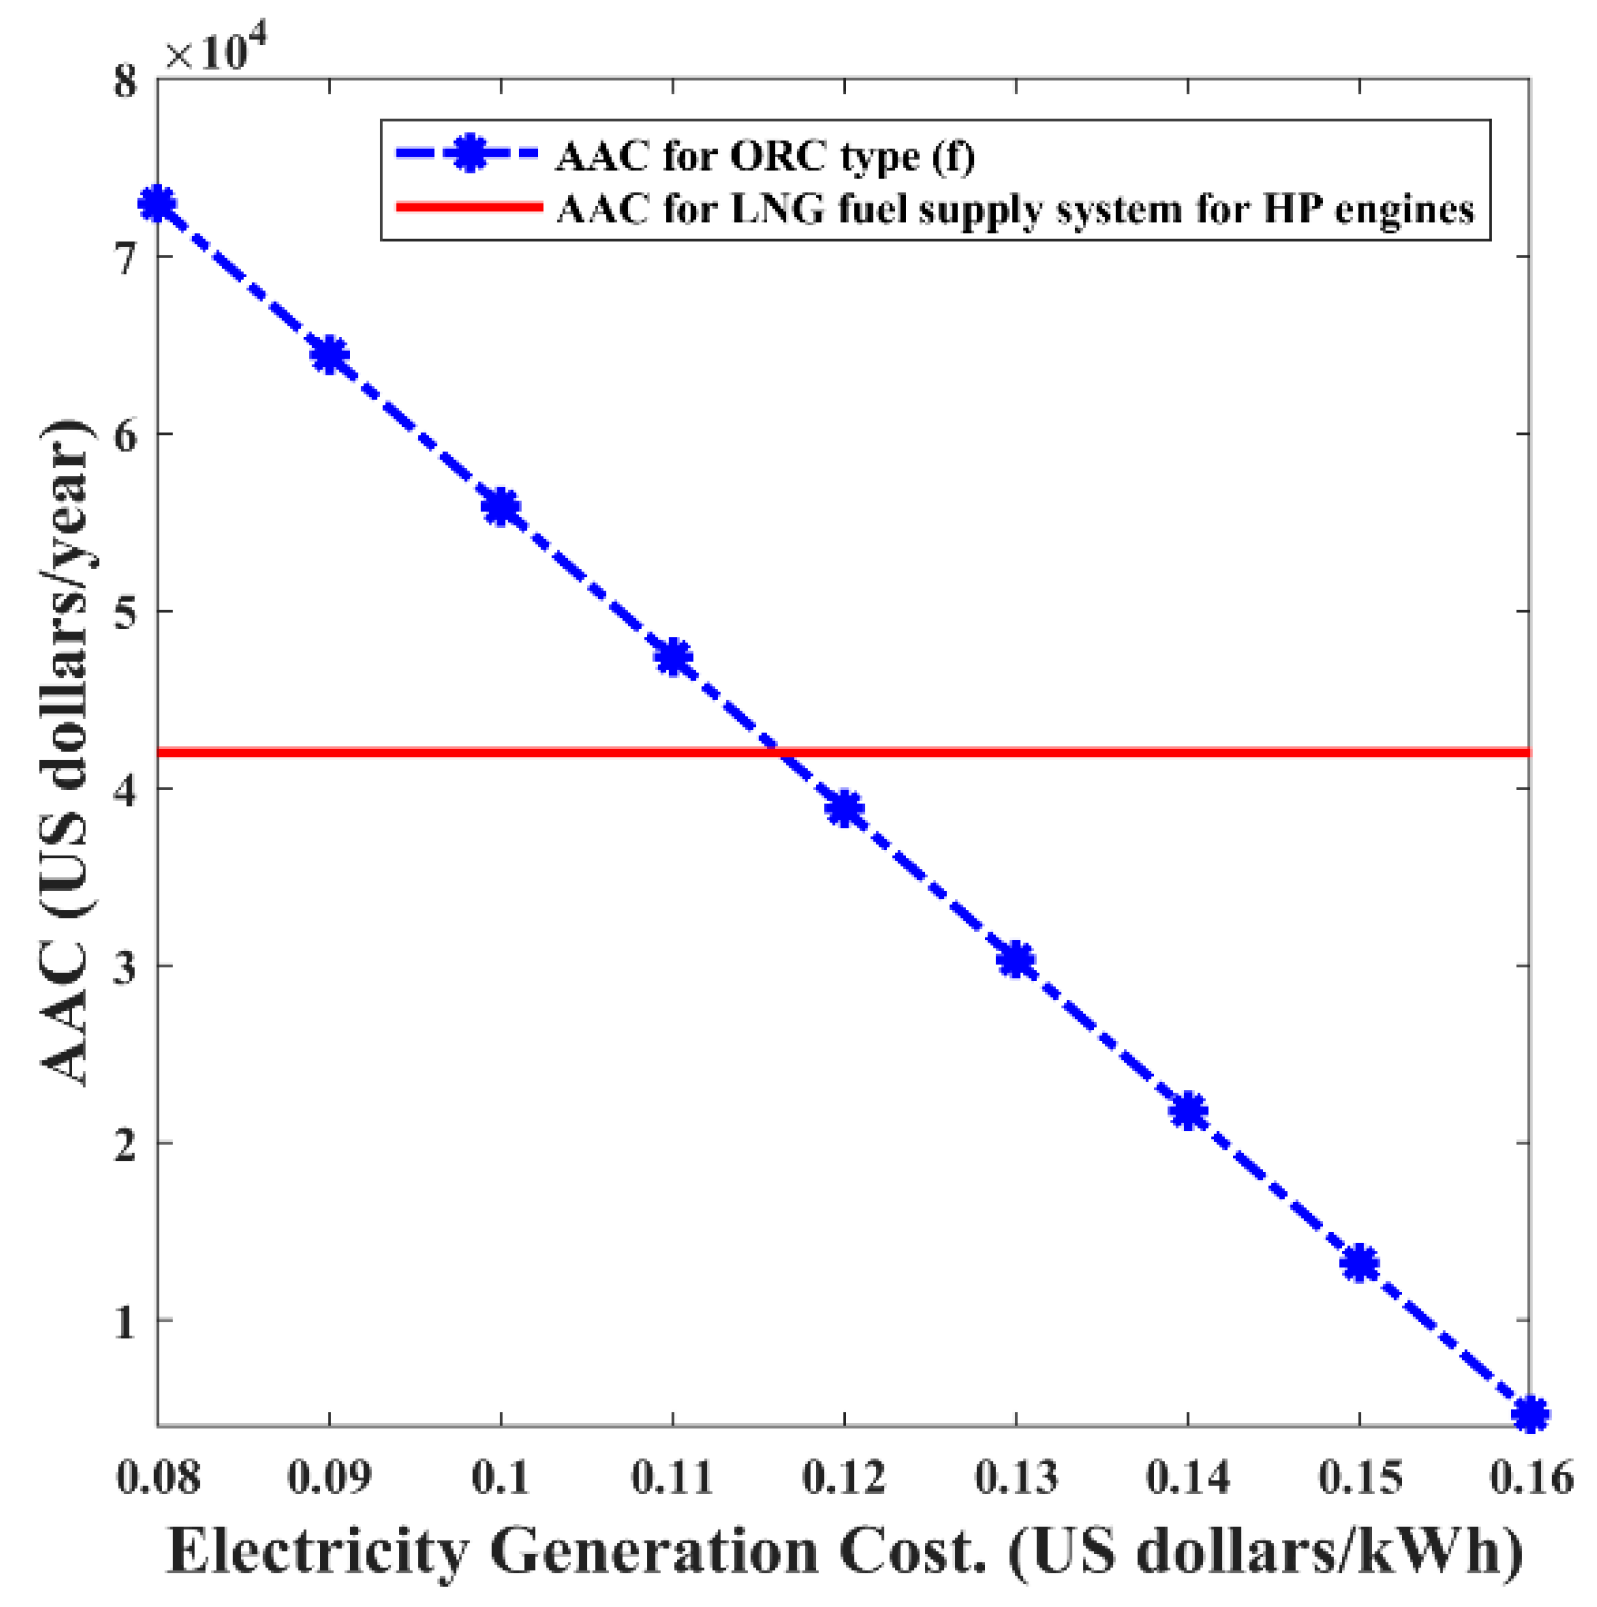
3.3. Sensitivity Analysis

To identify the effect of uncertainties on changes in jacket water temperatures and electricity generation costs, a sensitivity analysis was performed. The ORC Type (f) system, with propane as the WF, was used for the sensitivity analysis.

3.3.1. Changes in Evaporation Temperatures

To verify the effect of changes in evaporation temperatures on the performance of the ORC system, a sensitivity analysis was performed, the results of which are summarized in Figure 9. As shown in Figure 8, the exergy efficiency and the net power output increase as the evaporation temperature increases. When the evaporation temperature is 345 K, the net power output and the exergy efficiency are 114.6 kW and 39.9%, respectively, and when the evaporation temperature is 353 K, the net power output and the exergy efficiency are 119.1 kW and 41.5%, respectively. The net power output increases about 1%, and the exergy efficiency increases about 0.4% as the evaporation temperature increases by 2 K. Thus, in the viewpoint of performance, Type (c) and (f), which use engine jacket water instead of seawater, are much better than other cases because of higher engine jacket water temperatures than seawater temperatures. In addition, in terms of robustness, type (c) and (f) are much better than other cases because the temperature of engine jacket water remains constant under normal operating conditions while the temperature of seawater can change.

3.3.2. Changes in Electricity Generation Costs

Electricity generation costs can vary depending on fuel types, fuel prices, size of generators and etc. To verify the effect of changes in electricity generation costs on AAC of ORC Type (f), a sensitivity analysis was performed, the results of which are summarized in Figure 9. As shown in Figure 9, the highest AAC is 72,943 US dollars/year when the electricity generation cost is 0.08 USD/kWh and the lowest AAC is 4,732 US dollars/year when the electricity generation cost is 0.16 USD/kWh. If the electricity generation cost is higher than about 0.117 USD/kWh, installing ORC Type (f) is more advantageous than the LNG fuel supply system for the medium-pressure dual-fuel engine.

3.4. Discussion

Important findings of other studies on LNG cold energy recovery are summarized in Table 5. As shown in Table 5, propane seems to be most appropriate working fluid for recovering LNG cold energy for an LNG-powered ship. Astolfi et al. claimed R41 is the most efficient working fluid in an LNG regasification terminal, but in this study R41 shows lower performance than propane. The mixture of tetrafluoromethane (CF4) and propane (C3H8) exhibits relatively good performance at low evaporation temperatures in the study of Liu and Guo [13], but this working fluid seems to be inappropriate for an LNG-powered ship because the required ORC system is very complex due to triple condensation levels. Some studies have shown remarkable results with propane as the working fluid for recovering LNG cold energy. However, Bao et al. used the ORC system with triple condensation levels [14], and Le et al. used two dual ORC systems in series [18].
As discussed in the introduction, processes that require large areas are not attractive for offshore applications. Therefore, the findings of this study are significant in that a typical LNG fuel supply system can be replaced by a relatively simple ORC system with economic advantages and high exergy efficiencies (especially ORC Type (f)). In addition, as Type (f) uses engine jacket water instead of using seawater, this can address disturbances caused by seawater temperature changes.
Finally, according to the results of this study, medium-pressure dual-fuel engines are more attractive for recovering LNG cold energy than high-pressure dual-fuel engines in terms of exergy efficiencies and AAC.

4. Conclusions

This paper investigated the possibility of replacing a typical LNG fuel supply system with an ORC system to recover LNG cold energy for an LNG-powered ship. Six different ORC systems were investigated with nine different working fluids, and a simple economic analysis was conducted to verify the economic feasibility of the proposed ORC systems.
As a result, ORC type (f) with propane as the working fluid showed the best exergy efficiency (40.7%), the best net power output (116.8 kW) and the lowest actual annualized cost (38,838 US dollars/year). Unlike ORC systems proposed in previous studies, the ORC type (f) with propane has a relatively simple configuration and high exergy efficiency due to high evaporation temperature. According to the sensitivity analysis, the exergy efficiency and the net power output increase slightly by approximately 1% and 0.4%, respectively, with an increase of 2 K in the evaporation temperature. In addition, if the electricity generation cost is higher than about 0.117 USD/kWh, installing ORC Type (f) is more advantageous than the typical LNG fuel supply system for the medium-pressure dual-fuel engine.
Consequently, the proposed ORC system (especially ORC Type (f)) can successfully replace a typical LNG fuel supply system. In particular, for recovering LNG cold energy, medium-pressure dual-fuel engines are more beneficial than high-pressure dual-fuel engines due to additional reversible work.
The results of this study provide a novel solution for recovering LNG cold energy for an LNG-powered ship. However, the economic estimation model used in this study is simple and based on the onshore application. In addition, there is a potential problem of natural gas losses in the entire LNG supply chain that can accelerate global warming. Therefore, based on the results of this study, the research can be improved by using a techno-economic analysis or a life-cycle cost analysis to obtain more realistic economic estimation results.

Author Contributions

Conceptualization, J.K., S.-R.O., Y.-U.C. and K.P.; Methodology, J.K. and K.P.; Validation, J.K. and K.P.; Investigation, K.P.; Writing-Original Draft Preparation, J.K. and K.P..; Writing-Review & Editing, K.P.; Supervision, K.P.; Project Administration, Y.-U.C. and S.-R.O.; Funding Acquisition, J.-H.J.

Funding

This work was supported by the Korea Institute of Energy Technology Evaluation and Planning (KETEP) and the Ministry of Trade, Industry and Energy (MOTIE) of the Republic of Korea (No. 20163030031790).

Conflicts of Interest

The authors declare no conflict of interest.

Nomenclature

AACactual annualized cost
CEPCIchemical engineering plant cost index
CFOHclosed-feed organic fluid heater
ECAemission control areas
GBgigabyte
GWPglobal warming potential
IMOInternational Maritime Organization
LHVlower heating value
LNGliquefied natural gas
MITAminimum internal temperature approach
NGnatural gas
ORCorganic Rankine cycle
PCpurchase cost
PSOparticle swarm optimization
RAMrandom access memory
WFworking fluid
Symbols
ψexexergy efficiency
Exexergy potential
frwfworking fluid stream fraction ratio
h0enthalpy
hxenthalpy at 293 K
mwrmass flow rate of working fluid (kg/s)
Pexp1expander discharge pressure at WF condenser (bar)
Pexp2expander discharge pressure at CFOH (bar)
PLNGLNG pump discharge pressure (bar)
Pwfworking fluid pump discharge pressure (bar)
s0entropy
sxentropy at 293 K
SACsimplified annualized cost (US dollars)
T0temperature at 293 K
Tboilboiling temperature (K)
Tccritical temperature (K)
Tsupsuperheating temperature at WF evaporator (K)
vfvapor fraction
Vcwvolumetric flow rate of cooling water (m3/h)
Wnetnet power output (kW)
Wpumppower consumed by pumps
Wturbinepower generated by turbines

Appendix A

Table A1. Properties of working fluids [40].
Working FluidChemical FormulaTc (K)Pc (bar)Tboil (K)GWP (100-yr)
Methane
(R-50)
CH4190.646.111125
Ethane
(R-170)
C2H6305.349.1184.65.5
Ethylene
(R-1150)
C2H4282.550.61693.7
Propane
(R-1270)
C3H8369.942.5231.11.8
n-Butane
(R-600)
C4H10425382734.0
Krypton
(R-784)
Kr209.555.2119.80
R-152aC2H4F2386.545.2248.5124
R-32CH2F2351.357.8221.4675
R-41CH3F317.458.819592
Table A2. Setting parameters of the particle swarm optimization (PSO) algorithm.
ParametersValue
Number of Particles14 per decision variable
Max. Iteration150
Social-adjustment weight1.99
Self-adjustment weight0.99
Hybrid FunctionSequential Quadratic Programming
Table A3. LNG fuel supply system data used for the cost estimation.
ParametersValue
Vessel engine duty (kW)12000
LNG pump duty (kW)High-pressure engine:41.58
Medium-pressure engine:2.17
Vaporizer area (m2)High-pressure engine:7.05
Medium-pressure engine:6.51
Cooling water flow (m3/h)High-pressure engine:110.53
Medium-pressure engine:164.18

References

  1. Ancona, M.A.; Bianchi, M.; Branchini, L.; De Pascale, A.; Melino, F.; Mormile, M.; Palella, M.; Scarponi, L.B. Investigation on small-scale low pressure LNG production process. Appl. Energy 2017, 227, 672–685. [Google Scholar] [CrossRef]
  2. Kim, J.; Seo, Y.; Chang, D. Economic evaluation of a new small-scale LNG supply chain using liquid nitrogen for natural-gas liquefaction. Appl. Energy 2016, 182, 154–163. [Google Scholar] [CrossRef]
  3. Lim, W.; Choi, K.; Moon, I. Current Status and Perspectives of Liquefied Natural Gas (LNG) Plant Design. Ind. Eng. Chem. Res. 2013, 52, 3065–3088. [Google Scholar] [CrossRef]
  4. Seo, S.; Han, S.; Lee, S.; Chang, D. A pump-free boosting system and its application to liquefied natural gas supply for large ships. Energy 2016, 105, 70–79. [Google Scholar] [CrossRef]
  5. Eise Fokkema, J.; Buijs, P.; Vis, I.F.A. An investment appraisal method to compare LNG-fueled and conventional vessels. Transp. Res. Part Transp. Environ. 2017, 56, 229–240. [Google Scholar] [CrossRef]
  6. Geertsma, R.D.; Negenborn, R.R.; Visser, K.; Hopman, J.J. Design and control of hybrid power and propulsion systems for smart ships: A review of developments. Appl. Energy 2017, 194, 30–54. [Google Scholar] [CrossRef]
  7. Aspelund, A.; Gundersen, T.; Myklebust, J.; Nowak, M.P.; Tomasgard, A. An optimization-simulation model for a simple LNG process. Comput. Chem. Eng. 2010, 34, 1606–1617. [Google Scholar] [CrossRef]
  8. Wang, M.; Khalilpour, R.; Abbas, A. Thermodynamic and economic optimization of LNG mixed refrigerant processes. Energy Convers. Manag. 2014, 88, 947–961. [Google Scholar] [CrossRef]
  9. Yamamoto, T.; Furuhata, T.; Arai, N.; Mori, K. Design and testing of the Organic Rankine Cycle. Energy 2001, 26, 239–251. [Google Scholar] [CrossRef]
  10. Desai, N.B.; Bandyopadhyay, S. Process integration of organic Rankine cycle. Energy 2009, 34, 1674–1686. [Google Scholar] [CrossRef]
  11. Kajurek, J.; Rusowicz, A.; Grzebielec, A.; Bujalski, W.; Futyma, K.; Rudowicz, Z. Selection of refrigerants for a modified organic Rankine cycle. Energy 2019, 168, 1–8. [Google Scholar] [CrossRef]
  12. Astolfi, M.; Fantolini, A.M.; Valenti, G.; De Rinaldis, S.; Inglese, L.D.; Macchi, E. Cryogenic ORC To Enhance The Efficiency Of LNG Regasification Terminals. Energy Procedia 2017, 129, 42–49. [Google Scholar] [CrossRef]
  13. Liu, Y.; Guo, K. A novel cryogenic power cycle for LNG cold energy recovery. Energy 2011, 36, 2828–2833. [Google Scholar] [CrossRef]
  14. Bao, J.; Lin, Y.; Zhang, R.; Zhang, N.; He, G. Effects of stage number of condensing process on the power generation systems for LNG cold energy recovery. Appl. Therm. Eng. 2017, 126, 566–582. [Google Scholar] [CrossRef]
  15. Bao, J.; Zhang, R.; Lin, Y.; Zhang, N.; Zhang, X.; He, G. Simultaneous optimization of system structure and working fluid for the three-stage condensation Rankine cycle utilizing LNG cold energy. Appl. Therm. Eng. 2018, 140, 120–130. [Google Scholar] [CrossRef]
  16. Tomków, L.; Cholewiński, M. Improvement of the LNG (liquid natural gas) regasification efficiency by utilizing the cold exergy with a coupled absorption—ORC (organic Rankine cycle). Energy 2015, 87, 645–653. [Google Scholar] [CrossRef]
  17. Lee, S. Multi-parameter optimization of cold energy recovery in cascade Rankine cycle for LNG regasification using genetic algorithm. Energy 2017, 118, 776–782. [Google Scholar] [CrossRef]
  18. Le, S.; Lee, J.-Y.; Chen, C.-L. Waste cold energy recovery from liquefied natural gas (LNG) regasification including pressure and thermal energy. Energy 2018, 152, 770–787. [Google Scholar] [CrossRef]
  19. LNG Fuel Gas Systems. Available online: https://marine.man-es.com/technology/marine-fuel-gas-systems/lng-fuel-gas-systems (accessed on 6 May 2019).
  20. Wärtsilä LNGPac—Fuel Gas Supply System. Available online: https://www.wartsila.com/products/marine-oil-gas/gas-solutions/lng-solutions/wartsila-lngpac (accessed on 6 May 2019).
  21. Rochyana, M.F.; Jinca, M.Y.; Siahaya, J. MDO and LNG as Fuels (Duel Fuel) to Support Sustainable Maritime Transport (A Case Study in KM. Ciremai). Int. Refereed J. Eng. Sci. 2014, 3, 32–38. [Google Scholar]
  22. Wang, E.; Zhang, H.; Fan, B.; Wu, Y. Optimized performances comparison of organic Rankine cycles for low grade waste heat recovery. J. Mech. Sci. Technol. 2012, 26, 2301–2312. [Google Scholar] [CrossRef]
  23. MAN Energy Solutions. Available online: https://marine.man-es.com/applications/projectguides/2stroke/content/epub/S50ME-C8_2-GI.pdf (accessed on 6 May 2019).
  24. The Motor Ship. Available online: https://www.motorship.com/__data/assets/pdf_file/0029/619229/X-DF-engines-brochure.pdf (accessed on 8 February 2019).
  25. Park, K.; Oh, S.-R.; Won, W. Techno-economic optimization of the integration of an organic Rankine cycle into a molten carbonate fuel cell power plant. Korean J. Chem. Eng. 2019, 36, 345–355. [Google Scholar] [CrossRef]
  26. Aghahosseini, S.; Dincer, I. Comparative performance analysis of low-temperature Organic Rankine Cycle (ORC) using pure and zeotropic working fluids. Appl. Therm. Eng. 2013, 54, 35–42. [Google Scholar] [CrossRef]
  27. Wang, E.H.; Zhang, H.G.; Fan, B.Y.; Ouyang, M.G.; Zhao, Y.; Mu, Q.H. Study of working fluid selection of organic Rankine cycle (ORC) for engine waste heat recovery. Energy 2011, 36, 3406–3418. [Google Scholar] [CrossRef]
  28. Sahraei, M.H.; Ricardez-Sandoval, L.A. An Integration Framework for CO2 Capture Processes. In Materials and Process Systems for CO2 Capture: Modeling, Design, Control and Integration, 1st ed.; Papadopoulos, A.I., Seferlis, P., Eds.; John Wiley & Sons, Inc.: Hoboken, NJ, USA, 2017; pp. 523–544. [Google Scholar]
  29. Park, K.; Won, W.; Shin, D. Effects of varying the ambient temperature on the performance of a single mixed refrigerant liquefaction process. J. Nat. Gas Sci. Eng. 2016, 34, 958–968. [Google Scholar] [CrossRef]
  30. Tian, D.; Shi, Z. MPSO: Modified particle swarm optimization and its applications. Swarm Evolut. Comput. 2018, 41, 49–68. [Google Scholar] [CrossRef]
  31. Xu, G.; Yu, G. On convergence analysis of particle swarm optimization algorithm. J. Comput. Appl. Math. 2018, 333, 65–73. [Google Scholar] [CrossRef]
  32. Godio, A.; Santilano, A. On the optimization of electromagnetic geophysical data: Application of the PSO algorithm. J. Appl. Geophys. 2018, 148, 163–174. [Google Scholar] [CrossRef]
  33. Chen, Y.; Li, L.; Xiao, J.; Yang, Y.; Liang, J.; Li, T. Particle swarm optimizer with crossover operation. Eng. Appl. Artif. Intell. 2018, 70, 159–169. [Google Scholar] [CrossRef]
  34. Li, Y.; Li, Y.; Li, G.; Zhao, D.; Chen, C. Two-stage multi-objective OPF for AC/DC grids with VSC-HVDC: Incorporating decisions analysis into optimization process. Energy 2018, 147, 286–296. [Google Scholar] [CrossRef]
  35. Li, Y.; Wang, J.; Zhao, D.; Li, G.; Chen, C. A two-stage approach for combined heat and power economic emission dispatch: Combining multi-objective optimization with integrated decision making. Energy 2018, 162, 237–254. [Google Scholar] [CrossRef]
  36. Douglas, J.M. Conceptual Design of Chemical Processes, 1st ed.; McGraw-Hill, Inc.: New York, NY, USA, 1988; pp. 37–42. [Google Scholar]
  37. Lee, U.; Jeon, J.; Han, C.; Lim, Y. Superstructure based techno-economic optimization of the organic rankine cycle using LNG cryogenic energy. Energy 2017, 137, 83–94. [Google Scholar] [CrossRef]
  38. Saito, N. The Economic Analysis of Commercial Ships with Hydrogen Fuel Cell through Case Studies. Master’s Thesis, World Maritime University, Malmö, Sweden, 2018. [Google Scholar]
  39. Boveri, A.; Silvestro, F.; Gualeni, P. Ship electrical load analysis and power generation optimization to reduce operational costs. In Proceedings of the 2016 International Conference on Electrical Systems for Aircraft, Railway, Ship Propulsion and Road Vehicles & International Transportation Electrification Conference, Toulouse, France, 2–4 November 2016; IEEE: New York, NY, USA; pp. 1–6. [Google Scholar]
  40. Linstrom, P. NIST Chemistry WebBook, NIST Standard Reference Database 69; Stanford Library: Stanford, CA, USA, 1997. [Google Scholar]
Figure 1. Schematics of (a) a typical liquefied natural gas (LNG) fuel supply unit, and (b) an LNG fuel supply unit using engine jacket water.
Energies 12 01933 g001
Figure 2. Organic Rankine cycle (ORC) systems for the high-pressure dual fuel engine system [Type (a), (b), and (c)] and ORC systems for the medium-pressure dual fuel engine system [Type (d), (e), and (f)]. Diamond symbols identify stream segments of fluids.
Energies 12 01933 g002
Figure 3. Convergence curve for Type (f) when the working fluid is propane. (Convergence time = 146.1 min).
Energies 12 01933 g003
Figure 4. Optimized objective function values (left) and the net power output (right).
Energies 12 01933 g004
Figure 5. Temperature-entropy diagram for Types (e) and (f); working fluid is propane.
Energies 12 01933 g005
Figure 6. Optimization results when the working fluid is propane.
Energies 12 01933 g006
Figure 7. Temperature-entropy diagrams. (a) Type (d), (b) low-temperature condensation level in Type (e), (c) high-temperature condensation level in Type (e).
Energies 12 01933 g007
Figure 8. Results of sensitivity analysis (II).
Energies 12 01933 g008
Figure 9. Results of sensitivity analysis (II).
Energies 12 01933 g009
Table 1. Decision variables for optimization.
Decision VariablesUnitsTypesLower BoundUpper Bound
WF mass flow rate
(mwf)
kg/s(A), (B), (C)
(D), (E), (F)
0.0281.67
Super heating temperature
of the WF evaporator
(Tsup)
K(A), (B), (C)
(D), (E), (F)
273443
WF pump discharge pressure
(Pwf)
bar(A), (B), (C)
(D), (E), (F)
2Critical point
WF expander discharge pressure to the WF condenser
(Pexp1)
bar(A), (B), (C)
(D), (E), (F)
1.3Critical point
WF expander discharge pressure to the CFOH
(Pexp2)
bar(B), (C)
(E), (F)
1.330
WF mass fraction to the CFOH
(frwf)
-(B), (C)
(E), (F)
00.3
LNG pump discharge pressure
(PLNG)
Bar(D), (E), (F)1780
Table 2. Configuration parameters and assumptions for simulation.
ParametersValues
Expander isentropic efficiency [14,15]0.8
Pump isentropic efficiency [14,15]0.8
Ambient temperature (K)293
Hot source temperature for the evaporator (K)298
Engine jacket water temperature (K) [23]353
Minimum approach temperature in heat exchangers (K)2
Pressure drop of heat exchangers (bar)0.2
Property packagePeng-Robinson
Inlet LNG pressure (bar)1.01325
Inlet LNG temperature (K)saturated
Inlet LNG mass flow rate (kg/s)High-pressure engine [23]0.487
Medium-pressure engine [24]0.474
LNG composition (mol. %) [7,25]N2: 0.37
C1: 95.89
C2: 2.96
C3: 0.72
nC4: 0.06
NG send-out pressure (bar)High-pressure engine [23]299.6
Medium-pressure engine [24]16.6
NG send-out temperature (K)293
Table 3. Summary of the best decision variables for each type.
WFmwf
(kg/s)
Tsup
(K)
Pwf
(bar)
Pexp1
(bar)
Pexp2
(bar)
frwfPLNG
(bar)
Type aPropane
(R-1270)
0.4150.0009.2511.300---
Type bPropane
(R-1270)
0.4890.0209.4263.7451.3010.152-
Type cPropane
(R-1270)
0.53323.97319.1755.9821.3000.224-
Type dPropane
(R-1270)
0.6870.0089.2491.300--64.288
Type ePropane
(R-1270)
0.8200.0019.4503.7481.3010.15361.647
Type fPropane
(R-1270)
0.90123.43519.3935.7451.3000.21757.875
Table 4. Estimation results of simplified annualized cost and actual annualized cost.
TypeSimplified
Annualized Costs 1
(US dollars/year)
Produced Electricity
(kW)
Estimated Cost Saving 2
(US dollars/year)
Actual Annualized Costs
(US dollars/year)
LNG fuel supply system
(High-pressure)
52,4490052,449
ORC Type (a)
(WF = propane)
84,69124.121,11263,579
ORC Type (b)
(WF = propane)
102,65628.725,14177,515
ORC Type (c)
(WF = propane)
108,26744.438,89469,373
LNG fuel supply system
(Medium-pressure)
42,0080042,008
ORC Type (d)
(WF = propane)
111,59782.472,18239,415
ORC Type (e)
(WF = propane)
132,24490.279,01553,229
ORC Type (f)
(WF = propane)
141,154116.8102,31638,838
1 A lifetime of an ORC system is assumed to be 25 years [37].
2 7300 operation hours/year [38] and 0.12 USD/kWh of electricity generation cost [39] are assumed.
Table 5. Summary of important findings of other studies.
ReferencesWorking FluidExergy Efficiency
(%)
Evaporation Temperature
(K)
Net Power Output
(kW)
This studyPropane40.7353116.8
246.4 3
[12]R41N/A276–3033250–3413 1
[13]CF4 + C3
(mixture)
23.5293206.42 3
[14]PropaneN/A2843134–8598
104.5–286.6 3
[16]Ethane + Krypton
(mixture)
3.32779200
57.5 3
[17]Ethane + Propane
(cascade)
11.1 228896.1 3
[18]Propane263032153
1 Total power output of ORC systems.
2 Thermal efficiency.
3 Based on 1 kg/s mass flow rate of LNG.

