Article

Optimal Operation of Building Microgrids with Rooftop Greenhouse Under Component Outages in Islanded Mode

1
Department of Electrical Engineering, Incheon National University, 12-1 Songdo-dong, Yeonsu-gu, Incheon 406-840, Korea
2
Research Institute for Northeast Asian Super Grid, Incheon National University, 119 Academy-ro, Yeonsu-gu, Incheon 22012, Korea
*
Author to whom correspondence should be addressed.
Energies 2019, 12(10), 1930; https://doi.org/10.3390/en12101930
Submission received: 24 April 2019 / Revised: 10 May 2019 / Accepted: 15 May 2019 / Published: 20 May 2019
(This article belongs to the Special Issue Sustainable Use of Energy in Buildings)

Abstract

:
An optimal operation scheme for a building microgrid with a rooftop greenhouse in islanded mode is proposed in this paper. In islanded mode, the fulfillment of entire demand is challenging due to the absence of connection with the utility grid and the scarcity of local resources. The situation becomes more challenging when one or more pieces of equipment fail during the islanded mode. Therefore, in addition to islanded mode operation, component outage and recovery are also considered in this paper. In order to use the available energy efficiently, prioritization of building loads and control parameters of the greenhouse are proposed. A priority weight matrix is adopted to decide the supply of energy to fulfill the requirements of control parameters in the case of insufficient energy. In addition to the normal operation bounds, new bounds are defined to operate the control parameters if the resources are not sufficient. Additional penalties are imposed if the new bounds are chosen, due to violation of the normal operation range. The microgrid system is rescheduled if any component outage or recovery is detected from the outage point to the end of the scheduling horizon. The performance of the proposed method is evaluated by carrying out several simulations including component outage, component recovery, and simultaneous outage of two or more types of equipment. Numerical simulation results have demonstrated the effectiveness of the proposed operation scheme for optimal operation of building microgrids with a rooftop greenhouse in islanded mode.

1. Introduction

Building energy management systems (BEMS) are gaining popularity due to their ability to maximize profit for building owners. This objective is achieved by BEMS through monitoring and controlling various services within the building, ensuring increased efficiency of energy usage and optimizing the utilization of the building equipment. Generally, buildings use various energy forms such as electricity, heat energy, and cooling energy. Therefore, efficient conversion technologies of devices like combined heat and power units, optimal sizing of conventional and renewable sources, and integration of new devices are important ways to improve energy efficiency and economic benefit. Various studies have been conducted on maximizing the energy efficiency, sizing and integration of equipment, and improving economic benefits as discussed in the following paragraphs.
A deterministic demand side management program as a mixed integer linear programming problem is developed in reference [1], where the impact of EV integration on operation costs in smart buildings is analyzed. A new energy management strategy for a dc distribution system in buildings is proposed by reference [2]. The authors in reference [3] have studied integrating of combined heat and power and heat pumps in buildings to improve their economic benefits, performance, flexibility, and stability. A method for generating maps indicating minimum battery and photovoltaics sizes for self-sufficient single-family houses in rural areas at the border between Germany and the Czech Republic has been proposed in reference [4]. A control strategy for the management of a polygeneration system considering fuel cells and conventional energies technologies is proposed in reference [5]. In reference [6], a distributed optimization algorithm for residential users equipped with individual controllable loads, energy storage systems, and shared renewable energy sources is proposed. A scheduling approach for the minimization of energy costs in a smart home with storage devices, power generators, and renewable sources is proposed by reference [7]. In reference [8], an AC multi-period optimal power flow model for distribution systems with energy storage system considering uncertainties in wind and solar power generation is proposed. In reference [9], a real-time strategy based on model predictive control for the energy scheduling of a grid-connected smart residential users with deferrable and non-deferrable electrical appliances is proposed.
Meanwhile, due to increases in the standard of living, a limited availability of arable land, and growth in population has resulted in the deployment of greenhouses. Smart greenhouses can provide high-quality fruits and vegetables even in the off-season by controlling indoor environmental conditions. The environmental factors of the greenhouse such as temperature, CO2 concentration, light intensity, and humidity are important factors for plant growth [10]. However, these control parameters are coupled with each other and require significant amounts of energy to maintain within acceptable bounds. Control of these factors is a difficult and challenging issue and different studies are conducted to control the environmental factors in greenhouses, as discussed below.
The authors of reference [11] conducted a study to improve the energy performance of commercial greenhouses through a dual heat screen and double glazed glass in northern European climatic conditions. The authors in reference [12] have provided solutions for photovoltaic greenhouses to coordinate solar panels and energy production by using agricultural production. The authors have also studied internal parameters (temperature, relative humidity, and solar radiation) and the optimal range of parameters for efficient plant growth. In reference [13], a PID controller was used to adjust the various environmental conditions of the greenhouse to operate within the normal range and to effectively solve the interaction between the parameters. However, the fulfillment of these control parameters requires a significant amount of energy (electrical and thermal). Manual or sub-optimal operations can result in increased operation costs and ultimately reduce the profit for the greenhouse owners. Therefore, energy management of greenhouses has been considered by various researchers, as discussed below.
The concept of energy management for closed greenhouses integrated with thermal energy storage systems is presented in reference [14]. In reference [15], the temperature of the greenhouse is controlled by heating, natural ventilation, and energy conservation of the greenhouse by combining model predictive control with particle swarm optimization to solve non-linear optimization problems. In reference [16], various techniques are used for the energy management of greenhouses and their efficiencies are analyzed by using building energy simulations. In reference [17], a mathematical model for optimal operation of greenhouses is developed to minimize the operation cost of the energy generation units for a grid-connected mode. However, during emergencies, all the control parameters cannot be met due to disconnection from the utility grid. Therefore, both grid-connected and islanded modes have been considered in reference [18], where the islanded mode is more focused.
Recently, rooftop greenhouses have also been considered in various studies to enhance the self-sufficiency of cities. In the case of rooftop greenhouses, they can be deployed on the rooftops of buildings, which is otherwise a non-productive space. In reference [19], a residential building with a rooftop greenhouse is analyzed to quantify environmental impacts while considering the indoor temperatures of building households. In reference [20], a new agricultural production system considering sustainability in Mediterranean urban areas through the integration of a greenhouse on the roof of buildings is analyzed. In reference [
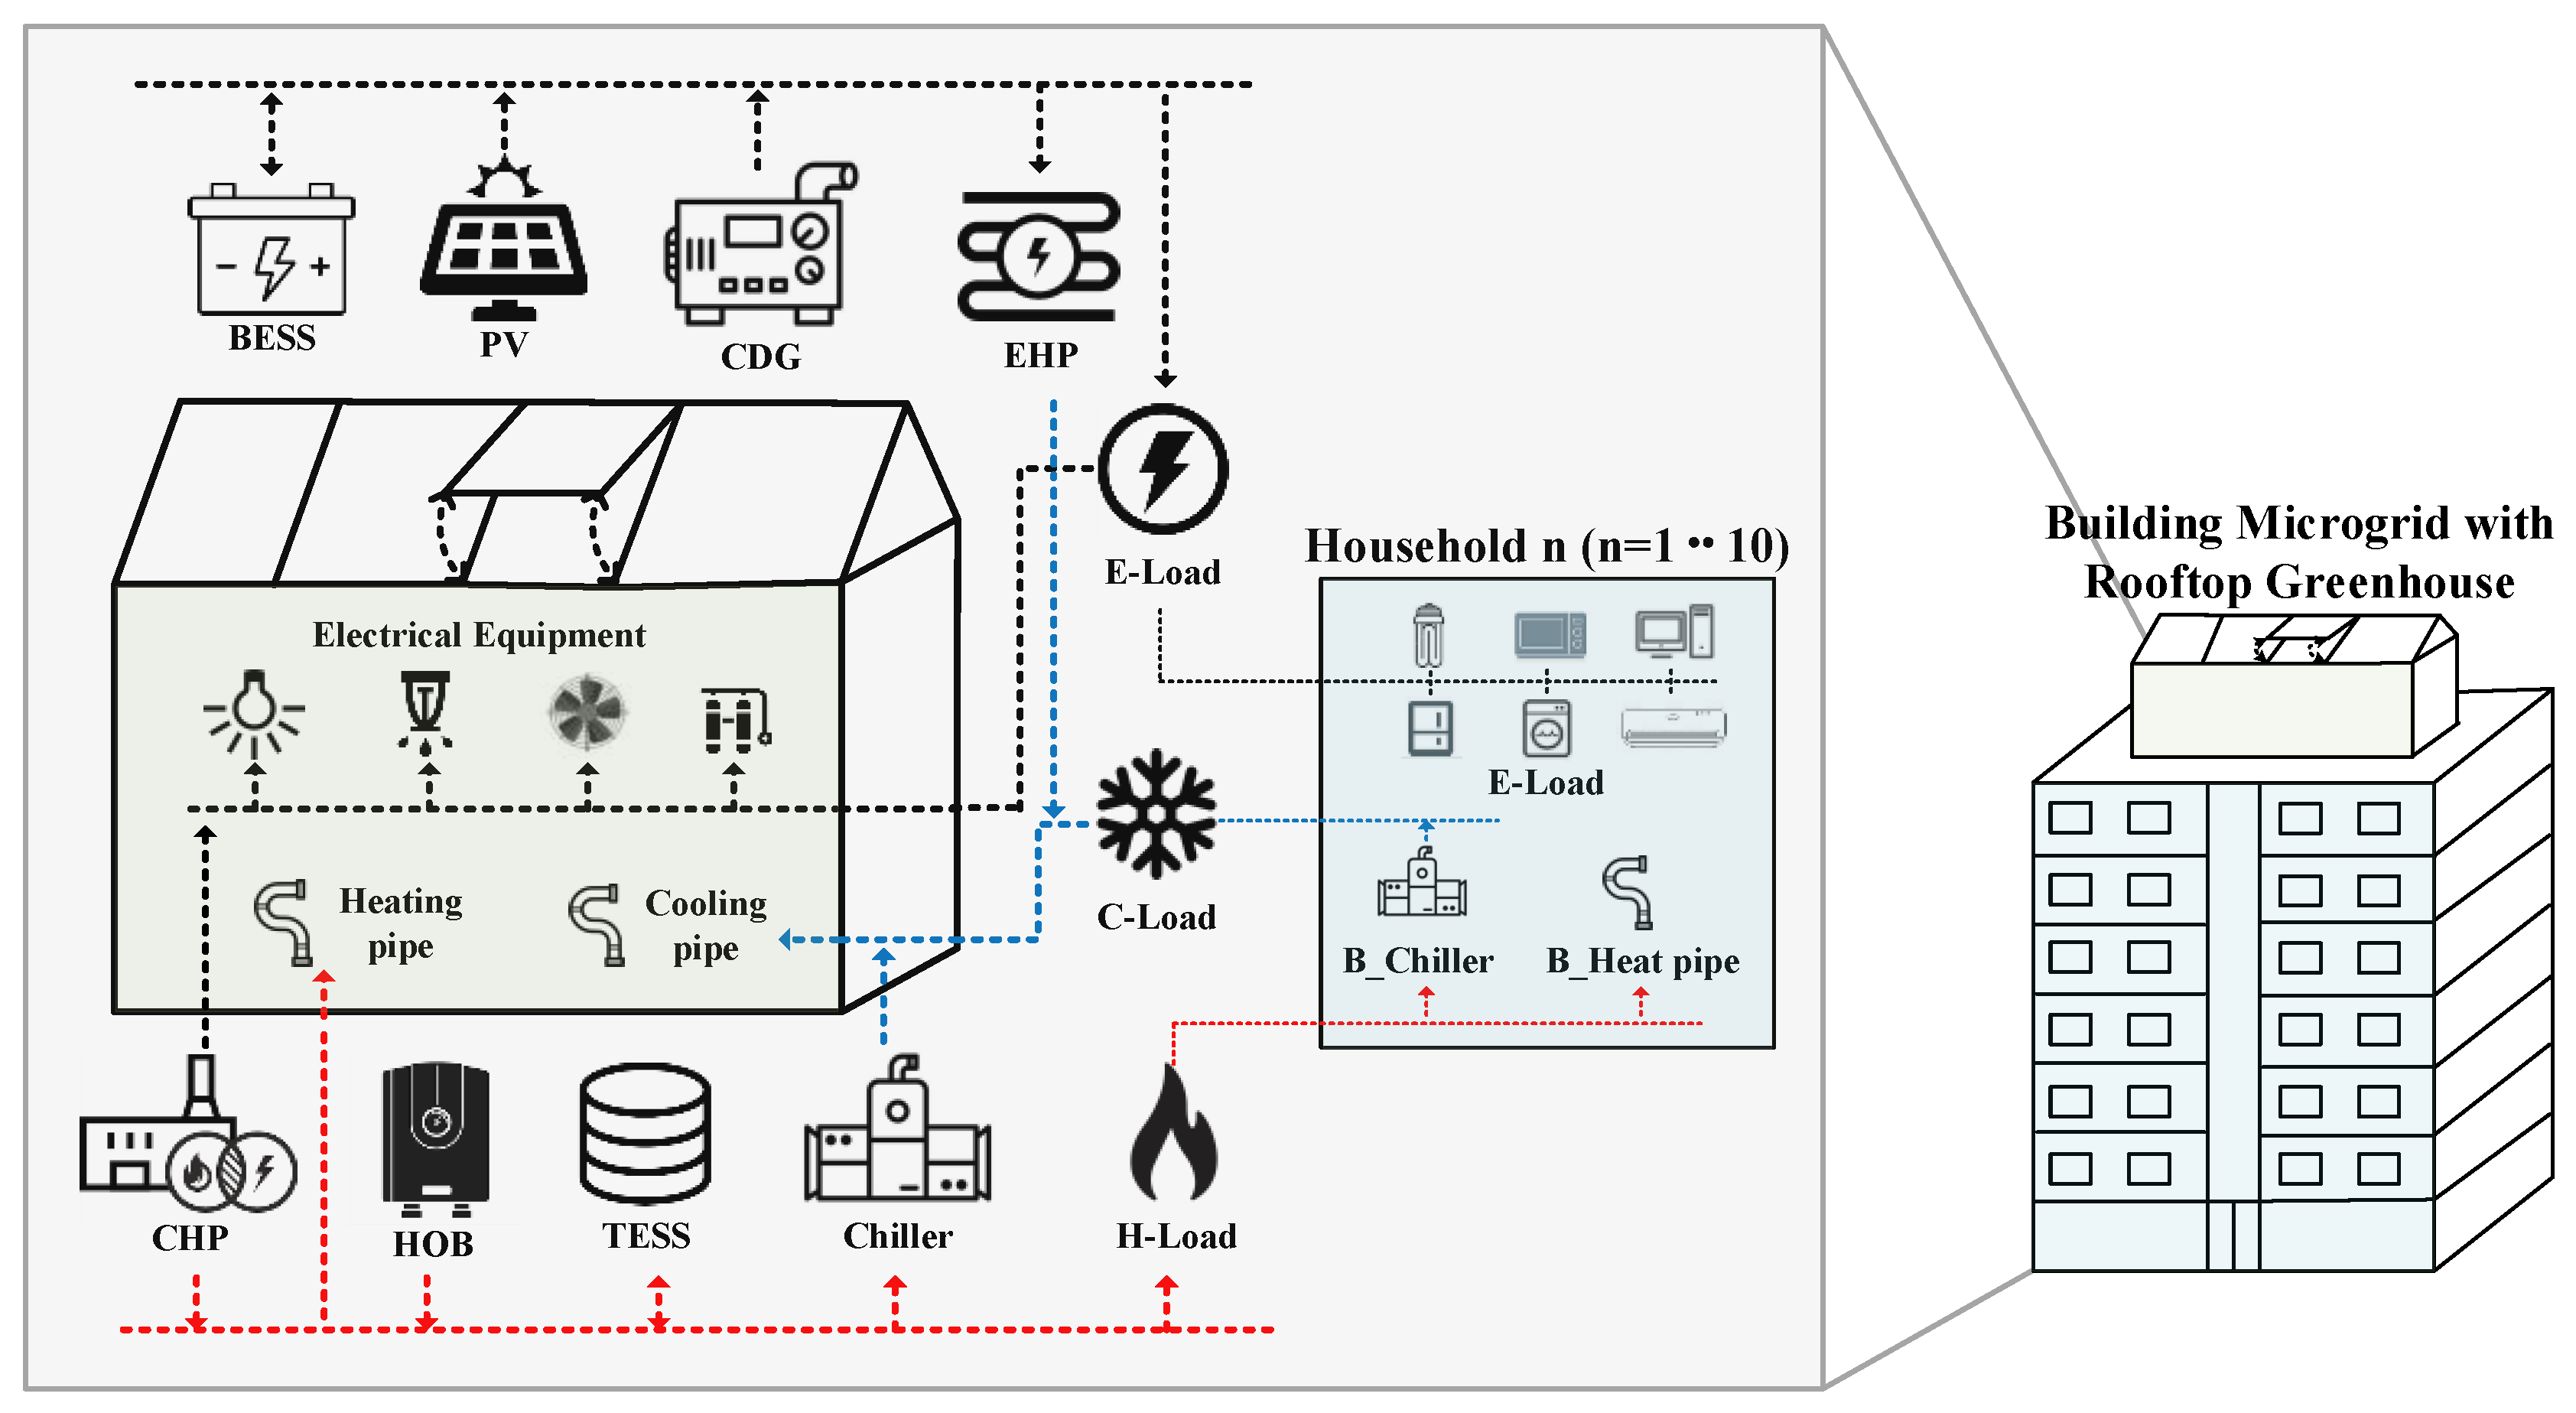
21], optimal operation of building microgrids with rooftop greenhouses is considered for a building having n households and a rooftop greenhouse.
The BEMS can be utilized to collectively control the equipment of the greenhouse and the building. This cooperative optimization can further increase the profit for building owners due to difference in energy consumption patterns of the building residents and the greenhouse. Therefore, coordinated operation of building microgrids with rooftop greenhouses has been studied. However, in reference [19], only control of indoor temperature of building and rooftop greenhouse using heat and cooling energy is considered. Similarly, indoor temperature control of building and rooftop greenhouse is studied in reference [20], where energy transfer between greenhouse and the building is considered. The amount of electricity needed to harvest crops and the potential profit from the crop is analyzed in reference [22]. In reference [23], the improvement in the crop yield and environmental benefits obtained through energy and gas exchange, water exchange, and waste energy exchange between building and rooftop are analyzed. However, the growth of plants is influenced by various other environmental factors also such as humidity, light intensity, and CO2 concentration, which are ignored in these studies. A huge amount of energy is required in building microgrids with a rooftop greenhouse to fulfil energy demands, thus an energy management system for improving crops yield and energy efficiency is required. An energy management system for building microgrids is also needed. In addition, in the islanded mode, due to the absence of connection with the utility grid, local resources may not be sufficient to fulfill the entire energy demands of the network. The situation becomes worse if any equipment failure occurs during the islanded period. Therefore, in this study, the islanded operation of building microgrid with rooftop greenhouse is studied considering optimal control environments, component outage, and component recovery.
This paper is an extension of reference [21], where only the grid-connected mode was considered. In this study, optimal operation of building microgrid with rooftop greenhouse in the islanded mode is considered. In addition, the outage and recovery of different components in the system during islanded mode are also considered. Both the building and greenhouse have electrical, thermal, and cooling energy loads. The greenhouse has additional constraints to control the indoor environmental parameters such as indoor temperature, humidity, CO
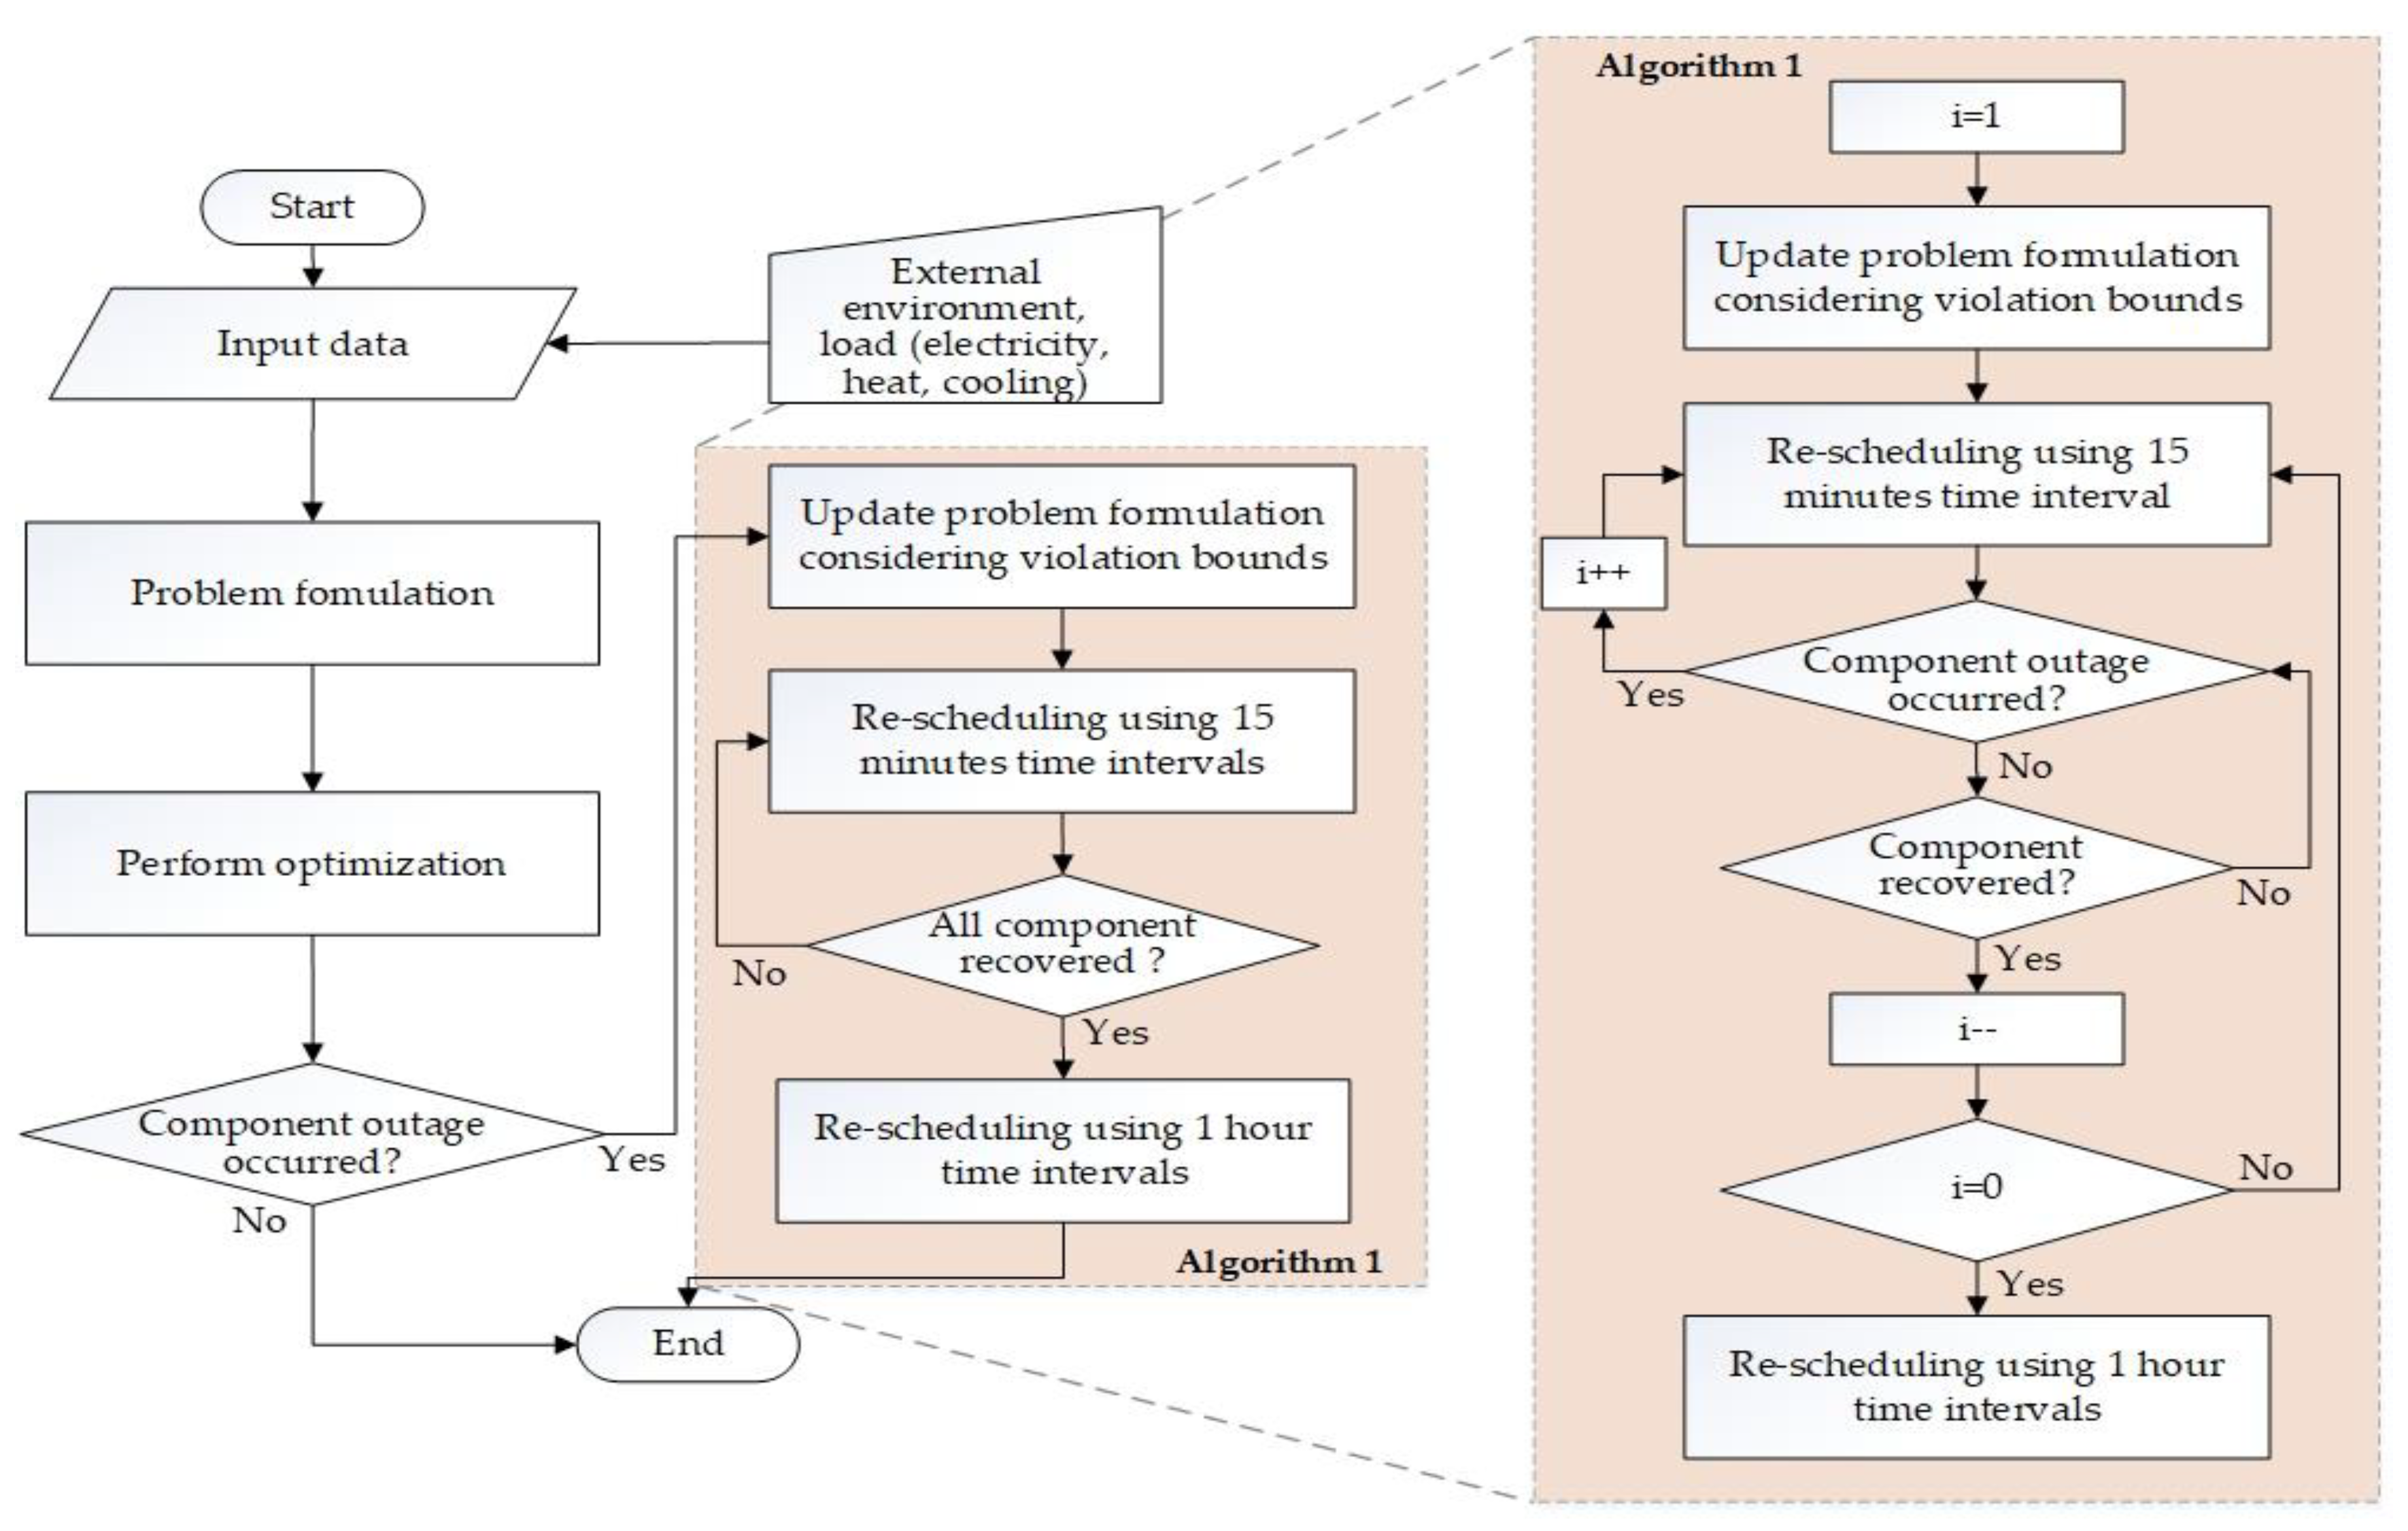
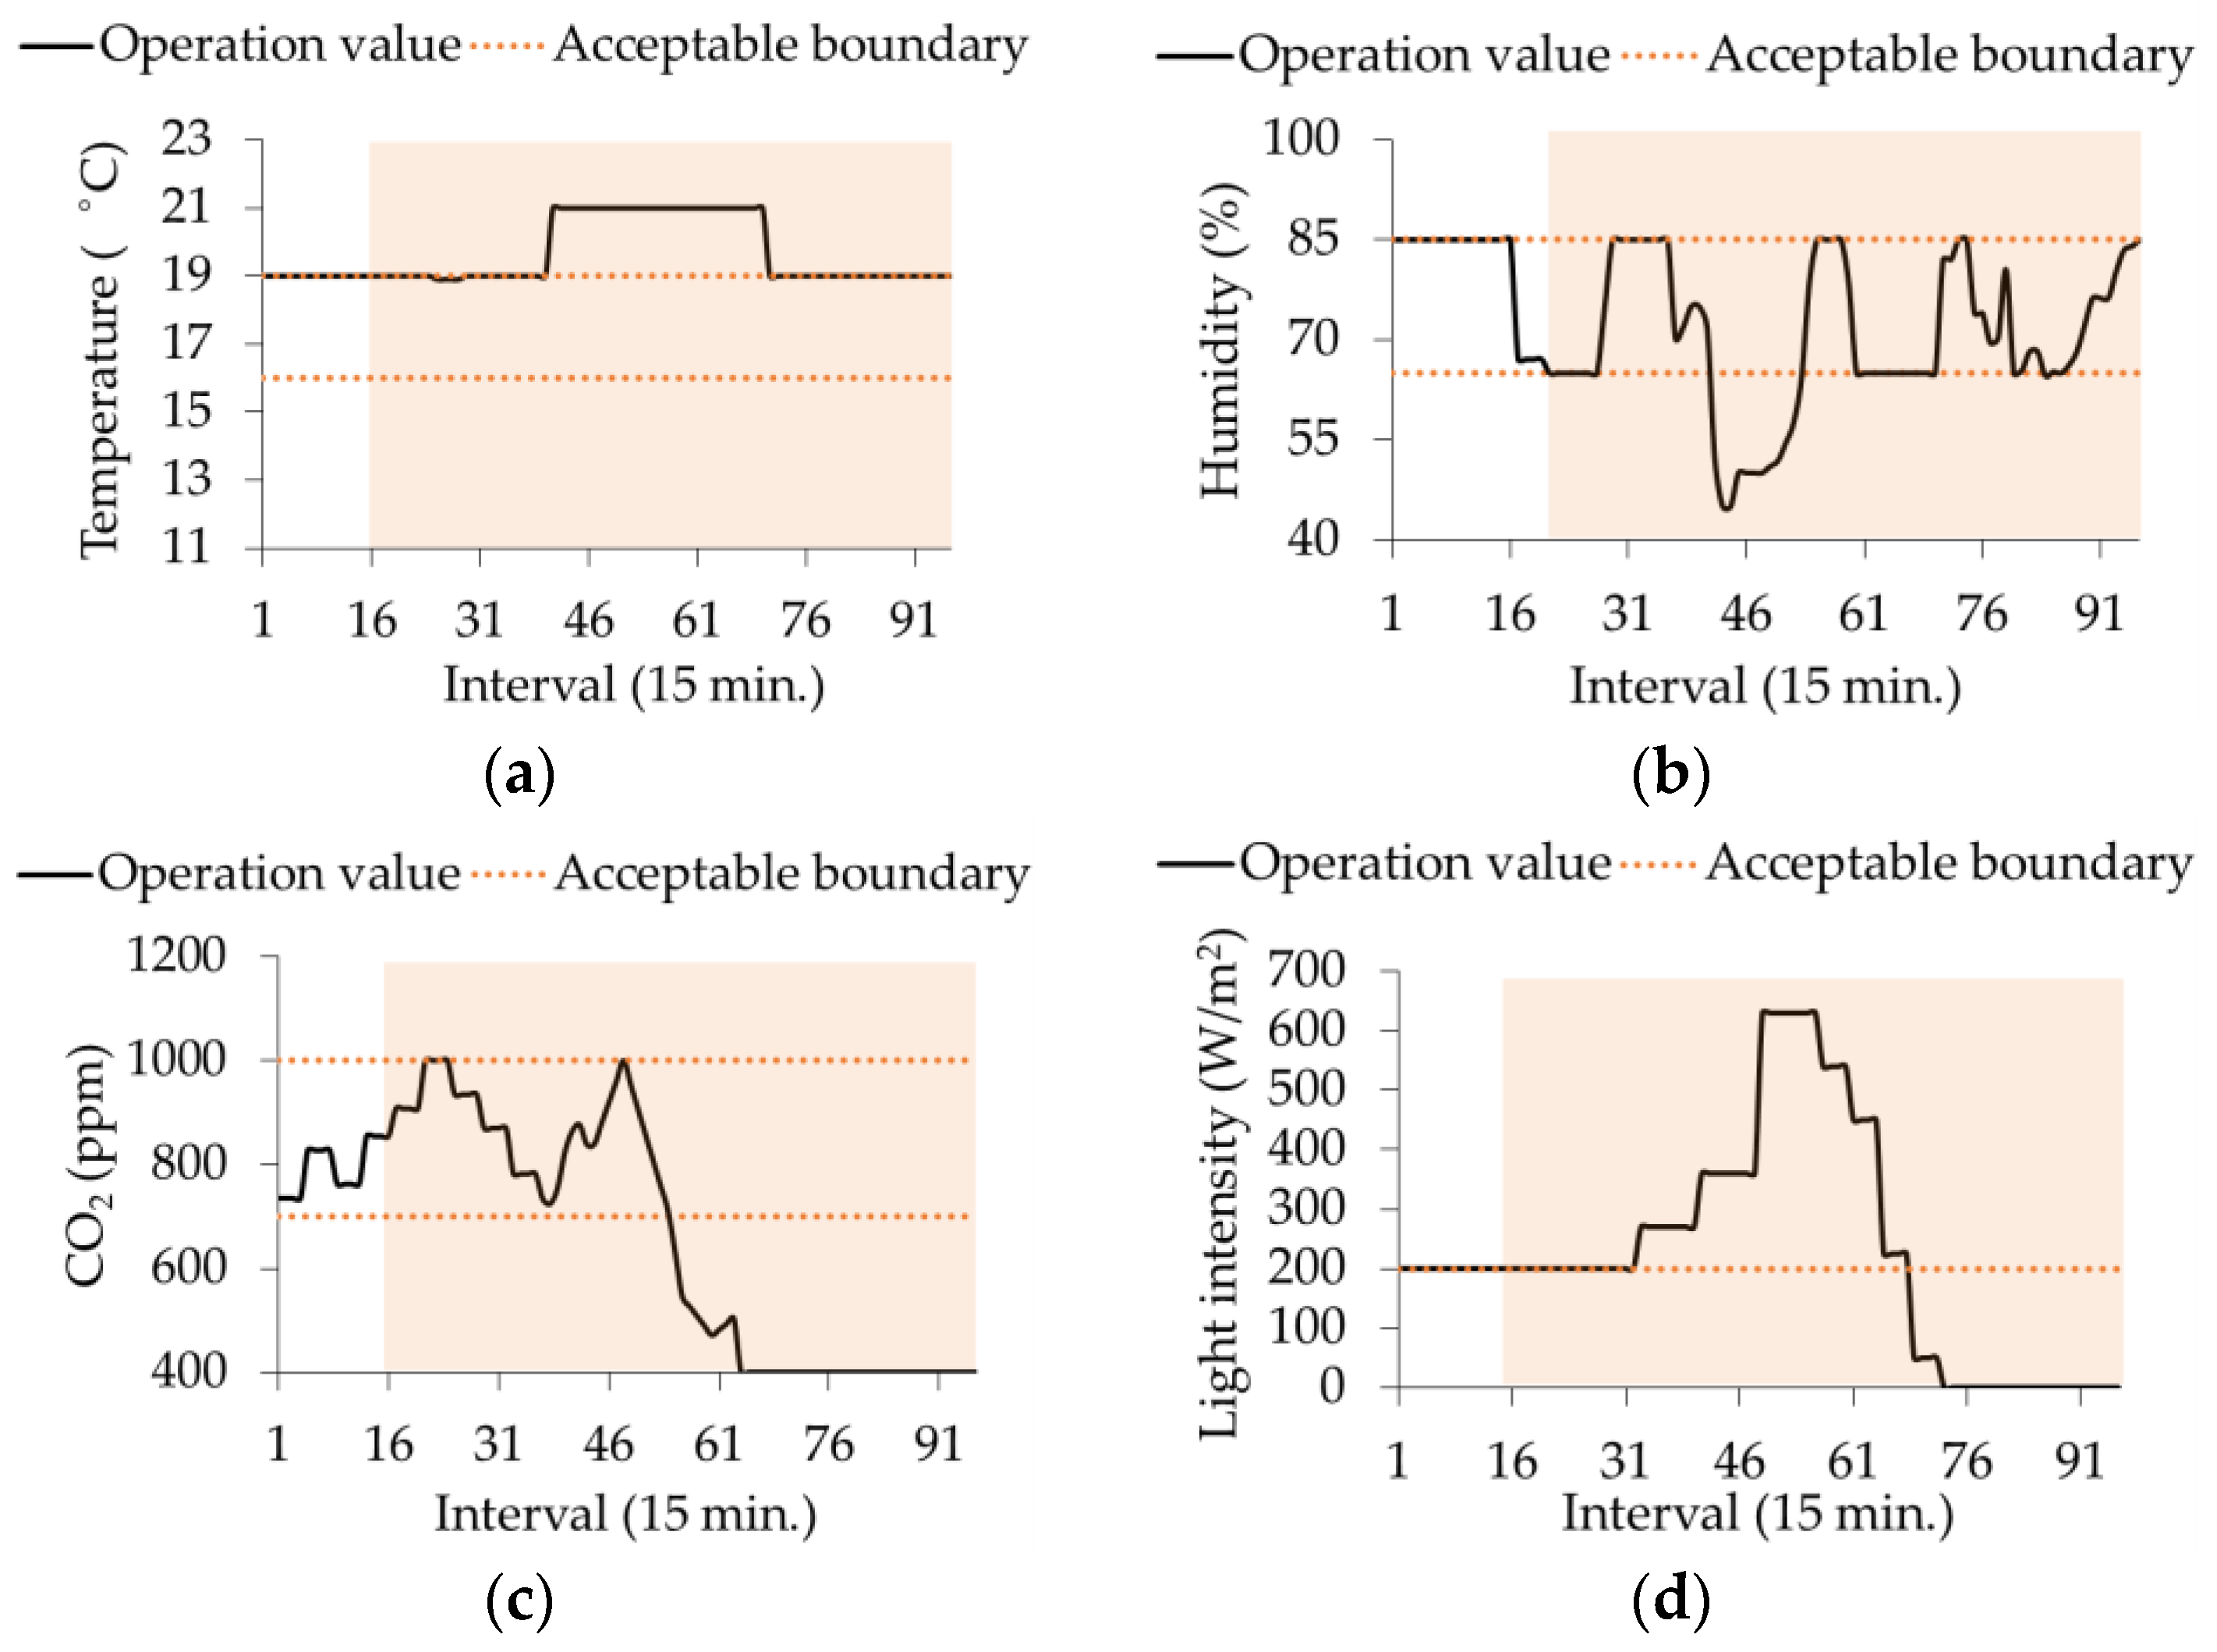
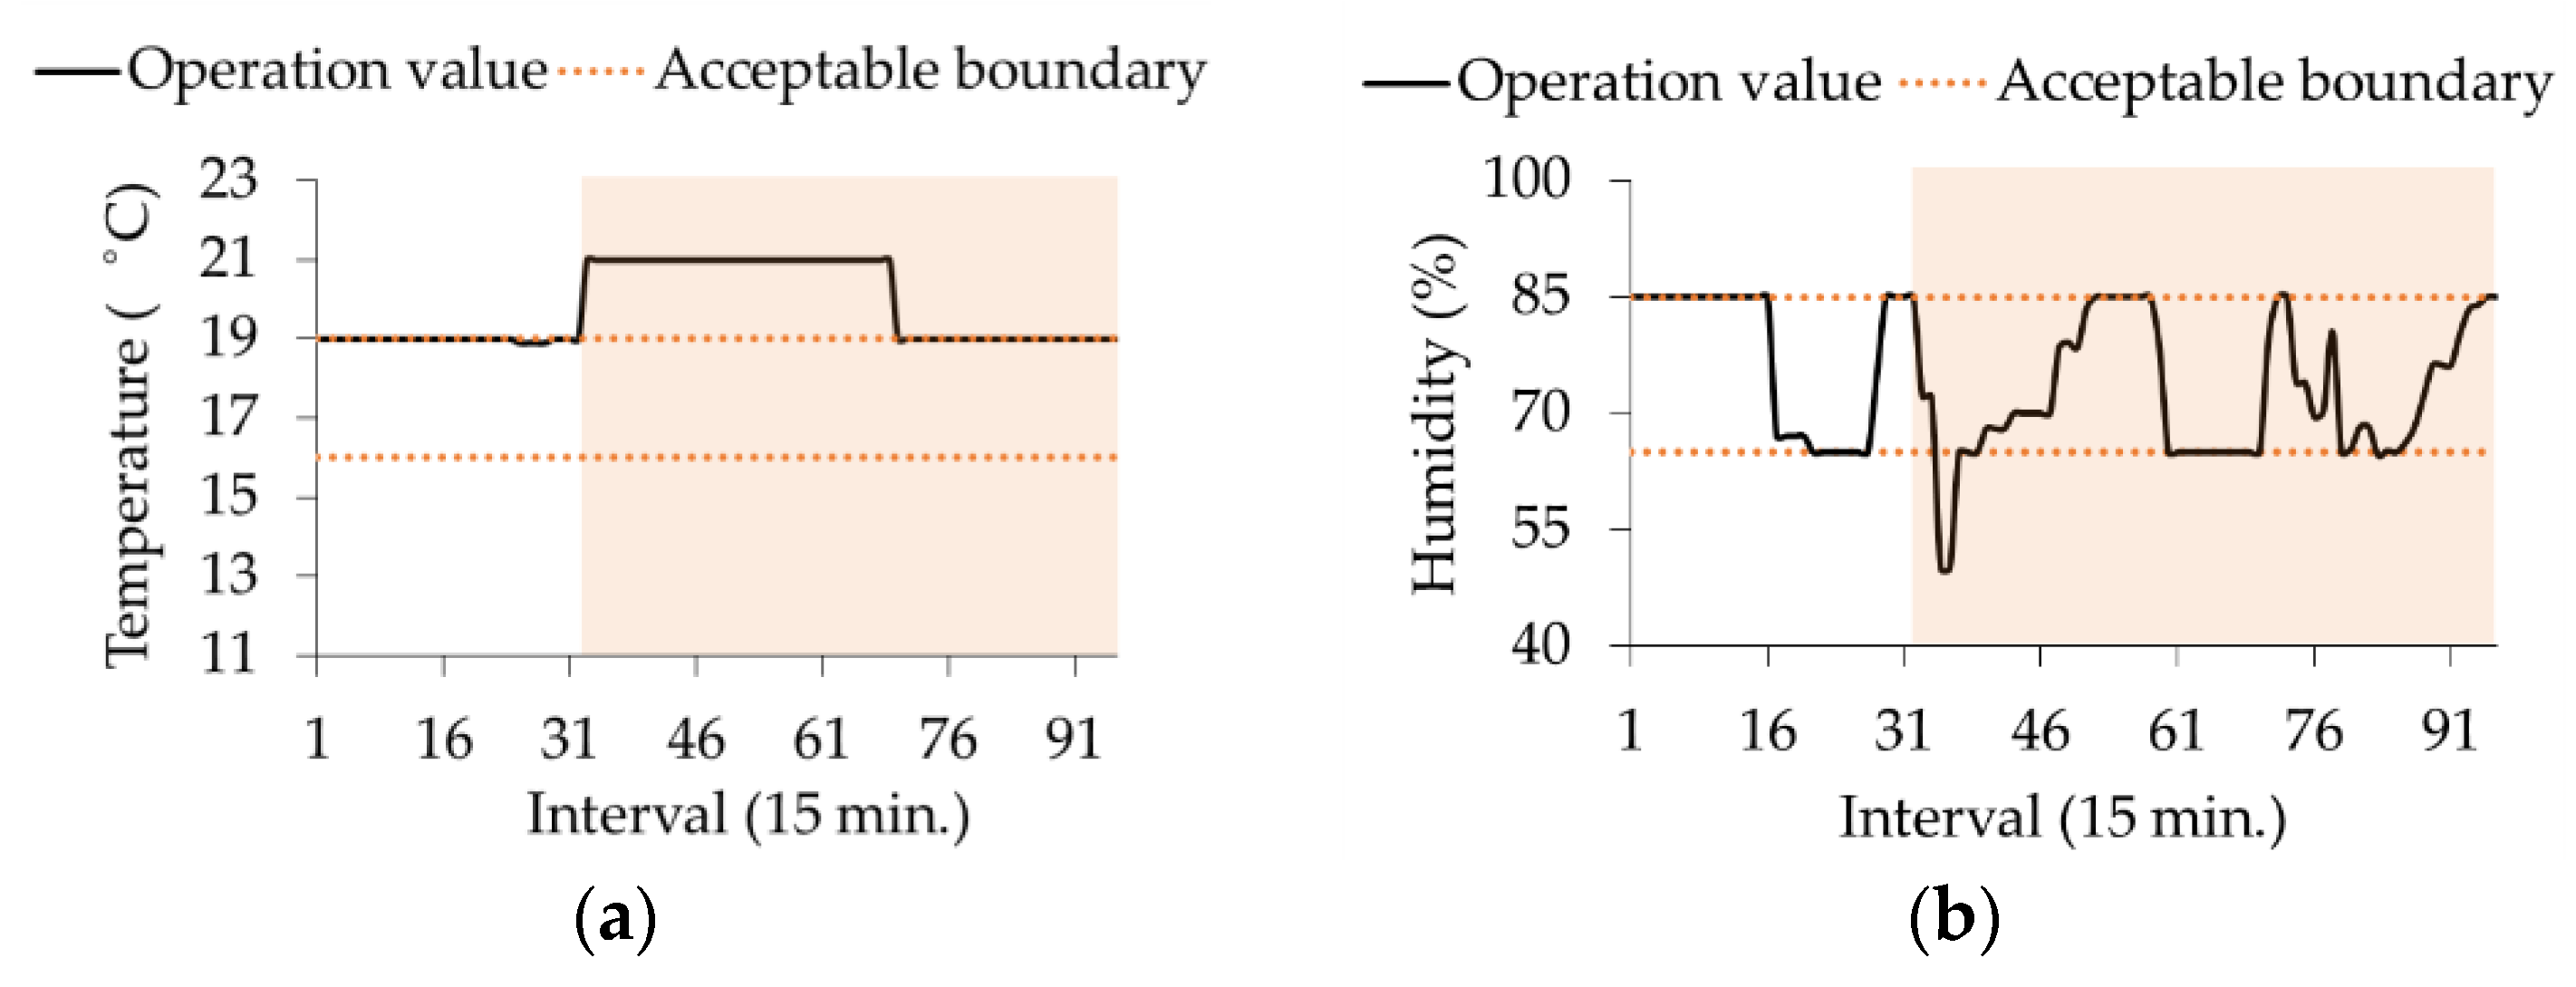
2 concentration, and light intensity. The load in the building is decomposed into critical and non-critical loads to ensure service reliability to critical loads during emergency operation of the microgrid. The normal operation bounds of control parameters in the greenhouse are relaxed to a set of additional bounds to maximize the growth of plants under resource scarcity. Different penalties are defined for violation of different bounds, i.e., higher penalties are set for higher deviations from the normal bounds. A priority weight matrix is defined to control the violation of parameters while considering the importance of each parameter to the plant growth. The performance of the proposed method is evaluated by carrying out various simulations in islanded mode. In addition to the operation of the islanded mode, the outage and recovery of CHP, EHP, and the fogging system are also considered during different intervals of the scheduling horizon. In addition, simultaneous outage of equipment is also analyzed to validate the performance of the proposed operation scheme under extreme cases of equipment outage.

2. Proposed Operation Method

2.1. Building Microgrids with Rooftop Greenhouse

The architecture of the building microgrid with rooftop greenhouse considered in this study is shown in Figure 1. The building microgrid with rooftop greenhouse can operate in both grid-connected and islanded modes. However, in this study only islanded mode is considered due to scarcity of resources during the islanded mode. The operation in islanded mode is more challenging and priority among the loads and control parameters of greenhouse is required to optimally utilize the available resources. The building microgrid with rooftop greenhouse consists of n households, a rooftop greenhouse, and energy supply equipment. The building microgrid with rooftop greenhouse contains a combined heat and power (CHP) generator, electric heat pump (EHP), heat only boiler (HOB), chiller, building chiller, photovoltaic (PV) arrays, battery energy storage system (BESS), and thermal energy storage system (TESS). In the building’s household(s), the cooling demand is supplied through air conditioner and building chiller and the heat demand is supplied through the building’s heat pipe. The electrical demand such as TV, refrigerator, and light are fulfilled through external CHP, DG, and BESS. Likewise, external equipment can supply electricity to the artificial light, fogging system, and CO2 generator of the greenhouse. CHP, HOB, and TESS can supply heat energy to the building microgrid with rooftop greenhouse and cooling energy is supplied through the chiller that uses thermal energy and EHP that uses electrical energy.
In this study, an outage of equipment in a building microgrid with rooftop greenhouse in islanded mode is considered, which contains n households and a rooftop greenhouse. When an outage of energy supply equipment occurs, environmental conditions are controlled through other replaceable equipment. However, it is difficult to control all environmental conditions within an acceptable boundary. If the use of other equipment cannot control the environmental conditions within the acceptable boundary, violation of one or more environmental conditions and household indoor temperature may be unavoidable. The violation is determined by the priority of the weight vector, which is explained in the next section. Therefore, optimal energy management of a building microgrid with rooftop greenhouse in the event of equipment outage in islanded mode is proposed.

2.2. Control Parameters

2.2.1. CO2 Concentration

CO2 concentration directly affects the photosynthesis process of plants. Therefore, CO2 concentration should be controlled between acceptable bounds for efficient photosynthesis of plants. CO2 concentration can be calculated using Equation (1). The total amount of CO2 at interval t ( C O 2 t g h ) depends on the following factors.
C O 2 t 1 i n CO2 injected at previous interval t-1
P t c o 2 Consumed power of CO2 generator
n t w s Wind speed
η n v Efficiency of greenhouse wall
u t n v State of natural ventilation
c r e s Plants respiration
θ t g h Greenhouse indoor temperature
I t t o t a l Total amount of light
C O 2 max g e n / P max c o 2 Efficiency of CO2 generator
a 1 , a 2 Coefficients for respiration rate of plants
a 3 Conversion factor from (1/s) to (1/h)
V g h Volume of the greenhouse
ρ a Density of air
C O 2 t i n = C O 2 t 1 i n + 1 ρ a V g h ( P t c o 2 C O 2 max g e n P max c o 2 A g h + ρ a n t w s η n v A n v u t n v ( C O 2 t o u t C O 2 t i n ) + c r e s A g h ( a 1 + a 2 θ t g h ) a 3 c p h o t I t t o t a l A g h ) ,   u t n v { 0 , 1 }   t T

2.2.2. Indoor Temperature

Temperature is an import factor in plant growth. If the greenhouse temperature is controlled within a certain boundary, it will greatly help the growth of the plants [24]. Temperature affects photosynthesis and therefore also affects CO2 concentration [25]. In addition, as the temperature increases, the saturated water vapor pressure increases and the humidity decreases accordingly. Therefore, indoor temperature of the greenhouse should be controlled within an appropriate boundary by using the greenhouse equipment.
The indoor temperature of the greenhouse at interval t can be calculated by Equation (2) [26]. Equation (2) shows that the indoor temperature of the greenhouse is a function of the following parameters.
θ t 1 i n Temperature at previous interval t-1
j t s r Heat absorbed from solar radiation
j t g h _ h t p Heat absorbed from heating pipe
j t g h _ c h l p Heat loss due to operation of cooling pipe
j t g h _ w a l l Heat losses through walls
j t g h _ s o i l Heat losses through soil
j t n v Heat losses through natural ventilation
j t e v Heat loss due to usage of the fogging system
j t c o 2 Heat produced due to operation of CO2 generator
j t l i Heat produced due to operation of artificial light
S H a Specific heat of air
θ t i n = θ t 1 i n + 1 ρ a S H a V g h ( j t s r + j t g h _ h t p + j t g h _ c h l p + j t g h _ w a l l + j t n v j t g h _ s o i l + j t l i + j t c o 2 j t e v ) t T

2.2.3. Humidity

Humidity is an environmental condition that is difficult to control because it changes depending on the evaporation of plants and the indoor temperature of the greenhouse. If the humidity is not controlled with a certain boundary, it causes diseases in leaves and roots and slows down the growth rate. In addition, higher humidity halts the transpiration process of plants [27,28].
The relative humidity is represented by Equation (3). The relative humidity can be estimated as the ratio of partial water vapor pressure to saturated water vapor pressure. The saturated water vapor pressure can be calculated by converting the nonlinear equation into a linear equation using the Taylor series [26]. Similarly, the water content of outside can be estimated by Equation (5). In Equation (7), the saturated water vapor pressure of outside can be computed if the outside temperature ( θ t o u t ) is known.
w t 1 i n Water content in the air at previous interval
w t o u t Outside water content
w t i n Inside water content
p t out _ p a r outside saturated water vapor pressure
R H t o u t outside relative humidity
p t out _ s a t outside saturated water vapor pressure
θ t o u t outside temperature
w max f g / P max f g efficiency of fogging system
w t r a n Transpiration of crops
η n v ratio of natural ventilation
a 4 constant for converting to percentage
a 5 , a 6 , a 7 constants for saturated water vapor pressure
a 8 constant for partial water vapor pressure
R H t g h = ( p t g h _ p a r / p t g h _ s a t ) a 4 t T
where,
p t g h _ sat = a 4 ( a 5 + ( a 6 e a 7 ( θ min + θ max ) 2 ) + a 7 ( θ t g h ( θ min + θ max ) 2 ) )   ,   p t g h _ p a r = w t i n p a t m a 8 t T
w t i n = w t 1 i n + 1 ρ a V g h ( w t r a n A g h + ρ a n t w s η n v A n v u t n v ( w t o u t w t i n ) + P t f g w max f g P max f g A g h ) , u t n v { 0 , 1 } t T
w t out = p t o u t _ p a r a 8 p a t m t T
p t out _ p a r = R H t o u t p t out _ s a t a 4 t T
p t o u t _ sat = a 4 ( a 5 + a 6 e a 7 θ t o u t ) t T

2.2.4. Light Intensity

Lighting is also an important environment condition for the optimal growth of any plant. Both artificial light and sunlight can provide light intensity. If greenhouse plants are not supplied with sufficient light intensity, they will not be capable of photosynthesis and will be damaged. Therefore, the light intensity should be maintained within a certain boundary [17].
I t t o t a l total light intensity
P t s r solar radiations
P t , i l i artificial lighting
η s r transmittance of the material
I t t o t a l = P t s r η s r + i I P t , i l i t T

2.3. Violation of Environment Conditions

Control of environmental factors is very important for the growth of plants and depends on the type of plant and on the growth period. The study in reference [29] has shown the impact of control parameters on plants growth. The impact of different control parameters on the growth of plants has been studied in reference [29] and a weight matrix of environmental factors has been developed, as shown in Equation (9). Environmental factors for tomato growth consist of the following three environmental factors: light intensity, temperature, and humidity. Temperature is the most important factor ( w 1 ), followed by light ( w 2 ) and humidity ( w 3 ). Light intensity, temperature, and humidity are strongly coupled with each other. CO2, on the other hand, has relative independence and is therefore not considered in the weight matrix and is defined independently. The requirement of CO2 is subjected to the availability of other control parameters, i.e., if humidity, light, and temperature are within the acceptable bounds, CO2 concentration can contribute to growth of the plant. Therefore, the priority of CO2 is set to the lowest. Similar calculations can be made when constructing a weight matrix for environmental element control of other plants.
When an outage of the equipment occurs in a building microgrid with rooftop greenhouse, it is difficult to adjust all four factors within acceptable bounds. Therefore, the priorities are determined through the following weight matrix, so that violation of acceptable bounds can be controlled based on the priority of different control parameters. In addition, a penalty cost is considered according to the priority of the weight matrix, and the penalty cost is imposed in case of a violation.
W = [ w 1 w 2 w 3 ]

3. Problem Formulation

In order to realize the optimization problem of the building microgrid with rooftop greenhouse, the mathematical models of building and greenhouse are formulated. Both building and greenhouse are optimized for electrical, heat, and cooling energies. In the building optimization problem, indoor temperature is controlled while in case of the greenhouse problem, and indoor temperature, humidity, light intensity, and CO2 concentration are controlled. The problem formulation process is explained in the following sections.

3.1. Objective Function

The first and second terms of the objective function (10) show generation cost of CHPs ( C i C H P ) and DGs ( C j D G ). The third and fourth terms show the operation cost of greenhouse chiller ( C C h l ) and building chiller ( C C h l _ B ). The fifth term shows the operation cost of HOB ( C H O B ). The last term shows the penalty cost of violation ( C t P e n ) of acceptable bounds of the control parameters in the greenhouse and the households. The penalty cost is comprised of a load shedding penalty and environmental conditions (humidity, temperature, light intensity, and CO2) violation penalties. The violation indication term ( V ) in the control parameters, which takes different values depending on the severity level of violation, i.e., different violation bounds are defined. Details about the violation bounds and corresponding penalties are described in detail in the Section 3.2.5.
min t T ( i I P t , i C H P C i C H P + j J P t , j D G C j D G + C O t C h l C C h l + C O t C h l _ B C C h l _ B + H t H O B C H O B + C t P e n )
where,
C t P e n = P t L o a d S h e d C p e n L o a d + V t H u m C p e n H u m + V t T e m C p e n T e m + V t L i g h t C p e n L i g h t + V t C O 2 C p e n C O 2 + n N V t B _ T e m C p e n B _ T e m

3.2. Constraints for Building Microgrid with Rooftop Greenhouse

3.2.1. Electrical Energy Balance

Electrical energy generated by CHPs ( P t , i C H P ), DGs ( P t , j D G ), PV ( P t P V ), discharged from BESS ( P t B ), and load shedding amount ( P t L o a d s h e d ) should be equal to greenhouse load ( P t G L o a d ), building load ( P t B L o a d ), usage of EHP ( P t E H P ), and charged amount to BESS ( P t B + ) at interval t as shown in Equation (11). The electric load of the greenhouse is composed of cooling and heating pipe valves ( u t g h _ c h l v , u t g h _ h t v ), capacity of cooling and heating pipe valves ( P max g h _ c h l v , P max g h _ h t v ), CO2 generator ( P t c o 2 ), fogging system ( P t f o g ), and artificial light ( P t , l l i ). The electric load of the building comprises the sum of each household appliances usage ( P t , n a c , P t , n C r i _ L o a d , P t , n N o n C r i _ L o a d ).
i I P t , i C H P + j J P t , j D G + P t P V + P t B +   P t L o a d s h e d =   P t G L o a d +   P t B L o a d +   P t E H P +   P t B + t T
where,
P t G L o a d = P max g h _ c h l v u t g h _ c h l v   + P max g h _ h t v u t g h _ h t v + P t c o 2 + P t f o g + l L P t , l l i A g h , P t B L o a d = n N ( P t , n a c + P t , n C r i _ L o a d + P t , n N o n C r i _ L o a d )
Charging and discharging of BESS are carried out considering the losses (charging ( L B + ) and discharging ( L B ), respectively) as given by (12)–(15). Similarly, u t B + and u t B indicate the state of charging and discharging, respectively. Charging and discharging cannot occur simultaneously as given by (12). The state of charge (SOC) of BESS is modeled considering the amount of energy given from the previous interval and amount of energy charged/discharged at current time interval t as shown in Equation (15).
u t B + u t B + 1   ,   u t B , u t B + { 0 , 1 } t T
0 P t B P B c a p SOC t 1 B ( 1 L B ) u t B t T
0 P t B + ( 1 L B + ) P B c a p ( 1 SOC t 1 B ) u t B + t T
S O C t B = S O C t 1 B + P t B / ( 1 L B ) + P t B + ( 1 L B + ) P B c a p t T

3.2.2. Heat Energy Balance

Heat energy generated by CHP ( H t C H P ), HOB ( H t H O B ), and taken from TESS ( H t T ) should be equal or greater than greenhouse heat load ( H t L o a d ), amount of heat used by greenhouse chiller ( H t c h l ), building chiller ( H t c h l _ B ), and stored in TESS ( H t T + ) at interval t, as shown in Equation (16). The amount of heat generated by CHP depends upon the heat to electricity ratio of CHP. Heat load is the sum of greenhouse heat load ( H t G l o a d ) and household heat load ( H t B L o a d ). CHP, chiller, and building chiller can calculate heat energy considering their electricity to heat energy efficiencies ( η C H P , η C h l , η C h l _ B ).
H t L o a d + H t c h l + H t c h l _ B + H t T + H t C H P + H t H O B + H t T t T
where,
H t L o a d = H t G l o a d + H t B L o a d
H t C H P = P t C H P η C H P ,   H t C h l = P t C h l η C h l ,   H t C h l _ B = P t C h l _ B η C h l _ B
The amount of heat stored or taken from the TESS is subjected to losses (loss per hour, L T ), as given by (17–19). The state of storage at interval t is modeled considering the amount of energy at the previous interval and amount of heat stored/taken at current interval t, as given by Equation (19).
0 H t T H T c a p S O C t 1 T ( 1 L T ) t T
0 H t T + H T c a p ( 1 S O C t 1 T ( 1 L T ) ) t T
S O C t T = S O C t 1 T ( 1 L T ) + H t T + H t T + H T c a p t T

3.2.3. Cooling Energy Balance

Cooling energy generated by EHP ( C O t E H P ), greenhouse chiller ( C O t C h l ), and building chiller ( C O t C h l _ B ) should be equal to the cooling load of the building ( C O t B L o a d ) and greenhouse ( C O t G L o a d ) as shown Equation (20). The amount of cooling energy generated by EHP ( C O t E H P ) and chillers (building ( C O t C h l _ B ) and greenhouse ( C O t C h l ), respectively) is subjected to their power to cooling conversion ratios ( η E H P _ cool , η C h l _ cool , η C h l _ B _ cool ).
C O t L o a d = C O t G L o a d + C O t B L o a d t T
where,
C O t G L o a d = C O t E H P + C O t C h l ,   C O t B L o a d = C O t C h l _ B
C O t E H P = P t E H P η E H P _ cool ,   C O t C h l = H t C h l η C h l _ cool ,   C O t C h l _ B = H t C h l _ B η C h l _ B _ cool

3.2.4. Greenhouse Constraints

The greenhouse constraints are shown in Equations (21)–(31). The environmental conditions such as indoor temperature ( θ t i n ), CO2 concentration ( C O 2 t i n ), humidity ( R H t g h ), and light intensity ( I t t o t a l ) should be controlled within acceptable boundaries. However, if environmental conditions cannot be controlled within acceptable boundaries, they can be controlled within BD1 or BD2 subjected to additional penalty costs. BD1 and BD2 imply the new operation bounds for these control parameters, where BD2 is bigger than BD1. The following equations show the indoor temperature, heating ( θ t g h _ h t p ) and cooling pipe ( θ t g h _ c h l p ), water contents, humidity, CO2 concentration, and light intensity constraints.
θ max , R H max , C O 2 max Maximum acceptable bounds of greenhouse environment parameters (temperature, humidity, and CO2
θ min , R H min , C O 2 min , I min t o t a l Minimum acceptable bounds of greenhouse environment parameters (temperature, humidity, CO2, light intensity)
θ max B D 1 , R H max B D 1 , C O 2 max B D 1 Maximum BD1 of greenhouse environment parameters (temperature, humidity, and CO2)
θ min B D 1 , R H min B D 1 , C O 2 min B D 1 , I min t o t a l _ B D 1 Minimum BD1 of greenhouse environment parameters (temperature, humidity, CO2, light intensity)
θ max B D 2 , R H max B D 2 , C O 2 max B D 2 Maximum BD2 of greenhouse environment parameters (temperature, humidity, and CO2)
θ min B D 2 , R H min B D 2 , C O 2 min B D 2 , I min t o t a l _ B D 2 Minimum BD2 of greenhouse environment parameters (temperature, humidity, CO2, light intensity)
θ max g h _ h t p , θ max g h _ c h l p Maximum bounds of heating and cooling pipe
θ min g h _ h t p , θ min g h _ c h l p Minimum bounds of heating and cooling pipe
p a t m Atmospheric pressure of air
V t T e m p , V t C O 2 , V t H u m i , V t L i g h t Violation indicators for greenhouse control parameters
θ min B D 2 θ t i n θ max B D 2 t T
{ V t T e m p = 0 , if     θ min θ t i n θ max t T V t T e m p = 1 , else   if     θ min B D 1 θ t i n < θ min ,   θ max B D 1 < θ t i n θ max B D 2 t T V t T e m p = 2 , else     θ min B D 2 θ t i n < θ min B D 1 ,   θ max B D 1 < θ t i n θ max B D 2 t T }
θ min g h _ h t p θ t g h _ h t p θ max g h _ h t p ,   θ min g h _ c h l p θ t g h _ c h l p θ max g h _ c h l p t T
w t i n R H max B D 2 a 4 P t g h _ s a t a 8 p a t m t T
w t i n R H min B D 2 a 4 P t g h _ s a t a 8 p a t m t T
R H min B D 2 R H t g h R H max B D 2 t T
{ V t H u m i = 0 ,   if       RH min RH t g h RH max t T V t H u m i = 1 ,   else   if   RH min B D 1 RH t g h < RH min ,   RH max < RH t g h RH max B D 1 t T V t H u m i = 2 ,   else   RH min B D 2 RH t g h < RH min B D 1 ,   RH max B D 1 < RH t g h RH max B D 2 t T }
C O 2 min B D 2 C O 2 t i n C O 2 max B D 2 t T
{ V t C O 2 = 0 ,   if   C O 2 min C O 2 t i n C O 2 max t T V t C O 2 = 1 ,   else   if   C O 2 min B D 1 C O 2 t i n < C O 2 min ,   C O 2 max < C O 2 t i n C O 2 max B D 1 t T V t C O 2 = 2 ,   else     C O 2 min B D 2 C O 2 t i n < C O 2 min B D 1 ,   C O 2 max B D 1 < C O 2 t i n C O 2 max B D 2 t T }
I t t o t a l I min t o t a l _ B D 2 t T
{ V t L i g h t = 0 ,   if       I min I t t o t a l t T V t L i g h t = 1 ,   else   if   I min B D 1 I t t o t a l < I min t T V t L i g h t = 2 ,   else     I min B D 2 I t t o t a l < I min B D 1 t T }

3.2.5. Household Constraints

Equations (32) and (33) show the constraints of temperature for heat pipe ( θ t , n h o _ h t p ) and indoor temperature of each household ( θ t , n i n ) in building, respectively. Different limits ( θ n r e s o u t , θ n r e s i n ) are imposed on the indoor temperature target in households considering the presence or absence of residents in the house, as shown in Equation (33).
θ min h o _ h t p θ t , n h o _ h t p θ max h o _ h t p t T , n N
{ θ n r e s o u t min θ t , n i n θ n r e s o u t max i f ,   d e p a r t t   <   a r r i v e θ n r e s i n min θ t , n i n θ n r e s i n max     e l s e t T , n N

3.2.6. Equipment Operation Constraints

The constraints for maximum and minimum operation ranges of the equipment in the building microgrid with rooftop greenhouse are given in Equations (34–42). CHPs and DGs generate electricity within their maximum and minimum ranges ( P max C H P , P max D G ), as shown in Equations (34) and (35). The upper and lower generation ranges of EHP ( P max E H P ) are shown in Equation (36). Equation (37) shows that generation limits of the HOB ( H max H O B ). Equations (38) and (39) show that operation ranges of chillers (greenhouse ( C O max C h l ) and building ( C O max C h l _ B ), respectively). The upper and lower generation ranges of the fogging system, CO2 generator, and artificial lights ( P max f g , P max c o 2 , P max l i ) are given by Equations (40)–(42).
0 P t , k C H P P max C H P t T , k K
0 P t , j D G P max D G t T , j J
0 P t E H P P max E H P t T
0 H t H O B H max H O B t T
0 C O t C h l C O max C h l t T
0 C O t C h l _ B C O max C h l _ B t T
0 P t f g P max f g t T
0 P t c o 2 P max c o 2 t T
0 P t , i l i P max l i t T , i I

3.3. Flowchart for Building Microgrids with Rooftop Greenhouse in Islanded Mode

The flow chart for building microgrids with rooftop greenhouse in islanded mode is shown in Figure 2. External environmental conditions and the forecasted values of the load are taken as inputs. Mathematical models are formulated for optimal operation, which is followed by the optimization process. When equipment outage occurs, the mathematical model is updated including the violation bounds. During the outage, rescheduling is performed for 15 min intervals from the time of outage till the end of the scheduling horizon. A variable (i) is defined to determine the number of equipment failures, the variable is increased by one for equipment outage and reduced by one for equipment recovery. Rescheduling is performed upon equipment outage and recovery from that point till the end of the scheduling horizon with 15-min resolution time. If all the outage equipment is recovered, the rescheduling is carried out using one hour time intervals. The entire process for rescheduling during component outage and recovery is described in detail in the figure below.

4. Numerical Simulation

The proposed building microgrid with rooftop greenhouse in islanded mode considering component outages is operated over a 24 h scheduling horizon with 1-h intervals and rescheduled with 15-min intervals when component outages occur. Initially, an offline day-ahead schedule is made for the microgrid and the outage/recovery of components is monitored. After detecting any component outage/recovery, the system is rescheduled from that point until the end of the scheduling horizon. In order to analyze the impact of component outages, seven cases were simulated. The first case is an islanded-mode case in which no outage occurs. Six other cases are simulated considering the outage and restoration of the equipment such as CHP, EHP, and fogging system. The outages were considered in the order of CHP, EHP, and fogging system and their recoveries were considered in the reverse order. The proposed method is formulated in a mixed integer linear programming form and it contains 84×T variables (including 5×T binary variables), 72×T bounding constraints, 10×T inequality constraints, and 25×T equality constraints. In normal operation T is taken as 24 and in emergency operation T is taken as 96. Simulations have been conducted by using CPLEX 12.7 [30] in a Visual Studio environment.

4.1. Input Parameters

Table 1 shows the parameters of energy supply facilities in the building microgrid with roof-top greenhouse. The ratio represents heat-to-power ratio for CHP and cooling to power ratio for HOB. The parameters of BESS and TESS used in this study are shown in Table 2. Charging and discharging losses are considered for BESS while interval-based losses are considered for TESS. Table 3 shows boundaries of control parameters. Each parameter is usually operated within acceptable boundary. However, in case of equipment outage, additional two boundaries are defined for each parameter to maximize the utilization of existing resources. Penalties are imposed in case of violating the normally acceptable bound. The penalties get higher if BD1 is violated and even higher for violation of BD2. The acceptable ranges of temperatures for different types of households, considering the presence or absence of residents in the house, are shown in Table 4. Table 5 shows the description and values of constants used in the problem formation section [17,18,21].
In order to analyze the performance of the proposed method, several component outage cases are simulated in this study, in islanded mode. The outage and recovery of CHP, EHP, and the fogging system are considered and their results are analyzed in the following sections.

4.2. Islanded Mode Without Component Outage

In this section, the islanded operation of microgrid is considered, without any outage of the equipment. Figure 3a shows the electrical energy balance of the system. It can be observed that CHP is mainly used to fulfill the power demand of the system due to its lower generation cost and ability to produce heat. The heat generated by the CHP is primarily used for fulfilling the heat demand of the system, as shown in Figure 3b. Excess of heat energy is stored in TESS and is used to fulfill the cooling demand of the system via chiller, as shown in Figure 3c. Chiller is mainly used to fulfill the cooling demand of the system and deficit amount is fulfilled by using EHP.
The environmental control parameters of greenhouses such as temperature, humidity, CO2, and light intensity are shown in Figure 4. It can be observed that all the control parameters are within the acceptable bounds, as defined in Table 3. Since the outside temperature is much higher, the temperature is controlled to its upper bound throughout the day.
Figure 5 shows the usage of greenhouse and building equipment such as the cooling pipe valve, fogging system, CO2 generator, and artificial light for environment control in building and greenhouse, respectively. During intervals 13–16, the cooling pipe valve is used to control the temperature in the building and greenhouse and is maximally used during intervals 13–16. The fogging system is operated to prevent water loss due to transpiration of the plant in the night interval and is used to prevent temperature violation and water loss due to evaporation. In the daytime, CO2 generator is used, which was consumed due to photosynthesis of the plant. However, in the remaining intervals, it is operated to control it within the acceptable boundary. Since the light intensity is sufficient in daytime, artificial light does not operate and it is mainly used in nighttime.
Temperature control of each household in building is shown in table 6. Different temperature boundaries are defined for each household considering the presence and absence of the residents, as shown in Table 4. The results show that the indoor temperature of all the households is within acceptable boundaries, as shown in Table 6.

4.3. CHP Outage Case

In this case, the outage of CHP unit is considered at the beginning of time interval 5 (interval 17 for 15-min resolution). Therefore, the system is rescheduled from t = 5 until the end of the scheduling horizon and the corresponding results are shown below. In this case, the time interval is reduced from 1-h to 15 min to capture the parameters’ dynamics and reschedule the system promptly after the occurrence/clearance of the component outage. It can be observed from Figure 6a that the building microgrid with rooftop greenhouse cannot use CHP and instead DG is used to fulfill the power demand of the system. Since DG cannot satisfy the electrical load in the 18–23 intervals, load shedding is carried out. Heat energy is supplied by using TESS and HOB and due to the outage of CHP, as shown in Figure 6b. Similarly, the usage of chiller is reduced due to the absence of heat energy and the cooling energy is supplied through a building chiller using the exhaust heat generated by household air conditioners (Figure 6c).
Due to the outage of CHP, the environment control parameters violate normal acceptable bound, as depicted by Figure 7. Since supply of heat energy decreases, temperature violation occurs in the 42–70 intervals. Due to increasing of temperature, humidity violated the normal bound in the 41st interval, even after using the fogging system. The violation in CO2 and light intensity occurred from interval 63 onwards due to high electric energy demand.
The violation in temperature of the households is also observed for all the building households due to the outage of the CHP unit. The results in Table 7 show that temperature violations have occurred in the households irrespective of the presence/absence of the residents in the homes. Building load is relatively lower as compared to the amount of electricity used in the greenhouse, temperature violation of building occurs before violating the bounds in greenhouse. The usage of greenhouse equipment for environmental control during CHP outage is shown in Figure 8.

4.4. EHP Outage Case

In this case, the outage of EHP is considered (in addition to outage of CHP) at the beginning of time interval 9 (interval 33 in case of 15 min resolution). It can be observed that in contrast to the previous two cases, EHP usage has reduced to zero during intervals 9–15, as shown in Figure 9. Instead of EHP, HOB is used to fulfill the heat demand of the system and is also used to fulfill the cooling demand of the system via chiller. It can be observed from Figure 7b that all the cooling demand is fulfilled via either the greenhouse chiller or the building chiller.
In terms of control parameters, more violation intervals have been observed for the temperature due to the inability to use both CHP and chiller in this case. Similarly, the violation in the humidity occurred more quickly due to a rise of temperature (Figure 10). The violations in CO2 and light are same as for the previous case; therefore, results of those parameters are not shown in this section. The violation of temperature in the households also follows a similar pattern with those of the previously therefore, the results of households are also not shown in this section.

4.5. Fogging System Outage

In this case, outage of the fogging system (in addition to outage of CHP and EHP) is considered at the beginning of time interval 15 (interval 57 in case of 15 min resolution). The system is rescheduled from interval 57 until the end of the scheduling horizon, as highlighted in the results. The power balance results are the same as the previous case (Figure 11a). However, due to outage of the fogging system, HOB utilization has increased to control the temperature of the greenhouse, as shown in Figure 11b. Similarly, in case of cooling energy balancing, building chiller is used during the last 6 intervals, as shown in Figure 11c.
Due to the outage of the fogging system, the violation in temperature has elongated as compared to the previous case (Figure 12a). Since most of the humidity control is carried out by the fogging system, a humidity violation can be observed after the outage of the fogging system in Figure 12b. CO2 and light intensity violations are same with the second case; therefore results of those parameters are not shown in this section.
The cooling pipe valve is used after the 76 intervals to control the temperature, as shown in Figure 13a. Figure 13b shows the fogging system operation, where it can be observed that it stopped its operation from 58 interval due to a failure in the fogging system.

4.6. Fogging System Recovery Case

The fogging system was considered to be restored from interval 18 (interval 69 in case of 15-min resolution) while CHP and EHP had still not-recovered. The highlighted parts in the results show the results for this case. The chiller and HOB usage were reduced in the 18 intervals and Building chiller usage was reduced to zero in the 19–24 intervals, as shown in Figure 14b. After 71 intervals, the temperature was within the acceptable boundary (Figure 15a). The fogging system was fully utilized to restore the humidity to the acceptable boundary. CO2 and light intensity results were similar to those of the previous case. The usage for cooling pipe valve and fogging system in this case are shown in Figure 16.

4.7. EHP Recovery Case

In this case, after the recovery of the fogging system, EHP recovery is also considered from the beginning of time interval 19 (73 in case of 15 min resolution). Since cooling energy is not needed in the 19–24 interval, EHP is not used even if it is recovered. Therefore, EHP recovery has no effect on the electrical, heat, and cooling energy balancing of building a microgrid with rooftop greenhouse. In addition, indoor environmental control parameters of the greenhouse and equipment operation are also the same as for the previous case. Note that the results from time interval 73 to 96 of this case are the same as the previous case.

4.8. CHP Recovery Case

Finally, in this case, CHP is also restored from the time interval 22 (interval 85 in case of 15 min resolution). In this case, all the faulty equipment is restored and the system is driven back to the normal state. It can be observed from Figure 17 that CHP is used instead of DG to generate electrical energy and produce heat energy. Due to the production of surplus heat energy, it is used for generating cooling energy by using chiller.
The temperature and humidity parameters are the same with the fogging system recovery case, i.e., within the acceptable bounds. On the other hand, a CO2 generator and artificial lighting are fully utilized in this case due to recovery of the power source (CHP). The operation value of light intensity is recovered to the acceptable boundary, but the operation value of CO2 cannot be recovered to its acceptable boundary (Figure 18) even when the equipment is used at its maximum (Figure 19). This implies that more time is required to bring the CO2 level to the acceptable bounds.

5. Conclusions

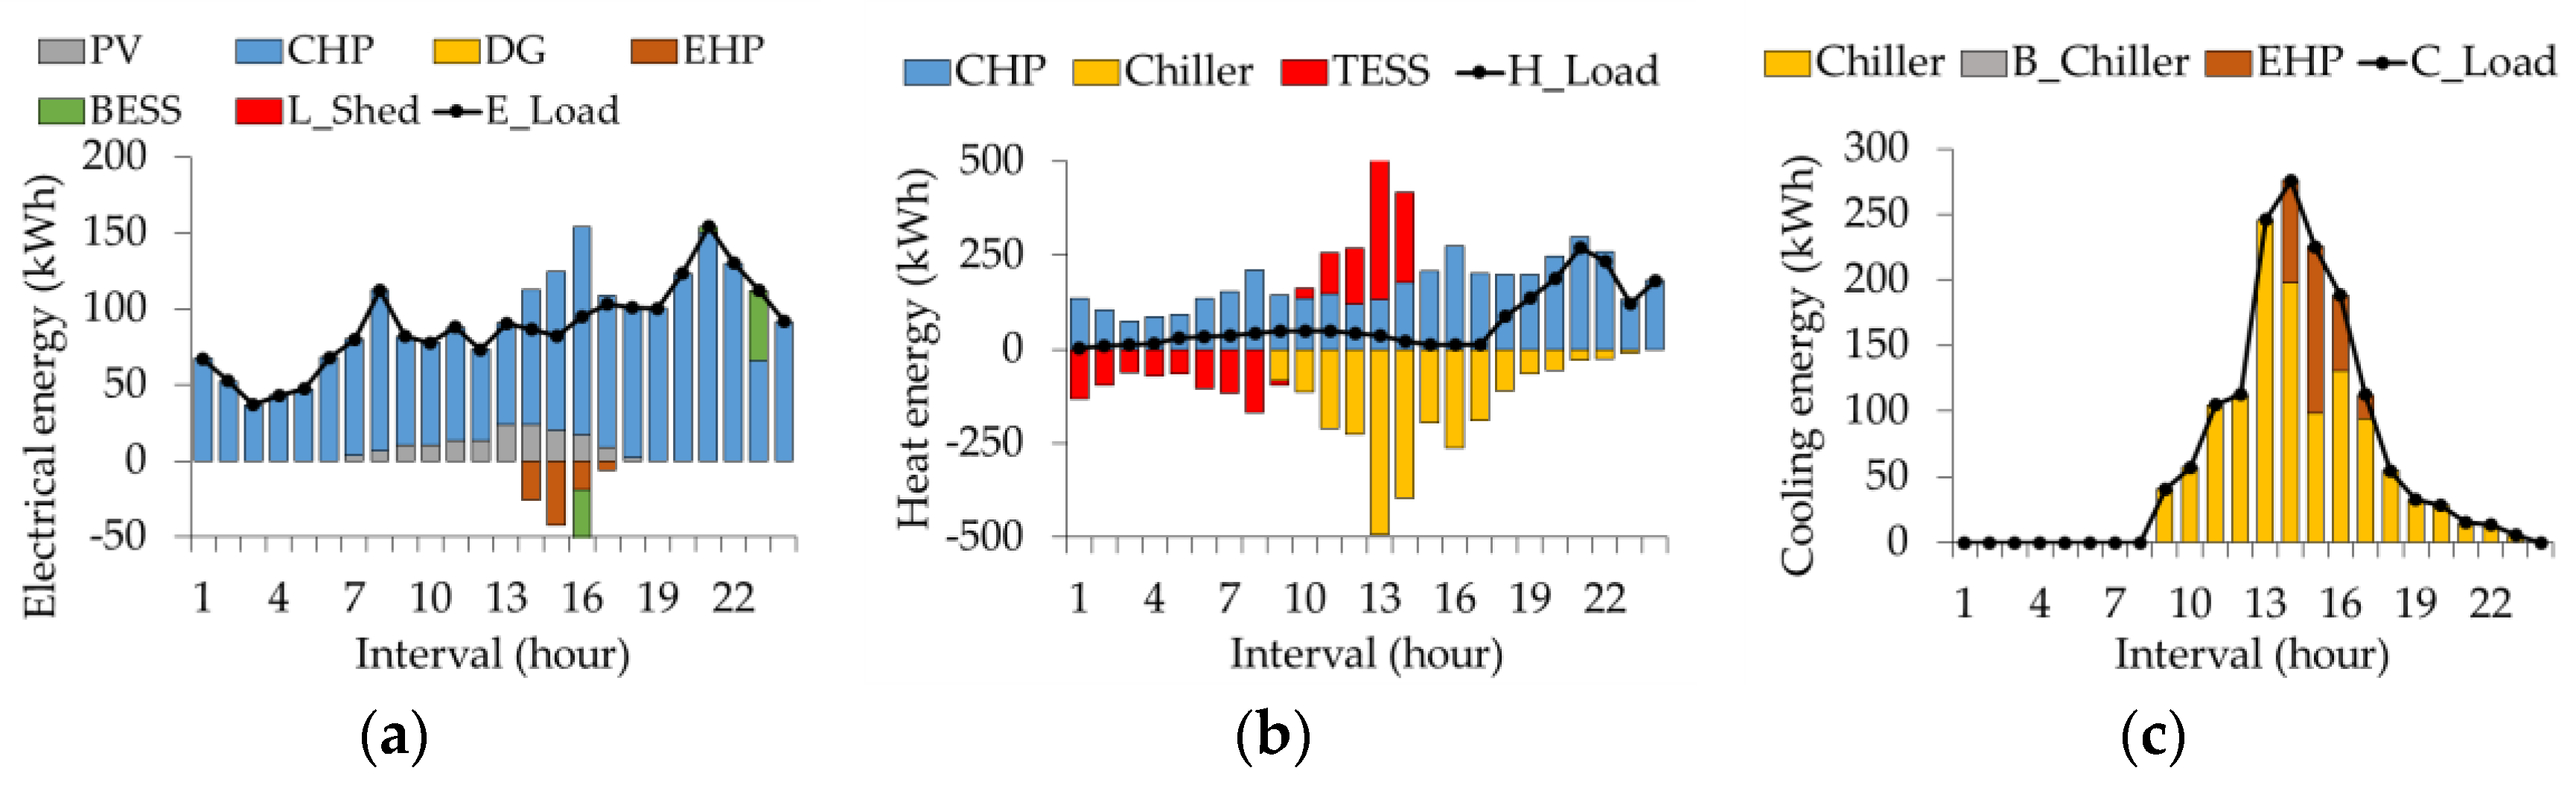
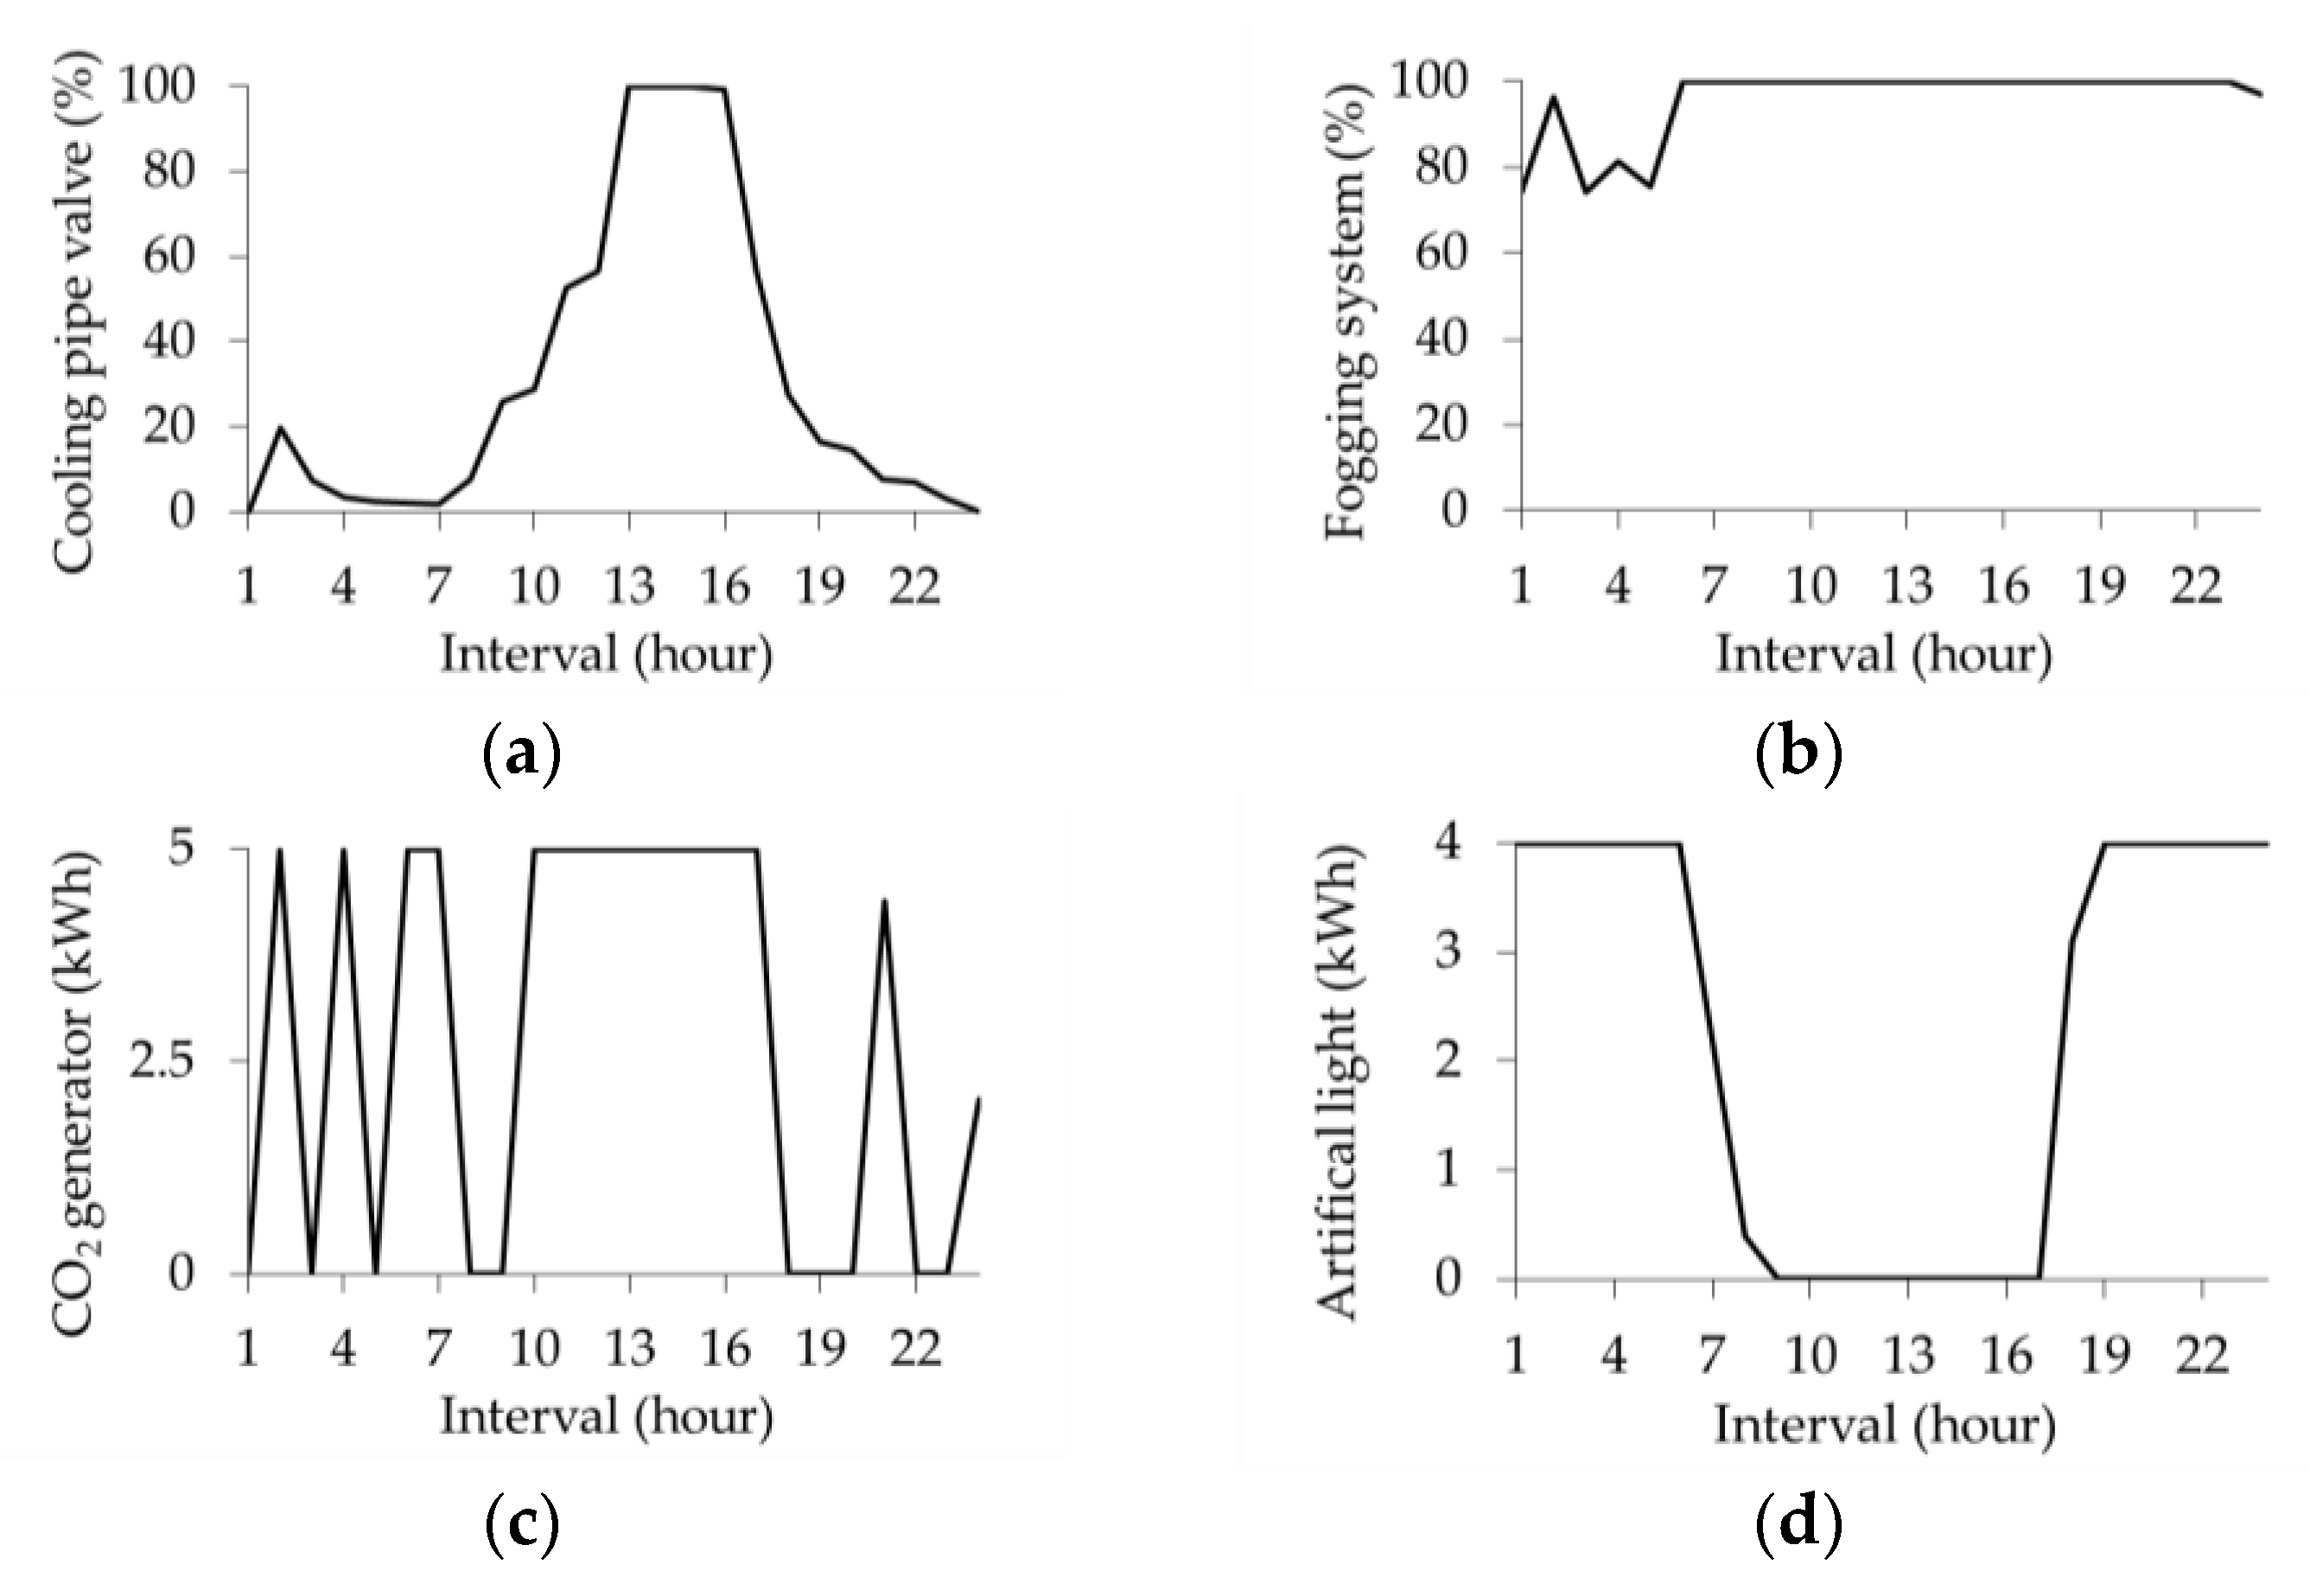
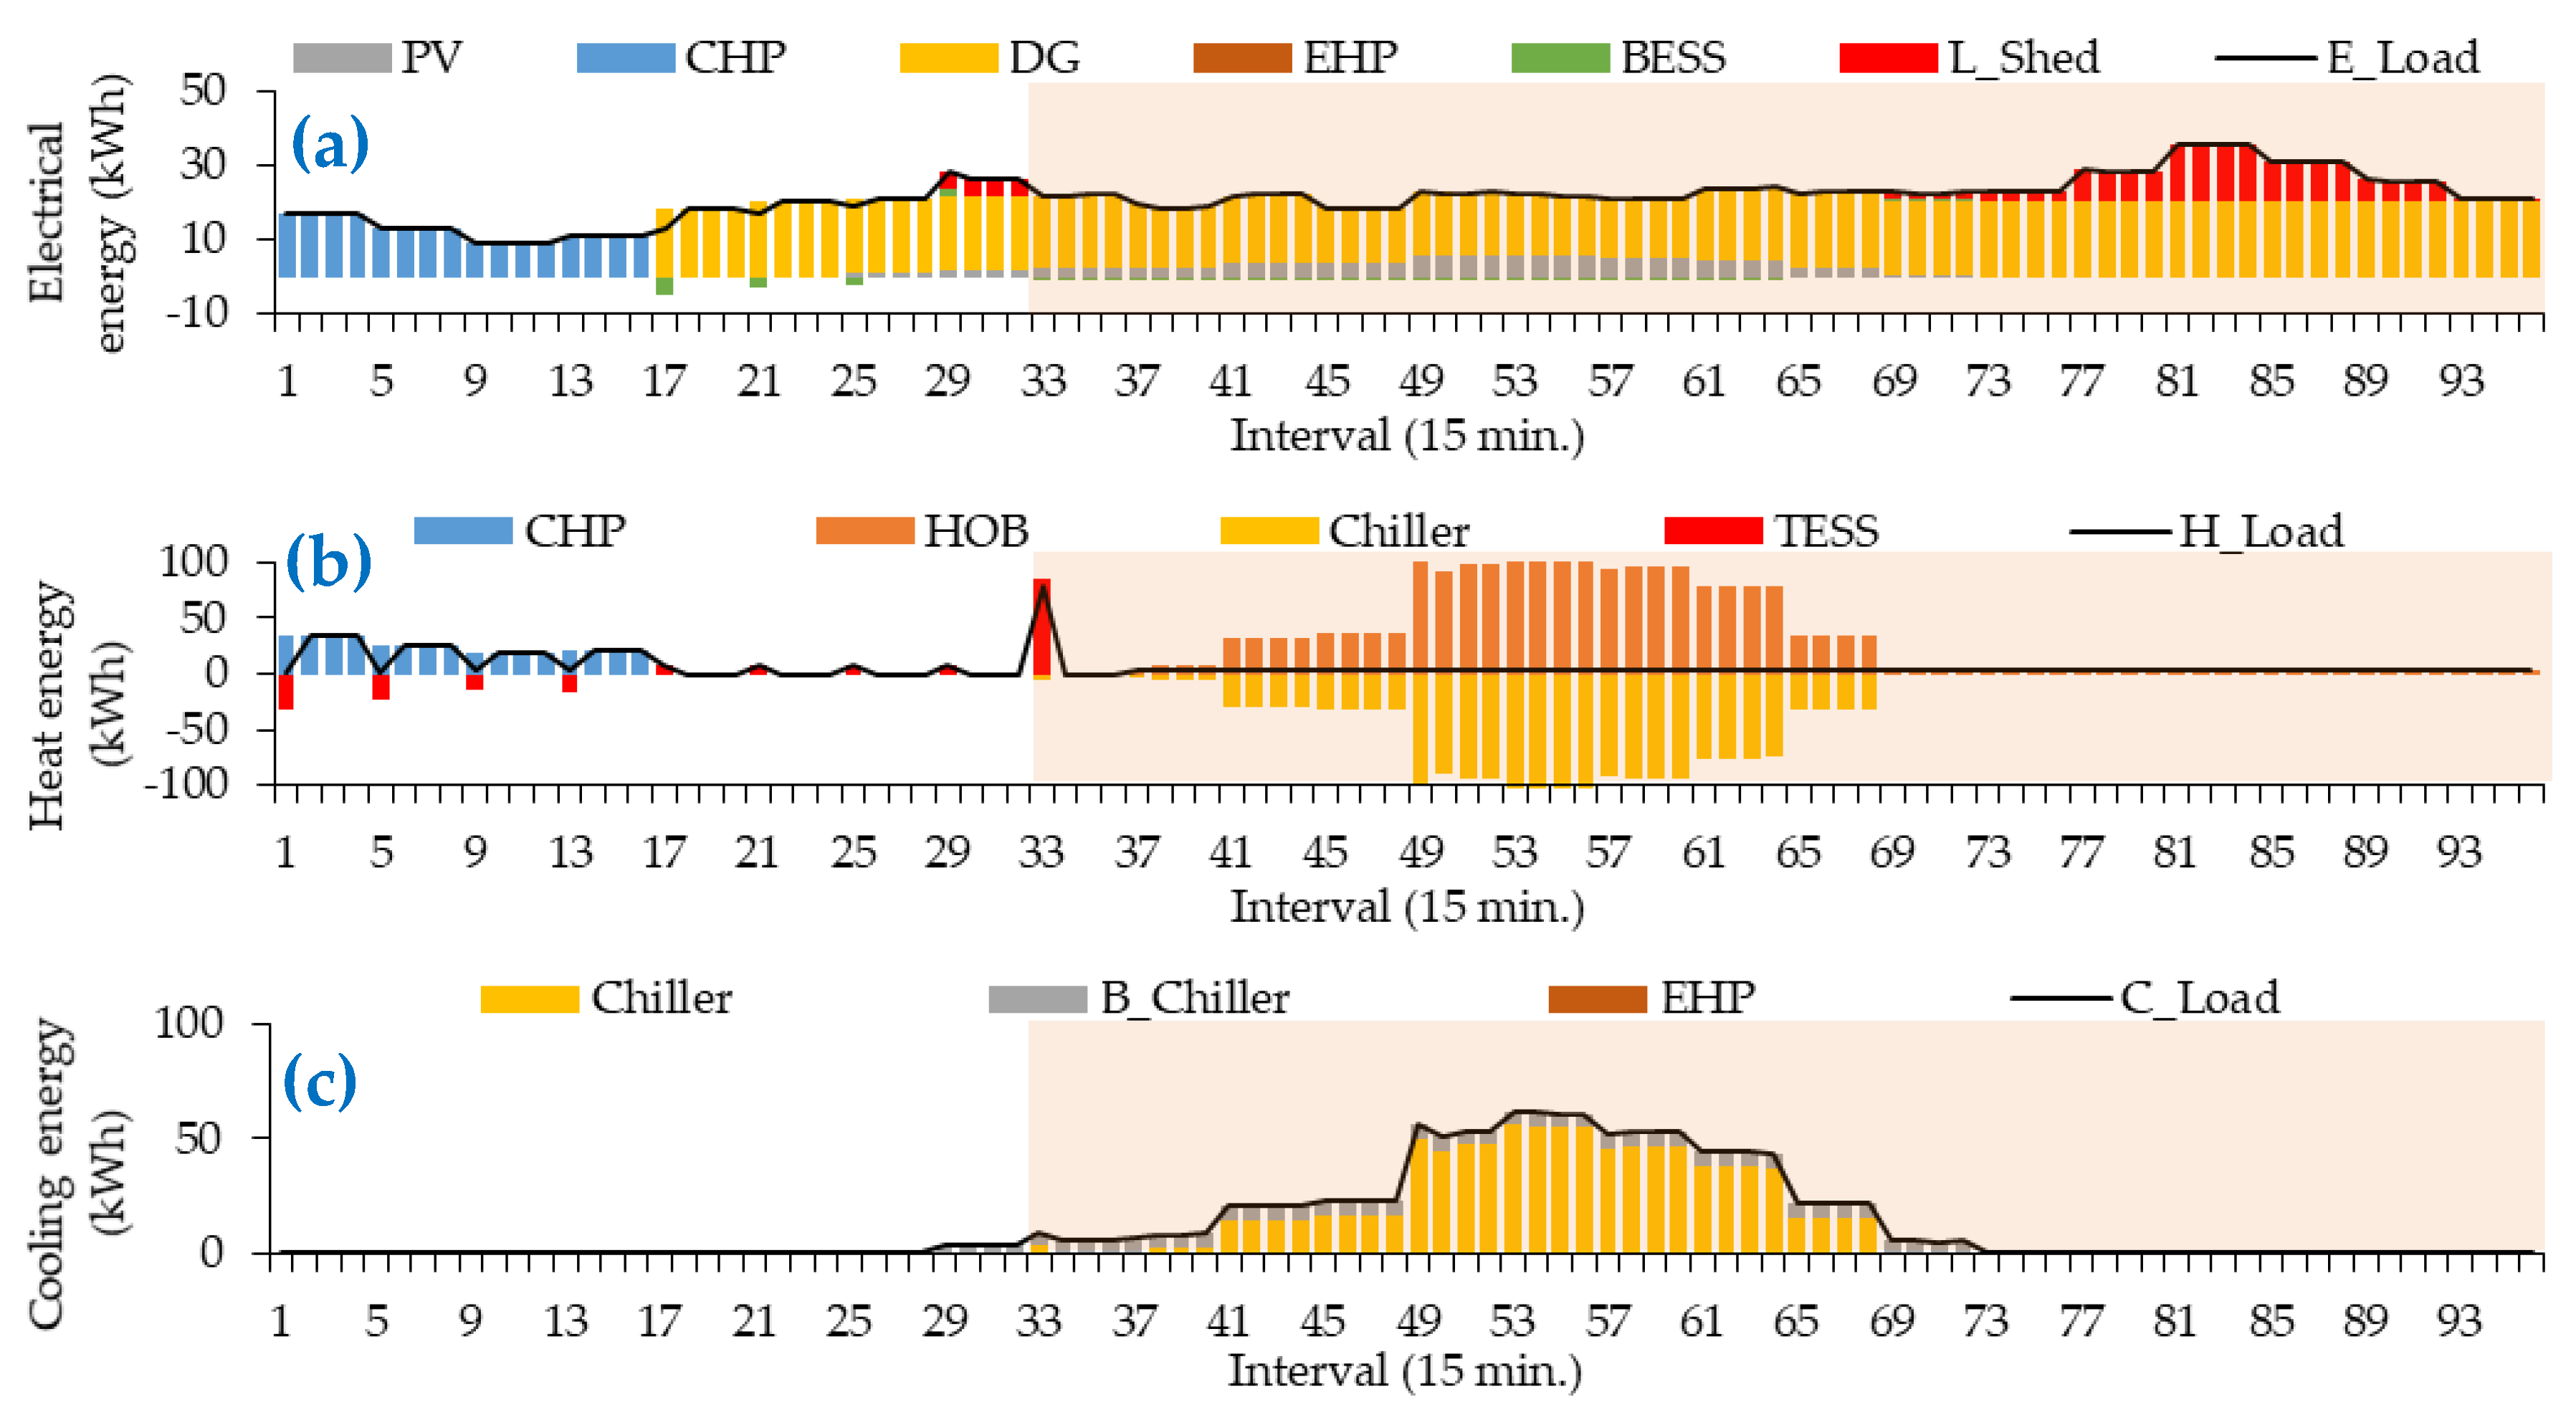
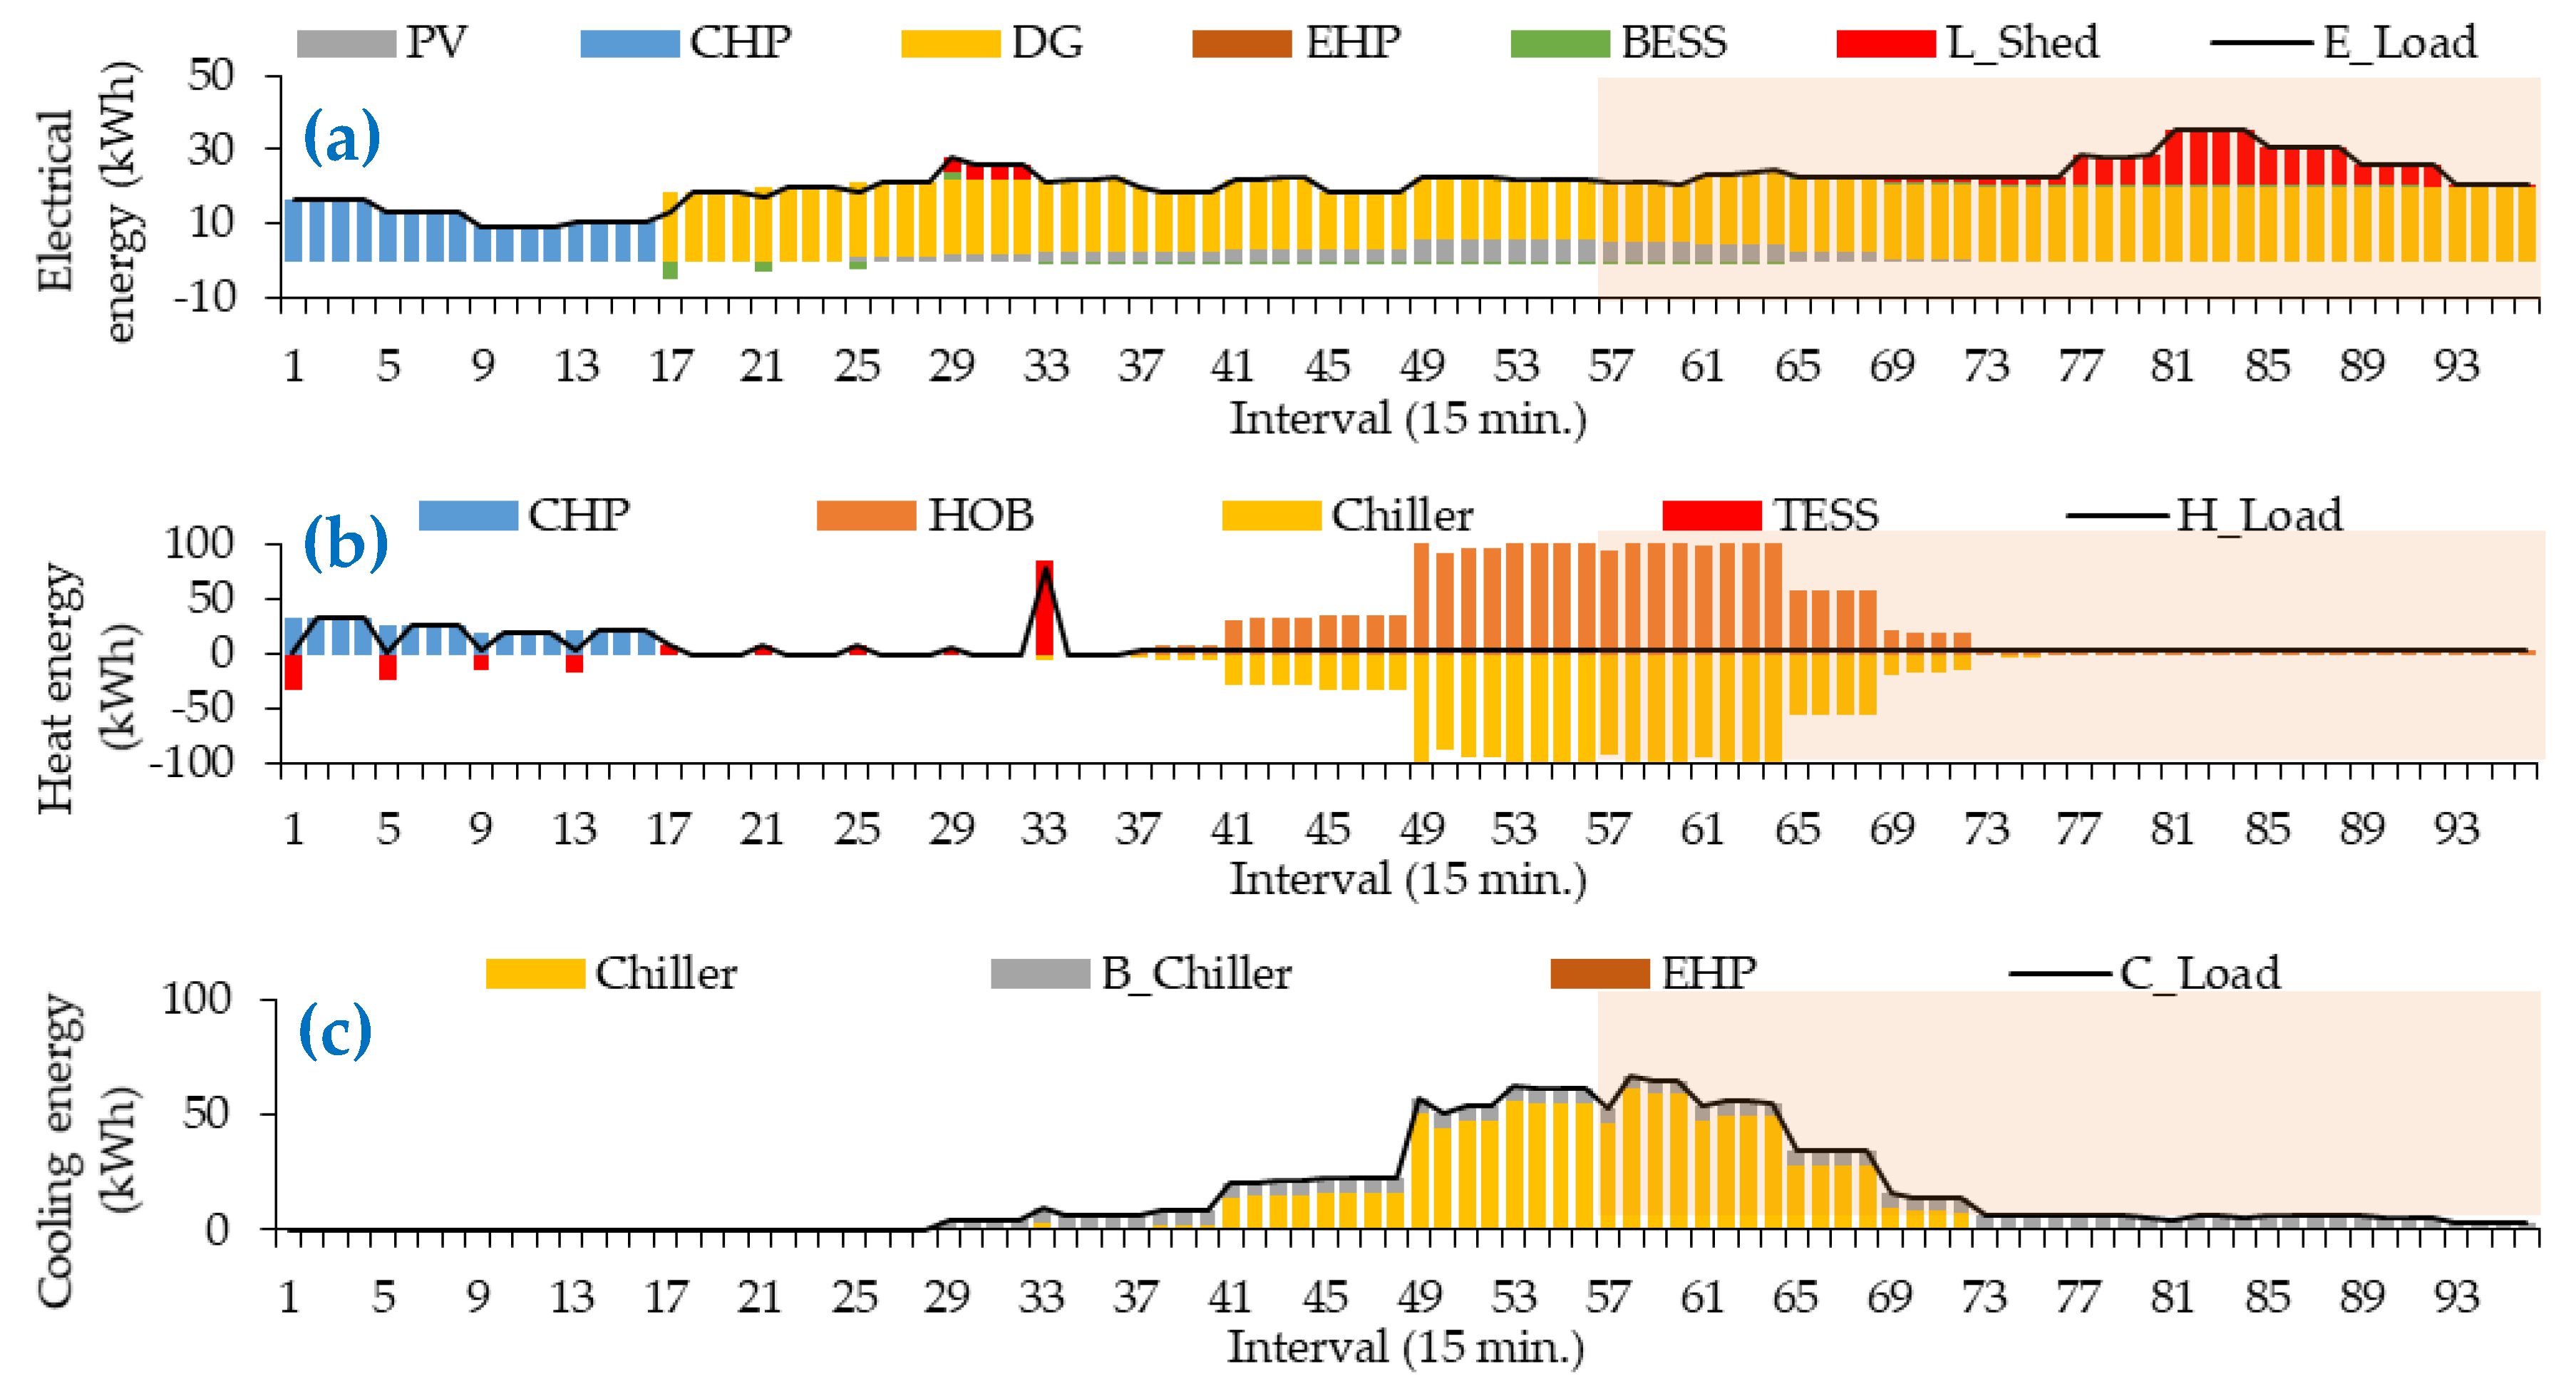
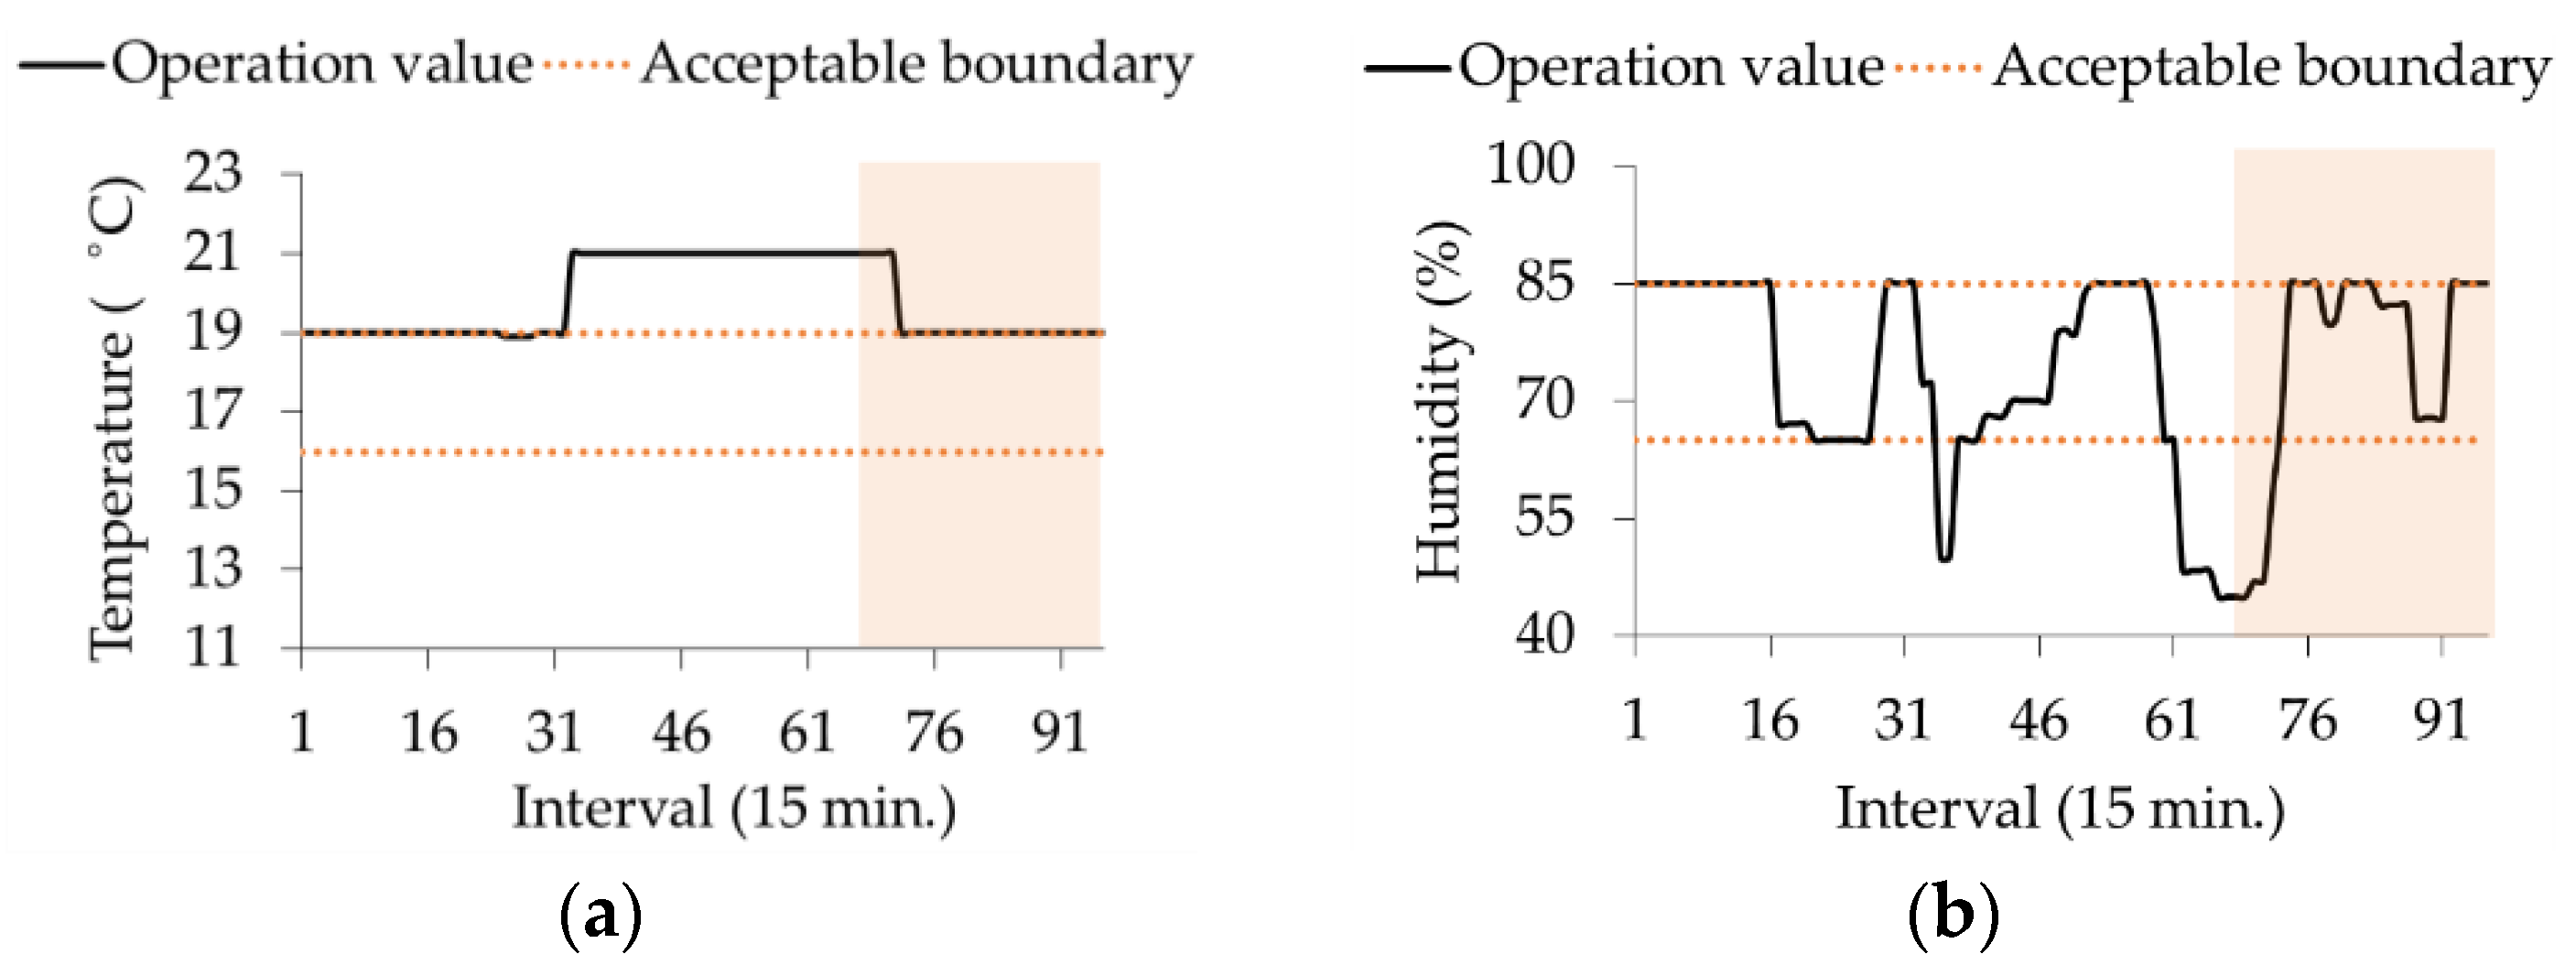
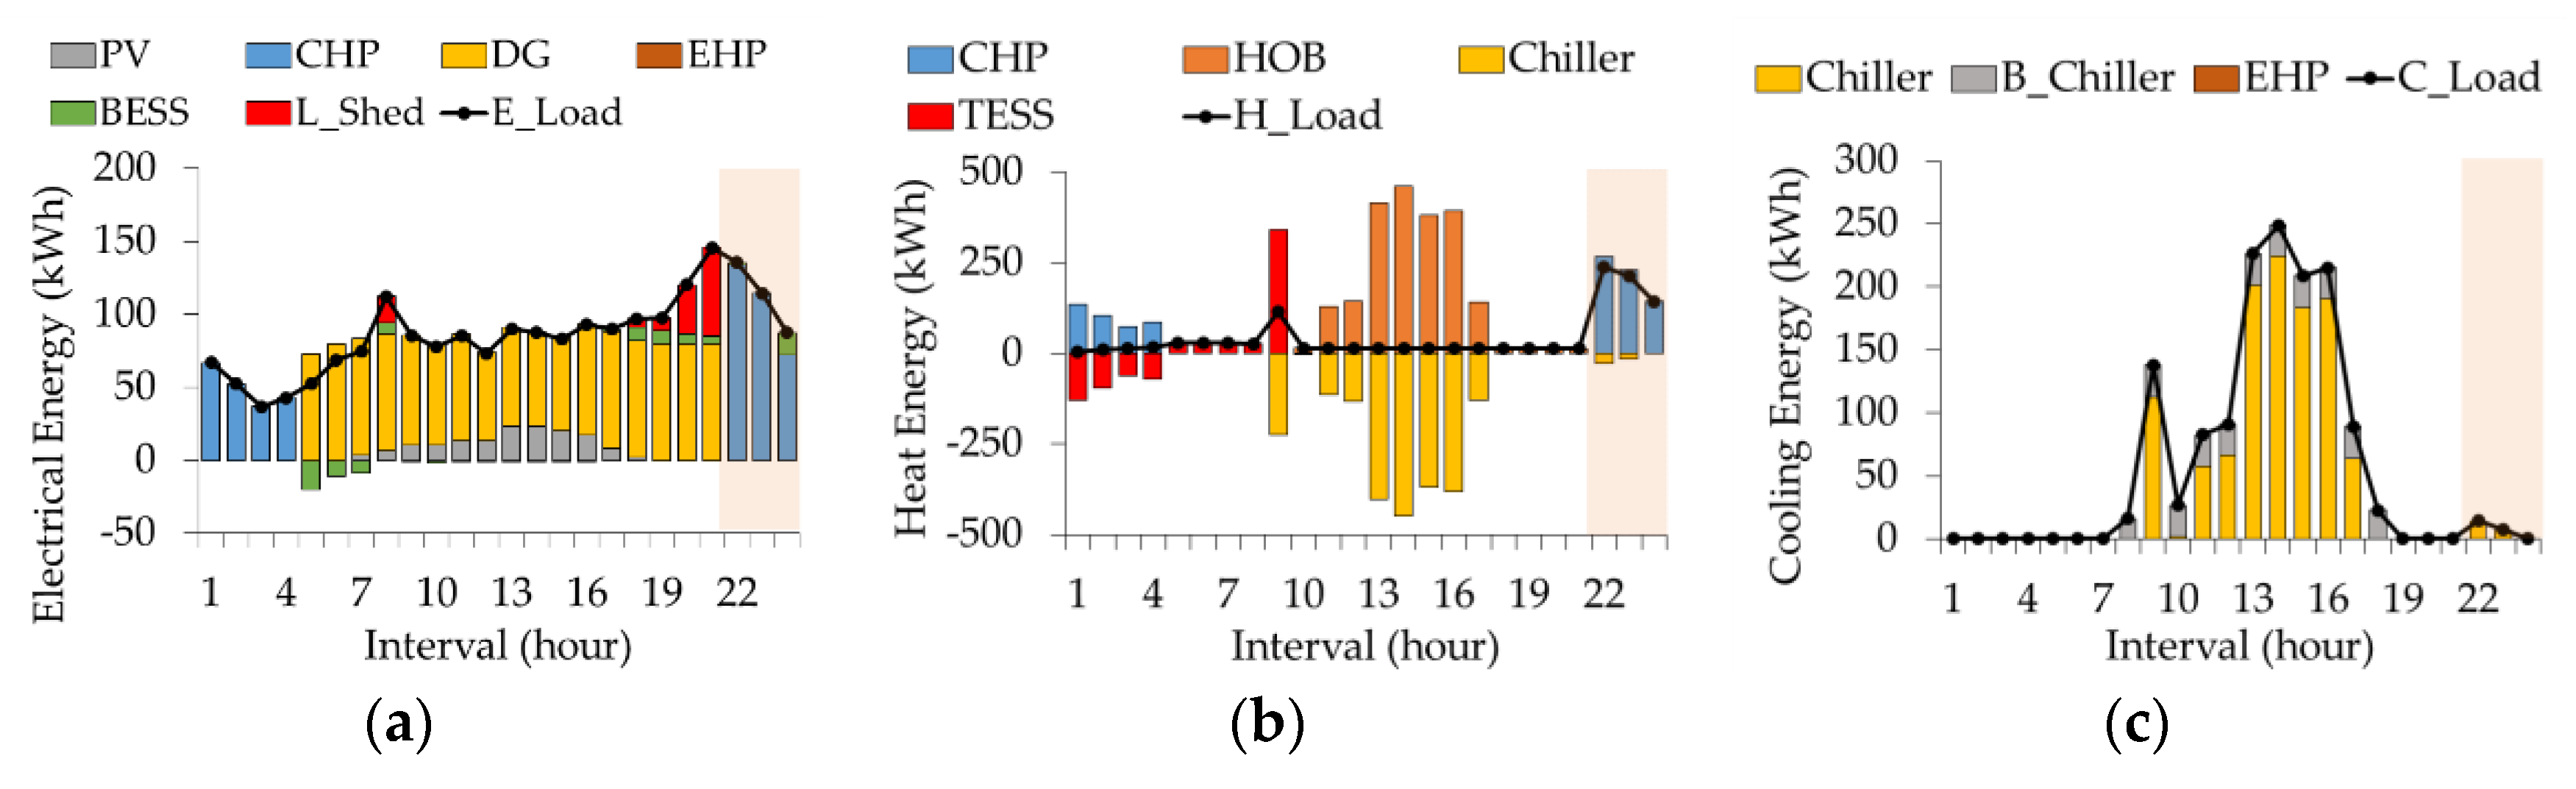
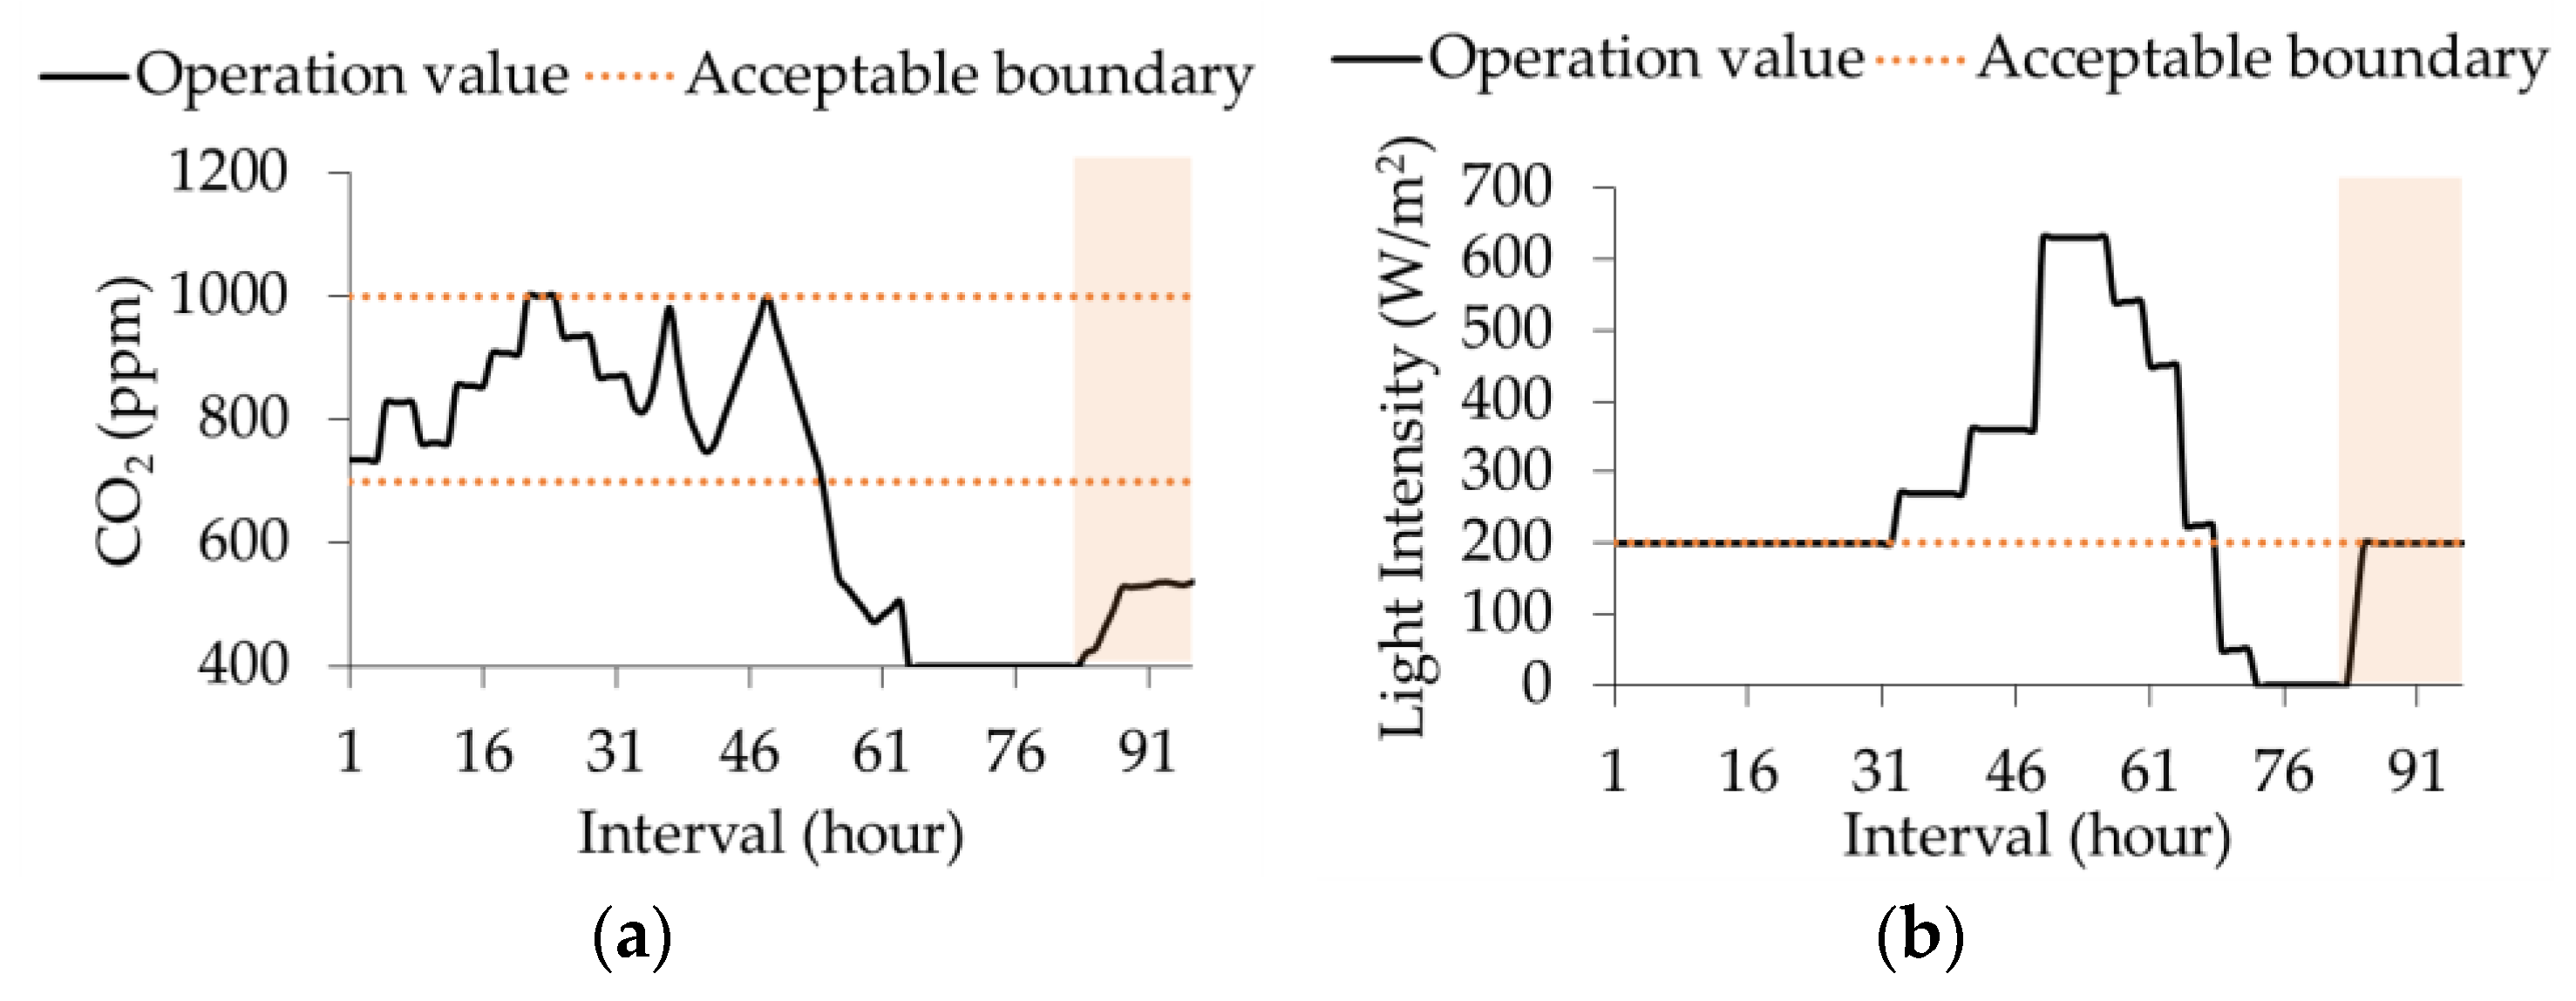
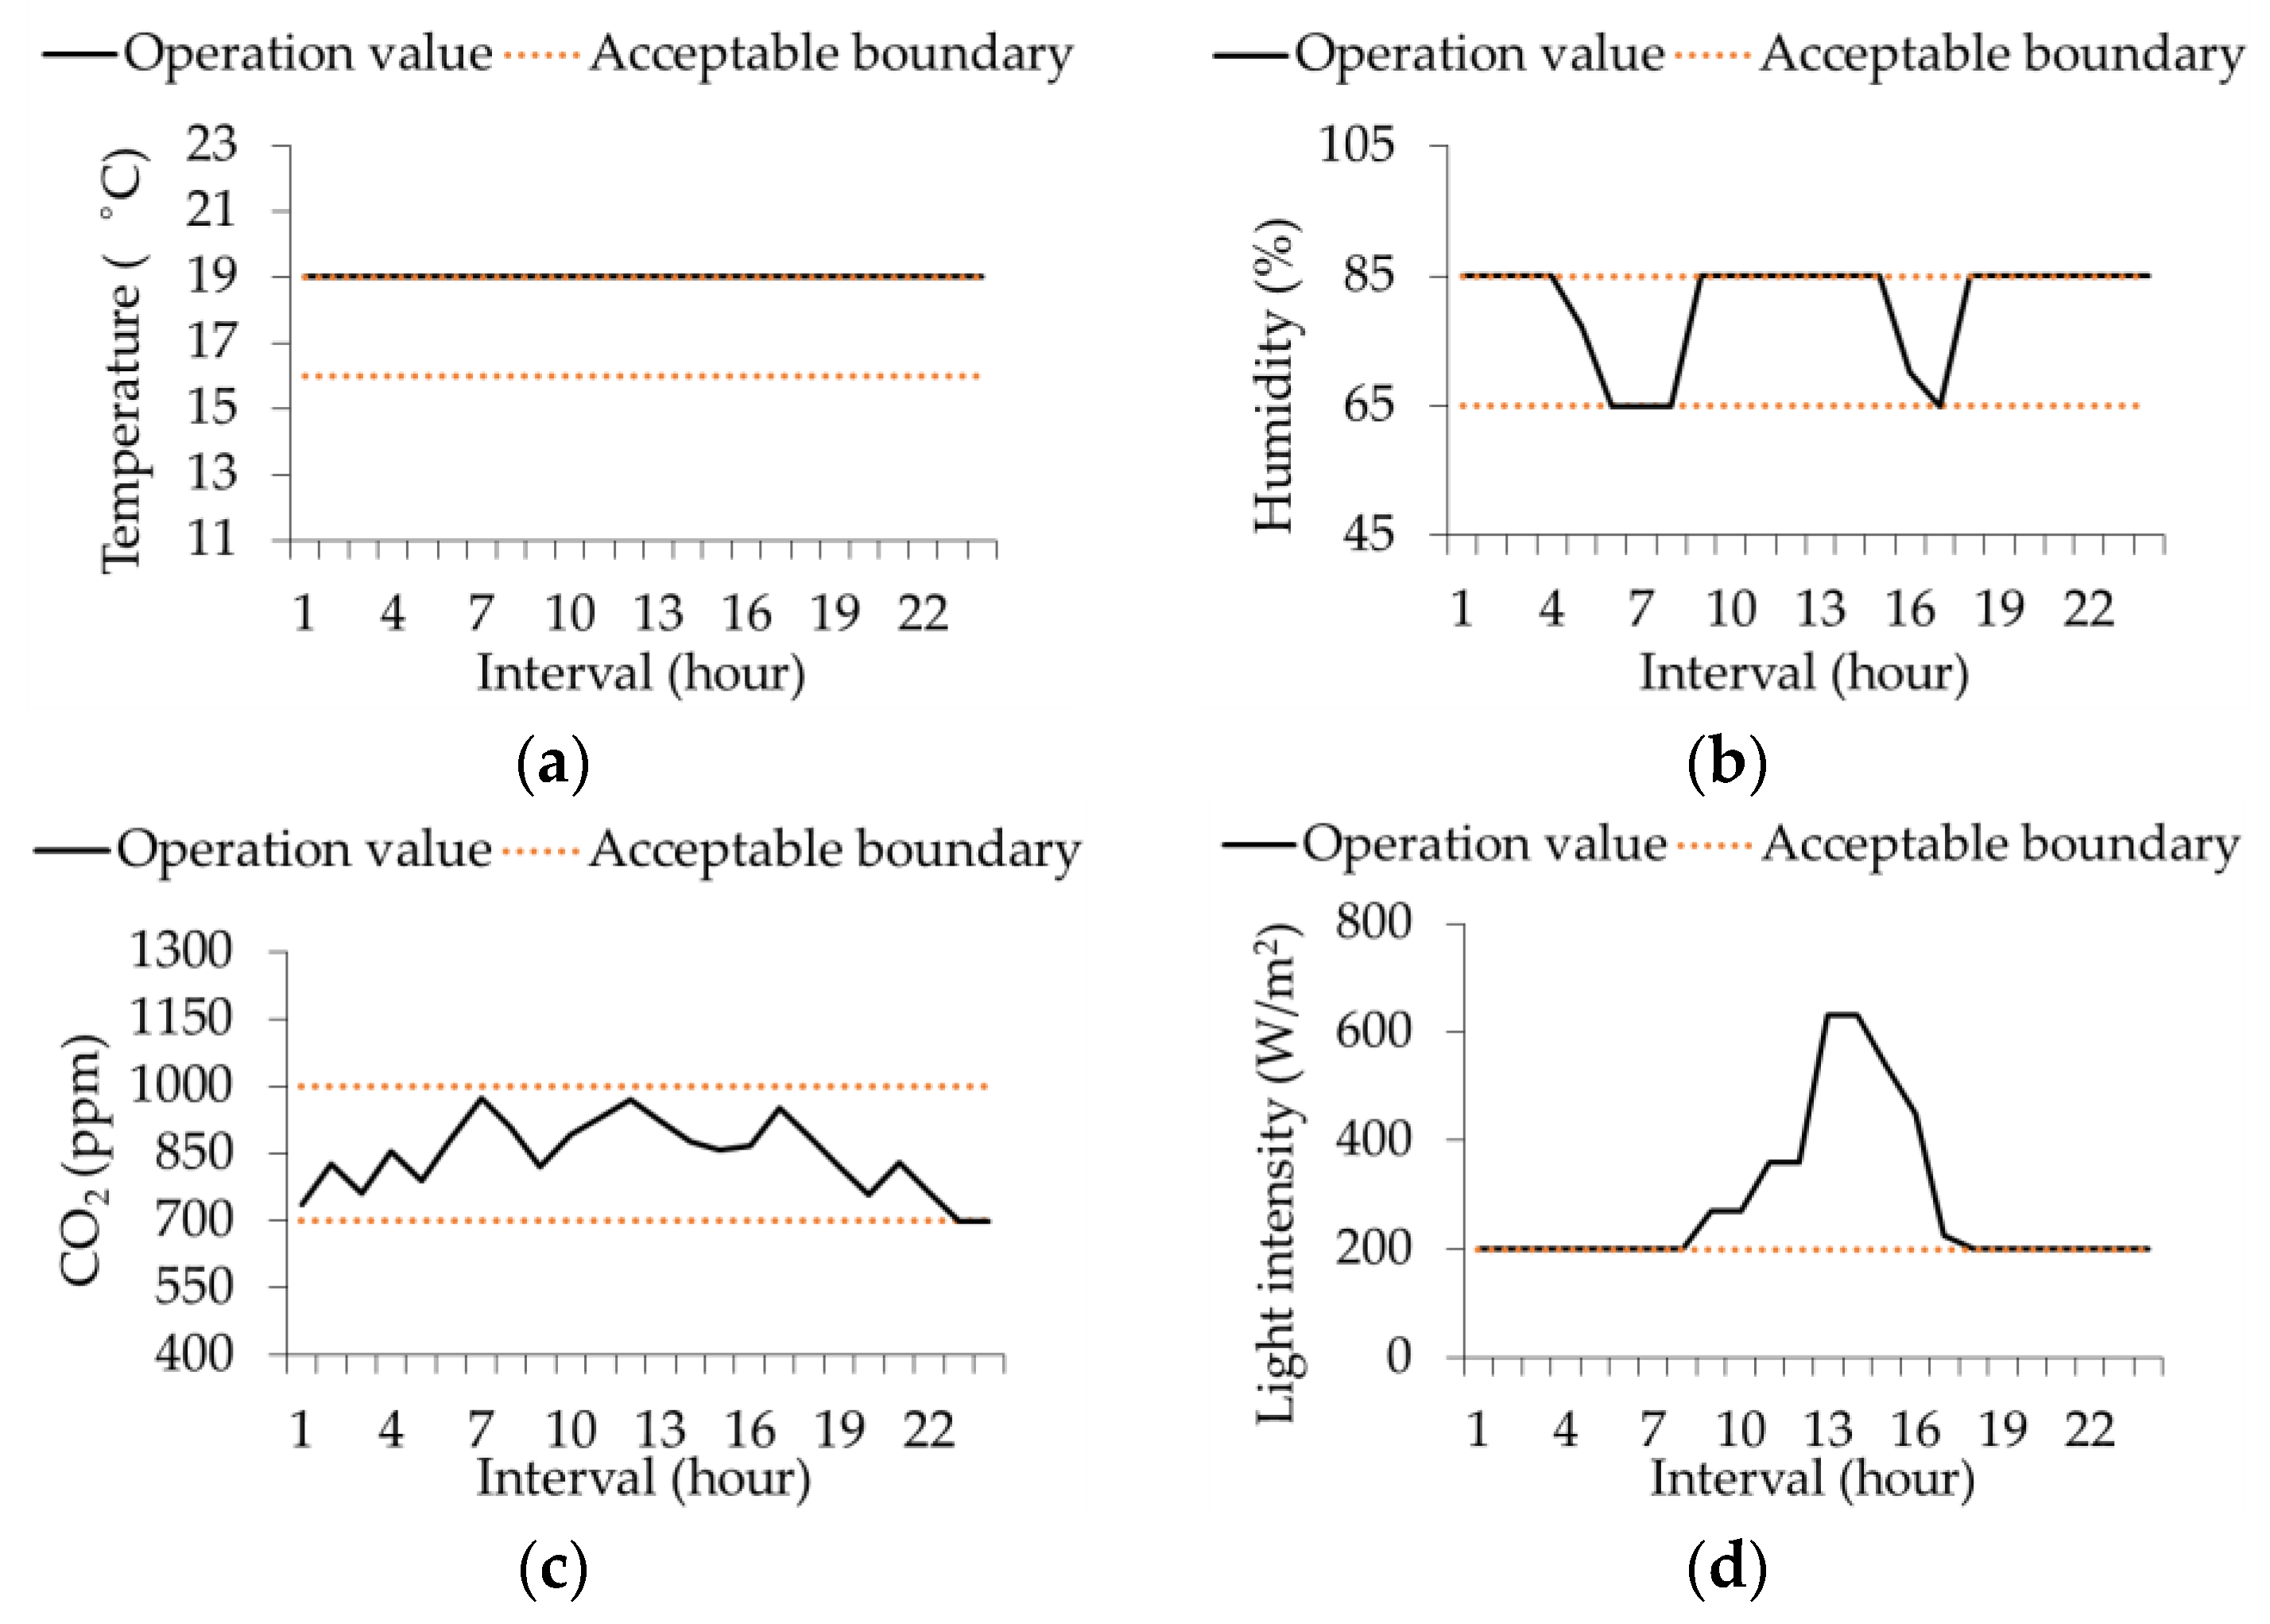
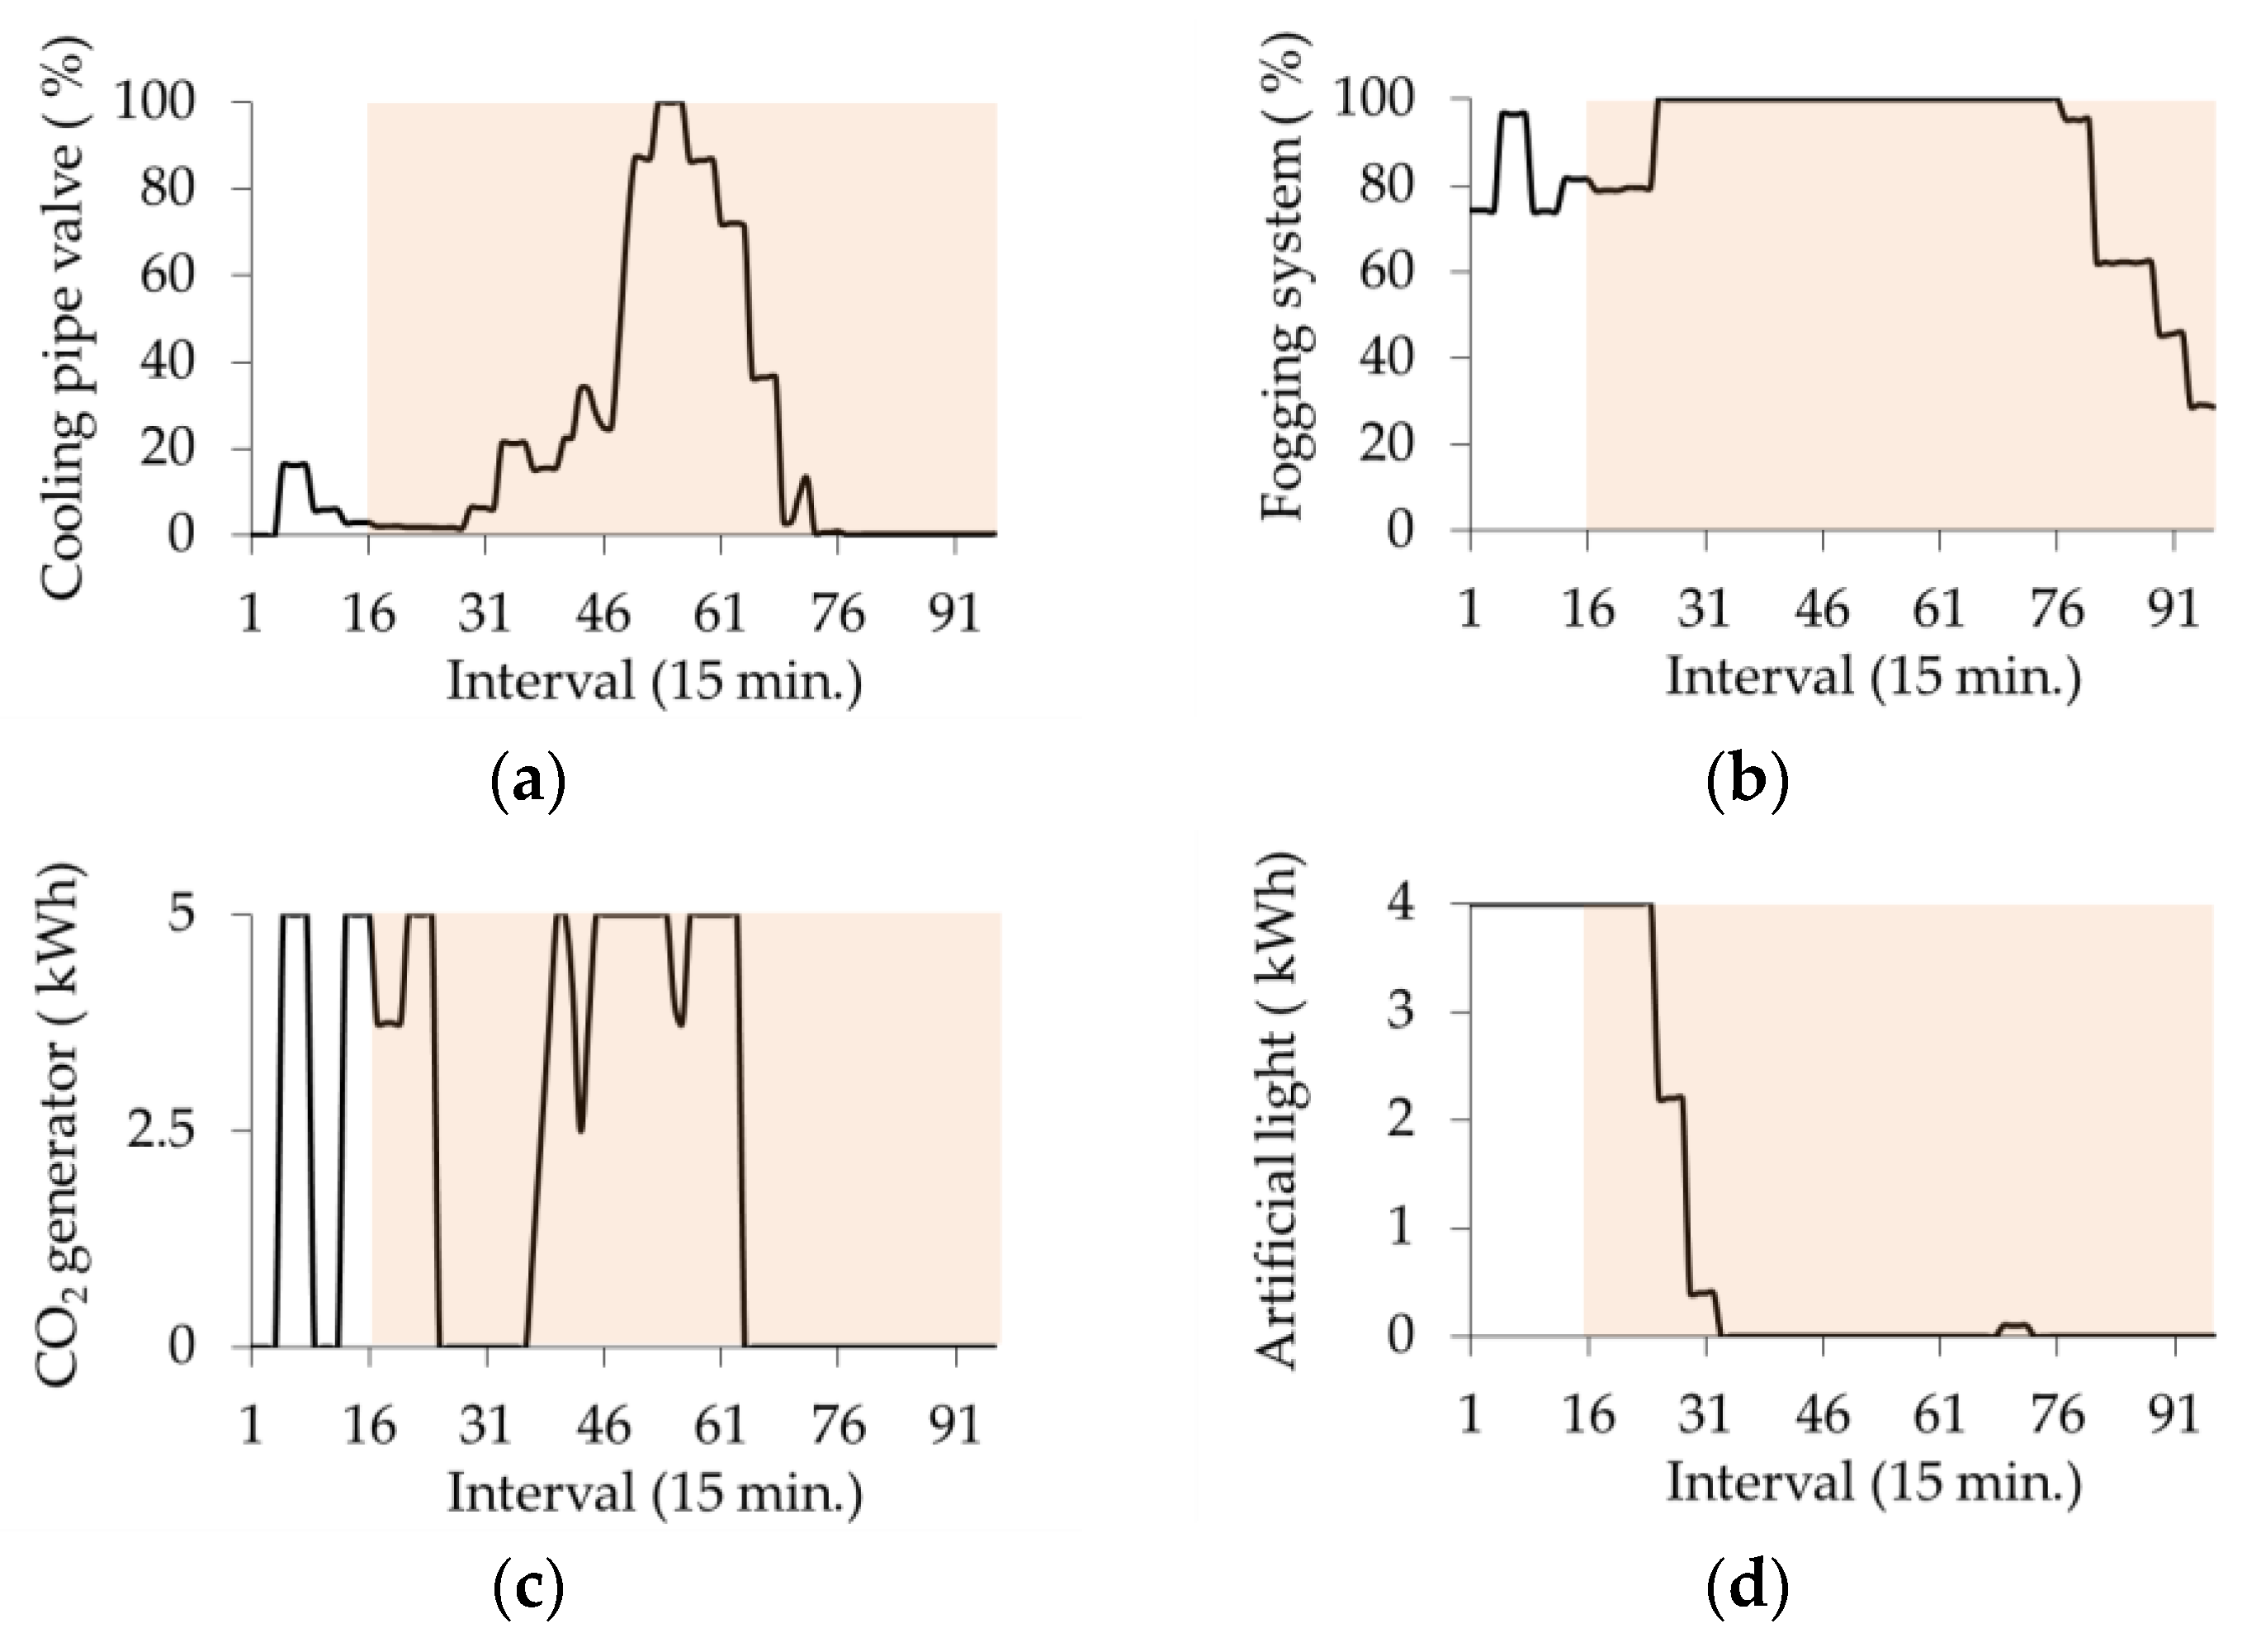
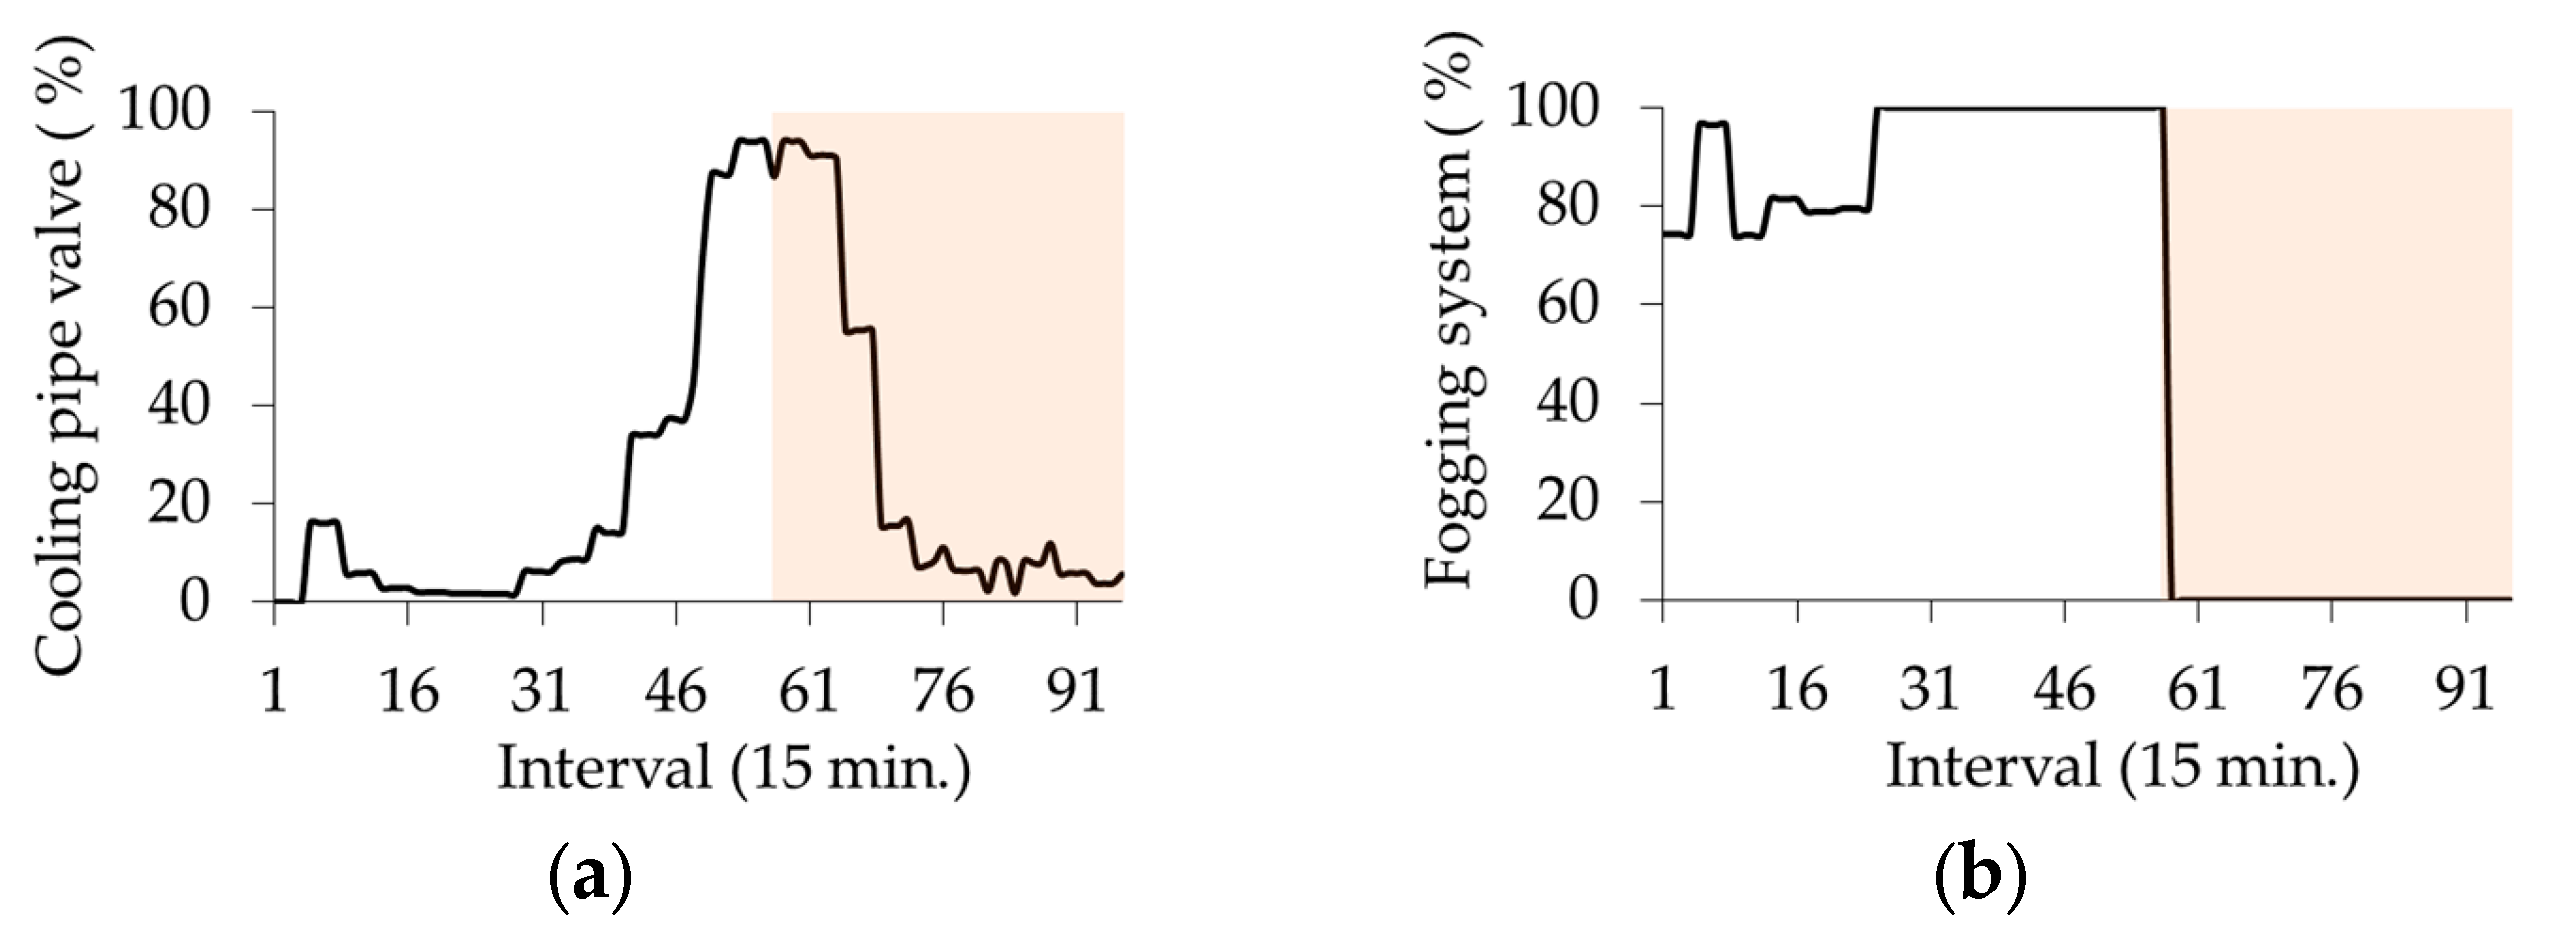
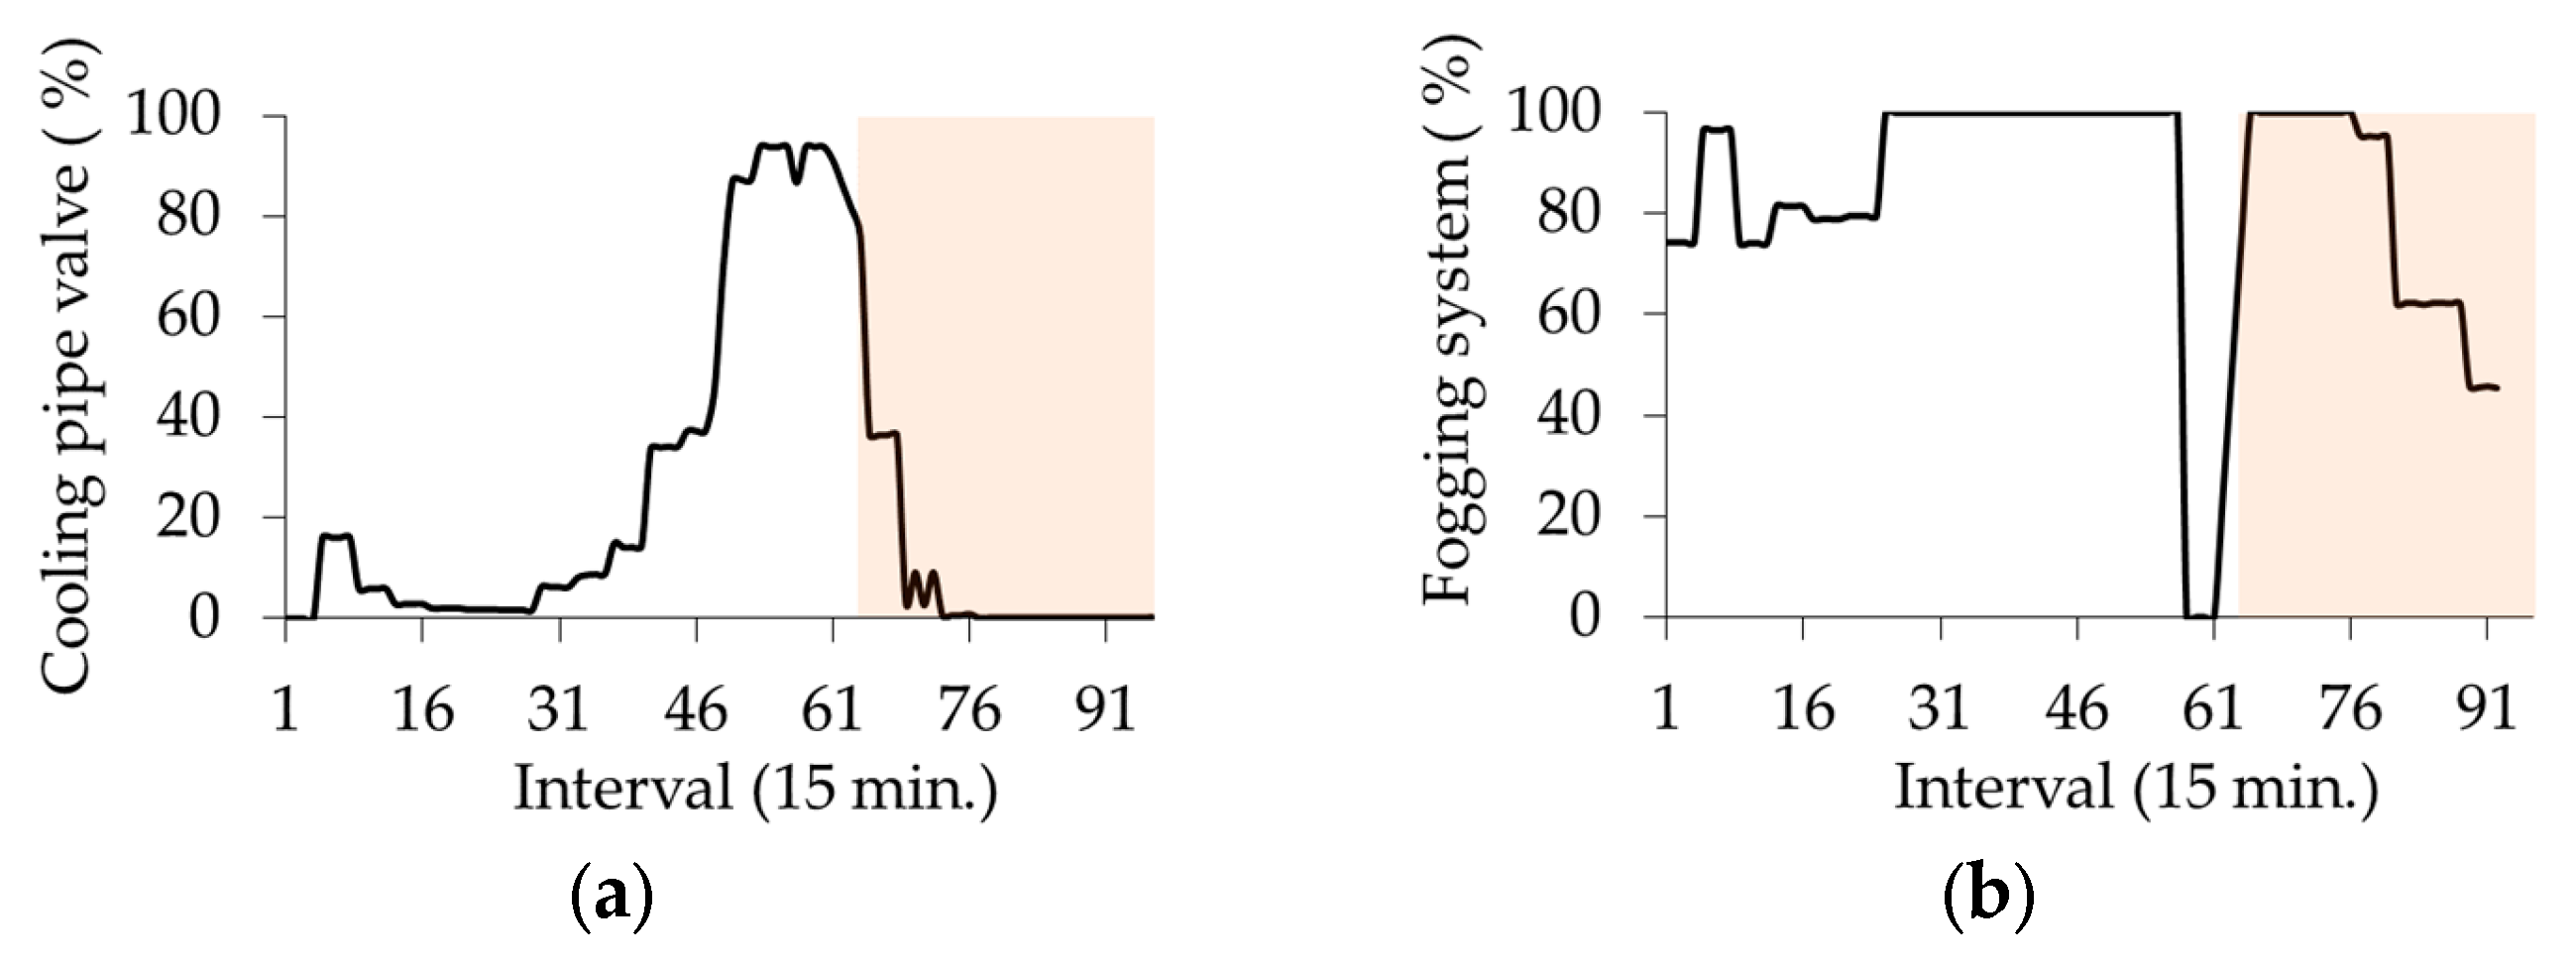
In this paper, an optimal operation method for a building microgrid with a rooftop greenhouse considering equipment outages is proposed. The proposed operational strategy defines the priority of various control parameters through the weight matrix and considers the optimum growth of the plants. If the control parameters are out of the acceptable bounds, additionally relaxed bounds are utilized and a violation cost is imposed. The performance of the proposed method is evaluated by considering seven equipment outages cases. It has been observed that during an equipment outage, replaceable equipment has been operated to fulfill the energy deficit, i.e., DG and HOB has been utilized in case of a CHP outage. In case of absence of replaceable equipment or inability of the replaceable equipment to fulfill the energy demand, violation of acceptable bounds is considered for the greenhouse. Similarly, the shedding of non-critical loads is considered in the case of building households. For example, in the case of an EHP outage, cooling is provided through the chiller but due to insufficient heat, temperature violations occur. It also has been observed that, after equipment restoration, the control parameters have gradually been restored to their normal bounds. However, in the final case, the CO2 concentration was unable to reach the acceptable bound in the current scheduling horizon due to limited capacity of the CO2 generator, i.e., it requires more time.
The formulated problem is subjected to environmental uncertainties and uncertainties in energy usage patterns of building residents. Consideration of uncertainties in loads and renewables will be a valuable extension of this paper.

Author Contributions

The paper was a collaborative effort between the authors. The authors contributed collectively to the theoretical analysis, modeling, simulation, and manuscript preparation.

Funding

This work was supported by Incheon National University Research Grant in 2018.

Acknowledgments

This work was supported by Incheon National University Research Grant in 2018.

Conflicts of Interest

The authors declare no conflict of interest.

References

  1. Wang, Y.; Wang, B.; Chu, C.C.; Pota, H.; Gadh, R. Energy management for a commercial building microgrid with stationary and mobile battery storage. Energy Build. 2016, 116, 141–150. [Google Scholar] [CrossRef]
  2. Byeon, G.; Yoon, T.; Oh, S.; Jang, G. Energy management strategy of the DC distribution system in buildings using the EV service model. IEEE Trans. Power Electron. 2013, 28, 1544–1554. [Google Scholar] [CrossRef]
  3. Basso, G.L.; Nastasi, B.; Salata, F.; Golasi, I. Energy retrofitting of residential buildings—How to couple Combined Heat and Power (CHP) and Heat Pump (HP) for thermal management and off-design operation. Energy Build. 2017, 151, 293–305. [Google Scholar] [CrossRef]
  4. Camargo, L.R.; Nitsch, F.; Gruber, K.; Dorner, W. Electricity self-sufficiency of single-family houses in Germany and the Czech Republic. Appl. Energy 2018, 228, 902–915. [Google Scholar] [CrossRef]
  5. Calise, F.; di Vastogirardi, G.D.N.; d’Accadia, M.D.; Vicidomini, M. Simulation of polygeneration systems. Energy 2018, 163, 290–337. [Google Scholar] [CrossRef]
  6. Carli, R.; Dotoli, M. Cooperative distributed control for the energy scheduling of smart homes with shared energy storage and renewable energy source. IFAC-Pap. 2017, 50, 8867–8872. [Google Scholar] [CrossRef]
  7. Carli, R.; Dotoli, M. Energy scheduling of a smart home under nonlinear pricing. In Proceedings of the 53rd IEEE Conference on Decision and Control, Los Angeles, CA, USA, 15–17 December 2014; pp. 5648–5653. [Google Scholar]
  8. Sperstad, I.B.; Korpås, M. Energy Storage Scheduling in Distribution Systems Considering Wind and Photovoltaic Generation Uncertainties. Energies 2019, 12, 1231. [Google Scholar] [CrossRef]
  9. Hosseini, S.M.; Carli, R.; Dotoli, M. Model Predictive Control for Real-Time Residential Energy Scheduling under Uncertainties. In Proceedings of the 2018 IEEE International Conference on Systems, Man, and Cybernetics (SMC), Miyazaki, Japan, 7–10 October 2018; pp. 1386–1391. [Google Scholar]
  10. Pahuja, R.; Verma, H.K.; Uddin, M. A wireless sensor network for greenhouse climate control. IEEE Pervasive Comput. 2013, 12, 49–58. [Google Scholar] [CrossRef]
  11. Vadiee, A.; Viktoria, M. Energy management strategies for commercial greenhouses. Appl. Energy 2014, 114, 880–888. [Google Scholar] [CrossRef]
  12. Marucci, A.; Andrea, C. Dynamic photovoltaic greenhouse: Energy efficiency in clear sky conditions. Appl. Energy 2016, 170, 362–376. [Google Scholar] [CrossRef]
  13. Hu, H.; Xu, L.; Wei, R.; Zhu, B. Multi-objective control optimization for greenhouse environment using evolutionary algorithms. Sensors 2011, 11, 5792–5807. [Google Scholar] [CrossRef] [PubMed]
  14. Vadiee, A.; Martin, V. Energy management in horticultural applications through the closed greenhouse concept, state of the art. Renew. Sustain. Energy Rev. 2012, 16, 5087–5100. [Google Scholar] [CrossRef]
  15. Zou, Q.; Ji, J.; Zhang, S.; Shi, M.; Luo, Y. Model predictive control based on particle swarm optimization of greenhouse climate for saving energy consumption. In Proceedings of the 2010 World Automation Congress, Kobe, Japan, 19–23 September 2010; pp. 123–128. [Google Scholar]
  16. Rasheed, A.; Lee, J.W.; Lee, H.W. A review of greenhouse energy management by using building energy simulation. Prot. Hortic. Plant Fact. 2015, 24, 317–325. [Google Scholar] [CrossRef]
  17. Chehreghani Bozchalui, M. Optimal Operation of Energy Hubs in the Context of Smart Grids. Ph.D. Thesis, University of Waterloo, Waterloo, ON, Canada, 2011. [Google Scholar]
  18. Hussain, A.; Choi, I.S.; Im, Y.H.; Kim, H.M. Optimal operation of greenhouses in microgrids perspective. IEEE Trans. Smart Grid 2018, 10, 3474–3485. [Google Scholar] [CrossRef]
  19. Benis, K.; Gomes, R.; Vicente, R.; Ferrao, P.; Fernandez, J. Rooftop greenhouses: LCA and energy simulation. In Proceedings of the International Conference CISBAT 2015 Future Buildings and Districts Sustainability from Nano to Urban Scale (LESO-PB, EPFL), Lausanne, Switzerland, 9–11 September 2015; pp. 95–100. [Google Scholar]
  20. Pons Valladares, O.; Nadal, A.; Sanyé-Mengual, E.; Llorach-Massana, P.; Cuerva, E.; Sanjuan-Delmàs, D. Roofs of the future: Rooftop greenhouses to improve buildings metabolism. Procedia Eng. 2015, 441–448. [Google Scholar] [CrossRef]
  21. Choi, I.S.; Hussain, A.; Bui, V.H.; Kim, H.M. A Multi-Agent System-Based Approach for Optimal Operation of Building Microgrids with Rooftop Greenhouse. Energies 2018, 11, 1876. [Google Scholar] [CrossRef]
  22. Kozai, T. Smart Plant Factory: The Next Generation Indoor Vertical Farms; Springer: Berlin/Heidelberg, Germany, 2018. [Google Scholar]
  23. Sanyé-Mengual, E.; Martinez-Blanco, J.; Finkbeiner, M.; Cerdà, M.; Camargo, M.; Ometto, A.R.; Ferreira, G. Urban horticulture in retail parks: Environmental assessment of the potential implementation of rooftop greenhouses in European and South American cities. J. Clean. Prod. 2018, 172, 3081–3091. [Google Scholar] [CrossRef]
  24. Amthor, J.S. Respiration and Crop Productivity; Springer Science & Business Media: Berlin/Heidelberg, Germany, 2012. [Google Scholar]
  25. Both, A.J.; Benjamin, L.; Franklin, J.; Holroyd, G.; Incoll, L.D.; Lefsrud, M.G.; Pitkin, G. Guidelines for measuring and reporting environmental parameters for experiments in greenhouses. Plant Methods 2015, 11, 43. [Google Scholar] [CrossRef] [PubMed]
  26. Bozchalui, M.C.; Cañizares, C.A.; Bhattacharya, K. Optimal energy management of greenhouses in smart grids. IEEE Trans. Smart Grid 2015, 6, 827–835. [Google Scholar] [CrossRef]
  27. Peery, J.A. How Does Humidifity Influence Crop Quality? Available online: https://www.pthorticulture.com/en/training-center/how-does-humidity-influence-crop-quality (accessed on 24 April 2019).
  28. Kozai, T. Resource use efficiency of closed plant production system with artificial light: Concept, estimation and application to plant factory. Proc. Jpn. Acad. Ser. B 2013, 89, 447–461. [Google Scholar] [CrossRef]
  29. Qian, G.; Wang, X.D. Greenhouse parameter control strategy based on the AHP (Analytical Hierarchy Process). In Proceedings of the 2013 25th Chinese Control and Decision Conference (CCDC), Guiyang, China, 25–27 May 2013; pp. 1589–1594. [Google Scholar]
  30. ILOG CPLEX 12.7.0 Users Manual; ILOG SA: Gentilly, France, 2016.
Figure 1. Configuration of the building microgrid with rooftop greenhouse considered in this study.
Energies 12 01930 g001
Figure 2. Flowchart of the energy scheduling algorithm for a building microgrid with rooftop greenhouse in islanded mode.
Energies 12 01930 g002
Figure 3. Energy balancing: (a) Electrical Energy; (b) Heat Energy; (c) Cooling Energy.
Energies 12 01930 g003
Figure 4. Environmental control of a building microgrid with rooftop greenhouse: (a) Temperature; (b) Humidity; (c) CO2 concentration; (d) Light intensity.
Energies 12 01930 g004
Figure 5. Equipment usage for environment control in a building microgrid with rooftop greenhouse: (a) Cooling pipe valve; (b) Fogging system; (c) CO2 generator; (d) Artificial light.
Energies 12 01930 g005
Figure 6. Energy balancing: (a) Electrical Energy; (b) Heat Energy; (c) Cooling Energy.
Energies 12 01930 g006
Figure 7. Environmental control of a building microgrid with rooftop greenhouse: (a) Temperature; (b) Humidity; (c) CO2 concentration; (d) Light intensity.
Energies 12 01930 g007
Figure 8. Equipment usage for environment control in a building microgrid with rooftop greenhouse: (a) Cooling pipe valve; (b) Fogging system; (c) CO2 generator; (d) Artificial light.
Energies 12 01930 g008
Figure 9. Energy balancing: (a) Electrical Energy; (b) Heat Energy; (c) Cooling Energy.
Energies 12 01930 g009
Figure 10. Environmental control of a building microgrid with rooftop greenhouse: (a) Temperature; (b) Humidity.
Energies 12 01930 g010
Figure 11. Energy balancing: (a) Electrical Energy; (b) Heat Energy; (c) Cooling Energy.
Energies 12 01930 g011
Figure 12. Environmental control of a building microgrid with rooftop greenhouse: (a) Temperature; (b) Humidity.
Energies 12 01930 g012
Figure 13. Equipment usage for environment control in a building microgrid with rooftop greenhouse: (a) Cooling pipe valve; (b) Fogging system.
Energies 12 01930 g013
Figure 14. Energy balancing: (a) Electrical Energy; (b) Heat Energy; (c) Cooling Energy.
Energies 12 01930 g014
Figure 15. Environmental control of a building microgrid with rooftop greenhouse: (a) Temperature; (b) Humidity.
Energies 12 01930 g015
Figure 16. Equipment usage for environment control in a building microgrid with rooftop greenhouse: (a) Cooling pipe valve; (b) Fogging system.
Energies 12 01930 g016
Figure 17. Energy balancing: (a) Electrical Energy; (b) Heat Energy; (c) Cooling Energy.
Energies 12 01930 g017
Figure 18. Environmental control of a building microgrid with rooftop greenhouse: (a) CO2 concentration; (b) Light intensity.
Energies 12 01930 g018
Figure 19. Equipment usage for environment control in a building microgrid with rooftop greenhouse: (a) CO2 generator; (b) Artificial light.
Energies 12 01930 g019
Table 1. Input parameters for energy supply facilities.
ParametersCost (KRW/kWh)Capacity (kW)COP/Ratio
CHP1301502
DG16080-
HOB1005001
Chiller206000.5
B_Chiller30500.5
EHP_Cooling-5003
Table 2. Thermal energy storage system (TESS) and battery energy storage system (BESS) parameters.
ParametersInitial (kW)Capacity (kW)Charging Loss (%)Discharging Loss (%)Loss Per Interval (%)
BESS105055-
TESS1000100--4
Table 3. Boundaries of control parameters in building the greenhouse.
Acceptable BoundaryBoundary 1Boundary 2
Temperature (℃)16–1914–2112–23
Humidity (%)65–8555–9545–100
CO2 (ppm)700–1000550–1150400–1300
Light Intensity (W/m2)>= 200100–2000–100
Table 4. Temperature control of each household in building.
CasesHousehold Number12345678910
Coming in going out timesDeparture time (h)81010128Outside all day
Arrival time (h)1920201813
Residents in homeMin. Temp. (°C)2121212121
Max. Temp. (°C)2222222222
Residents not in homeMin. Temp. (°C)20181819202018191919
Max. Temp. (°C)23232324242324232325
Table 5. Description and values of constants used in the problem formulation.
ConstantsDescriptionValue
a 1 Coefficient associated with the respiration of the crop−0.27
a 2 Coefficient associated with the respiration of the crop0.05
a 3 Conversion factor from (1/s) to (1/h)3600
a 4 Constant for converting to percentage100
a 5 Constant for saturated water vapor pressure1.7001
a 6 Constant for saturated water vapor pressure7.7835
a 7 Constant for saturated water vapor pressure1/17.0789
a 8 Constant for partial water vapor pressure0.6228
ρ a Density of air1.27
V g h Volume of greenhouse2048
A g h Area of greenhouse512
η s r Light transmission factor of greenhouse cover0.6
c r e s Respiration coefficient of crops1.224 e 3
c p h o t Photosynthesis coefficient of crops46.03 e 8
S H a Specific heat of air1.006
p a t m Atmospheric air pressure1013.25
w t r a n Crop evaporation125.8
Table 6. Temperature control of each household in building.
CasesHousehold Number12345678910
Residents in homeMin. Temp. (°C)2121212121Outside all day
Max. Temp. (°C)2222222222
Residents not in homeMin. Temp. (°C)20181819202018181919
Max. Temp. (°C)23212324242324242325
Table 7. Temperature control of each household in the building.
CasesHousehold Number12345678910
Residents at homeMin. Temp. (°C)2218202120Outside all day
Max. Temp. (°C)2322222424
Residents not at homeMin. Temp. (°C)22.1222.1222.1222.2522.252222222222
Max. Temp. (°C)3030303024.122324242325

