1. Introduction
Wind power is now a mainstream source of energy supply and will play a leading and significant role in de-carbonization of the world economy, while contributing to energy security [
1].
Currently, the total system installed generation capacity of Thailand is nearly 38 GW, to which nearly 4 GW of generation capacity is imported [
2]. In its planning, the Ministry of Energy of Thailand has targeted wind power generation to be 3002 MW by 2036, under the Alternative Energy Development Plan (AEDP) [
3,
4]. In order to promote wind power in the country, a feed-in-tariff (FIT) financial support scheme is used to ensure wind power project viability in areas with moderate wind resources. Furthermore, in special areas, such as remote areas and islands, where diesel power plants are operated, as well as in the southernmost region of Thailand, a premium FIT financial incentive is also provided to attract wind power project investments. The latest FIT and FIT premium for wind power is 6.06 and 0.5 THB/kWh or approximately 17 and 1.4 US cents/kWh, respectively.
The current total wind power installed capacity in Thailand is 754 MW [
4,
5], mainly distributed in the northeastern, the northern, and southern regions of Thailand. Wind power plants range from 6.9 to 103.5 MW, while the largest turbines currently installed in Thailand are 2.5 MW in nominal capacity.
Wind occurs due to pressure gradients that arise from temperature differences caused by unequal heating of the Earth’s surface. The general macroscale circulation results in the doldrums, situated in regions close to the Equator. Doldrums are characterized by calm prevailing winds and frequent showers, thunderstorms, as well as heavy rainfalls. The southernmost region of Thailand, located between 5.5° N and 7.0° N in the northern hemisphere, is characterized by wind speeds ranging from 8.0 m/s in the monsoon periods to a comforting breeze of 3.0 m/s at other periods of the year [
6].
Winds over large areas can be simulated using various mesoscale atmospheric models. Wind resource assessments, an important initial step in wind power development, provide information on the wind resource and identifies areas of optimum winds for the installation of wind power plants.
Using a Regional Atmospheric Modeling System (RAMS) model and the National Centers for Environmental Prediction/National Center for Atmospheric Research (NCEP/NCAR) reanalysis database for 2009–11 as the input climatology data, Waewsak et al. [
7] presented a low-resolution (9 km) wind atlas of Thailand. While the results showed that the territory had promising potential for wind power development, the low-resolution modeling has shown limitations in the analysis of the results.
The Mesoscale Compressible Community (MC2) atmospheric model has also been extensively used in various wind resource assessments. Notably, Waewsak et al. [
8] presented a high-resolution wind atlas for Nakhon Si Thammarat and Songkhla provinces in Southern Thailand by combining the MC2 mesoscale model with the MsMicro microscale modeling techniques. Beyond validating the concept of a mesoscale-microscale approach, the 200 m resolution wind maps identified the technical power potential for the area studied.
Using a similar approach, Waewsak et al. [
9] performed similar assessments, but for an offshore area. More specifically, the wind resource of the Gulf of Thailand was assessed using a similar coupled mesoscale-microscale modeling technique to quantify the technical power potential and the annual energy potential for offshore applications. Finally, Waewsak et al. [
10] applied the methodology for a limited area, an application to the detailed study, including an economic feasibility assessment, of an area identified to establish a wind power plant in Thailand.
Janjai et al. [
11] used a low-resolution atmospheric mesoscale model, namely the Karlsruhe Atmospheric Mesoscale Model (KAMM), to simulate wind speeds and wind directions in Thailand. The results showed that the territory has a limited wind resource, thus confirming that high-resolution wind resource assessment should be performed to identify potential locations to develop wind power plants.
For their part, Giannaros et al. [
12] presented an evaluation of the Weather Research and Forecasting (WRF) model using an assessment of the wind resource over Greece. The evaluation showed that the model provides satisfactory performance, while it nonetheless overestimated weak winds, and underestimated strong winds. Also using the WRF model, De Meji et al. [
13] studied the wind resource of Palestine, showing the limited wind resource of the territory to install wind power plants.
Also of interest is the work by Zhou et al. [
14] who estimated the technical potential of the onshore wind energy resources of Jiangsu province, China. The assessment of wind energy resource potential was based on the meteorological data period time as 1979–2008 from the China Meteorological Data Sharing Service System, land-use map and Chinese map from the Institute of Geographic and Natural Resource Research, Chinese Academy of Science. The result of the study showed that the eastern coastal areas of Jiangsu had a great wind energy resource as annual wind power density was more than 200 W/m
2. The annual energy production by wind power plants was 146,336 GWh in Jiangsu province.
Other approaches than numerical modeling have been used to assess the wind resource over a territory. For example, Oh et al. [
15] assessed the wind resource around the Korean peninsula by extrapolating wind speeds using marine buoy data at 4 m above mean sea level to a height of 80 m above mean sea level in order to study the feasibility of a 100 MW offshore wind power project. Also, Karagali et al. [
16] used QuickSCAT satellite image processing to assess the offshore wind resource in the northern European Sea.
Once potential areas are identified from the mesoscale wind maps, microscale wind resource mapping, with higher resolution, are further developed. The output of the mesoscale modeling, i.e., 1-year wind speed and wind direction data, at a standard wind turbine hub height, are used as the input data for microscale modeling over the target area for microscale wind resource mapping and, eventually, wind turbine generator siting.
For the microscale wind resource mapping, the coupled mesoscale atmospheric modeling, along with the long-term reanalysis climatic database, and microscale wind flow modeling are accomplished to develop high-resolution wind resource maps. Then, the surface areas with sufficient wind resource for power generation are analyzed and a yield assessment is performed for typical wind turbine generators in order to determine the estimated annual energy production from eventual wind power plants.
Consequently, this paper aims to assess the wind resource over the southernmost region of Thailand, where the Royal Thai Government wants to develop wind power generation using an FIT and FIT premium scheme. The Weather Research and Forecasting (WRF) mesoscale atmospheric modeling, along with the Modern-Era Retrospective Analysis for Research and Applications (MERRA) long-term reanalysis climatic database, and microscale computational fluid dynamics (CFD) wind flow modeling are used to generate wind resource maps at elevations corresponding to hub heights of current wind turbine generators, i.e., 80 m, 100 m, 120 m, and 140 m agl. The characteristics of the wind speeds and wind directions in the study area, i.e., wind speed profile, Weibull distribution, wind rise, and turbulence intensity (TI), are investigated to better understand the behavior and the inherent nature of the wind resource for the appropriate wind turbine generator selection process. The potential areas for wind power development are identified and the technical power potential (TPP) is analyzed for short- and medium-term planning of wind power development. The annual energy production and CO2eq emission avoidance are also investigated in this work.
2. Materials and Methods
2.1. Study Area
The study area is in the southernmost region of Thailand, which is comprised of three provinces, i.e., Pattani, Yala, and Narathiwat provinces, along with four districts (Chana, Nathawi, Sabayoi, and Thepa) of Songkhla province. The total area of the region studied, situated in a narrow peninsula, is 13,968 km
2 [
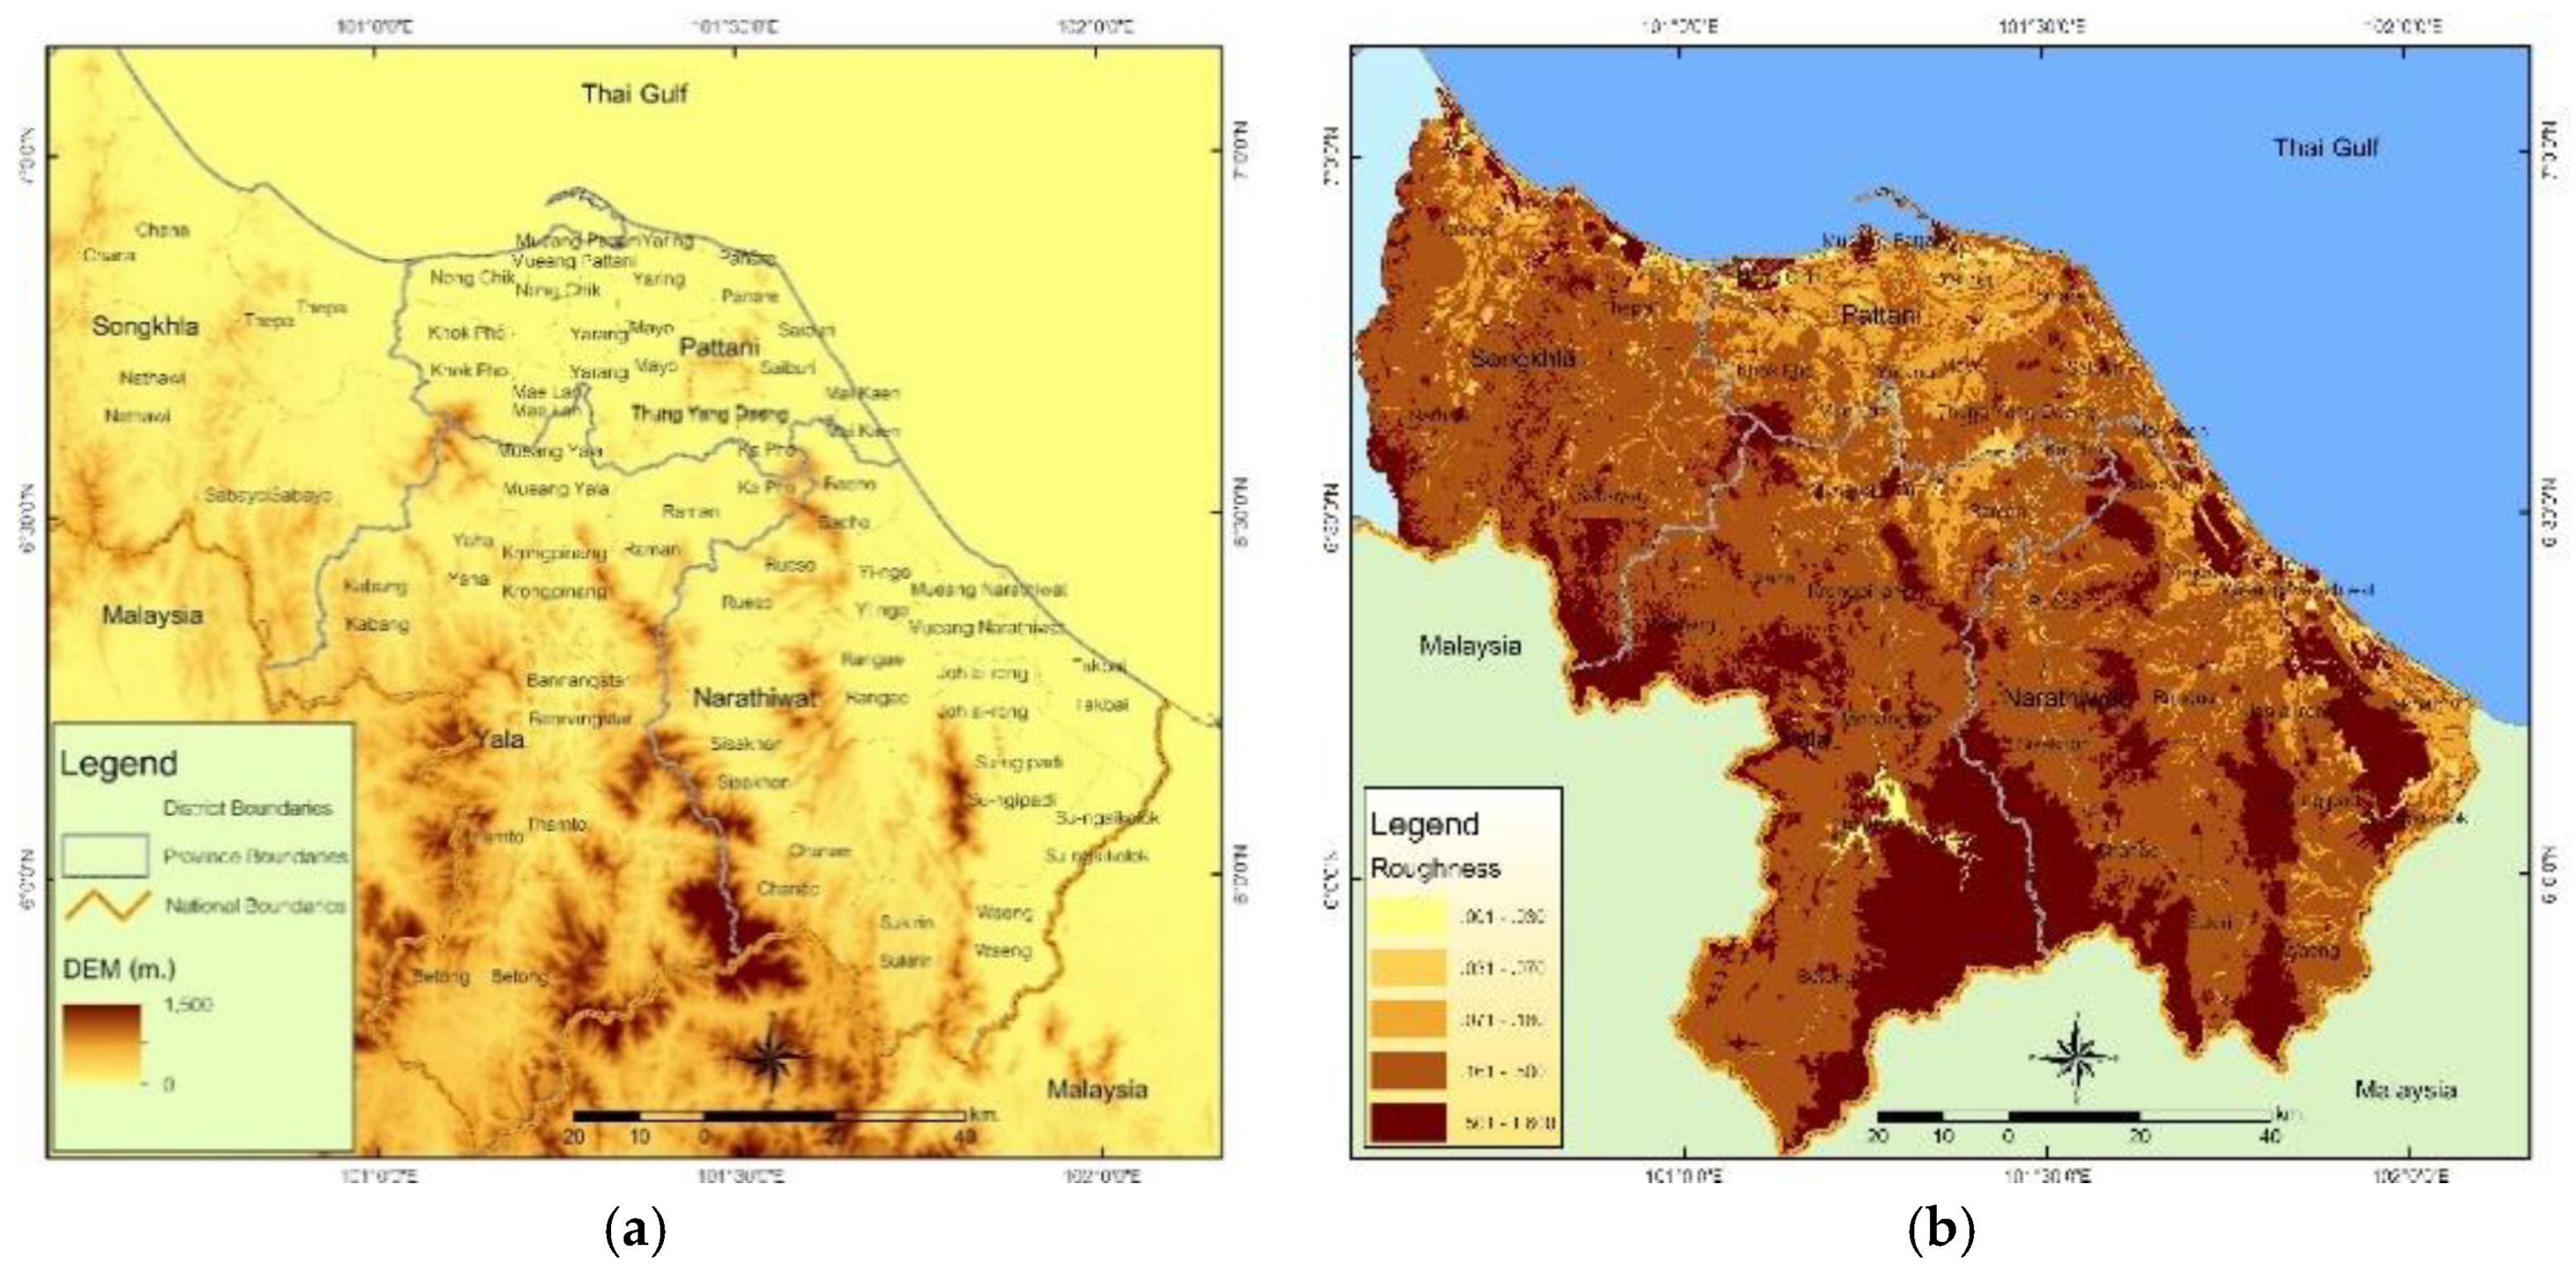
17]. The topography of the study area is flat terrain, along the coast of the Gulf of Thailand, while the terrain evolves towards complex terrains in the border area near Malaysia where the San Kala Khiri Mountains exist, as shown in
Figure 1a. The highest elevation is 1500 m above mean sea level at the mountain top of San Kala Khiri [
18], while the surface roughness of the study area is in the range of 0.0 to 1.6 m (
Figure 1b) [
17]. The area with high surface roughness is mainly due to Pará rubberwood plantations and forests in the mountainous area.
2.2. Mesoscale Atmospheric Modeling
Wind speeds over the large scale territory are predicted based on the WRF atmospheric modeling, along with the MERRA reanalysis climatic database (3TIER, Vaisala Energy [
19]).
MERRA is a reanalysis database, provided by NASA, based on satellite observations using the new version of the Goddard Earth Observing System Data Assimilation System Version 5 (GEOS-5) [
20]. The spatial resolution is 5 km and the dataset was created using a 10-year numerical weather prediction (NWP) model run.
3TIERs NWP models use numerical methods to obtain approximate solutions to mathematical equations that describe the physics and the dynamics of the atmosphere. To solve these equations for different locations in the study area, the atmosphere is divided into many small elements, both horizontally and vertically. The model computes the physical dynamics within each model element and how much mass, energy, and momentum are exchanged between the model elements. The final wind dataset is wind speeds and wind directions, as well as temperature, at a typical elevation, i.e., 120 m agl, at each centroid of all smaller grid cells.
To assess the quality of the dataset provided by 3TIERs global wind dataset, wind speeds were compared with publicly available wind speed observations from independent data sources, i.e., the National Centers for Environmental Prediction (NCEP) Automated Data Processing (ADP) surface observations dataset. The NCEP-ADP wind speeds were compared with wind speeds from 3TIERs global wind speed dataset at an elevation of 10 m agl. In the final comparison with actual NCEP-ADP direct observations, the annual mean wind speeds provided by 3TIERs global dataset have a difference of less than 0.5 m/s for 50% of the stations and a difference of less than 1.0 m/s for 78% of the stations. The overall bias is +0.05 m/s relative to NCEP-ADP observations, and the root mean square error (RMSE) is 0.93 m/s [
21,
22].
The obtained time series wind speed dataset at particular points of interest, especially in the centroid point of each smaller grid cell, was considered as the wind speed dataset that represents a virtual met mast (VMM), at an elevation of 120 m agl. The wind speed and wind direction dataset obtained from the VMM were used as the main input for the CFD microscale flow modeling to compute the wind speeds and wind directions near the ground, normally at hub heights of standard wind turbine generators, i.e., 80 to 140 m agl, and thus we were able to perform a yield assessment of any particular wind turbine generators available on the market to eventually do the micro-siting of wind power plants.
2.3. Microscale Computational Fluid Dynamics Wind Flow Modeling
CFD wind flow models, based on the potential wind flow theory, are widely used for the development and the design of wind power plants. These models have high computational requirements when compared to linearized wind flow models [
23]. The application of CFD wind flow models for wind resource assessment is performed by solving the Reynolds-averaged Navier–Stokes (RANS) equations with turbulence closure, where the turbulence model most commonly used are the k-epsilon and k-omega models [
24,
25].
This paper applied a CFD wind flow model to solve the RANS equations for incompressible flow, along with the k-epsilon turbulence model. The turbulence closure was obtained by relating the Reynolds stresses to the mean velocity through turbulent viscosity [
26].
The CFD-based wind flow model developed by WindSim AS [
27] was applied, along with the time series wind data obtained from 3TIERs global dataset at the centroid point for each smaller grid cell (the Virtual Machine Management Service (VMMs)); the Global Digital Elevation Model (GDEM) obtained via the Royal Thai Survey Department [
18]; and the high resolution land-use digital data obtained from the Land Development Department (LDD) [
17] in order to create the high resolution wind resource map with 50 m resolution (50 m × 50 m).
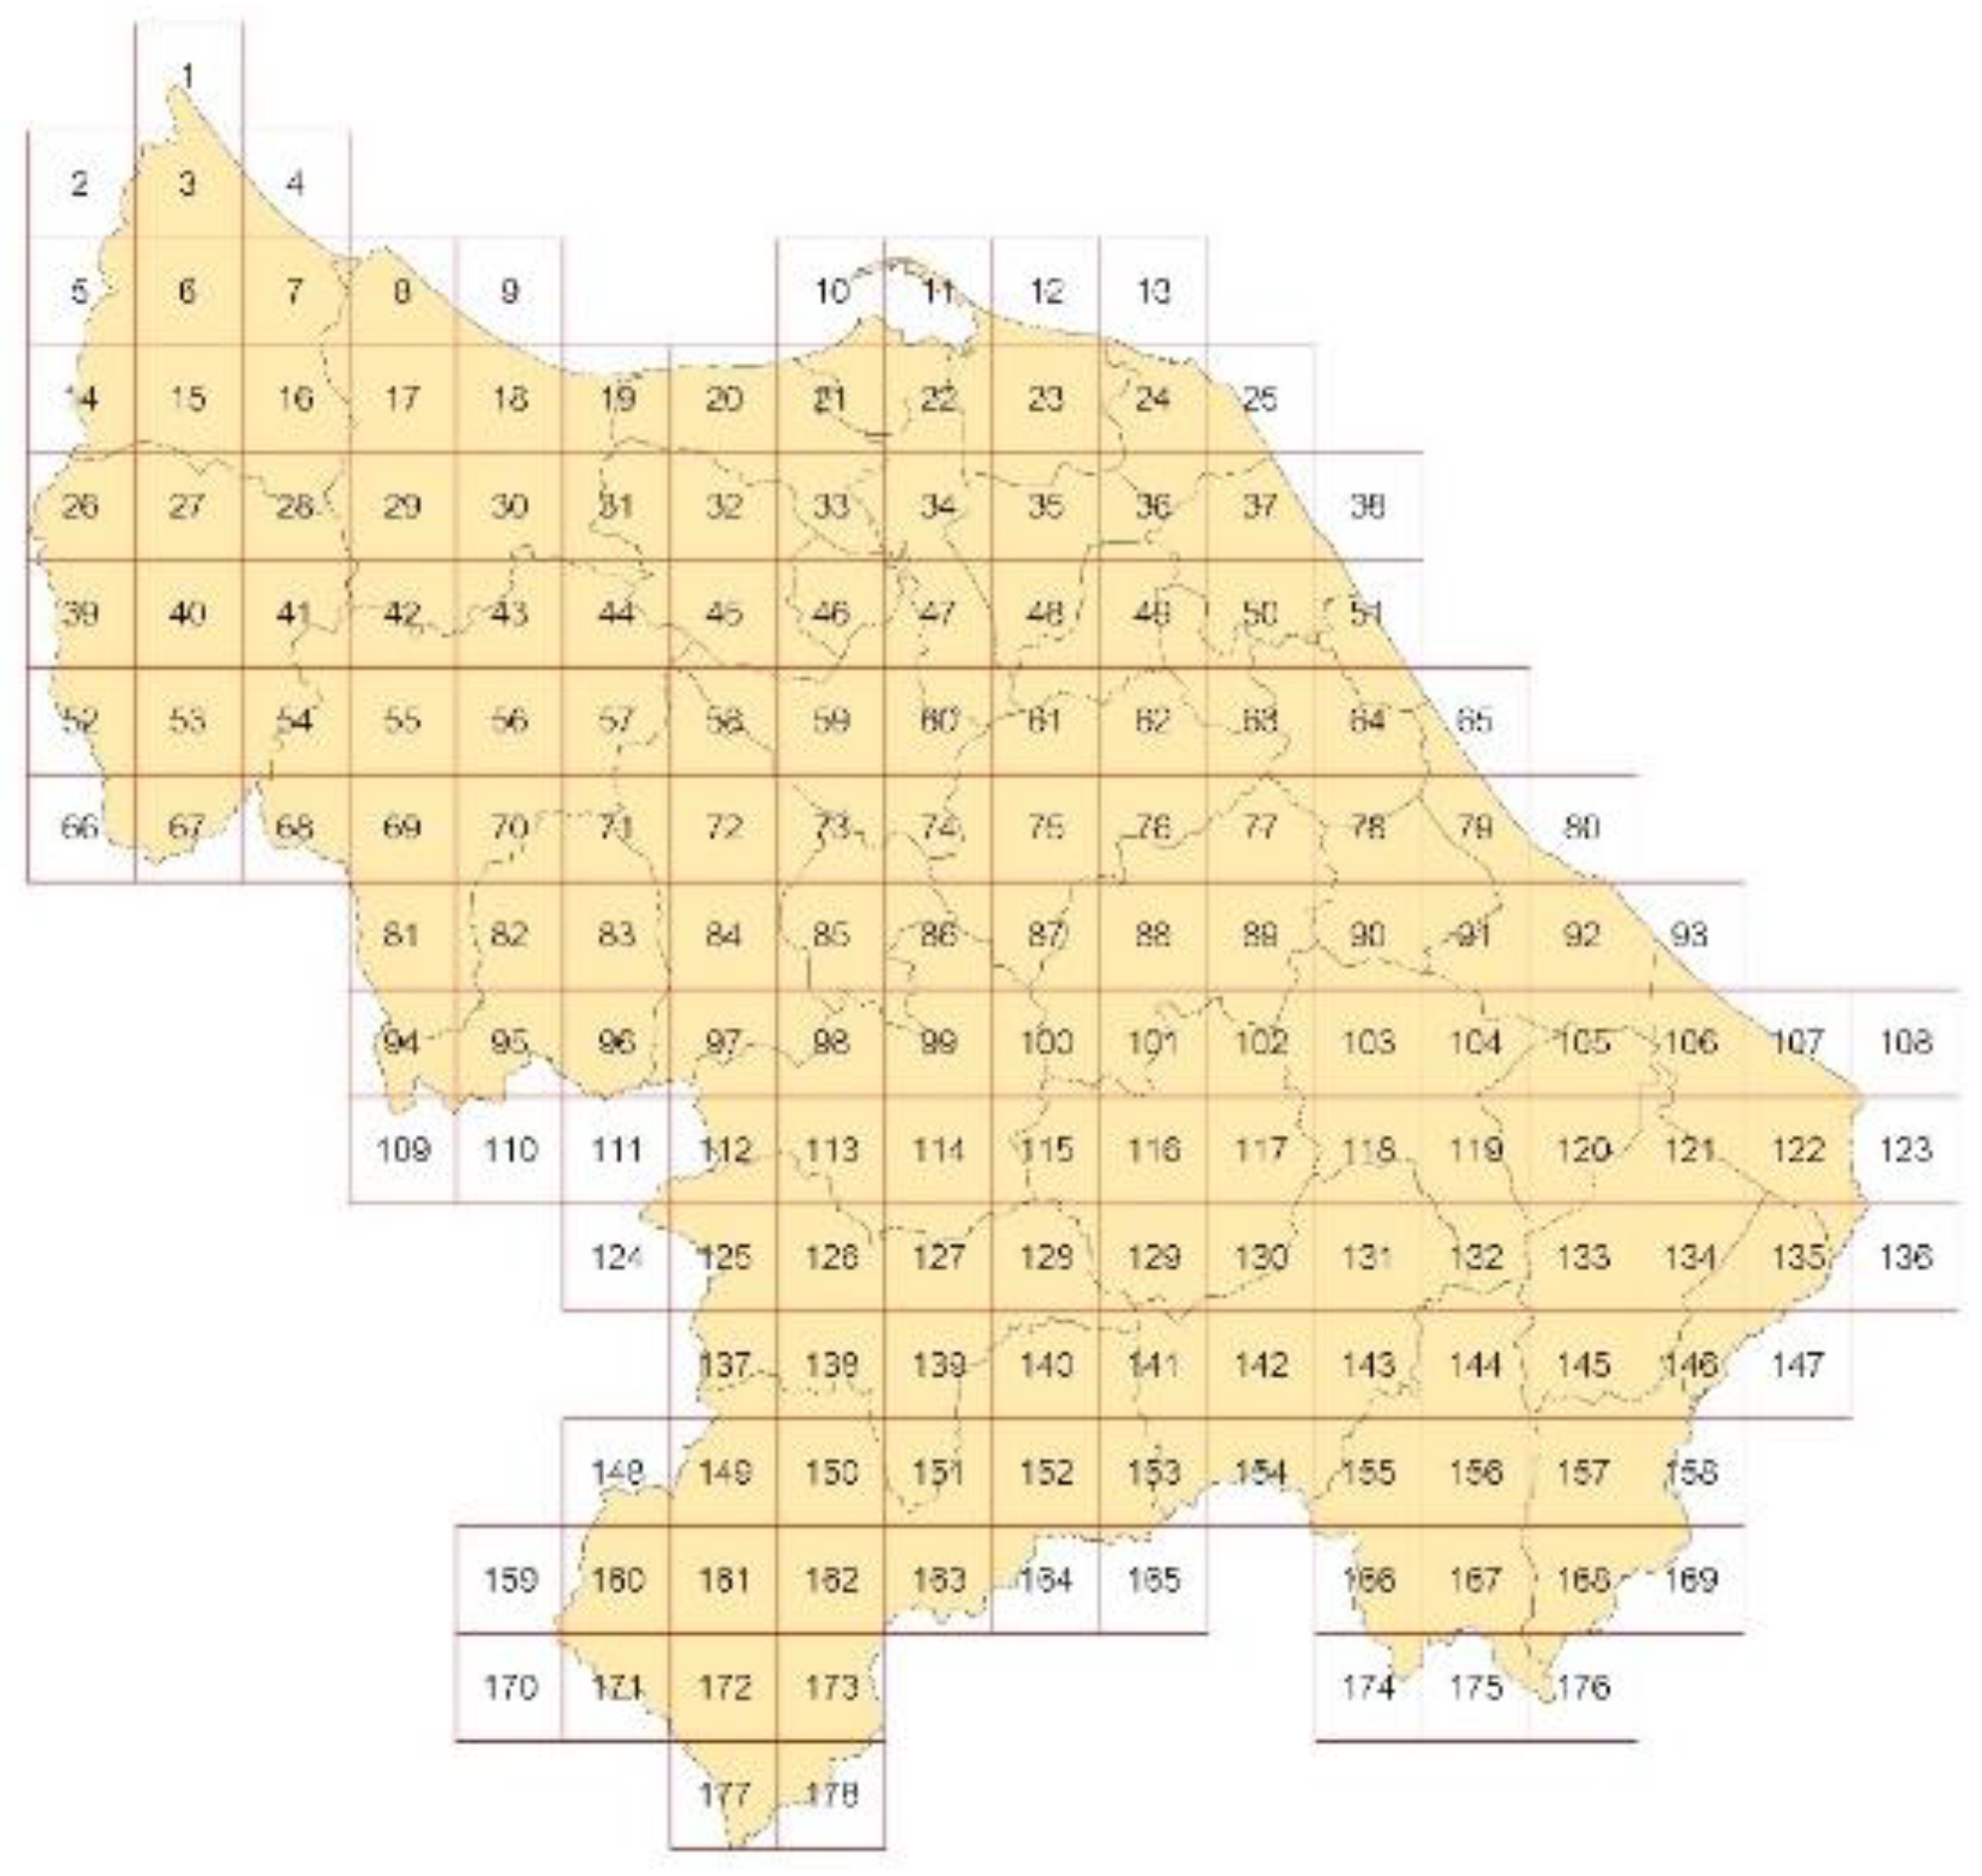
Figure 2 shows the 178 mesoscale grid cells, with dimensions of 10 × 10 km
2, over the territory of the study area used in the microscale CFD wind flow modeling.
The CFD-based wind flow modeling is needed to transfer the macroscale wind speed distribution at the VMM to any other position within the smaller grid cells and thereby obtain high-resolution wind speed maps at various elevations for any position within the wind power relevant volume of the atmosphere above the territory studied.
The local wind field near the ground is affected by the terrain [
28,
29]. Terrain data was used to establish a domain where the RANS equations would be numerically solved. Twelve RANS simulations were performed in order to have a 3D wind field for every wind direction under neutral conditions. Finally, 50 m resolution microscale wind resource maps, at various elevations agl, were created and were used to prepare the wind atlas and assess the wind resource for wind power generation.
Grid-independence tests for flat, semi-complex, and complex terrains were executed in the optimization of the computer simulations. The grid resolutions of 200 m, 100 m, 50 m, and 25 m were chosen in the testing for all terrain features. Grid independence and CFD microscale wind flow modeling were executed using a high-performance personal computer with the following specifications: processor Intel® Core(TM) i7-6700K CPU @ 4.00 GHz, and installed memory (RAM) 32.0 GB. The condition in execution was a single core computation. The grid independence tests confirmed that the 50 m resolution was the most appropriate resolution and is chosen in the CFD wind flow modeling for the wind speed predictions and the wind resource mapping.
2.4. High-Resolution Wind Resource Maps and Validation
The 178 microscale wind resource map files were processed using Arc GIS 10.2 tool for the smoothening process, along with a spatial analysis based on the inverse distance weighting (IDW) interpolation technique [
30], which is a type of deterministic method for multivariate interpolation with a known scattered set of points. The assigned values to unknown points were calculated with a weighted average of the values available at the known points. Finally, the high-resolution wind resource maps at elevations of 80 m, 100 m, 120 m, and 140 m agl were generated.
Moreover, the wind resource maps at 80 m, 100 m, 120 m, and 140 m agl were classified using the International Electrotechnical Commission (IEC) wind turbine generator classification (IEC 61400-1) [
31], namely Class I high winds (10 m/s), Class II medium winds (8.5 m/s), Class III low winds (7.5 m/s), and Class IV (6.0 m/s) in order to identify the suitable areas for wind turbine generator installations.
There was only one single IEC standard 120 m met tower installed in the Thepa district, Songkhla province, with the coordinates of 6.89° N latitude and 100.91° E longitude (
Figure 1). Wind speeds were measured at 20 m, 80 m, 90 m, 100 m, 110 m, and 120 m agl, while wind directions were measured at 20 m, 80 m, 100 m, and 120 m agl. Calibrated three-cup anemometers model RNRG #40C and calibrated wind vanes model RNRG #200P were used to measure and monitor the wind speed and the wind direction as a function of time. These sensors were connected to a Nomad II wind data logger (Vaisala Nomad
® 2 Wind, Vaisala SAA, Paris, France), with 10 min logging interval data collection. The measurement campaign was executed from August 2014 to July 2015, inclusively, thus covering a full annual cycle of the climate. The Weibull distribution and the wind rose of the measured wind speeds and wind directions were analyzed based on 1 m/s wind speed intervals for the Weibull distribution and 16 sectorwise, or 22.5 degree, wind roses. The vertical wind speed profile was also analyzed using the power and log laws to describe the vertical wind shear characteristics. By using the measured data and based on the power law wind speed profile, a power exponent of 0.298 is obtained. On the other hand, for the log law wind speed profile, surface roughness of 1.53 m was used in the analysis.
Time series of the hourly and daily wind speeds for the whole year, along with the annual mean wind speeds at 80 m, 100 m, and 120 m agl were analyzed. Furthermore, to describe the characteristics of the wind speed in each period of the year where the wind speed was affected by the northeast and the southwest monsoons, time series wind speeds at 80 m, 100 m, and 120 m agl were analyzed for the summer (February–May), and the light (May–October) and heavy (October– February) rainy seasons.
Because of its intermittent nature, wind fluctuations exhibit a wide spectrum of time-scales, from seconds to years, thus covering very short intervals in the turbulence scale, to hourly, daily, seasonal and annual cycle variations. The benefit of investigating the variability of the wind over a territory is useful not only in the feasibility study phase of wind power plants but also for the wind power prediction and the control of wind turbines in the operational phase of wind power plants.
The turbulence intensity (TI), defined by the ratio of the standard deviation and the mean speed of the measured wind speeds [
32], was also a key parameter that will be used as one of the main criteria for an appropriate wind turbine generator selection in wind power plant development. The TI of the wind speed relates to the fatigue load of a wind turbine generator in operation. In this work, the TI of measured wind speeds at 80 m, 100 m, and 120 m agl are analyzed and presented. The monthly mean TI and the relationship between TI and wind speed are illustrated.
The wind resource maps at 80 m, 100 m, and 120 m agl were validated by comparing with the annual mean speeds measured at the IEC standard 120 m met tower. The absolute error and the percentage relative errors are analyzed and presented.
2.5. Estimation of Output Parameters
The wind resource maps at elevations of 80 m, 100 m, 120 m, and 140 m agl were used to analyze the technical power potential (TPP). The TPP is computed using the 5D × 7D turbine spacing, where D is the total diameter of the rotor of the wind turbine used in the modeling.
The wind resource maps at typical hub heights of current modern wind turbine generators, i.e., 120 m agl, was used in the estimation of the annual energy production (AEP). Based on a capacity factor of 25.5%, as recommended by the National Renewable Energy Laboratory (NREL) [
33], the AEP was estimated at each wind turbine generator that fits within the area considered for wind power development.
Finally, the greenhouse gas emission avoidance was estimated using an emission conversion factor of 0.5661 tonnes CO
2eq/MWh of electricity generated from wind turbines [
34].
3. Results
Figure 3 shows the time series of the measured wind speeds by the 120 m met tower in the Thepa district at elevations of 80 m, 100 m, and 120 m agl, respectively, for various periods of time, in hourly, daily and annual averages. The figure shows the hourly and daily measured wind speeds, along with the annual mean wind speed, at 80 m, 100 m, and 120 m agl over the 1-year period of measurements (August 2014 to July 2015). It can be seen that the measured wind speed varies in the range of 0 to 15 m/s. The annual mean wind speeds at 80 m, 100 m, and 120 m agl are 4.5, 4.7, and 4.9 m/s, respectively.
Figure 3 also shows the time series of the measured hourly, daily, seasonal, and annual mean wind speeds: summer period (February–May); and rainy period, classified into two sub-seasons, i.e., the light rainy season (May–October), and the heavy rainy monsoon season (October–February). It can be seen that the wind speeds in the summer period and heavy rainy monsoon sub-season are higher than in the light rainy season. The seasonal mean wind speeds at 80 m, 100 m, and 120 m agl are 5.1, 5.3, and 5.5 m/s, respectively, in the summer; while they are 3.6, 3.8, and 3.9 m/s, respectively, in the light rainy season and they are 5.0, 5.3, and 5.5 m/s, respectively, in the heavy rainy monsoon season. It can be pointed out that the seasonal mean wind speed in the light rainy season (May– October) is less than the annual mean wind speed. On the other hand, the seasonal mean wind speed in the summer season (February–May) and in the heavy rainy monsoon season (October–February) are higher than the annual mean wind speed, and both periods are characterized by strong fluctuations in the wind speed.
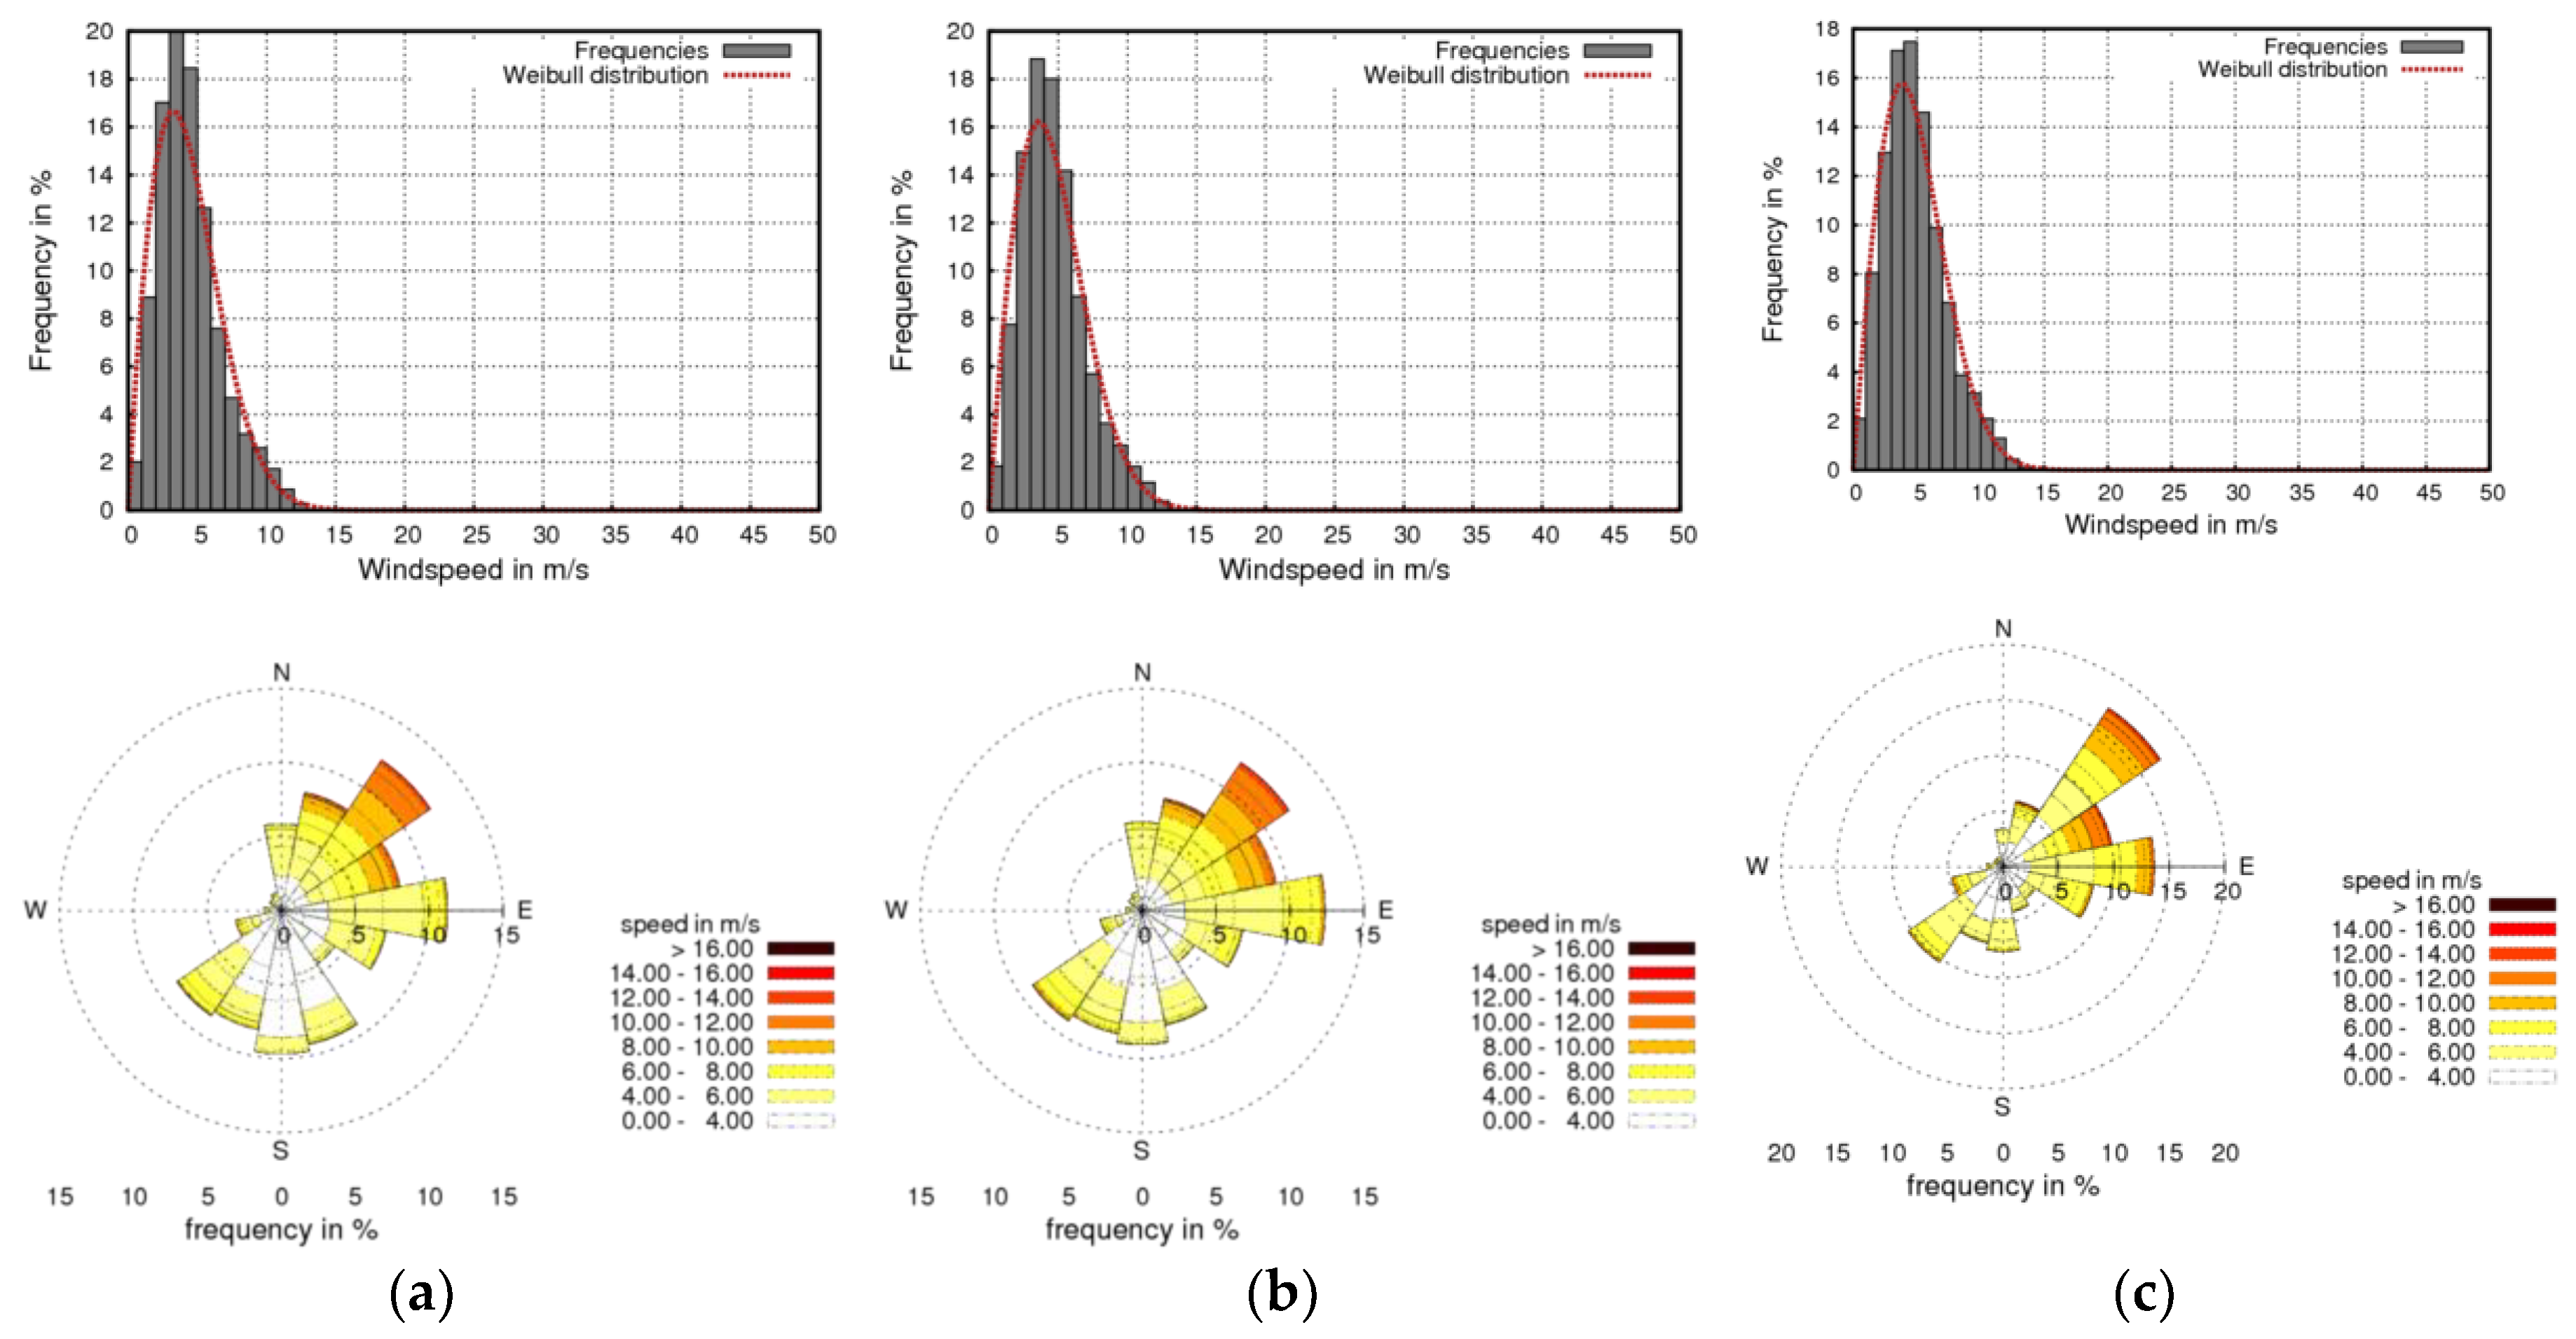
Figure 4 shows the Weibull distributions and the wind roses of the 1-year (August 2014–July 2015) measured wind speeds and wind directions at 80 m, 100 m, and 120 m agl. Results show that the Weibull shape parameter is in the range of 1.86 to 1.94, while the Weibull scale parameter is in the range of 5.2 to 5.6 m/s, corresponding to mean wind speeds in the range of 4.7 to 5.0 m/s. Results further show that wind power density is in the range of 122 to 144 W/m
2.
Results from the wind roses clearly show the dominant wind directions, notably from the northeast direction during the northeast monsoon period (October–February) and the southwest monsoon period (June–September).
Figure 5 shows the vertical wind profiles of the measured wind speeds by the 120 m met tower installed in the Thepa district, at 20 m, 80 m, 90 m, 100 m, 110 m, and 120 m agl, along with curves fitted with the power and log laws. It can be seen that the wind speeds at elevations of 110–120 m agl do not increase significantly. Moreover, it appears that the power law is the appropriate model to describe the behavior of the wind speed profile in the coastal region of the territory studied.
Figure 6 shows the monthly and the annual mean turbulence intensity (TI) of the measured wind speeds at elevations of 80 m, 100 m, and 120 m agl. It is found that the annual mean TI at 80 m, 100 m, and 120 m agl are 10.1%, 9.0%, and 8.5%, respectively. Results show that the period of December to April (corresponding essentially to the summer period) is characterized by lower fluctuations in the wind speed. The TI parameter is needed in the selection of the appropriate wind turbine generator for installation under the IEC wind classification standard. Based on the TI analysis of the site, it can be concluded that the TI is less than 13% for year-round.
Figure 7 shows the relationship between the TI and the wind speed in the form of scatter and line plots of the measured data. It is found that higher wind speeds induce lower TI. Thus, the high TI originates at lower wind speeds, especially lower than 3.0 m/s, which is the cut-in speed of most current wind turbine generators.
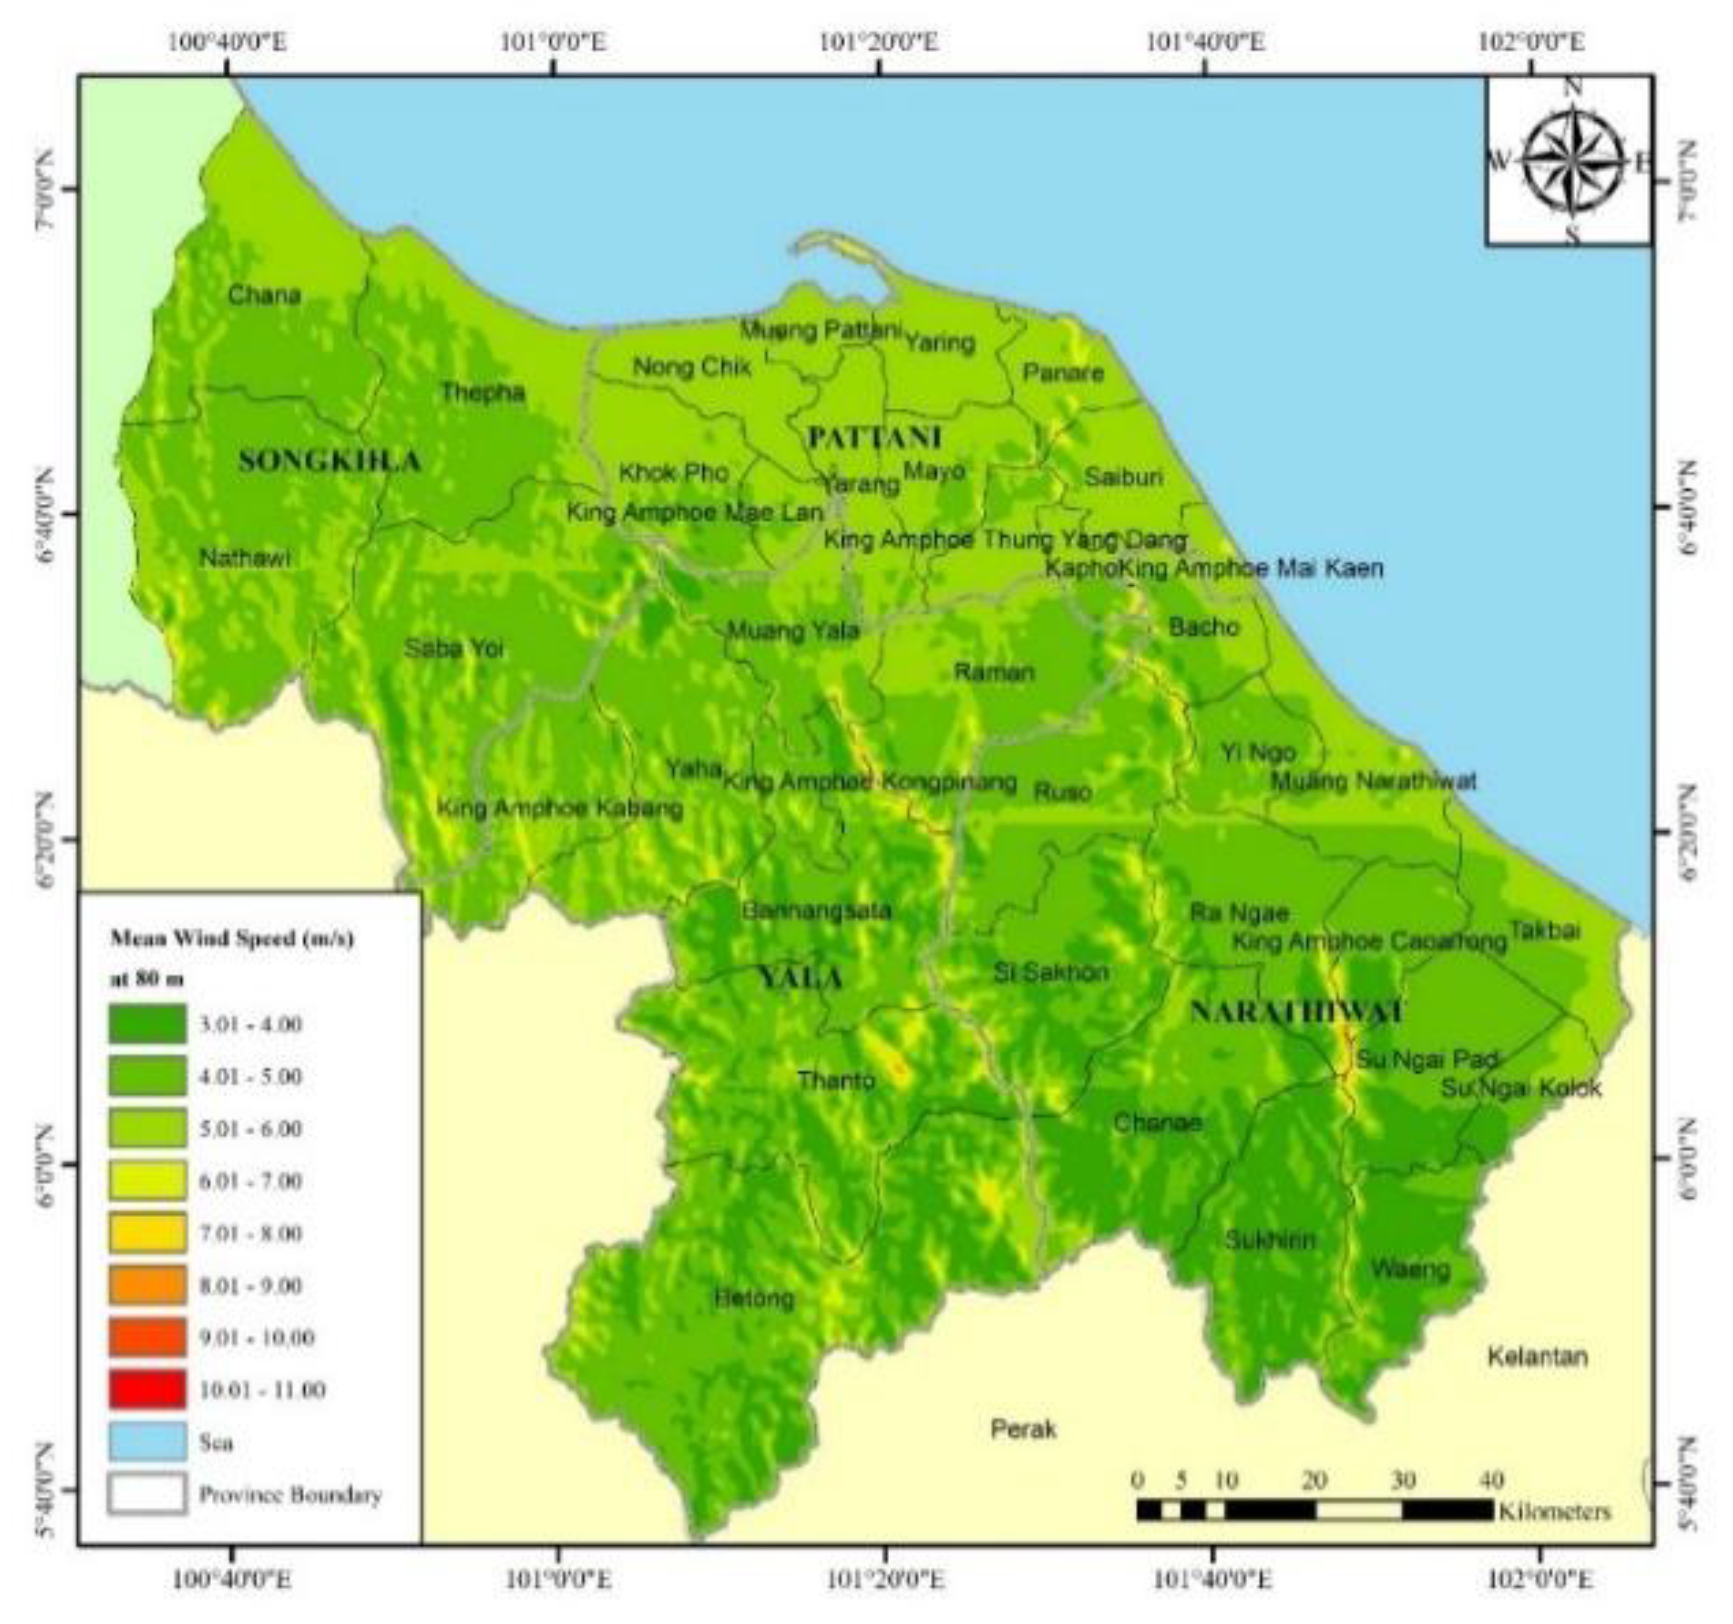
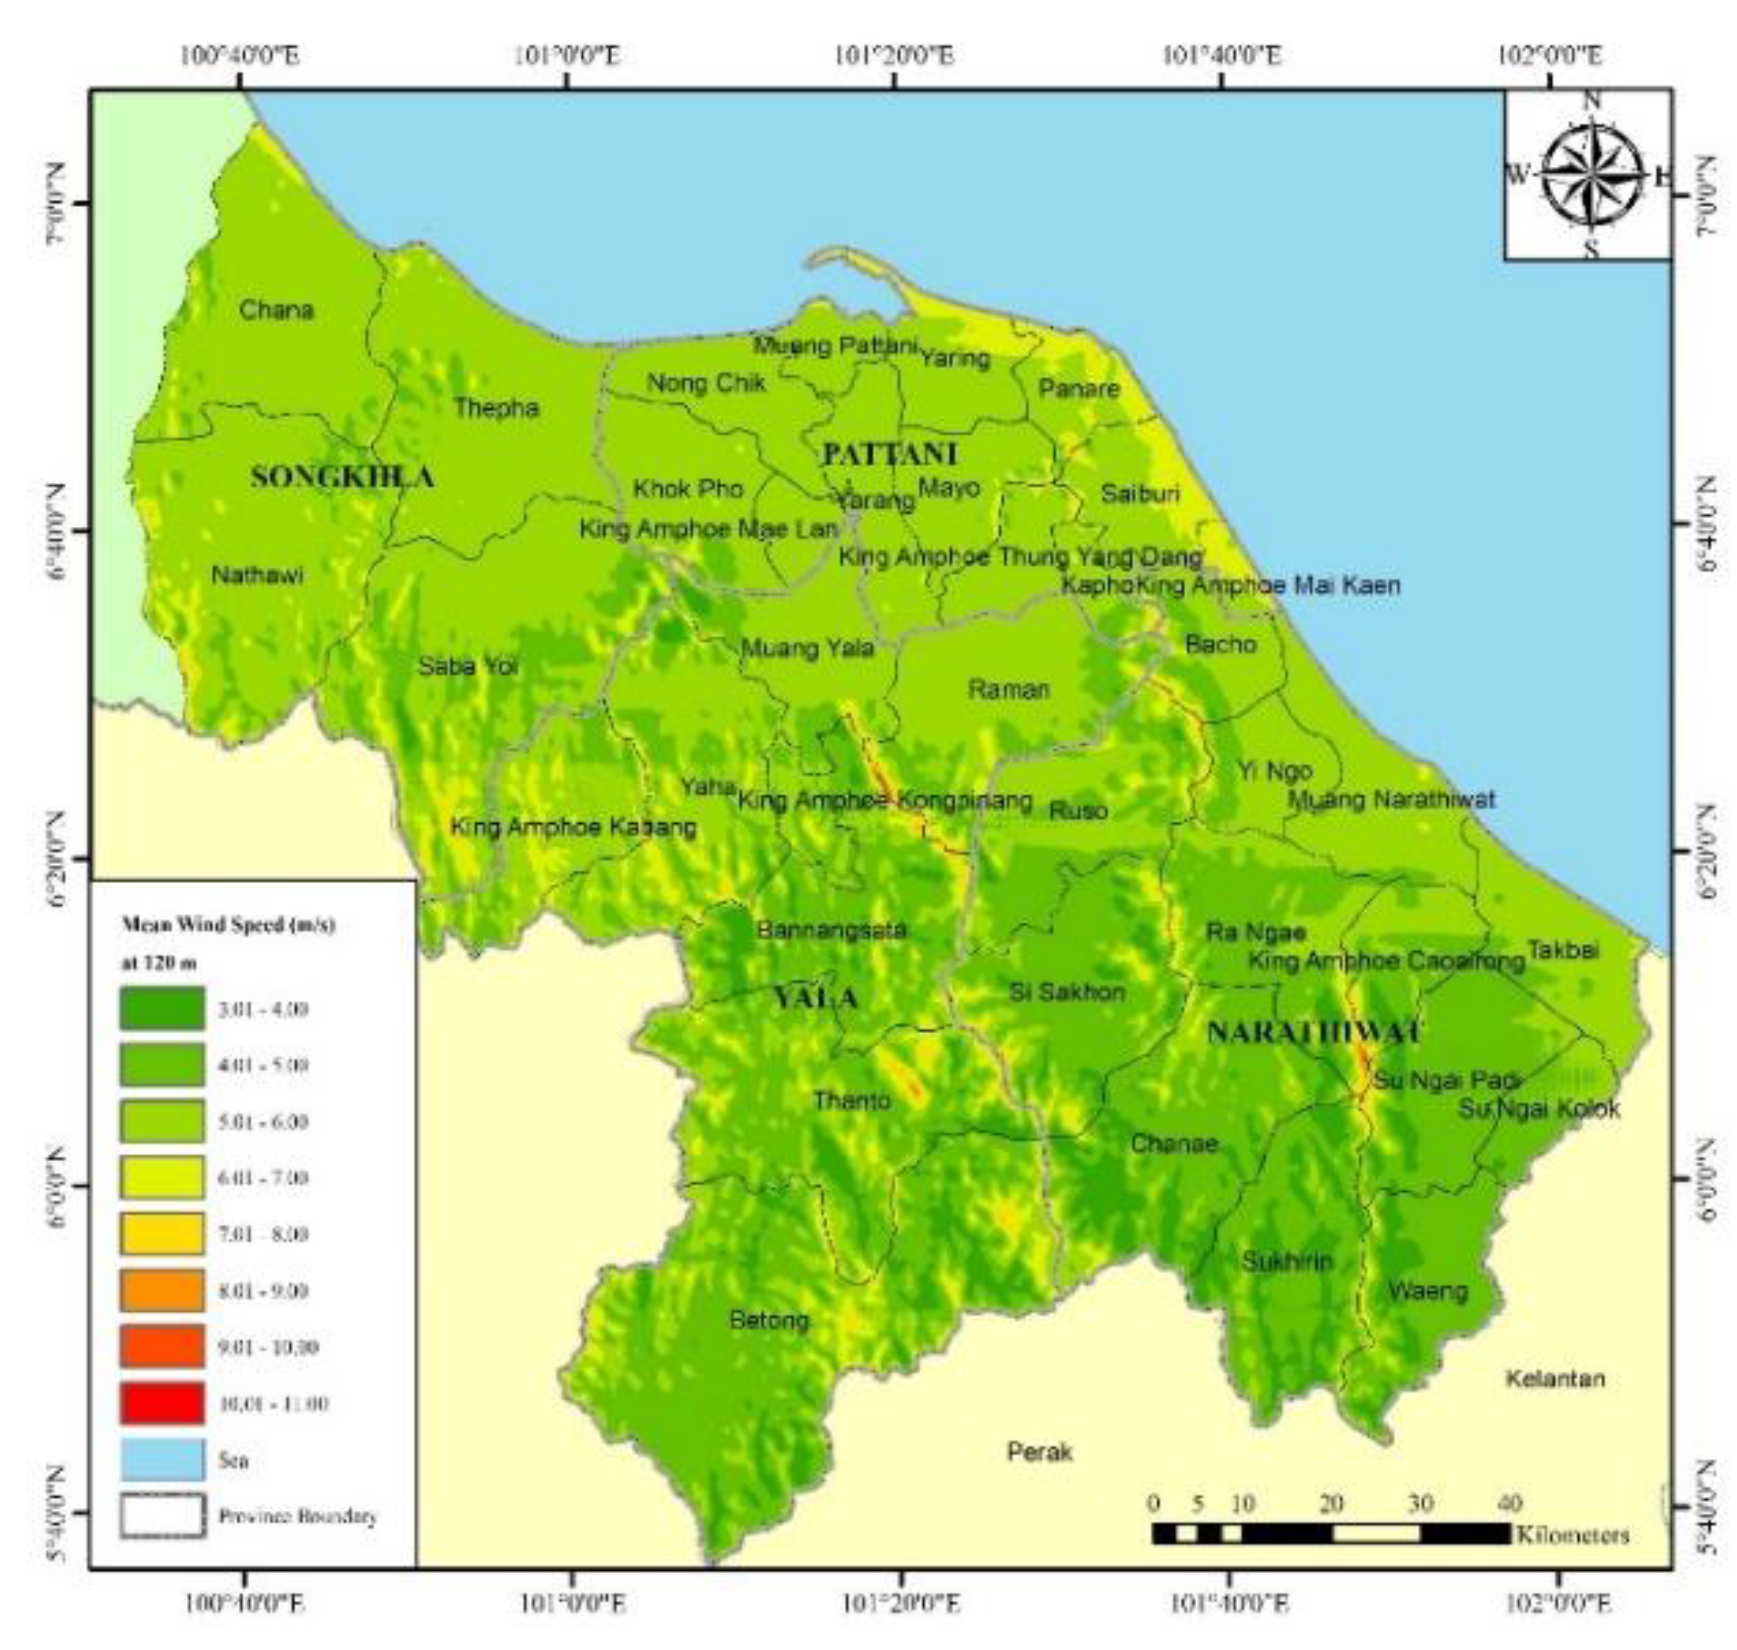
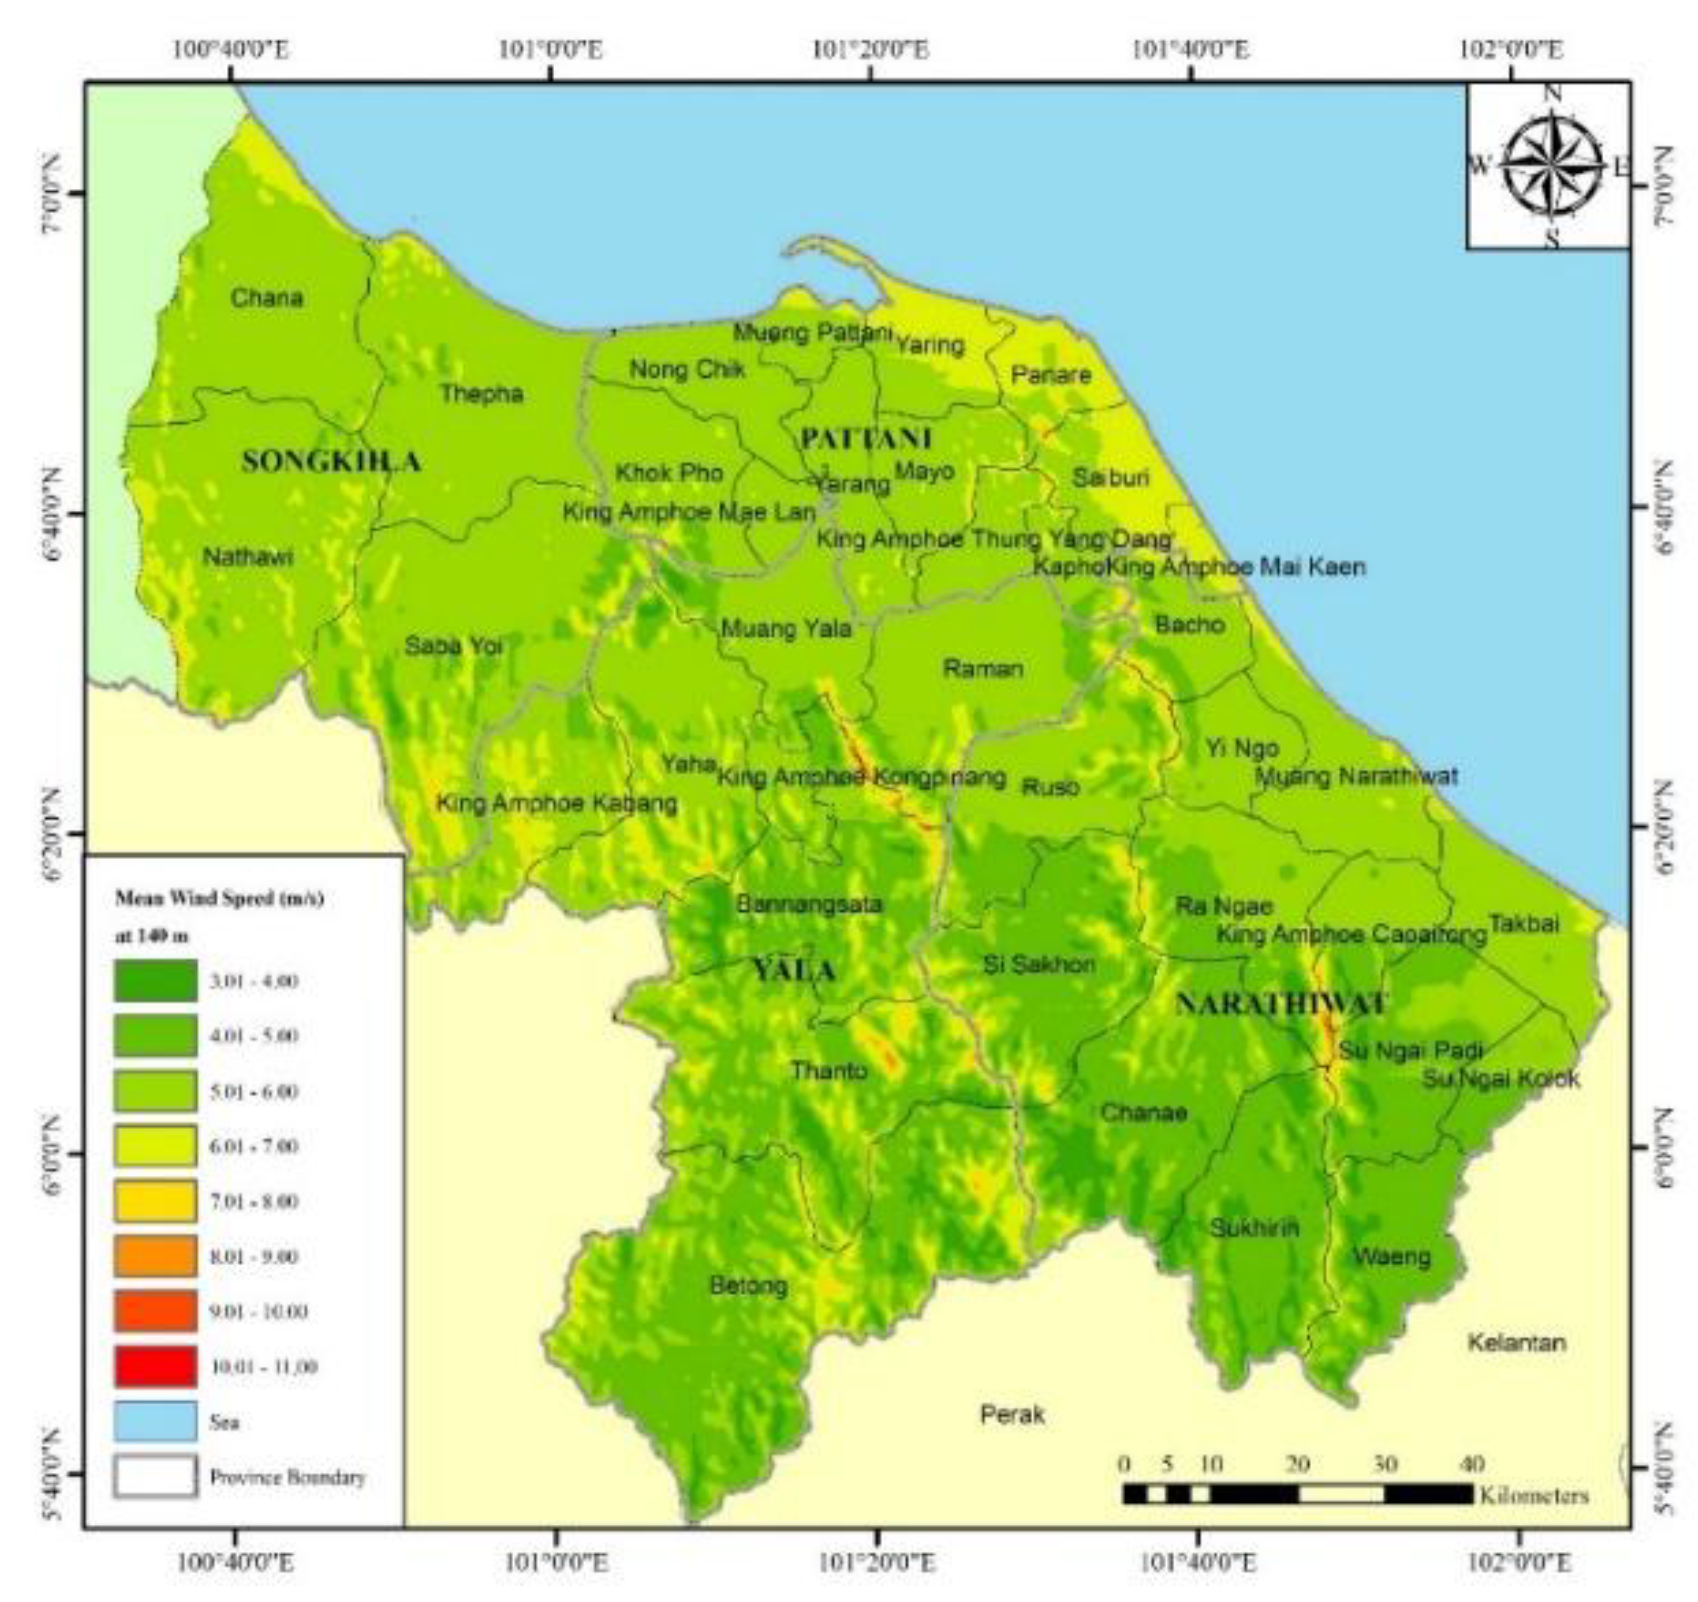
Results from the WRF atmospheric modeling, along with the MERRA reanalysis climatic database between 1981 and 2010, and the CFD wind flow modeling reveal that the wind resource in the southernmost region of Thailand is in the range of 3.0 to 11.0 m/s at 80 to 140 m agl, as illustrated in
Figure 8,
Figure 9,
Figure 10 and
Figure 11.
It can be observed from these four wind resource maps that the areas with higher potential wind resources are found in two major territories. The mountainous areas in Yala and Narathiwat provinces have the best wind resource in the region, notably on the crest of mountain ranges, where the annual mean speed was in the range of 6.0 to 11.0 m/s at 80 to 140 m agl. For its part, the terrain along the coastal line and the flat areas of Pattani province has a wind resource that could be developed, but with low-speed wind turbines. Indeed, for the coastal line and the flat areas Pattani province, the annual mean wind speeds are in the range of 5.0 to 7.0 m/s at 120 to 140 m agl.
While not having the best wind resource in the region, the terrain along the coastal line and the flat areas of Pattani province offers the most promising area for wind power development in the southernmost region of Thailand, rather than the mountainous areas which have more constraints in terms of access, installation of wind turbines, and legislation for wind power development by the Ministry of Natural Resources and Environment.
Before further analysis, the validation of the high-resolution wind resource maps is accomplished by using measured wind speeds obtained from the 120 m met tower in Thepa district, Songkhla province.
Table 1 shows the validation results and the error analysis for the wind speeds at 80 m, 100 m, and 120 m agl. It can be observed that the predicted mean wind speeds at all elevations are higher than the measured ones, with relative errors in the predictions being less than 15%. Results from the error analysis, presented in
Table 1, show that the absolute error in the wind speed predictions is in the range of 0.61 to 0.75 m/s, while the percentage relative error is in the range of 12 to 15%.
Further details for the spatial analysis, using Arc GIS 10.2, indicate that the potential areas with annual mean wind speeds above 8.0 m/s at 120 m agl, where wind power plants could be installed, cover a total surface area of 86 km
2, corresponding to a TPP of 307 MW (
Table 2). These areas should be considered in the short-term planning of wind power development in the southernmost region of Thailand. However, for the low to moderate wind resource (7.0 to 8.0 m/s) at 120 m agl, which includes easily accessible areas in the coastal line and the flat areas of Pattani province, the area for wind turbine installation covers 359 km
2 in the southernmost region of Thailand, corresponding to a TPP of 1273 MW. These areas should be considered for the medium-term planning of wind power development in the region.
Based on the IEC wind turbine generator classes (IEC 61400-1), wind maps at each elevation, i.e., 80 m, 100 m, 120 m, and 140 m agl, are used to identify the suitable areas for the installation of wind turbine generators. Results show that Class III and Class IV wind turbine generators could be installed in the southernmost region of Thailand. Class III wind turbine generators could mainly be installed in the mountainous areas, while Class IV wind turbine generators could be installed along the coastal line and the flat areas of Pattani province. Limited mountainous areas could install Class II wind turbine generators.
However, other factors that affect the levelized cost of electricity should be taken into consideration in wind power project development, including the slope and geotechnical characteristics of the terrain; the infrastructure such as main roads and local roads for wind turbine generator logistics and transportation; the connection to the electricity load; etc. These issues could be further analyzed in the site selection process and the micro-siting phase of wind power development in the region.
This investigation reveals that the southernmost region of Thailand has a relatively limited wind resource, which could none-the-less be developed with currently available wind turbine generators. While the best wind resources are in the mountainous areas of Yala, Songkhla, and Narathiwat provinces, the coastal line and the flat areas of Pattani province have wind resources that could be exploited through wind power plants using Class IV wind turbine generators.
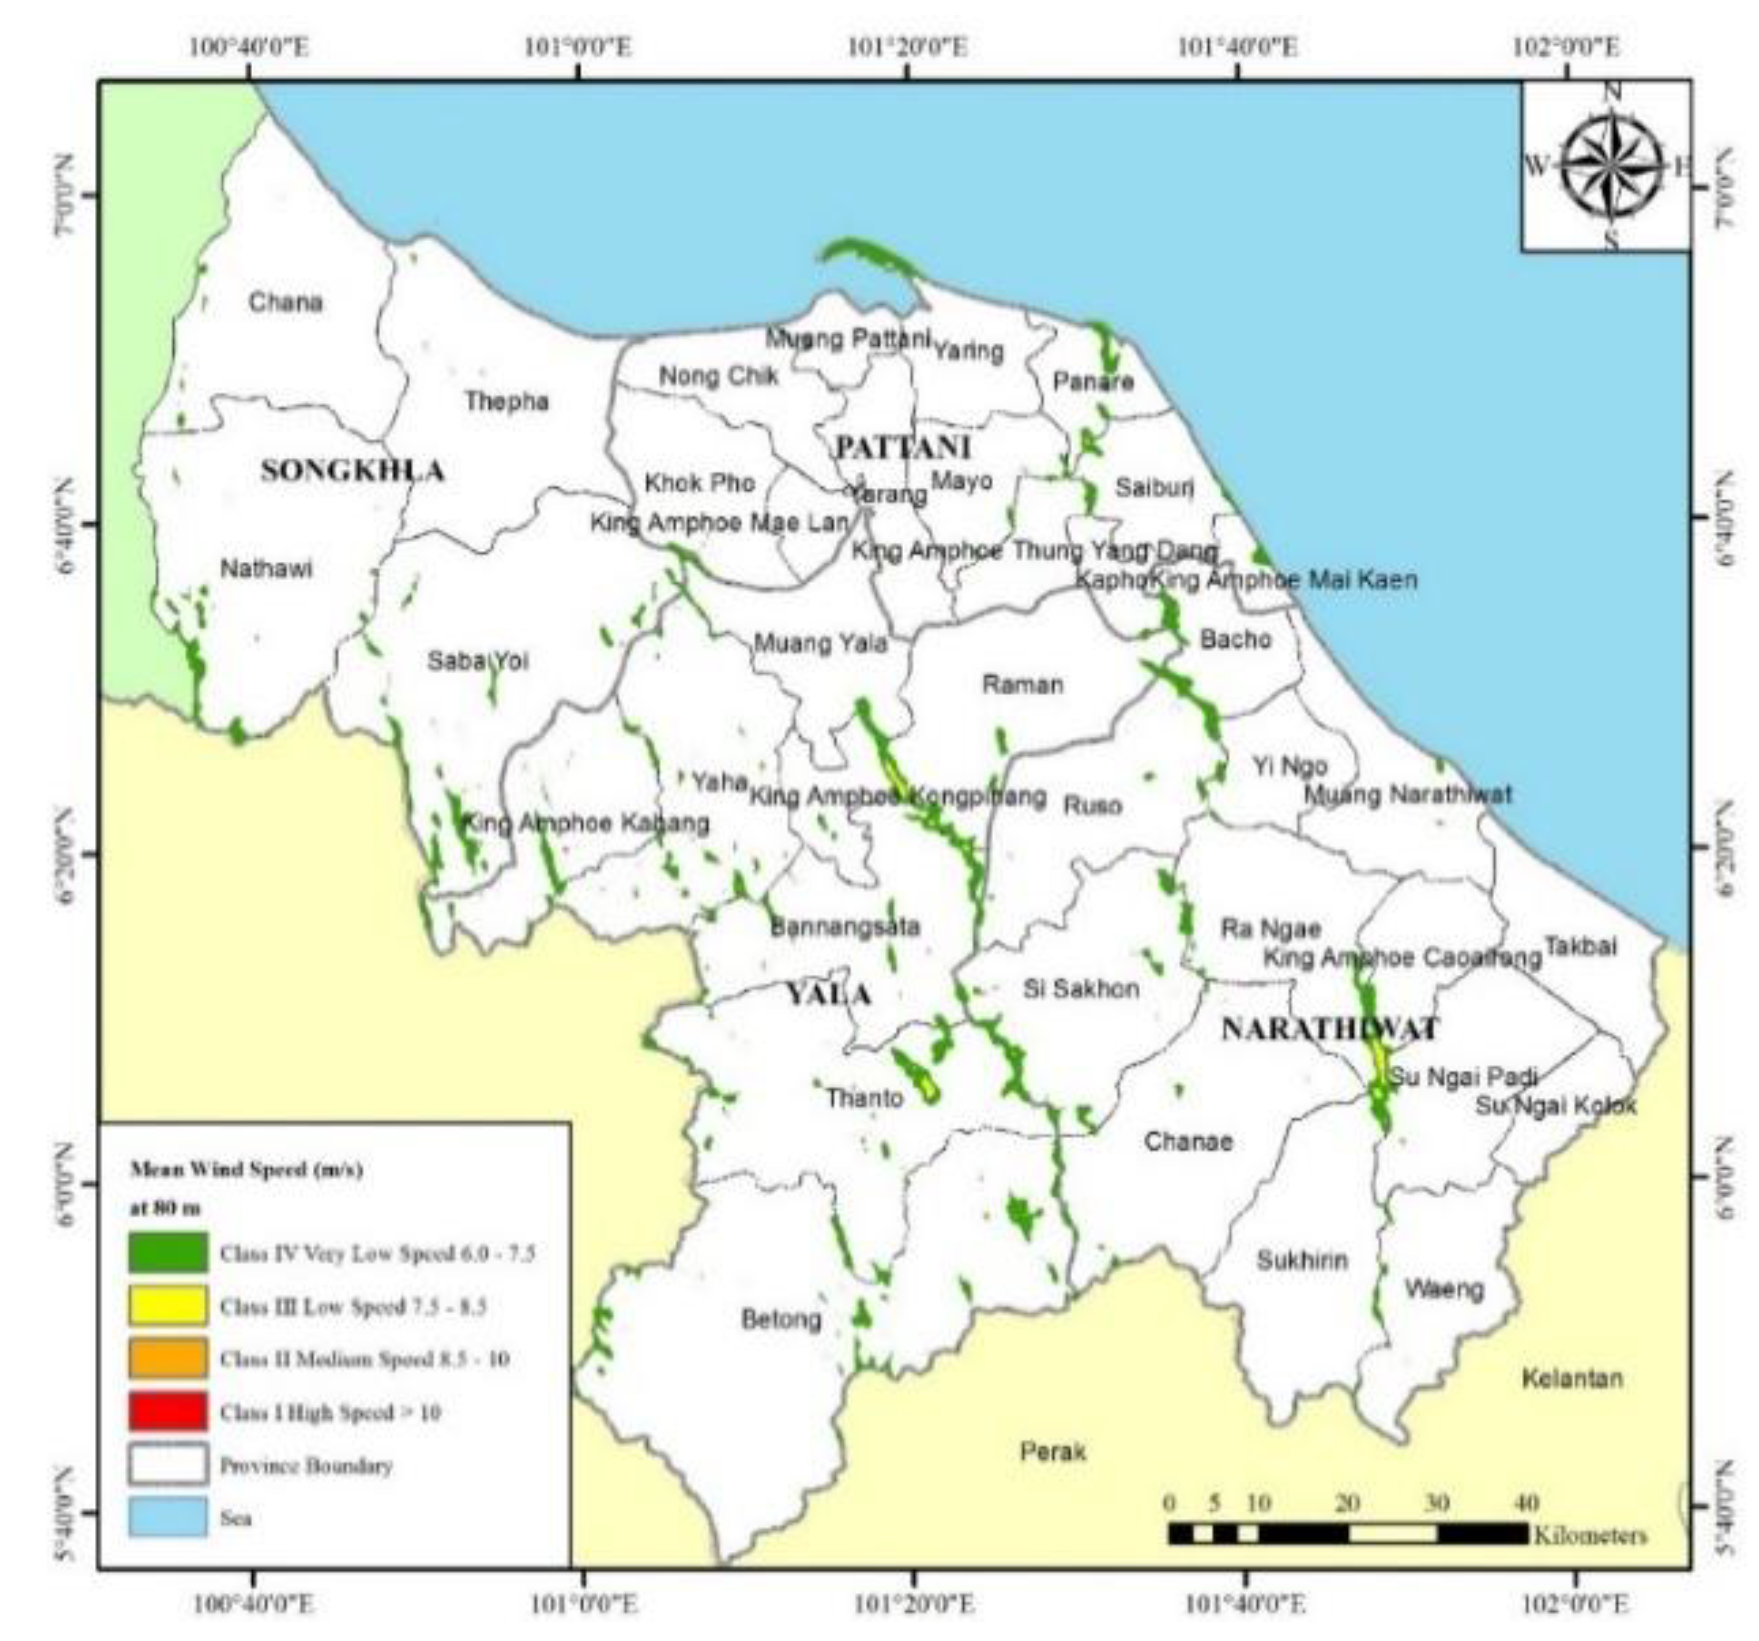
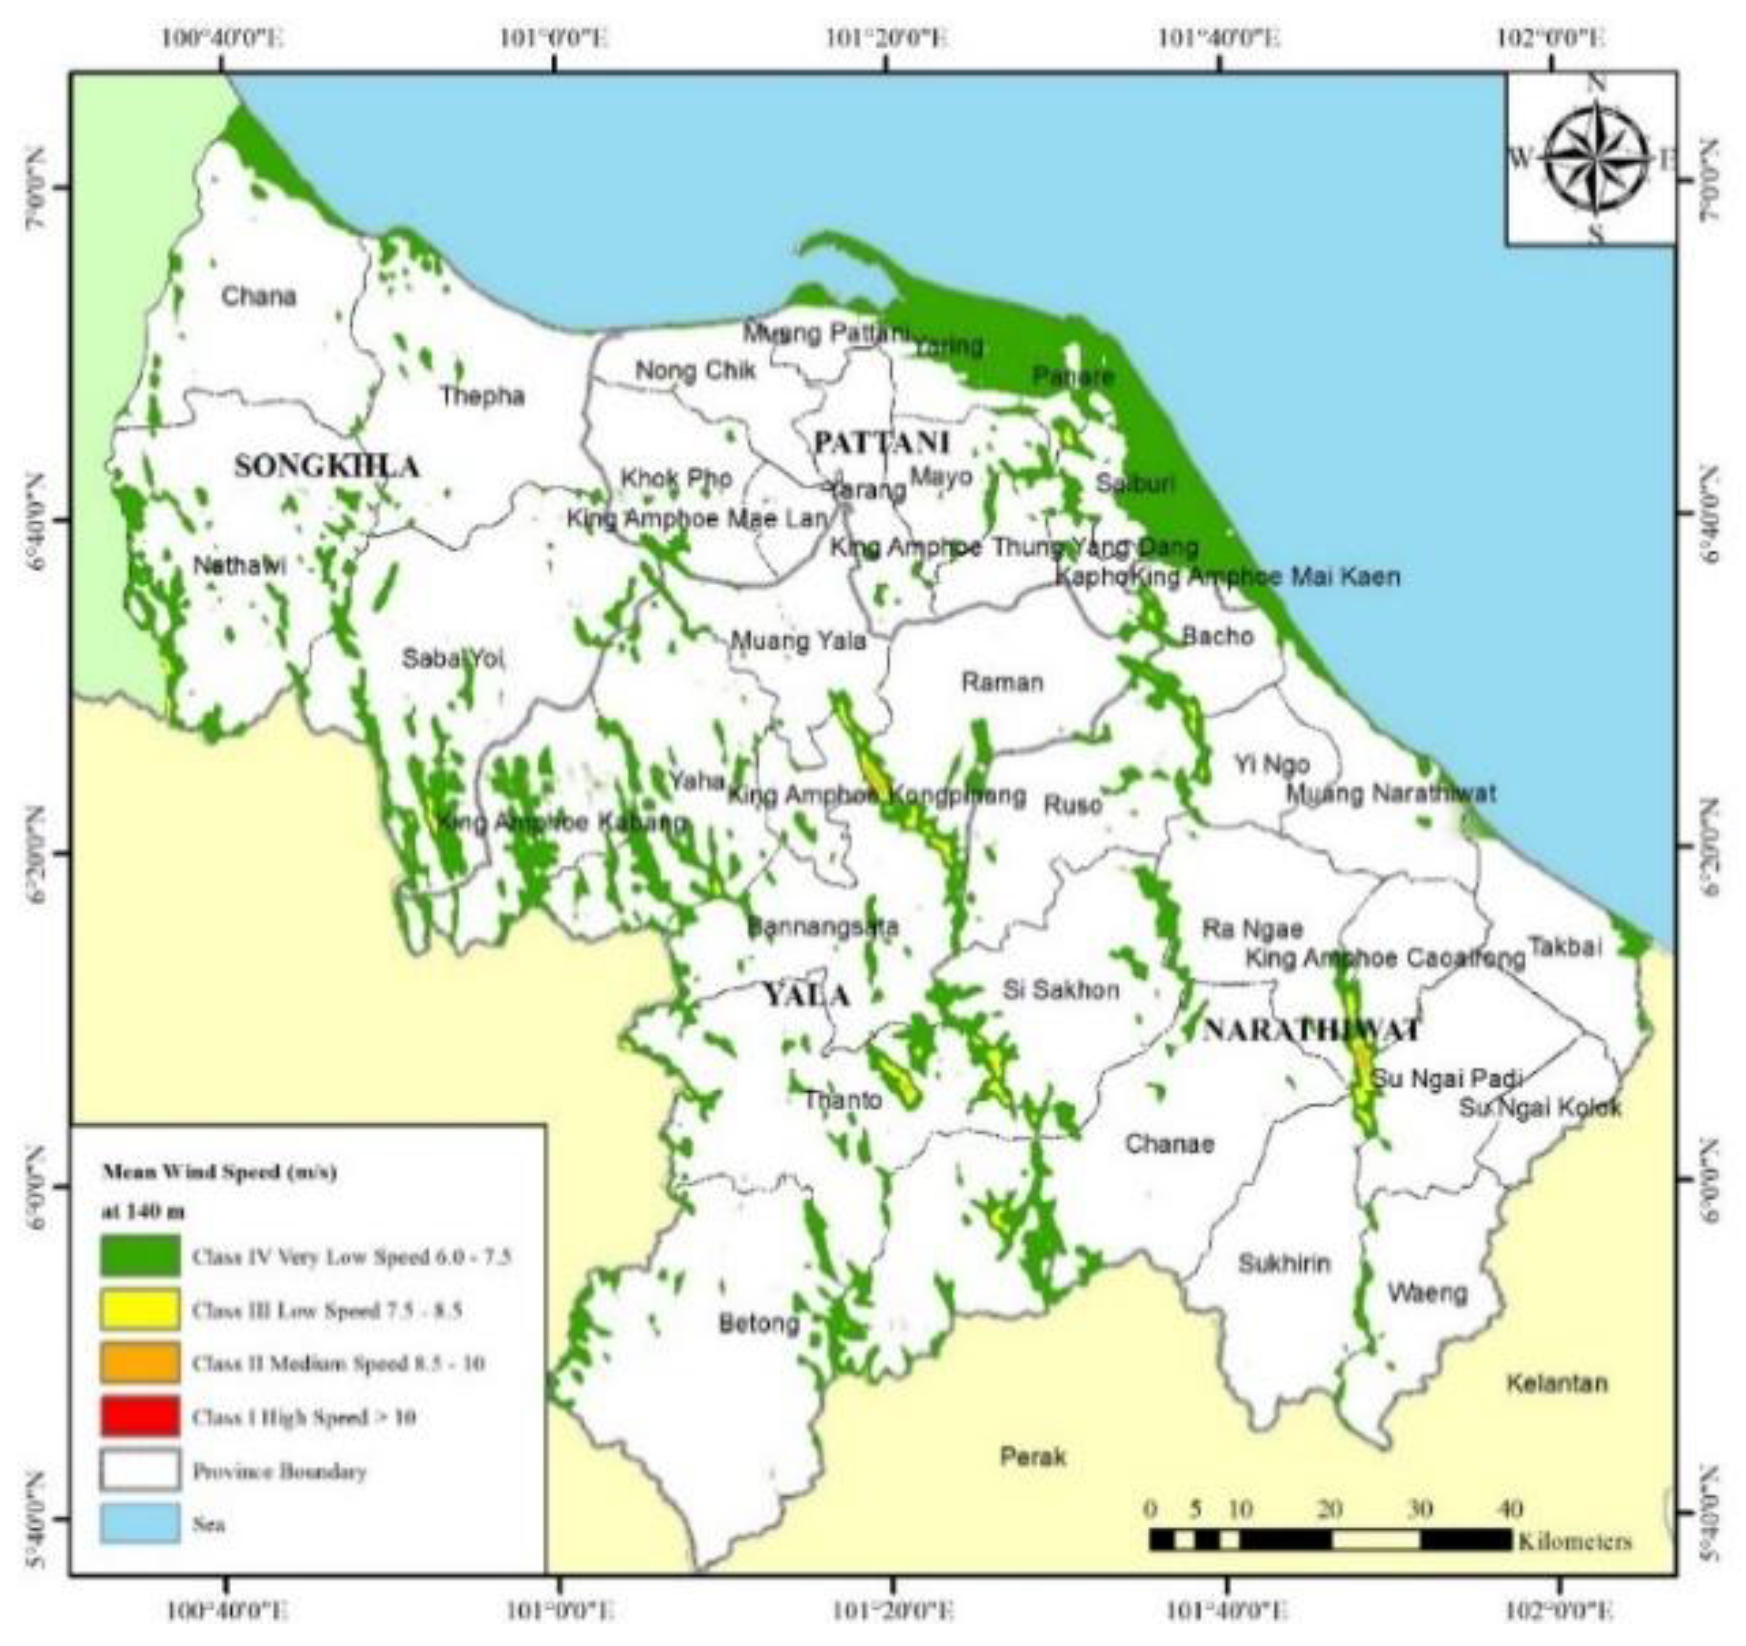
Finally, a wind resource classification is carried out to identify the appropriate wind turbine generator class for areas that have a wind resource above 6.0 m/s. The areas depicting the appropriate IEC Class wind turbine generators, installed at hub heights of 80 m, 100 m, 120 m, and 140 m agl, are shown in
Figure 12,
Figure 13,
Figure 14 and
Figure 15, respectively. As noted previously, it is found that there are some suitable mountainous areas in Yala and Narathiwat provinces that could install Class II and Class III wind turbine generators with hub heights of 120 to 140 m agl, while Class IV wind turbine generators could be installed along the coastal line and the flat areas of Pattani province.
Based on a generic wind turbine generator currently available, with a hub height of 120 m agl and a wind resource above 8.0 m/s, the 307 MW wind power capacity in the southernmost region of Thailand would generate an annual energy production (AEP) in the order of 690 GWh/year, corresponding to greenhouse gas emission avoidance of 1.2 million tonnes CO
2eq (
Table 3). On the other hand, developing wind power plants with IEC Class IV wind turbines in regions of lower wind resource, where annual mean wind speeds are in the range of 7.0 to 8.0 m/s, could generate nearly 3,000 GWh/yr of energy, with a CO
2eq emissions avoidance of 5 million tonnes CO
2eq on a yearly basis.
4. Conclusions
This paper presents a wind resource assessment of the southernmost region of Thailand for wind power plant development, using the WRF atmospheric modeling, along with the MERRA reanalysis climatic database between 1981–2010, coupled with a microscale CFD wind flow modeling. High-resolution wind resource maps at 80 m, 100 m, 120 m, and 140 m agl are developed to identify the potential areas for wind power plant developments in the southernmost region of Thailand.
Validation of the high-resolution wind resource maps is accomplished by comparing the predicted mean wind speeds and the measured mean wind speeds from a single IEC standard 120 m met tower, with measurements at elevations of 80 m, 100 m, and 120 m. The percentage relative error in the wind maps is less than 15%, with a bias of 0.05 m/s, while the predicted mean speeds are higher than the measured ones at all elevations, with an absolute error less than 0.75 m/s.
The wind measurements from the 120 m IEC standard met tower shows that the annual mean wind speeds, at 80 m, 100 m, and 120 m agl, over the 1-year period of measurements (August 2014 to July 2015) are 4.5 m/s, 4.7 m/s, and 4.9 m/s, respectively. While the 10-min average wind speeds range from 0 to 15 m/s, the annual mean wind speeds are relatively low; thus the importance of making high-resolution wind resource maps to be able to identify potential areas where the wind speeds would be sufficient to install efficient wind power plants.
The region is also characterized by seasonal variations of the wind characteristics. The summer (February to May) and the heavy rainy monsoon (October to February) seasons are characterized by the strongest mean wind speeds, in the range of 5.0 m/s, 5.3 m/s, and 5.5 m/s, at elevations of 80 m, 100 m, and 120 m agl, respectively. The lowest wind regime is during the light rainy season (May–October).
The dominant wind direction of the most promising winds for power generation are from the northeast direction during the heavy rainy monsoon period (October to February), while the other dominant wind direction is from the southwest. These opposite dominant wind directions are favorable for wind power plant development, as they allow optimizing the positions of individual turbines to minimize wake effects.
The turbulence intensity decreases with elevation, ranging from 10.1% at 80 m agl to 8.5% at 120 m agl. However, the strongest turbulence intensities are for low wind speeds (below 3 m/s), which are below the cut-in wind speeds of most standard wind turbines.
This investigation reveals that the potential areas with the most promising wind speeds above 8.0 m/s are located in the mountainous areas. However, the areas characterized by lower wind resource, with wind speeds in the range of 6 to 7 m/s, are located along the coastal line and the flat areas of Pattani province. For the areas with the most promising wind resource, the surface area that could be developed reaches 86 km2, with a technical power potential in the order of 300 MW. Once this wind resource would be fully developed and operational, it could generate 690 GWh/year of energy and thus could avoid greenhouse gas emissions to the atmosphere by approximately 1.2 million ton CO2eq on a yearly basis.
On the other hand, developing power plants with IEC Class IV wind turbines in regions of lower wind resource, i.e., a total area of 359 km2 but with easier access, could see the integration of 1273 MW of installed capacity, which could generate nearly 3000 GWh/year of energy, with a CO2eq emissions avoidance of 5 million tonnes CO2eq on a yearly basis.
Finally, considering the uncertainty in the prediction of the wind resource, and considering that there is only a single IEC standard met tower in the region, it is recommended to install a met mast or a met tower in strategic areas of the coastal line and the flat areas of Pattani province, in order to further validate the wind speeds predicted and to gain a better physical understanding in the wind resource in the southernmost region of Thailand.


