Article

Thermal Conductivity Enhancement of Phase Change Materials for Low-Temperature Thermal Energy Storage Applications

1
Thermal Engineering Division, Fujikura Automotive Europe GmbH, 85053 Ingolstadt, Germany
2
School of Engineering, RMIT University, Melbourne 3083, Australia
*
Author to whom correspondence should be addressed.
Energies 2019, 12(1), 75; https://doi.org/10.3390/en12010075
Submission received: 13 November 2018 / Revised: 21 December 2018 / Accepted: 21 December 2018 / Published: 27 December 2018
(This article belongs to the Special Issue Solar Energy Harvesting, Storage and Utilization)

Abstract

:
Low thermal conductivity is the main drawback of phase change materials (PCMs) that is yet to be fully addressed. This paper studies several efficient, cost-effective, and easy-to-use experimental techniques to enhance thermal conductivity of an organic phase change material used for low-temperature thermal energy storage applications. In such applications, the challenges associated with low thermal conductivity of such organic PCMs are even more pronounced. In this investigation, polyethylene glycol (PEG-1000) is used as PCM. To improve the thermal conductivity of the selected PCM, three techniques including addition of carbon powder, and application of aluminum and graphite fins, are utilized. For measurement of thermal conductivity, two experimental methods—including flat and cylindrical configurations—are devised and increments in thermal conductivity are calculated. Melting and solidification processes are analyzed to evaluate melting and solidification zones, and temperature ranges for melting and solidification processes respectively. Furthermore, latent heat of melting is computed under constant values of heat load. Ultimately, specific heat of the PCM in solid state is measured by calorimetry method considering water and methanol as calorimeter fluids. Based on the results, the fin stack can enhance the effective thermal conductivity by more than 40 times with aluminum fins and 33 times with carbon fins. For pure PCM sample, Initiation of melting takes place around 37 °C and continues to above 40 °C depending on input heat load; and solidification temperature range was found to be 33.6–34.9 °C. The investigation will provide a twofold pathway, one to enhance thermal conductivity of PCMs, and secondly ‘relatively easy to set-up’ methods to measure properties of pure and enhanced PCMs.

1. Introduction

Generally, thermal energy storage technologies can be categorized as latent heat with phase change materials (PCMs), sensible heat and those working based on reversible thermochemical reactions [1,2]. Because of relatively high storage capacity, isothermal nature of the storage process, low cost, and desirable chemical stability, PCM-based storage systems have attracted further attention in recent years [3,4]. However, the main drawback of pure PCMs is their relatively poor thermal conductivities that results in an unacceptably slow heat transfer rate in some applications [5,6]. Therefore, introducing a promising and affordable technique for enhancing the thermal conductivity of PCMs can play a key role in improving their performance.
Various techniques have been reported to date by different researchers to address the low thermal conductivity problem of PCMs. These included the addition of high-conductivity particles and powders, using fins or extended surfaces, employing metal foams, using multiple PCMs, and embedding heat pipes (i.e., studied either numerically and/or experimentally) [7,8,9,10,11].
The addition of high-conductivity additives to PCMs, which is one of the promising methods tried to date for improving their effective thermal conductivity, has been analyzed by several researchers. Number of studies specially focused on introducing carbon-based (e.g., graphite) and metallic nanoparticles to PCMs. Li and Zhai [12] theoretically and experimentally studied a solar collector-storage system in which a composite PCM containing erythritol and expanded graphite with melting temperature of 119 °C was filled in aluminum pipes. According to their results, the composite PCM containing 3 wt% expanded graphite was reported to be the best option for mid-temperature heat storage and could increase the storage efficiency by up to 40.17%. Lin et al. [13] compared several methods for enhancing the thermal conductivity of PCMs including the addition of carbon-based additives, which turned out to be more promising than metal-based additives. The research conducted by Choi et al. [14] (i.e., using transient hot-wire method to measure the thermal conductivity) demonstrated that graphite possessed the most promising performance for promoting the thermal conductivity of the PCM. They reported that by adding graphite 5% by volume the rate of heat transfer improved by about 3.5 times. Similar result was also reported by Li [15], who experimentally measured the thermal conductivity of a composite PCM containing nano-graphite (NG) and paraffin. They reported that the PCM containing 10 vol% NG was about 0.95 W/(m·K) (7.5 times greater that thermal conductivity of pure PCM). Comparing this result with those reported by Choi et al. [14] indicates that improvement in thermal conductivity of PCMs is linearly proportional with the concentration of graphite nanoparticles added to the PCM. Huang et al. [16] reported similar relationship between the conductivity improvement and graphite nanoparticles concentration. Wang et al. [17] and Liu et al. [11] are also among other researchers who studied and supported the idea of introducing nanoparticles to PCMs as a promising solution to enhance their effective thermal conductivity. There are also studies reported in the literature that incorporated some numerical analysis on using nanoparticles for enhancing the thermal conductivity of PCMs. Examples of these (mainly review works) are the studies conducted by Fan and Khodadadi [8] that also confirmed the effectiveness of this approach in enhancing the thermal conductivity of PCMs. Marcos et al. [18] presented several nano-enhanced PCMs formulated by dispersions of functionalized graphene nanoplatelets in PEG-400 as a base PCM. They observed that graphene nanoplatelets could increase the thermal conductivity of the PCM samples by up to 23% and decrease the crystallization temperature by up to 4 °C.
Adding metallic-based nanoparticles to PCMs was also studied by several researchers. Khyad et al. [19] added 1% mass fraction of aluminum powder as additive to a PCM (melting at below 80 °C) and observed 18 times enhancement in thermal conductivity, i.e., from 0.23 W/(m·K) to 4.11 W/(m·K). The effect of addition of aluminum powder to PCMs was also studied by Li et al. [20] by emphasizing on melting and solidification processes as well as thermal conductivity enhancement. They showed that with 1% and 2% mass fractions of aluminum, solidification time of the PCM (i.e., with melting interval of 45.8–50.3 °C) was reduced from 220 min to 140 min. In another study, Sahan et al. [21] used nanomagnetite (Fe3O4), and for 10% and 20% paraffin-nanomagnetite composites, the thermal conductivity of the PCM was enhanced up to 48% and 60%, respectively. Vallejo et al. [22] investigated the effect of different functionalized graphene nanoplatelet dispersions on the heat transfer capacity and stability of propylene glycol–water mixture considering 3:7 mass ratio. According to their results, the thermal conductivity of the PCM, they used, in their study was enhanced by up to 16% for a case with 1% by weight functionalized graphene nanoplatelets mass fraction.
The application of fins has been introduced as another efficient technique for improving the thermal conductivity of PCMs. Several studies—mostly conducted theoretically, by Youssef et al. [23], Liu et al. [10], Abujas et al. [24], and Ibrahim et al. [9]—confirmed that thermal charging and discharging performance of PCMs can improve significantly by embedding finned pipes and tubes in PCMs. Ibrahim et al. [9] also suggested the use of porous materials and heat pipes as other effective ways to enhance the thermal conductivity of PCMs. In an almost similar approach, Mills et al. [25] could achieve 20–130 times improvement in thermal conductivity of a paraffin wax with the melting point of 55 °C and thermal conductivity of 0.2 W/(m·K) by applying porous graphite matrices fabricated by compacting flake graphite soaked in a bath of sulfuric and nitric acid. They obtained the results for graphite matrix bulk densities ranging from 50 gr/L to 350 gr/L.
Different investigations have been carried out to show the crucial effects of PCMs on thermal performance of buildings from energy conservation and air conditioning standpoints [26]. Ye et al. [3] used two concepts, energy saving equivalent and energy saving index, to evaluate the performance of a paraffin wax as PCM used in a passive room from an energy standpoint. They demonstrated that the use of PCM could reduce the indoor temperature fluctuations. Arnault et al. [27] numerically determined the thermal performance of a floor in presence/absence of PCM considering melting temperature, thickness, and position of a PCM layer as crucial factors. Jiang et al. [6] introduced an efficient and simple analytical method to optimize the PCM characteristics in a passive solar room. Pasupathy and Velraj [26] used a double layer inorganic eutectic PCM in roof of a building for thermal management purposes. Li et al. [28] focused on thermal investigation of melting and freezing processes of several PCMs for building applications using DSC method. In another study, Ferrer et al. [29] employed DSC method to determine the specific heat capacity of several PCMs by considering the heat flow fluctuations. Lachheb et al. [30] numerically and experimentally analyzed the thermal behavior of a PCM/Plaster composite in passive solar walls. Mazzeo et al. [31] proposed a set of parameters for dynamic thermal analysis of PCM layers in air-conditioned buildings considering liquid–solid interfaces and non-sinusoidal periodic boundary conditions. Sharifi et al. [32] computationally evaluated the effectiveness of PCMs incorporated in gypsum boards (i.e., used to reduce the energy consumption in buildings). Guarino et al. [33] experimentally and theoretically simulated the thermal performance of a building-integrated glazed-façade thermal storage system in which PCM was embedded for cold climates. Navarro et al. [34] carried out a thermo-physical analysis on a PCM incorporated into a radiant wall considering cycling stability factor in buildings. Bouhal et al. [35] performed a parametric CFD investigation on the melting process of a PCM inside an enclosing with fins for solar building applications. Ahangari and Maerefat [36] introduced a PCM with an appropriate melting point close to room air temperature to improve the thermal comfort in a building under several climate conditions. Xie et al. [37] numerically simulated the thermal performance of PCM wallboards throughout a year for residential applications. Nada and El-Nagar [38] focused on temperature control and thermal performance improvement of a building using PV modules integrated with Al2O3 nano-enhanced PCM boxes. Saffari et al. [39] optimized the melting temperature of a PCM to increase the cooling, heating, and the annual total heating and cooling performance of a building under different climate conditions using a simulation-based method.
Among different renewable energy resources, solar energy has been experiencing a significant growth and attracted attention due to its inexhaustibility, availability and exploitability [40]. Especially, solar-thermal systems have widely been used in residential applications in recent years with the aim of reducing thermal energy consumption of the building (e.g., normally by the air conditioning units or hot water systems) [3,31]. However, solar energy is intermittent by nature that makes it a challenge for applications with requirements for continuous supply of heat [41]: e.g., poor to no availability of solar radiation during rainy days and cloudy periods or at night [13]. For continuous and effective supply of heat, thermal energy storage solutions can address this problem and support the replacement of fossil fuels with renewables that help decrease GHG emissions significantly [13]. In residential applications, an appropriate thermal storage system can efficiently improve indoor thermal comfort degree by transporting much of excessive energy from daytime to nighttime and from hot days to cold days [27,31,42,43,44]. PCM-based storage systems could efficiently be integrated with concentrated solar power plants, solar water heating systems, solar greenhouses, solar cooking systems, and photovoltaic systems [45,46,47]. Nevertheless, as discussed before, many commonly-used PCMs have poor thermal conductivity [45,46,47,48,49]. Therefore, PCMs with enhanced thermal conductivity are required to overcome the discrepancy between the supply and demand (i.e., considering the impermanency of thermal energy supply through renewables) [39].
As discussed in detail, different methods for enhancing thermal conductivity of PCMs have been reported in the literature to date. However, there is no strong agreement between the outcomes reported in terms of the extent of improvement using different methods. Hence, further experimental studies can contribute to reaching an agreement on this matter. Moreover, especially for methods involving mesh, foam, or finned materials, the studies conducted to date are limited, with most of them restricted to theoretical modeling investigations with not many experimental verifications supporting them. Besides, simultaneous effect of employing different methods in terms of improving the thermal conductivity and other performance indicators of PCMs were not adequately studied in the past. It is also notable that a robust experimental investigation on improving the heat transfer rate of PCMs by adding powder is still scant [20].
In response to these research gaps, the present study aims to experimentally investigate several efficient and cost-effective methods for increasing the thermal conductivity of a selected organic PCM. It is noteworthy that so far, numerous PCMs, both organics and inorganics, have been tested for thermal energy storage applications. Inorganic PCMs are highly corrosive and suffer from chemical and thermal instabilities [21]. On the other hand, organic PCMs possess most of the above-mentioned properties except high thermal conductivity [21]. Therefore, there is a substantial need for further studying the techniques for enhancement of thermal conductivity of organic PCMs. For robust measurement of thermal conductivity, simple and efficient methods, including flat and cylindrical configurations, were devised using reliable experimental set-ups. Three techniques including addition of carbon powder, application of aluminum fins and carbon fins, were utilized for improving the thermal conductivity of PCMs. Considering the thermal conductivity of the pure PCM used in this study, the thermal conductivity increments achieved by using each of these techniques were measured and compared. Furthermore, melting and solidification processes of the PCM were experimentally examined leading to identification of melting and solidification zones. Subsequently, variations of fusion and solidification temperatures with time under certain conditions were comprehensively discussed and latent heat of melting for the PCM was computed under several constant values of heat load. Moreover, the specific heat of the PCM in solid state is obtained using calorimetry method.

2. Overview of Methods

In order to accurately and reliably measure the thermal conductivity of the selected PCM sample, two experimental set-ups, including flat and cylindrical configurations, have been devised based on Fourier law. In flat configuration method, heat generated by a heater block flows one-dimensionally through the sample and the thermal conductivity is measured by using several thermocouples fixed across the PCM thickness. In cylindrical configuration method, thermal energy is transferred radially to the PCM by a heater rod and thermal conductivity is measured by reading the temperatures of thermocouples fixed at different distances along the radius direction. Since melting and solidification phenomena are important factors to consider for selecting PCMs, it is highly essential to investigate the phase change transformations occurring during melting and solidification processes. In this study, in order to analyze the melting behavior of the PCM, heat is transferred to the material by a heater rod under a constant input power. By using this method, the melting zone and melting temperature range of the PCM are determined. In order to describe the solidification zone and solidification temperature range of the PCM, cooling air moved by a fan (i.e., to create forced convection) is applied.
In order to measure the specific heat capacity of the PCM, the calorimetry method is employed. In this regard, necessary data, such as temperature gradient, masses of PCM and calorimeter fluids, are extracted during the calorimetry experiment. With all these experiments a data acquisition system connected to a computer was used to collect the data reported by the thermocouples.

3. Experimental Study

3.1. PCM Material Selection

In this study, a grade of polyethylene glycol (PEG) with molecular weight around 1000 gr/mol and melting temperature range of 37–40 °C [50,51], which is manufactured by Science Lab (catalogue code: SLP4435) [52] has been selected as the PCM. PEGs, also known as polyoxyethylene or polyethylene oxide, are white, non-toxic, and non-corrosive materials that can be free-flow powders [50,51]. Their chemical formula, HO-CH2-(CH2-O-CH2)n-CH2-OH, enables them to be soluble in water and other organic substances [53]. Due to its chemical and thermal stabilities and relatively high latent heat of fusion, PEG-1000 is one of the promising PCMs that can be used for low and medium-temperature solar energy storage applications [54]. In the present experimental investigation, different set-ups have been devised to enhance the thermal conductivity of PEG-1000. Furthermore, thermal properties of the selected PCM including thermal conductivity in solid state, melting and solidification hysteresis, latent heat, and specific heat in solid state, are determined. Properties of the PEG-1000 are presented in Table 1.

3.2. Experimetal Set-Ups

3.2.1. Thermal Conductivity Improvement Options

The addition of powders with high thermal conductivity to the PCMs is one of the options for promoting the overall effective thermal conductivity of composite PCMs. Another possible option is to extend the heat transfer area by employing fins attached to the PCM container. In this investigation, the addition of carbon powder to PEG-1000 as well as the use of aluminum and carbon fins were studied experimentally. It must be pointed out that only one measurement was taken for each point due to rapid changes in the PCM phase (i.e., data had to be taken instantaneously). Hence, doing uncertainly analysis is not applicable in this case; however, considering the error associated with measurement, maximum errors of instrumentation are reported. It must be notes that thermal properties of the materials tested for improvement of the effective thermal conductivity of the PCM are provided by their supplier [52]. The arrangements used for thermal conductivity improvement of PEG-1000 are described as follows.

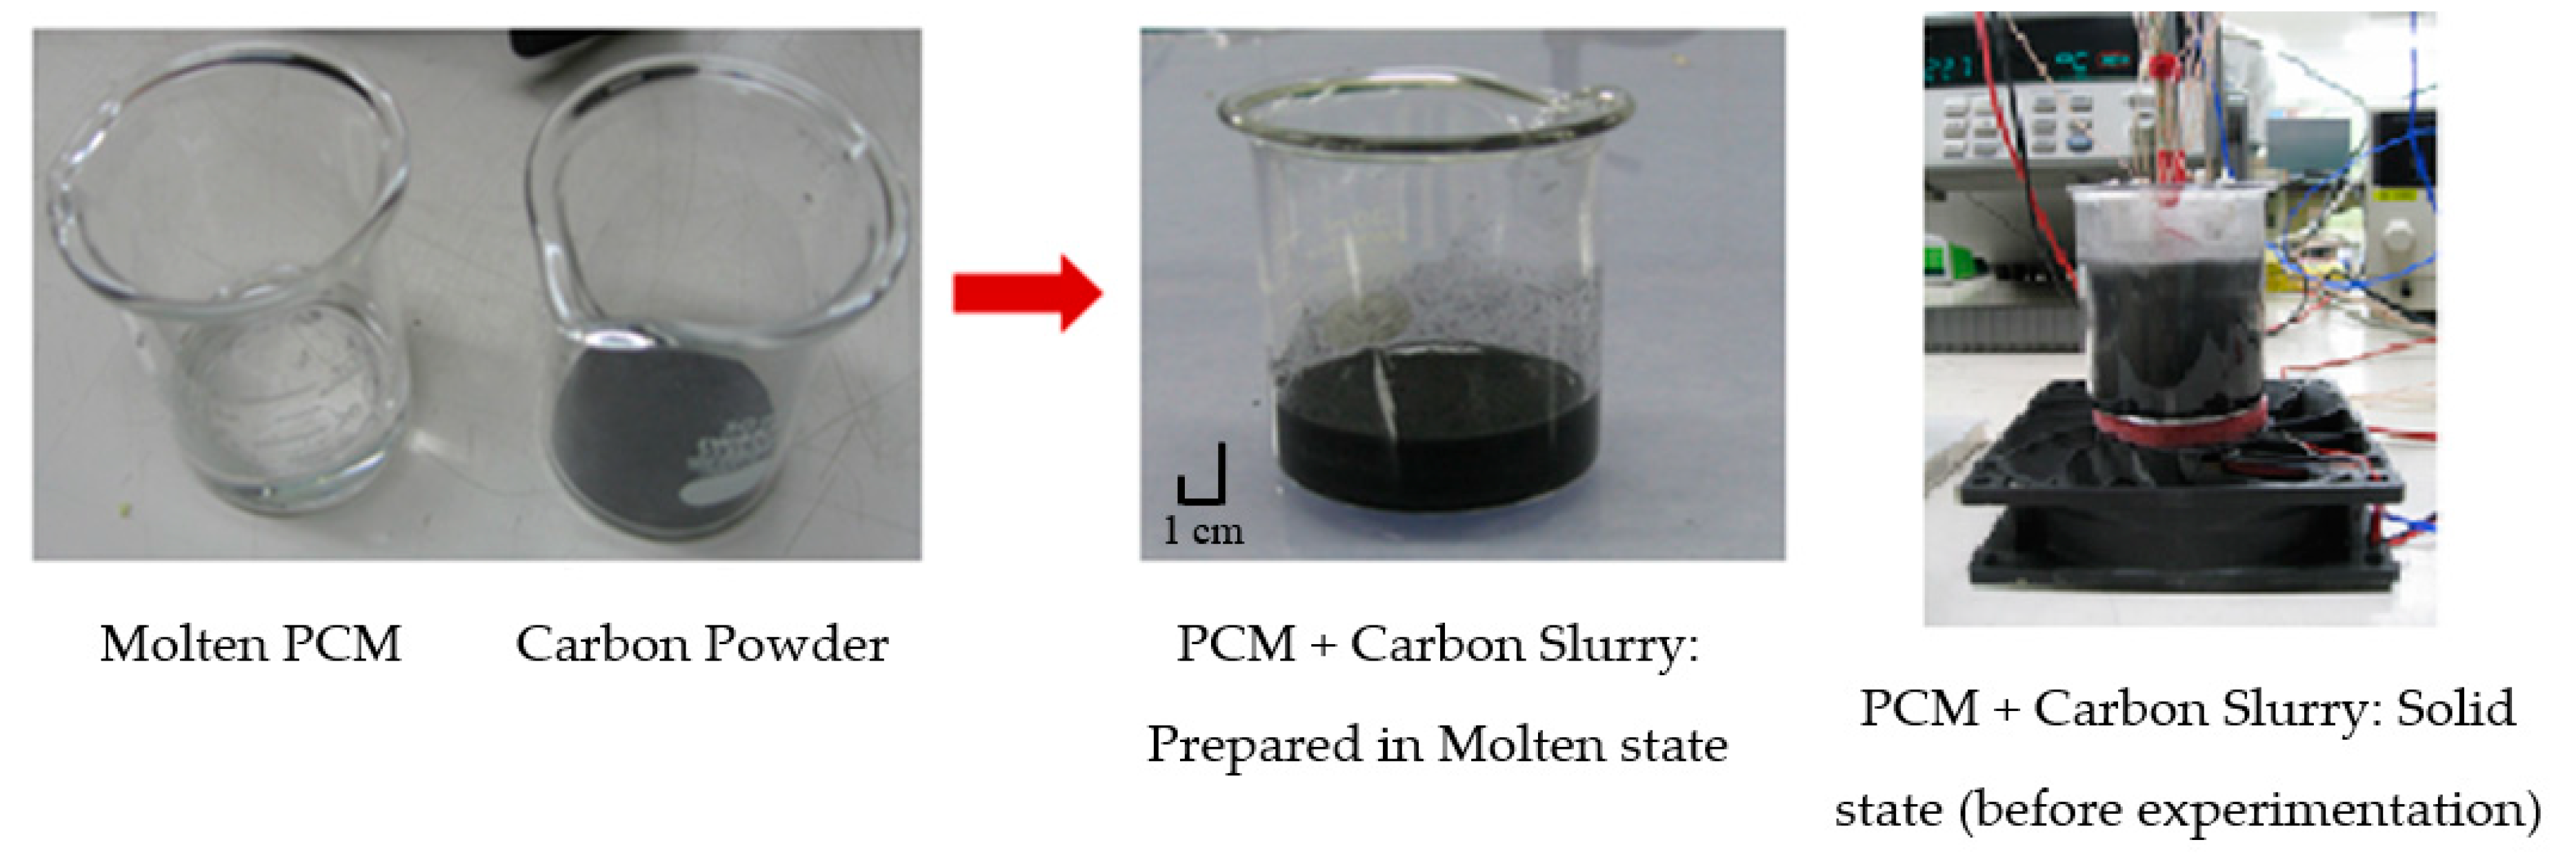
3.2.2. Carbon Powder

Carbon and its compounds, such as graphite, are promising non-toxic materials that possess various attractive properties such as high thermal conductivity and non-metallic characteristics (no galvanic corrosion risk). They are also inexpensive, light weight, and readily available in large industrial quantities [55,56]. They are of high thermal conductivity that is greater than most metallic materials such as iron and lead. In addition, its suitable chemical stability enables this material to endure acid, alkaline, and organic solvent corrosion [57].
In this study, the carbon powder is prepared by granulating carbon plates using a taper drill with typical powder sizes of 10to 50 μ m . The carbon powder was added to the molten PEG-1000 for increasing the composite PCM thermal conductivity (Figure 1). The slurry contains 0.78–2.5% carbon by volume in this study; higher concentrations were not used in this study, as a conservative approach, to avoid the settlement of carbon particles. It is notable that the PEG was fully molten by heating it to temperatures greater than 37 °C, followed by mixing of carbon powder in the molten PEG by continuous stirring till the mixture starts solidifying. The maximum and minimum errors of instrumentation for this technique were found to be 6.5% and 3.2%, respectively. The suspension of carbon particles in slurry was assumed to be homogeneous; however, a fully homogeneous carbon slurry may not be achieved in reality.

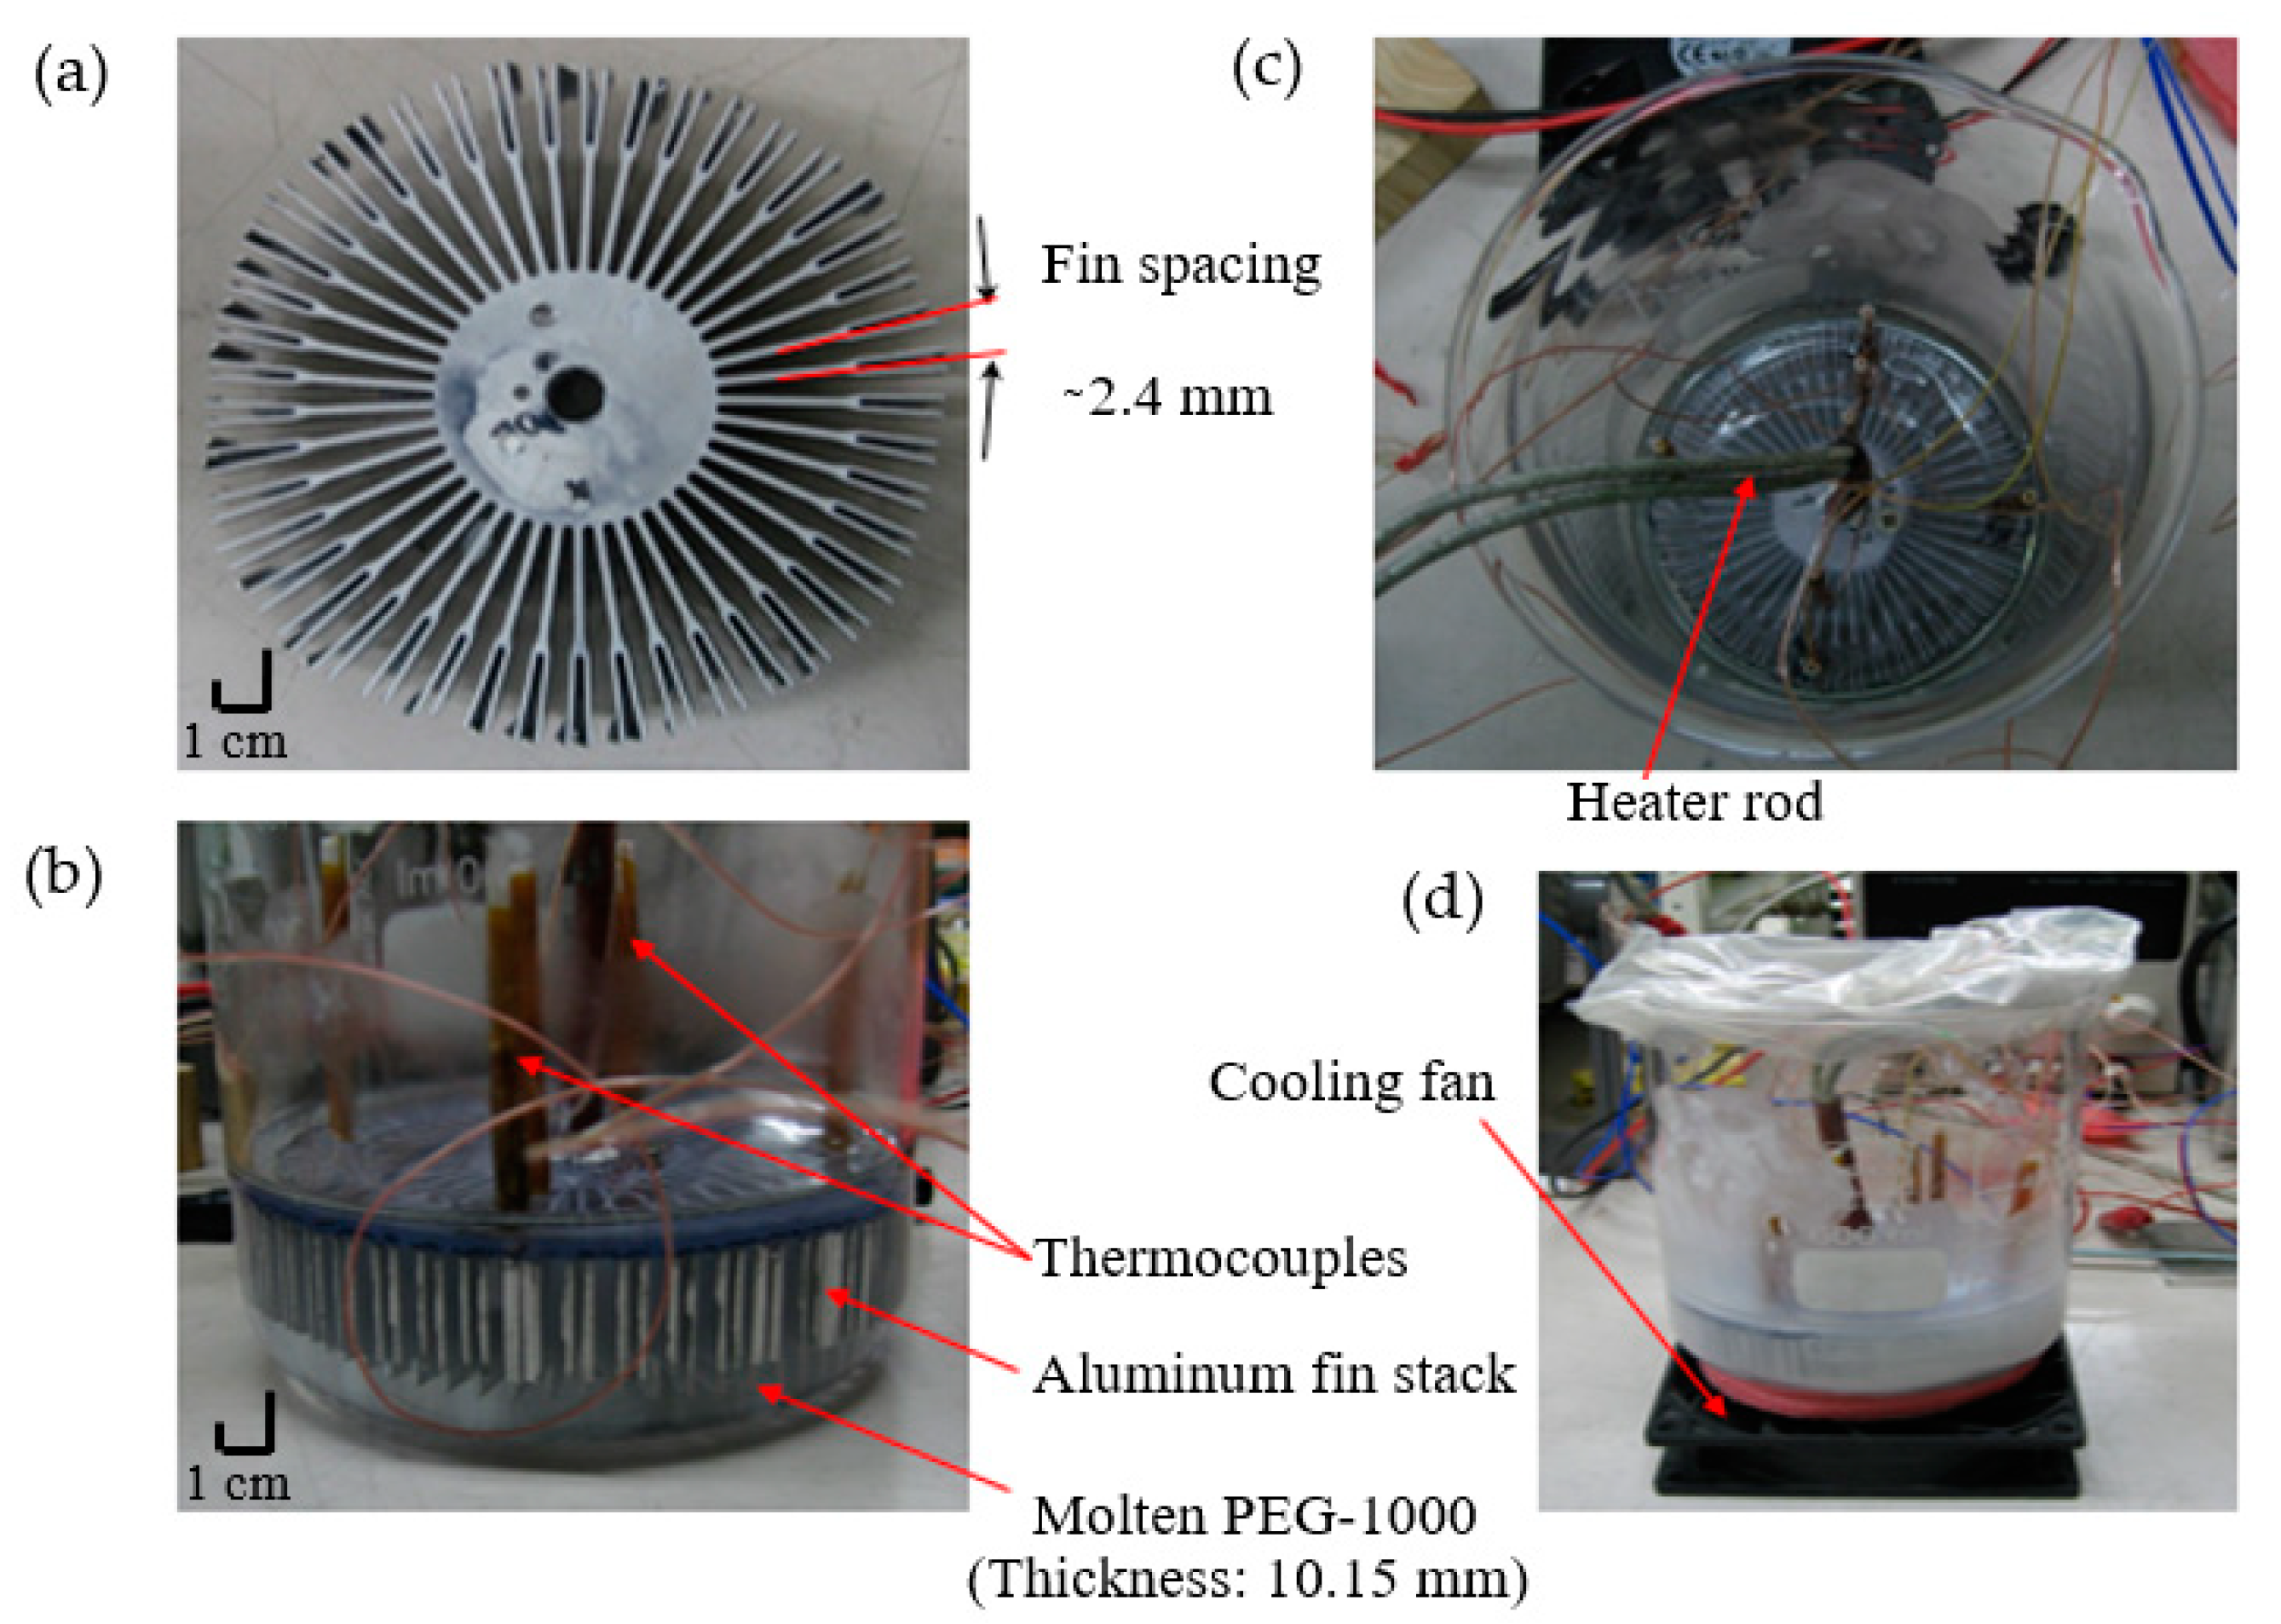
3.2.3. Aluminum Fins
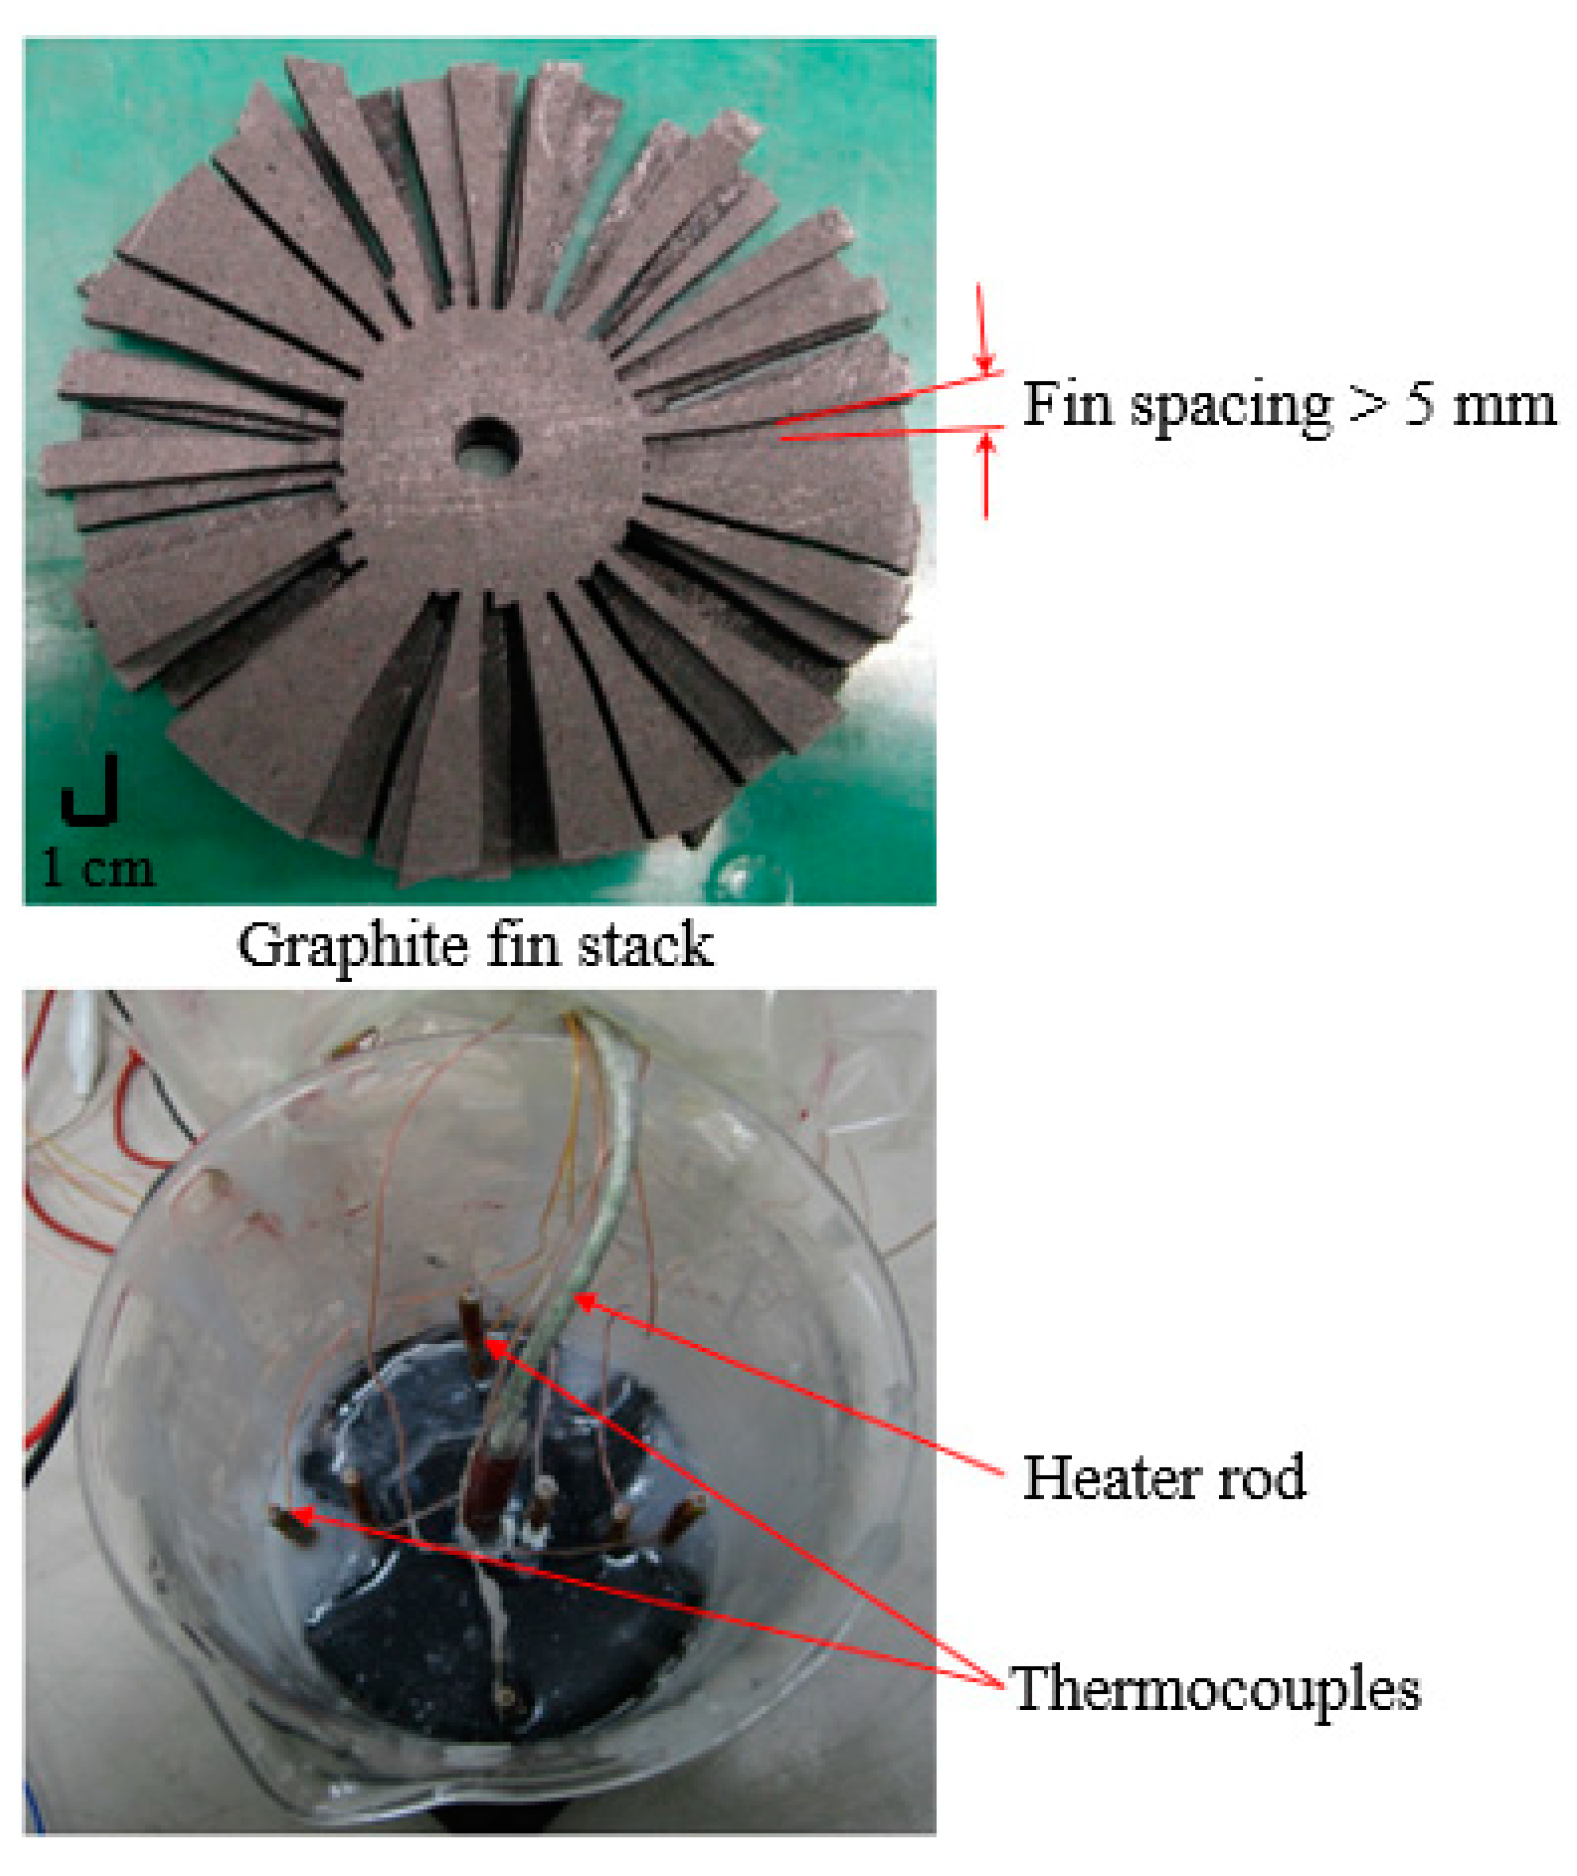
Another technique employed for thermal conductivity enhancement of the PCM was the utilization of aluminum fins. As also suggested by Dhaidan and Khodadadi [58], the very low density of aluminum and its high thermal conductivity (i.e., as compared to metals such as iron and brass) leads to a much lighter thermal energy storage system. Figure 2 illustrates the finned structure of the aluminum heat sink used in this investigation. Maximum and minimum errors of instrumentation by this experimental set-up are found to be 1.2% and 1%, respectively.
For the aluminum fin stack, fins are made of pure aluminum with thermal conductivity of ~210 W/(m·K). The aluminum heat sink is 22.67% by volume and 41.53% by weight of the entire system (PCM + fin stack). The surface area of the aluminum heat sink is 1082 cm2. As detailed in Figure 2, the set-up includes a PCM container, aluminum fin stack, several T-type thermocouples located midway between the fins, heater rod, and a cooling fan. It is notable that the thermal conductivity enhancement process is mainly dependent on the percentage of filler into the PCM and thermal conductivity of the filler material. The combined effects of higher filler ratio and thermal conductivity of aluminum fins result in higher thermal conductivity enhancement for Al + fins compared to the other combinations.

3.2.4. Carbon Fins

Due to the desirable characteristics of carbon, a heat sink composed of carbon fins was employed to enhance the thermal conductivity of the PCM used in this study. The carbon fin stack forms 24.68% by volume and 33.96% by weight of the whole system (PCM + fin stack). The surface area of the carbon heat sink is 981 cm2. The experimental set-up consisted of carbon fin stack, and T-type thermocouples placed midway between the fins and heater rod as shown in Figure 3. Maximum and minimum errors of instrumentation by the set-up were found to be 2.9% and 2.1%, respectively.

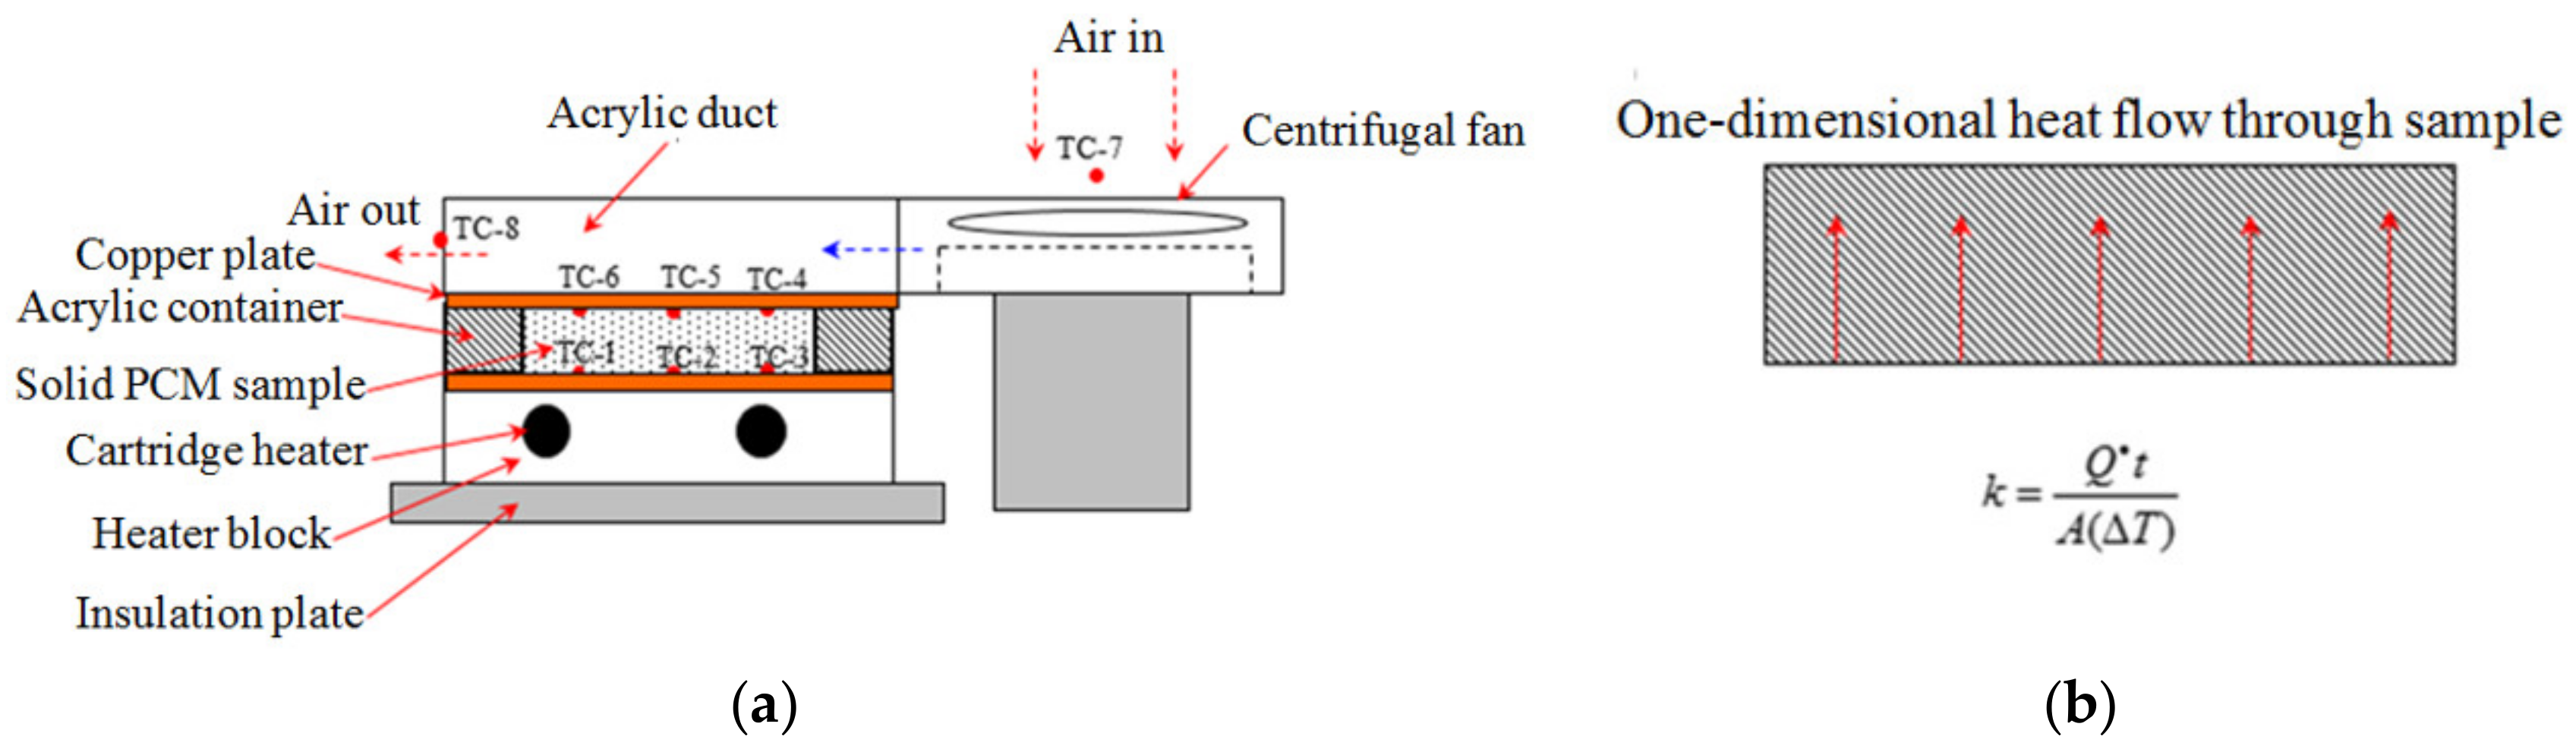
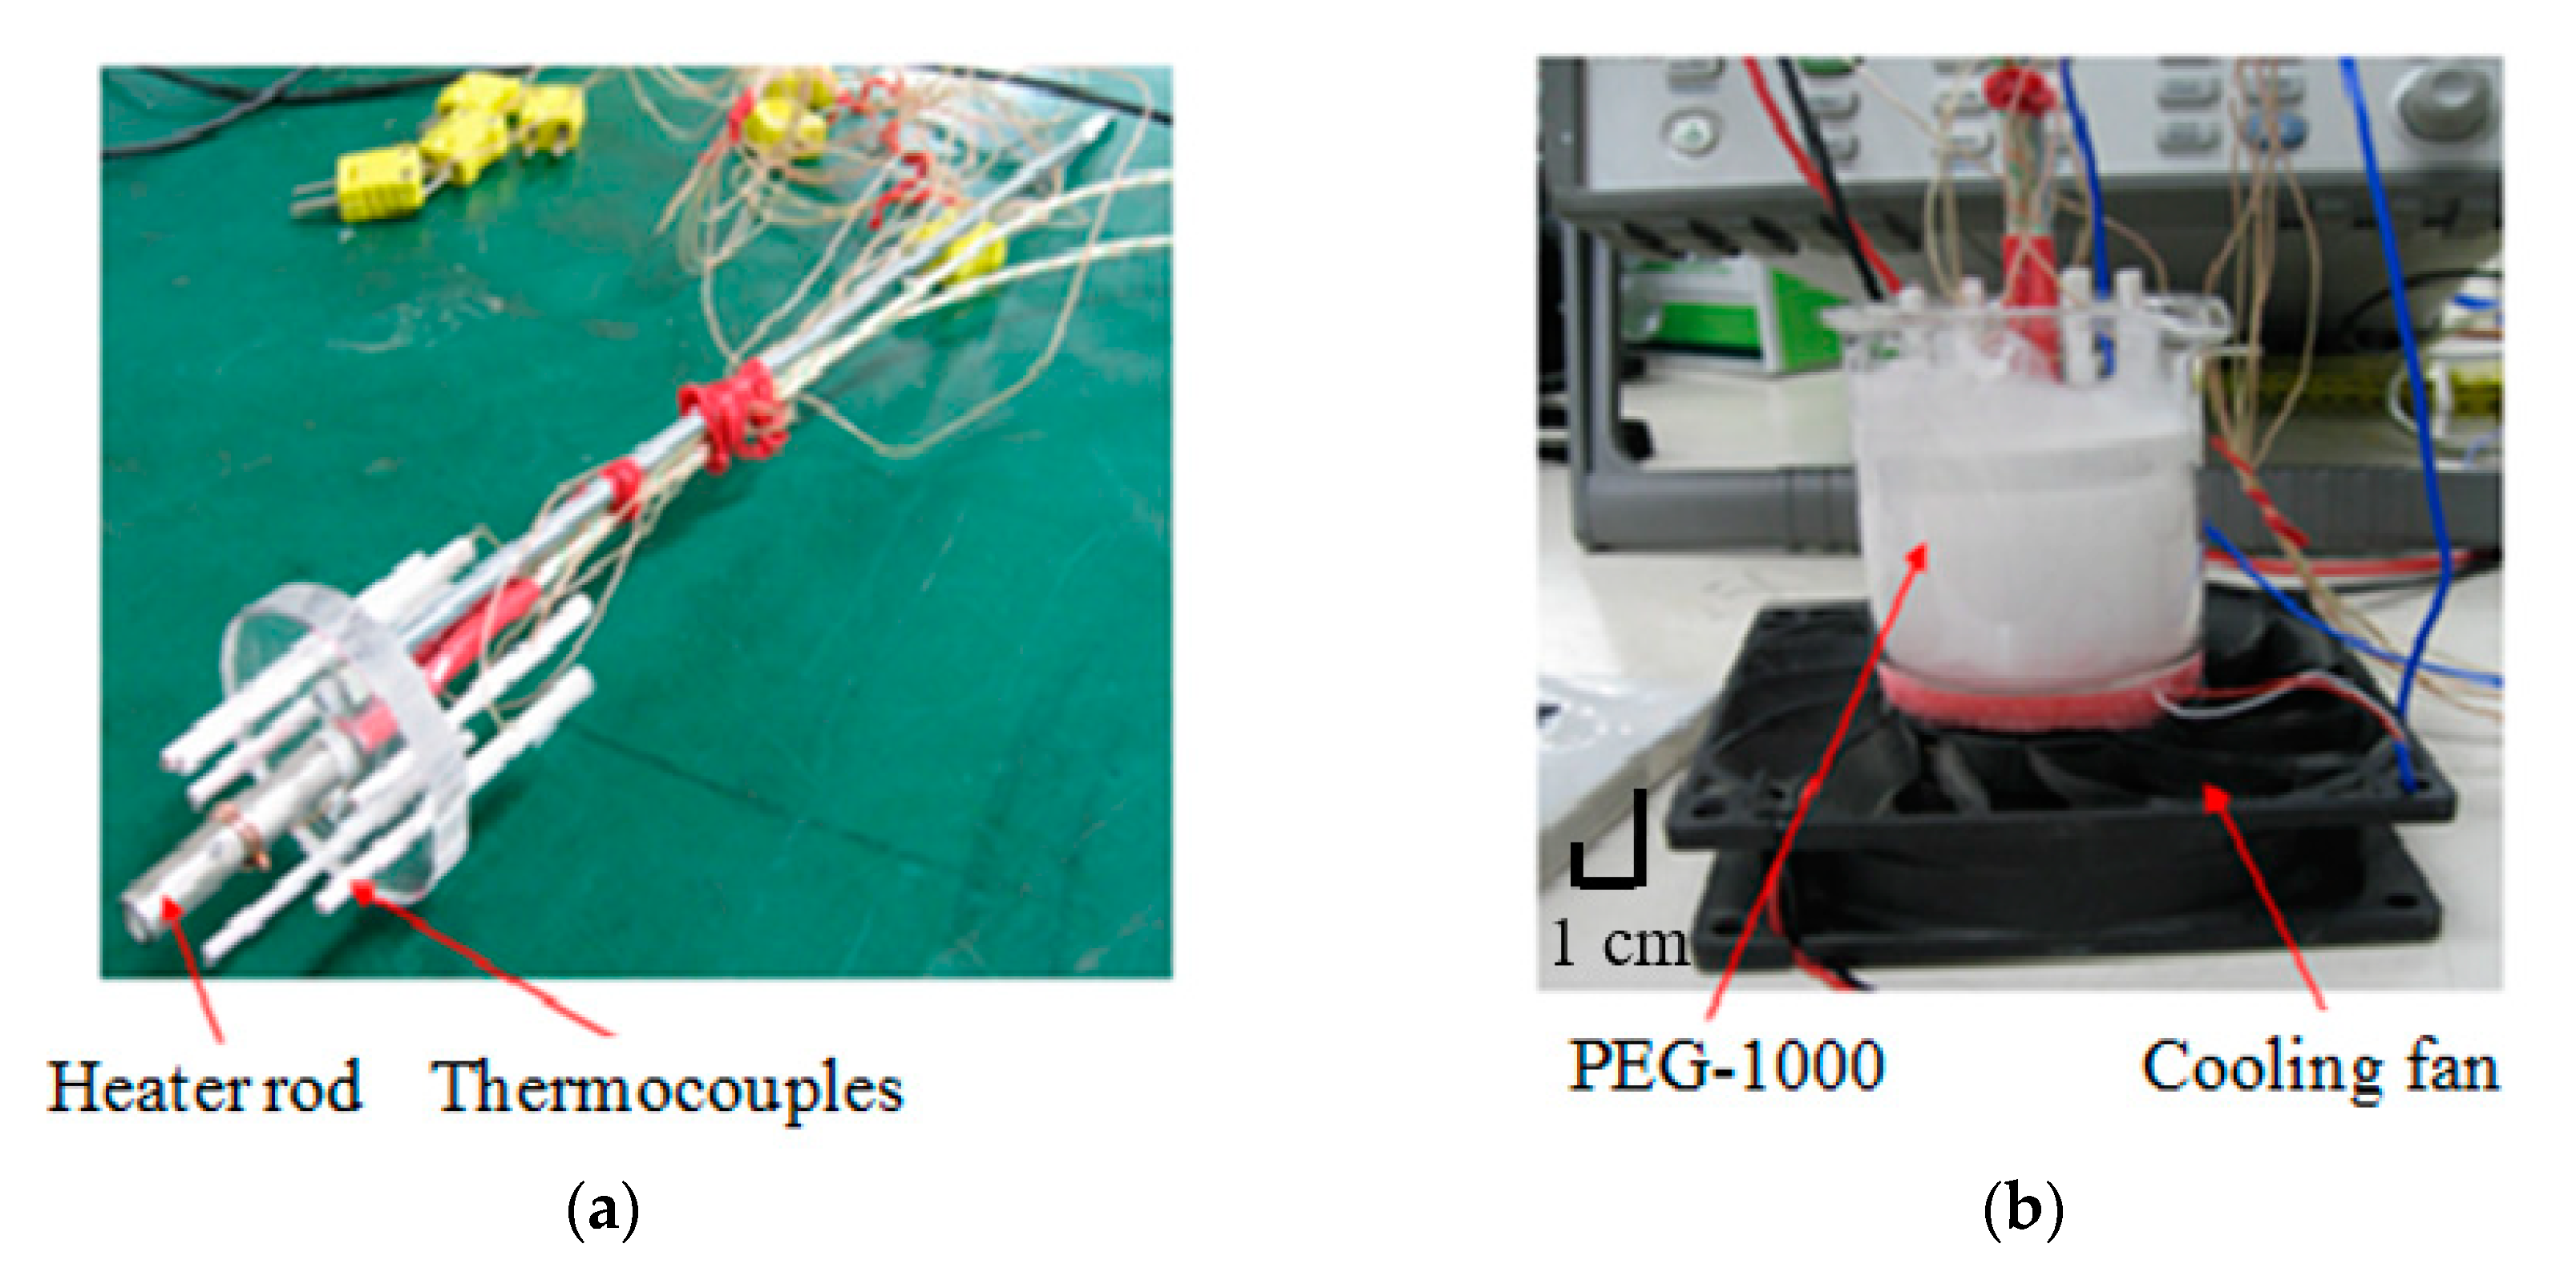
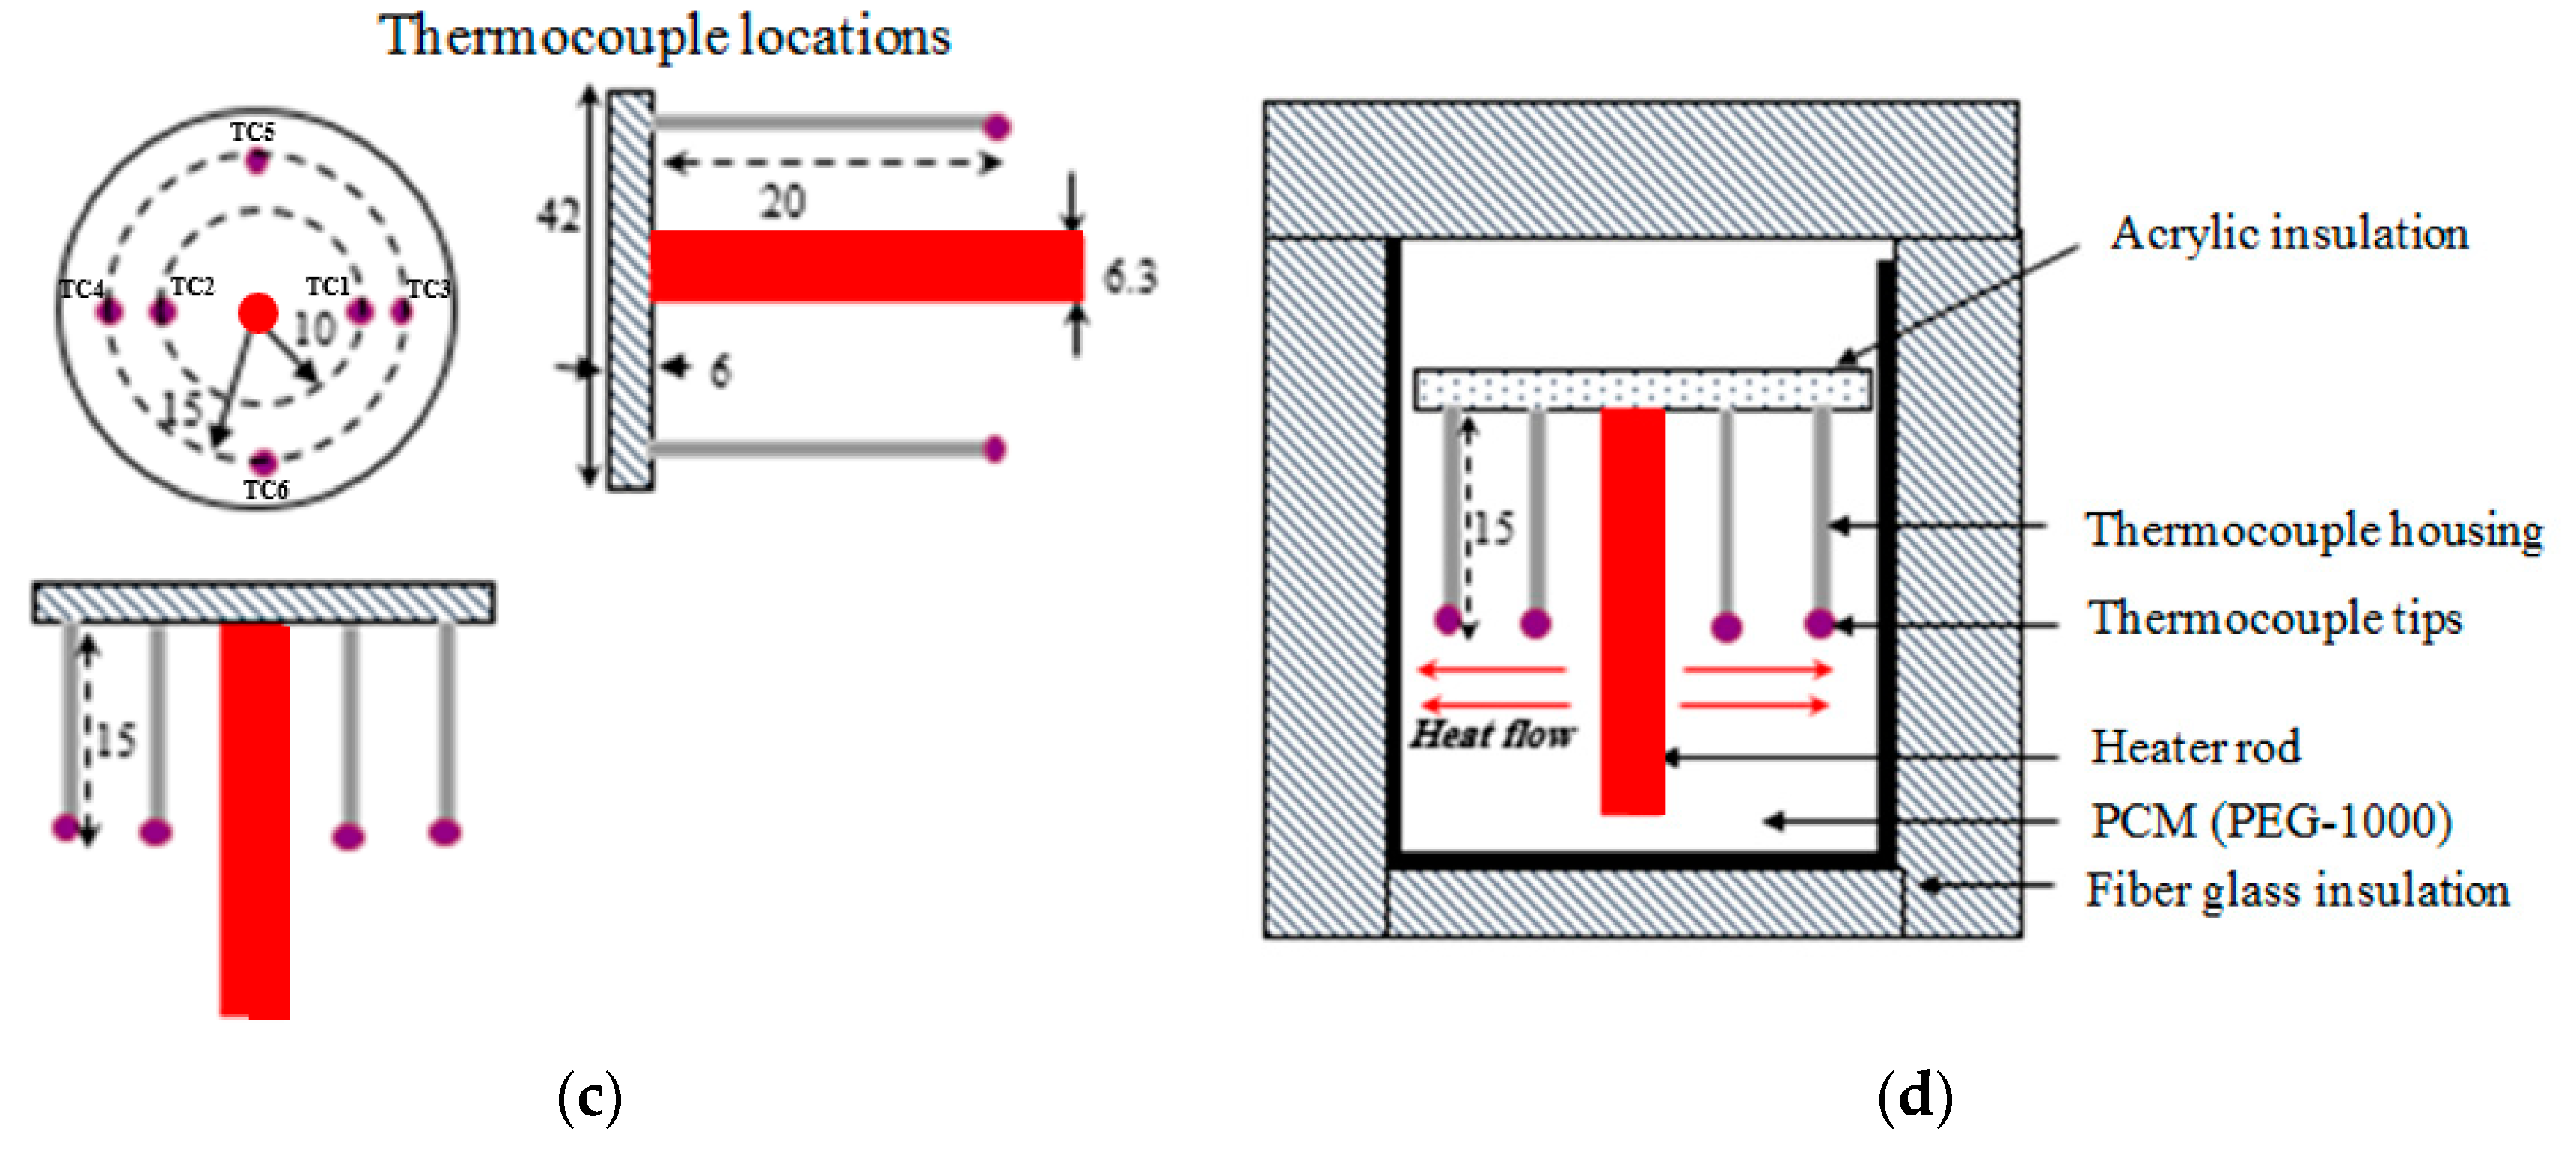
3.2.5. Thermal Conductivity Measurement Set-Ups

Flat and cylindrical configurations were employed in order to accurately measure the thermal conductivity of PEG-1000. In flat configuration method, heat flows upward one-dimensionally (i.e., Y-direction) through the solid PCM sample between two flat copper plates as illustrated in Figure 4.
In this set-up, the distance between the plates (thickness of the PCM) is 10.15 mm. Possible avenues for heat leakages in this method are also shown in Figure 4. As can be observed in this figure, heat is delivered to the PCM by means of a heater block containing two cartridge heaters. Acrylic container and a duct are placed around the PCM. In order to minimise the heat losses to the ambient, an insulation block is used. The effect of possible heat loss through this insulation layer will be further discuss later in this paper. It should be pointed out that TC-1, -2, and -3 are fixed on metallic surface and present at the heating interface, so it is not possible to note any heat losses (i.e., mainly a function of exposed surface area) from these thermocouples, as most of these TCs will register temperature close to each other. For cooling purposes, air exiting a centrifugal fan flows through the acrylic duct located above the PCM container. Based on the experimental data, it was observed that thermocouple readings (on heated or cooled side) across PCM sample were within +/− 0.01 °C, which confirm uniform heating/cooling of PCM material and the integrity of experimental set-up.
In cylindrical configuration method, heat radially flows through the wall of a hollow cylinder, which is filled with PEG-1000. The components of the experimental set-up, related to the cylindrical configuration method, are shown in Figure 5.
The test set-up consists of thermocouple housing, thermocouple tips, PCM, heater rod and acrylic insulation plate and fiber glass insulation material. The heat loss to the ambient although negligible (considering a near perfect thermal insulation used) in some cases, it can be a source of error or discrepancy in the results. This will be further discussed in the paper. The entire system is placed on a fan for cooling purpose. The air exiting the fan passes upward on outside of the cylinder. The experiment was conducted below the melting point of the PCM (37 °C). To avoid melting of the PCM, the rate of heat had was adjusted between 1 W and 5 W.

3.2.6. Melting Test on PCM

To describe the melting process of the PCM, the thermal energy generated by a heater rod is radially transferred to PEG-1000 under different constant values of input power. The configuration of the experimental set-up used for melting test on the PCM is the same as that shown in Figure 5. It is important to mention that melting commencement and finish for the PCM samples are approximated from the thermocouple readings. In this case, the error associated with thermocouple location on estimation of melting start and finish has been neglected.

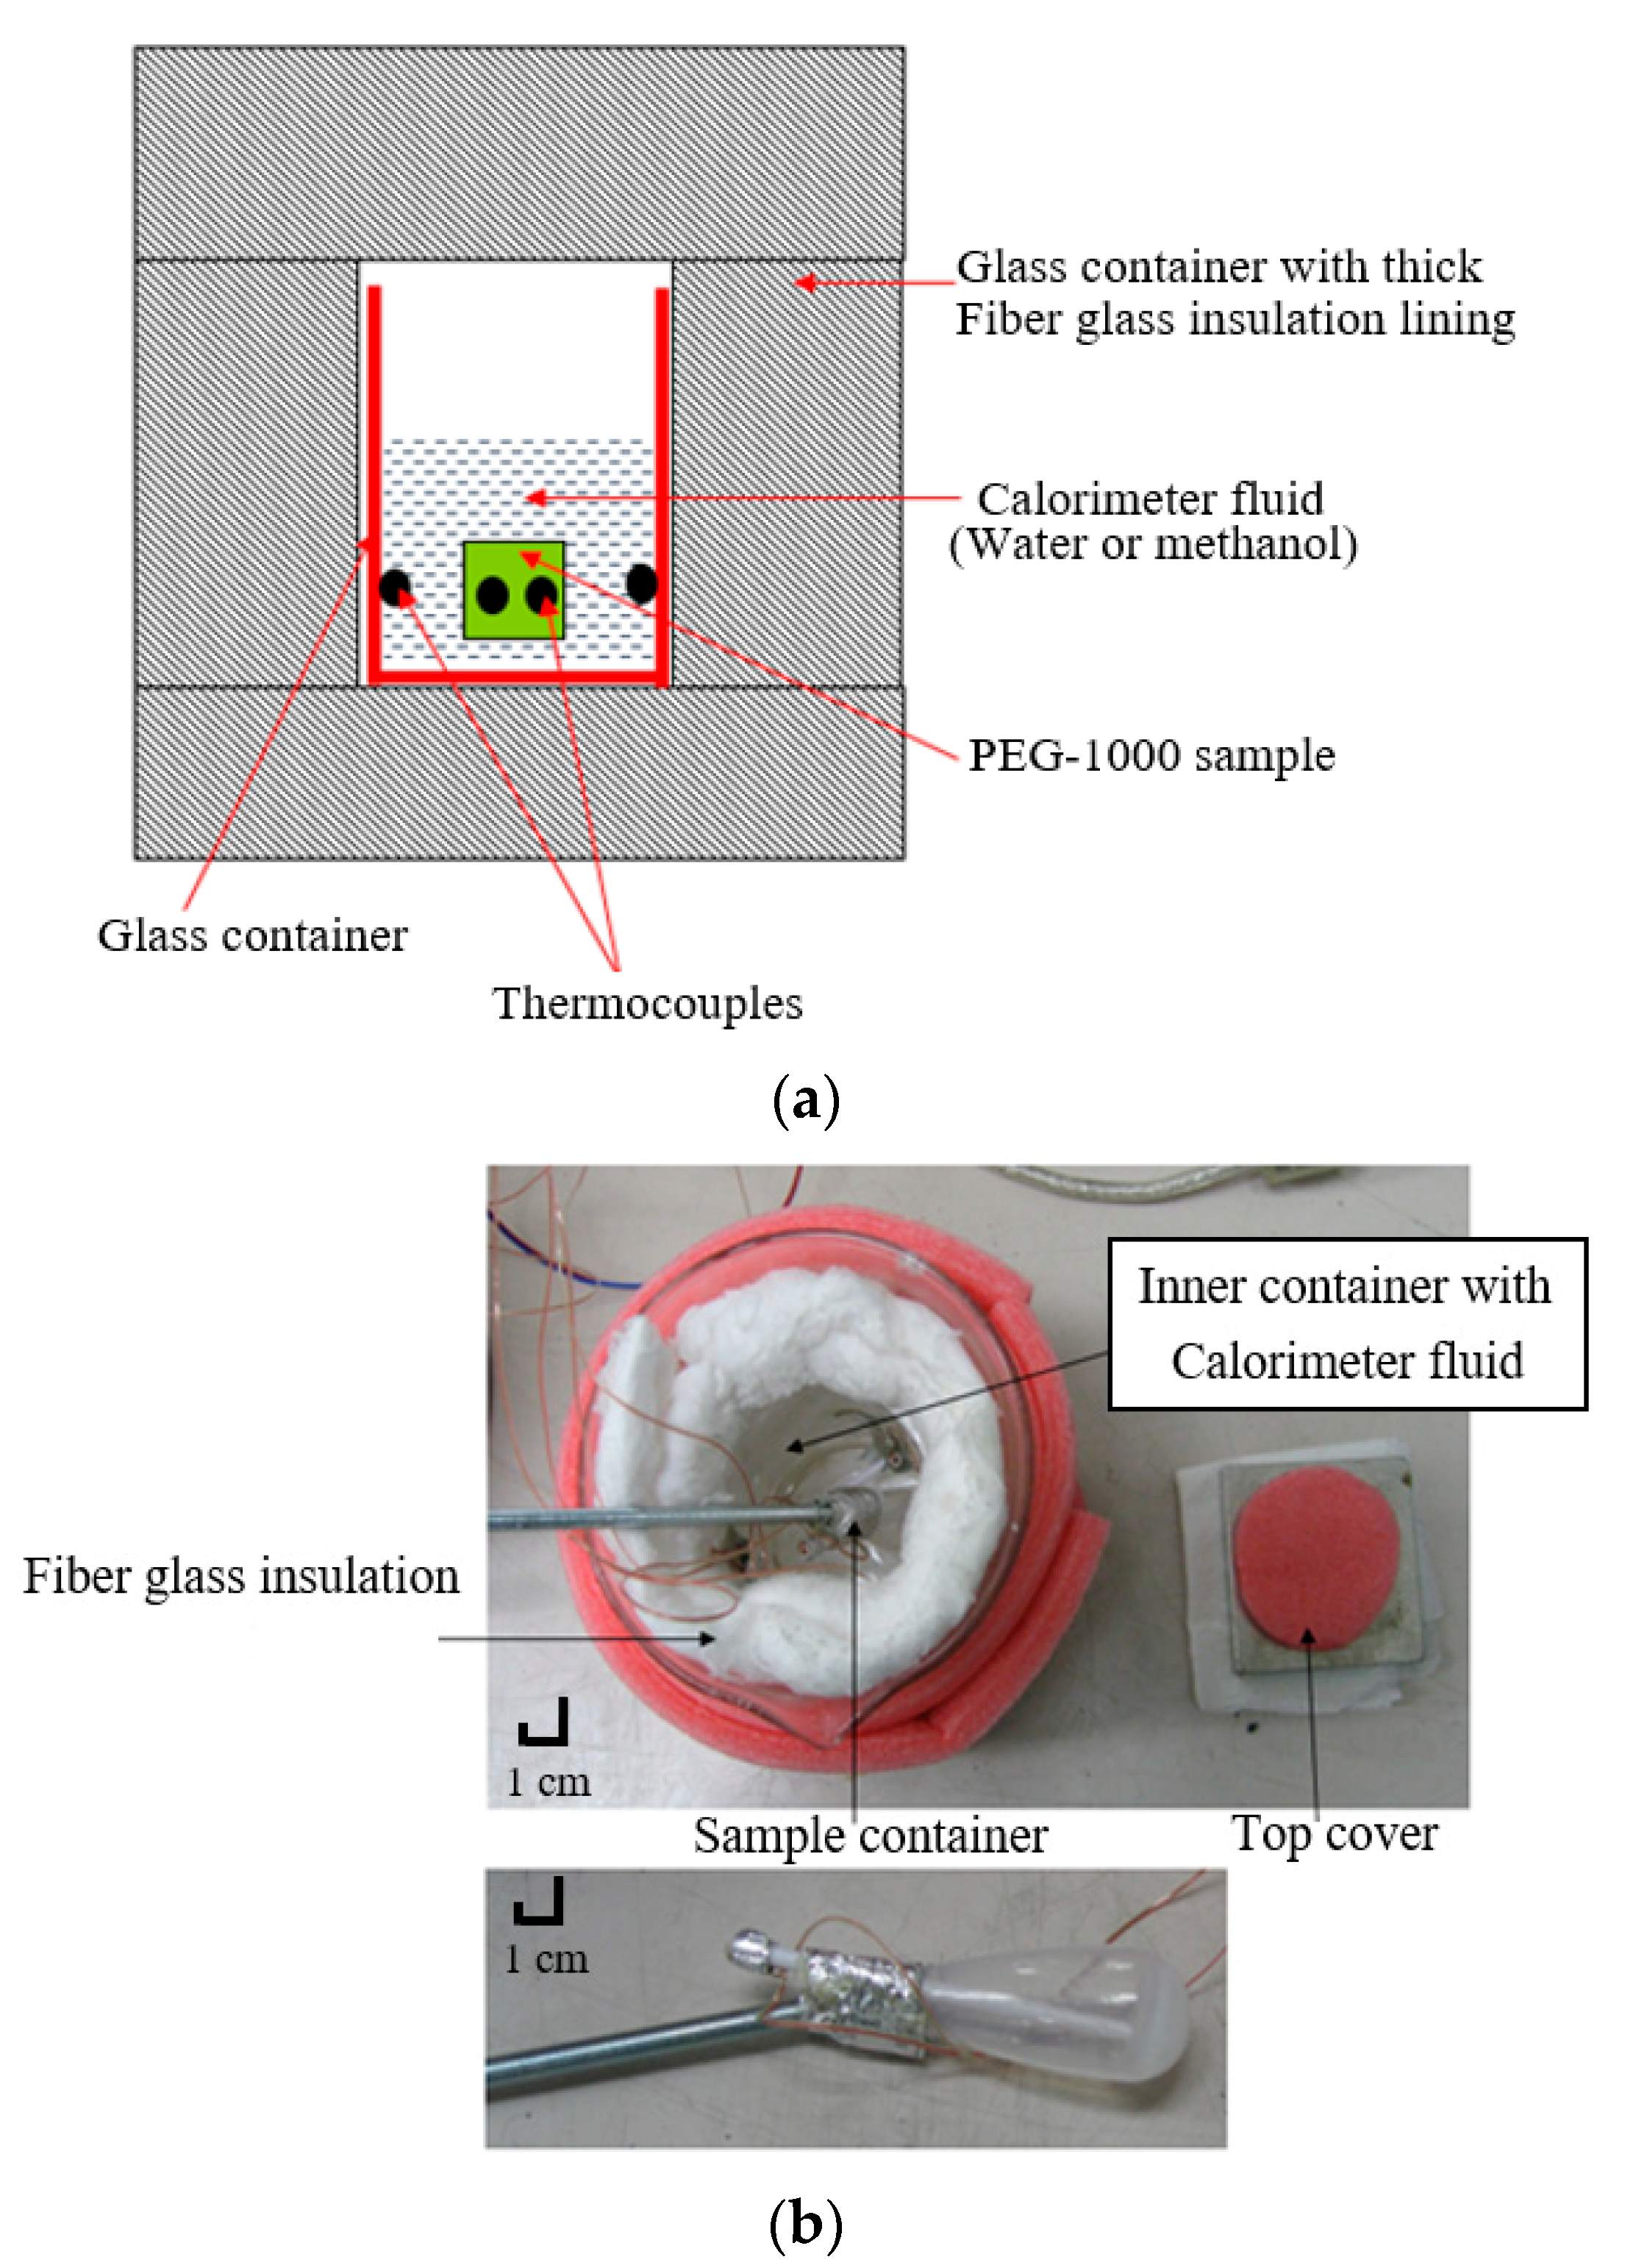
3.2.7. Specific Heat Measurement in Solid State

For measuring the specific heat of the PCM, an experimental approach, namely calorimetry method, is utilized. The details of this set-up are illustrated in Figure 6. An important assumption here is that the thermal capacity of the container has been neglected.
According to Figure 6, the set-up consists of a calorimeter fluid, PCM sample container (i.e., made of thin walled polyethylene, placed inside the calorimeter fluid), glass container, T-type thermocouples, and fiber glass insulation block. This insulation layer was assumed to be perfect making heat losses from the system zero. Water and methanol are separately considered and tested as calorimeter fluids. The main motivation behind using methanol as a working fluid is that experimental values closer to actual values could be achieved due to its lower latent heat (i.e., the error of the experiment is minimum). The word ‘actual’ used in the paper is referred to the real values provided by the manufacturers/suppliers or those reference data available in the handbooks. These data are used as reference points to show the accuracy of the measurements.
In the present experimental investigation, inaccuracies in the measurement of thermal conductivity is mainly coming from errors of instrumentations used in the test set-up, which includes T-type thermocouples, power-meter, and dimensional measurement devices, neglecting the thermal capacity of the container, and assuming the heat losses from the experimental setup is zero. Agilent Datalogger HP34970A is used for measuring the temperatures. The thermocouples used in the set-up had an accuracy of +/− 0.5 °C, the power meter was able to measure current with accuracy of +/− 0.01 A and voltage with the accuracy of +/− 0.1 V, and the Vernier calliper used to measure dimensions of the test sample had an accuracy of +/− 0.01 mm.

4. Results and Discussion

4.1. Thermal Conductivity Measurement

Figure 7 depicts the increments in the PCM effective thermal conductivity resulted from using each of the techniques described in Section 3. According to this figure, the values of effective thermal conductivity for pure PEG-1000, composite PCM containing 0.78 wt% and 2.5 wt% carbon powder for uniform heating case, PCM with aluminum fins, and PCM with carbon fins, are found to be 0.22 W/(m·K), 0.27 W/(m·K), 0.29 W/(m·K), 9.4 W/(m·K), and 7.03 W/(m·K), respectively. As can be seen in the figure, by introducing a fin stack the effective thermal conductivity could be improved significantly by more than 42 times with Al fins and 33 times with carbon fins. It is noteworthy that even though planar thermal conductivity of carbon (up to 500 W/m K) is greater than aluminum (~210 W/(m·K)), the effective thermal conductivity of PCM with Al fins was measured to be higher due to high fin density and uniform fins distribution in the case of Al fin stack. Although the effect of carbon on hysteresis was not investigated in details as part of this study, during the experiment, no differences on PCM melting/solidification were observed for cases with and without carbon.

4.2. Temperature Distribution

In Figure 8, the variations of heater rod temperature and temperature distributions along the inner and outer radiuses of the cylinder measured by the thermocouples, with respect to heat load are illustrated. This graph confirms the isentropic thermal properties of the PEG-1000, as evident from the temperature distribution inside the bulk of the experimental sample. For measuring the temperature by means of cylindrical configuration method, maximum and minimum errors of instrumentation are found to be 16% and 4.3%, respectively.

4.3. PCM Melting Process

Figure 9a–c shows the variations of temperature with time during continuous heating process at different values of input power. As a matter of fact, the temperature evolutions for different power loads helps to understand how heat propagates through the PCM as well as melting/solidification hysteresis. Investigation of these processes further helps provide a basis for thermal conductivity enhancement. In these figures, heater temperature and PCM temperature distributions along the inner and outer radii are indicated. As previously mentioned, maximum and minimum errors of instrumentation due to the experimental set-up are found to be 16% and 4.3%, respectively. It should be clarified that in the graphs presented, melting starts when the temperature starts getting stable after initial increase, and melting stops when the temperature starts to increase again, after PCM has completely melted. Figure 9a illustrates the heat exchanging process inside the PCM test sample under 1.04 W input power in six hours. With regard to this figure, initially the solid PCM receives heat leading to increase in time-dependent temperature. Afterwards, melting process starts and continues until the solid PCM transforms to liquid phase. The PCM temperature rises slightly within the melting zone. Finally, the heat is delivered to liquid PCM and the temperature increases with a steeper slope. It is noteworthy that, in the final process, the temperature curves converges, indicating the melting of the entire PCM. For the thickness of the sample 20 mm, the temperature curve for the thermocouple located in the middle of the sample provided a good thermodynamic analysis of the overall sample. The melting temperature ranges from 37.3 °C to 41.1 °C.
Figure 9b shows the heating process of the PCM test sample under 2.34 W of input power in about 2.5 hours. For this value of input power, the melting temperature of PEG-1000 ranges from ~37.7 °C to ~40.18 °C. It can be implied from Figure 9b that the melting time for PCM closer to the heater is shorter than the bulk of PCM. Owing to the location of temperature measurement points, the sensors located in the bulk of PCM would register lower melting time due to their distance from heater rod, which represents the proportional extent of PCM being melted.
Heating process for PCM test sample with 3.15 W input power for 1 hour and 40 minutes is delineated in Figure 9c. With this value of input power, melting temperature of the PCM ranges from 37.1 °C to 41.3 °C.
Regarding Figure 9a–c, the temperature trend of PCM sample under constant heating condition is a closely linked to the input power. An increment in heat load results in localized melting of the PCM due to high thermal resistance (low thermal conductivity) as demonstrated in these graphs. Melting time is approximately equal to the time in which heater temperature is constant. It should be pointed out that initiation of melting takes place at around 37 °C and continues until above 40 °C depending on the input heat loads.

4.4. PCM Solidification Process

Figure 10 shows the solidification process of the PCM in about three hours. As indicated by this figure, initially liquid PCM cools down to the solidification temperature followed by the start of solidification process as specified in the figure. It should be stated that the solidification process occurs at a nearly constant temperature for bulk of the PCM due to high heat transferred through convection in liquid phase. After solidification of all the liquid PCM, heat is further removed from the solid PCM. In this case, cooling is done by forced convection using a fan. According to Figure 10, solidification temperature of the considered PCM ranges from ~33.6 °C to ~34.9 °C. It is observed that the solidification temperature is always less than melting temperature. Furthermore, the solidification process is faster than the melting process and the PCM needs sub-cooling of 3–4 °C for solidification.

4.5. Latent Heat Capacity

Latent heat of melting for the PCM can be approximated by the melting curves presented in Figure 9a–c. During melting of the PCM, heater surface temperature is almost constant. For very low values of input heat load, the values of latent heat are higher due to heat losses to the ambient as the experiment took very longer time. Heat losses to the ambient mainly depend on the experimental melting time apart from other factors, and can be neglected, specially when the melting time is short. Low input power, however, provides a very good approximation of the melting zone due to low temperature gradient. High heat loads decrease heat losses due to smaller experimental time but produce high temperature gradient across PCM thickness. Table 2 presents the results of latent heat capacity extracted from the PCM melting curves.
The actual value of the PCM latent heat, as provided by supplier, was 155.4 kJ/kg. In Table 2, a comparison is made between the values of latent heat, values of input power, and the actual value of the PCM latent heat. As indicated before, the main reason for larger error is that ambient heat losses are a function of time. Hence, if the experimental time is longer, then there will be larger losses that result in larger discrepancies in calculated values. According to results, when the values of input power are 2.34 W and 3.15 W, the obtained values of latent heat are closer to the actual value of the PCM latent heat, 160.51 kJ/kg, and 159.56 kJ/kg, respectively. It is worth mentioning that the melting time (related to these values of input power) is 1 hour and 1 min, and 45 min, respectively.

4.6. Specific Heat Capacity Measurement

Determination of solid PCM specific heat, C p , from melting curve is difficult because of large temperature gradients across sample thickness. As previously discussed, to calculate the C p of the PCM, calorimetry method is employed. Figure 11 compares the value of actual specific heat with the obtained values of specific heat using water and methanol as calorimeter fluids.
As can be seen in Figure 11, methanol gives better results than water because of low of it lower thermal capacity (about 1.4 kJ/kg·K) compared to water (about 4.2 kJ/kg·K) leading to a higher temperature gradient during the experiment; hence, the outcomes would be more consistent and repeatable. Therefore, the calorimeter fluid, which does not dissolve the PCM sample, and have relatively low thermal capacity should be used. PCM sample size is a very important factor to be considered. Smaller sample sizes provide better results due to proper heat distribution inside the sample owing to their relatively low thermal resistance. However, it must be noted that the temperature changes for smaller samples are very small that makes the output values from the experiment very sensitive to temperature measurements.

4.7. Validation

For validation purposes, the values of the PCM thermal conductivity obtained by flat and cylindrical configuration methods are compared with the actual value of thermal conductivity provided by the supplier. In Figure 12, the variations of the PCM thermal conductivity with power, obtained from flat and cylindrical configuration methods, are illustrated. In flat configuration method, minimum and maximum errors of instrumentation are 4.22% and 8.32%, respectively.
According to Figure 12, the experimental values of thermal conductivity measured by flat configuration method are higher than the actual value of the PCM thermal conductivity provided be the supplier. The discrepancy between the data is mainly due to the heat leakages from the experimental set-up to the environment that was indicated before as a possible source of error. In the cylindrical configuration method, the experimental values of the PCM thermal conductivity have been measured to be in range of 0.2 W/(m·K) to 0.22 W/(m·K). In this case, minimum and maximum values of error were found to be 0.25% and 0.33%, respectively. It is notable that this is a typical thermal conductivity range for organic PCMs. As a result, the cylindrical method gives more accurate results as it significantly minimizes the ambient heat losses.

5. Conclusions

In this paper, several techniques for enhancing thermal conductivity of PCMs were experimentally studied. This included the addition of carbon powder and the introducing aluminum and carbon fins to a PCM selected for this study. PEG-1000 PCM with melting point of about 37 °C was used as a reasonable organic PCM for low-temperature thermal energy storage applications. Aluminum and carbon were used as heat transfer enhancers due to their low cost, light structure, and high thermal conductivity. In this study, 0.78–2.5% carbon powder was introduced to molten PCM containing PEG-1000 and the increment in the thermal conductivity was investigated. The effects of introducing aluminum and carbon fins on the thermal conductivity of the PCM was also investigated. For this purpose, aluminum heat sink with ~22.67% volume and ~41.5% weight of total system and carbon heat sink with ~24.7% volume and ~34% weight of total (PCM + fin stack) assembly were used. To measure the thermal conductivity of the PCM precisely, simple and easy to set-up experimental methods, referred to as flat and cylindrical configurations, were employed. Subsequently, the measured thermal conductivity values were compared with the actual thermal conductivity of pure PCM provided by PCM supplier. To calculate the melting and solidification zones of the PCM, melting and solidification processes were comprehensively studied under different heating conditions and by utilizing the experimental set-ups discussed in the paper. Following this, latent heat of melting for the PCM was measured under different values of input heat loads. Finally, the specific heat of the PCM in solid state was obtained using calorimetry method. Main findings of the present experimental study can be summarized as follows:
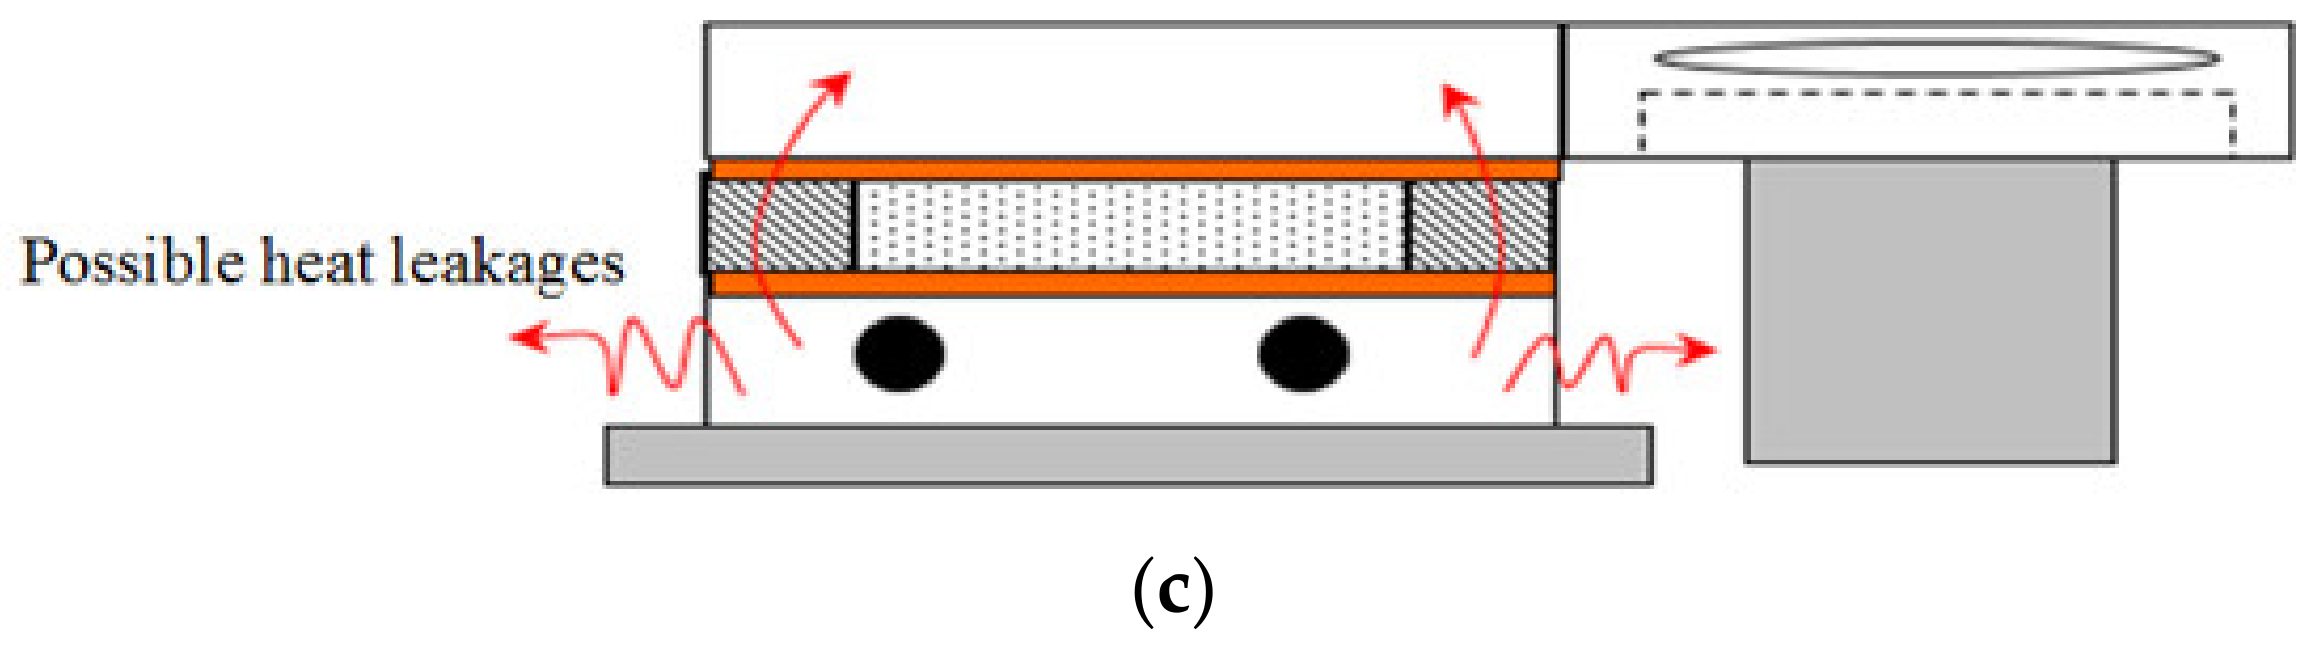
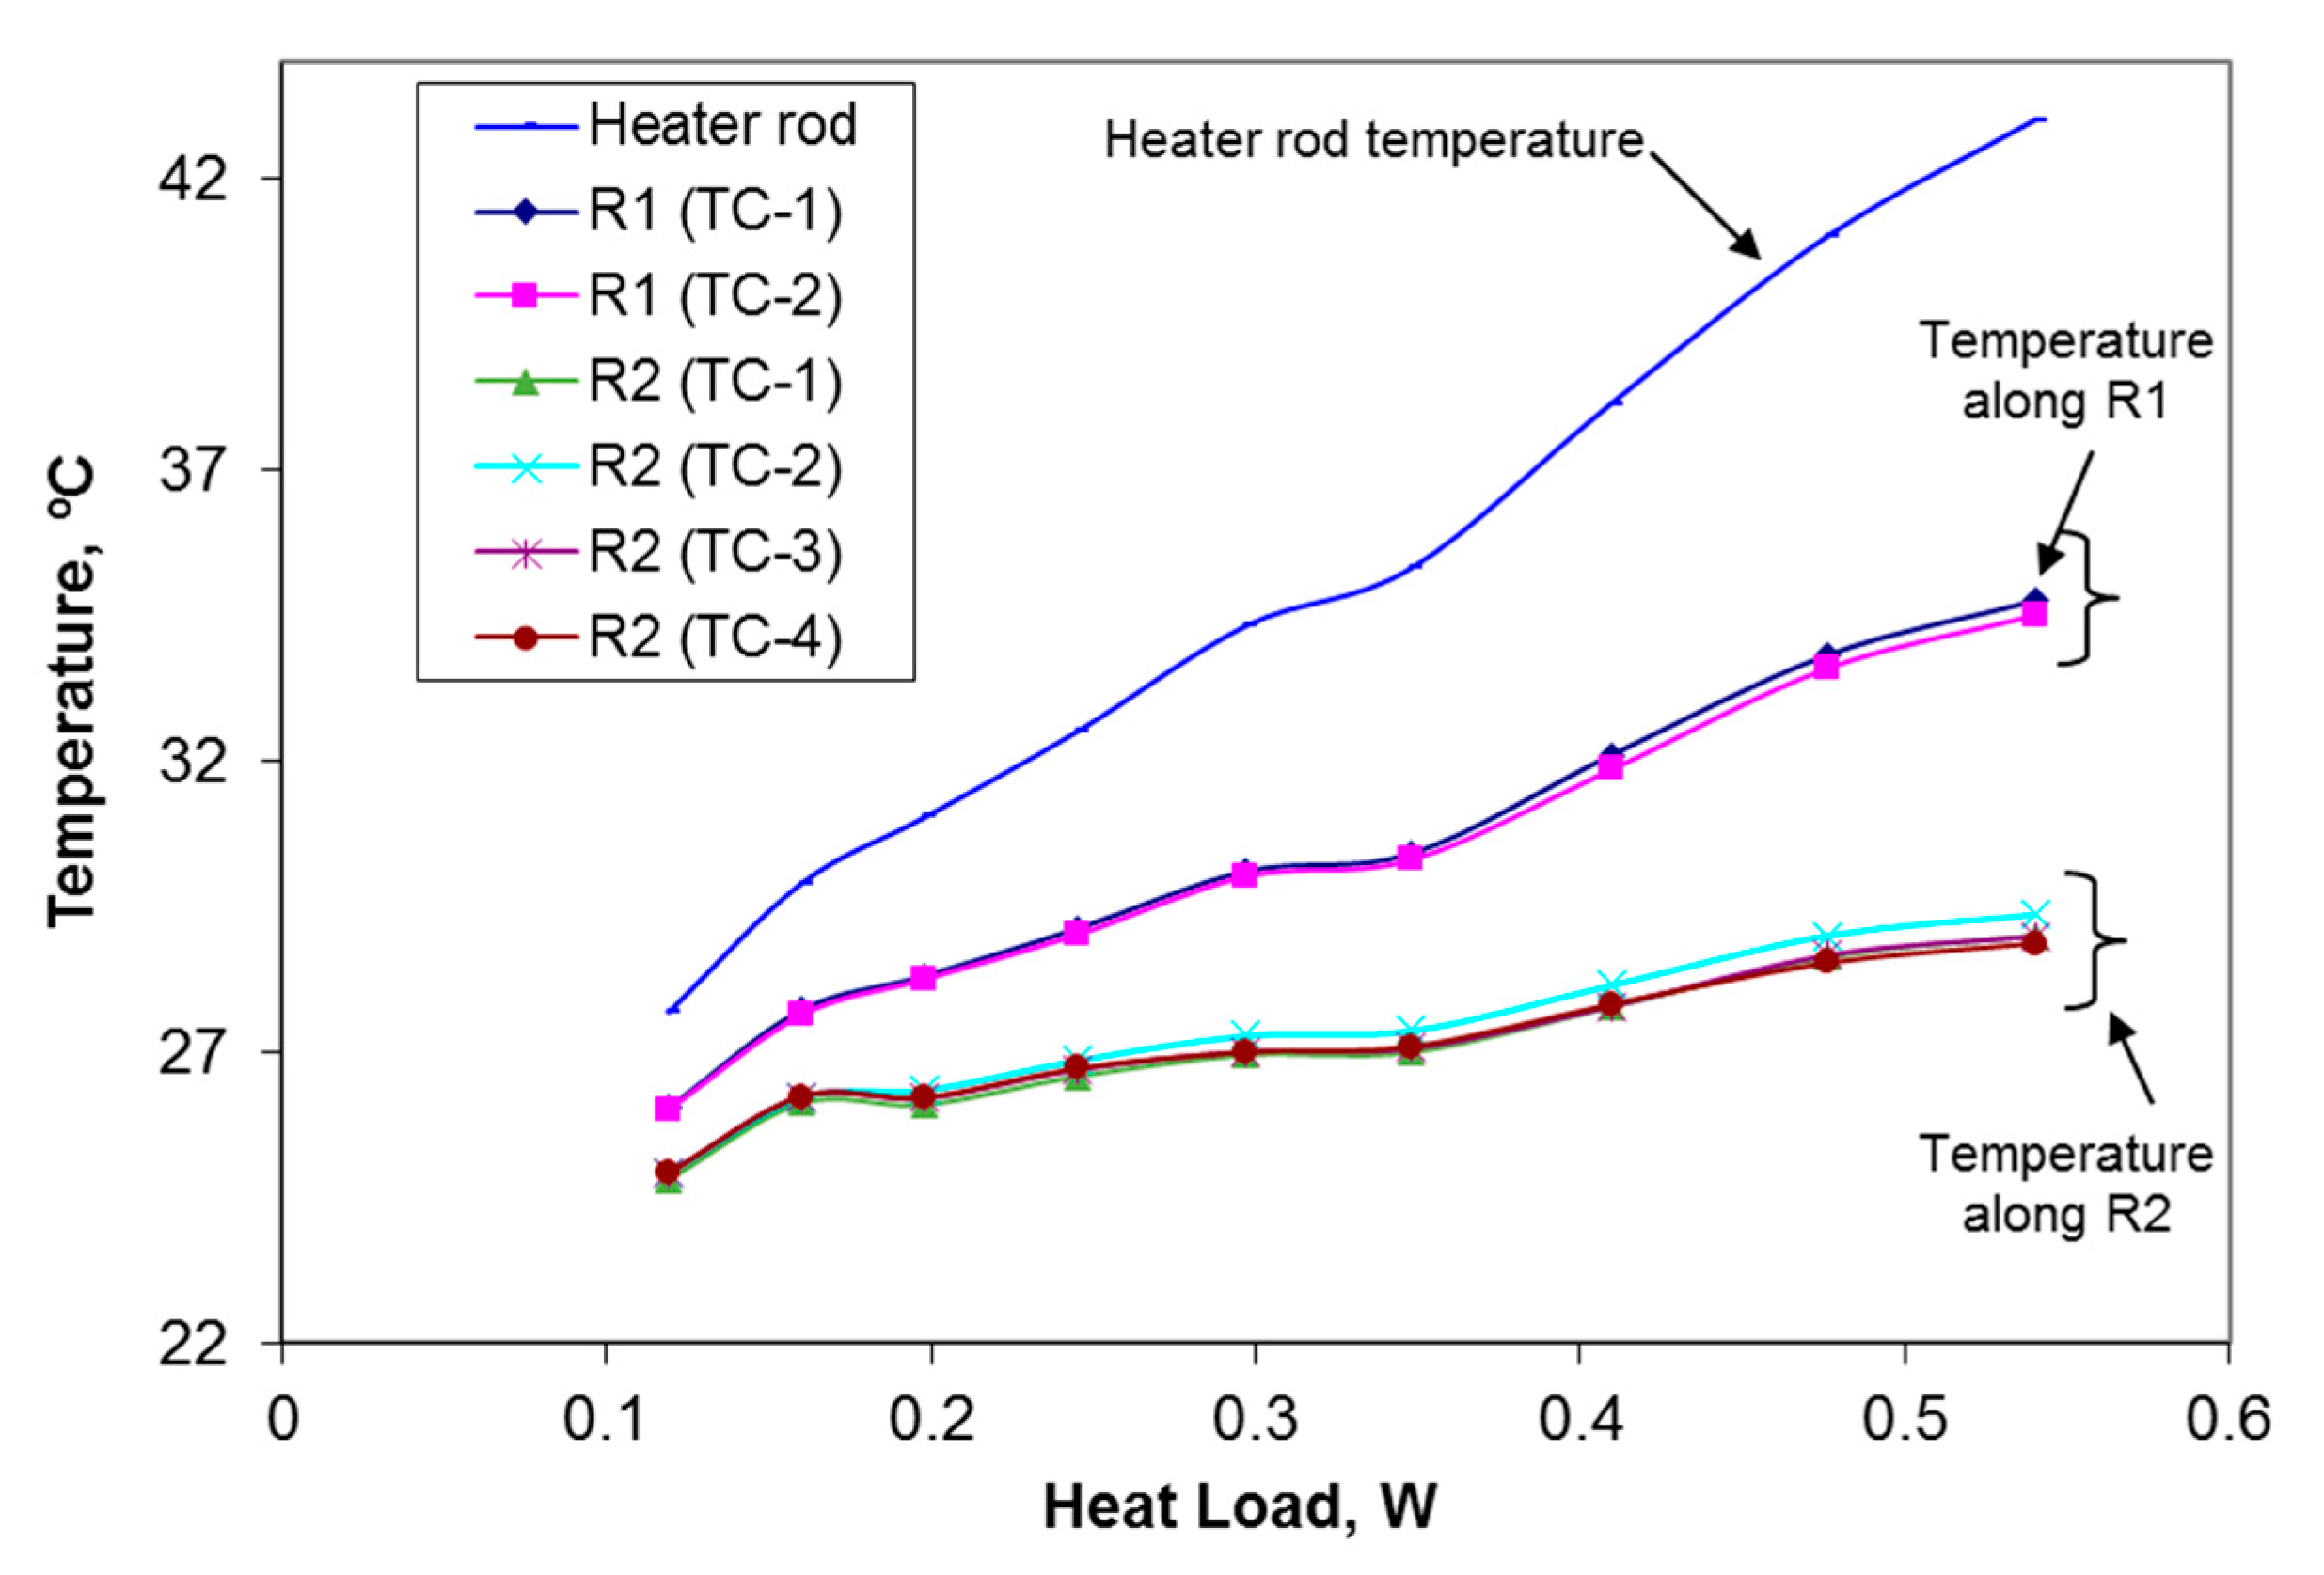
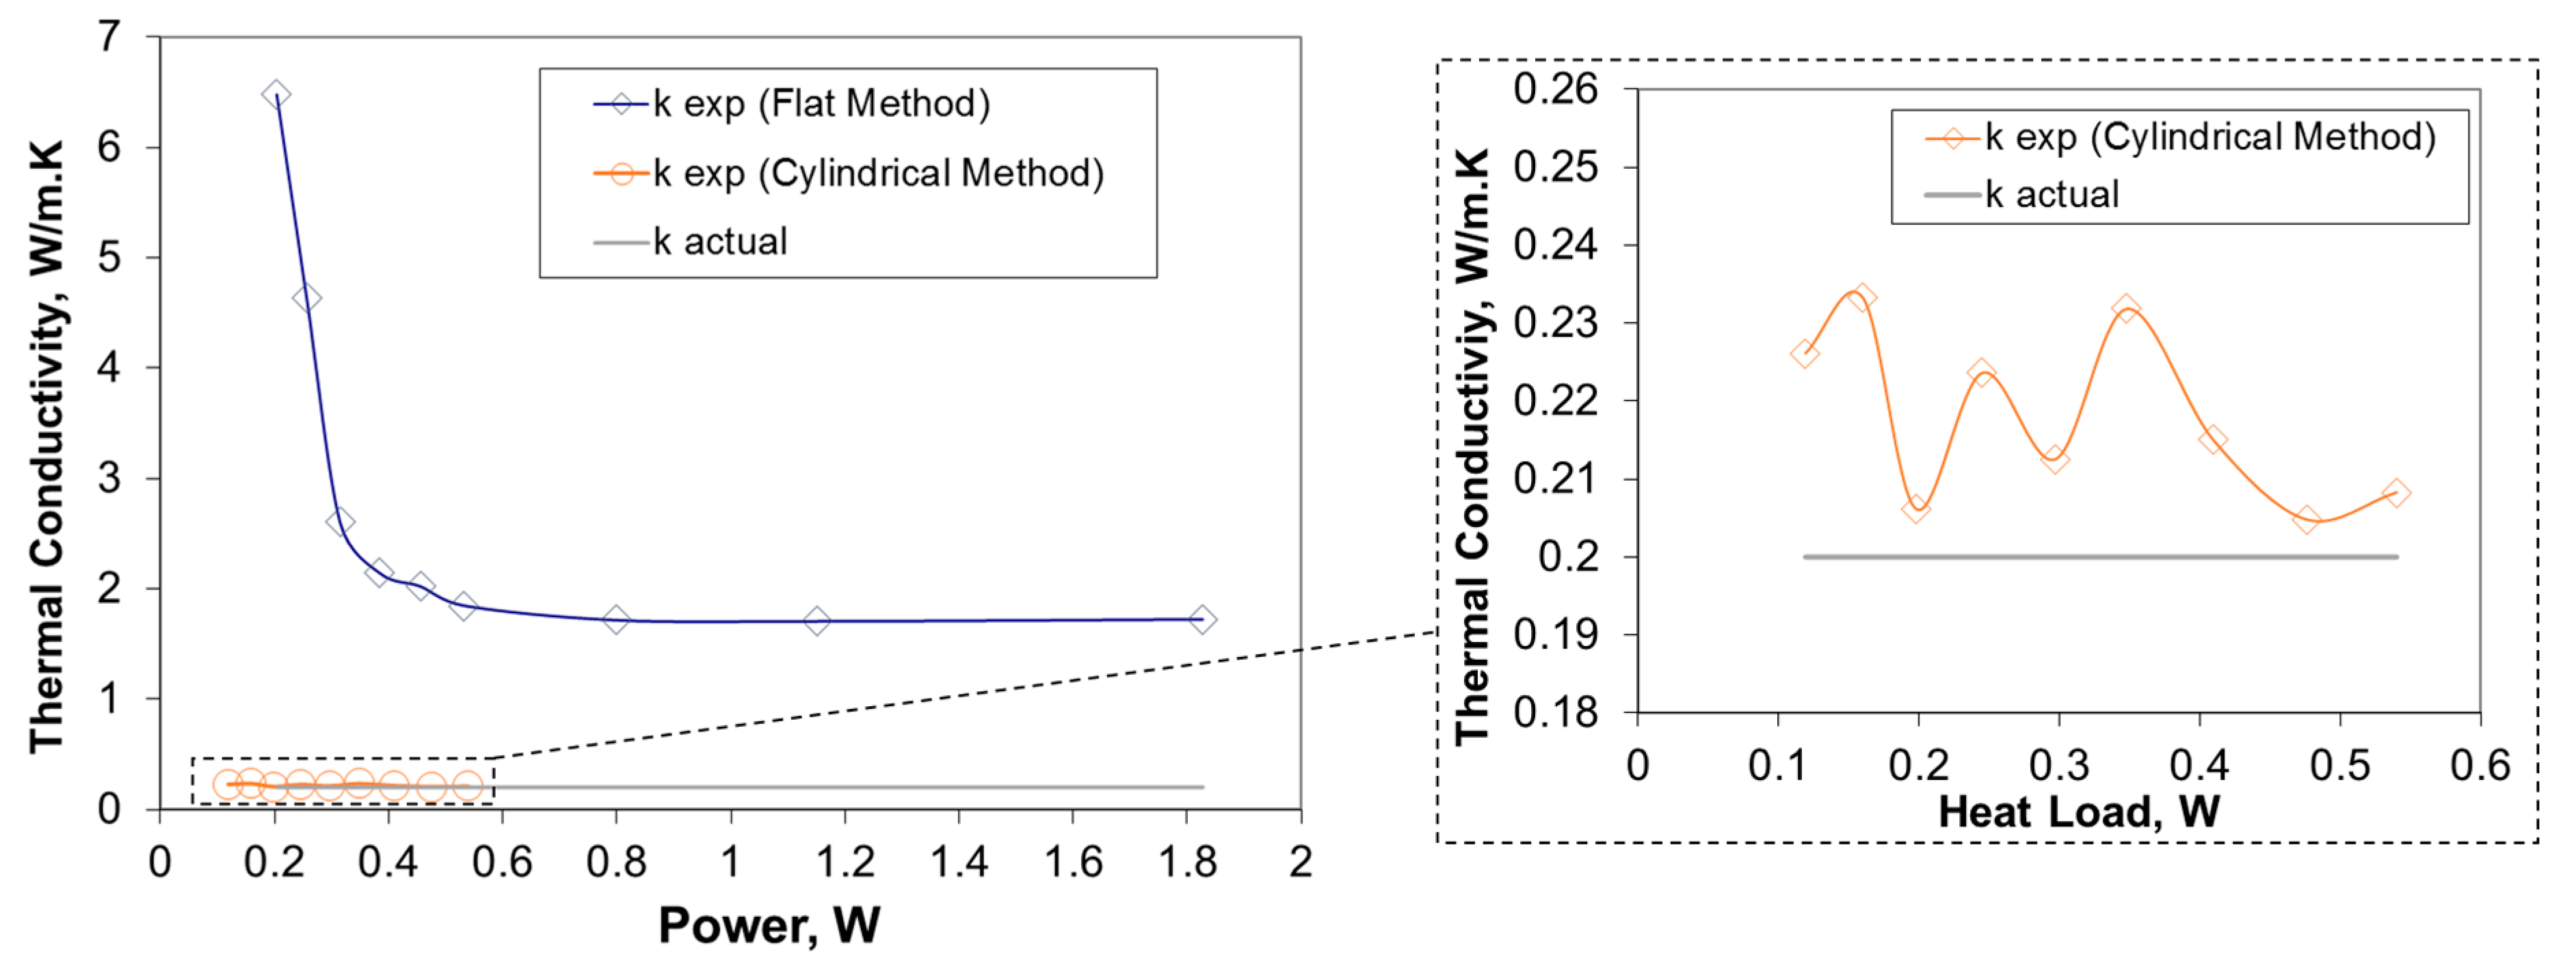
  • Due to relatively low ambient heat loss, the cylindrical configuration method was an efficient and accurate technique for measuring the thermal conductivity of the PCM.
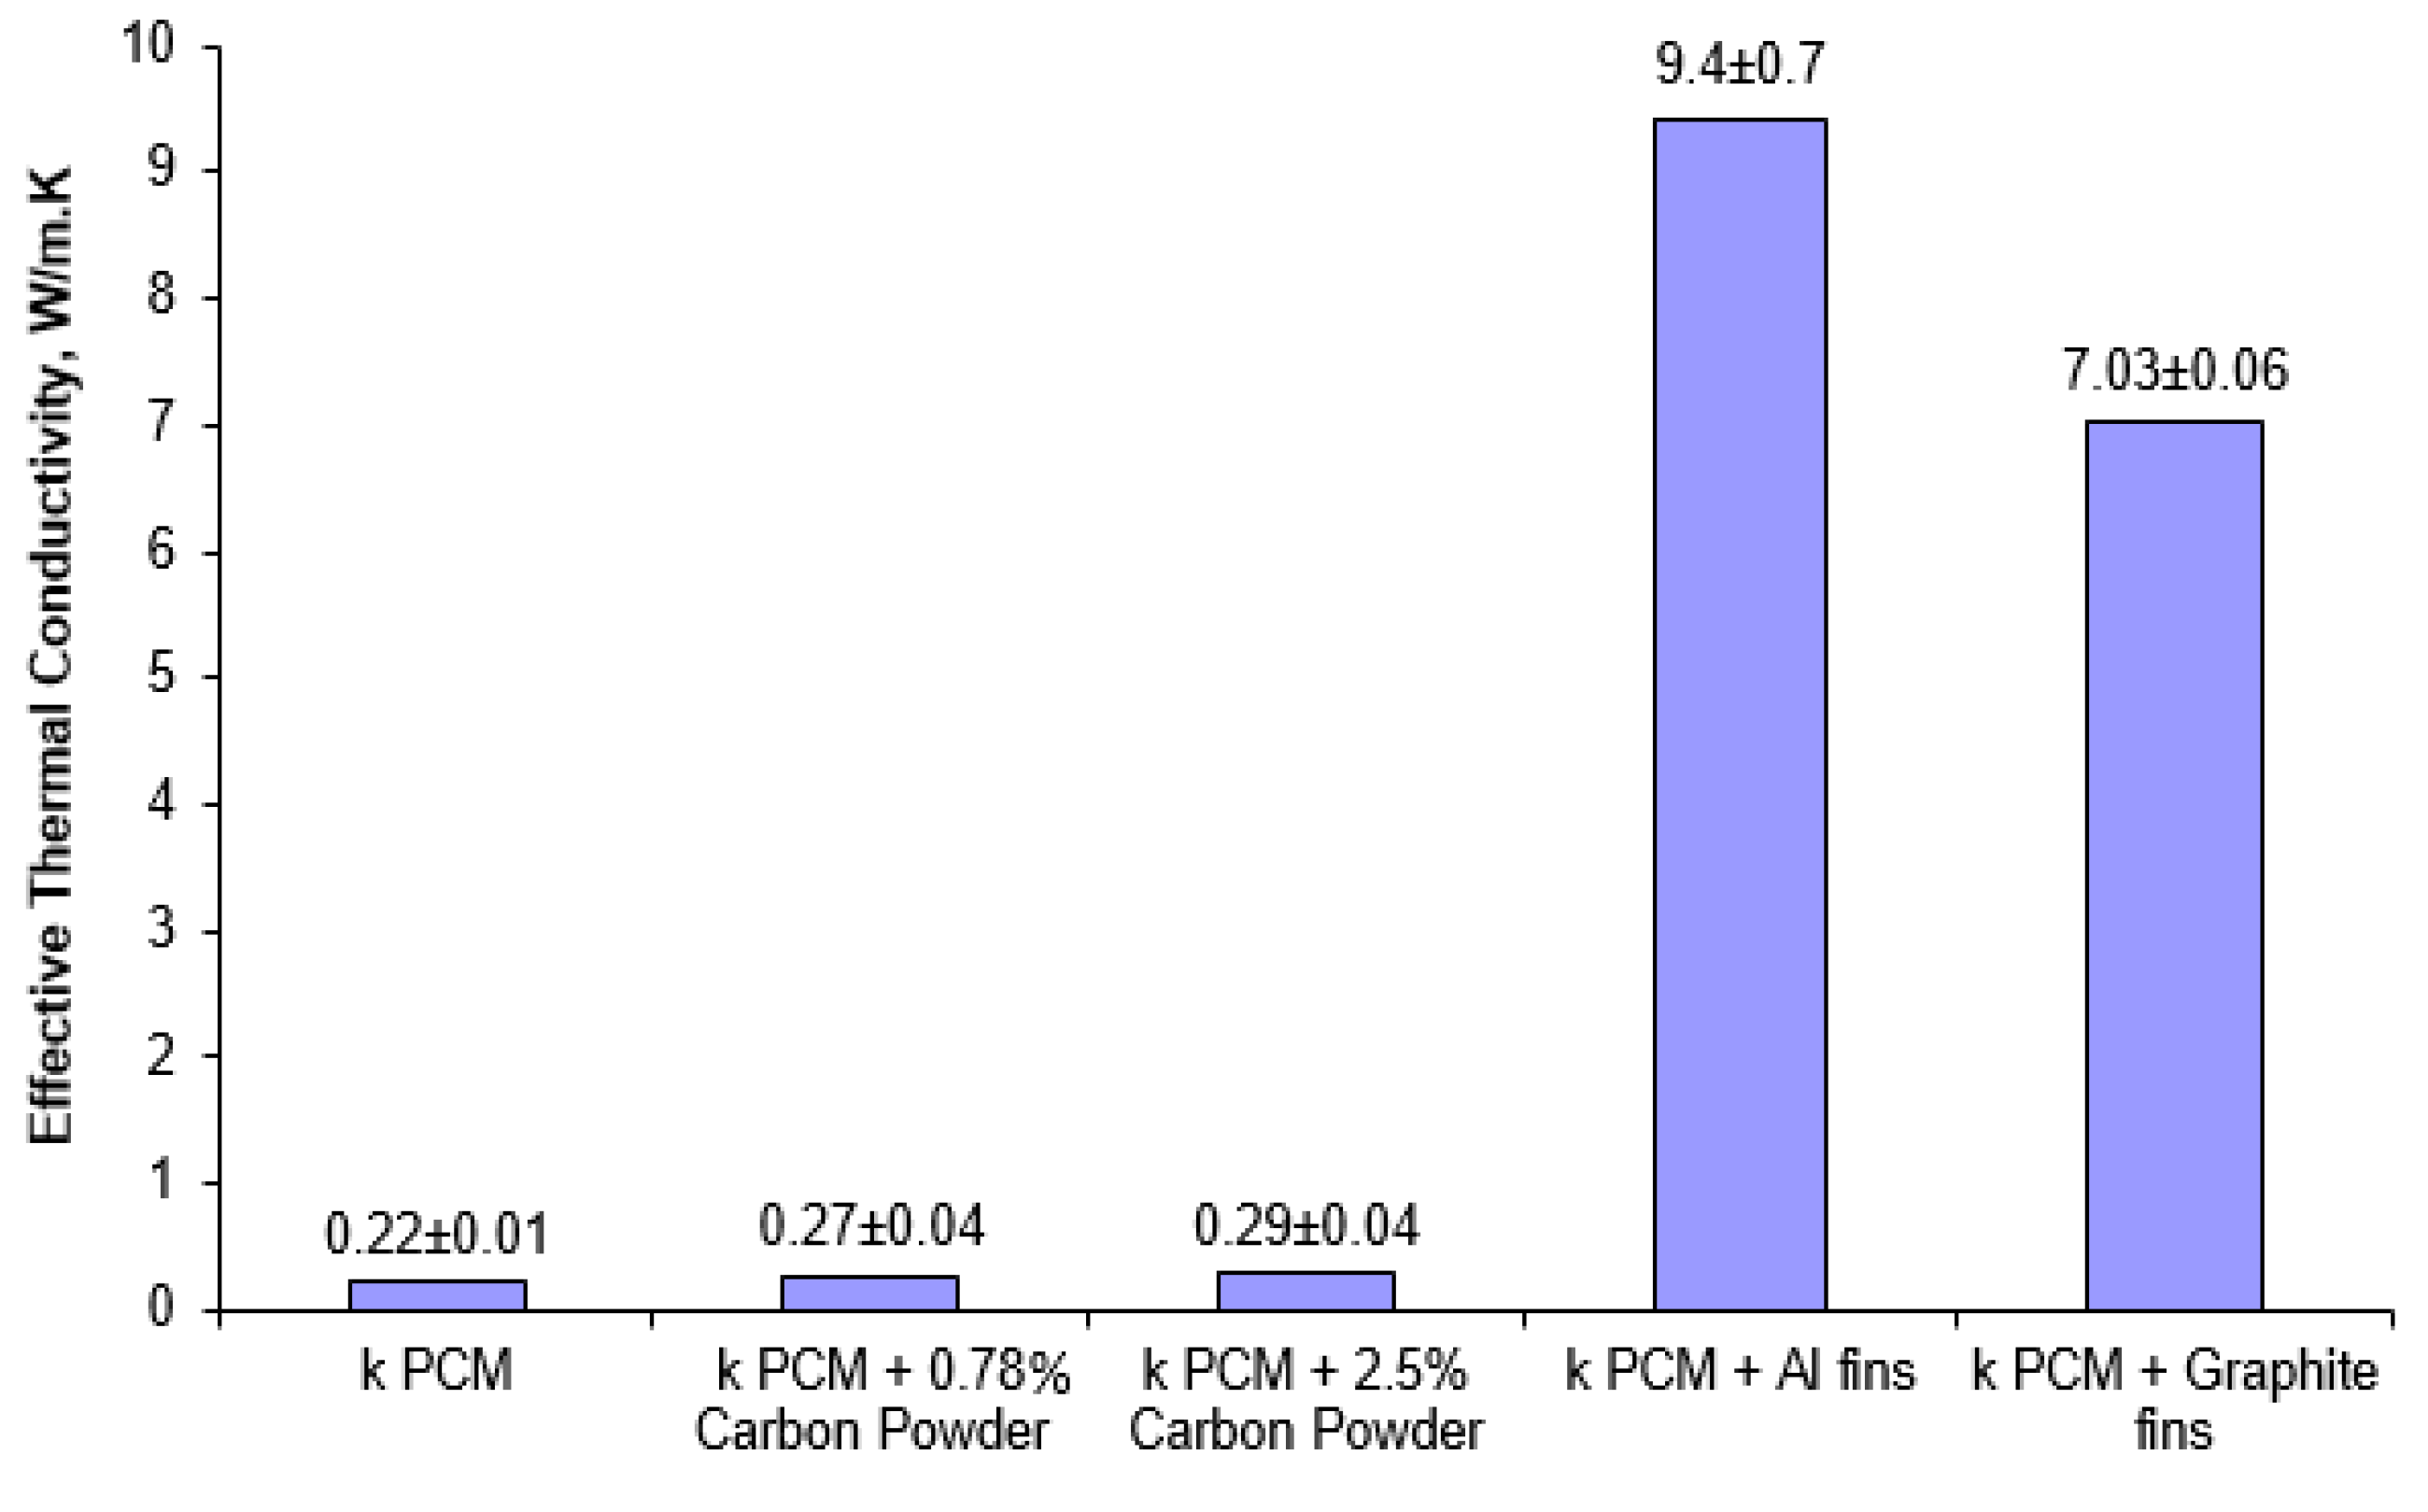
  • Fin stack could enhance the effective thermal conductivity of the PCM sample by more than 42 times with Al fins and 33 times with carbon fins. Even though the thermal conductivity of carbon(>500 W/(m·K)) is greater than Aluminum (~210 W/(m·K)), the effective thermal conductivity of PCM with Al fins showed more improvement than that achieved by using carbon fins. This is mainly due to high fin density and uniform fins distribution in the case of Al fin stack.
  • Increase in the thermal conductivity value for the PCM case with carbon powder addition was marginal as compared to the case with added fins.
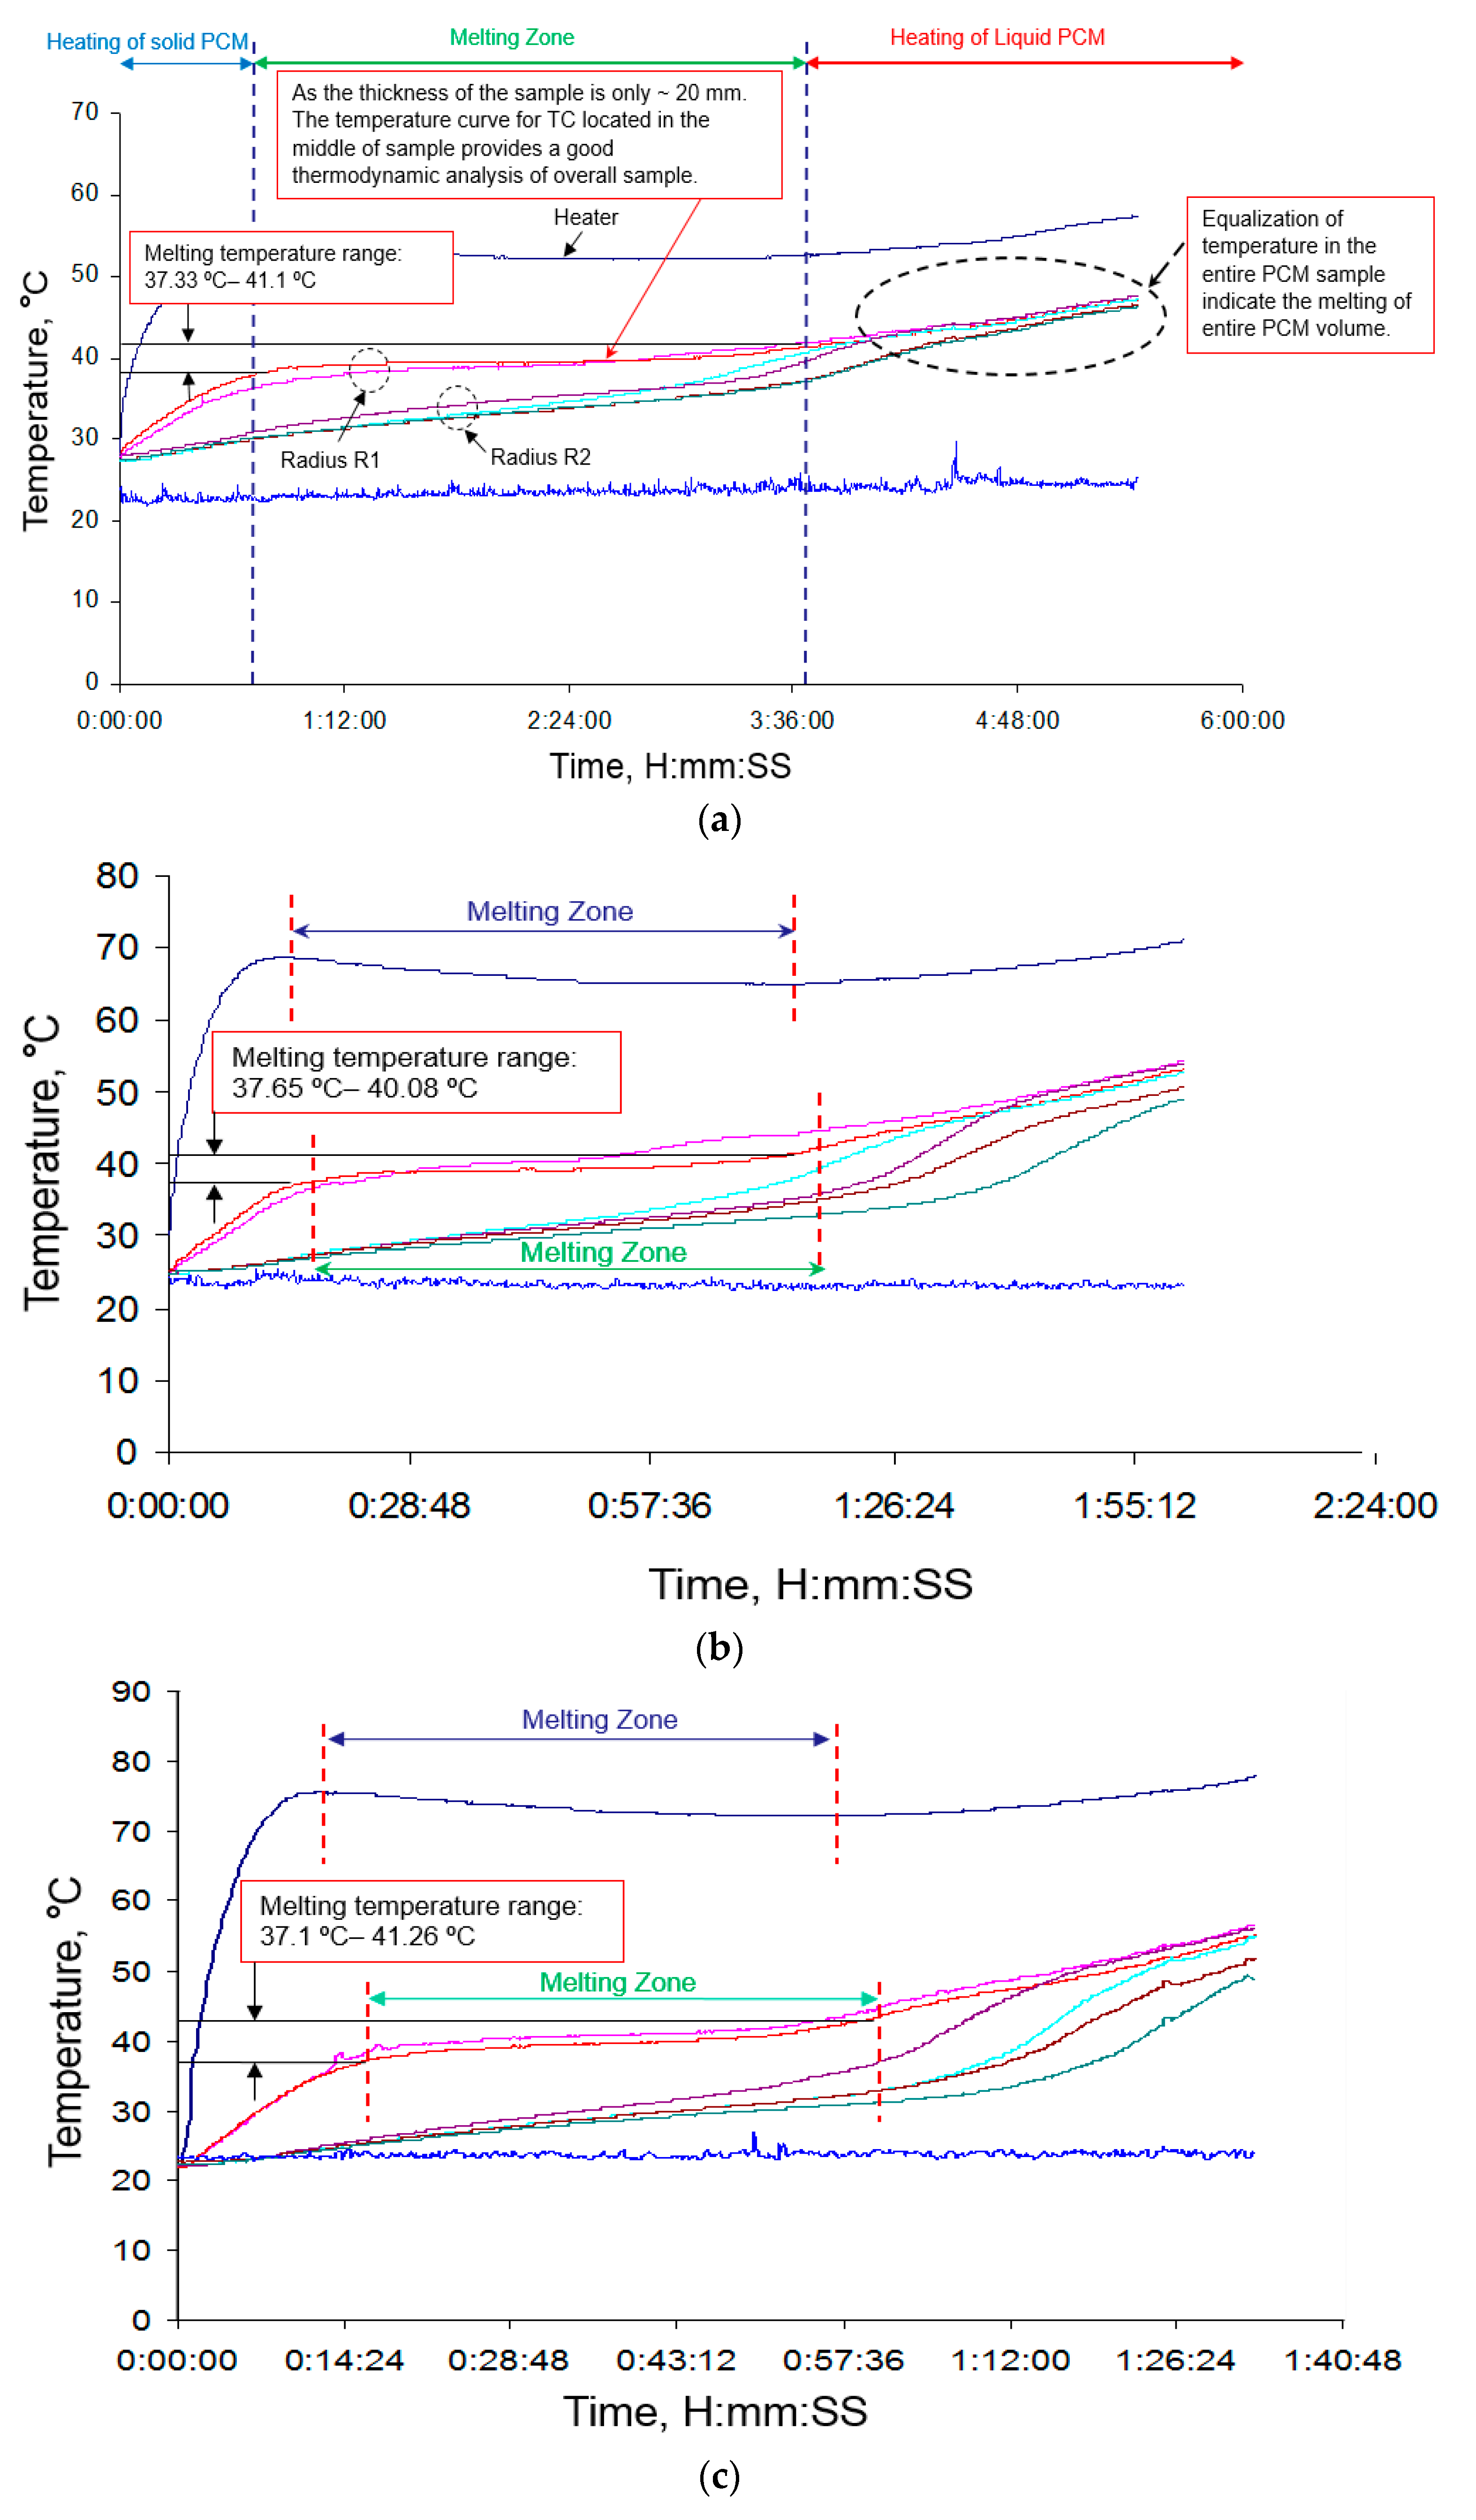
  • Melting temperature ranges of the PCM under 1.04 W, 2.34 W, and 3.15 W input heat loads were found to be ~37.3–41 °C, ~37.6–40.1 °C, and ~37.1–41.3 °C, respectively. According to the results, the initiation of melting takes place at around 37 °C and continues until above 40 °C depending on the input heat load. It is worth noting that the melting time for the aforementioned values of heat inputs were 2 hr 47 min, 1 hr 1 min, and 45 min, respectively.
  • For the PCM, solidification temperature range was found to be ~33.6–34.9 °C. Furthermore, solidification temperature was lower than melting temperature and took less time than melting. The PCM needed sub-cooling of 3–4 °C for solidification.
  • The values of latent heat of melting of the PCM with 1.04 W, 2.34 W, and 3.15 W input power was found to be ~195.2 kJ/kg, ~160.5 kJ/kg, and ~159.6 kJ/kg, respectively. For very low input heat loads, the values of latent heat were significantly higher than the actual value of latent heat due to ambient heat losses.
  • Low input power provided very good approximation of melting zone due to lower temperature gradient, across PCM heat flow direction.
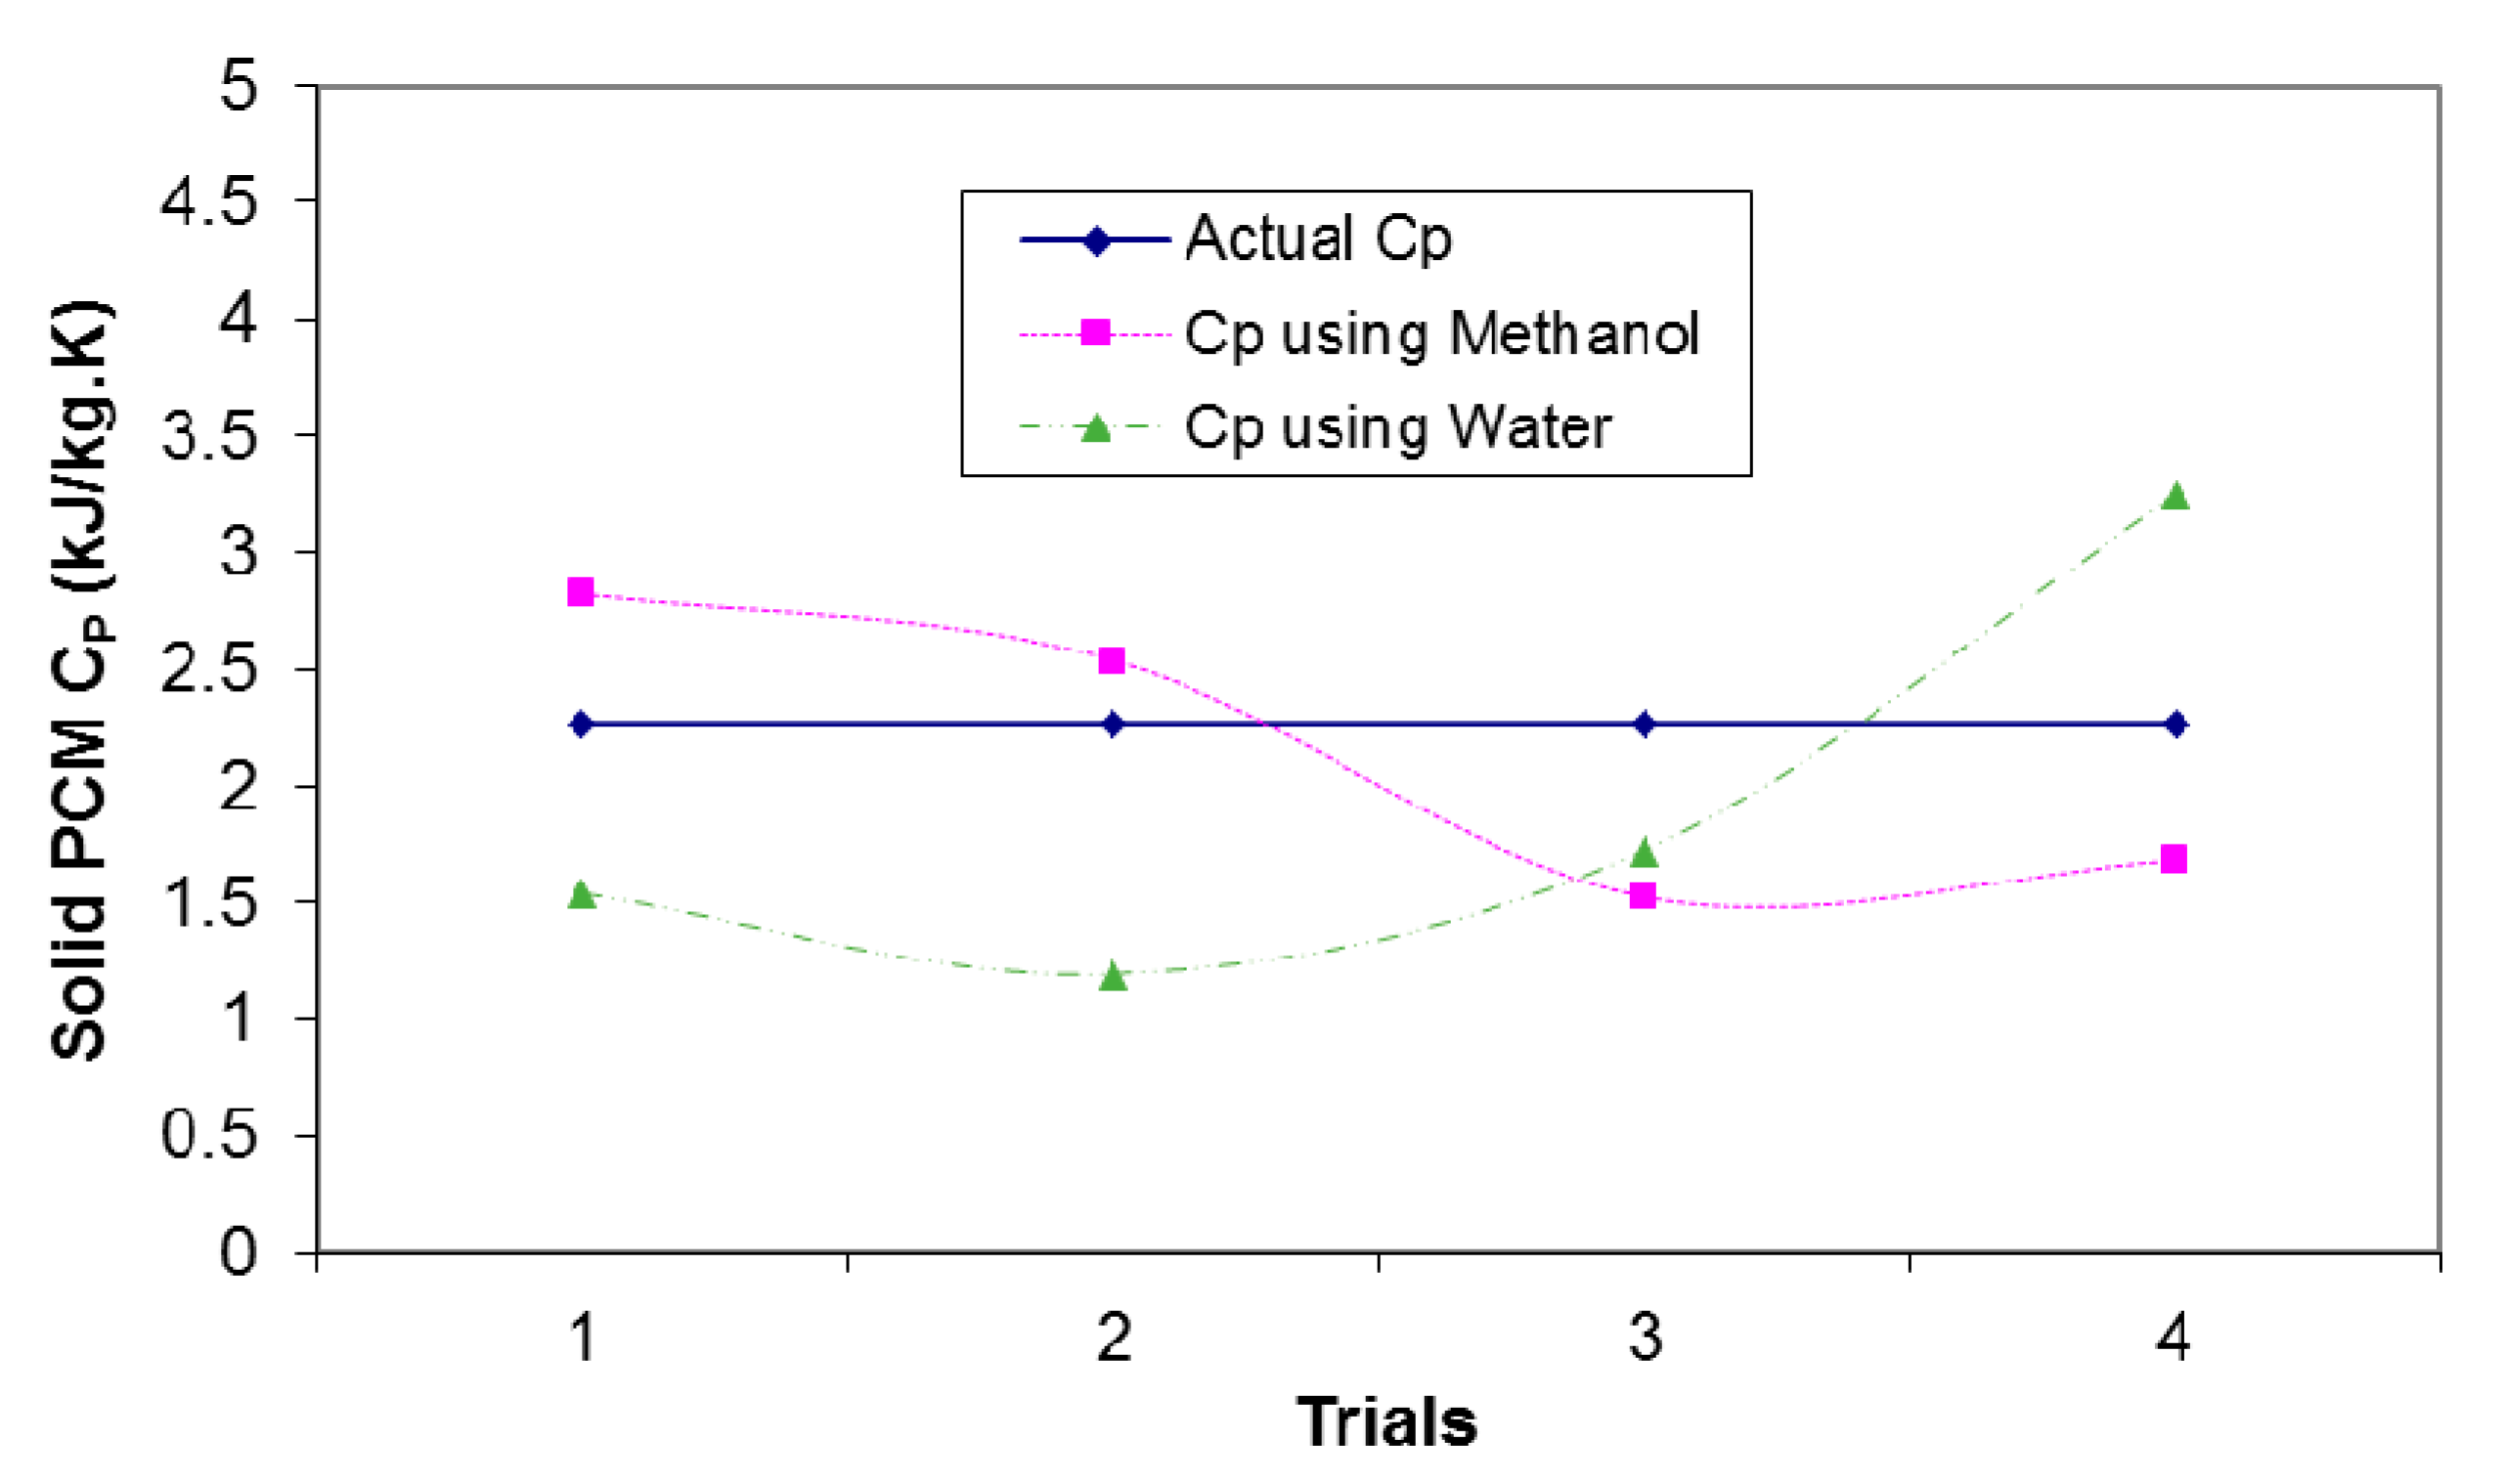
  • Methanol as calorimeter fluid gave better results than those obtained using water due to low C p (~1.4 kJ/kg·K) of methanol as compared to water (~4.2 kJ/kg·K).

Author Contributions

The work is the results of a collaborative research work by Fujikura Ltd and RMIT University with the following details: Conceptualization, R.S.; methodology, R.S.; literature review, S.S. and B.S.; validation, R.S., S.S. and B.S.; formal analysis, R.S., S.S. and B.S.; investigation, R.S., S.S. and B.S.; writing—original draft preparation, S.S.; writing—review and editing, R.S. and B.S.; supervision, R.S. and B.S.; project administration, R.S.

Funding

The work was funded by Fujikura Ltd.

Conflicts of Interest

The authors declare no conflict of interest.

Nomenclature

C p Specific heat, J/kg·K
k Thermal conductivity, W/(m·K)
RRadius, m
T Temperature, °C
Subscripts
AlAluminum
CFDComputational fluid dynamics
ExpExperimental
grgram
LLiter
PCMPhase change material
PEGPolyethylene glycol
TCThermocouple

References

  1. Yan, T.; Wang, R.Z.; Li, T.X.; Wang, L.W.; Fred, I.T. A review of promising candidate reactions for chemical heat storage. Renew. Sustain. Energy Rev. 2015, 43, 13–31. [Google Scholar] [CrossRef]
  2. Sharma, R.K.; Ganesan, P.; Tyagi, V.V.; Metselaar, H.S.; Sandaran, S.C. Developments in organic solid–liquid phase change materials and their applications in thermal energy storage. Energy Convers. Manag. 2015, 95, 193–228. [Google Scholar] [CrossRef]
  3. Ye, H.; Long, L.; Zhang, H.; Zou, R. The performance evaluation of shape-stabilized phase change materials in building applications using energy saving index. Appl. Energy 2014, 113, 1118–1126. [Google Scholar] [CrossRef]
  4. Xu, B.; Li, P.; Chan, C. Application of phase change materials for thermal energy storage in concentrated solar thermal power plants: A review to recent developments. Appl. Energy 2015, 160, 286–307. [Google Scholar] [CrossRef] [Green Version]
  5. Farid, M.M.; Khudhair, A.M.; Razack, S.A.; Al-Hallaj, S. A review on phase change energy storage: Materials and applications. Energy Convers. Manag. 2004, 45, 1597–1615. [Google Scholar] [CrossRef]
  6. Ling, Z.; Chen, J.; Xu, T.; Fang, X.; Gao, X.; Zhang, Z. Thermal conductivity of an organic phase change material/expanded graphite composite across the phase change temperature range and a novel thermal conductivity model. Energy Convers. Manag. 2015, 102, 202–208. [Google Scholar] [CrossRef] [Green Version]
  7. Cárdenas, B.; León, N. High temperature latent heat thermal energy storage: Phase change materials, design considerations and performance enhancement techniques. Renew. Sustain. Energy Rev. 2013, 27, 724–737. [Google Scholar] [CrossRef]
  8. Fan, L.; Khodadadi, J.M. Thermal conductivity enhancement of phase change materials for thermal energy storage: A review. Renew. Sustain. Energy Rev. 2011, 15, 24–46. [Google Scholar] [CrossRef]
  9. Ibrahim, N.I.; Al-Sulaiman, F.A.; Rahman, S.; Yilbas, B.S.; Sahin, A.Z. Heat transfer enhancement of phase change materials for thermal energy storage applications: A critical review. Renew. Sustain. Energy Rev. 2017, 74, 26–50. [Google Scholar] [CrossRef]
  10. Liu, L.; Su, D.; Tang, Y.; Fang, G. Thermal conductivity enhancement of phase change materials for thermal energy storage: A review. Renew. Sustain. Energy Rev. 2016, 62, 305–317. [Google Scholar] [CrossRef]
  11. Liu, M.; Saman, W.; Bruno, F. Review on storage materials and thermal performance enhancement techniques for high temperature phase change thermal storage systems. Renew. Sustain. Energy Rev. 2012, 16, 2118–2132. [Google Scholar] [CrossRef]
  12. Li, B.; Zhai, X. Experimental investigation and theoretical analysis on a mid-temperature solar collector/storage system with composite PCM. Appl. Therm. Eng. 2017, 124, 34–43. [Google Scholar] [CrossRef]
  13. Lin, Y.; Jia, Y.; Alva, G.; Fang, G. Review on thermal conductivity enhancement, thermal properties and applications of phase change materials in thermal energy storage. Renew. Sustain. Energy Rev. 2017, 82, 2730–2742. [Google Scholar] [CrossRef]
  14. Choi, D.H.; Lee, J.; Hong, H.; Kang, Y.T. Thermal conductivity and heat transfer performance enhancement of phase change materials (PCM) containing carbon additives for heat storage application. Int. J. Refrig. 2014, 42, 112–120. [Google Scholar] [CrossRef]
  15. Li, M. A nano-graphite/paraffin phase change material with high thermal conductivity. Appl. Energy 2013, 106, 25–30. [Google Scholar] [CrossRef]
  16. Huang, Z.; Xie, N.; Luo, Z.; Gao, X.; Fang, X.; Fang, Y.; Zhang, Z. Characterization of medium-temperature phase change materials for solar thermal energy storage using temperature history method. Sol. Energy Mater. Sol. Cells 2017, 179, 152–160. [Google Scholar] [CrossRef]
  17. Wang, J.; Xie, H.; Xin, Z.; Li, Y.; Chen, L. Enhancing thermal conductivity of palmitic acid based phase change materials with carbon nanotubes as fillers. Sol. Energy 2010, 84, 339–344. [Google Scholar] [CrossRef]
  18. Marcos, M.A.; Cabaleiro, D.; Guimarey, M.J.; Comuñas, M.J.; Fedele, L.; Fernández, J.; Lugo, L. PEG 400-Based Phase Change Materials Nano-Enhanced with Functionalized Graphene Nanoplatelets. Nanomaterials 2018, 8, 16. [Google Scholar] [CrossRef]
  19. Khyad, A.; Samrani, H.; Bargach, M.N.; Tadili, R. Energy storage with PCMs: Experimental analysis of paraffin’s phase change phenomenon & improvement of its properties. J. Mater. Environ. Sci. 2016, 7, 2551–2560. [Google Scholar]
  20. Li, W.; Wang, Y.H.; Kong, C.C. Experimental study on melting/solidification and thermal conductivity enhancement of phase change material inside a sphere. Int. Commun. Heat Mass Transf. 2015, 68, 276–282. [Google Scholar] [CrossRef]
  21. Şahan, N.; Fois, M.; Paksoy, H. Improving thermal conductivity phase change materials—a study of paraffin nanomagnetite composites. Sol. Energy Mater. Sol. Cells 2015, 137, 61–67. [Google Scholar] [CrossRef]
  22. Vallejo, J.P.; Pérez-Tavernier, J.; Cabaleiro, D.; Fernández-Seara, J.; Lugo, L. Potential heat transfer enhancement of functionalized graphene nanoplatelet dispersions in a propylene glycol-water mixture. Thermophysical profile. J. Chem. Thermodyn. 2018, 123, 174–184. [Google Scholar] [CrossRef]
  23. Youssef, W.; Ge, Y.T.; Tassou, S.A. CFD modelling development and experimental validation of a phase change material (PCM) heat exchanger with spiral-wired tubes. Energy Convers. Manag. 2018, 157, 498–510. [Google Scholar] [CrossRef]
  24. Abujas, C.R.; Jové, A.; Prieto, C.; Gallas, M.; Cabeza, L.F. Performance comparison of a group of thermal conductivity enhancement methodology in phase change material for thermal storage application. Renew. Energy 2016, 97, 434–443. [Google Scholar] [CrossRef]
  25. Mills, A.; Farid, M.; Selman, J.R.; Al-Hallaj, S. Thermal conductivity enhancement of phase change materials using a graphite matrix. Appl. Therm. Eng. 2006, 26, 1652–1661. [Google Scholar] [CrossRef]
  26. Pasupathy, A.; Velraj, R. Effect of double layer phase change material in building roof for year round thermal management. Energy Build. 2008, 40, 193–203. [Google Scholar] [CrossRef]
  27. Arnault, A.; Mathieu-Potvin, F.; Gosselin, L. Internal surfaces including phase change materials for passive optimal shift of solar heat gain. Int. J. Therm. Sci. 2010, 49, 2148–2156. [Google Scholar] [CrossRef]
  28. Li, L.; Yu, H.; Wang, X.; Zheng, S. Thermal analysis of melting and freezing processes of phase change materials (PCMs) based on dynamic DSC test. Energy Build. 2016, 130, 388–396. [Google Scholar] [CrossRef]
  29. Ferrer, G.; Barreneche, C.; Solé, A.; Martorell, I.; Cabeza, L.F. New proposed methodology for specific heat capacity determination of materials for thermal energy storage (TES) by DSC. J. Energy Storage 2017, 11, 1–6. [Google Scholar] [CrossRef]
  30. Lachheb, M.; Younsi, Z.; Naji, H.; Karkri, M.; Nasrallah, S.B. Thermal behavior of a hybrid PCM/plaster: A numerical and experimental investigation. Appl. Therm. Eng. 2017, 111, 49–59. [Google Scholar] [CrossRef]
  31. Mazzeo, D.; Oliveti, G.; Arcuri, N. Definition of a new set of parameters for the dynamic thermal characterization of PCM layers in the presence of one or more liquid-solid interfaces. Energy Build. 2017, 141, 379–396. [Google Scholar] [CrossRef]
  32. Sharifi, N.P.; Shaikh, A.A.N.; Sakulich, A.R. Application of phase change materials in gypsum boards to meet building energy conservation goals. Energy Build. 2017, 138, 455–467. [Google Scholar] [CrossRef]
  33. Guarino, F.; Athienitis, A.; Cellura, M.; Bastien, D. PCM thermal storage design in buildings: Experimental studies and applications to solaria in cold climates. Appl. Energy 2017, 185, 95–106. [Google Scholar] [CrossRef]
  34. Navarro, L.; Solé, A.; Martín, M.; Barreneche, C.; Olivieri, L.; Tenorio, J.A.; Cabeza, L.F. Benchmarking of useful phase change materials for a building application. Energy Build. 2019, 182, 45–50. [Google Scholar] [CrossRef]
  35. Bouhal, T.; Meghari, Z.; El Rhafiki, T.; Kousksou, T.; Jamil, A.; Ghoulam, E.B. Parametric CFD analysis and impact of PCM intrinsic parameters on melting process inside enclosure integrating fins: Solar building applications. J. Build. Eng. 2018, 20, 634–646. [Google Scholar] [CrossRef]
  36. Ahangari, M.; Maerefat, M. An innovative PCM system for thermal comfort improvement and energy demand reduction in building under different climate conditions. Sustain. Cities Soc. 2019, 44, 120–129. [Google Scholar] [CrossRef]
  37. Xie, J.; Wang, W.; Liu, J.; Pan, S. Thermal performance analysis of PCM wallboards for building application based on numerical simulation. Sol. Energy 2018, 162, 533–540. [Google Scholar] [CrossRef]
  38. Nada, S.A.; El-Nagar, D.H. Possibility of using PCMs in temperature control and performance enhancements of free stand and building integrated PV modules. Renew. Energy 2018, 127, 630–641. [Google Scholar] [CrossRef]
  39. Saffari, M.; De Gracia, A.; Fernández, C.; Cabeza, L.F. Simulation-based optimization of PCM melting temperature to improve the energy performance in buildings. Appl. Energy 2017, 202, 420–434. [Google Scholar] [CrossRef]
  40. Bal, L.M.; Satya, S.; Naik, S.N.; Meda, V. Review of solar dryers with latent heat storage systems for agricultural products. Renew. Sustain. Energy Rev. 2011, 15, 876–880. [Google Scholar] [CrossRef]
  41. Subburaj, A.S.; Pushpakaran, B.N.; Bayne, S.B. Overview of grid connected Renew. Energy based battery projects in USA. Renew. Sustain. Energy Rev. 2015, 45, 219–234. [Google Scholar] [CrossRef]
  42. Jiang, F.; Wang, X.; Zhang, Y. A new method to estimate optimal phase change material characteristics in a passive solar room. Energy Convers. Manag. 2011, 52, 2437–2441. [Google Scholar] [CrossRef]
  43. Mazzeo, D.; Oliveti, G.; De Gracia, Á.; Coma, J.; Solé, A. Experimental validation of the exact analytical solution to the steady periodic heat transfer problem in a PCM layer. Energy 2017, 140, 1131–1147. [Google Scholar] [CrossRef] [Green Version]
  44. Sun, X.; Zhang, Q.; Medina, M.A.; Lee, K.O. Energy and economic analysis of a building enclosure outfitted with a phase change material board (PCMB). Energy Convers. Manag. 2014, 83, 73–78. [Google Scholar] [CrossRef]
  45. Dwivedi, V.K.; Tiwari, P.; Tiwari, S. Importance of Phase Change Material (PCM) in solar thermal applications: A review. In Proceedings of the 2016 International Conference on Emerging Trends in Electrical Electronics & Sustainable Energy Systems (ICETEESES), Sultanpur, India, 11–12 March 2016; pp. 42–45. [Google Scholar] [CrossRef]
  46. Kenisarin, M.; Mahkamov, K. Sol. Energy storage using phase change materials. Renew. Sustain. Energy Rev. 2007, 11, 1913–1965. [Google Scholar] [CrossRef]
  47. Malan, D.J.; Dobson, R.T.; Dinter, F. Solar thermal energy storage in power generation using phase change material with heat pipes and fins to enhance heat transfer. Energy Procedia 2015, 69, 925–936. [Google Scholar] [CrossRef]
  48. Wei, G.; Wang, G.; Xu, C.; Ju, X.; Xing, L.; Du, X.; Yang, Y. Selection principles and thermophysical properties of high temperature phase change materials for thermal energy storage: A review. Renew. Sustain. Energy Rev. 2017, 81, 1771–1786. [Google Scholar] [CrossRef]
  49. Mishra, A.; Shukla, A.; Sharma, A. Latent heat storage through phase change materials. Resonance 2015, 20, 532–541. [Google Scholar] [CrossRef]
  50. Maxa, J.; Novikov, A.; Nowottnick, M. Thermal Peak Management Using Organic Phase Change Materials for Latent Heat Storage in Electronic Applications. Materials 2018, 11, 31. [Google Scholar] [CrossRef]
  51. Hallworth, M.A.; Huppert, H.E.; Sparks, R.S. Lava flows. Mod. Geol. 1987, 11, 93–107. [Google Scholar]
  52. Science Lab Inc. Available online: http://www.sciencelab.com (accessed on 31 August 2017).
  53. Sharma, R.K.; Ganesan, P.; Tyagi, V.V.; Mahlia, T.M. Accelerated thermal cycle and chemical stability testing of polyethylene glycol (PEG) 6000 for solar thermal energy storage. Sol. Energy Mater. Sol. Cells 2016, 147, 235–239. [Google Scholar] [CrossRef]
  54. Alkan, C.; Günthe, E.; Hiebler, S.; Himpel, M. Complexing blends of polyacrylic acid-polyethylene glycol and poly(ethylene-co-acrylic acid)-polyethylene glycol as shape stabilized phase change materials. Energy Convers. Manag. 2012, 64, 364–370. [Google Scholar] [CrossRef]
  55. Johansen, J.B.; Dannemand, M.; Kong, W.; Fan, J.; Dragsted, J.; Furbo, S. Thermal conductivity enhancement of sodium acetate trihydrate by adding graphite powder and the effect on stability of supercooling. Energy Procedia 2015, 70, 249–256. [Google Scholar] [CrossRef]
  56. Mao, C.; Wood, M.; David, L.; An, S.J.; Sheng, Y.; Du, Z.; Meyer, H.M.; Ruther, R.E.; Wood, D.L. Selecting the Best Graphite for Long-Life, High-Energy Li-Ion Batteries. J. Electrochem. Soc. 2018, 165, 1837–1845. [Google Scholar] [CrossRef]
  57. Li, Q.; Chen, L.; Ma, H.; Huang, C.H. Enhanced Heat Transfer Characteristics of Graphite Concrete and Its Application in Energy Piles. Adv. Mater. Sci. Eng. 2018, 2018. [Google Scholar] [CrossRef]
  58. Dhaidan, N.S.; Khodadadi, J.M. Improved performance of latent heat energy storage systems utilizing high thermal conductivity fins: A review. J. Renew. Sustain. Energy 2017, 9, 034103. [Google Scholar] [CrossRef]
Figure 1. Composite PCM containing PEG-1000 and Carbon.
Energies 12 00075 g001
Figure 2. Experimental set-up for improving the thermal conductivity of the PCM using aluminum fins. (a) Aluminum fin stack; (b) Al fin stack suspended in PCM; (c) Al fin stack with heating arrangement; (d) Experimental set-up details.
Energies 12 00075 g002
Figure 3. Carbon fin stack for PCM thermal conductivity enhancement. (Top) Fin stack; (Bottom) Experimental test set-up.
Energies 12 00075 g003
Figure 4. Set-up of flat configuration method for thermal conductivity measurement and possible heat leakages in this method. (a) Experimental set-up; (b) Heat flow pattern; (c) Heat leaks through set-up.
Energies 12 00075 g004aEnergies 12 00075 g004b
Figure 5. Cylindrical configuration test set-up for measurement of PCM thermal conductivity and melting test. (a) Heating and temperature measurement arrangement; (b) Actual test set-up; (c) Thermocouple locations; (d) Cross section of test set-up detailing different components and heat flow pattern.
Energies 12 00075 g005aEnergies 12 00075 g005b
Figure 6. Calorimetry experimental method for measuring the PCM specific heat in solid state. (a) Cross sectional details of test set-up; (b) Component details of set-up.
Energies 12 00075 g006
Figure 7. Effective thermal conductivity for pure and enhanced PCMs measured by cylindrical configuration method.
Energies 12 00075 g007
Figure 8. Temperature distributions along the inner ( R 1 ±   0.01) and outer ( R 2 ±   0.01) radiuses of the cylinder measured by cylindrical configuration method.
Energies 12 00075 g008
Figure 9. (a) Heat exchange process inside the PCM test sample under 1.04 W input power analyzed by cylindrical configuration method. (b) Heat exchange process inside the PCM test sample under 2.34 W input power analyzed by cylindrical configuration method. (c) Heat exchange process inside the PCM test sample under 3.15 W input power analyzed by cylindrical configuration method.
Energies 12 00075 g009
Figure 10. Solidification process of the PCM analyzed by cylindrical configuration method.
Energies 12 00075 g010
Figure 11. Comparison of the actual and measured specific heat capacity, C p , for solid PCM.
Energies 12 00075 g011
Figure 12. Comparison between the actual and resulted thermal conductivities obtained by flat and cylindrical configuration methods.
Energies 12 00075 g012
Table 1. Properties of the PEG-1000.
PEG-1000 Polyethylene Glycol
TypeOrganic phase change material
Molecular weight1020 amu
Melting point 37.1 °C
Specific gravity1.1
Specific heat2.26 kJ/kg
Latent heat 154.91 kJ/kg
Flame temperature265 °C
PH value5.5
Thermal conductivity0.2 W/(m·K)
Table 2. Values of latent heat capacity and melting time of the PCM.
Input Power (W)Latent Heat (kJ/kg)Melting TimeError with Respect to Manufacturing Values
Actual Value155.40 ± 0.08
1.04 ± 0.01195.17 ± 0.082 hour and 47 min25.6%
2.34 ± 0.01160.51 ± 0.081 hour and 1 min3.3%
3.15 ± 0.01159.56 ± 0.0845 min2.7%

