Data-Based Sensing and Stochastic Analysis of Biodiesel Production Process


Abstract
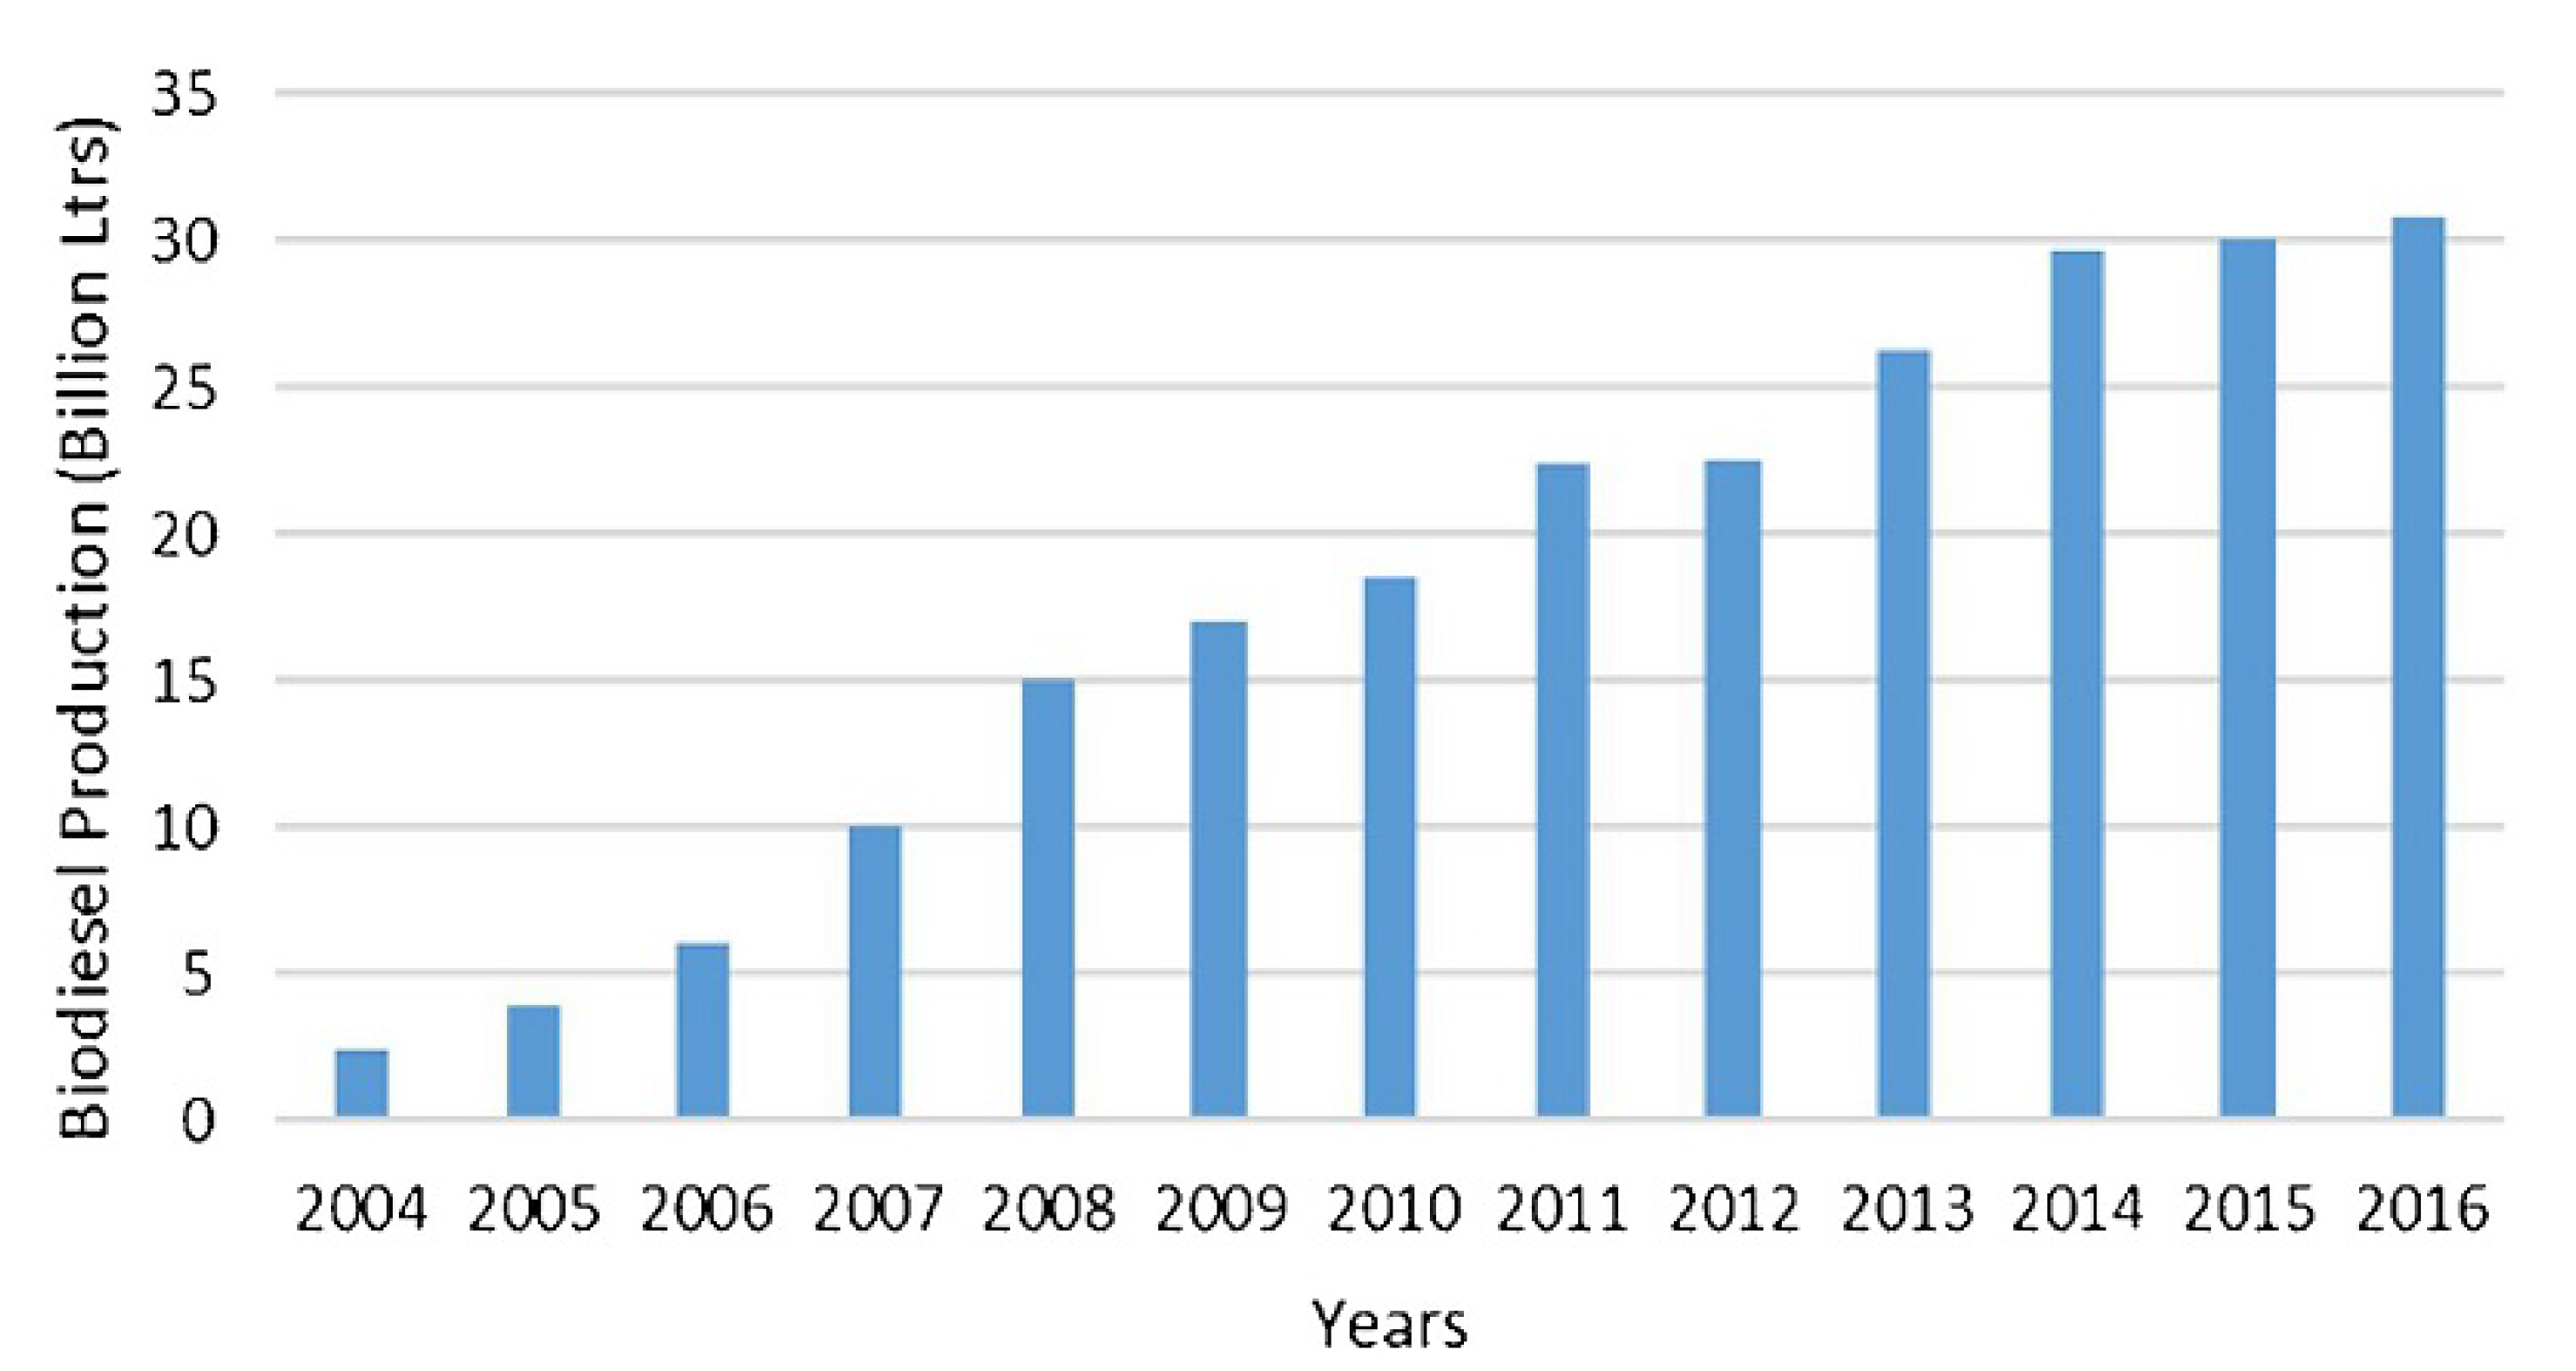
1. Introduction
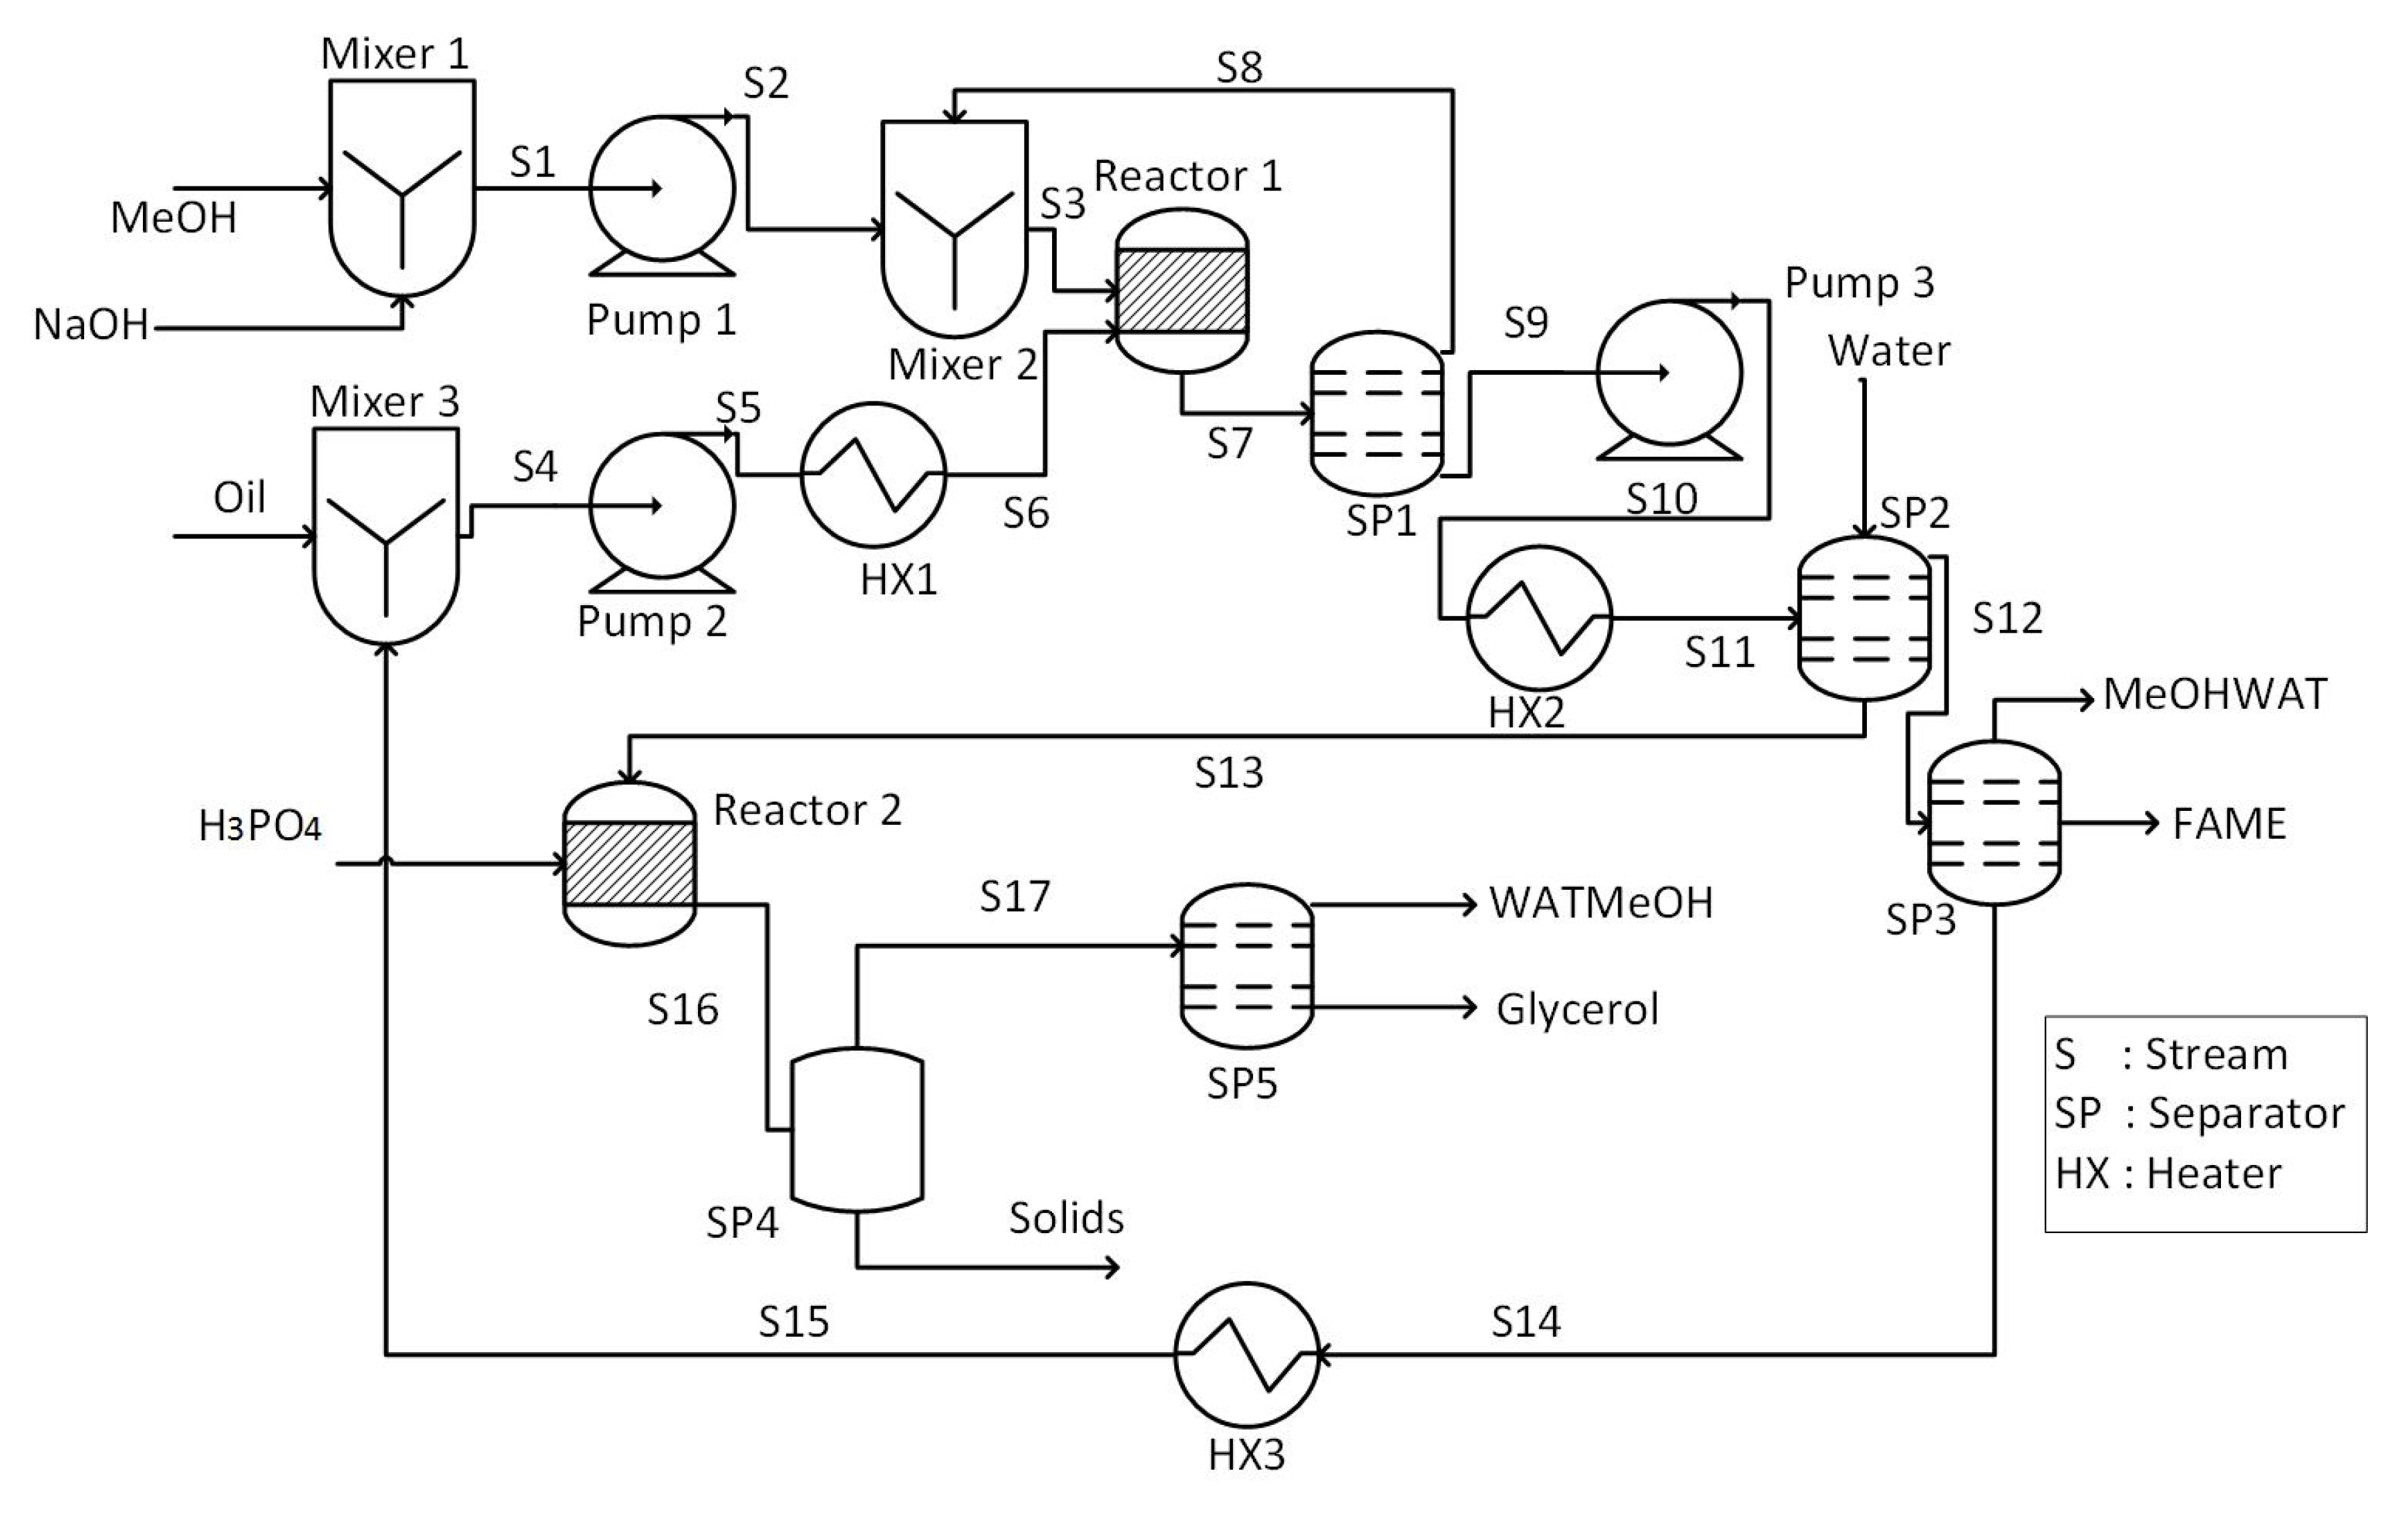
2. Process and Data Description
3. Fundamentals of Modeling and Analysis Methods
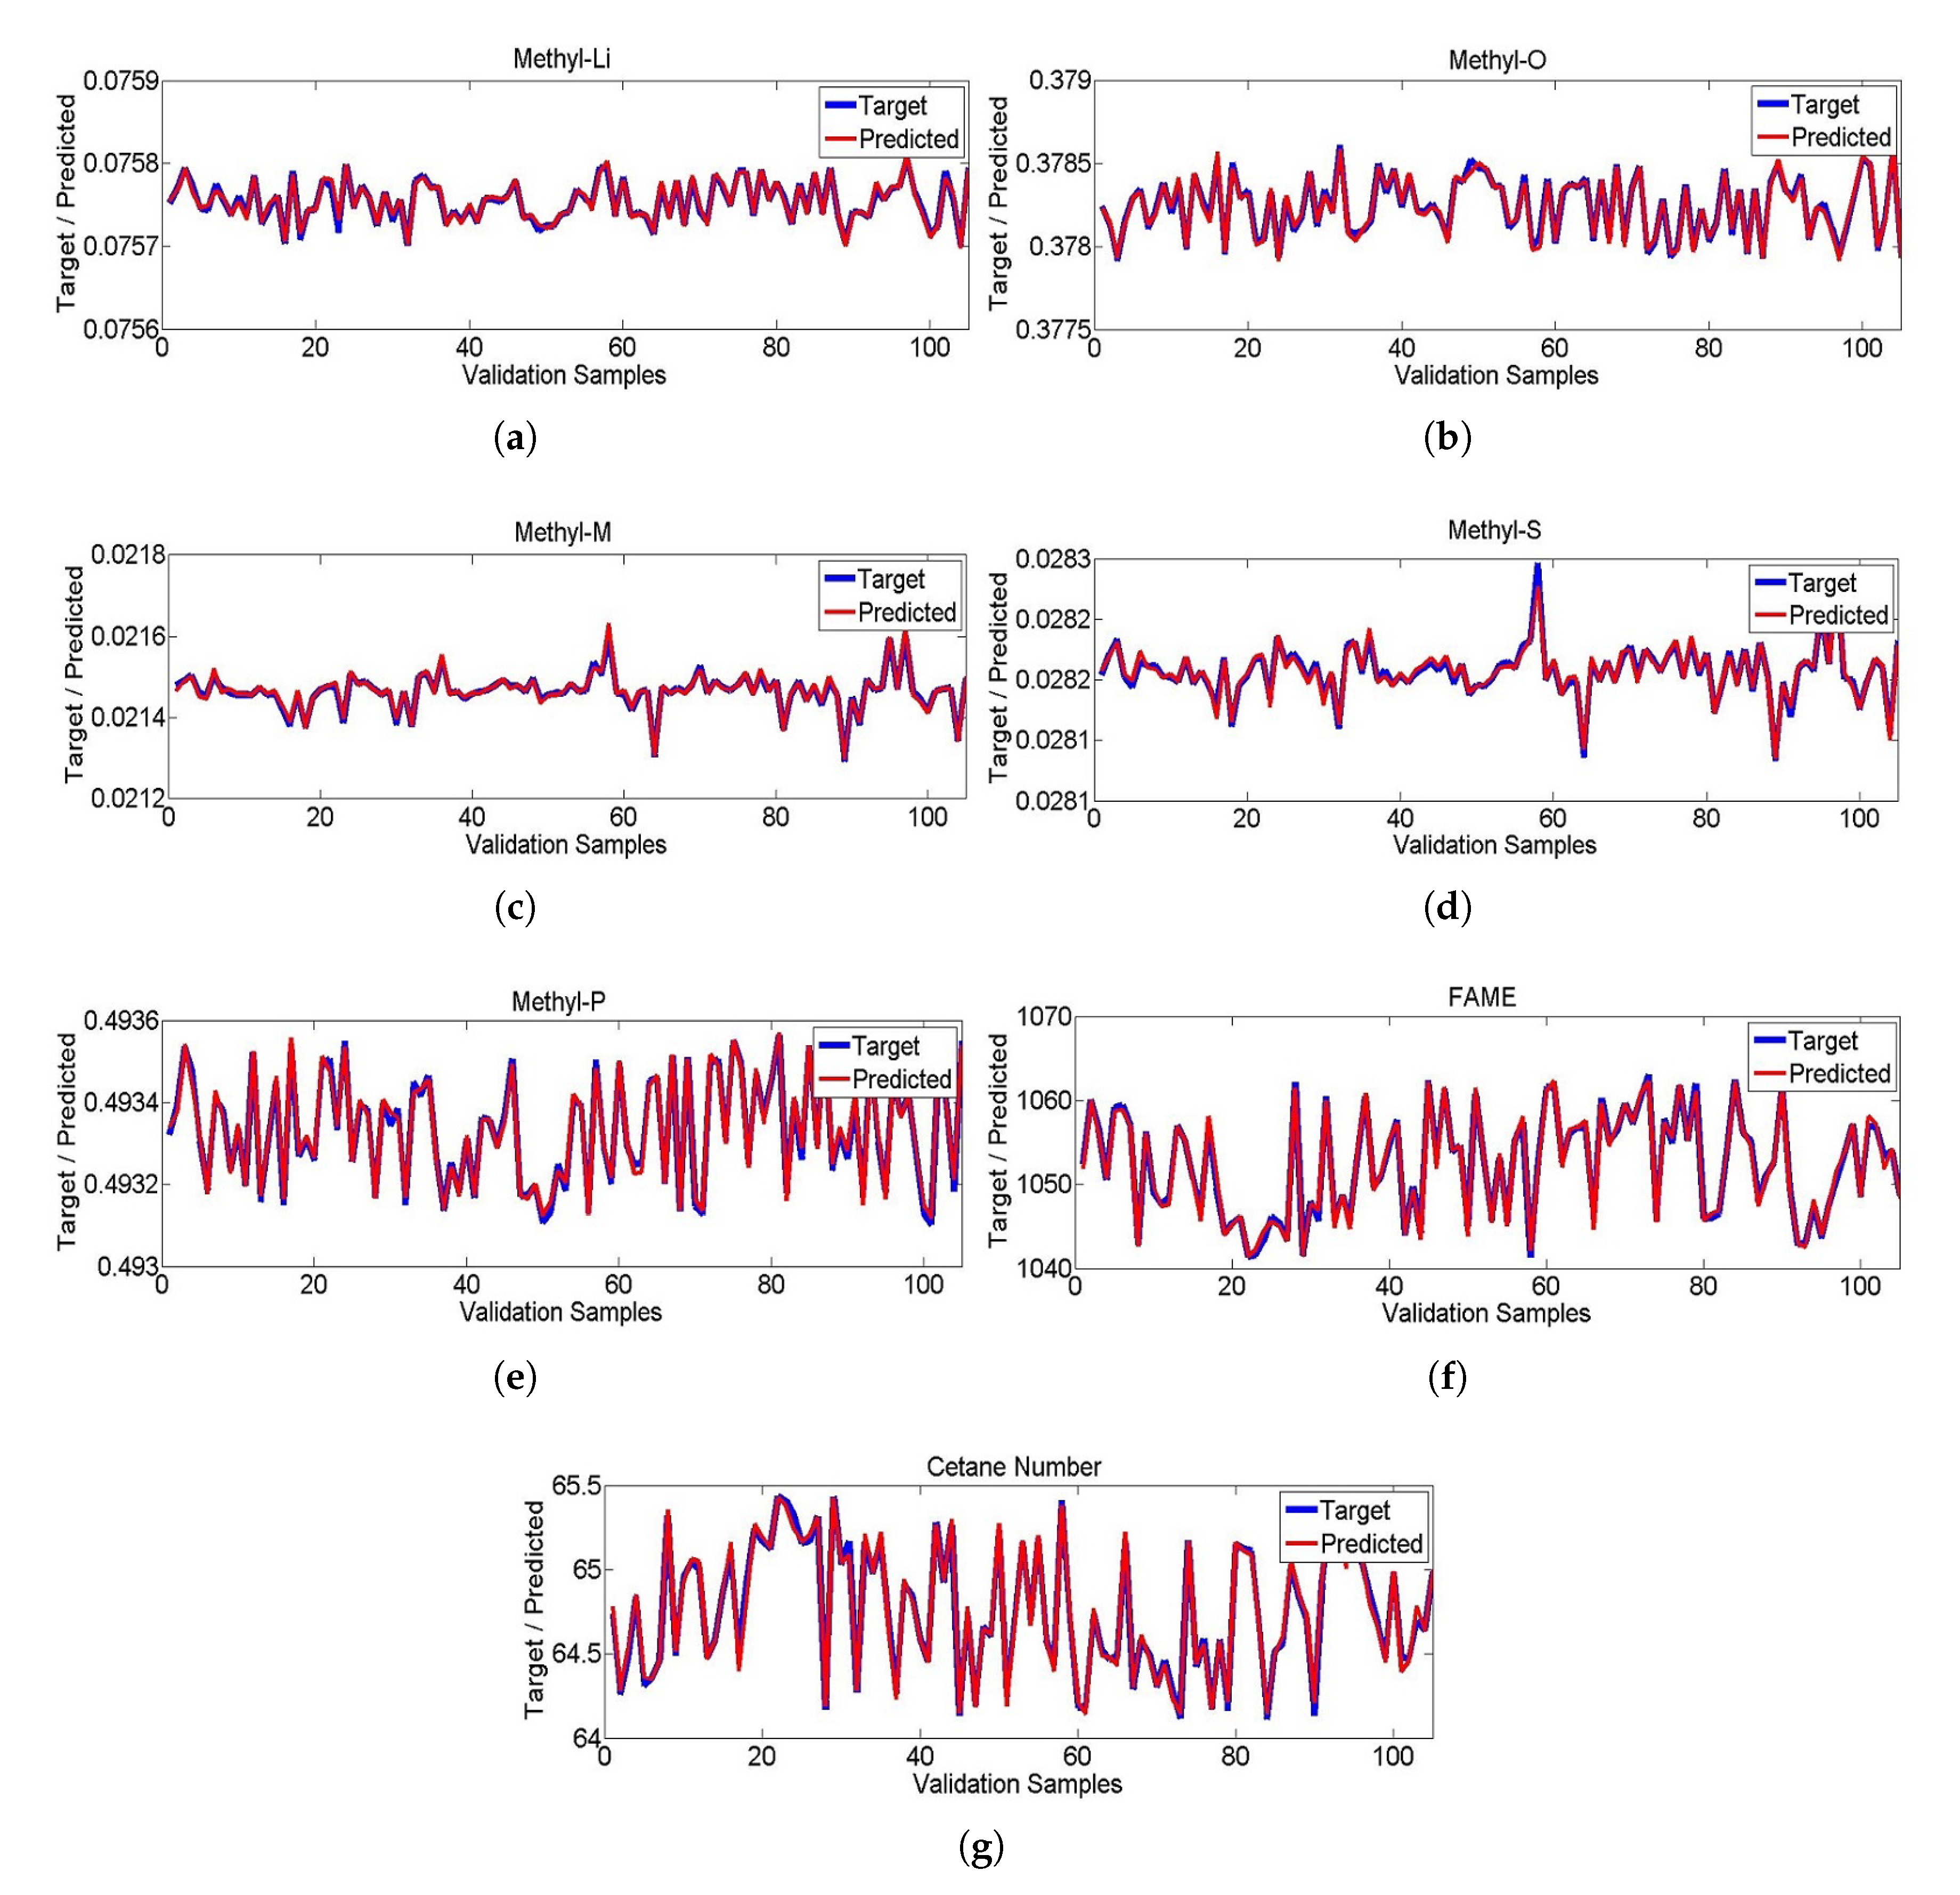
3.1. Soft-Sensor Development
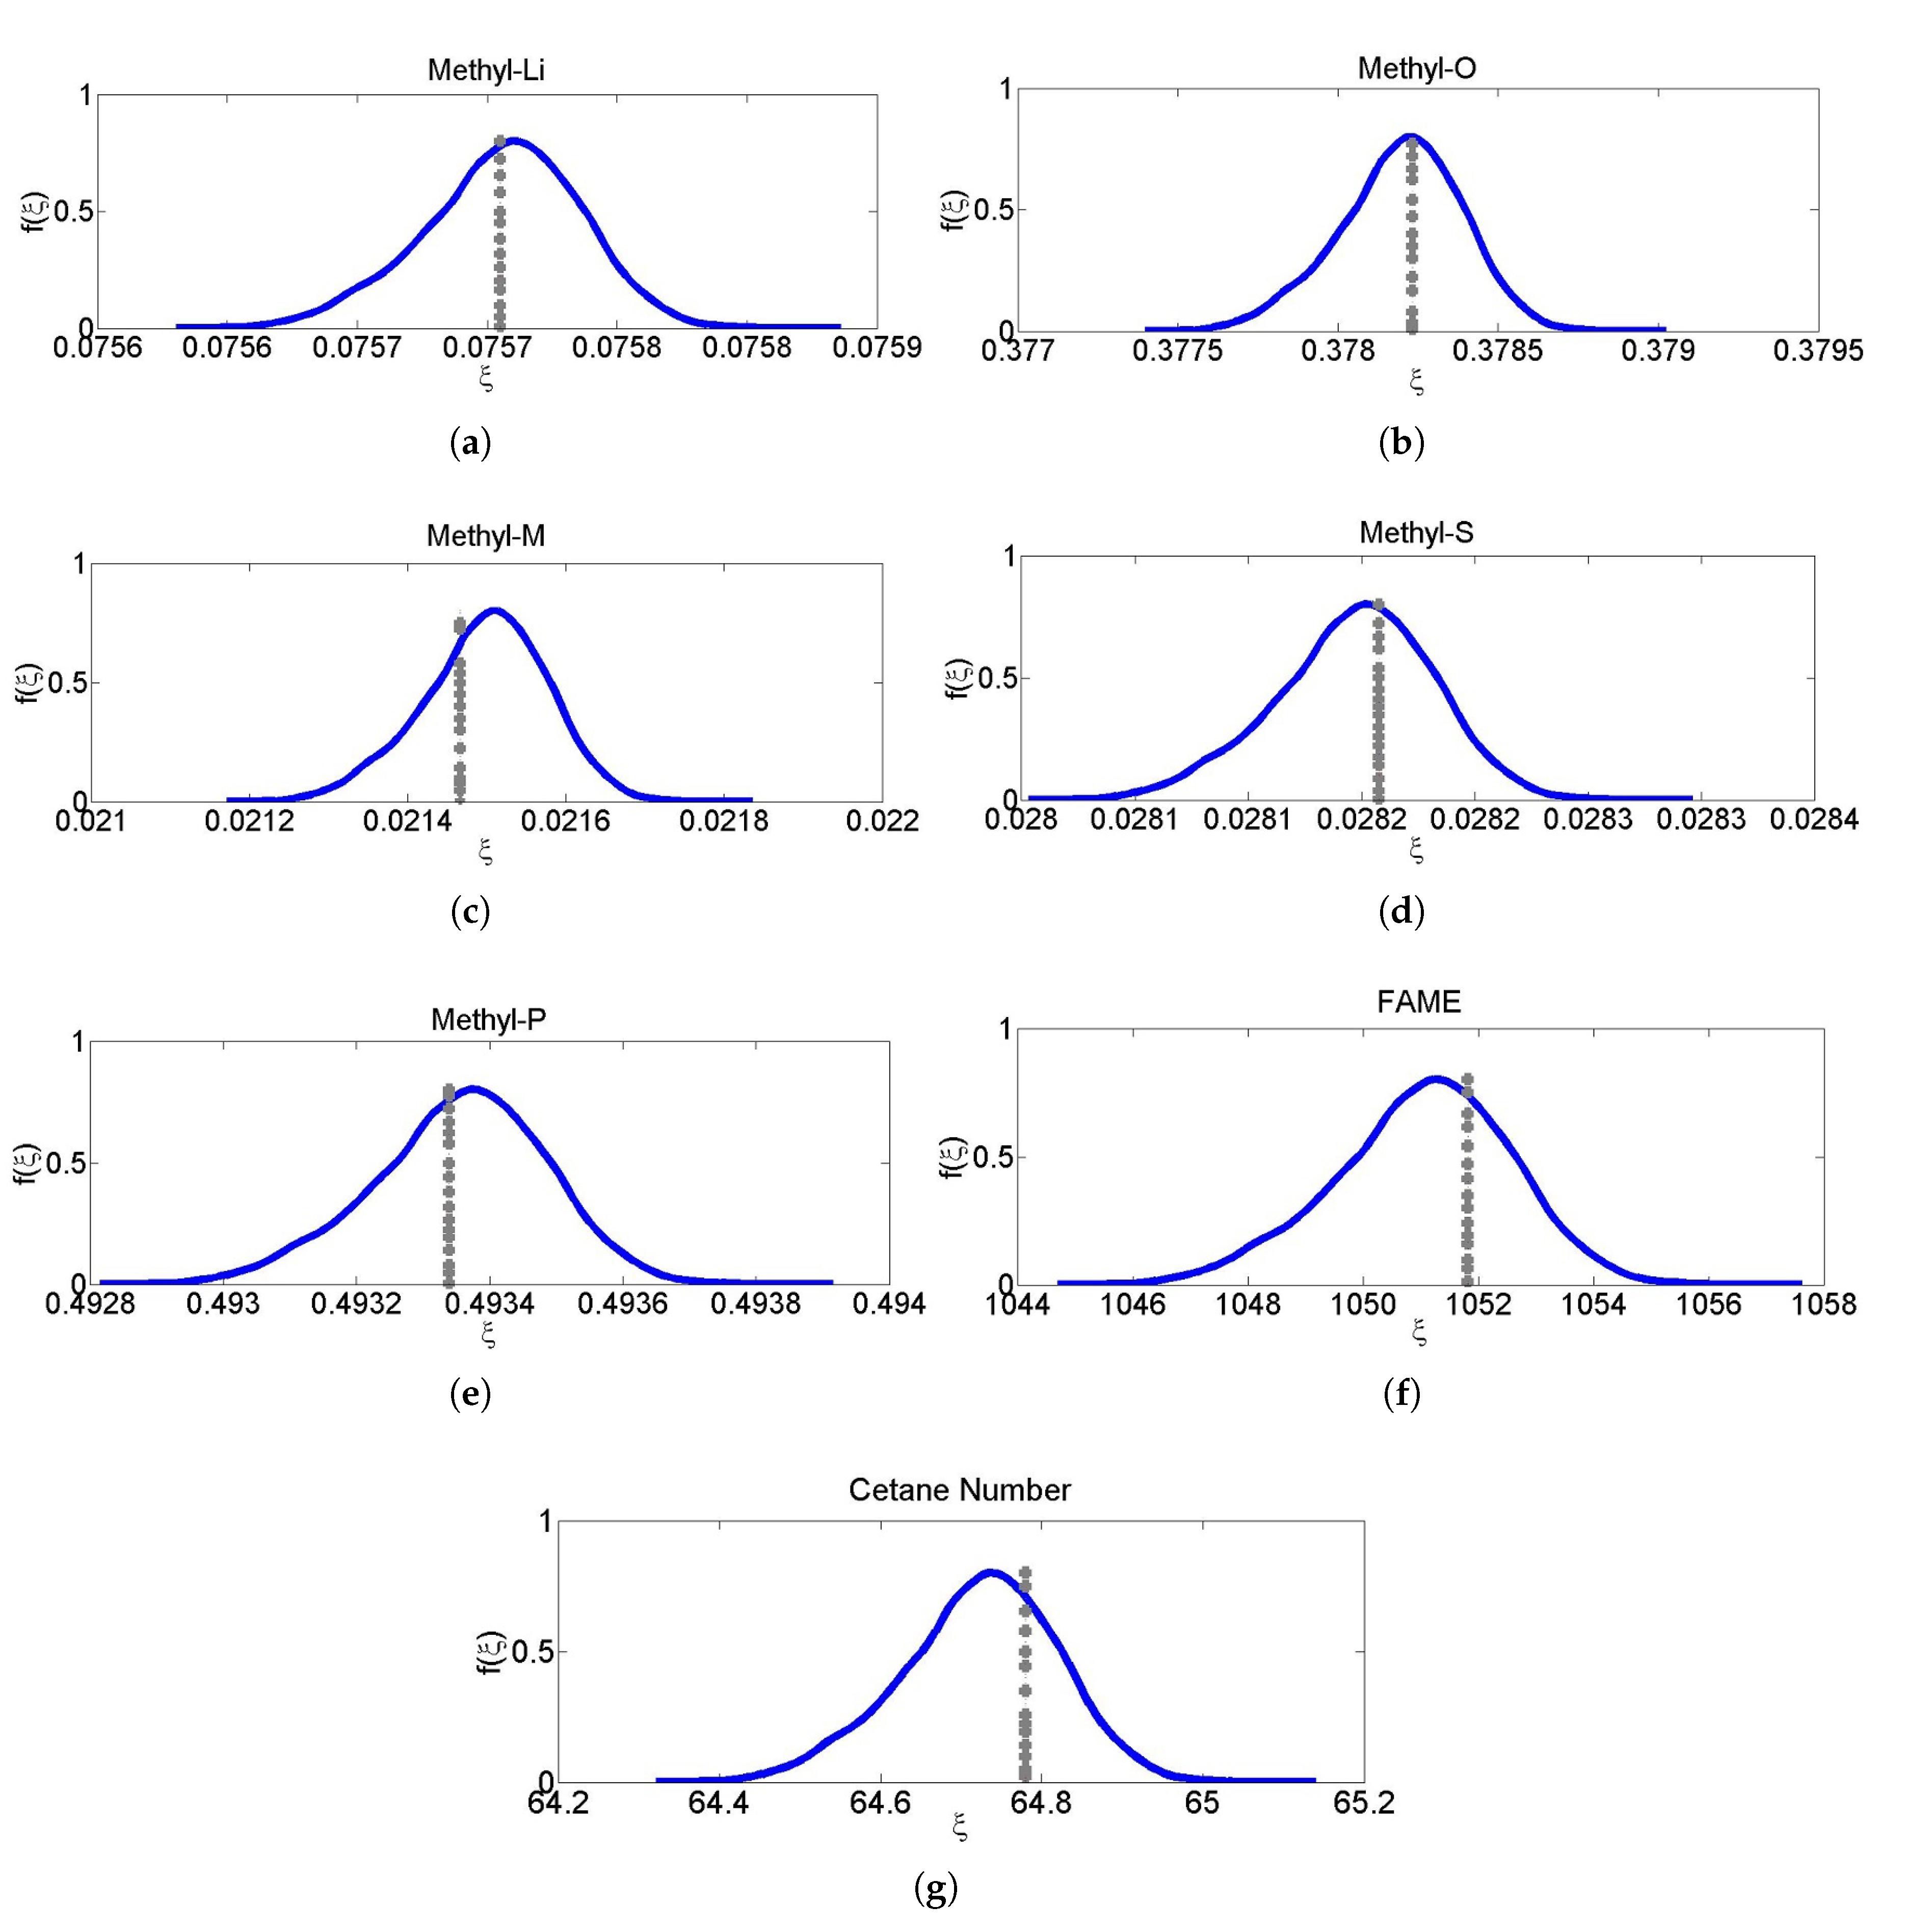
3.2. Uncertainty Analysis
4. Proposed Modeling and Analysis Framework
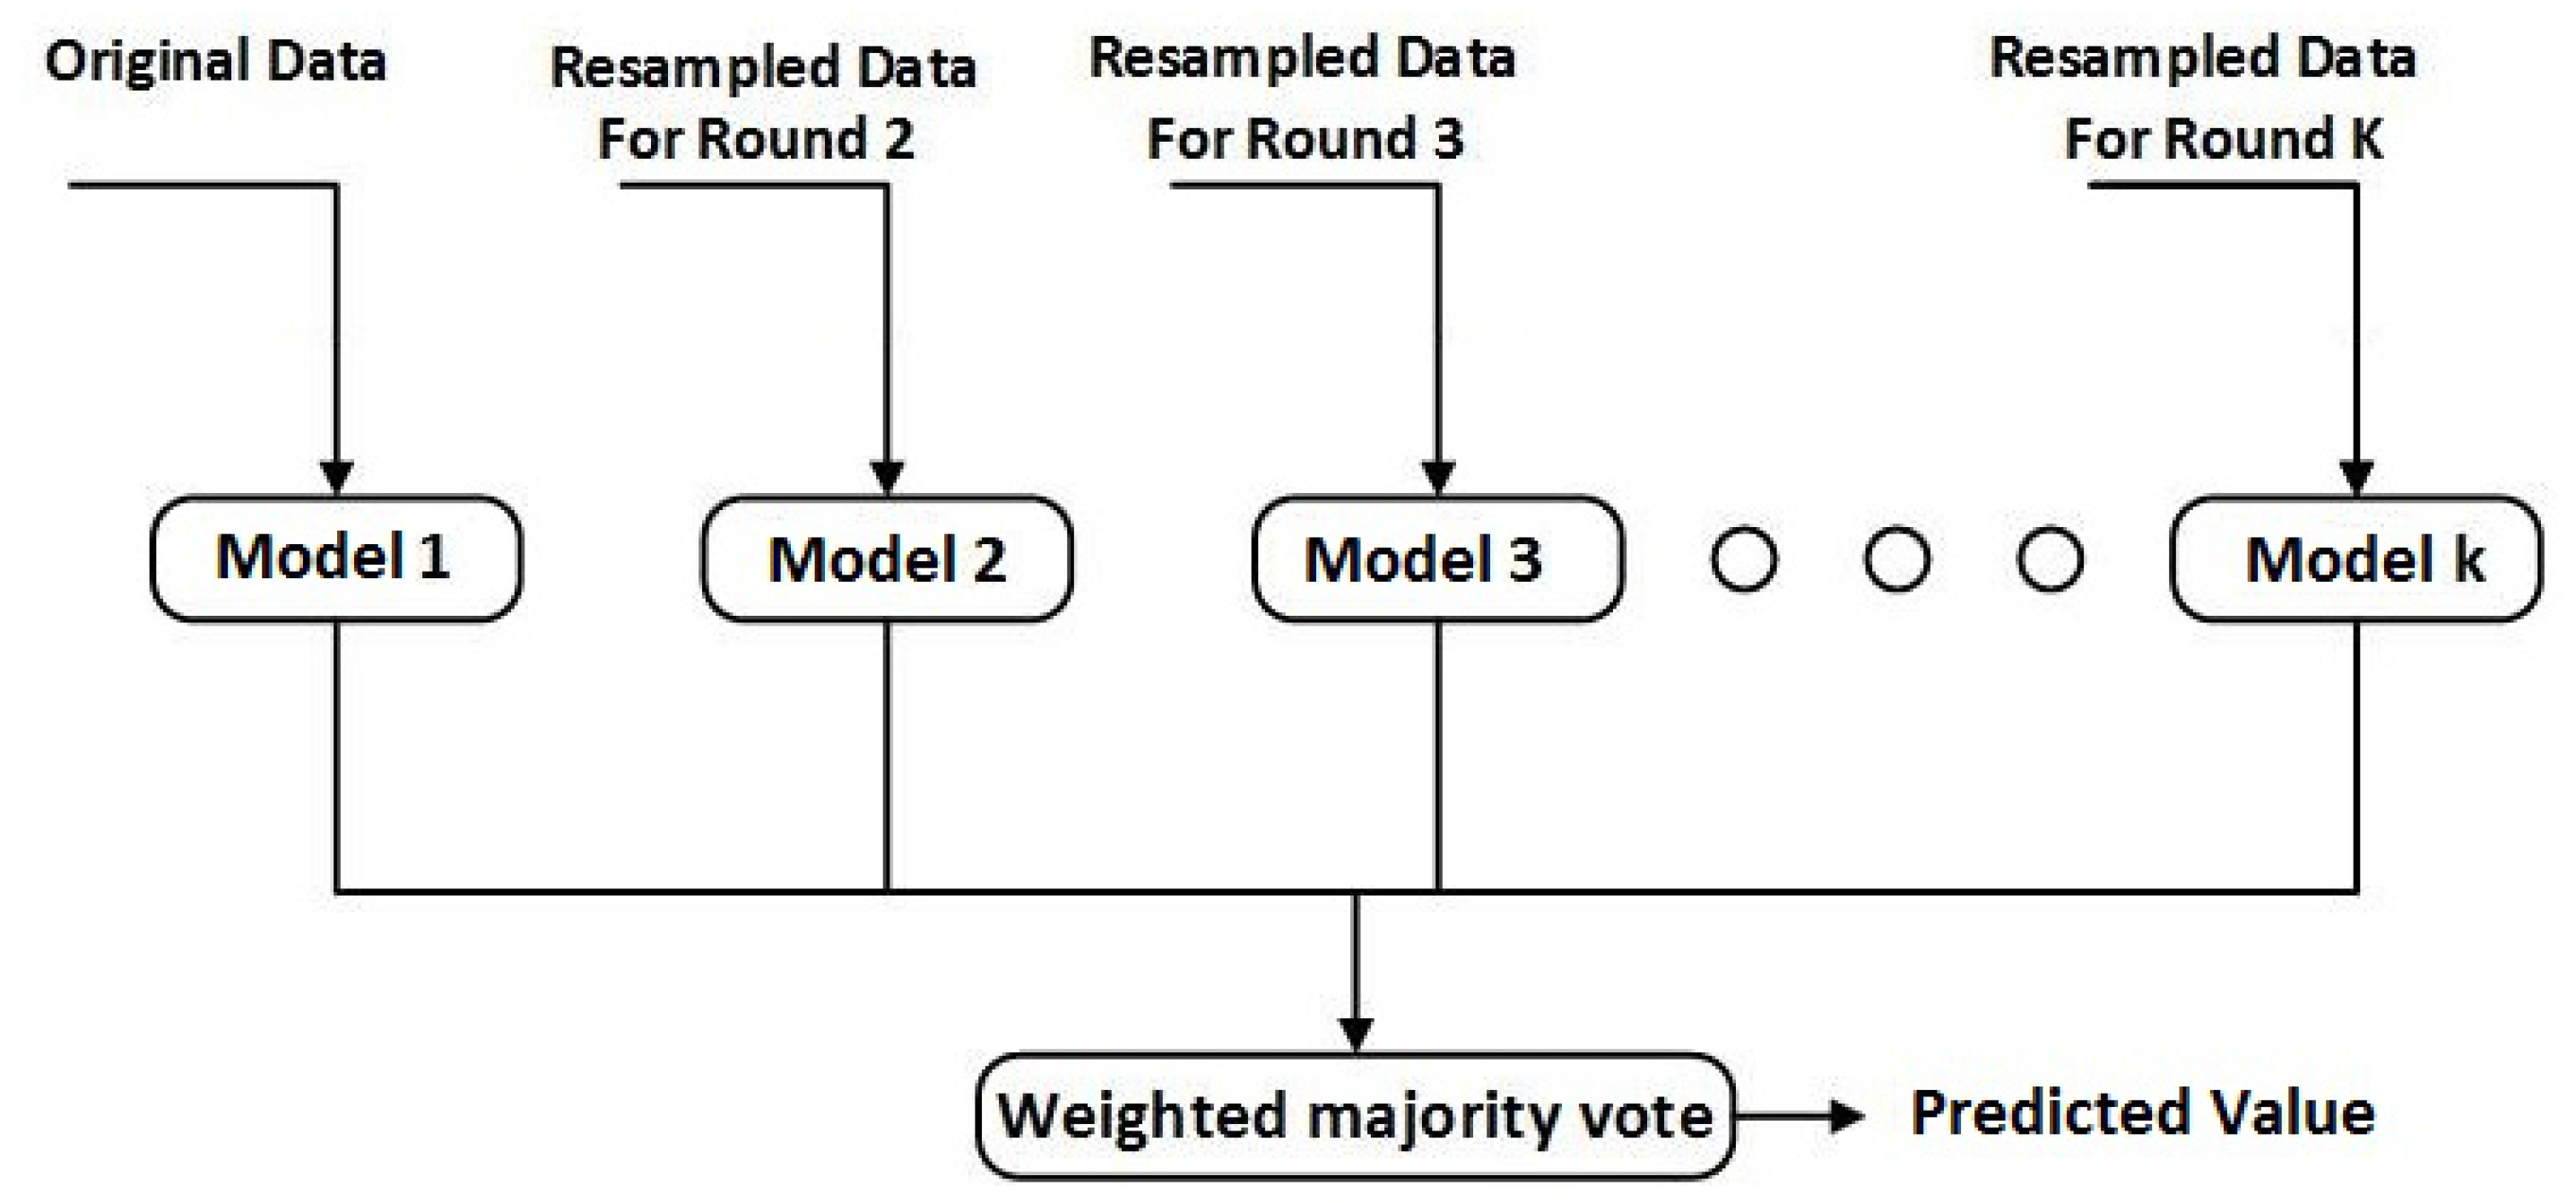
- Soft-sensor Design: The generated data are used to develop the soft-sensors through the ensemble learning method. The number of decision trees, i.e. weak learners, in the ensemble models is optimized.
- PCE based uncertainty analysis: The ensemble model developed in Step 2 is used within the PCE framework. PCE level and the number of terms are optimized. A uniform uncertainty in all input variables is assumed and PCE based random variables are generated for each of the input variables. The PCE based generated random variables are fed to the ensemble model and predictive distributions of respective outputs are obtained.
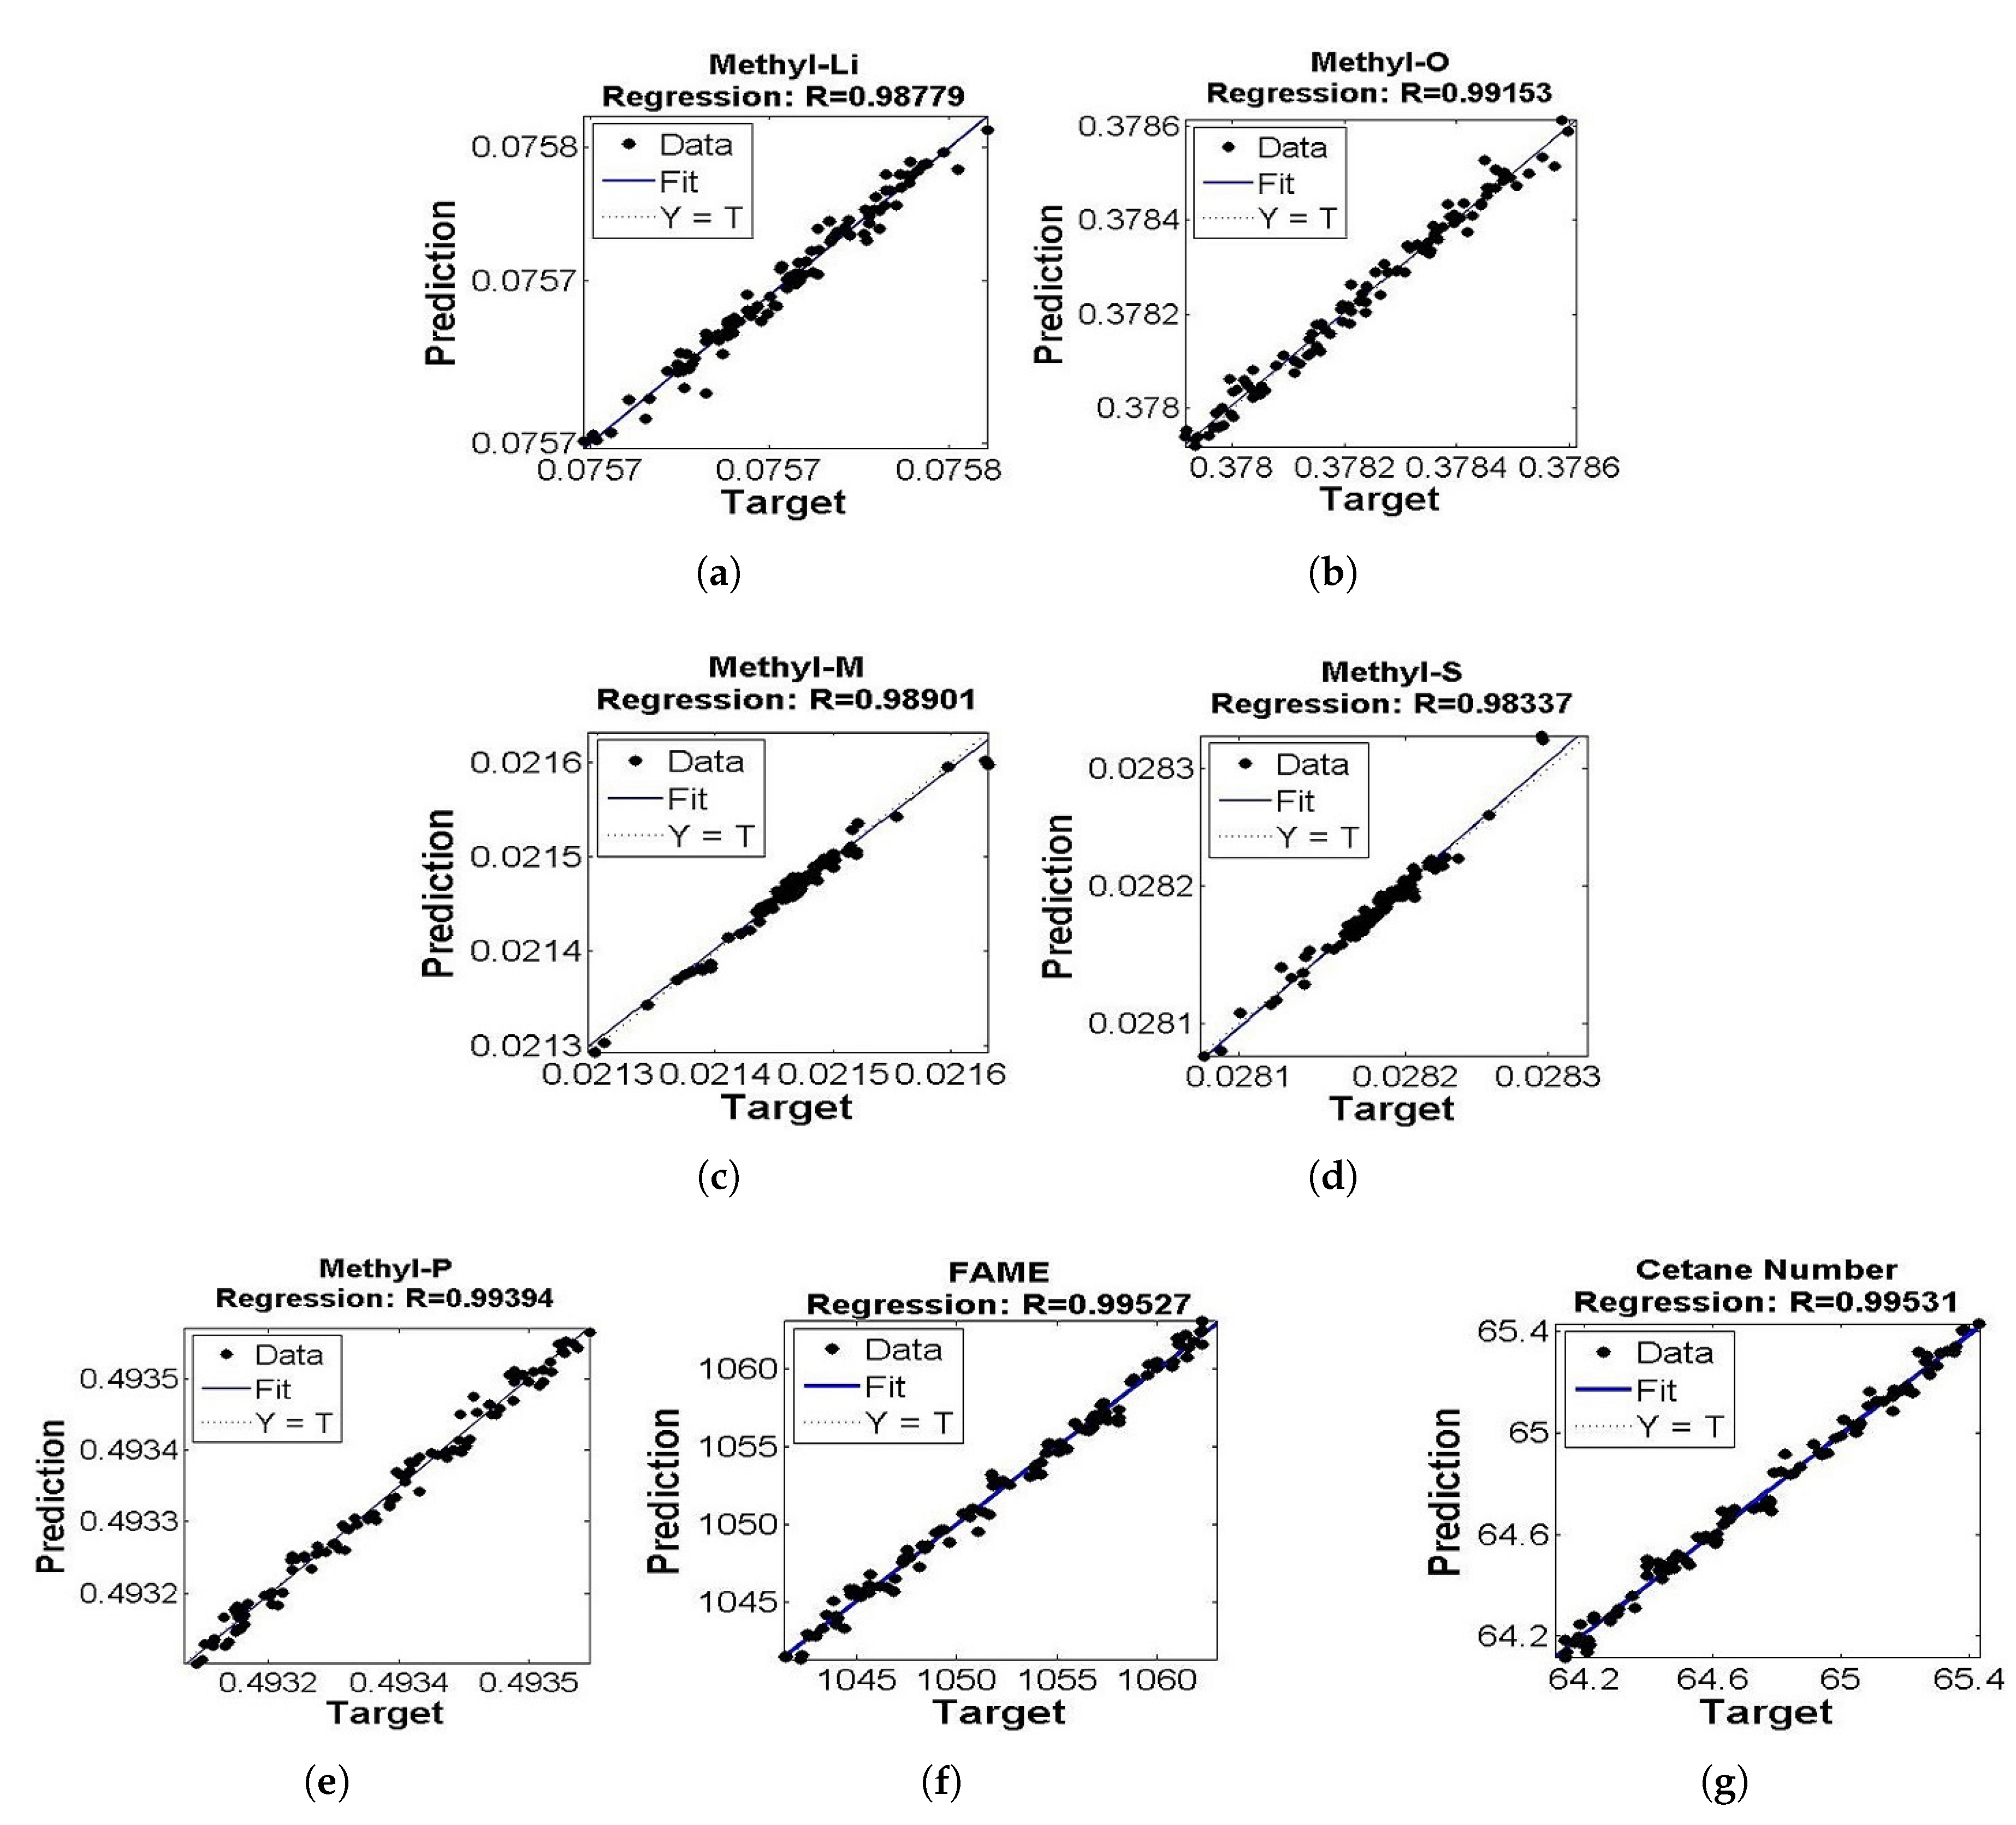
5. Results and Discussion
6. Conclusions
Author Contributions
Funding
Conflicts of Interest
References
- Atadashi, I.; Aroua, M.; Aziz, A.A.; Sulaiman, N. Refining technologies for the purification of crude biodiesel. Appl. Energy 2011, 88, 4239–4251. [Google Scholar] [CrossRef]
- Atadashi, I.; Aroua, M.; Aziz, A.A.; Sulaiman, N. Production of biodiesel using high free fatty acid feedstocks. Renew. Sustain. Energy Rev. 2012, 16, 3275–3285. [Google Scholar] [CrossRef]
- Jain, M.; Chandrakant, U.; Orsat, V.; Raghavan, V. A review on assessment of biodiesel production methodologies from Calophyllum inophyllum seed oil. Ind. Crop. Prod. 2018, 114, 28–44. [Google Scholar] [CrossRef]
- Kadlec, P.; Gabrys, B.; Strandt, S. Data-driven soft sensors in the process industry. Comput. Chem. Eng. 2009, 33, 795–814. [Google Scholar] [CrossRef]
- Meng, X.; Jia, M.; Wang, T. Neural network prediction of biodiesel kinematic viscosity at 313 K. Fuel 2014, 121, 133–140. [Google Scholar] [CrossRef]
- Rocabruno-Valdés, C.; Ramírez-Verduzco, L.; Hernández, J. Artificial neural network models to predict density, dynamic viscosity, and cetane number of biodiesel. Fuel 2015, 147, 9–17. [Google Scholar] [CrossRef]
- Mostafaei, M.; Javadikia, H.; Naderloo, L. Modeling the effects of ultrasound power and reactor dimension on the biodiesel production yield: Comparison of prediction abilities between response surface methodology (RSM) and adaptive neuro-fuzzy inference system (ANFIS). Energy 2016, 115, 626–636. [Google Scholar] [CrossRef]
- Miraboutalebi, S.; Kazemi, P.; Bahrami, P. Fatty Acid Methyl Ester (FAME) composition used for estimation of biodiesel cetane number employing random forest and artificial neural networks: A new approach. Fuel 2016, 166, 143–151. [Google Scholar] [CrossRef]
- Raman, A.A.A.; MK, A.; Sulaiman, N. Estimation of vegetable oil-based ethyl esters biodiesel densities using artificial neural networks. J. Appl. Sci. Data 2008, 8, 3005–3011. [Google Scholar] [CrossRef]
- Wali, W.; Hassan, K.; Cullen, J.; Shaw, A.; Al-Shamma’a, A. Real time monitoring and intelligent control for novel advanced microwave biodiesel reactor. Measurement 2013, 46, 823–839. [Google Scholar] [CrossRef]
- Fayyazi, E.; Ghobadian, B.; Najafi, G.; Hosseinzadeh, B. Genetic algorithm approach to optimize biodiesel production by ultrasonic system. Chem. Prod. Process Model. 2014, 9, 59–70. [Google Scholar] [CrossRef]
- Sikorski, J.J.; Brownbridge, G.; Garud, S.S.; Mosbach, S.; Karimi, I.A.; Kraft, M. Parameterisation of a biodiesel plant process flow sheet model. Comput. Chem. Eng. 2016, 95, 108–122. [Google Scholar] [CrossRef]
- Cheng, M.Y.; Prayogo, D.; Ju, Y.H.; Wu, Y.W.; Sutanto, S. Optimizing mixture properties of biodiesel production using genetic algorithm-based evolutionary support vector machine. Int. J. Green Energy 2016, 13, 1599–1607. [Google Scholar] [CrossRef]
- Ahmad, I.; Kano, M.; Hasebe, S. Dimensions and Analysis of Uncertainty in Industrial Modeling Process. J. Chem. Eng. Jpn. 2018, 51, 1–11. [Google Scholar] [CrossRef]
- Helton, J.C.; Cooke, R.M.; McKay, M.D.; Saltelli, A. Sensitivity analysis of model output: SAMO 2004. Reliab. Eng. Syst. Saf. 2006, 10, 1105–1108. [Google Scholar] [CrossRef]
- Refsgaard, J.C.; van der Sluijs, J.P.; Højberg, A.L.; Vanrolleghem, P.A. Uncertainty in the environmental modelling process—A framework and guidance. Environ. Model. Softw. 2007, 22, 1543–1556. [Google Scholar] [CrossRef]
- Van Der Heijden, K. Scenarios and forecasting: Two perspectives. Technol. Forecast. Soc. Chang. 2000, 65, 31–36. [Google Scholar] [CrossRef]
- Linkov, I.; Burmistrov, D. Model uncertainty and choices made by modelers: Lessons learned from the international atomic energy agency model intercomparisons. Risk Anal. Int. J. 2003, 23, 1297–1308. [Google Scholar] [CrossRef]
- Butts, M.B.; Payne, J.T.; Kristensen, M.; Madsen, H. An evaluation of the impact of model structure on hydrological modelling uncertainty for streamflow simulation. J. Hydrol. 2004, 298, 242–266. [Google Scholar] [CrossRef]
- Duan, Q.; Sorooshian, S.; Gupta, V.K. Optimal use of the SCE-UA global optimization method for calibrating watershed models. J. Hydrol. 1994, 158, 265–284. [Google Scholar] [CrossRef]
- Doherty, J.; Johnston, J.M. Methodologies for calibration and predictive analysis of a watershed model 1. JAWRA J. Am. Water Resour. Assoc. 2003, 39, 251–265. [Google Scholar] [CrossRef]
- Saltelli, A.; Chan, K.; Scott, E.M. Sensitivity Analysis; Wiley: New York, NY, USA, 2000; Volume 1. [Google Scholar]
- Knothe, G.; Matheaus, A.C.; Ryan, T.W., III. Cetane numbers of branched and straight-chain fatty esters determined in an ignition quality tester. Fuel 2003, 82, 971–975. [Google Scholar] [CrossRef]
- Breiman, L. Random forests. Mach. Learn. 2001, 45, 5–32. [Google Scholar] [CrossRef]
- Ahmad, I.; Mabuchi, H.; Kano, M.; Hasebe, S.; Inoue, Y.; Uegaki, H. Data-Based Ground Fault Diagnosis of Power Cable Systems. SICE J. Control Meas. Syst. Integr. 2013, 6, 290–297. [Google Scholar] [CrossRef]
- Friedman, J.H. Greedy function approximation: A gradient boosting machine. Ann. Stat. 2001, 29, 1189–1232. [Google Scholar] [CrossRef]
- Helton, J.C.; Johnson, J.D.; Sallaberry, C.J.; Storlie, C.B. Survey of sampling-based methods for uncertainty and sensitivity analysis. Reliab. Eng. Syst. Saf. 2006, 91, 1175–1209. [Google Scholar] [CrossRef]
- Perez, R.A. Uncertainty Analysis of Computational Fluid Dynamics via Polynomial Chaos. Ph.D. Thesis, Virginia Tech, Blacksburg, VA, USA, 2008. [Google Scholar]
- Oladyshkin, S.; Nowak, W. Data-driven uncertainty quantification using the arbitrary polynomial chaos expansion. Reliab. Eng. Syst. Saf. 2012, 106, 179–190. [Google Scholar] [CrossRef]
- Rajabi, M.M.; Ataie-Ashtiani, B.; Simmons, C.T. Polynomial chaos expansions for uncertainty propagation and moment independent sensitivity analysis of seawater intrusion simulations. J. Hydrol. 2015, 520, 101–122. [Google Scholar] [CrossRef]
- Sudret, B.; Der Kiureghian, A. Stochastic Finite Element Methods and Reliability: A State-of-the-Art Report; Department of Civil and Environmental Engineering, University of California Berkeley: Berkeley, CA, USA, 2000. [Google Scholar]
- Ahmad, I.; Ali, G.; Bilal, M.; Hussain, A. Virtual sensing of catalytic naphtha reforming process under uncertain feed conditions. In Proceedings of the 2018 International Conference on Computing, Mathematics and Engineering Technologies (iCoMET), Sukkur, Pakistan, 3–4 March 2018; pp. 1–6. [Google Scholar]
- Ahmad, I.; Mabuchi, H.; Kano, M.; Hasebe, S.; Inoue, Y.; Uegaki, H. Data-Based Fault Diagnosis of Power Cable System: Comparative Study of k-NN, ANN, Random Forest, and CART. In Proceedings of the 18th IFAC World Congress, Milano, Italy, 28 August–2 September 2011; pp. 12880–12885. [Google Scholar]


| No. | Names | No. | Names |
|---|---|---|---|
| 1 | MeOH steam’s flow rate | 26 | Water steam’s temperature |
| 2 | MeOH steam’s temperature | 27 | Water steam’s pressure |
| 3 | MeOH steam’s pressure | 28 | Water stream’s flow rate |
| 4 | NaOH steam’s pressure | 29 | H3PO4 steam’s temperatre |
| 5 | NaOH steam’s temperature | 30 | H3PO4 steam’s pressure |
| 6 | NaOH steam’s total flow rate | 31 | H3PO4 steam’s total flow rate |
| 7 | NaOH percentage in total fowrate | 32 | H3PO4 percentage in total flow rate |
| 8 | Water percentage in total flow rate | 33 | Water percentage in total flow rate |
| 9 | Oil stream’s temperature | 34 | Pump 1 pressure |
| 10 | Oil stream’s pressure | 35 | Pump 2 pressure |
| 11 | Oil stream’s total flow rate | 36 | HX1 temperature |
| 12 | Triolein flow rate | 37 | Reactor1 temperature |
| 13 | Trimyristin flow rate | 38 | Reactor1 pressure |
| 14 | Triplamitin flow rate | 39 | Reactor1 residence time |
| 15 | Polyphenyl sulfide flow rate | 40 | SP1 basis |
| 16 | Diphenyloxazole flow rate | 41 | SP1 reflux rate |
| 17 | Oleo-palmitostearin flow rate | 42 | Pump 3 pressure |
| 18 | Matrix metalloproteinase flow rate | 43 | HX2 temperature |
| 19 | Dipalmitoyl linoleoyl glycerol flow rate | 44 | SP3 basis |
| 20 | Palmitoyl dioleylglycerol flow rate | 45 | SP3 reflux frate |
| 21 | Linoleoyloleoyl palmitoyl glycerol flow rate | 46 | Reactor2 temperature |
| 22 | Dioleoyl stearo glycerol flow rate | 47 | Reactor2 pressure |
| 23 | Dilinoleoyl stearoyl glycerol flow rate | 48 | SP5 basis |
| 24 | Monolauroyl dioleoyl glycerol flow rate | 49 | SP5 reflux rate |
| 25 | Dipalmitoyl glycerol flow rate |
| No. | Names | Values | Units |
|---|---|---|---|
| 1 | Oleic Acid Methyl Ester(Methyl O) | 397.8 | kg/h |
| 2 | Palmitic Acid Methyl Ester(Methyl P) | 518.9 | kg/h |
| 3 | Myristic Acid Methyl Ester(Methyl M) | 22.57 | kg/h |
| 4 | Linoleic Acid Methyl Ester(Methyl Li) | 79.68 | kg/h |
| 5 | Stearic Acid Methyl Ester(Methyl S) | 29.67 | kg/h |
| 6 | FAME | 1050 | kg/h |
| 7 | Cetane Number | 64.78 |
| No. | Output Variable | Weak Learners | % Accuracy | RMSE Value | SSE Value |
|---|---|---|---|---|---|
| 1 | Methyl Li | 1200 | 98.779 | 3.954 × 10⁻⁶ | 1.61 × 10⁻⁹ |
| 2 | Methyl O | 1200 | 99.153 | 2.391 × 10⁻⁵ | 5.89 × 10⁻⁸ |
| 3 | Methyl M | 400 | 98.901 | 6.906 × 10⁻⁶ | 4.912 × 10⁻⁶ |
| 4 | Methyl P | 600 | 99.394 | 1.488 × 10⁻⁵ | 2.279 × 10⁻⁸ |
| 5 | Methyl S | 2000 | 98.337 | 4.188 × 10⁻⁶ | 1.807 × 10⁻⁹ |
| 6 | FAME flow rate | 800 | 99.527 | 0.6025 | 37.99 |
| 7 | Cetane Number | 650 | 99.531 | 0.0396 | 0.1407 |
| Actual | Values | Error (%) | |||||||||||
|---|---|---|---|---|---|---|---|---|---|---|---|---|---|
| P | Li | O | M | S | CN | FAME | P | Li | O | M | S | CN | FAME |
| 0.49334 | 0.07575 | 0.37823 | 0.02147 | 0.02821 | 64.77983 | 1051.82387 | 0.00352 | 0.00336 | 0.00323 | 0.05590 | 0.01239 | 0.07194 | 0.05856 |
| 0.49337 | 0.07577 | 0.37815 | 0.02149 | 0.02822 | 64.28166 | 1059.97524 | 0.00346 | 0.00203 | 0.00479 | 0.00775 | 0.00722 | 0.03378 | 0.00347 |
| 0.49354 | 0.07579 | 0.37793 | 0.02150 | 0.02823 | 64.52924 | 1055.90848 | 0.00104 | 0.00039 | 0.00378 | 0.01603 | 0.01017 | 0.07744 | 0.05311 |
| 0.49344 | 0.07576 | 0.37814 | 0.02145 | 0.02821 | 64.85225 | 1050.64924 | 0.00793 | 0.01181 | 0.00439 | 0.04947 | 0.01045 | 0.01915 | 0.01297 |
| 0.49331 | 0.07575 | 0.37829 | 0.02145 | 0.02820 | 64.36030 | 1058.68015 | 0.00235 | 0.00113 | 0.00015 | 0.02177 | 0.01737 | 0.07569 | 0.04245 |
| 0.49318 | 0.07575 | 0.37833 | 0.02152 | 0.02822 | 64.35063 | 1058.83926 | 0.00194 | 0.00751 | 0.00459 | 0.08273 | 0.03344 | 0.00743 | 0.05034 |
| 0.49343 | 0.07577 | 0.37814 | 0.02146 | 0.02821 | 64.46647 | 1056.93662 | 0.00450 | 0.01071 | 0.00623 | 0.05596 | 0.00571 | 0.00400 | 0.00197 |
| 0.49337 | 0.07576 | 0.37820 | 0.02147 | 0.02821 | 65.35289 | 1042.60063 | 0.00331 | 0.00485 | 0.00585 | 0.03767 | 0.01174 | 0.04987 | 0.02124 |
| 0.49323 | 0.07574 | 0.37838 | 0.02146 | 0.02820 | 64.51843 | 1056.08529 | 0.00121 | 0.00075 | 0.00278 | 0.00945 | 0.00470 | 0.03943 | 0.01381 |
| 0.49335 | 0.07575 | 0.37824 | 0.02146 | 0.02820 | 64.91510 | 1049.63203 | 0.00247 | 0.00833 | 0.00870 | 0.00704 | 0.00951 | 0.05944 | 0.07687 |
| 0.49319 | 0.07573 | 0.37842 | 0.02146 | 0.02820 | 65.06075 | 1047.28217 | 0.00027 | 0.00619 | 0.01187 | 0.00108 | 0.00013 | 0.02891 | 0.02542 |
| 0.49352 | 0.07578 | 0.37800 | 0.02148 | 0.02822 | 65.04558 | 1047.52648 | 0.00036 | 0.00243 | 0.00264 | 0.01259 | 0.00175 | 0.07035 | 0.08327 |
| 0.49317 | 0.07573 | 0.37844 | 0.02146 | 0.02820 | 64.46980 | 1056.88189 | 0.00317 | 0.00209 | 0.00205 | 0.01450 | 0.00381 | 0.01719 | 0.00665 |
| 0.49332 | 0.07575 | 0.37825 | 0.02147 | 0.02821 | 64.57717 | 1055.12474 | 0.00224 | 0.00774 | 0.00933 | 0.02765 | 0.00063 | 0.01173 | 0.00227 |
| 0.49346 | 0.07576 | 0.37815 | 0.02143 | 0.02820 | 64.87258 | 1050.32008 | 0.00256 | 0.00124 | 0.00737 | 0.03615 | 0.01075 | 0.00821 | 0.03637 |
| 0.49316 | 0.07571 | 0.37857 | 0.02139 | 0.02817 | 65.16236 | 1045.64917 | 0.00273 | 0.00275 | 0.01595 | 0.04569 | 0.03807 | 0.11464 | 0.10758 |
| 0.49356 | 0.07579 | 0.37797 | 0.02147 | 0.02822 | 64.39687 | 1058.07882 | 0.00281 | 0.00591 | 0.00420 | 0.04087 | 0.00622 | 0.16337 | 0.14401 |
| 0.49327 | 0.07572 | 0.37847 | 0.02138 | 0.02817 | 64.82592 | 1051.07598 | 0.00120 | 0.00937 | 0.00967 | 0.00119 | 0.01301 | 0.14071 | 0.14541 |
| 0.49332 | 0.07574 | 0.37829 | 0.02145 | 0.02820 | 65.26961 | 1043.93092 | 0.00181 | 0.00229 | 0.00010 | 0.00044 | 0.00617 | 0.04575 | 0.01654 |
| 0.49327 | 0.07574 | 0.37832 | 0.02147 | 0.02820 | 65.19200 | 1045.1737 | 0.00167 | 0.00131 | 0.00610 | 0.00296 | 0.00477 | 0.03743 | 0.01871 |
| 0.49351 | 0.07578 | 0.37801 | 0.02148 | 0.02822 | 65.12934 | 1046.17934 | 0.00443 | 0.00215 | 0.00833 | 0.01145 | 0.00528 | 0.00977 | 0.01049 |
| 0.49348 | 0.07578 | 0.37803 | 0.02149 | 0.02822 | 65.42734 | 1041.41424 | 0.00570 | 0.01090 | 0.00177 | 0.05628 | 0.01134 | 0.00765 | 0.00286 |
| 0.49334 | 0.07573 | 0.37835 | 0.02140 | 0.02818 | 65.37571 | 1042.23679 | 0.00163 | 0.02018 | 0.00616 | 0.04574 | 0.02140 | 0.04538 | 0.05826 |
| 0.49353 | 0.07580 | 0.37792 | 0.02151 | 0.02824 | 65.24007 | 1044.40363 | 0.00295 | 0.00026 | 0.00585 | 0.02183 | 0.00675 | 0.12215 | 0.10655 |
| 0.49325 | 0.07575 | 0.37831 | 0.02148 | 0.02821 | 65.16601 | 1045.59063 | 0.00001 | 0.00042 | 0.00527 | 0.00645 | 0.01937 | 0.01289 | 0.04896 |
| P | Li | O | M | S | CN | FAME |
|---|---|---|---|---|---|---|
| 0.16552 | 0.27808 | 0.34019 | 2.40974 | 0.82984 | 1.08191 | 1.05554 |
| 0.16577 | 0.27457 | 0.31979 | 2.38871 | 0.83584 | 1.05563 | 0.95637 |
| 0.16292 | 0.27772 | 0.31339 | 2.39248 | 0.83512 | 1.02864 | 0.91446 |
| 0.16308 | 0.27550 | 0.31750 | 2.34861 | 0.84314 | 1.04743 | 1.03876 |
| 0.16093 | 0.27067 | 0.33528 | 2.41099 | 0.82704 | 1.08012 | 1.00535 |
| 0.16059 | 0.27486 | 0.31578 | 2.45583 | 0.83230 | 0.99584 | 0.96712 |
| 0.16267 | 0.27954 | 0.31831 | 2.37411 | 0.83245 | 1.03889 | 0.95274 |
| 0.16841 | 0.27268 | 0.31927 | 2.40162 | 0.83223 | 0.96045 | 0.96516 |
| 0.16376 | 0.27824 | 0.32129 | 2.37550 | 0.82250 | 0.99785 | 0.93083 |
| 0.16149 | 0.27109 | 0.33075 | 2.42211 | 0.83674 | 0.93986 | 0.99403 |
| 0.16636 | 0.26695 | 0.32182 | 2.41314 | 0.82858 | 1.04694 | 1.00870 |
| 0.16065 | 0.26844 | 0.32060 | 2.40208 | 0.82506 | 0.95842 | 1.01706 |
| 0.16265 | 0.27800 | 0.32840 | 2.46668 | 0.82138 | 1.01479 | 1.01629 |
| 0.16915 | 0.28244 | 0.32207 | 2.37457 | 0.83700 | 0.99861 | 0.98543 |
| 0.16623 | 0.27555 | 0.31957 | 2.33797 | 0.83614 | 1.07821 | 1.06566 |
| 0.16651 | 0.27631 | 0.32403 | 2.36810 | 0.84555 | 1.06042 | 1.02553 |
| 0.15890 | 0.27896 | 0.32217 | 2.39600 | 0.81433 | 0.96692 | 1.10511 |
| 0.16413 | 0.26931 | 0.31606 | 2.38986 | 0.82274 | 1.03271 | 0.97631 |
| 0.16124 | 0.27469 | 0.33022 | 2.41911 | 0.84660 | 1.03330 | 1.00750 |
| 0.16817 | 0.28308 | 0.32721 | 2.42816 | 0.83586 | 1.04583 | 1.00173 |
| 0.16146 | 0.27422 | 0.31547 | 2.40128 | 0.83253 | 0.98816 | 1.00466 |
| 0.16226 | 0.27761 | 0.32194 | 2.43287 | 0.83526 | 0.91761 | 0.86320 |
| 0.16428 | 0.27386 | 0.31823 | 2.40904 | 0.84382 | 0.98527 | 0.92505 |
| 0.15903 | 0.27715 | 0.31880 | 2.36198 | 0.82594 | 1.05677 | 0.98890 |
| 0.16761 | 0.27635 | 0.33213 | 2.41000 | 0.83058 | 1.09828 | 1.08529 |
© 2018 by the authors. Licensee MDPI, Basel, Switzerland. This article is an open access article distributed under the terms and conditions of the Creative Commons Attribution (CC BY) license (http://creativecommons.org/licenses/by/4.0/).
Share and Cite
Ahmad, I.; Ayub, A.; Ibrahim, U.; Khattak, M.K.; Kano, M. Data-Based Sensing and Stochastic Analysis of Biodiesel Production Process. Energies 2019, 12, 63. https://doi.org/10.3390/en12010063
Ahmad I, Ayub A, Ibrahim U, Khattak MK, Kano M. Data-Based Sensing and Stochastic Analysis of Biodiesel Production Process. Energies. 2019; 12(1):63. https://doi.org/10.3390/en12010063
Chicago/Turabian StyleAhmad, Iftikhar, Ahsan Ayub, Uzair Ibrahim, Mansoor Khan Khattak, and Manabu Kano. 2019. "Data-Based Sensing and Stochastic Analysis of Biodiesel Production Process" Energies 12, no. 1: 63. https://doi.org/10.3390/en12010063
APA StyleAhmad, I., Ayub, A., Ibrahim, U., Khattak, M. K., & Kano, M. (2019). Data-Based Sensing and Stochastic Analysis of Biodiesel Production Process. Energies, 12(1), 63. https://doi.org/10.3390/en12010063