Modelling of a Variable Refrigerant Flow System in EnergyPlus for Building Energy Simulation in an Open Building Information Modelling Environment

 ,
,
Abstract
1. Introduction
2. Materials and Methods
2.1. VRF System Model
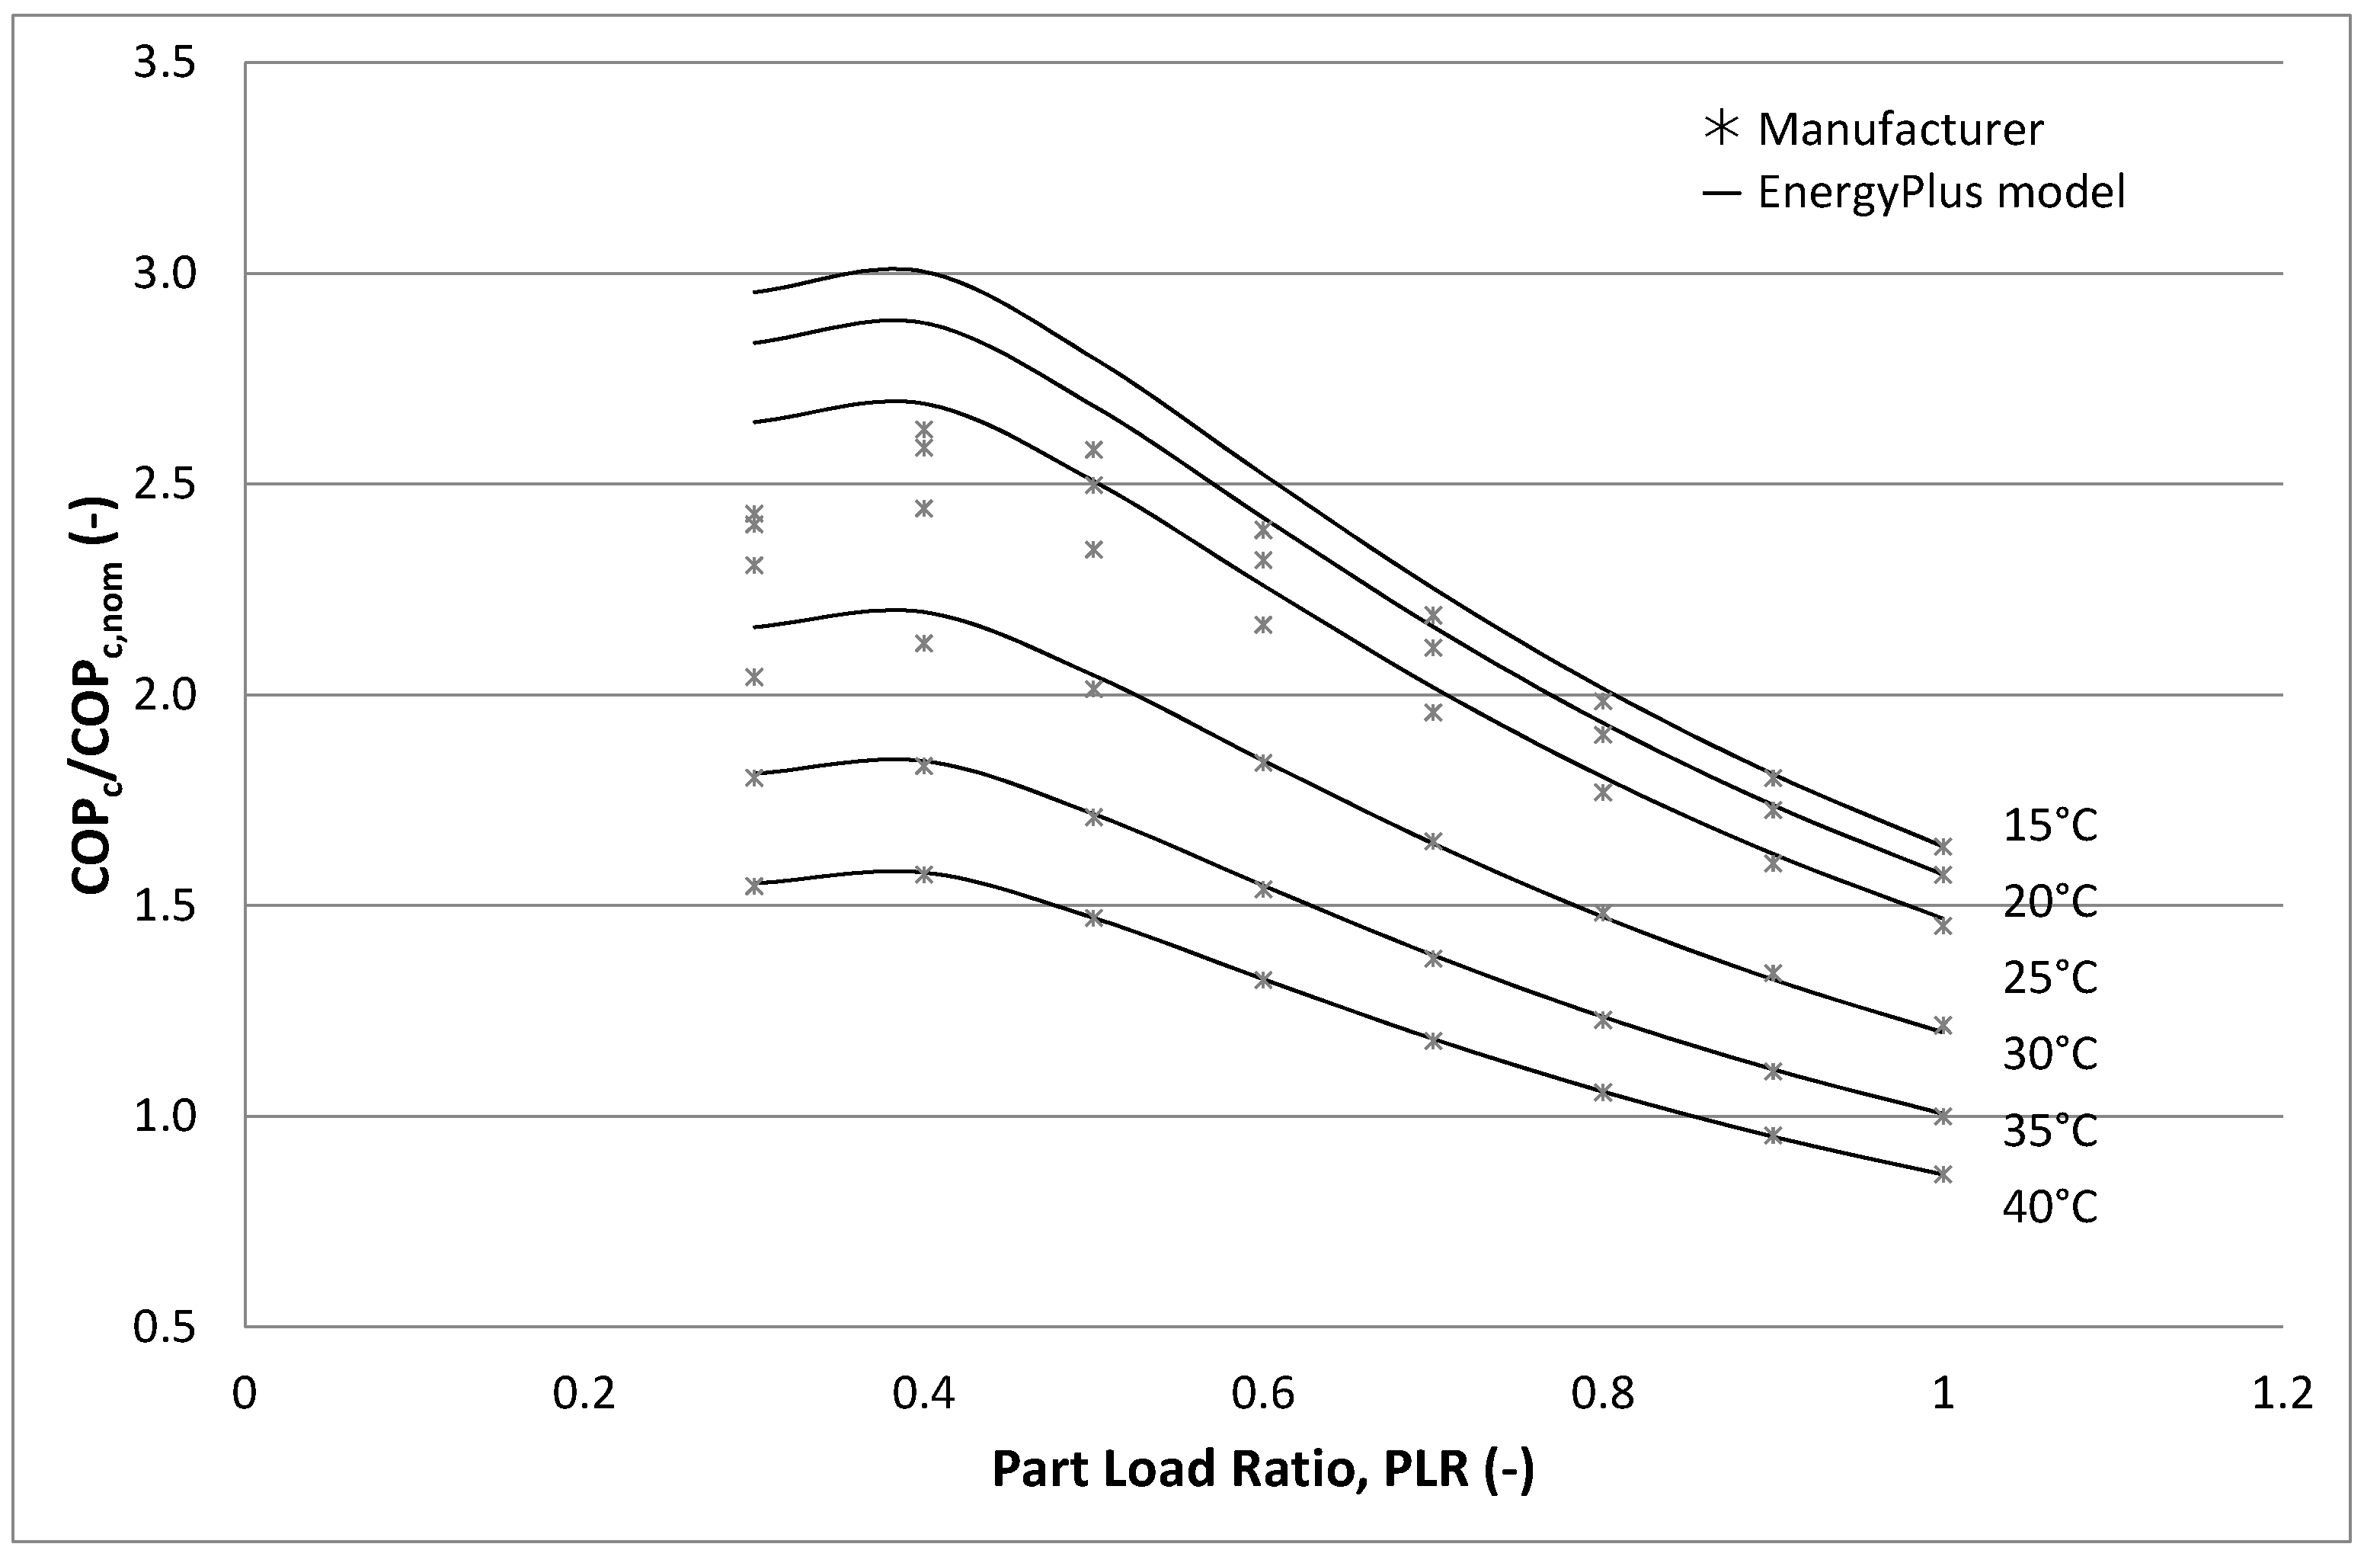
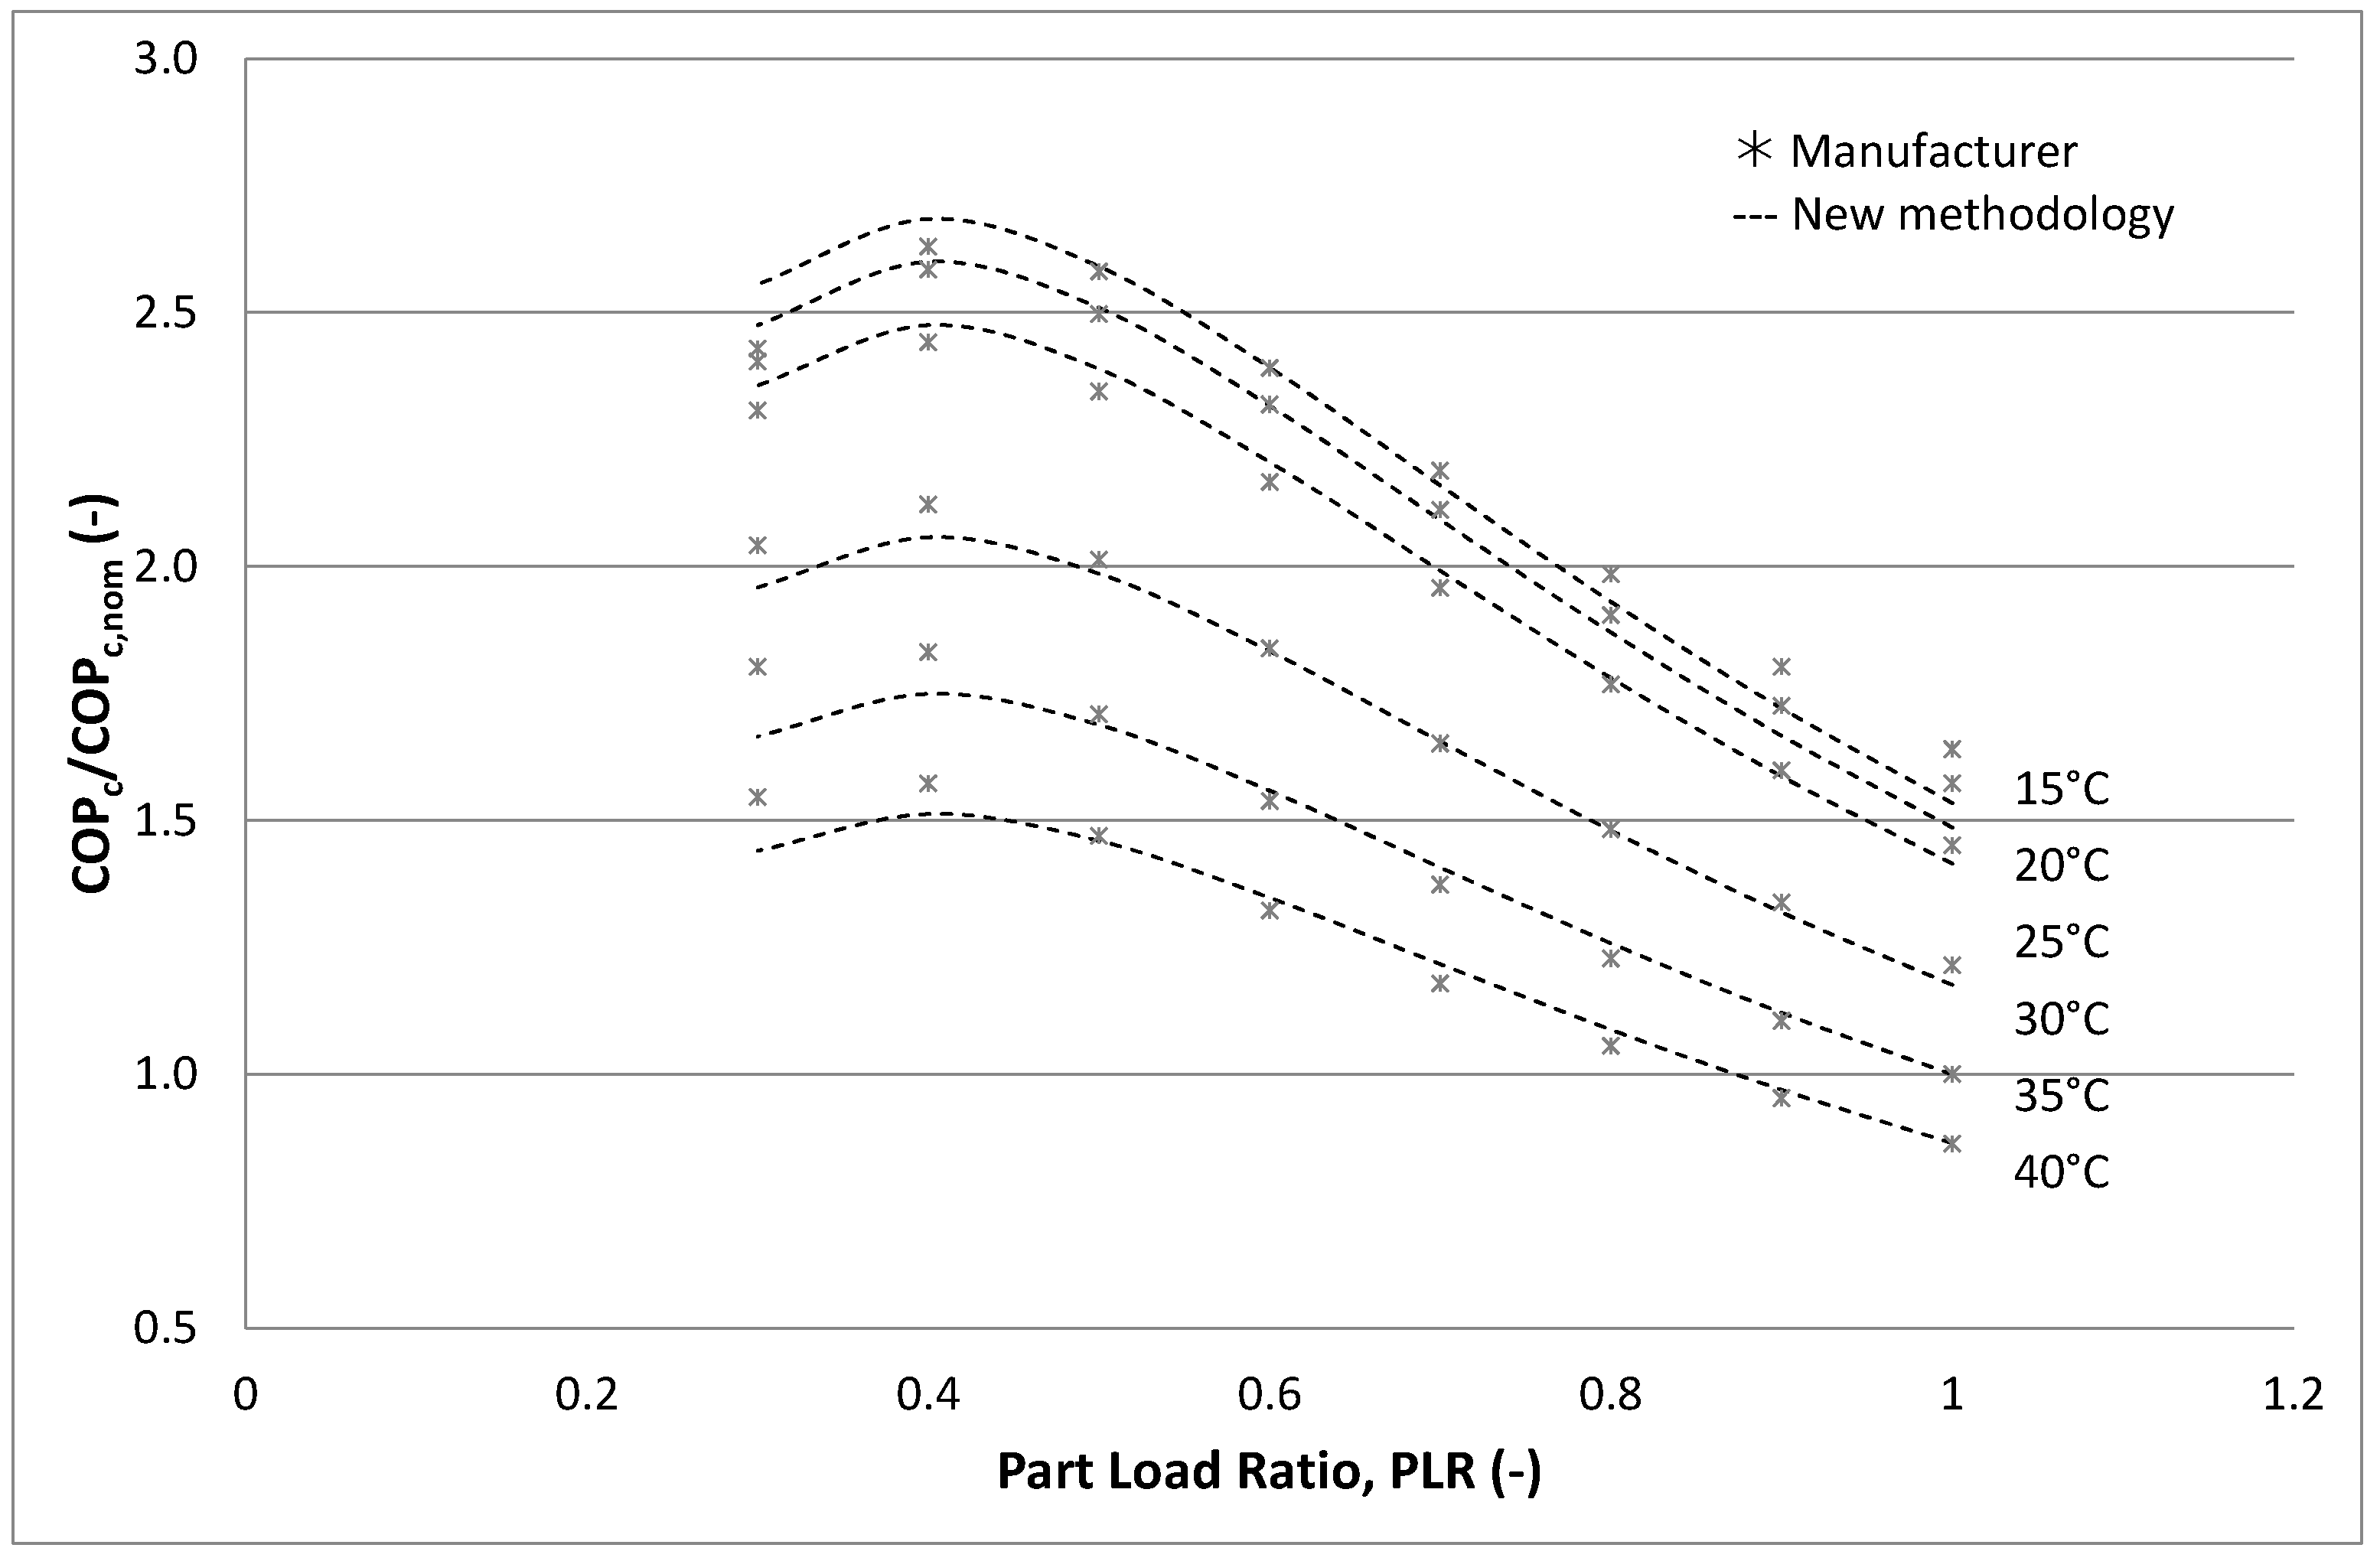
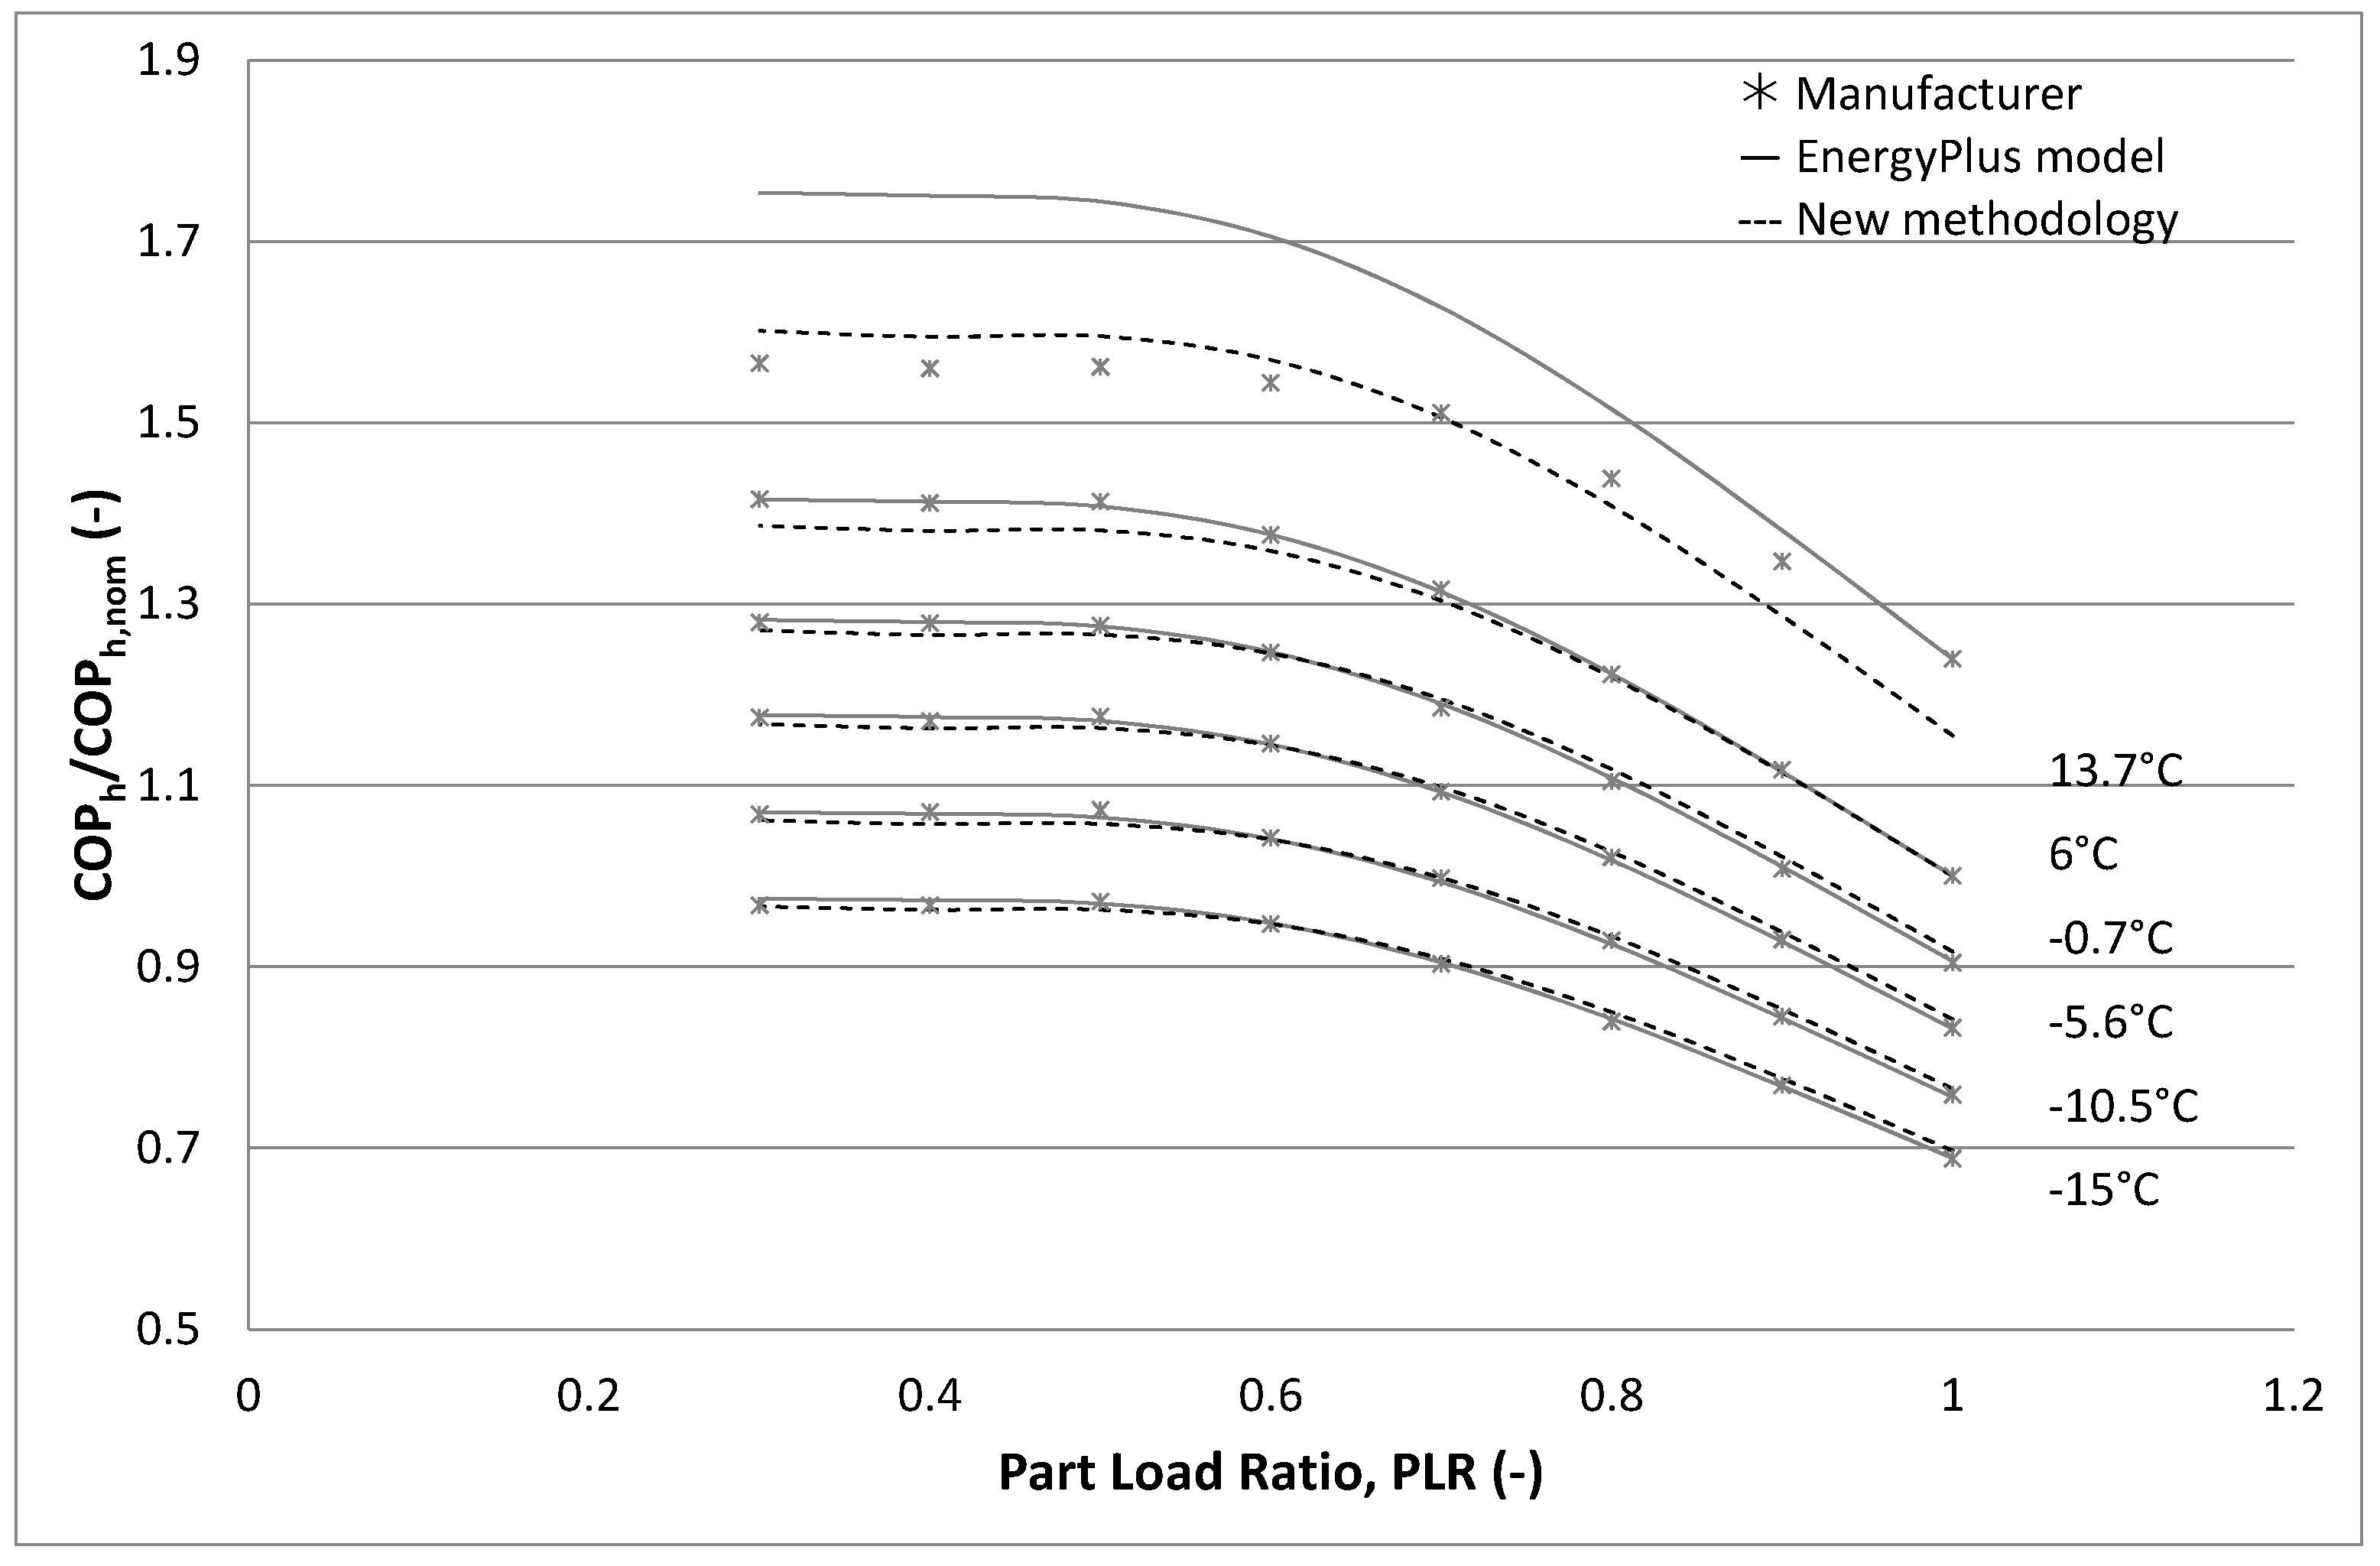
2.2. Model Verification
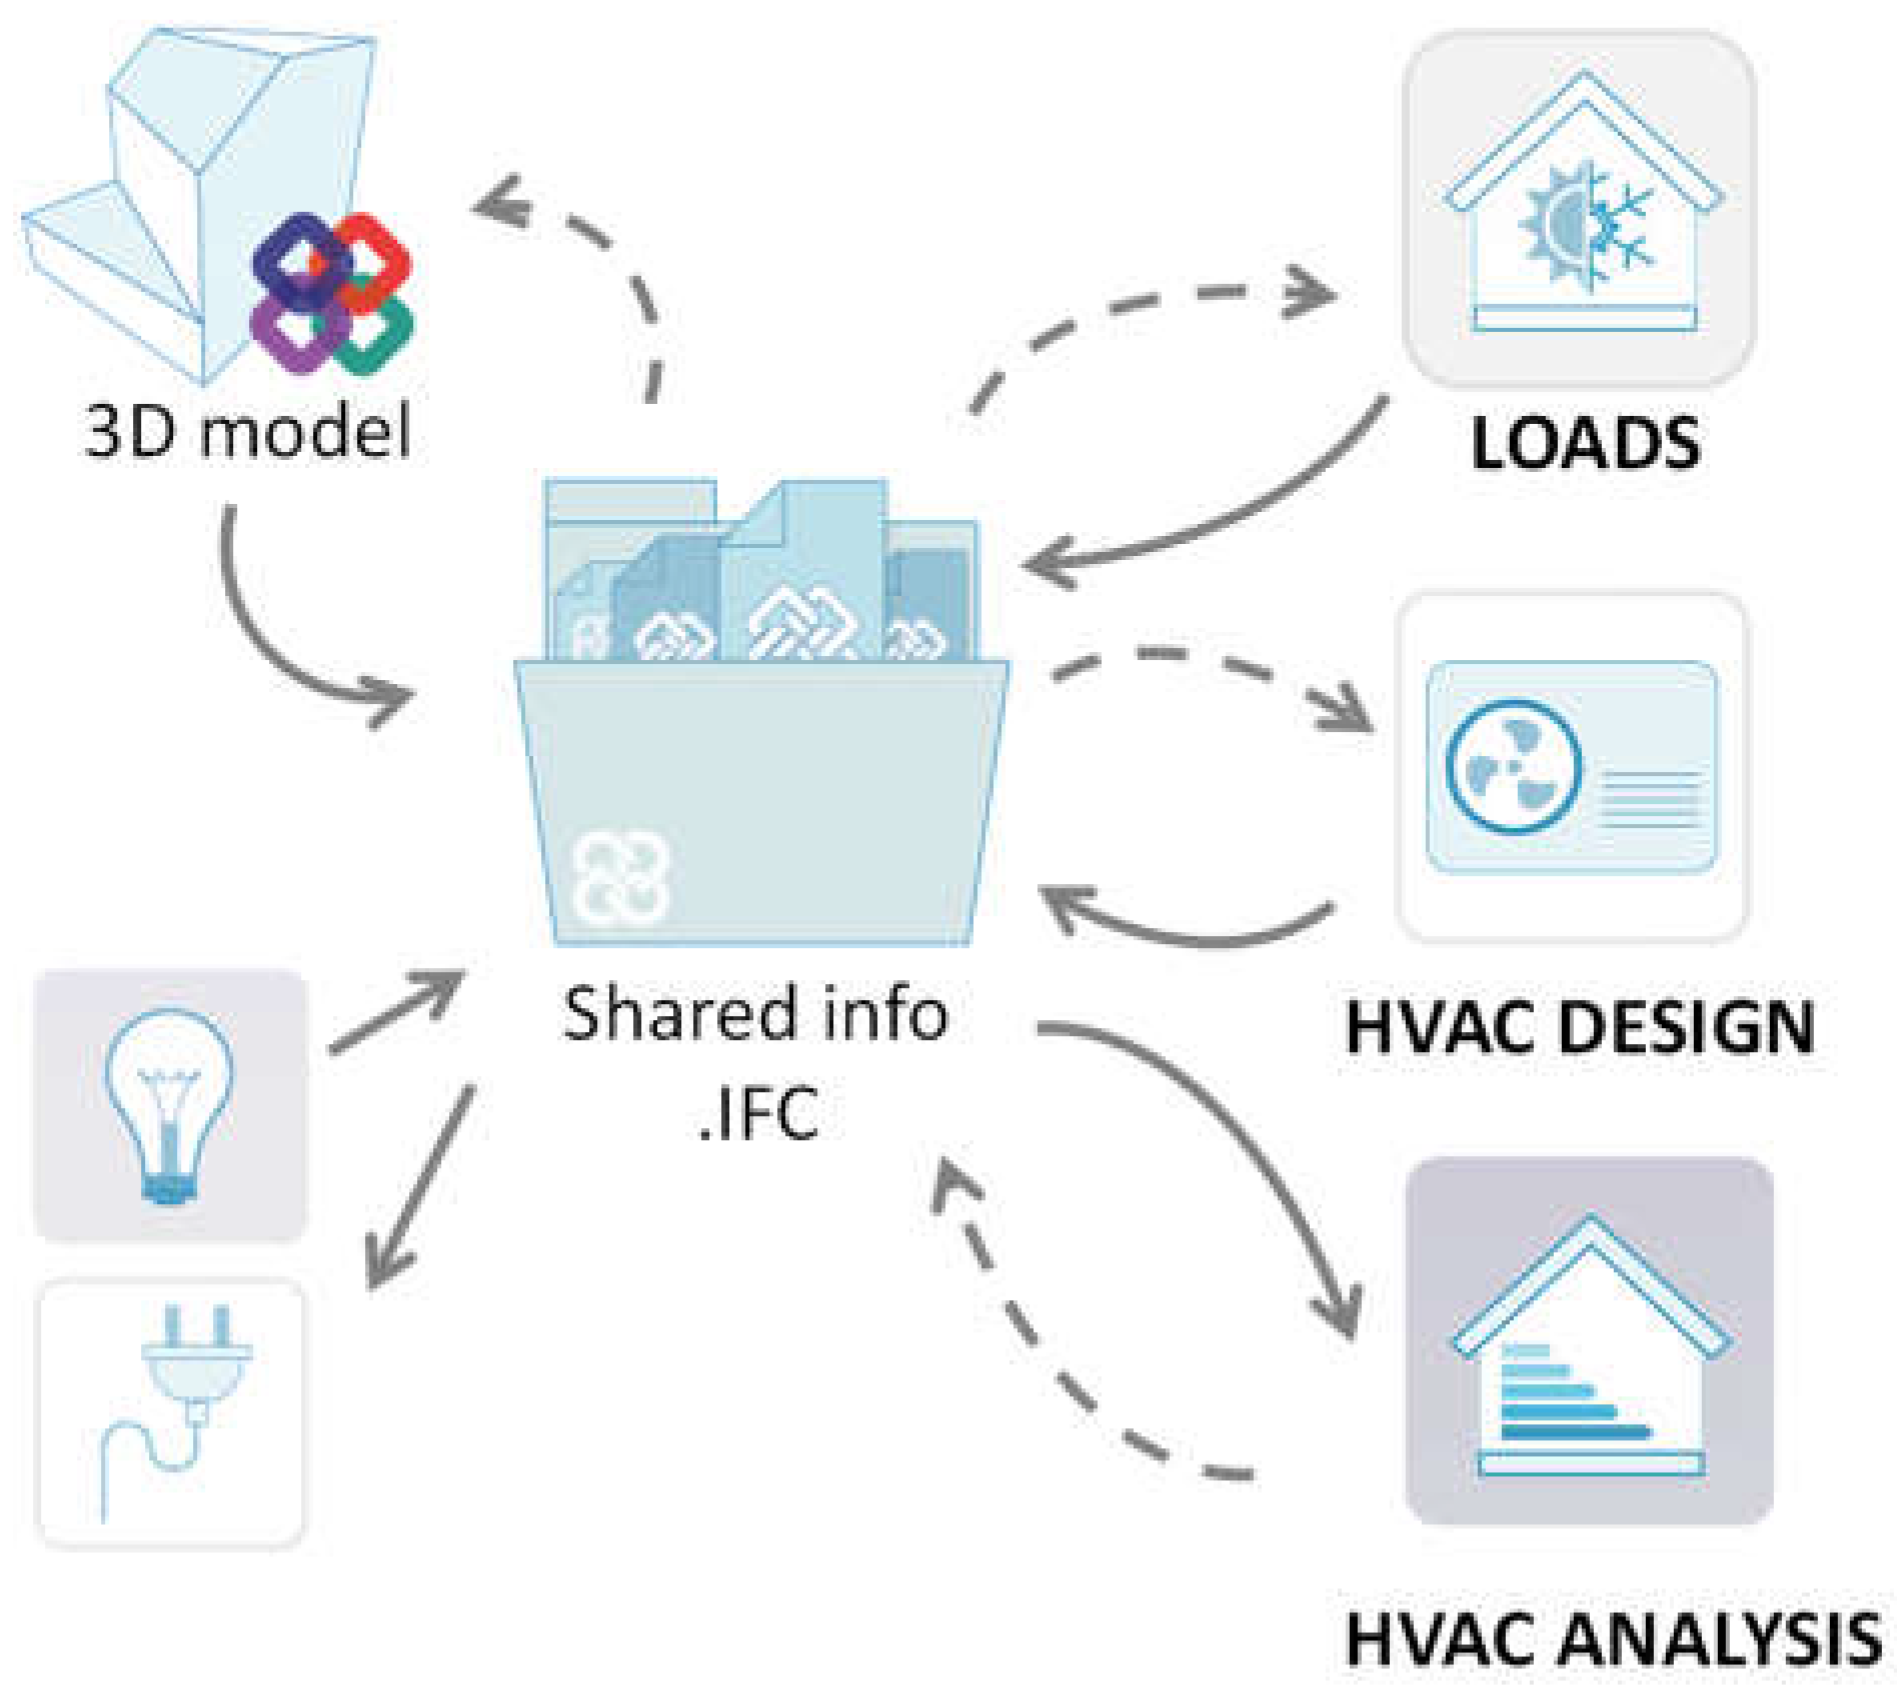
2.3. Open BIM Workflow
2.4. Office Building Study
3. Results and Discussion
4. Conclusions
Author Contributions
Funding
Acknowledgments
Conflicts of Interest
Abbreviations
| Nomenclature | |
| COP | Coefficient Of Performance, ratio (-) |
| CR | Combination ratio of indoor VRF units (-) |
| E | Energy (J) |
| EIR | Energy Input Ratio (1/COP) |
| Power input (W) | |
| PLR | Part load ratio (-) |
| Heat pump capacity (W) | |
| T | Temperature (°C) |
| Abbreviations | |
| BIM | Building Information Modelling |
| DHW | Domestic Hot Water |
| EPBD | Energy Performance of Buildings Directive |
| HVAC | Heating, Ventilating and Air Conditioning |
| NZEB | Nearly Zero-Energy Building |
| RMSE | Root Mean Square Error |
| SBTC | Spanish Building Technical Code |
| Subscripts | |
| avg | Average |
| c | Cooling |
| con | Condenser |
| corr | Correction factor |
| h | Heating |
| HP | Heat pump |
| nom | Nominal |
| nr | non-renewable |
| s | source |
| TU | Terminal units |
| wb | Wet bulb |
References
- E.Y.T.E. (IDAE, Instituto para la diversificación y Ahorro de la Energía); Ministerio de Industria. Consumos del sector residencial en España Resumen de Información Básica; Ministerio de Industria: Madrid, Spain, 2014; pp. 1–16.
- EU. Directive 2010/31/EU of the European Parliament and of the Council of 19 May 2010 on the energy performance of buildings (recast). Off. J. Eur. Union 2010, 13–35. [Google Scholar] [CrossRef]
- Nardi, I.; Lucchi, E.; de Rubeis, T.; Ambrosini, D. Quantification of heat energy losses through the building envelope: A state-of-the-art analysis with critical and comprehensive review on infrared thermography. Build. Environ. 2018, 146, 190–205. [Google Scholar] [CrossRef]
- Afify, R. Designing VRF systems. ASHRAE J. 2008, 50, 52–55. [Google Scholar]
- Pezzutto, S.; De Felice, M.; Fazeli, R.; Kranzl, L.; Zambotti, S. Status Quo of the Air-Conditioning Market in Europe: Assessment of the Building Stock. Energies 2017, 10, 1253. [Google Scholar] [CrossRef]
- EU Commission. Commision Recommendation (EU) 2016/1318 guidelines for the promotion of nZEB. Off. J. Eur. Union 2016, 208, 46–56. [Google Scholar]
- Moran, P.; Goggins, J.; Hajdukiewicz, M. Super-insulate or use renewable technology? Life cycle cost, energy and global warming potential analysis of nearly zero energy buildings (NZEB) in a temperate oceanic climate. Energy Build. 2017, 139, 590–607. [Google Scholar] [CrossRef]
- Sarbu, I.; Sebarchievici, C. Performance Evaluation of Radiator and Radiant Floor Heating Systems for an Office Room Connected to a Ground-Coupled Heat Pump. Energies 2016, 9, 228. [Google Scholar] [CrossRef]
- Lucchi, M.; Lorenzini, M.; Valdiserri, P. Energy performance of a ventilation system for a block of apartments with a ground source heat pump as generation system. J. Phys. Conf. Ser. 2017, 796, 12034. [Google Scholar] [CrossRef]
- Aynur, T.N.; Hwang, Y.; Radermacher, R. Simulation comparison of VAV and VRF air conditioning systems in an existing building for the cooling season. Energy Build. 2009. [Google Scholar] [CrossRef]
- Raustad, R. A variable refrigerant flow heat pump computer model in energyplus. In Proceedings of the ASHRAE Annual Meeting, Dallas, TX, USA, 30 January 2013; pp. 299–308. [Google Scholar]
- US Department of Energy (DOE). EnergyPlusTM version 8.9.0 Documentation: Engineering Reference. 2018. Available online: www.energyplus.net (accessed on 21 December 2018).
- Sharma, C.; Raustad, R. Compare energy use in variable refrigerant flow heat pumps field demostration and compter model. In Proceedings of the ASHRAE Annual Conference, Denver, CO, USA, 22–26 June 2013. [Google Scholar]
- Hong, T.; Sun, K.; Zhang, R.; Hinokuma, R.; Kasahara, S.; Yura, Y. Development and validation of a new variable refrigerant flow system model in EnergyPlus. Energy Build. 2016, 117, 399–411. [Google Scholar] [CrossRef]
- Kim, D.; Cox, S.J.; Cho, H.; Im, P. Evaluation of energy savings potential of variable refrigerant flow (VRF) from variable air volume (VAV) in the U.S. climate locations. Energy Rep. 2017, 3, 85–93. [Google Scholar] [CrossRef]
- Yu, X.; Yan, D.; Sun, K.; Hong, T.; Zhu, D. Comparative study of the cooling energy performance of variable refrigerant flow systems and variable air volume systems in office buildings. Appl. Energy 2016, 183, 725–736. [Google Scholar] [CrossRef]
- Kani-Sanchez, C.; Richman, R. Incorporating variable refrigerant flow (VRF) heat pump systems in whole building energy simulation—Detailed case study using measured data. J. Build. Eng. 2017, 12, 314–324. [Google Scholar] [CrossRef]
- Kim, D.; Cox, S.J.; Cho, H.; Im, P. Model calibration of a variable refrigerant flow system with a dedicated outdoor air system: A case study. Energy Build. 2018, 158, 884–896. [Google Scholar] [CrossRef]
- Candelario-Garrido, A.; García-Sanz-Calcedo, J.; Reyes Rodríguez, A.M. A quantitative analysis on the feasibility of 4D Planning Graphic Systems versus Conventional Systems in building projects. Sustain. Cities Soc. 2017, 35, 378–384. [Google Scholar] [CrossRef]
- Olawumi, T.O.; Chan, D.W.M. Identifying and prioritizing the benefits of integrating BIM and sustainability practices in construction projects: A Delphi survey of international experts. Sustain. Cities Soc. 2018, 40, 16–27. [Google Scholar] [CrossRef]
- European Parliament and the Council of the European Union. Directive 2014/24/EU of the European Parliament and the Council. Off. J. Eur. Union 2014, 2014, 65–242. [Google Scholar] [CrossRef]
- Sattary, S.; Thorpe, D. Potential carbon emission reductions in australian construction systems through bioclimatic principles. Sustain. Cities Soc. 2016, 23, 105–113. [Google Scholar] [CrossRef]
- CYPE Software. BIMserver.center—Workflow demo. 2018. Available online: https://www.youtube.com/watch?v=T5uKMiIBn_c&list=PLbM0_0AnNRm_NyVE0Rfev7aHs3DUww9iz&index=18 (accessed on 21 December 2018).
- CTE. Spanish Building Technical Code, Real Decreto 314/2006 17 Marzo. Agencia Estatal Boletín Oficial del Estado, 2006. Available online: https://www.boe.es/buscar/act.php?id=BOE-A-2006-5515 (accessed on 21 December 2018).
- IDEA. Factores de emisión de co2 y coeficientes de paso a energía primaria de diferentes fuentes de energía final consumidas en el sector de edificios en España. 2014. Available online: https://energia.gob.es/es-es/Paginas/index.aspx (accessed on 21 December 2018).
- Torregrosa-Jaime, B.; González, B.; Martínez, P.J.; Payá-Ballester, G. Analysis of the Operation of an Aerothermal Heat Pump in a Residential Building Using Building Information Modelling. Energies 2018, 6, 1642. [Google Scholar] [CrossRef]


| City | Climatic Zone | U–Ext. Wall | U–Roof | Heating Demand | Cooling Demand | Combined Demand | Limit Demand |
|---|---|---|---|---|---|---|---|
| (W/m2 K) | (W/m2 K) | (kWh/m2·y) | (kWh/m2·y) | (kWh/m2·y) | (kWh/m2·y) | ||
| Barcelona | C2 | 0.57 | 0.32 | 10.8 | 25.9 | 28.9 | 33.4 |
| Madrid | D3 | 0.48 | 0.29 | 20.6 | 34.9 | 45.0 | 55.9 |
| Equipment | Heating (Tout=7 °C db/6 °C wb, Tint=20 °C db) | Cooling (Tout=35 °C, Tint=27 °C db/19 °C wb) | ||
|---|---|---|---|---|
| COPh,nom ratio | COPc,nom ratio | |||
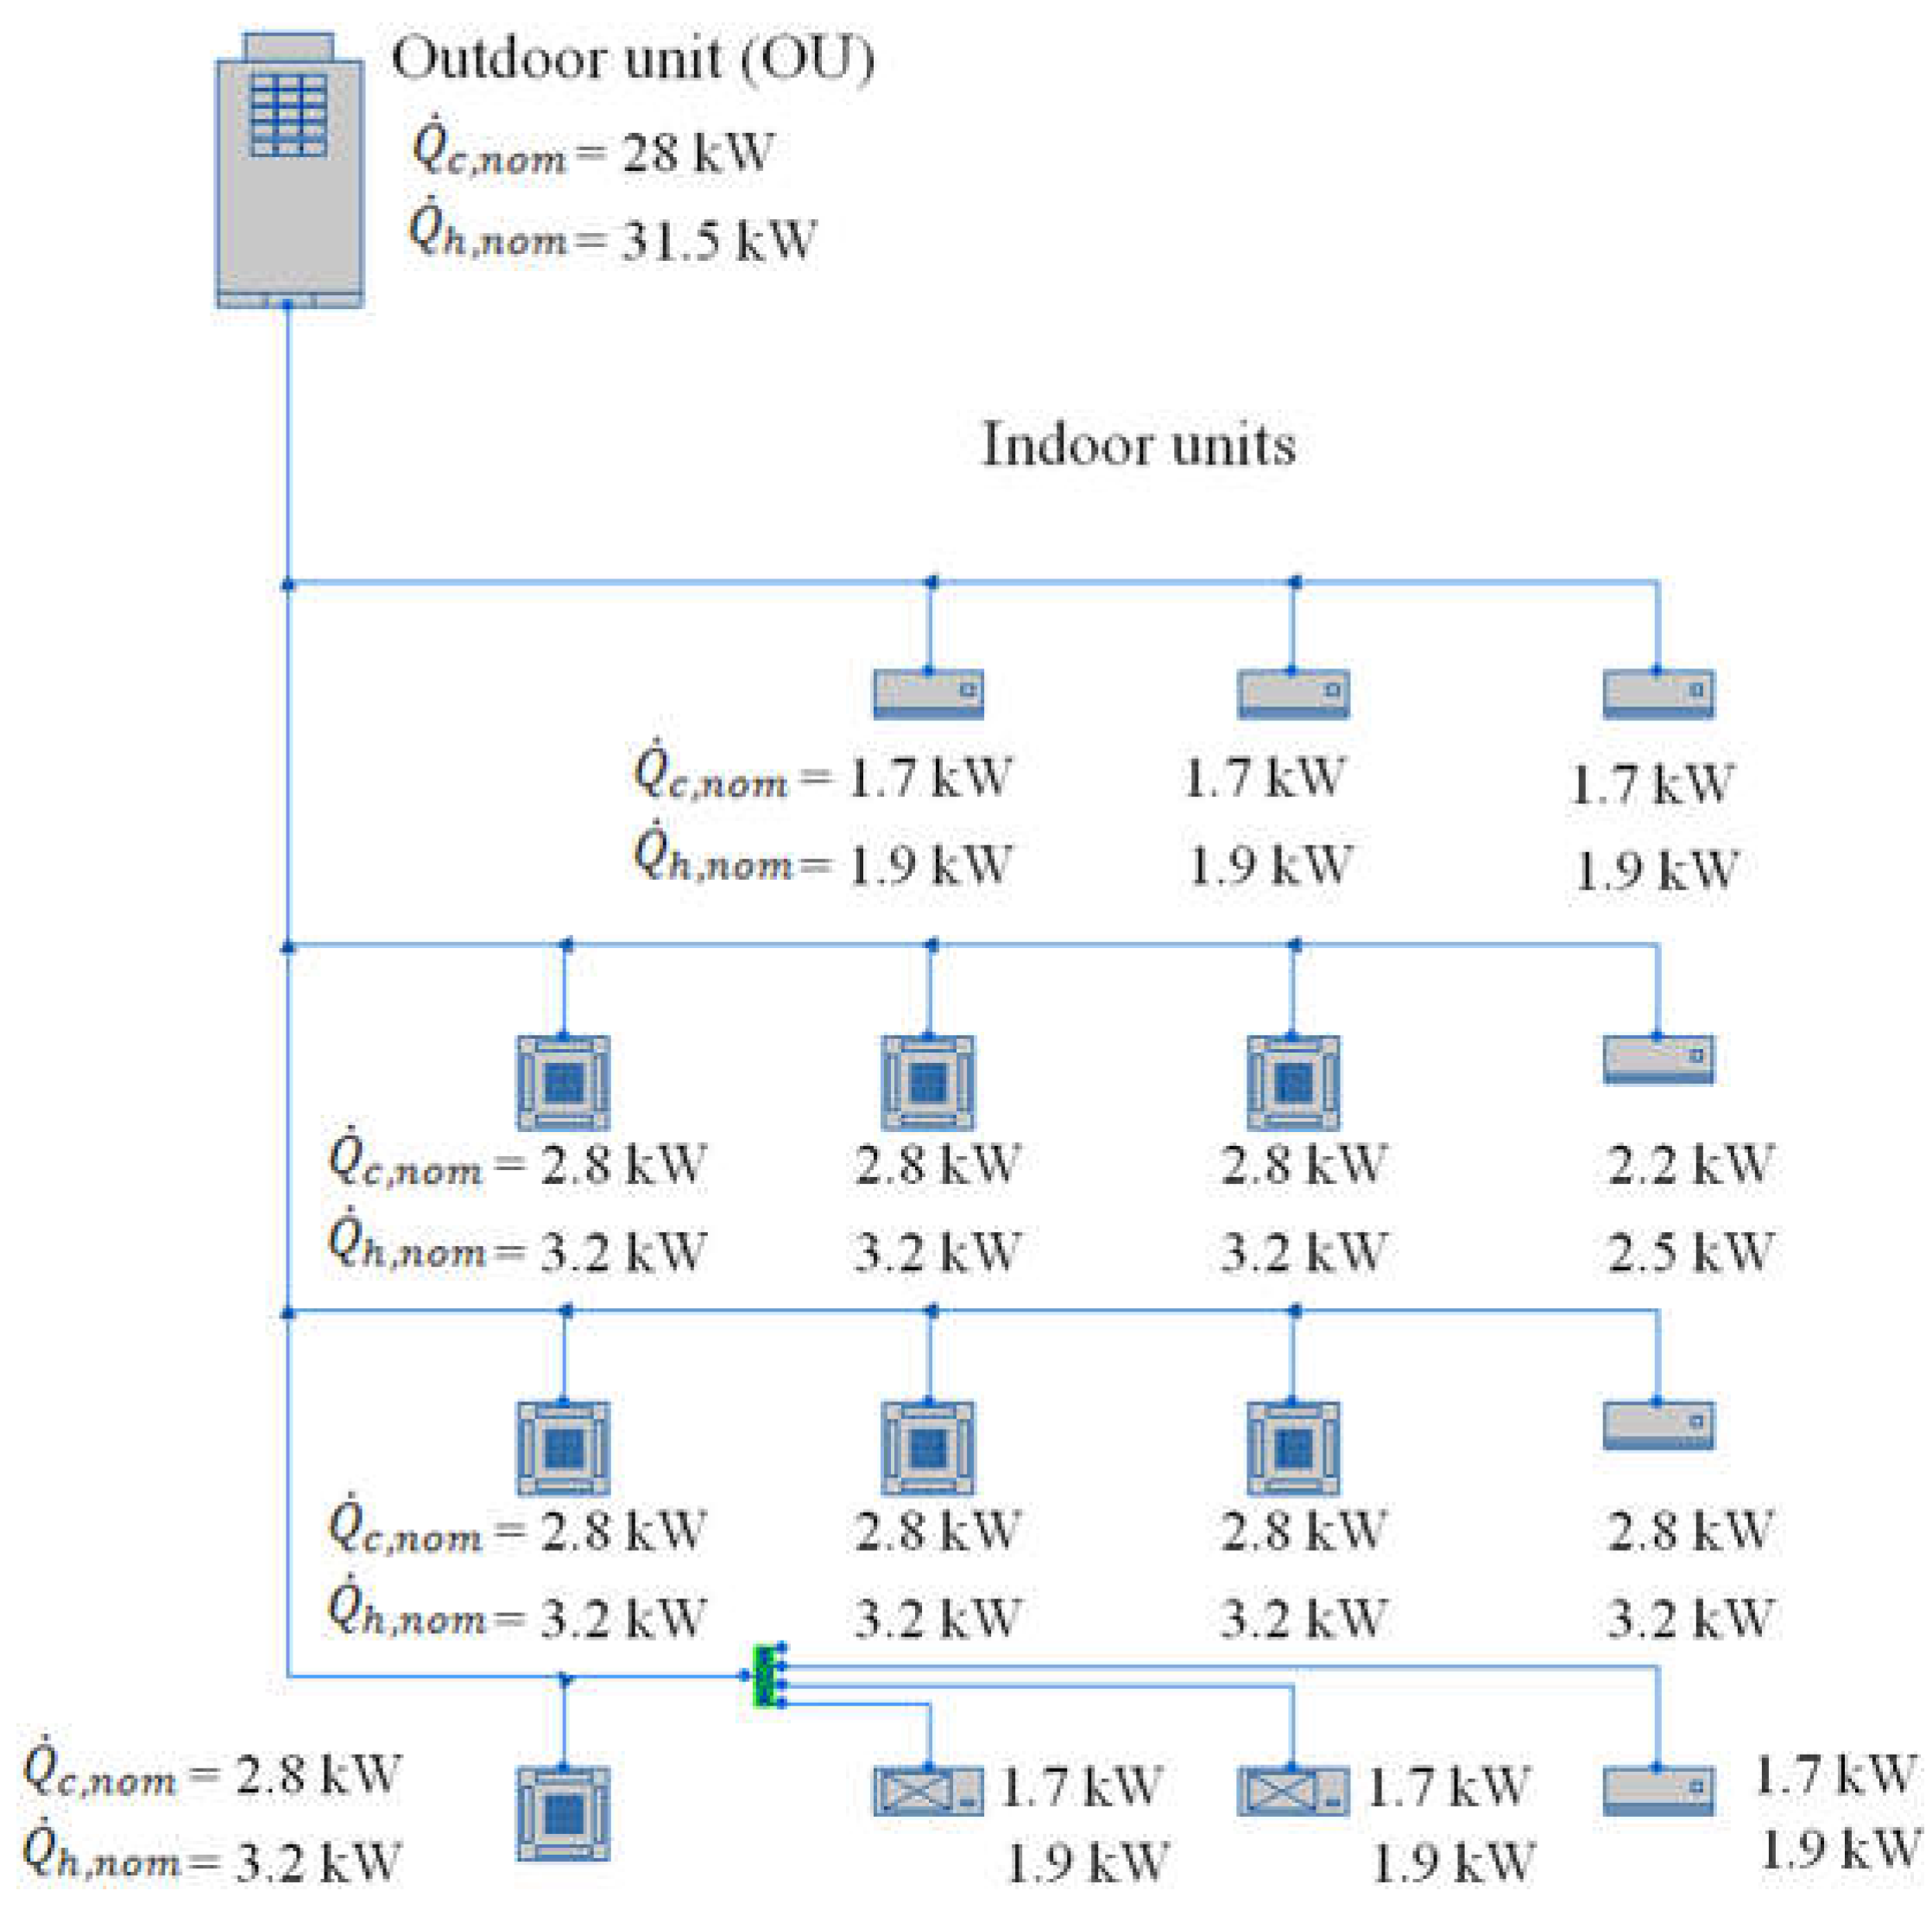
| OU | 31.5 | 4.25 | 28 | 3.64 |
| VRF Electric Consumption (kWh) Madrid | VRF Electric Consumption (kWh) Barcelona | |||||
|---|---|---|---|---|---|---|
| Standard Model | New Model | Difference | Standard Model | New Model | Difference | |
| Cooling | 2263 | 2337 | +3.27% | 1480 | 1582 | +6.91% |
| Heating | 1425 | 1439 | +0.97% | 711 | 722 | +1.59% |
| City | Es,nr (kWh/m2/y) | CO2 Emissions (kg CO2/m2/y) | |||||
|---|---|---|---|---|---|---|---|
| Heating | Cooling | Lighting | Total | Building | Class B | Class | |
| Barcelona | 3.2 | 7.02 | 55.6 | 65.8 | 11.2 | 15.7–25.5 | A |
| Madrid | 6.4 | 10.4 | 55.6 | 72.4 | 12.3 | 19.3–31.4 | A |
© 2018 by the authors. Licensee MDPI, Basel, Switzerland. This article is an open access article distributed under the terms and conditions of the Creative Commons Attribution (CC BY) license (http://creativecommons.org/licenses/by/4.0/).
Share and Cite
Torregrosa-Jaime, B.; Martínez, P.J.; González, B.; Payá-Ballester, G. Modelling of a Variable Refrigerant Flow System in EnergyPlus for Building Energy Simulation in an Open Building Information Modelling Environment. Energies 2019, 12, 22. https://doi.org/10.3390/en12010022
Torregrosa-Jaime B, Martínez PJ, González B, Payá-Ballester G. Modelling of a Variable Refrigerant Flow System in EnergyPlus for Building Energy Simulation in an Open Building Information Modelling Environment. Energies. 2019; 12(1):22. https://doi.org/10.3390/en12010022
Chicago/Turabian StyleTorregrosa-Jaime, Bárbara, Pedro J. Martínez, Benjamín González, and Gaspar Payá-Ballester. 2019. "Modelling of a Variable Refrigerant Flow System in EnergyPlus for Building Energy Simulation in an Open Building Information Modelling Environment" Energies 12, no. 1: 22. https://doi.org/10.3390/en12010022
APA StyleTorregrosa-Jaime, B., Martínez, P. J., González, B., & Payá-Ballester, G. (2019). Modelling of a Variable Refrigerant Flow System in EnergyPlus for Building Energy Simulation in an Open Building Information Modelling Environment. Energies, 12(1), 22. https://doi.org/10.3390/en12010022