Economic Performance of Using Batteries in European Residential Microgrids under the Net-Metering Scheme


Abstract
1. Introduction
1.1. Literature Review
- Research agrees that batteries in PV-powered grid-connected residential MGs have many advantages but under the net-metering scheme they can only be made profitable through support; however no investigation or simulation of a specific support measure could be found.
- Academic literature confirms that, from a technological point of view, DNOs can be potentially interested in an uptake of residential MGs;
- As a method of evaluation, the techno-economic assessment (TEA) with tools such as the HOMER software is commonly used for studies similar to ours.
1.2. Residential, PV+Battery MGs
1.3. Residential Microgrids versus DNOs
1.4. Economic Assessment of Microgrids
2. Method
- A residential load sized to 8 households
- A PV unit sized to cover ca. 70% of the yearly consumption
- A connection to the main grid under the net-metering scheme
- A storage unit sized to cover ca. 19% of the yearly consumption
2.1. TEA of the System
- Grid-only, which corresponds to our baseline scenario ()
- Grid+PV, which means covering the load with a PV unit backed by the main grid under the net-metering scheme ()
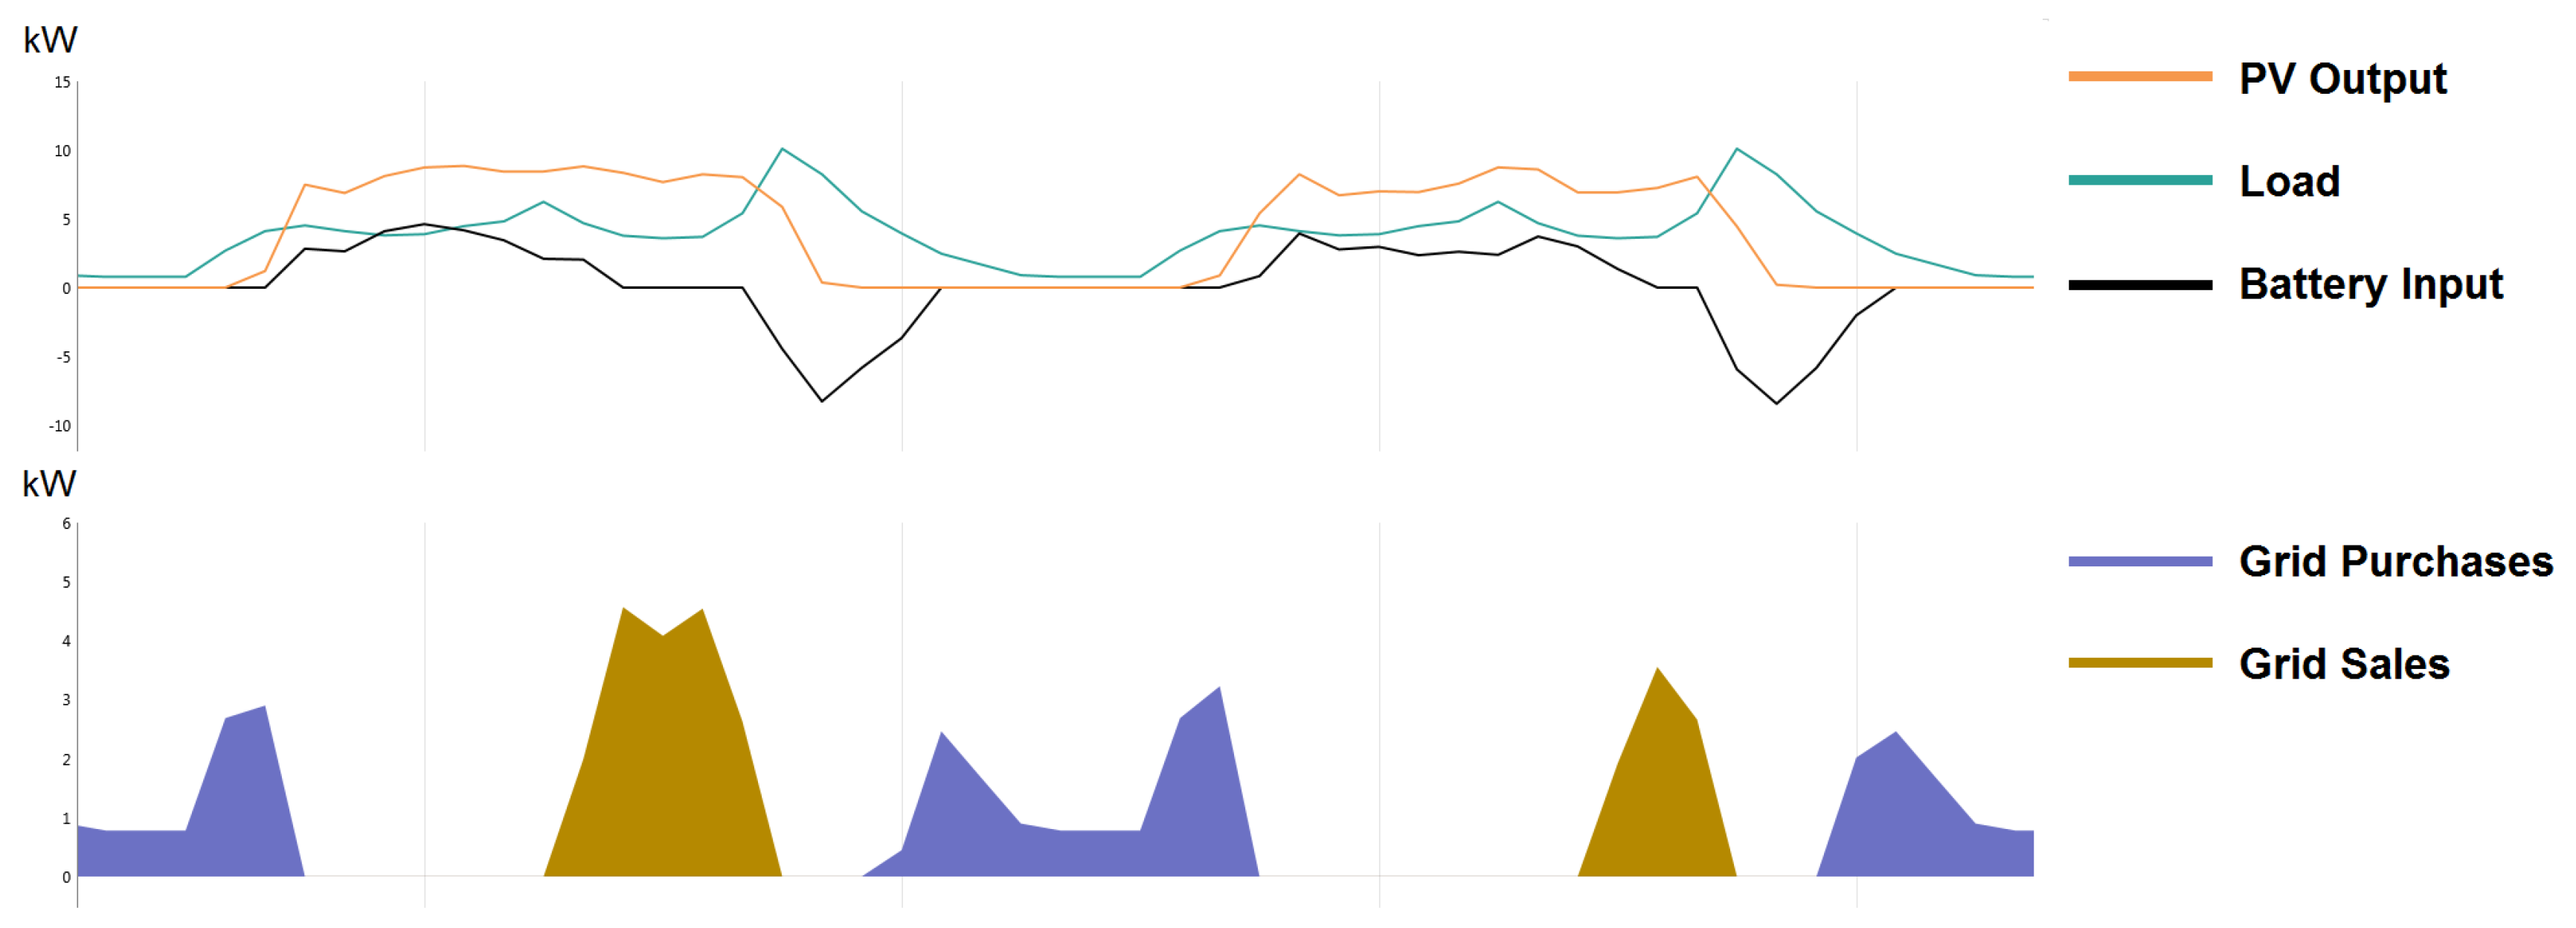
- Grid +Battery+PV, in which the load is served by a PV unit backed primarily by storage and secondarily by the main grid under the net-metering scheme ()
- Grid+Battery, which is regarded as an impractical solution and therefore discarded.
2.2. Case Studies
- Geographically determined economic and environmental parameters, which depend on each country and are assumed to be fixed (sun radiation intensity, inflation rate, electricity price);
- Technical parameters of the examined systems, referring to technical capacity and performance levels of equipment pieces, as well as the relationships and proportions between them. These have been provided by the host facilities (if necessary an equivalent has been recalculated to match equipment pieces provided by the software database) and further resized to fit the 8-household objective;
- Economic parameters including equipment prices and O&M costs. Acquisition prices have been partly collected from online retail sources, partly provided by the host facilities.
2.2.1. Geographically Determined Economic and Environmental Parameters
- latitude and longitude (software database)
- GHI radiation (software database)
- temperature resource (software database)
- load profiles (software database combined with experimental data)
- PV generation profiles (software database combined with experimental data, for details see Appendix A)
2.2.2. Technical Parameters
2.2.3. Economic Parameters
2.3. Scenario Analyses
- Investor: can be the consumer (i.e., the households, in which case it is the “prosumer”) or another private investor willing to set up a grid-connected MG (PV+Battery) for the 8 households. The decision of the investor is 0 or 1, whether to invest or not, and it is based on whether the investment brings savings compared to the baseline scenario ().
- Supporter: can be the policy maker and/or the DNO or any other stakeholder interested in the advantages of decentralizing the electricity production (see the introduction). The Supporter is willing to cover partly or fully the cost of including a storage system over the 25 years of project lifetime, but not willing to facilitate savings (profit) for the Investor ().
3. Results
3.1. Results from Case Studies
3.1.1. Scenario 1: Battery and Replacements for Free
3.1.2. Scenario 2: Storage Costs Shared
4. Conclusions
Author Contributions
Funding
Acknowledgments
Conflicts of Interest
Abbreviations
| CRES | Centre for Renewable Energy and Saving |
| DER | Decentralized Energy Resources |
| DG | Distributed Generation |
| DNO | District Network Operator |
| DTU | Danish Technical University |
| FiT | Feed-in Tariff |
| H2020 | EU Horizon 2020 Programme |
| IRR | Internal Rate of Return |
| LV | Low Voltage |
| MG | Microgrid |
| MV | Medium Voltage |
| NPC | Net Present Cost |
| NPV | Net Present Value |
| PV | Photovoltaic |
| RES | Renewable Energy Sources |
| RSE | Ricerca sul Sistema Energetico |
| TEA | Techno-economic assessment |
| VTT | Finnish Technical Research Centre |
Appendix A. System Description

| GR | IT | DK | FI | |
|---|---|---|---|---|
| System Consumption (kWh/year) | 10,715 | 96,678 | 16,060 | 4105 |
| PV Production (kWh/year) | 8320 | 58,187 | 10,306 | 2764 |
| PV Capacity (kWp) | 3.36 | 30.34 | 10 | 3.03 |
| Fraction Production:Consumption | 77.65% | 60.19% | 64.17% | 67.34% |
| GR | IT | DK | FI | |
|---|---|---|---|---|
| Avg Household cons [56] (kWh/year) | 3758 | 2432 | 3878 | 8041 |
| Resized to 8 households (kWh/year) | 30,064 | 19,456 | 31,024 | 64,328 |
| Production resized (kWh/year) | 23,344.14 | 11,709.86 | 19,908.68 | 43,315.56 |
| Capacity factor | 28.27% | 21.90% | 11.80% | 10.40% |
| Rated capacity for new PV (kW) | 9.43 | 6.10 | 9.26 | 47.55 |
| Renewable fraction without battery | 60.10% | 49.50% | 48.80% | 49.20% |
| GR | IT | DK | FI | |
|---|---|---|---|---|
| Total load with 8 HHs (kWh/year) | 30,064 | 19,456 | 31,024 | 64,328 |
| PV Production (kWh/year) | 23,344 | 11,710 | 19,909 | 43,316 |
| Battery type | sonnenbatterie 4–6 kWh eco | LGchemRESU10 [9.8 kWh] | CAT TimeShift 6.74 | Samsung M8194 M2 [7.6 kWh] |
| Battery Discharge power (kW) | 4.00 | 5.00 | 6.52 | 7.60 |
| Battery nominal capacity (kWh/cell) | 6.00 | 9.80 | 6.74 | 7.60 |
| Nr of cells/strings | 5 | 3 | 6 | 12 |
| Usable nominal storage capacity per charge at given SoC (kWh) | 24 | 24.4 | 32.4 | 73 |
| Roundtrip efficiency | 86% | 95% | 95% | 90% |
| Energy In (kWh/year) | 6761 | 3850 | 6576 | 13,567 |
| Energy Out (kWh/year) | 5837 | 3678 | 6251 | 12,279 |
| Nr of cycles/year | 282 | 158 | 203 | 186 |
| Converter to match peak load (kW) | 10 | 11 | 17 | 36 |
| Fraction Battery intake: PV production | 29% | 33% | 33% | 31% |
| Fraction Battery Output: Consumption | 19.42% | 18.90% | 20.15% | 19.09% |
| Renewable fraction with battery | 68.70% | 56.90% | 55.90% | 55.10% |
| Increase in renewable fraction compared to Table A2 | 14.31% | 14.95% | 14.55% | 11.99% |
Appendix B. Overview of System Input Indicators
| Indicator | Source | Notes |
|---|---|---|
| Discount rate | 3P | [53] |
| Inflation Rate | 3P | www.tradingeconomics.com |
| Annual capacity shortage | 0 (zero) | No shortage acceptable |
| Project lifetime | 25 years | standard |
| PV capacity | EX | ---- |
| PV capital cost | EX | adjusted with online retail resources, excl. VAT |
| PV Replacement cost | AS | Assume zero residual value after the lifetime of a PV unit |
| PV O&M cost per kW capacity | EX | As provided by experts at the host facilities |
| PV derating factor | HB | ---- |
| PV electrical bus (AC/DC) | AS | Assumed AC in all systems, converter included with the PV unit |
| PV Capacity optimization | AS | none |
| Consider temperature effects? | AS | Yes, in order to caption major geographical differences |
| Temperature effect on power | HB | ---- |
| Ground reflectance | HB | ---- |
| Tracking system | EX | No |
| Nominal operating cell temp | HB | ---- |
| Efficiency at standard testing conditions | HB | ---- |
| GHI Input | HB, EX | database standard solar resource scaled to match experimental data |
| GHI Scaled annual average | HB, EX | As calculated |
| Load Peak Month | AS | January or August, depending on geography |
| Load Profile | HB, EX | database standard load resource scaled to match experimental data |
| Load Random Variability | HB | statstical variance |
| Load Day-to-day | HB | ----- |
| Load timestep | EX | 1 h |
| Load type | AS | residential, as per research scope |
| Load peak month profile | HB, EX | database standard load resource scaled to match experimental data |
| Load Average energy baseline | EX | ---- |
| Load Average energy scaled | EX | ---- |
| Load Average power baseline | EX | ---- |
| Load Average power scaled | EX | ---- |
| Load Peak baseline | EX | ---- |
| Load Peak scaled | HB, EX | ---- |
| Load factor baseline | HB, EX | ---- |
| Load factor scaled | HB, EX | as calculated |
| Load Scaled annual average | HB, EX | as calculated |
| Load Efficiency advanced | AS | not regarded |
| Storage type | AS | Li-Ion, state of the art technology on level 2018 |
| Storage Nominal Voltage | HB, EX | As follows from the equipment type selected |
| Storage Nominal Capacity | HB, EX | As follows from the equipment type selected |
| Storage Quantity (nr of cells) | HB, AS | As calculated in order to cover power and energy demand |
| Storage roundtrip efficiency | HB | corresponds to the specs of the equipment selected |
| Storage Capital cost | 3P | Based on the equipment type selected |
| Storage Replacement | AS | Assumed zero residual value after the lifetime of a battery |
| Storage O&M | AS | assumed zero, in order to leave only one cost driver for the total investment cost of the storage system |
| Storage Throughput | EX | automatically calculated |
| Storage String size Storage Quantity (nr of cells) | HB, EX | As calculated in order to obtain power and energy demand |
| Storage Initial state of charge | AS | zero %, otherwise more energy in the system than produced or purchased |
| Storage Minimum state of charge | AS | 20%, a real-life reasonable average for the lifetime of the battery |
| Storage Minimum storage life | AS | 8 years for batteries used very intensively, that should be replaced twice over the 25 years |
| Converter Type | HB, EX | Calculated as necessary |
| Converter Capacity | HB, EX | As calculated to cover the demand |
| Converter Capital | AS | 1 € assumed, in order to leave only one cost driver for the total investment cost of the storage system |
| Converter Replacement cost | AS | Zero assumed, in order to leave only one cost driver for the total investment cost of the storage system |
| Converter O&M | AS | Zero assumed, in order to leave only one cost driver for the total investment cost of the storage system |
| Converter Capacity optimization | AS | None |
| Converter Lifetime | AS | 25 years assumed |
| Converter Efficiency | HB | 95% |
| Converter Parallel with AC generator? | HB | yes, required |
| Converter Rectifier Input | HB | ----- |
| Converter Relative capacity | HB | ----- |
| Converter Efficiency | HB | ----- |
| Grid electricity price | EX | ---- |
| Grid pricing sysyem | AS | Net Metering, as per research scope |
| Grid Controller | HB | ---- |
| Grid Emissions | HB | ---- |
| CO2 | HB | ---- |
| CO | HB | ---- |
| Unburned Hydrocarbons | HB | ---- |
| Particulate Matter | HB | ---- |
| SO2 | HB | ---- |
| NOx | HB | ---- |
| Controller Homer Cycle Charge | HB | ---- |
| Controller Capital | AS | Assumed zero, to leave just the battery to be the cost carrier |
| Controller Replacement | AS | zero |
| Controller O&M | AS | zero |
| Controller Lifetime | AS | 25 years |
| Apply Setpoint state of charge | HB | ---- |
| Allow diesel-off generation | ----- | not the case |
| Allow generators to operate simultaneously | ----- | not the case |
| Allow systems with generator capacity less than peak load | ----- | not the case |
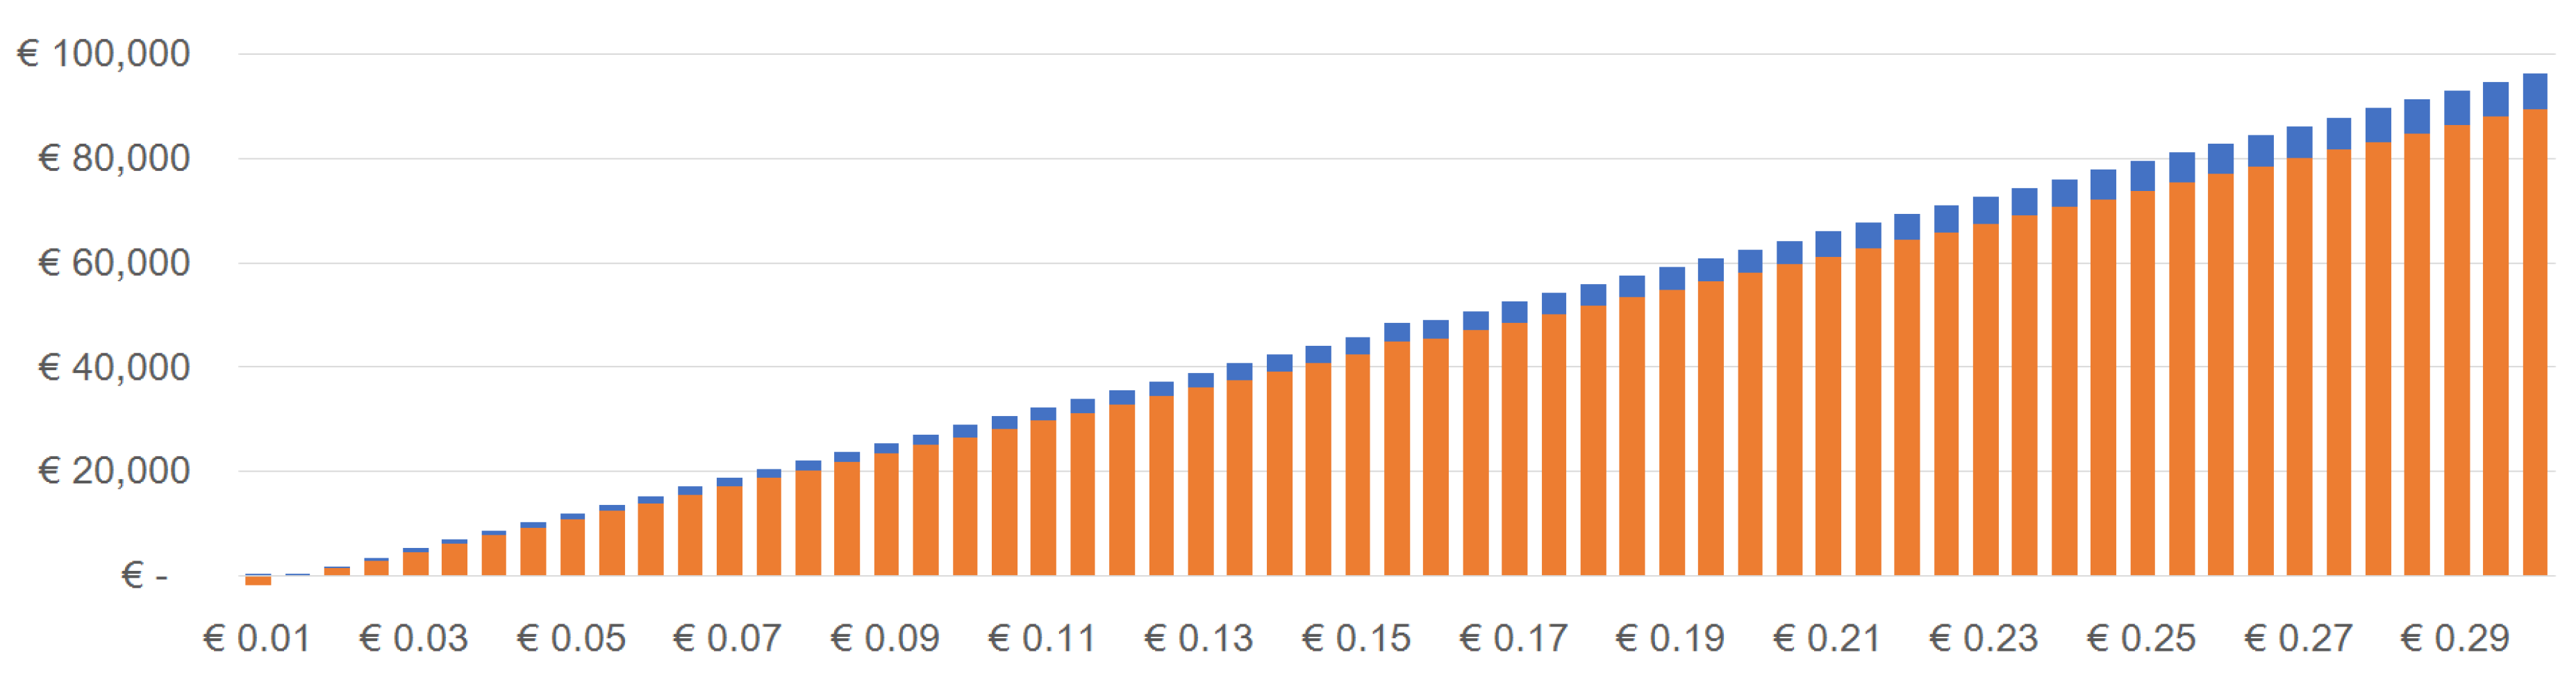
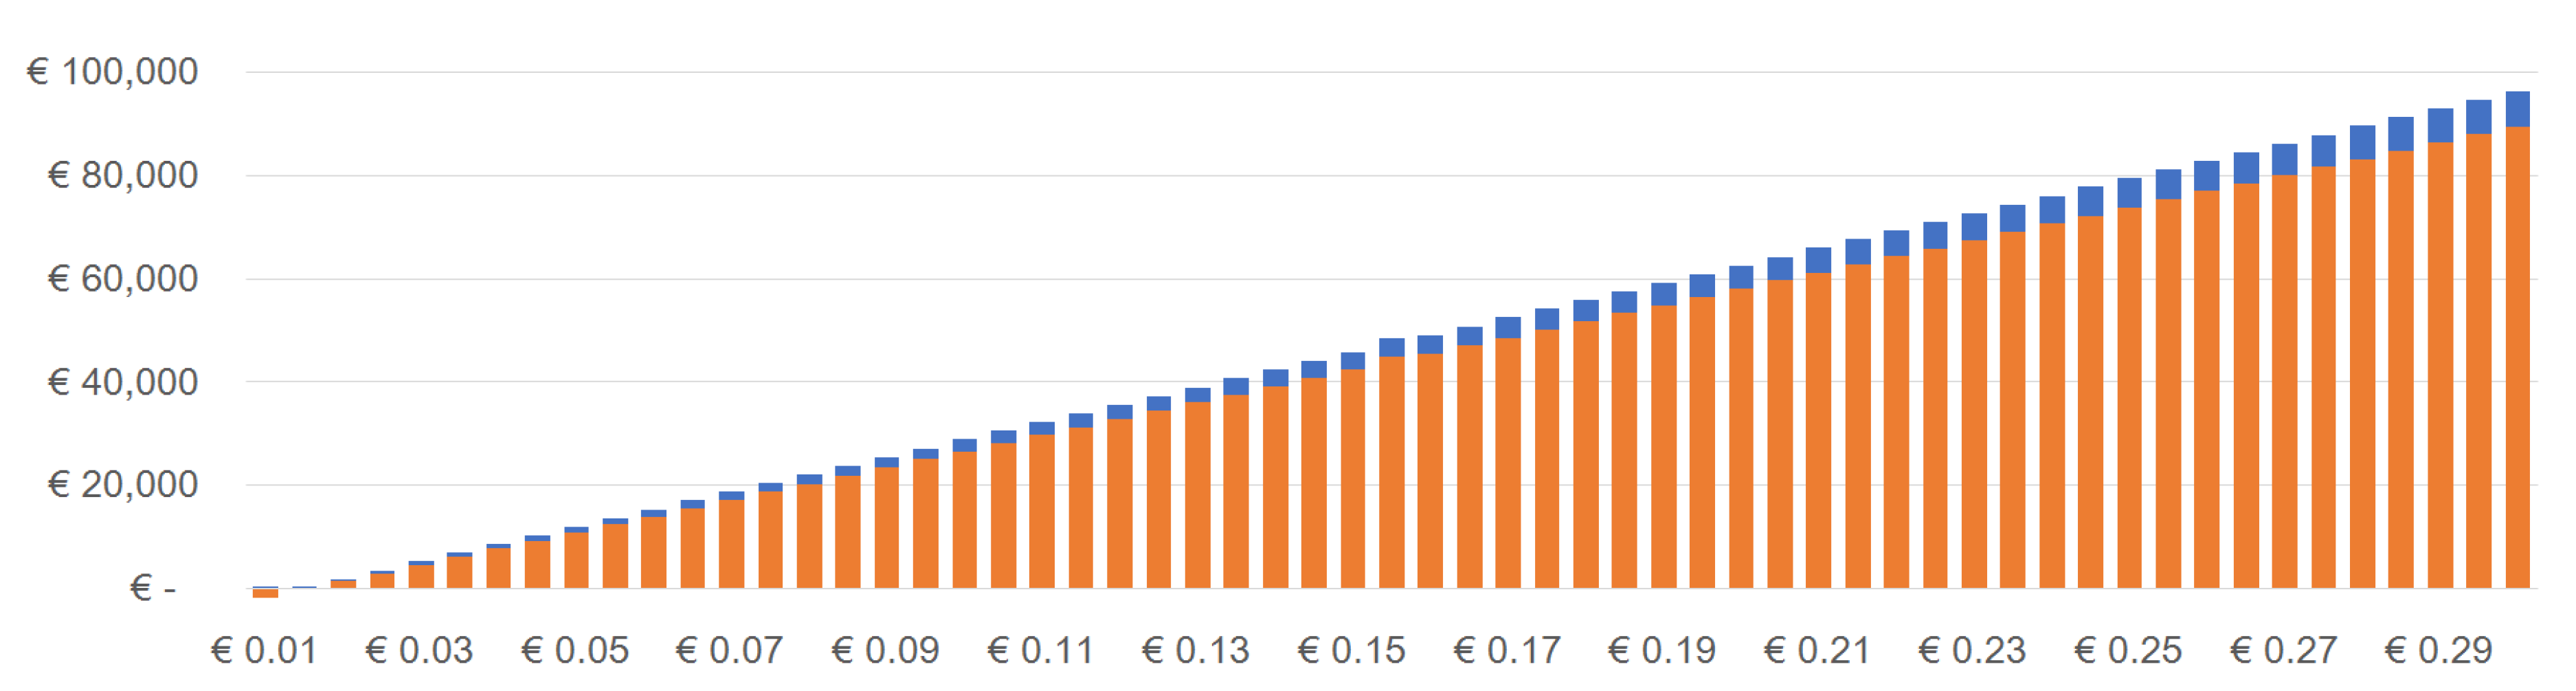
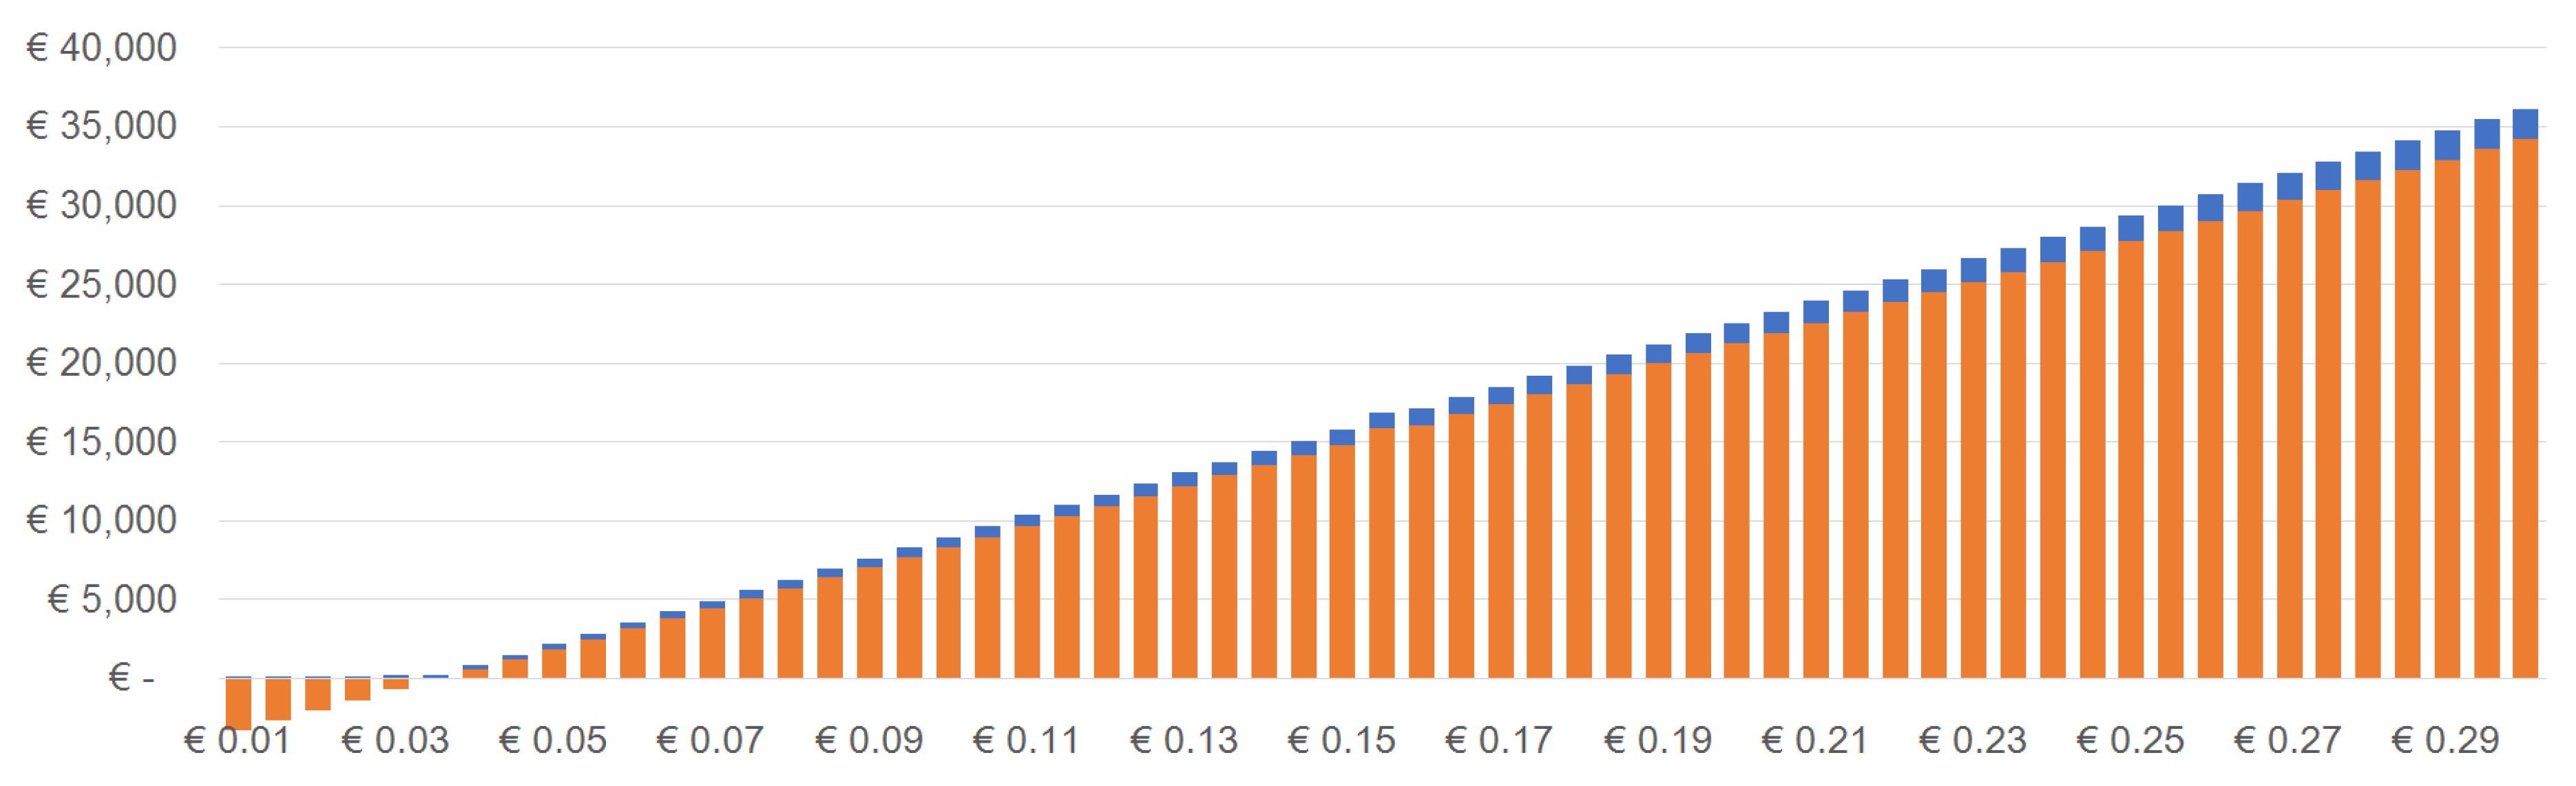
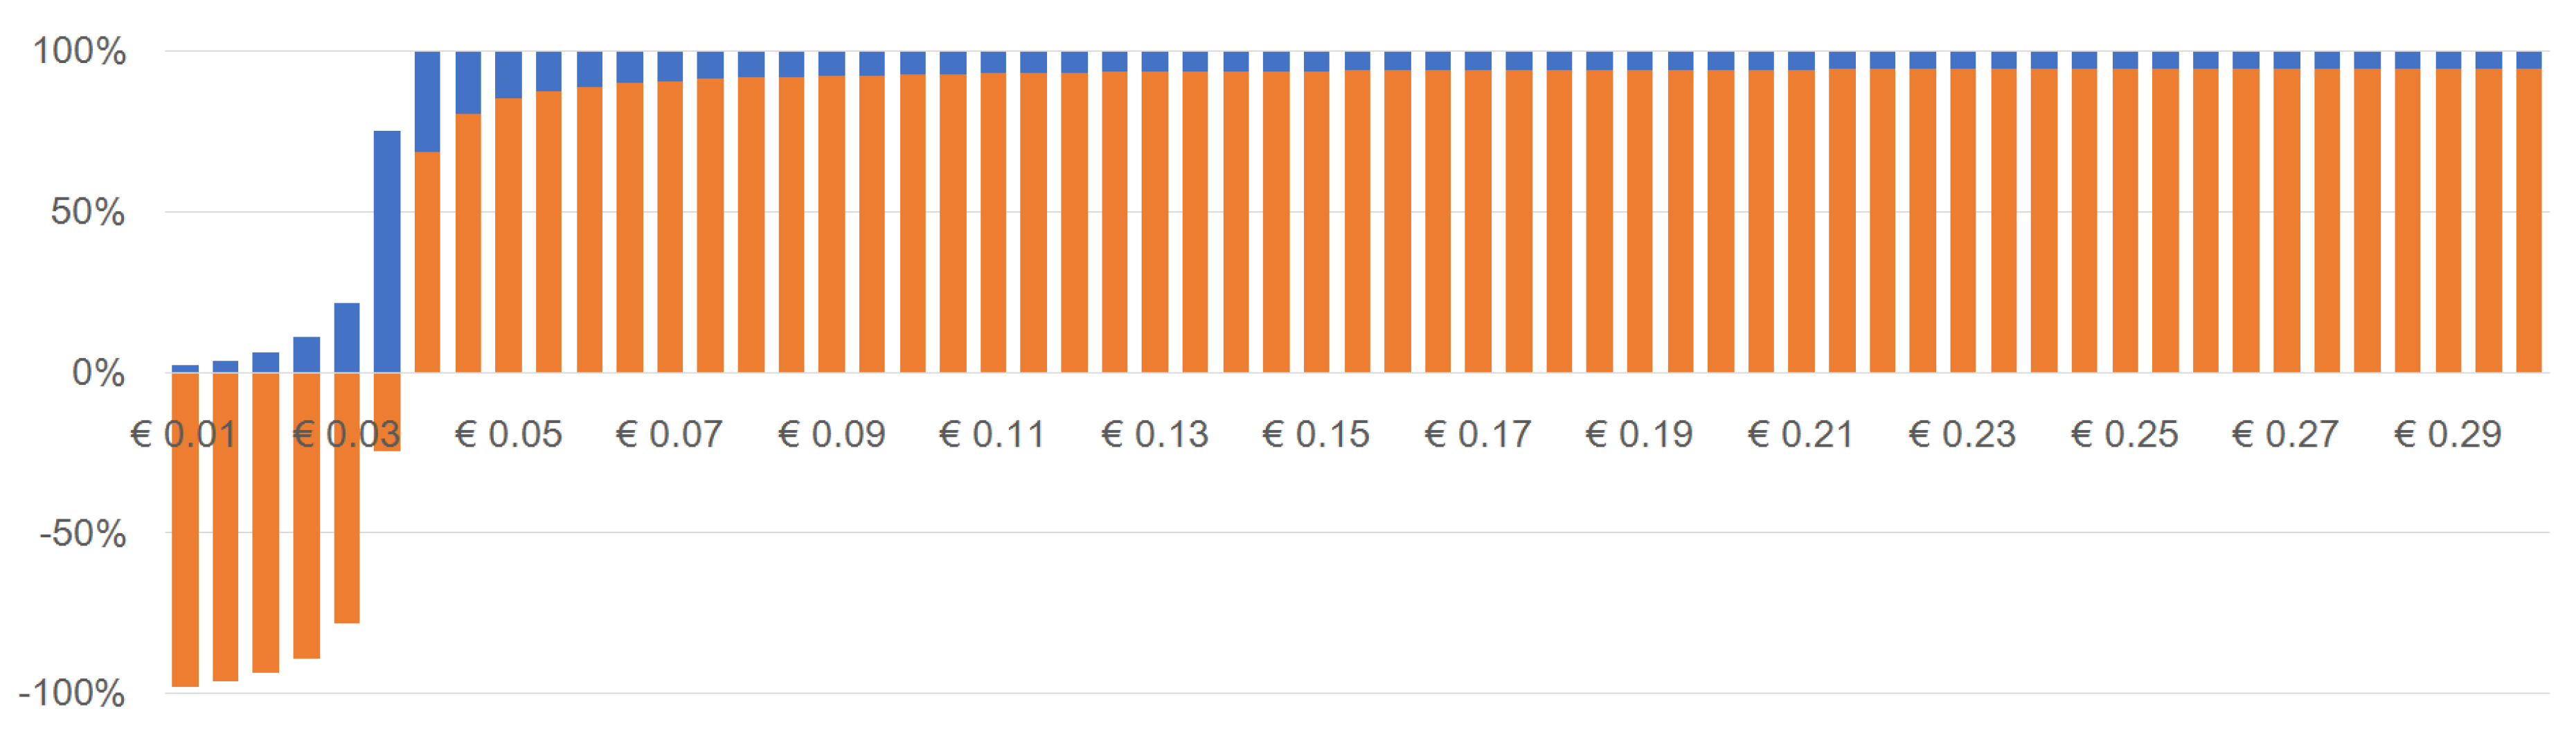
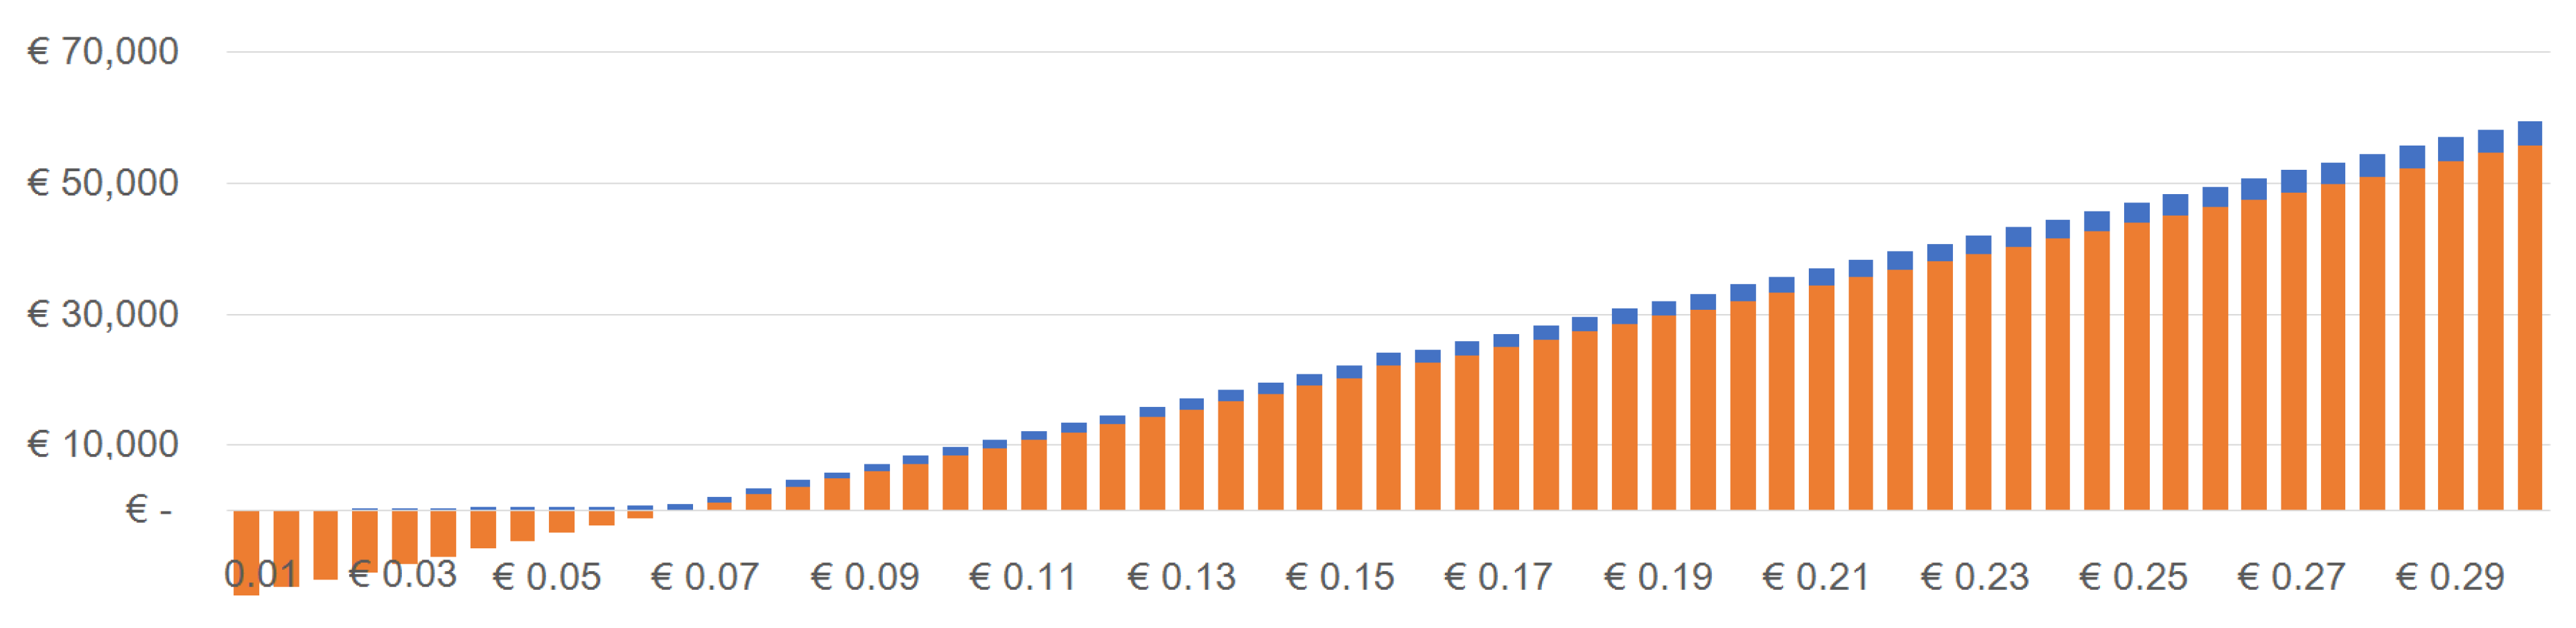
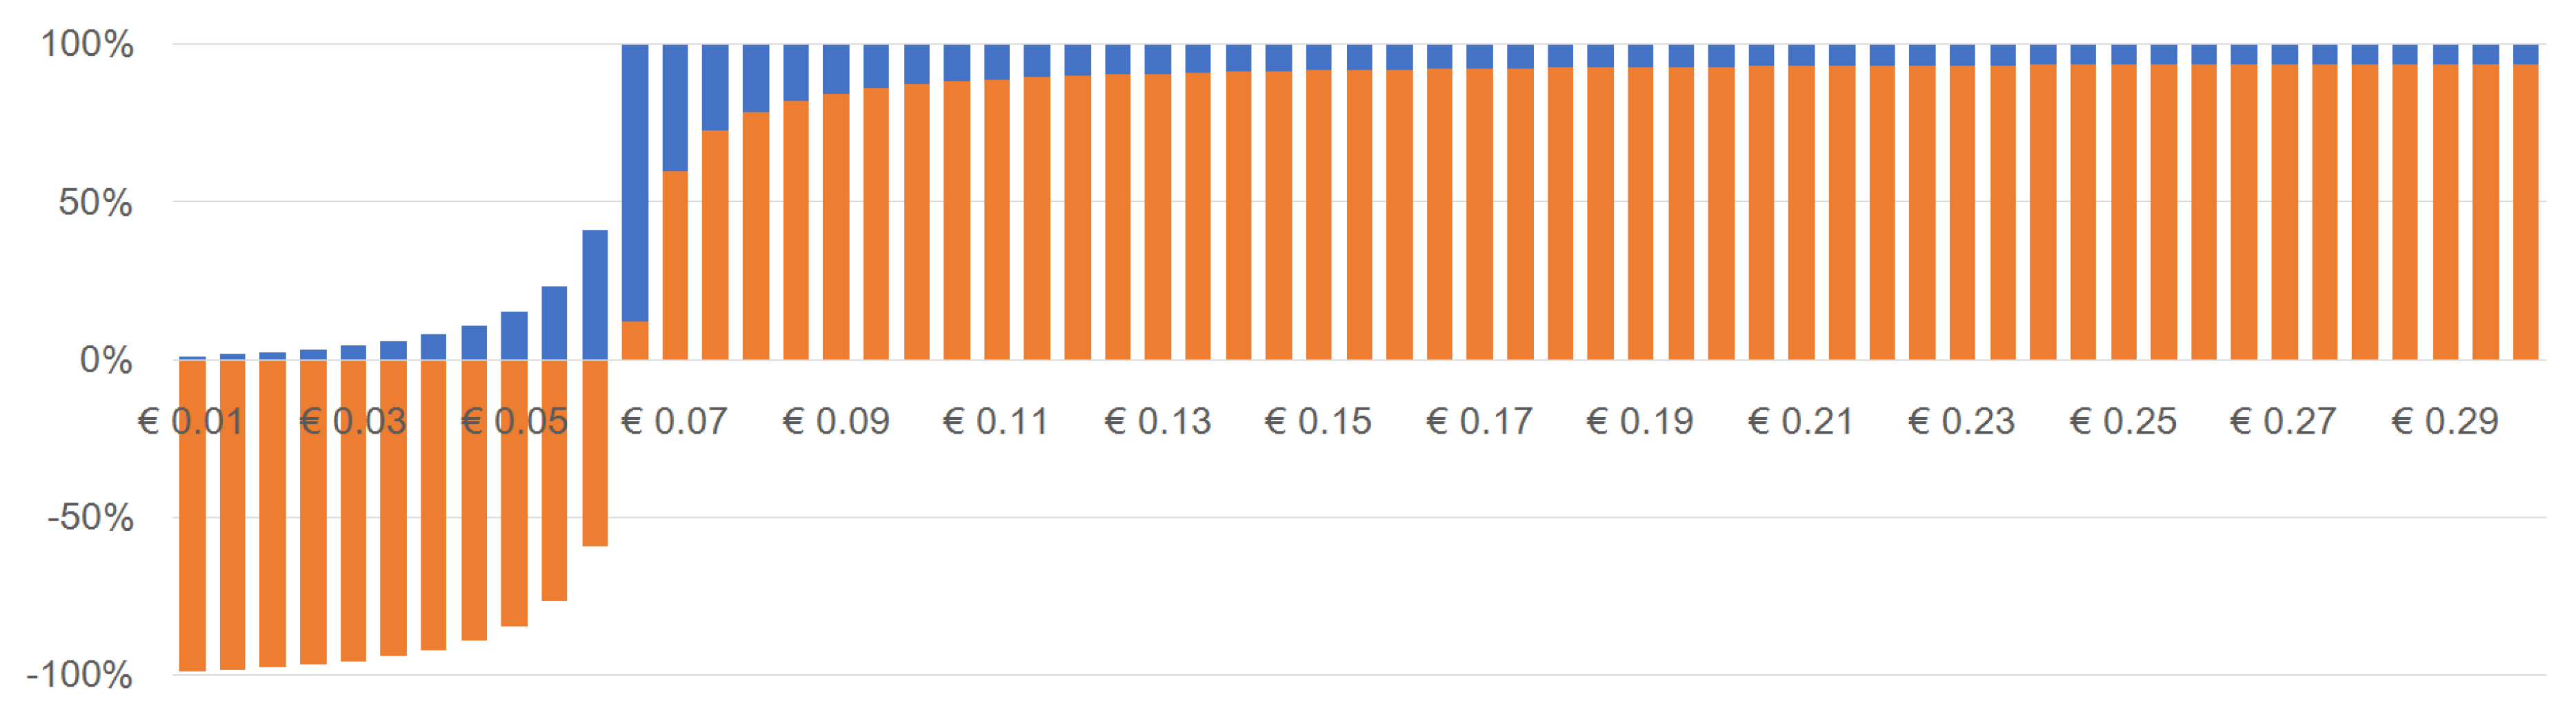
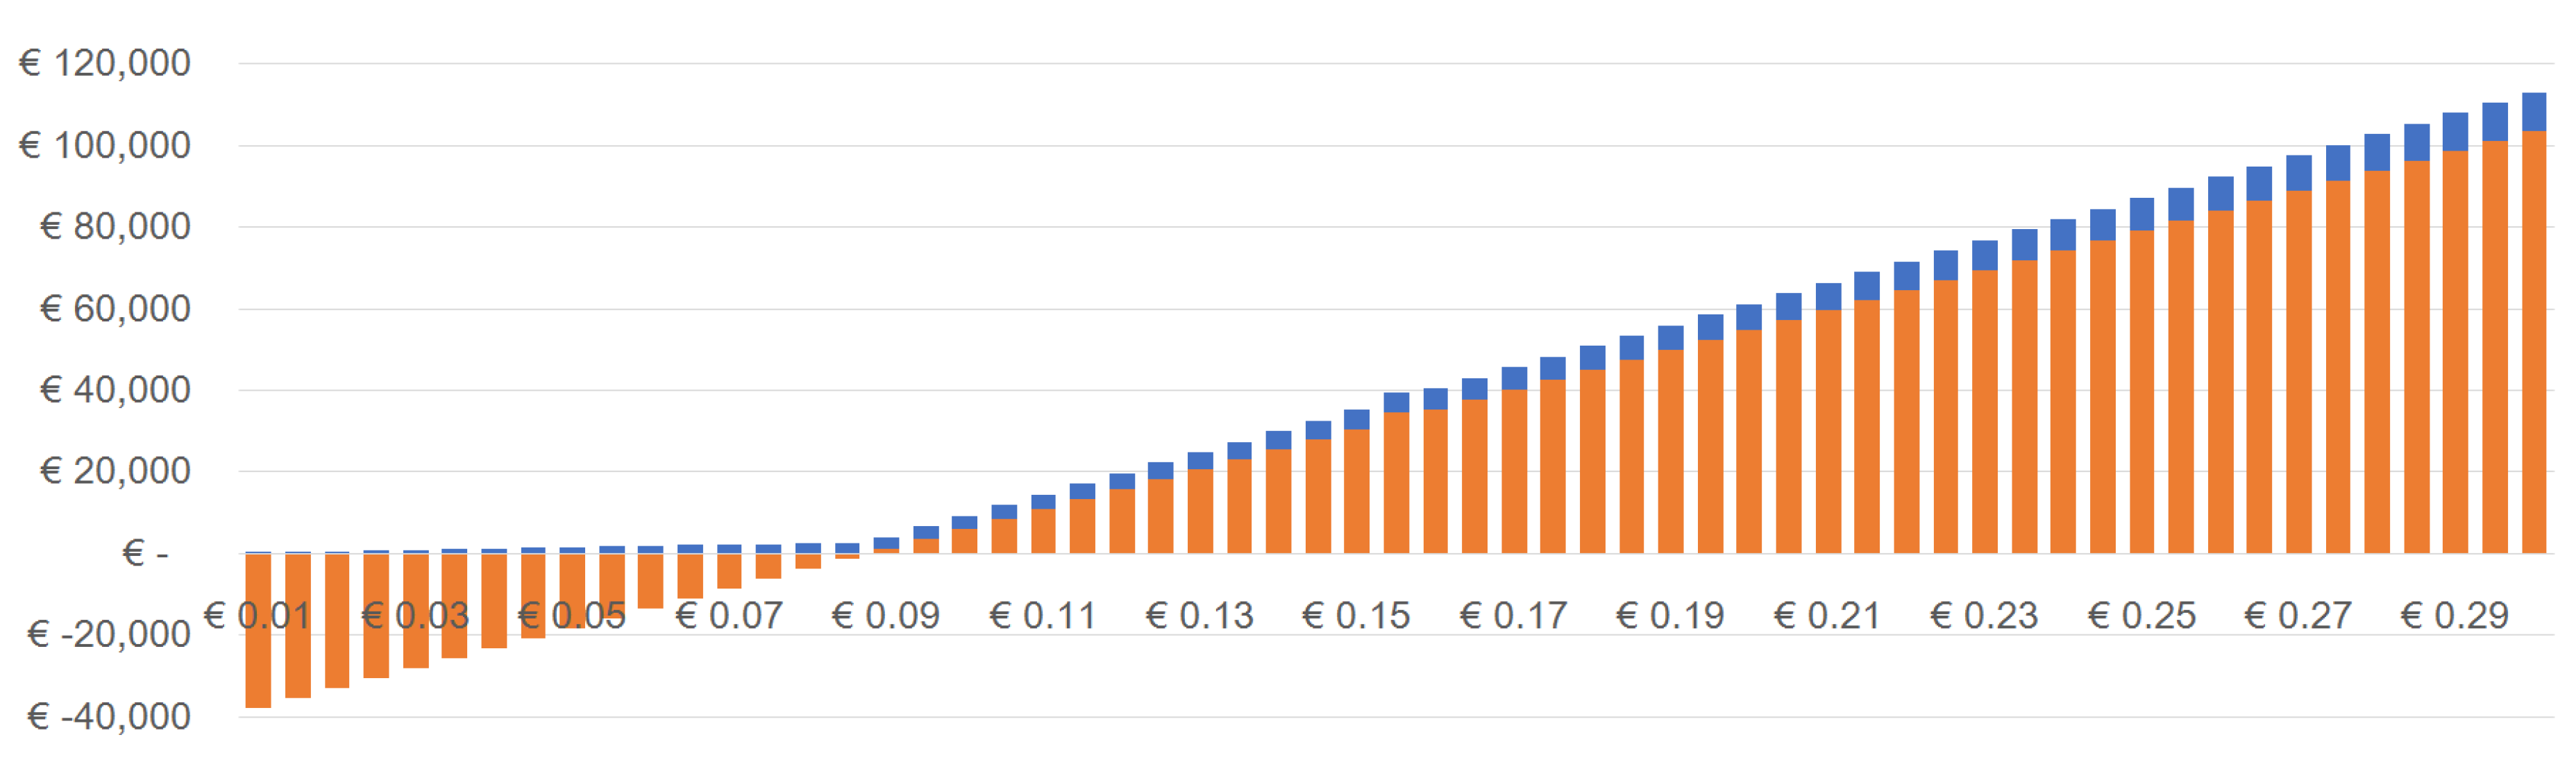
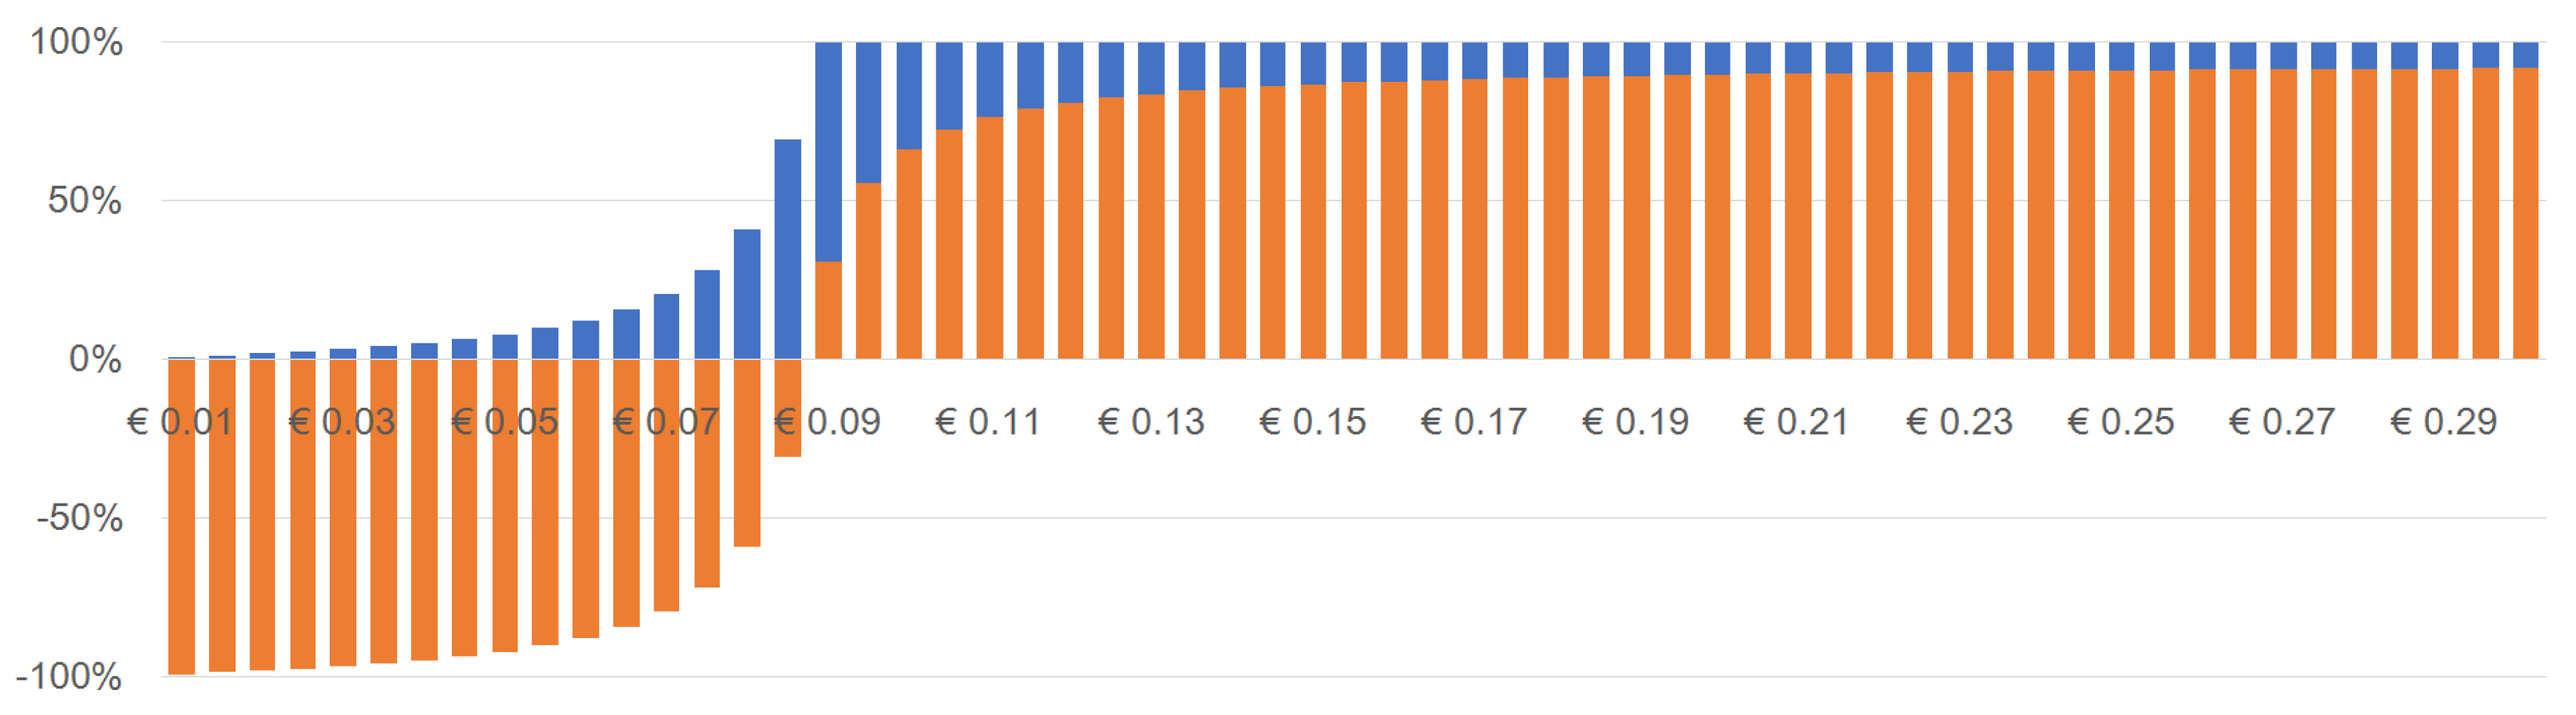
Appendix C. Evolution of Savings for the Investor, in €, Compared to the Baseline Scenario and to the Best-Case Scenario, Varying with the Price of Electricity


Appendix D. Source Data for Tables and Figures
| €/kWh | GREECE | ITALY | DENMARK | FINLAND | ||||||||
|---|---|---|---|---|---|---|---|---|---|---|---|---|
| (€) | (€) | (€) | (€) | (€) | (€) | (€) | (€) | (€) | (€) | (€) | (€) | |
| 0.01 | 4224 | 5970 | −1746 | 2247 | 5558 | −3311 | 3896 | 16,815 | −12,919 | 7681 | 45,472 | −37,791 |
| 0.015 | 6335 | 6507 | −172 | 3370 | 6034 | −2664 | 5844 | 17,579 | −11,735 | 11,522 | 46,872 | −35,350 |
| 0.02 | 8447 | 7043 | 1404 | 4494 | 6511 | −2017 | 7792 | 18,342 | −10,550 | 15,363 | 48,273 | −32,910 |
| 0.025 | 10,553 | 7580 | 2973 | 5617 | 6987 | −1370 | 9740 | 19,106 | −9366 | 19,204 | 49,673 | −30,469 |
| 0.03 | 12,671 | 8117 | 4554 | 6741 | 7464 | −723 | 11,688 | 19,869 | −8181 | 23,044 | 51,073 | −28,029 |
| 0.035 | 14,782 | 8654 | 6128 | 7864 | 7940 | −76 | 13,636 | 20,633 | −6997 | 26,885 | 52,474 | −25,589 |
| 0.04 | 16,894 | 9191 | 7703 | 8988 | 8417 | 571 | 15,584 | 21,396 | −5812 | 30,726 | 53,874 | −23,148 |
| 0.045 | 19,006 | 9728 | 9278 | 10,111 | 8893 | 1218 | 17,532 | 22,160 | −4628 | 34,567 | 55,274 | −20,707 |
| 0.05 | 21,118 | 10,264 | 10,854 | 11,235 | 9369 | 1866 | 19,481 | 22,923 | −3442 | 38,407 | 56,675 | −18,268 |
| 0.055 | 23,229 | 10,801 | 12,428 | 12,358 | 9846 | 2512 | 21,429 | 23,687 | −2258 | 42,248 | 58,075 | −15,827 |
| 0.06 | 25,341 | 11,338 | 14,003 | 13,482 | 10,322 | 3160 | 23,377 | 24,450 | −1073 | 46,089 | 59,475 | −13,386 |
| 0.065 | 27,453 | 11,875 | 15,578 | 14,605 | 10,799 | 3806 | 25,325 | 25,214 | 111 | 49,930 | 60,876 | −10,946 |
| 0.07 | 29,565 | 12,412 | 17,153 | 15,729 | 11,275 | 4454 | 27,273 | 25,982 | 1291 | 53,770 | 62,276 | −8506 |
| 0.075 | 31,676 | 12,948 | 18,728 | 16,852 | 11,752 | 5100 | 29,221 | 26,741 | 2480 | 57,611 | 63,676 | −6065 |
| 0.08 | 33,788 | 13,485 | 20,303 | 17,976 | 12,228 | 5748 | 31,169 | 27,509 | 3660 | 61,452 | 65,077 | −3625 |
| 0.085 | 35,900 | 14,022 | 21,878 | 19,099 | 12,705 | 6394 | 33,117 | 28,268 | 4849 | 65,292 | 66,477 | −1185 |
| 0.09 | 38,012 | 14,559 | 23,453 | 20,223 | 13,180 | 7043 | 35,065 | 29,036 | 6029 | 69,133 | 67,878 | 1255 |
| 0.095 | 40,124 | 15,096 | 25,028 | 21,346 | 13,658 | 7688 | 37,013 | 29,795 | 7218 | 72,974 | 69,278 | 3696 |
| 0.10 | 42,235 | 15,633 | 26,602 | 22,470 | 14,133 | 8337 | 38,961 | 30,563 | 8398 | 76,815 | 70,678 | 6137 |
| 0.105 | 44,347 | 16,169 | 28,178 | 23,593 | 14,610 | 8983 | 40,909 | 31,322 | 9587 | 80,655 | 72,079 | 8576 |
| 0.11 | 46,459 | 16,706 | 29,753 | 24,717 | 15,087 | 9630 | 42,857 | 32,085 | 10,772 | 84,496 | 73,479 | 11,017 |
| 0.115 | 48,571 | 17,243 | 31,328 | 25,840 | 15,563 | 10,277 | 44,805 | 32,849 | 11,956 | 88,337 | 74,879 | 13,458 |
| 0.12 | 50,682 | 17,780 | 32,902 | 26,936 | 16,040 | 10,896 | 46,753 | 33,612 | 13,141 | 92,178 | 76,280 | 15,898 |
| 0.125 | 52,794 | 18,317 | 34,477 | 28,087 | 16,516 | 11,571 | 48,702 | 34,376 | 14,326 | 96,018 | 77,680 | 18,338 |
| 0.13 | 54,906 | 18,853 | 36,053 | 29,210 | 16,993 | 12,217 | 50,650 | 35,139 | 15,511 | 99,859 | 79,080 | 20,779 |
| 0.135 | 57,018 | 19,390 | 37,628 | 30,334 | 17,469 | 12,865 | 52,598 | 35,903 | 16,695 | 103,700 | 80,481 | 23,219 |
| 0.14 | 59,129 | 19,927 | 39,202 | 31,457 | 17,946 | 13,511 | 54,546 | 36,666 | 17,880 | 107,540 | 81,881 | 25,659 |
| 0.145 | 61,241 | 20,464 | 40,777 | 32,581 | 18,422 | 14,159 | 56,494 | 37,430 | 19,064 | 111,381 | 83,281 | 28,100 |
| 0.15 | 63,353 | 21,001 | 42,352 | 33,704 | 18,899 | 14,805 | 58,442 | 38,193 | 20,249 | 115,222 | 84,682 | 30,540 |
| 0.158 | 66,732 | 21,860 | 44,872 | 35,502 | 19,661 | 15,841 | 61,559 | 39,415 | 22,144 | 121,367 | 86,922 | 34,445 |
| 0.16 | 67,576 | 22,074 | 45,502 | 35,951 | 19,851 | 16,100 | 62,338 | 39,720 | 22,618 | 122,903 | 87,483 | 35,420 |
| 0.165 | 69,688 | 22,611 | 47,077 | 37,075 | 20,328 | 16,747 | 64,286 | 40,484 | 23,802 | 126,744 | 88,883 | 37,861 |
| 0.17 | 71,800 | 23,148 | 48,652 | 38,198 | 20,804 | 17,394 | 66,234 | 41,247 | 24,987 | 130,585 | 90,283 | 40,302 |
| 0.175 | 73,912 | 23,685 | 50,227 | 39,322 | 21,281 | 18,041 | 68,182 | 42,011 | 26,171 | 134,426 | 91,684 | 42,742 |
| 0.18 | 76,023 | 24,222 | 51,801 | 40,445 | 21,757 | 18,688 | 70,130 | 42,774 | 27,356 | 138,266 | 93,084 | 45,182 |
| 0.185 | 78,135 | 24,758 | 53,377 | 41,569 | 22,234 | 19,335 | 72,078 | 43,538 | 28,540 | 142,107 | 94,484 | 47,623 |
| 0.19 | 80,247 | 25,295 | 54,952 | 42,692 | 22,710 | 19,982 | 74,026 | 44,301 | 29,725 | 145,948 | 95,885 | 50,063 |
| 0.195 | 82,359 | 25,832 | 56,527 | 43,816 | 23,187 | 20,629 | 75,794 | 45,065 | 30,729 | 149,789 | 97,285 | 52,504 |
| 0.20 | 84,471 | 26,369 | 58,102 | 44,939 | 23,662 | 21,277 | 77,922 | 45,828 | 32,094 | 153,629 | 98,685 | 54,944 |
| 0.205 | 86,582 | 26,906 | 59,676 | 46,063 | 24,140 | 21,923 | 79,870 | 46,592 | 33,278 | 157,470 | 100,086 | 57,384 |
| 0.21 | 88,694 | 27,443 | 61,251 | 47,186 | 24,616 | 22,570 | 81,819 | 47,355 | 34,464 | 161,311 | 101,486 | 59,825 |
| 0.215 | 90,806 | 27,979 | 62,827 | 48,310 | 25,092 | 23,218 | 83,767 | 48,119 | 35,648 | 165,151 | 102,886 | 62,265 |
| 0.22 | 92,918 | 28,516 | 64,402 | 49,433 | 25,569 | 23,864 | 85,715 | 48,882 | 36,833 | 168,992 | 104,287 | 64,705 |
| 0.225 | 95,029 | 29,053 | 65,976 | 50,557 | 26,045 | 24,512 | 87,663 | 49,646 | 38,017 | 172,833 | 105,687 | 67,146 |
| 0.23 | 97,141 | 29,590 | 67,551 | 51,680 | 26,522 | 25,158 | 89,611 | 50,409 | 39,202 | 176,674 | 107,088 | 69,586 |
| 0.235 | 99,253 | 30,127 | 69,126 | 52,804 | 26,998 | 25,806 | 91,559 | 51,173 | 40,386 | 180,514 | 108,488 | 72,026 |
| 0.24 | 101,365 | 30,663 | 70,702 | 53,927 | 27,475 | 26,452 | 93,507 | 51,936 | 41,571 | 184,355 | 109,888 | 74,467 |
| 0.245 | 103,476 | 31,200 | 72,276 | 55,050 | 27,951 | 27,099 | 95,455 | 52,700 | 42,755 | 188,196 | 111,289 | 76,907 |
| 0.25 | 105,588 | 31,737 | 73,851 | 56,174 | 28,428 | 27,746 | 97,403 | 53,463 | 43,940 | 192,037 | 112,689 | 79,348 |
| 0.255 | 107,700 | 32,274 | 75,426 | 57,297 | 28,904 | 28,393 | 99,351 | 54,227 | 45,124 | 195,877 | 114,089 | 81,788 |
| 0.26 | 109,812 | 32,811 | 77,001 | 58,421 | 29,380 | 29,041 | 101,299 | 54,990 | 46,309 | 199,718 | 115,490 | 84,228 |
| 0.265 | 111,923 | 33,348 | 78,575 | 59,544 | 29,857 | 29,687 | 103,247 | 55,754 | 47,493 | 203,559 | 116,890 | 86,669 |
| 0.27 | 114,035 | 33,884 | 80,151 | 60,668 | 30,333 | 30,335 | 105,195 | 56,517 | 48,678 | 207,400 | 118,290 | 89,110 |
| 0.275 | 116,147 | 34,421 | 81,726 | 61,791 | 30,810 | 30,981 | 107,143 | 57,281 | 49,862 | 211,240 | 119,691 | 91,549 |
| 0.28 | 118,259 | 34,958 | 83,301 | 62,915 | 31,286 | 31,629 | 109,091 | 58,044 | 51,047 | 215,081 | 121,091 | 93,990 |
| 0.285 | 120,371 | 35,495 | 84,876 | 64,038 | 31,763 | 32,275 | 111,039 | 58,808 | 52,231 | 218,922 | 122,491 | 96,431 |
| 0.29 | 122,482 | 36,032 | 86,450 | 65,162 | 32,239 | 32,923 | 112,988 | 59,571 | 53,417 | 222,762 | 123,892 | 98,870 |
| 0.295 | 124,594 | 36,568 | 88,026 | 66,285 | 32,716 | 33,569 | 114,936 | 60,335 | 54,601 | 226,603 | 125,292 | 101,311 |
| 0.30 | 126,706 | 37,105 | 89,601 | 67,409 | 33,191 | 34,218 | 116,884 | 61,103 | 55,781 | 230,444 | 126,692 | 103,752 |
References
- European Commission. Energy Roadmap 2050. Technical Report. 2012. Available online: https://ec.europa.eu/energy/sites/ener/files/documents/ (accessed on 10 December 2018).
- Clarke, T.; Lambert, E.; Deavis-Marks, M.; Ceccarelli, A.; Zoppi, T.; Jung, O.; Chai, M.; Chen, Y.; Vasenev, A.; Montoya, L. Improving the Robustness of Urban Electricity Networks. Technical report, Ethos Energy, University of Florence, FTW, Queen Mary University of London, University of Twente. 2015. Available online: http://ireneproject.eu/wp-content/uploads (accessed on 10 December 2018).
- IEA. Smart Grids in Distribution Networks: Roadmap Development and Implementation. Technical Report. IEA, 2015. Available online: www.iea.org/publications (accessed on 10 December 2018).
- Yan, J.; Zhai, Y.; Wijayatunga, P.; Mohamed, A.M.; Campana, P.E. Renewable energy integration with mini/micro-grids (editorial). Appl. Energy 2017, 201, 241–244. [Google Scholar] [CrossRef]
- IRENA. Innovation Outlook: Renewable Mini-Grids. Technical report. IRENA, Abu Dhabi, 2016. Available online: www.irena.org/publications (accessed on 10 December 2018).
- Schwaegerl, C.; Tao, L. Quantification of Technical, Economic, Environmental and Social Benefits of Microgrid Operation. In Microgrids: Architectures and Control; Hatziargyriou, N., Ed.; Wiley IEEE Press: Chichester, UK, 2014; Chapter 7; pp. 275–313. [Google Scholar]
- Mohammed, Y.S.; Mustafa, M.W.; Bashir, N. Hybrid renewable energy systems for off-grid electric power: Review of substantial issues. Renew. Sustain. Energy Rev. 2014, 35, 527–539. [Google Scholar] [CrossRef]
- Blanco, H.; Faaij, A. A review at the role of storage in energy systems with a focus on Power to Gas and long-term storage. Renew. Sustain. Energy Rev. 2018, 81, 1049–1086. [Google Scholar] [CrossRef]
- European Commission. Energy Storage—The Role of Electricity. Technical Report. European Commission, Brussels, 2017. Available online: https://ec.europa.eu/energy/en/topics/technology-and-innovation/energy-storage (accessed on 10 December 2018).
- Zehir, M.A.; Batman, A.; Sonmez, M.A.; Font, A.; Tsiamitros, D.; Stimoniaris, D.; Kollatou, T.; Bagriyanik, M.; Ozdemir, A.; Dialynas, E. Impacts of microgrids with renewables on secondary distribution networks. Appl. Energy 2017, 201, 308–319. [Google Scholar] [CrossRef]
- Van Der Schoor, T.; Scholtens, B. Power to the people: Local community initiatives and the transition to sustainable energy. Renew. Sustain. Energy Rev. 2015, 43, 666–675. [Google Scholar] [CrossRef]
- Becker, S.; Kunze, C.; Vancea, M. Community energy and social entrepreneurship: Addressing purpose, organisation and embeddedness of renewable energy projects. J. Clean. Prod. 2017, 147, 25–36. [Google Scholar] [CrossRef]
- Hicks, J.; Ison, N. An exploration of the boundaries of ‘community’ in community renewable energy projects: Navigating between motivations and context. Energy Policy 2018, 113, 523–534. [Google Scholar] [CrossRef]
- Yu, H.J.J. A prospective economic assessment of residential PV self-consumption with batteries and its systemic effects: The French case in 2030. Energy Policy 2018, 113, 673–687. [Google Scholar] [CrossRef]
- Mariam, L.; Basu, M.; Conlon, M.F. Microgrid: Architecture, policy and future trends. Renew. Sustain. Energy Rev. 2016, 64, 477–489. [Google Scholar] [CrossRef]
- Soshinskaya, M.; Crijns-Graus, W.H.; Guerrero, J.M.; Vasquez, J.C. Microgrids: Experiences, barriers and success factors. Renew. Sustain. Energy Rev. 2014, 40, 659–672. [Google Scholar] [CrossRef]
- Moretti, M.; Djomo, S.N.; Azadi, H.; May, K.; De Vos, K.; Van Passel, S.; Witters, N. A systematic review of environmental and economic impacts of smart grids. Renew. Sustain. Energy Rev. 2017, 68, 888–898. [Google Scholar] [CrossRef]
- Miller, L.; Carriveau, R. A review of energy storage financing—Learning from and partnering with the renewable energy industry. J. Energy Storage 2018, 19, 311–319. [Google Scholar] [CrossRef]
- Sauhats, A.; Zemite, L.; Petrichenko, L.; Moshkin, I.; Jasevics, A. Estimating the Economic Impacts of Net Metering Schemes for Residential PV Systems with Profiling of Power Demand, Generation, and Market Prices. Energies 2018, 11, 3222. [Google Scholar] [CrossRef]
- Coppo, M.; Pelacchi, P.; Pilo, F.; Pisano, G.; Soma, G.G.; Turri, R. The Italian smart grid pilot projects: Selection and assessment of the test beds for the regulation of smart electricity distribution. Electr. Power Syst. Res. 2015, 120, 136–149. [Google Scholar] [CrossRef]
- Bianco, G.; Noce, C.; Sapienza, G. Enel Distribuzione projects for renewable energy sources integration in distribution grid. Electr. Power Syst. Res. 2015, 120, 118–127. [Google Scholar] [CrossRef]
- Crispim, J.; Braz, J.; Castro, R.; Esteves, J. Smart Grids in the EU with smart regulation: Experiences from the UK, Italy and Portugal. Util. Policy 2014, 31, 85–93. [Google Scholar] [CrossRef]
- Delfanti, M.; Fasciolo, E.; Olivieri, V.; Pozzi, M. A2A project: A practical implementation of smart grids in the urban area of Milan. Electr. Power Syst. Res. 2015, 120, 2–19. [Google Scholar] [CrossRef]
- Siirto, O.; Hyvärinen, M.; Loukkalahti, M.; Hämäläinen, A.; Lehtonen, M. Improving reliability in an urban network. Electr. Power Syst. Res. 2015, 120, 47–55. [Google Scholar] [CrossRef]
- Li, Y.; Gao, W.; Ruan, Y. Performance investigation of grid-connected residential PV-battery system focusing on enhancing self-consumption and peak shaving in Kyushu, Japan. Renew. Energy 2018, 127, 514–523. [Google Scholar] [CrossRef]
- Pena-Bello, A.; Burer, M.; Patel, M.K.; Parra, D. Optimizing PV and grid charging in combined applications to improve the profitability of residential batteries. J. Energy Storage 2017, 13, 58–72. [Google Scholar] [CrossRef]
- Dietrich, A.; Weber, C. What drives profitability of grid-connected residential PV storage systems? A closer look with focus on Germany. Energy Econ. 2018, 74, 399–416. [Google Scholar] [CrossRef]
- Parra, D.; Patel, M.K. Effect of tariffs on the performance and economic benefits of PV-coupled battery systems. Appl. Energy 2016, 164, 175–187. [Google Scholar] [CrossRef]
- Zsiborács, H.; Baranyai, N.H.; Vincze, A.; Háber, I.; Pintér, G. Economic and Technical Aspects of Flexible Storage Photovoltaic Systems in Europe. Energies 2018, 11, 1445. [Google Scholar] [CrossRef]
- Cerino Abdin, G.; Noussan, M. Electricity storage compared to net metering in residential PV applications. J. Clean. Prod. 2018, 176, 175–186. [Google Scholar] [CrossRef]
- Cucchiella, F.; D’Adamo, I.; Gastaldi, M. The economic feasibility of residential energy storage combined with PV panels: The role of subsidies in Italy. Energies 2017, 10, 1434. [Google Scholar] [CrossRef]
- Milis, K.; Peremans, H.; Van Passel, S. Steering the adoption of battery storage through electricity tariff design. Renew. Sustain. Energy Rev. 2018, 98, 125–139. [Google Scholar] [CrossRef]
- Zame, K.K.; Brehm, C.A.; Nitica, A.T.; Richard, C.L.; Schweitzer, G.D. Smart grid and energy storage: Policy recommendations. Renew. Sustain. Energy Rev. 2018, 82, 1646–1654. [Google Scholar] [CrossRef]
- Laws, N.D.; Anderson, K.; DiOrio, N.A.; Li, X.; McLaren, J. Impacts of valuing resilience on cost-optimal PV and storage systems for commercial buildings. Renew. Energy 2018, 127, 896–909. [Google Scholar] [CrossRef]
- Shaw-Williams, D.; Susilawati, C.; Walker, G. Value of residential investment in photovoltaics and batteries in networks: A techno-economic analysis. Energies 2018, 11, 1022. [Google Scholar] [CrossRef]
- Robert, F.C.; Sisodia, G.S.; Gopalan, S. A critical review on the utilization of storage and demand response for the implementation of renewable energy microgrids. Sustain. Cities Soc. 2018, 40, 735–745. [Google Scholar] [CrossRef]
- Zehir, M.A.; Batman, A.; Sonmez, M.A.; Font, A.; Tsiamitros, D.; Stimoniaris, D.; Kollatou, T.; Bagriyanik, M.; Ozdemir, A.; Dialynas, E. Impact of Renewable Based Microgrid Supply/Demand Profiles on Low Voltage Distribution Networks. Energy Procedia 2016, 103, 231–236. [Google Scholar] [CrossRef]
- CIGRE. Planning and Optimization Methods for Active Distribution Systems. Technical Report. August 2014. Available online: https://www.researchgate.net/publication/283569552_Planning_and_optimization_methods_for_active_distribution_systems (accessed on 10 December 2018).
- Bell, K.; Gill, S. Delivering a highly distributed electricity system: Technical, regulatory and policy challenges. Energy Policy 2018, 113, 765–777. [Google Scholar] [CrossRef]
- McKenna, R. The double-edged sword of decentralized energy autonomy. Energy Policy 2018, 113, 747–750. [Google Scholar] [CrossRef]
- Haider, H.T.; See, O.H.; Elmenreich, W. A review of residential demand response of smart grid. Renew. Sustain. Energy Rev. 2016, 59, 166–178. [Google Scholar] [CrossRef]
- Carvalho, P.; Marques, R.C. Computing economies of scope using robust partial frontier nonparametric methods. Water 2016, 8, 82. [Google Scholar] [CrossRef]
- Asano, H.; Bando, S. Economic Analysis of Microgrids. In Proceedings of the Power Conversion Conference, Nagoya, Japan, 2–5 April 2007; pp. 654–658. [Google Scholar]
- Quashie, M.; Bouffard, F.; Joós, G. Business cases for isolated and grid connected microgrids: Methodology and applications. Appl. Energy 2017, 205, 105–115. [Google Scholar] [CrossRef]
- Allegrini, J.; Orehounig, K.; Mavromatidis, G.; Ruesch, F.; Dorer, V.; Evins, R. A review of modelling approaches and tools for the simulation of district-scale energy systems. Renew. Sustain. Energy Rev. 2015, 52, 1391–1404. [Google Scholar] [CrossRef]
- Connolly, D.; Lund, H.; Mathiesen, B.V.; Leahy, M. A review of computer tools for analysing the integration of renewable energy into various energy systems. Appl. Energy 2010, 87, 1059–1082. [Google Scholar] [CrossRef]
- Al-falahi, M.D.; Jayasinghe, S.D.; Enshaei, H. A review on recent size optimization methodologies for standalone solar and wind hybrid renewable energy system. Energy Convers. Manag. 2017, 143, 252–274. [Google Scholar] [CrossRef]
- Tezer, T.; Yaman, R.; Yaman, G. Evaluation of approaches used for optimization of stand-alone hybrid renewable energy systems. Renew. Sustain. Energy Rev. 2017, 73, 840–853. [Google Scholar] [CrossRef]
- HOMER. HOMER Pro Version 3.12 online User Manual. HOMER Energy, 2016. Available online: https://www.homerenergy.com/products/pro/docs/3.12/index.html (accessed on 3 January 2019).
- Basher, S.A.; Raboy, D.G. The misuse of net present value in energy efficiency standards. Renew. Sustain. Energy Rev. 2018, 96, 218–225. [Google Scholar] [CrossRef]
- TradingEconomics. Country Indicators. Available online: https://tradingeconomics.com/countries (accessed on 10 December 2018).
- Papadopoulos, M.; Karteris, M.M. An assessment of the Greek incentives scheme for photovoltaics. Energy Policy 2009, 37, 1945–1952. [Google Scholar] [CrossRef]
- Grant Thornton and Clean Energy Pipeline. Renewable Energy Discount Rate Survey Results—2017. Available online: https://www.grantthornton.co.uk/globalassets/1.-member-firms/united-kingdom/pdf/documents/renewable-energy-discount-rate-survey-2017.pdf (accessed on 10 December 2018).
- Comodi, G.; Giantomassi, A.; Severini, M.; Squartini, S.; Ferracuti, F.; Fonti, A.; Nardi Cesarini, D.; Morodo, M.; Polonara, F. Multi-apartment residential microgrid with electrical and thermal storage devices: Experimental analysis and simulation of energy management strategies. Appl. Energy 2015, 137, 854–866. [Google Scholar] [CrossRef]
- Hesse, H.C.; Schimpe, M.; Kucevic, D.; Jossen, A. Lithium-ion battery storage for the grid—A review of stationary battery storage system design tailored for applications in modern power grids. Energies 2017, 10, 2107. [Google Scholar] [CrossRef]
- World Energy Council. Average Electricity Consumption Per Electrified Household. 2016. Available online: https://wec-indicators.enerdata.net/household-electricity-use.html (accessed on 10 December 2018).
- Goebel, C.; Cheng, V.; Jacobsen, H.A. Profitability of residential battery energy storage combined with solar photovoltaics. Energies 2017, 10, 976. [Google Scholar] [CrossRef]
- Eurostat. Share of Energy from Renewable Sources, Energy Indicator: Share of Renewable Energy in Electricity. Available online: http://appsso.eurostat.ec.europa.eu/nui/submitViewTableAction.do (accessed on 10 December 2018).


| Greece | Italy | Denmark | Finland | |
|---|---|---|---|---|
| Price of electricity (€/kWh) | 0.07 | 0.055 | 0.30 | 0.158 |
| Inflation rate [51] | 1.2% | 0.9% | 1% | 0.5% |
| Discount rate [52,53] | 6% | 8% | 7.25% | 7.25% |
| GR | IT | DK | FI | |
|---|---|---|---|---|
| Consumption (kWh/year) [56] | 30,064 | 19,456 | 31,024 | 64,328 |
| PV Production (kWh/year) | 23,344 | 11,710 | 19,909 | 43,316 |
| PV Production/Total Consumption | 77.65% | 60.19% | 64.17% | 67.34% |
| Rated capacity PV (kW) | 9.43 | 6.10 | 9.26 | 47.55 |
| Renewable fraction PV-only | 60.10% | 49.50% | 48.80% | 49.20% |
| Battery nominal capacity (kWh) | 30.00 | 29.4 | 40.44 | 91.2 |
| Battery intake/PV production | 29% | 33% | 33% | 31% |
| Battery Output/Consumption | 19.42% | 18.90% | 20.15% | 19.09% |
| Renewable fraction with battery 1 | 68.70% | 56.90% | 55.90% | 55.10% |
| GR | IT | DK | FI | |
|---|---|---|---|---|
| Capacity (kW) | 9.43 | 6.10 | 19.26 | 47.55 |
| Total price (€) | 4895 | 3892 | 12,868 | 36,983 |
| (€/kWh) | Greece | Italy | Denmark | Finland |
|---|---|---|---|---|
| 0.01 | 4224 | 2247 | 3896 | 7681 |
| 0.02 | 8447 | 4494 | 7792 | 15,363 |
| 0.03 | 12,671 | 6741 | 11,688 | 23,044 |
| 0.04 | 16,894 | 8988 | 15,584 | 30,726 |
| 0.05 | 21,118 | 11,235 | 19,481 | 38,407 |
| 0.055 | 23,229 | 12,358 | 21,429 | 42,248 |
| 0.06 | 25,341 | 13,482 | 23,377 | 46,089 |
| 0.07 | 29,565 | 15,729 | 27,273 | 53,770 |
| 0.08 | 33,788 | 17,976 | 31,169 | 61,452 |
| 0.09 | 38,012 | 20,223 | 35,065 | 69,133 |
| 0.10 | 42,235 | 22,470 | 38,961 | 76,815 |
| 0.158 | 66,732 | 35,502 | 61,559 | 121,367 |
| 0.20 | 84,471 | 44,939 | 77,922 | 153,629 |
| 0.30 | 126,706 | 67,409 | 116,884 | 230,444 |
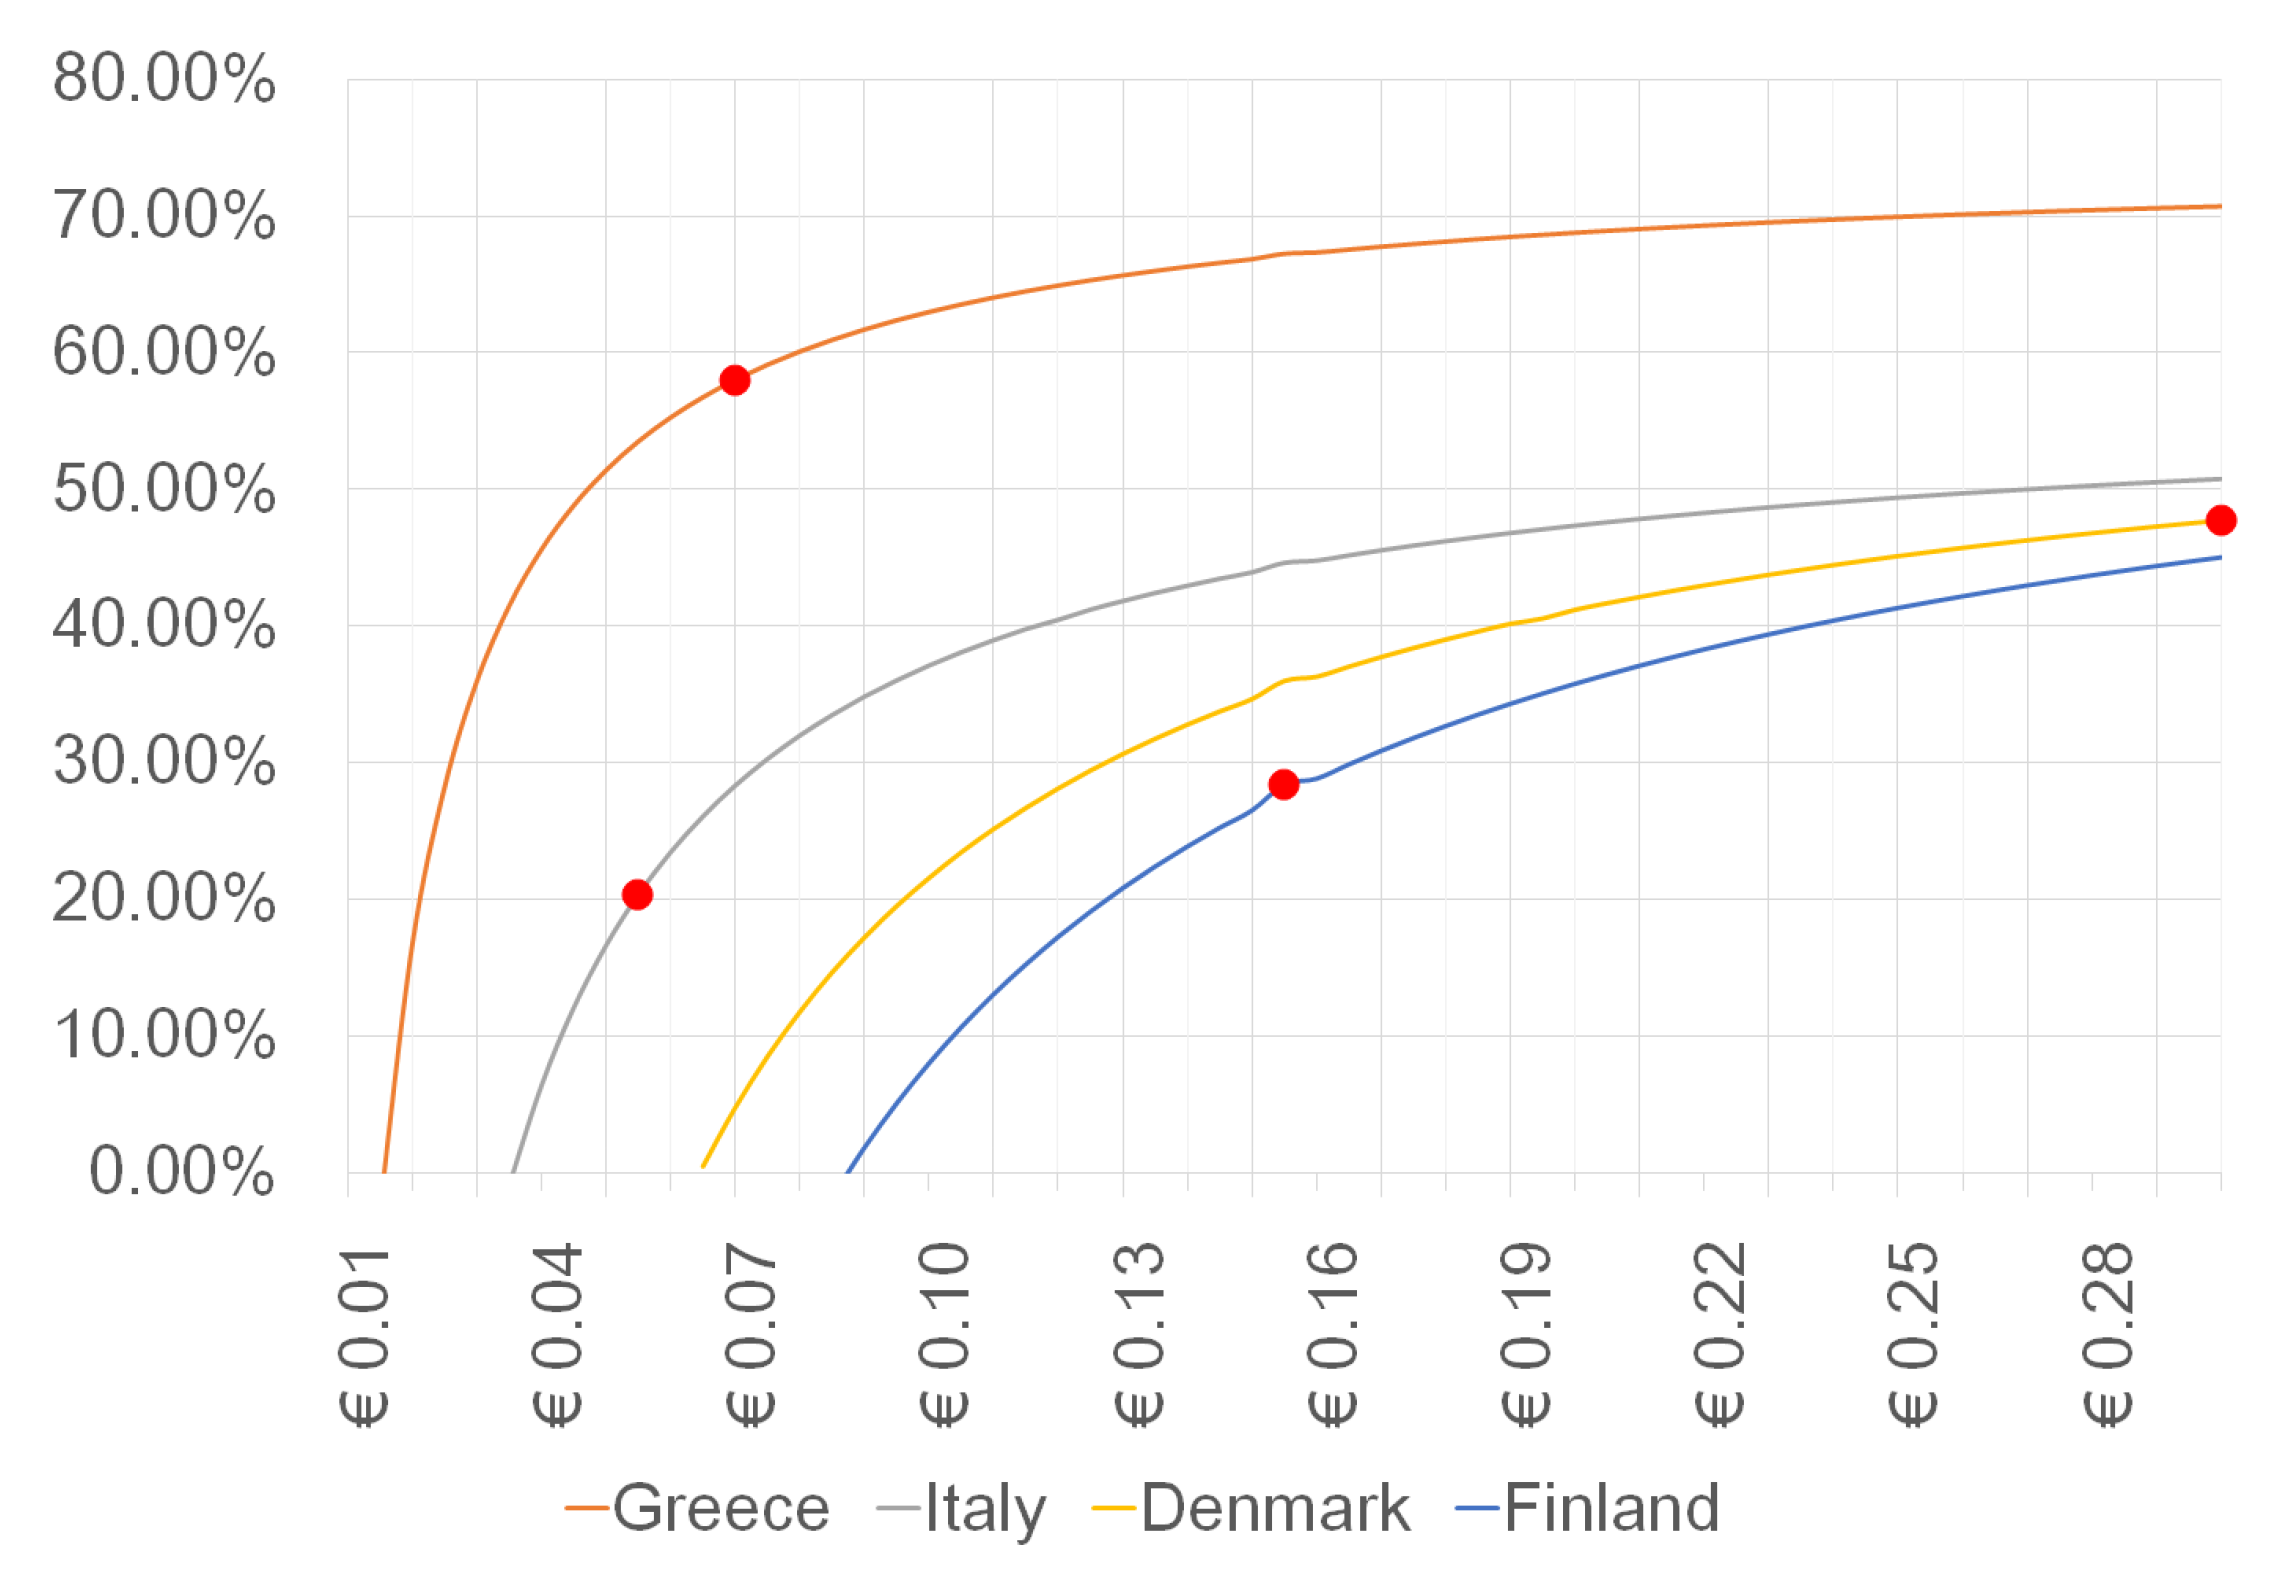
| (€/kWh) | GR | IT | DK | FI |
|---|---|---|---|---|
| 0.01 | −41% | −147% | −332% | −492% |
| 0.02 | 16% | −45% | −135% | −214% |
| 0.03 | 36% | −11% | −70% | −122% |
| 0.04 | 45% | 6% | −37% | −75% |
| 0.05 | 51% | 17% | −18% | −48% |
| 0.055 | 54% | 20% | −11% | −37% |
| 0.06 | 55% | 23% | −5% | −29% |
| 0.07 | 58% | 28% | 5% | 16% |
| 0.08 | 60% | 32% | 12% | −6% |
| 0.09 | 62% | 35% | 17% | 2% |
| 0.10 | 63% | 37% | 22% | 8% |
| 0.158 | 67% | 45% | 36% | 28% |
| 0.20 | 69% | 47% | 41% | 36% |
| 0.30 | 71% | 51% | 48% | 45% |
| GR | IT | DK | FI | |
|---|---|---|---|---|
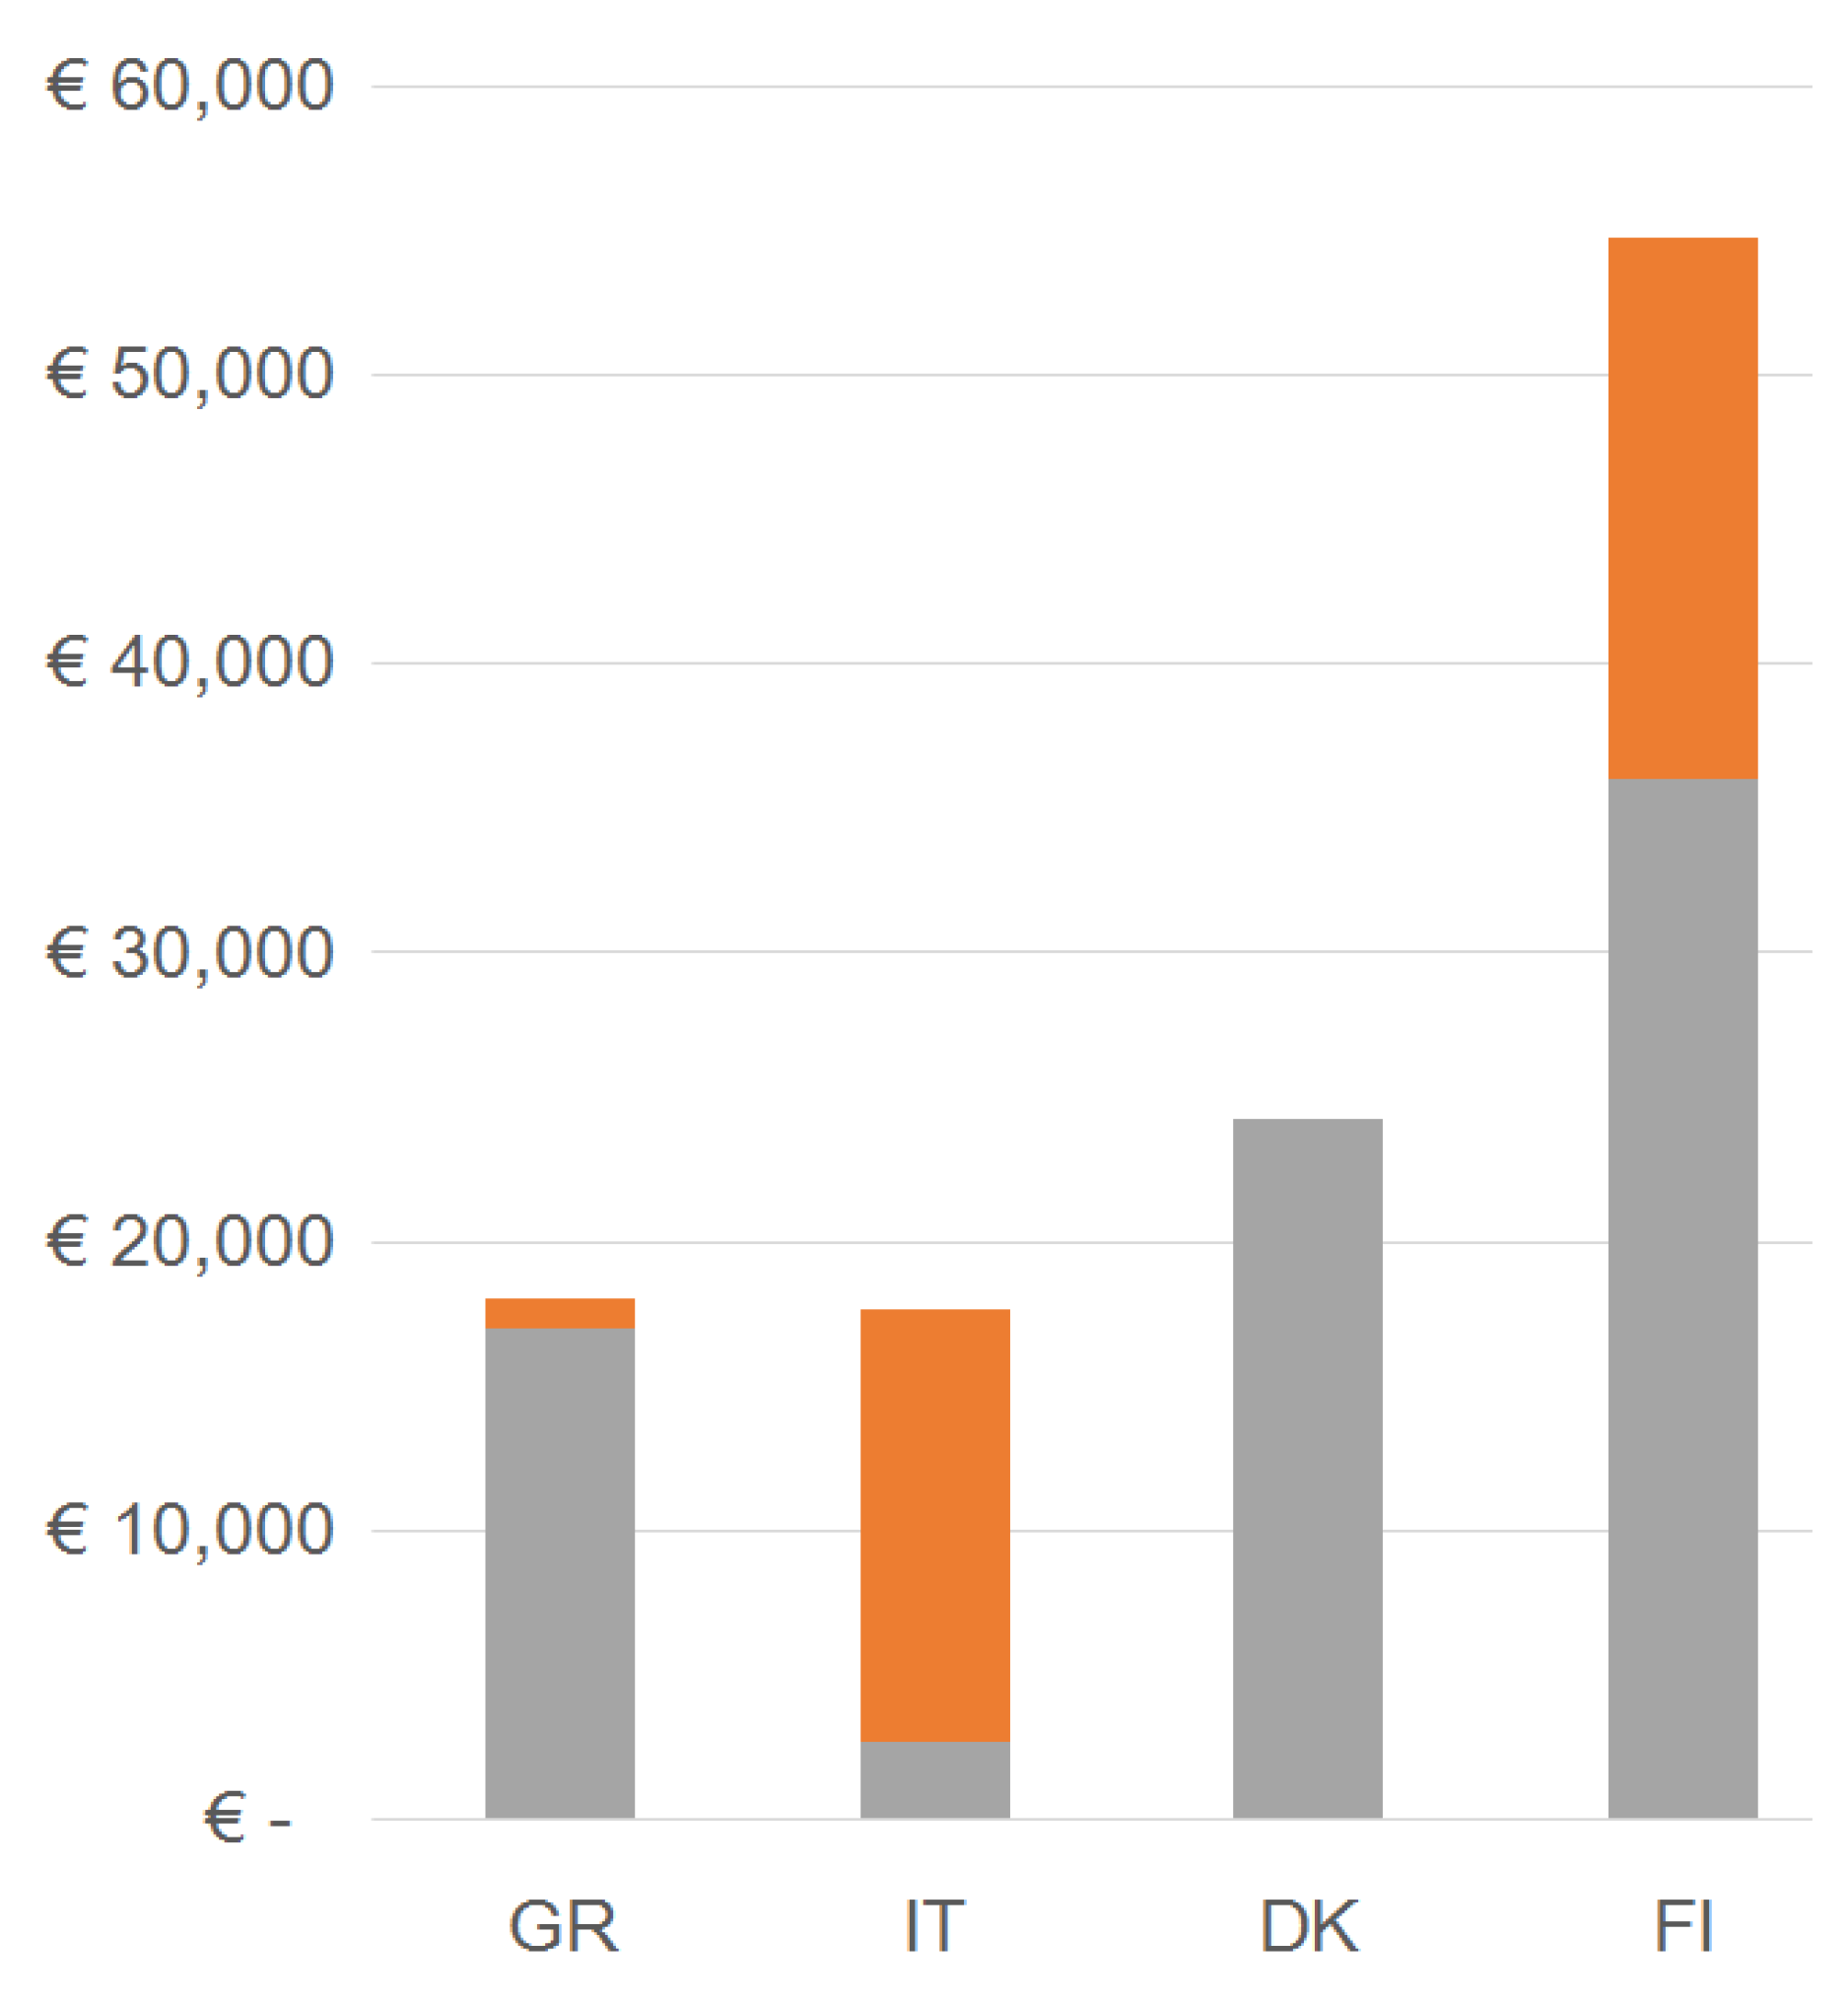
| Battery capacity (kWh) | 30 | 29.4 | 40.44 | 91.2 |
| (€) | 18,000 | 17,640 | 26,264 | 54,720 |
| (€) | 17,000 | 2700 | 55,000 | 36,000 |
| /kWh (€) | 566.7 | 99.23 | 1360.04 | 394.74 |
| Share of | 94.4% | 15.3% | 226.67% | 65.79% |
| (€) | 1000 | 14,940 | −30,736 | 18,720 |
| /kWh (€) | 33.3 | 508 | – | 205 |
| Share of | 5.6% | 84.7% | – | 34.21% |
| Scenario 1 | Scenario 2 | |
|---|---|---|
| Case Study | Battery for Free | Battery Costs Shared |
| Greece | for all €/kWh | 94.4% self-financed battery |
| at €/kWh, 17,153 € saved compared to the baseline scenario | Additional = 1000 € contribution required | |
| Italy | for all €/kWh | 15.3% self-financed battery |
| at = 0.055 €/kWh, 2512 € saved compared to the baseline scenario | Additional = 14,940 € contribution required | |
| Denmark | for all €/kWh | 100% self-financed battery |
| at = 0.30 €/kWh, 55,781 € saved compared to the baseline scenario | No additional contribution from Supporter required | |
| Finland | for all €/kWh | 34.2% self-financed battery |
| at €/kWh, 34,445 € saved compared to the baseline scenario | Additional = 18,720 € contribution required |
| GR | IT | DK | FI | |
|---|---|---|---|---|
| Renewable fraction in electricity, national (%) 1 | 23.8 | 34.0 | 53.7 | 32.9 |
| True 2 renewable fraction PV only (%) | 69.59 | 66.67 | 76.29 | 65.91 |
| True renewable fraction PV+Battery (%) | 76.15 | 71.55 | 79.58 | 69.87 |
| Net increase of renewable fraction due to Battery (%) | 6.56 | 4.88 | 3.29 | 3.96 |
© 2019 by the authors. Licensee MDPI, Basel, Switzerland. This article is an open access article distributed under the terms and conditions of the Creative Commons Attribution (CC BY) license (http://creativecommons.org/licenses/by/4.0/).
Share and Cite
Saviuc, I.; Peremans, H.; Van Passel, S.; Milis, K. Economic Performance of Using Batteries in European Residential Microgrids under the Net-Metering Scheme. Energies 2019, 12, 165. https://doi.org/10.3390/en12010165
Saviuc I, Peremans H, Van Passel S, Milis K. Economic Performance of Using Batteries in European Residential Microgrids under the Net-Metering Scheme. Energies. 2019; 12(1):165. https://doi.org/10.3390/en12010165
Chicago/Turabian StyleSaviuc, Iolanda, Herbert Peremans, Steven Van Passel, and Kevin Milis. 2019. "Economic Performance of Using Batteries in European Residential Microgrids under the Net-Metering Scheme" Energies 12, no. 1: 165. https://doi.org/10.3390/en12010165
APA StyleSaviuc, I., Peremans, H., Van Passel, S., & Milis, K. (2019). Economic Performance of Using Batteries in European Residential Microgrids under the Net-Metering Scheme. Energies, 12(1), 165. https://doi.org/10.3390/en12010165