Article

Effect of Tip Clearance on Flow Field and Heat Transfer Characteristics in a Large Meridional Expansion Turbine

College of Power and Energy Engineering, Harbin Engineering University, Harbin 150001, China
*
Author to whom correspondence should be addressed.
Energies 2019, 12(1), 162; https://doi.org/10.3390/en12010162
Submission received: 27 November 2018 / Revised: 27 December 2018 / Accepted: 28 December 2018 / Published: 4 January 2019

Abstract

:
The large meridional expansion turbine stator leads to complex secondary flows and heat transfer characteristics in the blade endwall region, while the upstream tip clearance leakage flow of the rotor makes it more complex in flow and heat transfer. The influence of the upstream rotor tip clearance on the large meridian expansion stator is worth studying. The flow and heat transfer characteristics of the downstream large meridional expansion turbine stator were studied by comparing the tip leakage flow of 1.5-stage shrouded and unshrouded turbines using a three-dimensional Reynolds-Averaged Navier-Stokes (RANS) solver for viscous turbulent flows. Validation studies were performed to investigate the aerodynamics and heat transfer prediction ability of the shear stress transport (SST) turbulence model. The influence of different tip clearances of the rotor including unshrouded blade heights of 0%, 1% and 5% and a 1% shrouded blade height were investigated through numerical simulation. The results showed that the upper passage vortex separation was more serious and the separation, and attachment point of horseshoe vortex in the pressure side were significantly more advanced than that of non-expansion turbines. The tip leakage vortex obviously increased the negative incidence angle at the downstream inlet. Furthermore, the strength of the high heat transfer zone on the suction surface of the downstream stator was significantly increased, while that of the shrouded rotor decreased.

1. Introduction

In general, the low-pressure turbine of marine gas turbines has a high endwall angle design. The large meridional expansion endwall can effectively reduce the large deflection angle of the blade profile to meet the expansion ratio requirement. The large meridional expansion can cause a large secondary flow and flow separation at the endwall, and the endwall heat transfer is strongly affected by secondary effects. The difference between rotor tip leakage flow and the circumferential velocity of the main flow causes great mixing loss and exerts a strong effect on the boundary layer of the endwall. Therefore, it is of great value to study the influence of tip clearance of the rotor on the flow and the heat transfer characteristics of the downstream large meridional expansion stator.
Tip leakage flow has become one of the key factors in reducing turbine air thermal performance [1,2]. More than one-third of flow loss in turbines is caused by tip clearance flow. For every 1% increase in the ratio of the tip clearance to blade height, turbine efficiency will decrease by 0.8–1.2% [3,4]. The shrouded rotor structure has been widely used in a gas turbine. Denton [5] developed a model of tip leakage loss in a shrouded turbine. In the downstream of the seal teeth, the leakage fluid expands rapidly, resulting in a sharp decrease in the axial velocity of the leakage fluid. Tip leakage flows of shrouded turbines not only affect the boundary layer of the endwall but also influence the development of secondary flows in the downstream static blade passage. Korschunow et al. [6] studied the interference characteristics of the leakage flow and the mainstream by combining model tests and theoretical analysis, where the fact that leakage flow also changes the downstream static flow field and increases the secondary flow loss in the endwall was not considered. The results of Anker, Peters et al. [7,8] showed that the presence of tip sealing teeth significantly reduced the tip leakage. With the increase of blade clearance size, the incidence angle at the downstream static blade inlet also increased, while the radial variation range of the flow angle at the downstream static blade inlet increased. However, studies on large meridional expansion turbine stators by upstream rotor clearance has not been conducted.
Over the past decades, designers have put great effort into increasing the turbine inlet temperature to improve turbine efficiency. As a result of this trend, the first two stage vanes and blades are exposed to increasing temperatures, and turbine entry temperature is much higher than the melting point of the metal. To ensure that the turbine still works in such harsh environments, blades should employ blade cooling and thermal barrier coatings [9,10]. To achieve reliable and efficient cooling schemes, a crucial step in the turbine blade cooling design is the prediction of the flow and heat transfer of the passages and endwall. Therefore, designers must be equipped with knowledge of the endwall heat load distributions of the turbine (see the paper by Haselbach and Schiffer [11]). The AITEB research project studied the secondary flow field and endwall heat transfer of a low-pressure turbine blade with a shrouded rotor. Dannhauer [12] and Rehder and Dannhauer [13] studied the flow, heat transfer, and film cooling effect of leakage clearance on the downstream static blade channel. The secondary flow field has a great influence on the heat transfer of the endwall without leakage flow; however, the effect of upstream leakage flow on the heat transfer of a large meridional expansion stator is still unclear.
The tip clearance of the rotor in the first stage has a great influence on the flow field and heat transfer of the downstream large meridional expansion stator. However, there have been no detailed studies of such issues in the published literature. The numerical investigation presented in this paper was conducted to clarify the effects of upstream rotor tip clearance on the stator in a 1.5-stage large meridional expansion turbine. Steady 3-D Reynolds-Averaged Navier-Stokes (RANS) simulations were performed to investigate the influence of tip leakage flow on the inlet conditions and on the flow field and heat transfer characteristics of the stator. The shear-stress transport (SST) k-ω turbulence model was used in the steady simulation. The model was validated by using the experimental data of Qureshi et al. [14].

2. Numerical Methods

2.1. Turbine in Study and Boundary Conditions

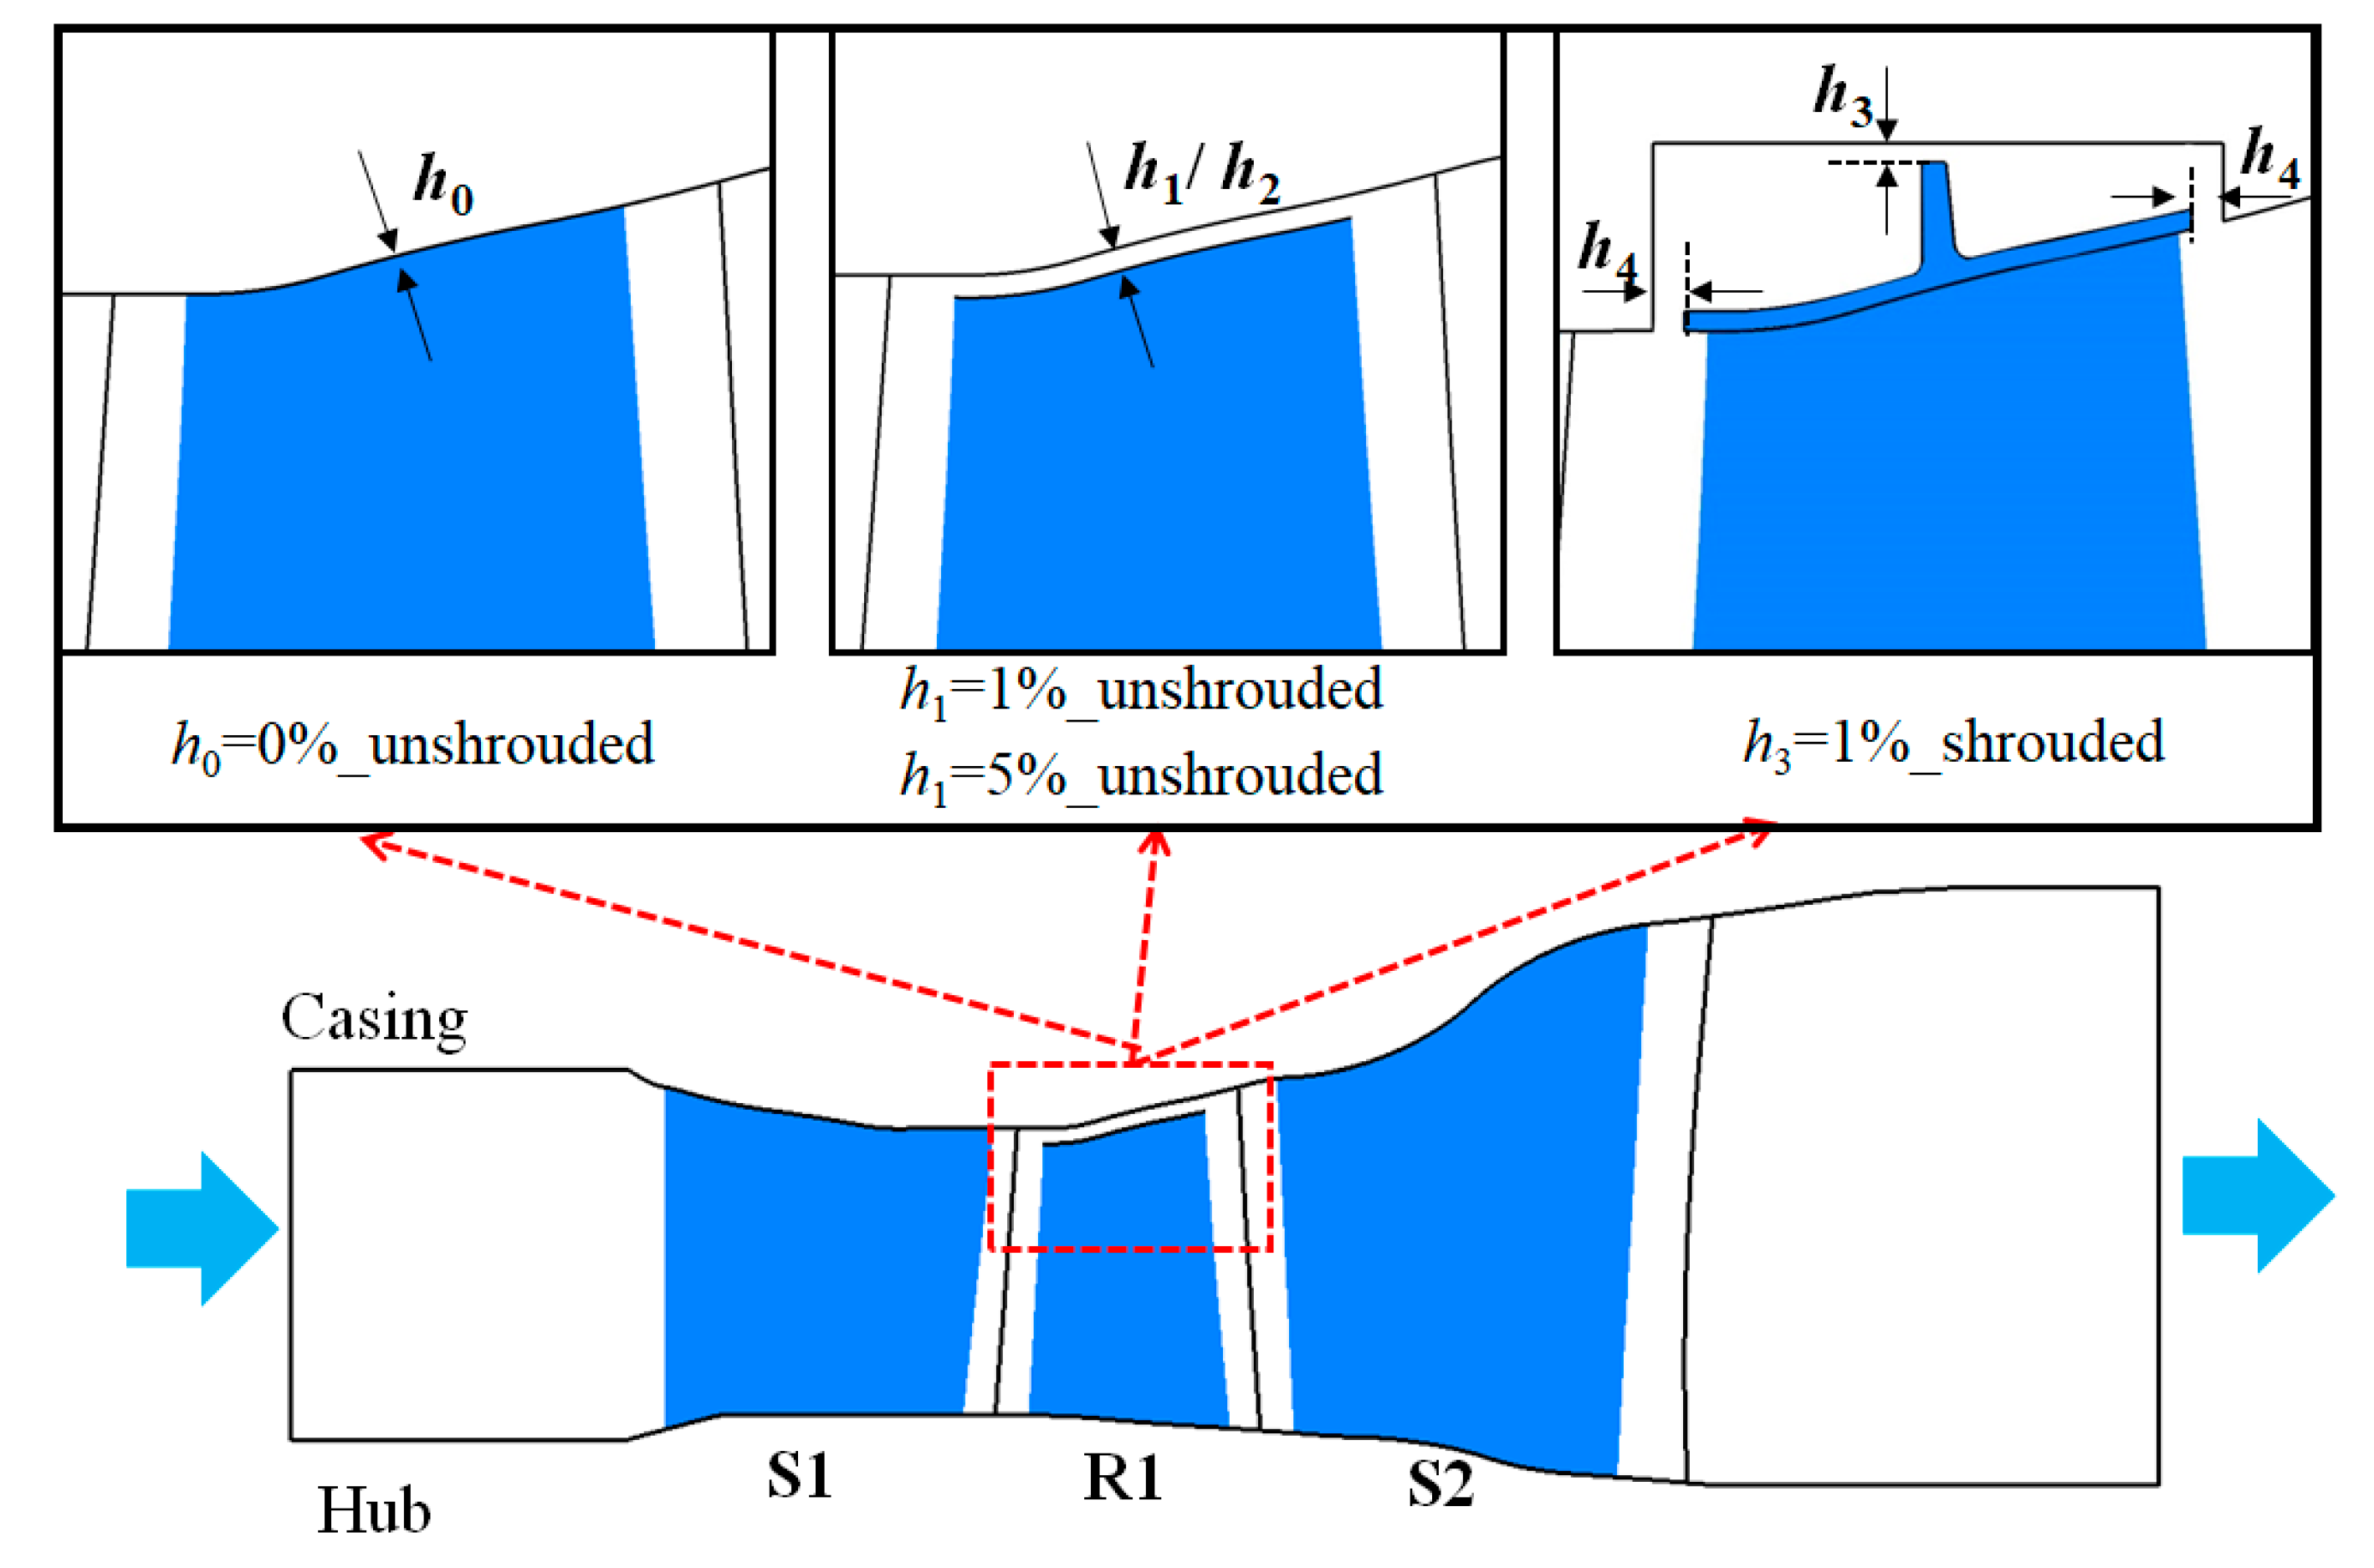
A 1.5-stage large meridional expansion high-pressure turbine was selected for this research, as this turbine has been used in a certain type of marine gas turbine. The numerical simulation condition in this turbine is the working condition, and transonic exists locally. Figure 1 shows the section diagram of its meridian passage, where S1 and R1 are the first-stage guide vane and rotor, respectively, and S2 is the second-stage stator. The obvious feature of S2 is the large meridian expansion. Its average shroud expansion angle, α1, is 22° and hub expansion angle, α2, is 13°. As part of this study, the aerodynamic experimental study of S2 under low working conditions was completed [15].
The detailed parameters and boundary conditions of 1.5-stage turbines are given in Table 1. In order to ensure the stability of the incoming flow, the inlet and outlet are given enough extension sections. The inlet is given the total temperature and pressure, and the outlet is given the static pressure. For wall heat transfer boundary conditions, the temperature ratio (Tg/Tw) between gas temperature and isothermal wall temperature was set as 1.5. This ratio is not random, but is based on relevant research. In the study of Qureshi et al. [14] and Ameni et al. [16], specific studies of this ratio are given. Non-adiabatic heat transfer numerical simulation models usually use isothermal wall conditions, and the wall temperature depends on the heat transfer between the wall and the main flow. However, in cases where the wall temperature does not change much, Nu is generally considered to be independent of the wall temperature. Except for periodic boundaries, other walls use non-slip boundary conditions. The Mach number range is 0.32 to 1.13.

2.2. Numerical Solver and Mesh

In this paper, a high performance computational fluid dynamics (CFD) software tool ANSYS CFX 17.0 (AEA [17]) was used for the numerical calculation. CFX adopts the finite volume method, based on the finite element method, to deduce the fully implicit multi-grid coupling algorithm, which has excellent convergence performance and numerical accuracy. The Reynolds-averaged Navier-Stokes equations, in generalized coordinates, were solved by the finite volume space dispersion technique. The flow equation, turbulent kinetic energy equation, and specific dissipation rate equation were discretized by the spatial high resolution second-order windward scheme and the time-order inverse Euler scheme. In the present computations, the fluid was set as a single component of the ideal air with a constant specific heat ratio, γ = 1.4. The heat transfer model uses total energy.
The heat transfer coefficient (HTC) is mainly affected by the flow state of the near-wall, so the near-wall turbulence model has a great influence on the prediction accuracy of the wall heat transfer coefficient. Many studies [18,19,20] have shown that the shear-stress transport (SST) k-ω turbulence model is particularly capable of simulating the complex flow characteristics of impeller machinery. Zuckerman et al. [21,22] conducted a detailed analysis of the advantages and disadvantages of the k-ε, k-ω, SST, and v2-f models where it was found that the SST model combines the advantages of the far-wall k-ε model and near-wall k-ω model. The SST model uses the variant equation to determine turbulence viscosity [23], which is more accurate in predicting adverse pressure gradient turbulence. Moreover, when compared with the model of k-ε and v2-f, the SST model is more accurate for predicting the heat transfer coefficient of a wall caused by a secondary flow. Therefore, the SST turbulence model was adopted for numerical simulation in this paper.
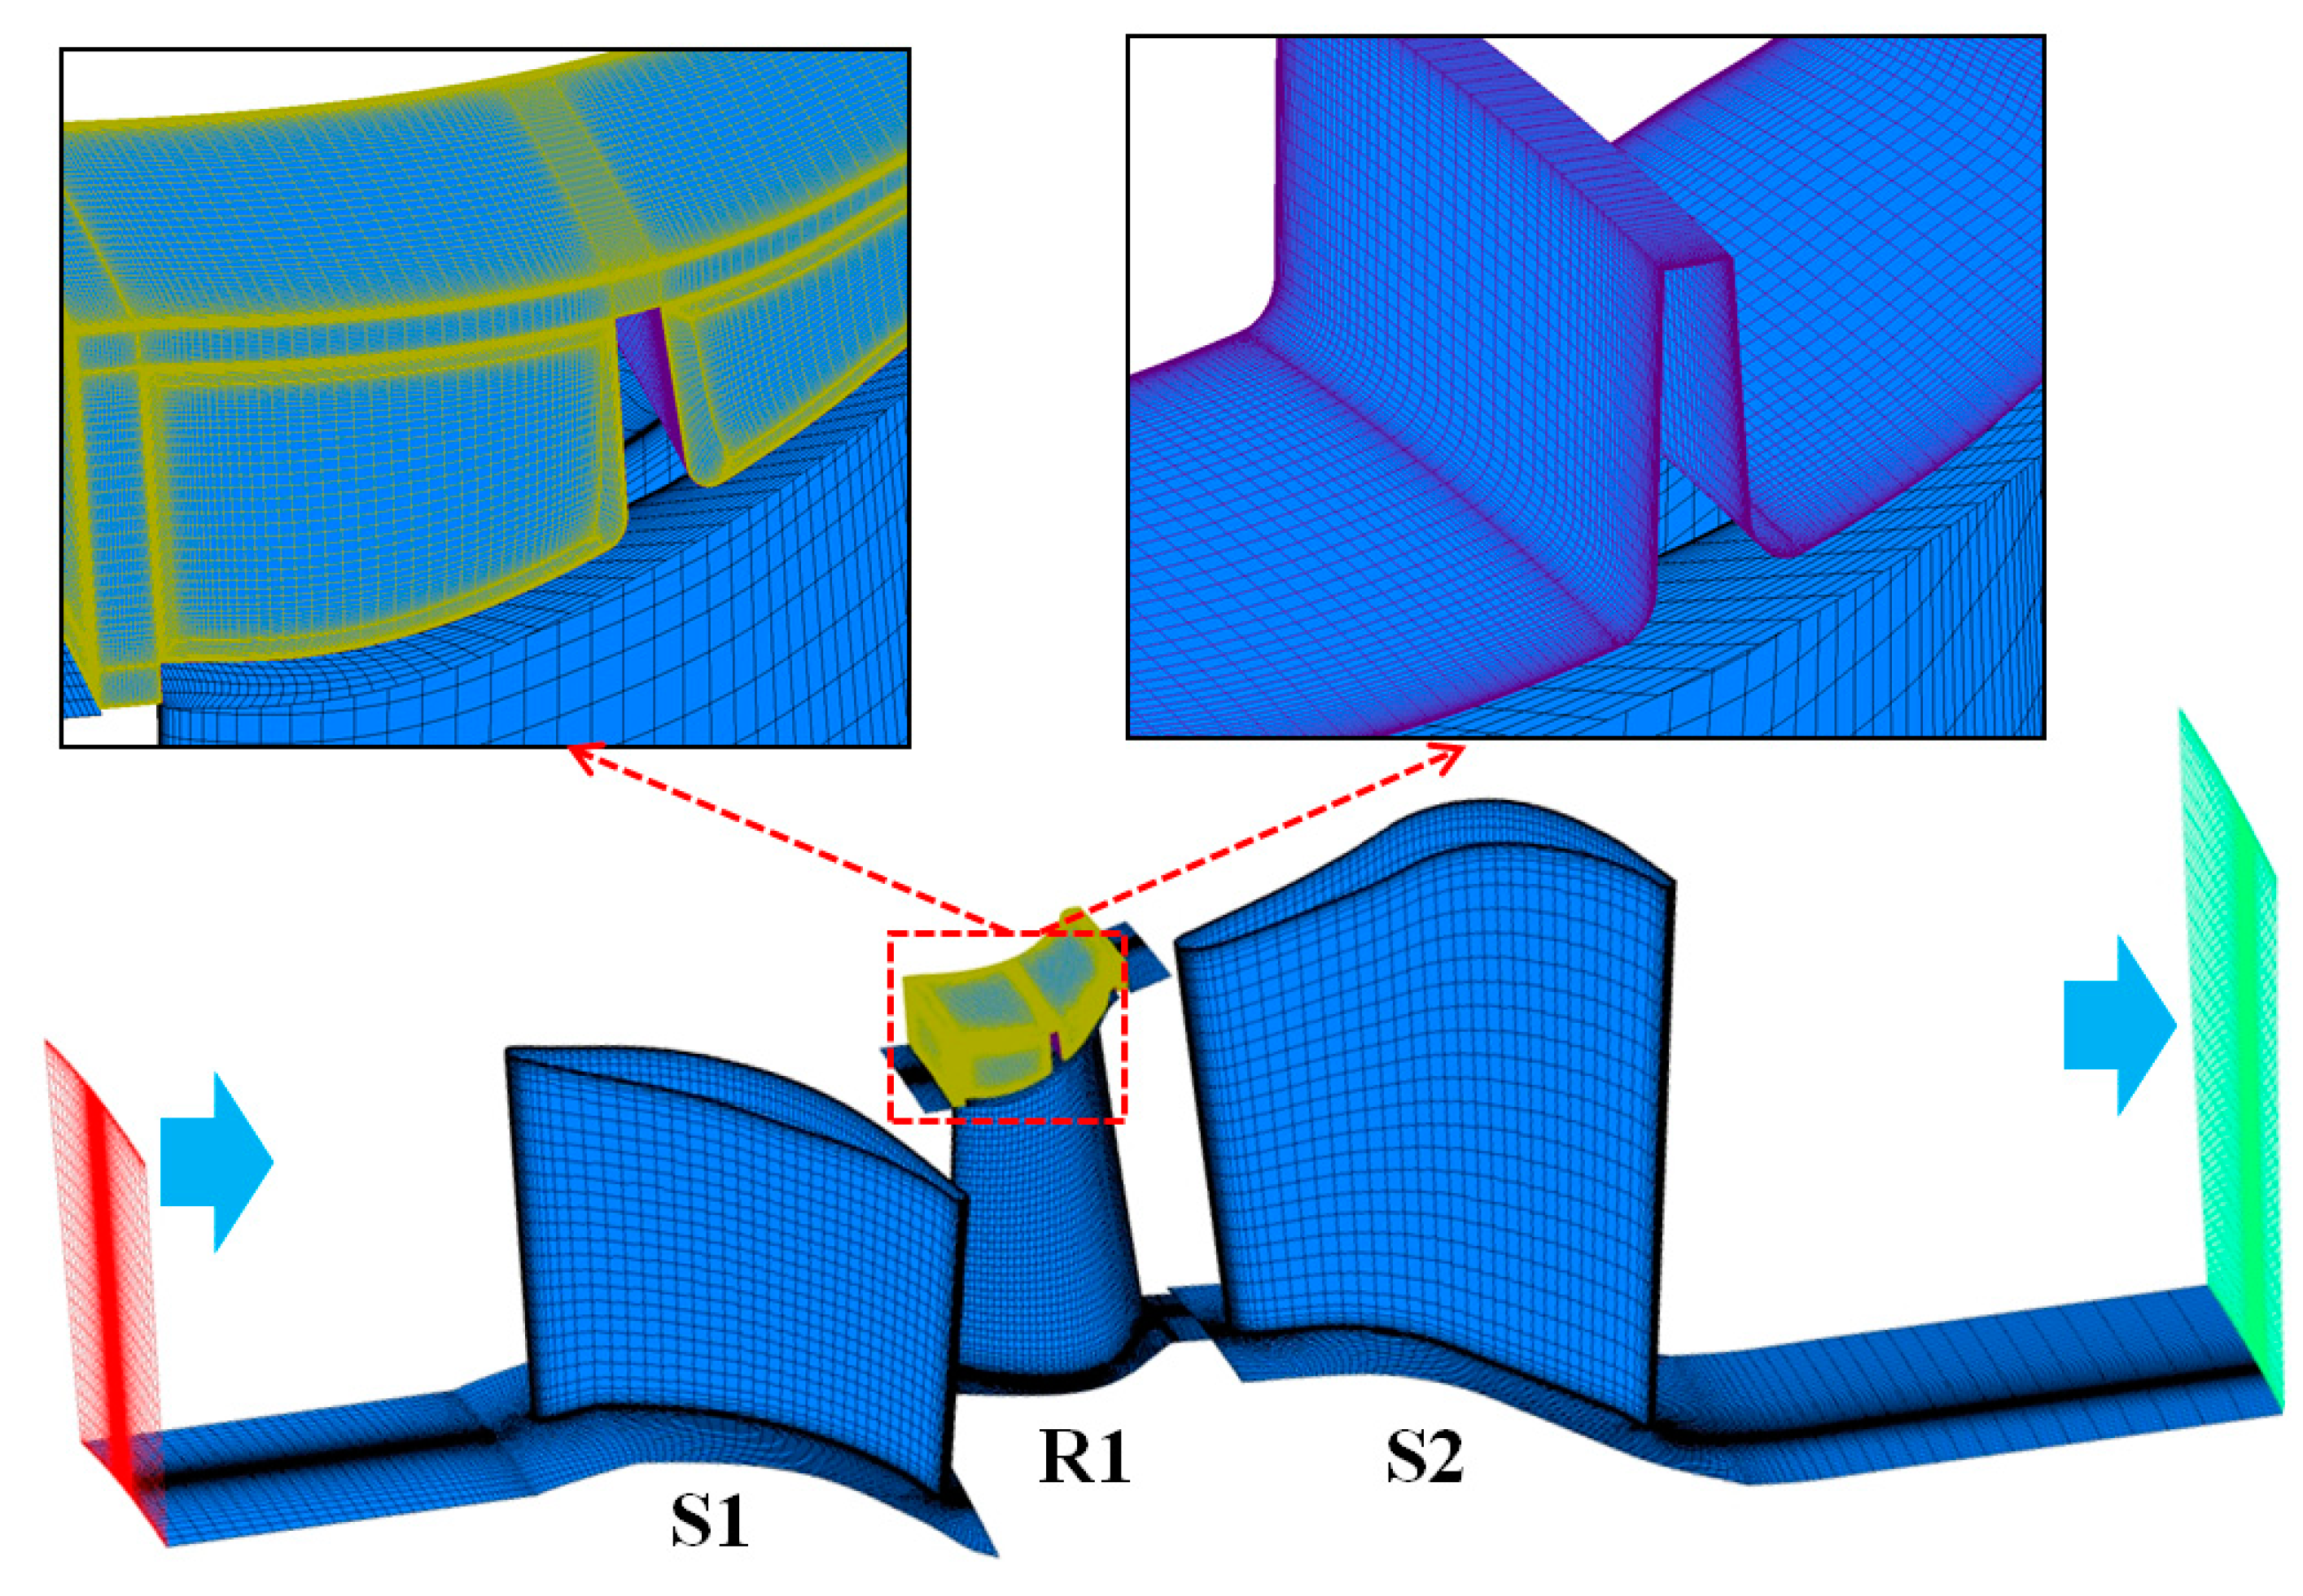
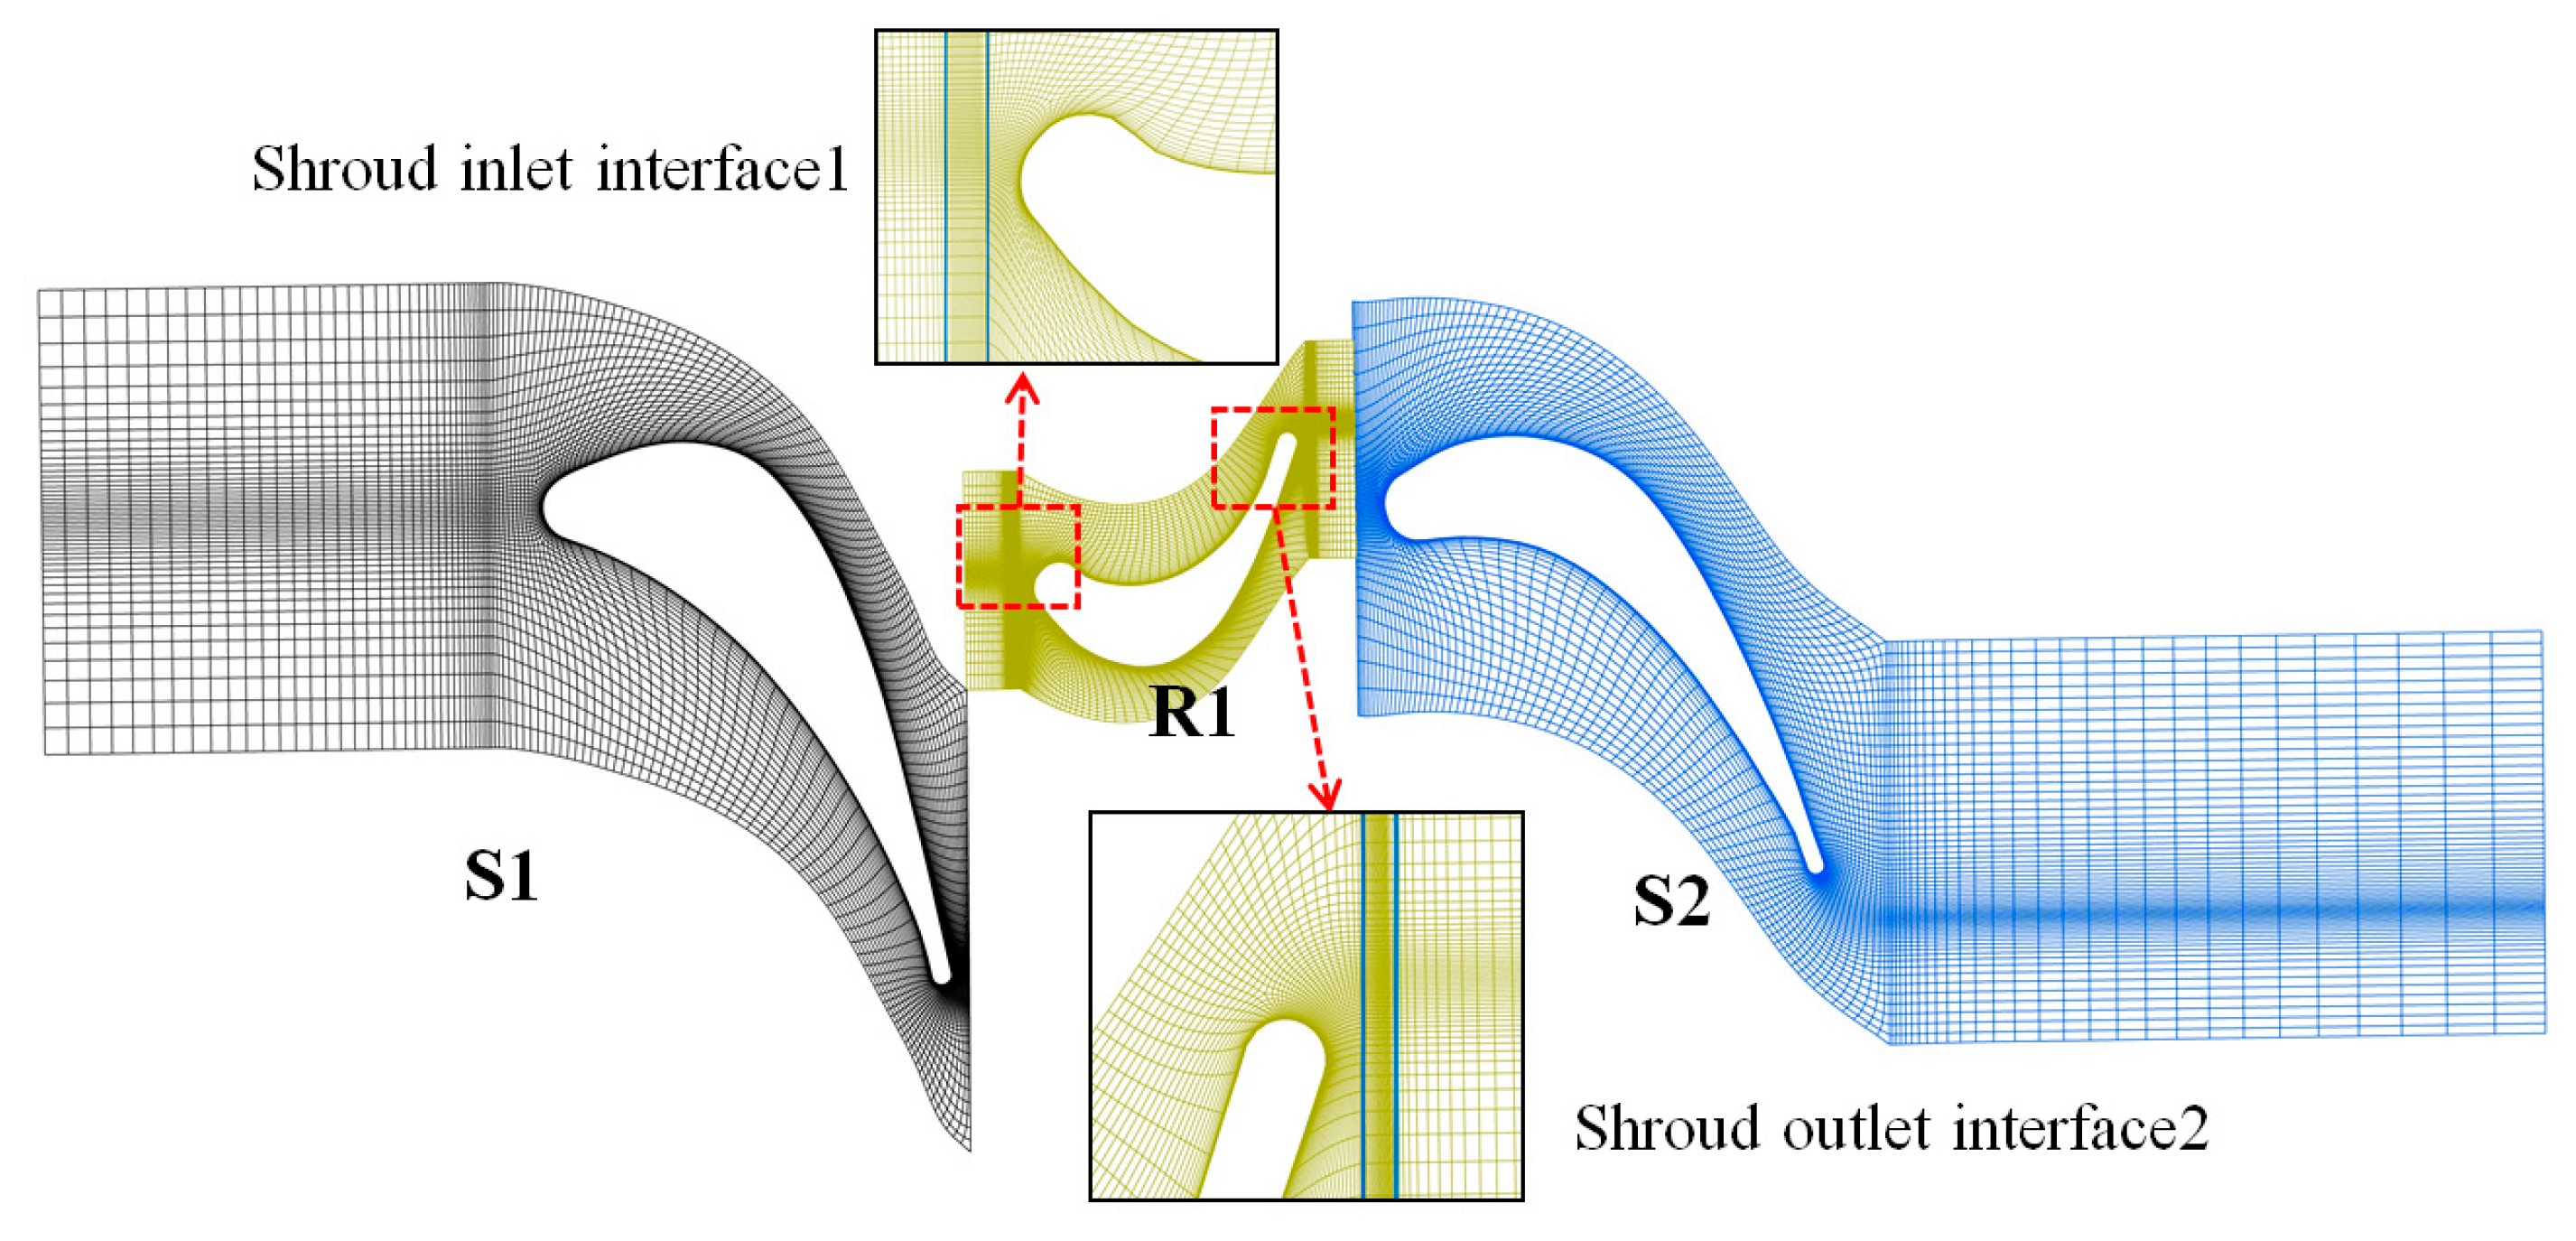
The geometric models and the generation of grid models were accomplished through the high-performance software package Autogrid5 (NUMECA’s preprocessor). Figure 2 shows the 1.5-stage turbine grid diagram of S2 with shroud. The grid topology of S2 is shown in Figure 3. The boundary layer mesh of the shroud is encrypted, as shown in the enlarged image. The location of boundary layer adopts a 20-layer grid. The total number of meshes in the shroud is 1.5 million. The inner O-type grid and outer H-type grid were used to improve the quality of the whole grid considering that the labyrinth seal is connected to the top of the rotor through the interface, and the geometrical shape of the seal determines that it can only use the h-type grid. In the study by [24], the HTC was studied in detail on a blade similar to S2, indicating that the use of a 20-layer grid near the wall surface could meet the requirements of boundary layer capture. In this paper, the near-wall surface was divided into 20 points by the same method. The final grid used a total of 12 million cells. To maintain that the average non-dimensional near-wall distance of y plus value was less than 1, the first cell height at the surface was set as 0.2 μm. All cases in this article use the same grid topology.
The convergence criterion of numerical simulation in this paper was used to reduce the RMS residual to less than 10−5, and the mass flow difference at the inlet and outlet of the model to less than 0.1%. If the change of isentropic efficiency was less than 0.01% in 10 consecutive iterations, the solution was judged as converged.
The mesh independence was verified by comparing the total pressure loss coefficient (Cp) and the area-averaged shroud heat flux of S2 under different grid node numbers. The results of different grids are shown in Table 2. Compared with Mesh-2, the Cp of the densified Mesh-3 decreased by about 0.02%, and the area-averaged shroud heat flux decreased by about 0.6%. Therefore, the total number of mesh nodes for all cases in this article was set between 12 million and 13 million.
The total pressure loss coefficient of S2 is defined as:
C p = ( p ¯ t , i n p ¯ t , o u t ) / ( p ¯ t , o u t p ¯ s , o u t ) ,
where p ¯ t , i n is the average total pressure at the interface between R1 and S2; p ¯ t , o u t is the average total pressure at the outlet; and p ¯ s , o u t is the average static pressure at the outlet.

2.3. Experimental Validation of Numerical Models

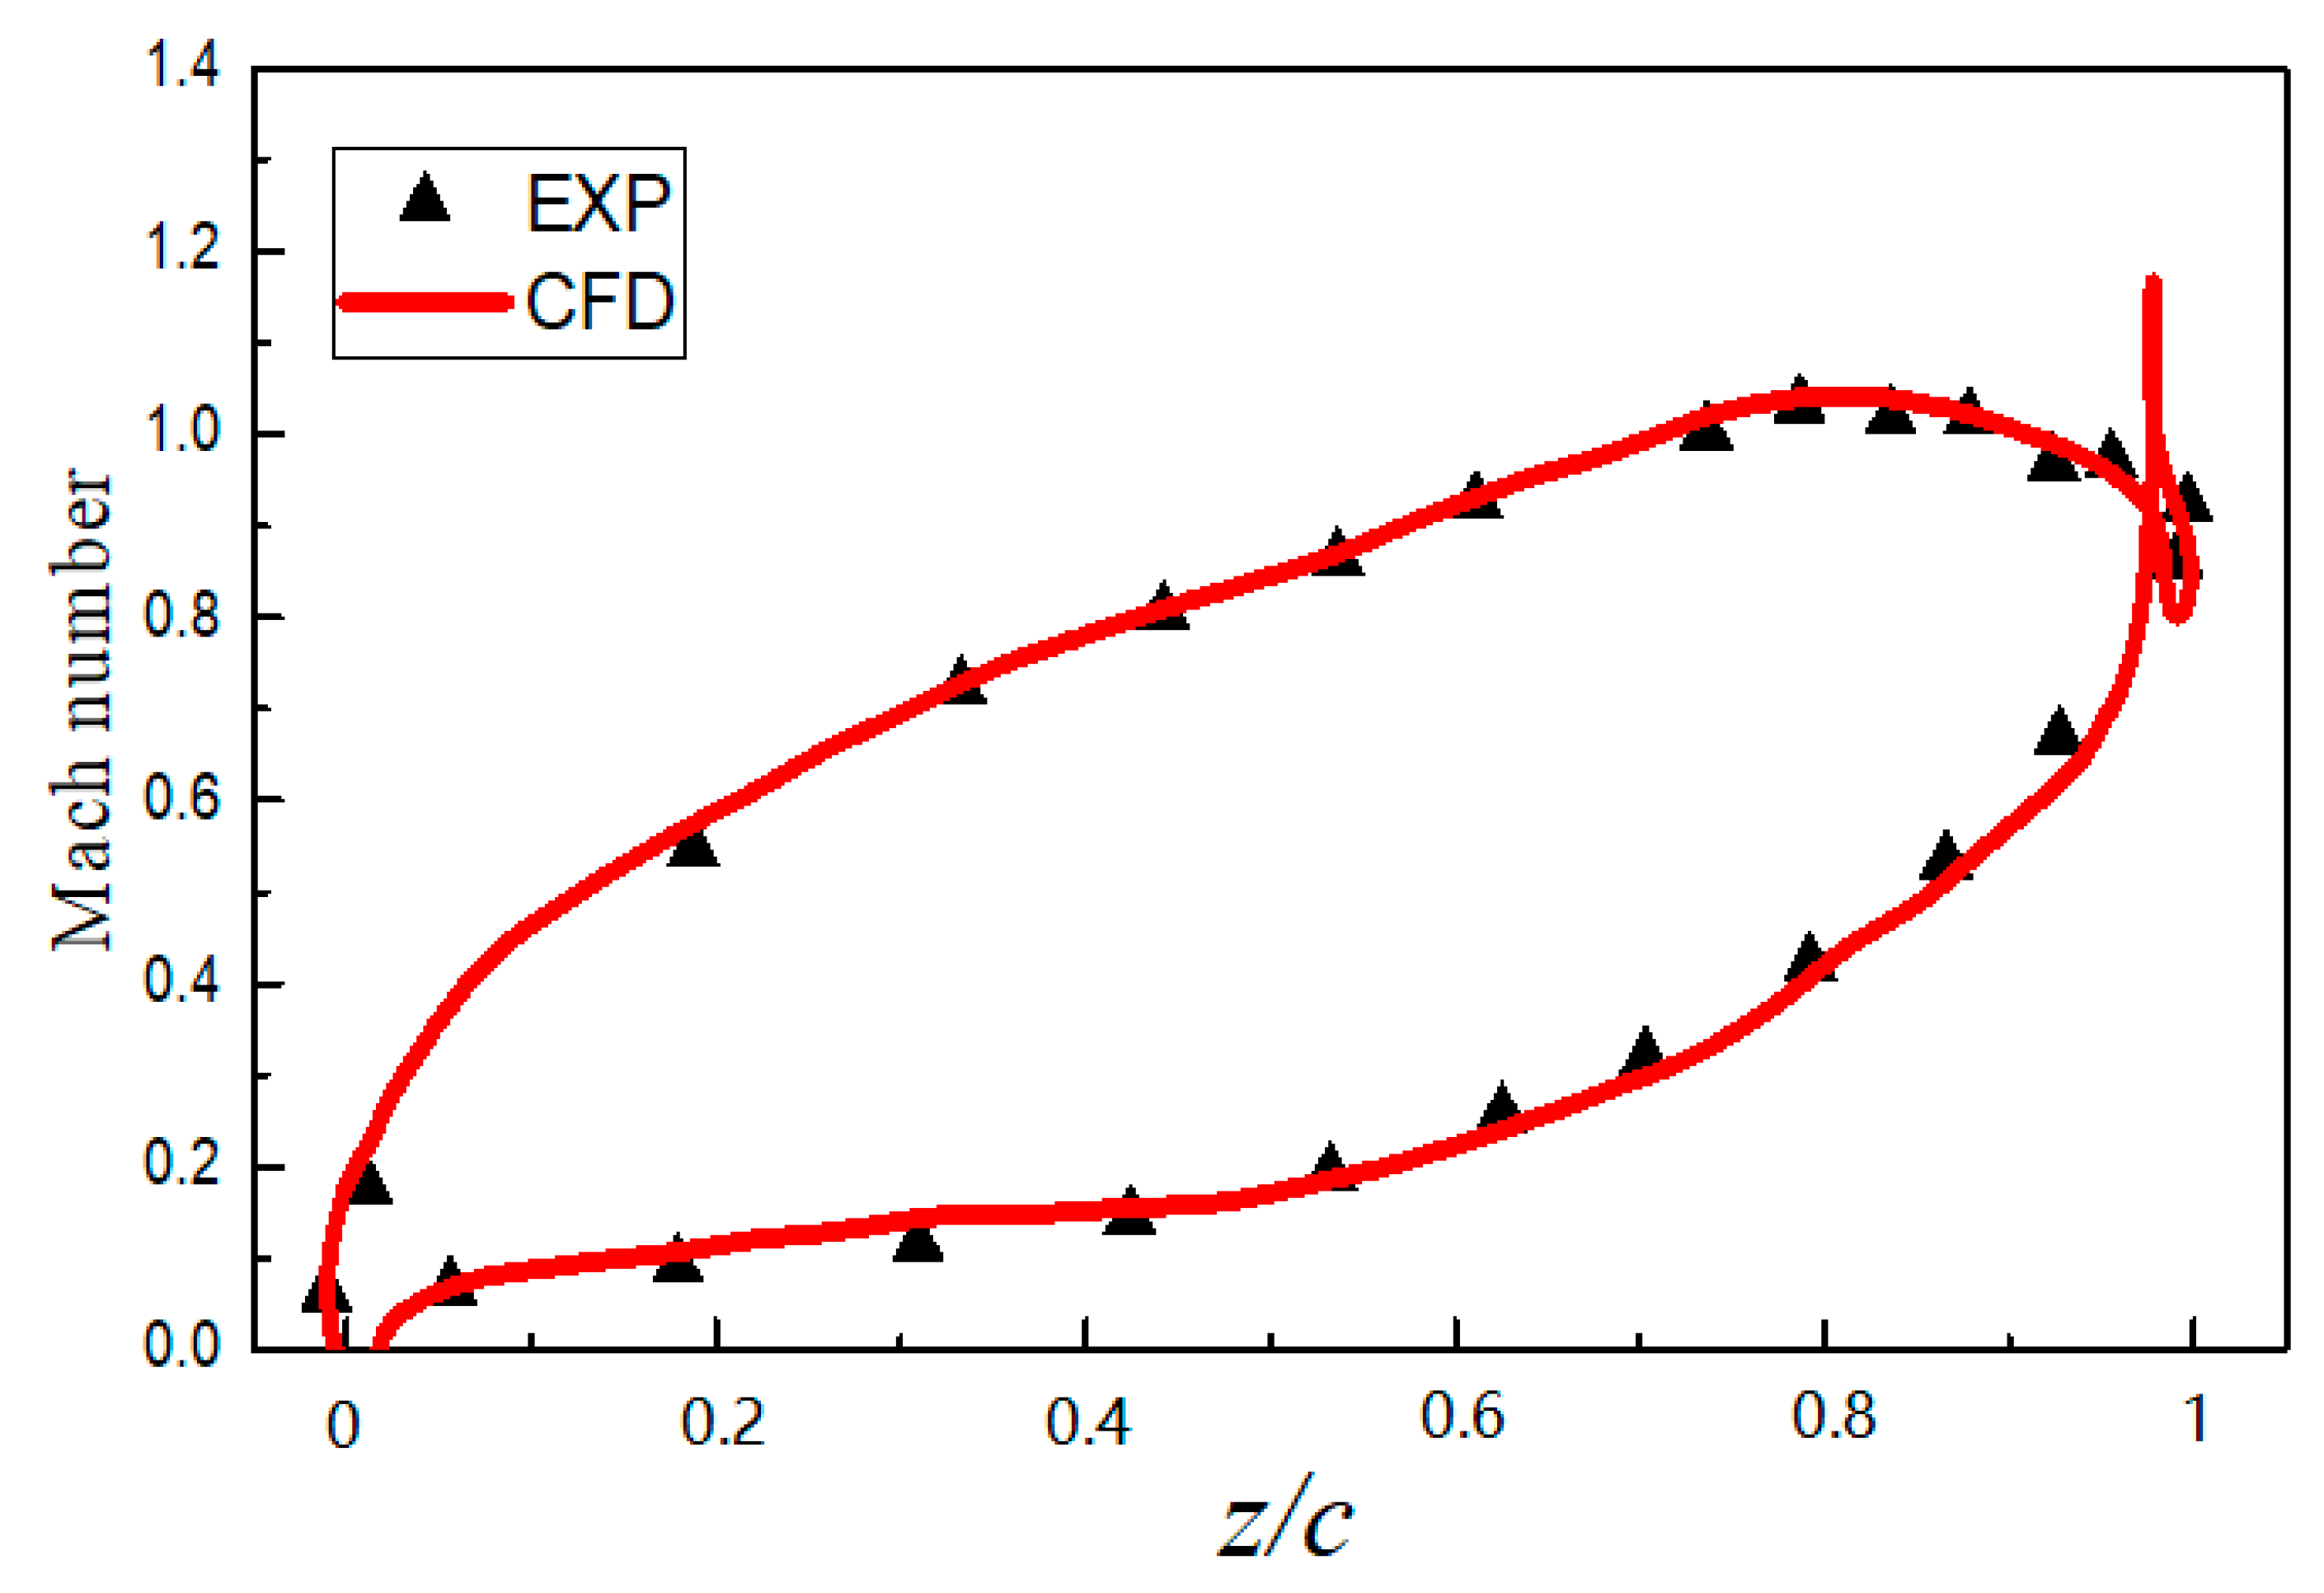
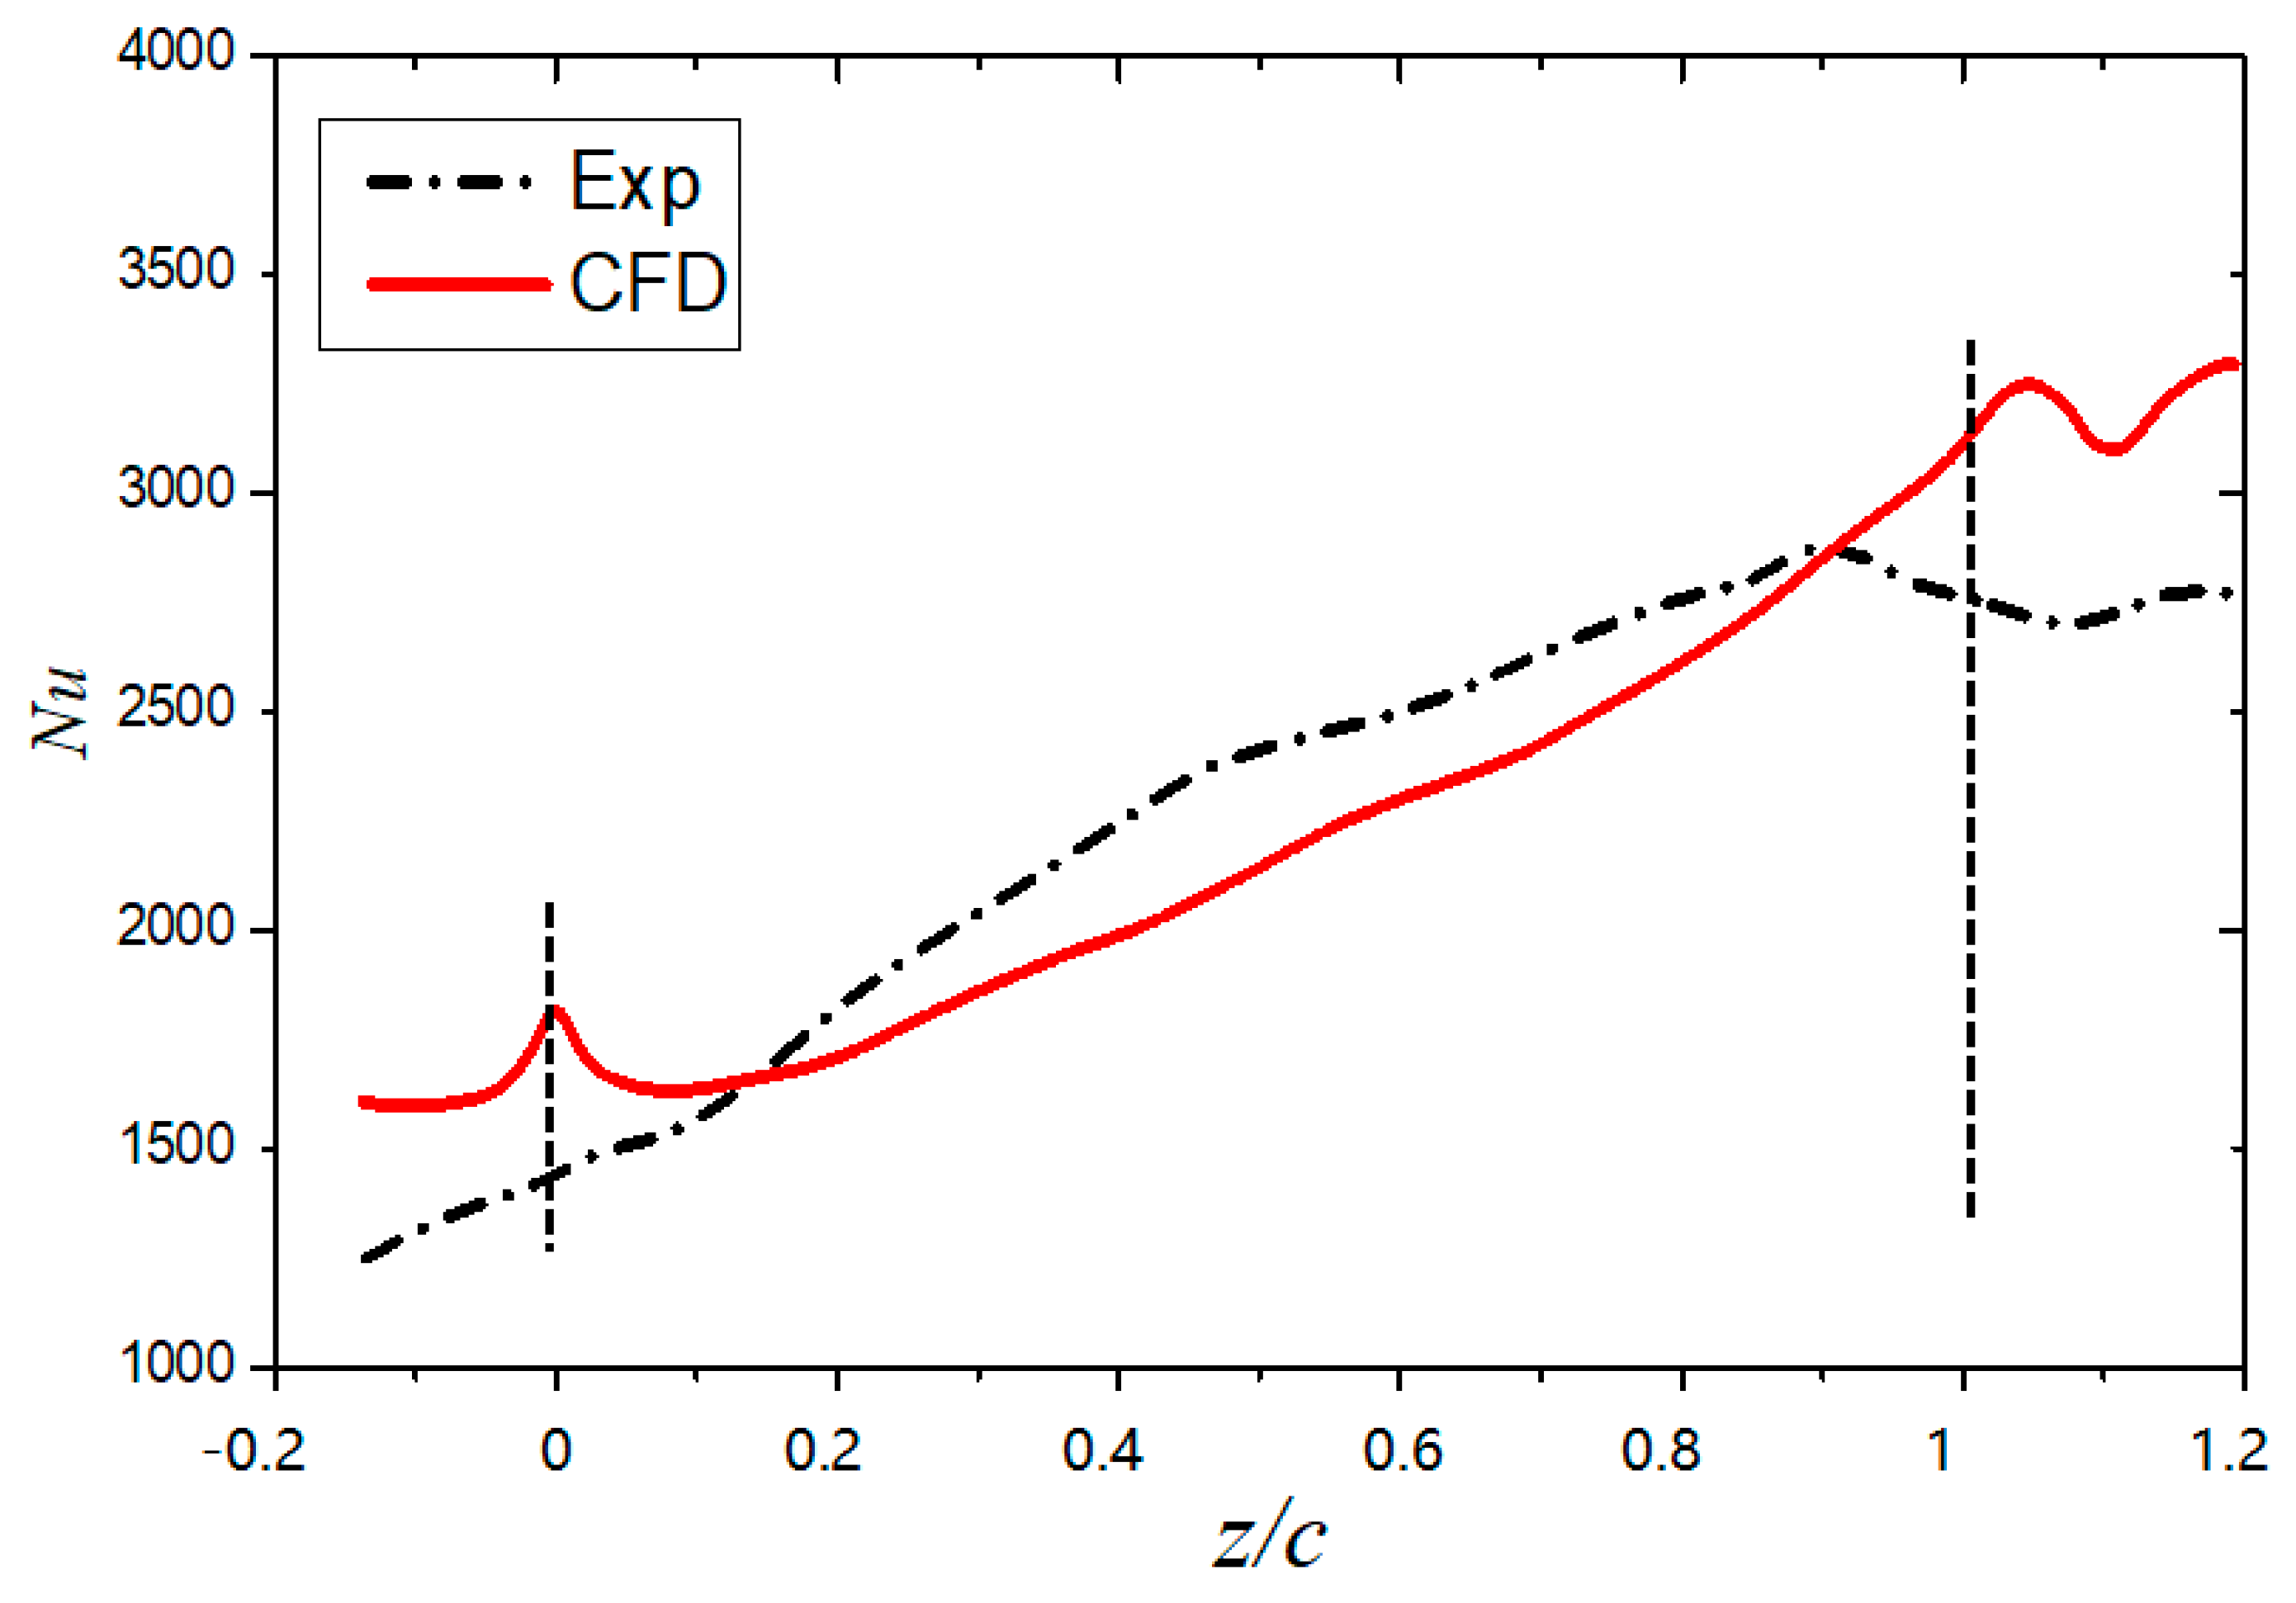
Regarding the experimental research on large meridional expansion stators, no relevant experiments have been published in the present papers. Furthermore, in the existing literature, the accuracy of the numerical calculation can be verified by verifying the experimental results of similar blades. It is feasible to predict the accuracy of numerical calculation through qualitative comparison [25]. Qureshi et al. [14], from Oxford University, carried out aerodynamics and heat transfer experiments and predictions in the MT1 turbine blades, and the shape and working condition of the MT1 turbine are very similar to the S2 blade in this study. By comparing the numerical simulation data with this experimental data, a reasonable calculation accuracy can be obtained. The turbine testing device used in this study was an engine scale, short duration, rotating transonic turbine, in which the aerodynamic and heat transfer dimensionless parameters matched the engine conditions. Therefore, this paper used the MT1 turbine data of Qureshi et al. to verify the numerical calculations. Since the focus of this study was the large meridional expansion effect of the stator, the Mach number of the blade near the endwall and Nu distribution of the endwall were compared. The numerical simulation of the MT1 turbines adopted the same mesh number, the same mesh topology, and the same turbulence model (SST) as the S2 model in this study. Figure 4 compares the isentropic Mach number of the simulated data and experimental data at a 90% blade height, using the same numerical simulation method. Figure 5 shows the Nu number comparison of the shroud. It can be seen that the numerical simulation method in this paper could well predict the isentropic Mach number distribution of the blade, except for the trailing edge fluctuation. For the simulation of Nu distribution in the shroud, the difference between the numerical data and the experimental data was 9.62%. The numerical simulation method was accurate in predicting the heat transfer trend of the shroud, and the difference between the leading edge and trailing edge was reasonable, in theory. For the heat transfer error, the heat transfer prediction in this paper was reasonable. In conclusion, considering the uncertainty of the experiment, the numerical simulation method adopted in this paper was reasonable for predicting the flow and heat transfer.

2.4. Gap Configuration

In this paper, four calculation models for different tip clearances of R1 were designed. The specific design parameters are shown in Table 3. In Case 0, the tip clearance of R1 was set as 0% of the blade height and the clearance size was 0 mm. This is not a real condition, and was used only for comparative research. In Case 1, the tip clearance of R1 was set as 1% of the blade height and the clearance size was 6 mm. The clearance size of the second case is the actual working condition. In Case 2, the tip clearance of R1 was set as 5% of the blade height and the clearance size was 2.9 mm. The clearance in Case 2 was much larger than the real condition to fully expose the impact of the clearance. The tip clearance was constant along the radial direction. In Case 3, the tip clearance size of the shrouded R1 was set as 1% of the blade height and the shroud inlet and outlet size were set as 2% of the blade height. The meridional view of the configuration is shown in Figure 6.

3. Results and Discussion

3.1. Secondary Flow in S2

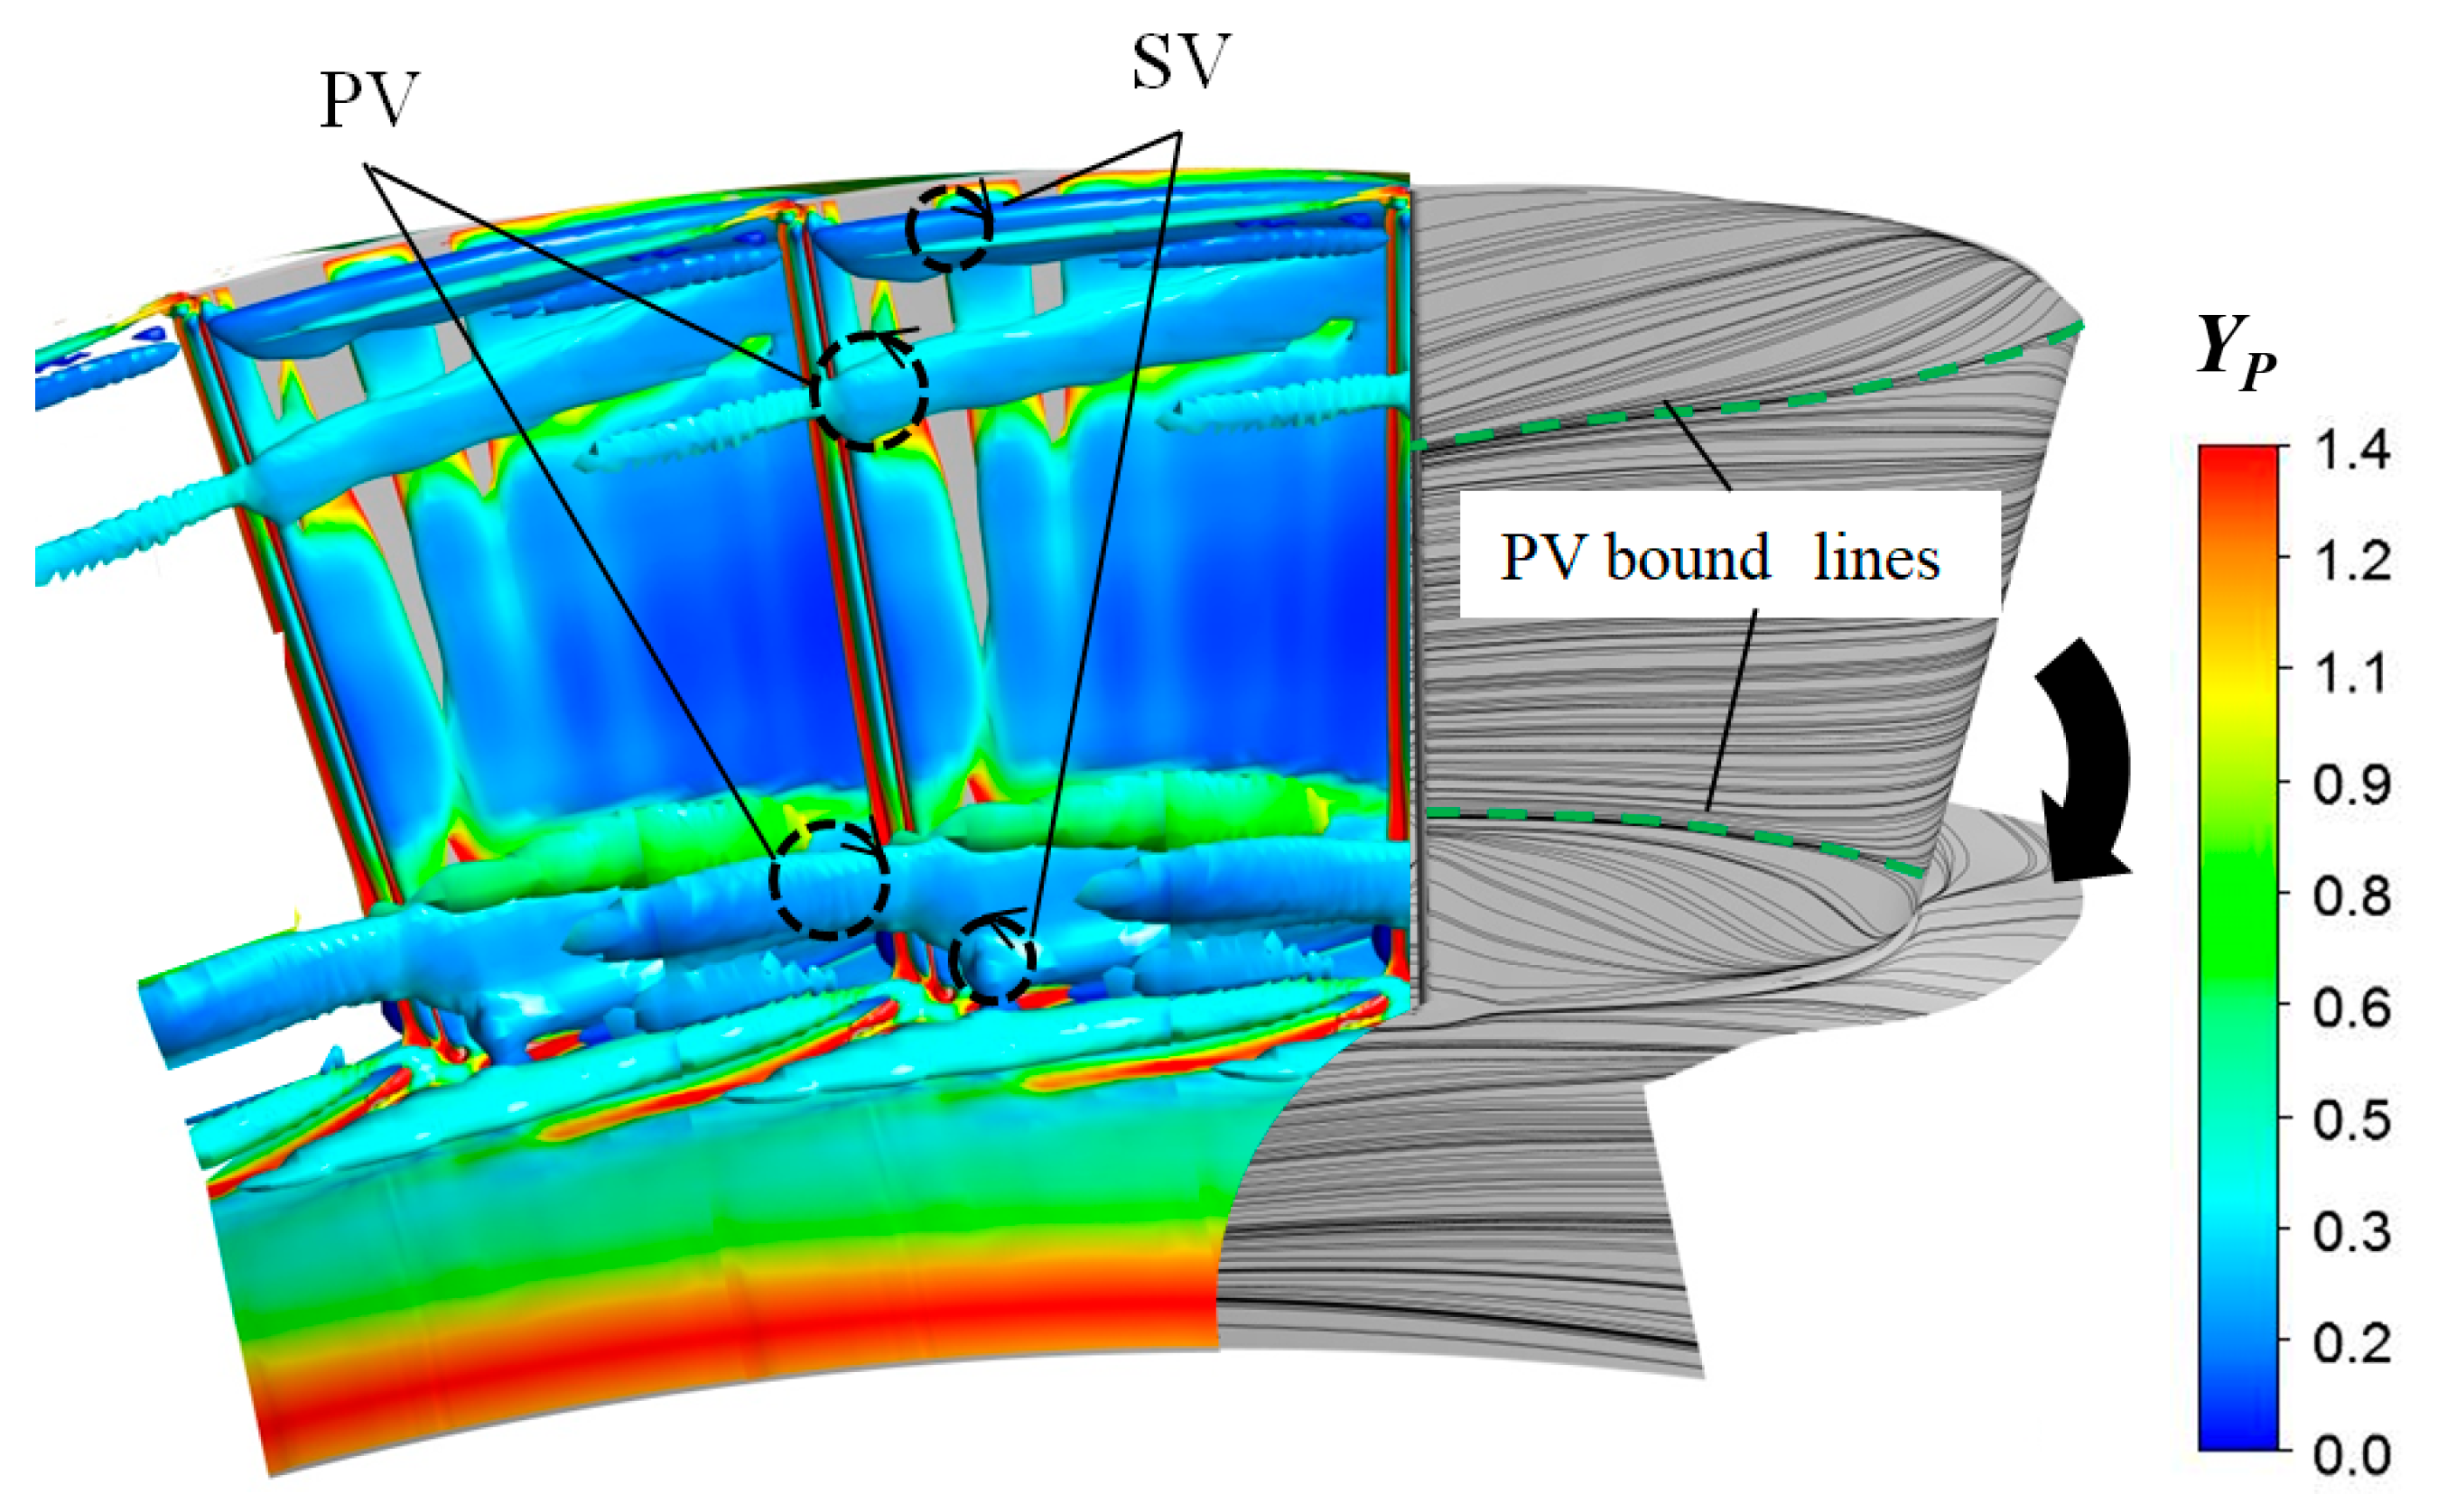
As the research aim of this paper was to study the influence of the tip clearance of R1 on the flow and heat transfer characteristics of S2, it was necessary to first analyze the vortex structure of S2 without the clearance model. The S2 channel has a large meridional expansion, which leads to a greater secondary flow loss. In order to display its vortex system, the following vortex core display method was adopted in this paper: The Q-criterion. Hunt et al. [26] defined a vortex core as a connected region with a positive second invariant (Q > 0) of the gradient of the velocity (∇ c ). The physical interpretation of the vortex core is that the size of vorticity is greater than the size of strain rate, and is written as:
Q = 1 2 u i , j u i , j = 1 2 ( Ω 2 S 2 ) ,
where Ω and S are the rotation and strain tensors. Figure 7 shows the isosurface of vortical structures for the h0 = 0%_unshrouded case using the Q-criterion. The relative total pressure loss coefficient colored the vortex structure. The view was set from downstream. The relative total pressure loss coefficient is defined as:
Y P = ( p ¯ t , i n p t ) / ( p ¯ t , i n p ¯ s , o u t ) ,
where p ¯ t , i n is the average relative total pressure at the inlet of S2; p t is local relative total pressure; and p ¯ s , o u t is the average static pressure at the outlet of S2.
The characteristics of secondary flow and its vortex model have been comprehensively summarized in the papers of Sieverding et al. [27] and Langston et al. [28]. It can be seen from Figure 7 that the vortex structure of the passage vortices and tailing shed vortices (SV) can be clearly identified at the S2 passage. The passage vortex is coupled with the SV and flows to the downstream blade row. The passage vortices move obviously towards the middle of S2, at the span position of the outlet. As the expansion of the casing is greater than that of the hub endwall, the upper passage vortex separation is more serious. From the exit direction, the upper passage vortex rotates counterclockwise, and the SV rotates clockwise, while the lower passage vortex and the SV move in opposite directions.
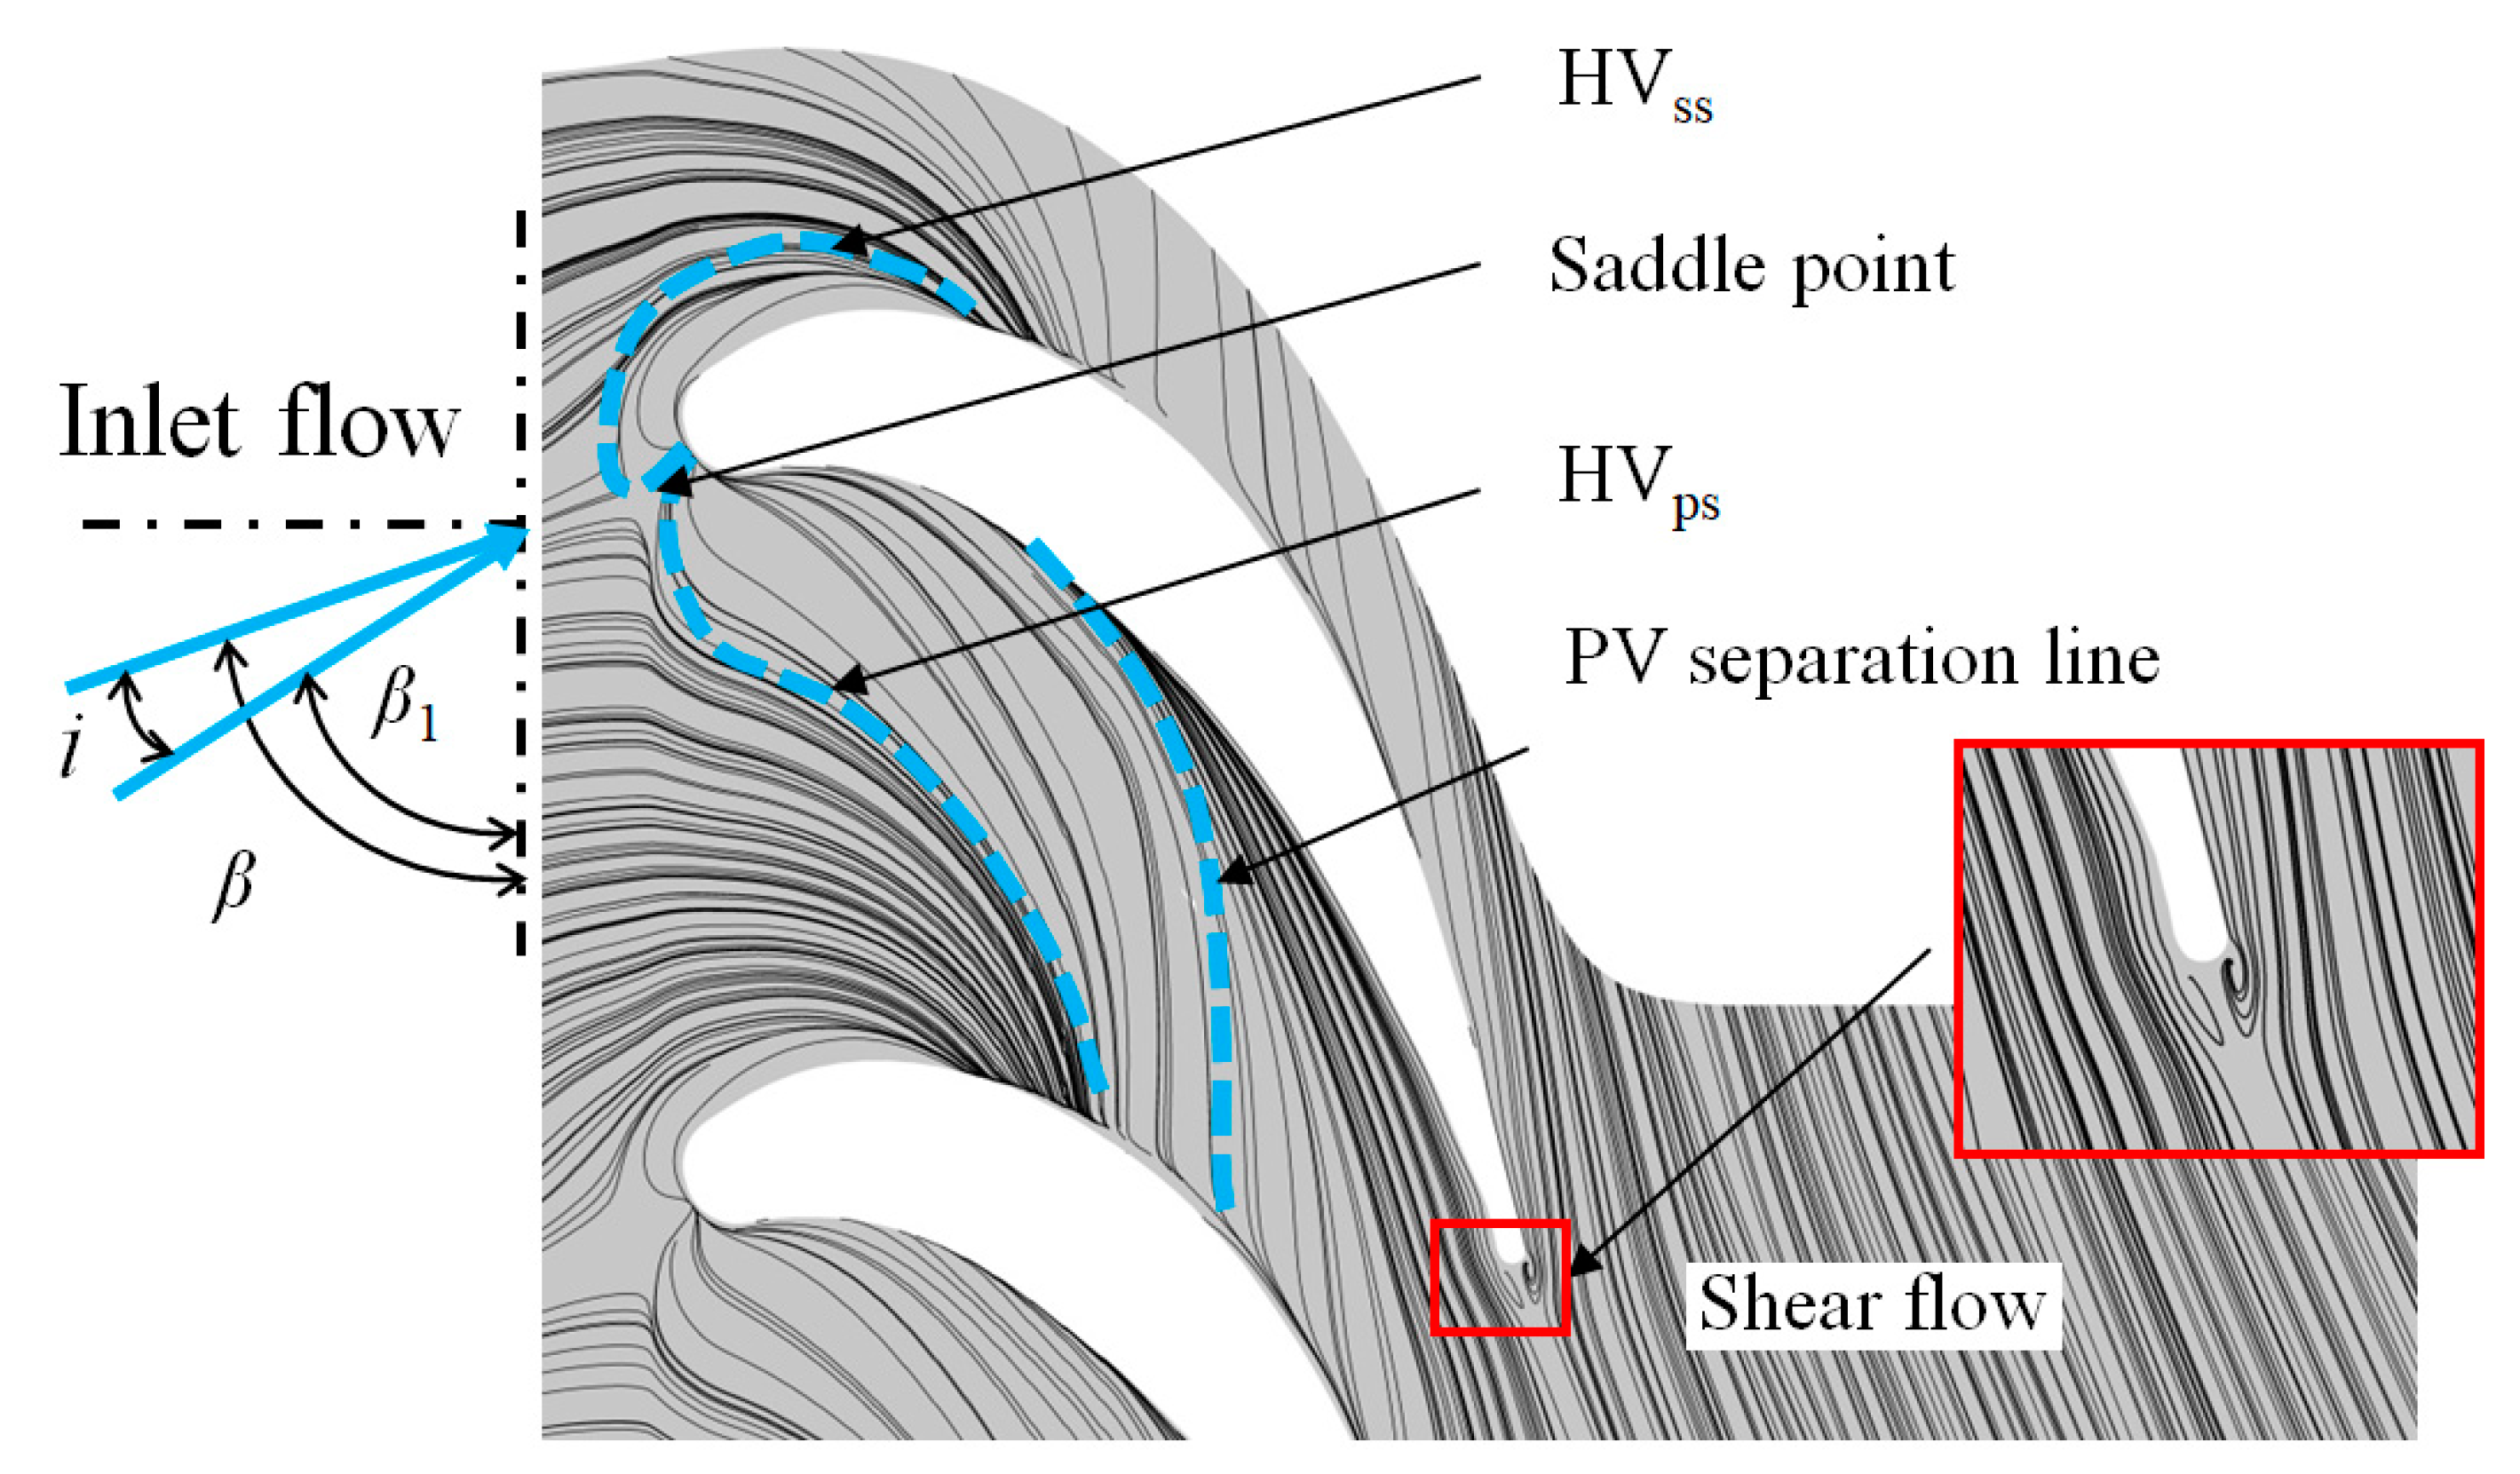
The flow characteristics of the vane and endwall directly affect endwall heat transfer. In order to understand heat transfer near the endwall, the key is to fully clarify the flow behaviors. Figure 8 shows the limiting streamline of the S2 casing. The horseshoe vortex is the main part of the cascade vortex structure system. The relevant flow phenomena are shown: The saddle point region, located in the leading edge of the vane; the separation lines of the HVps (horseshoe vortex in the PS) and HVss (horseshoe vortex in the SS); and the PV (passage vortex) and shear flow, downstream of the trailing edge.
Combining Figure 7 and Figure 8, it can be seen that the HVps started to separate at the 20% axial chord length of the S2 pressure side. The HVps flowed to the SS through the channel and reached 65% of the axial chord length. Friedrich et al. [29] of the German Aerospace Center carried out detailed experiments on the EGG transonic planar cascade, indicating that the separation of the HVps started from a 40% axial chord length and was attached to 80% of the axial chord length. Similarly, in the study of Benoit Laveau et al. [30], an experimental analysis of the turbine guide vane was conducted, and it was concluded that the HVps separated from 30% axial chord length and attached to 75% of the axial chord length. Compared with non-expansion blades, the separation and attachment point of horseshoe vortex pressure surface had an advance of 15%.

3.2. Aerodynamic Analysis of S2 with Different R1 Tip Clearance

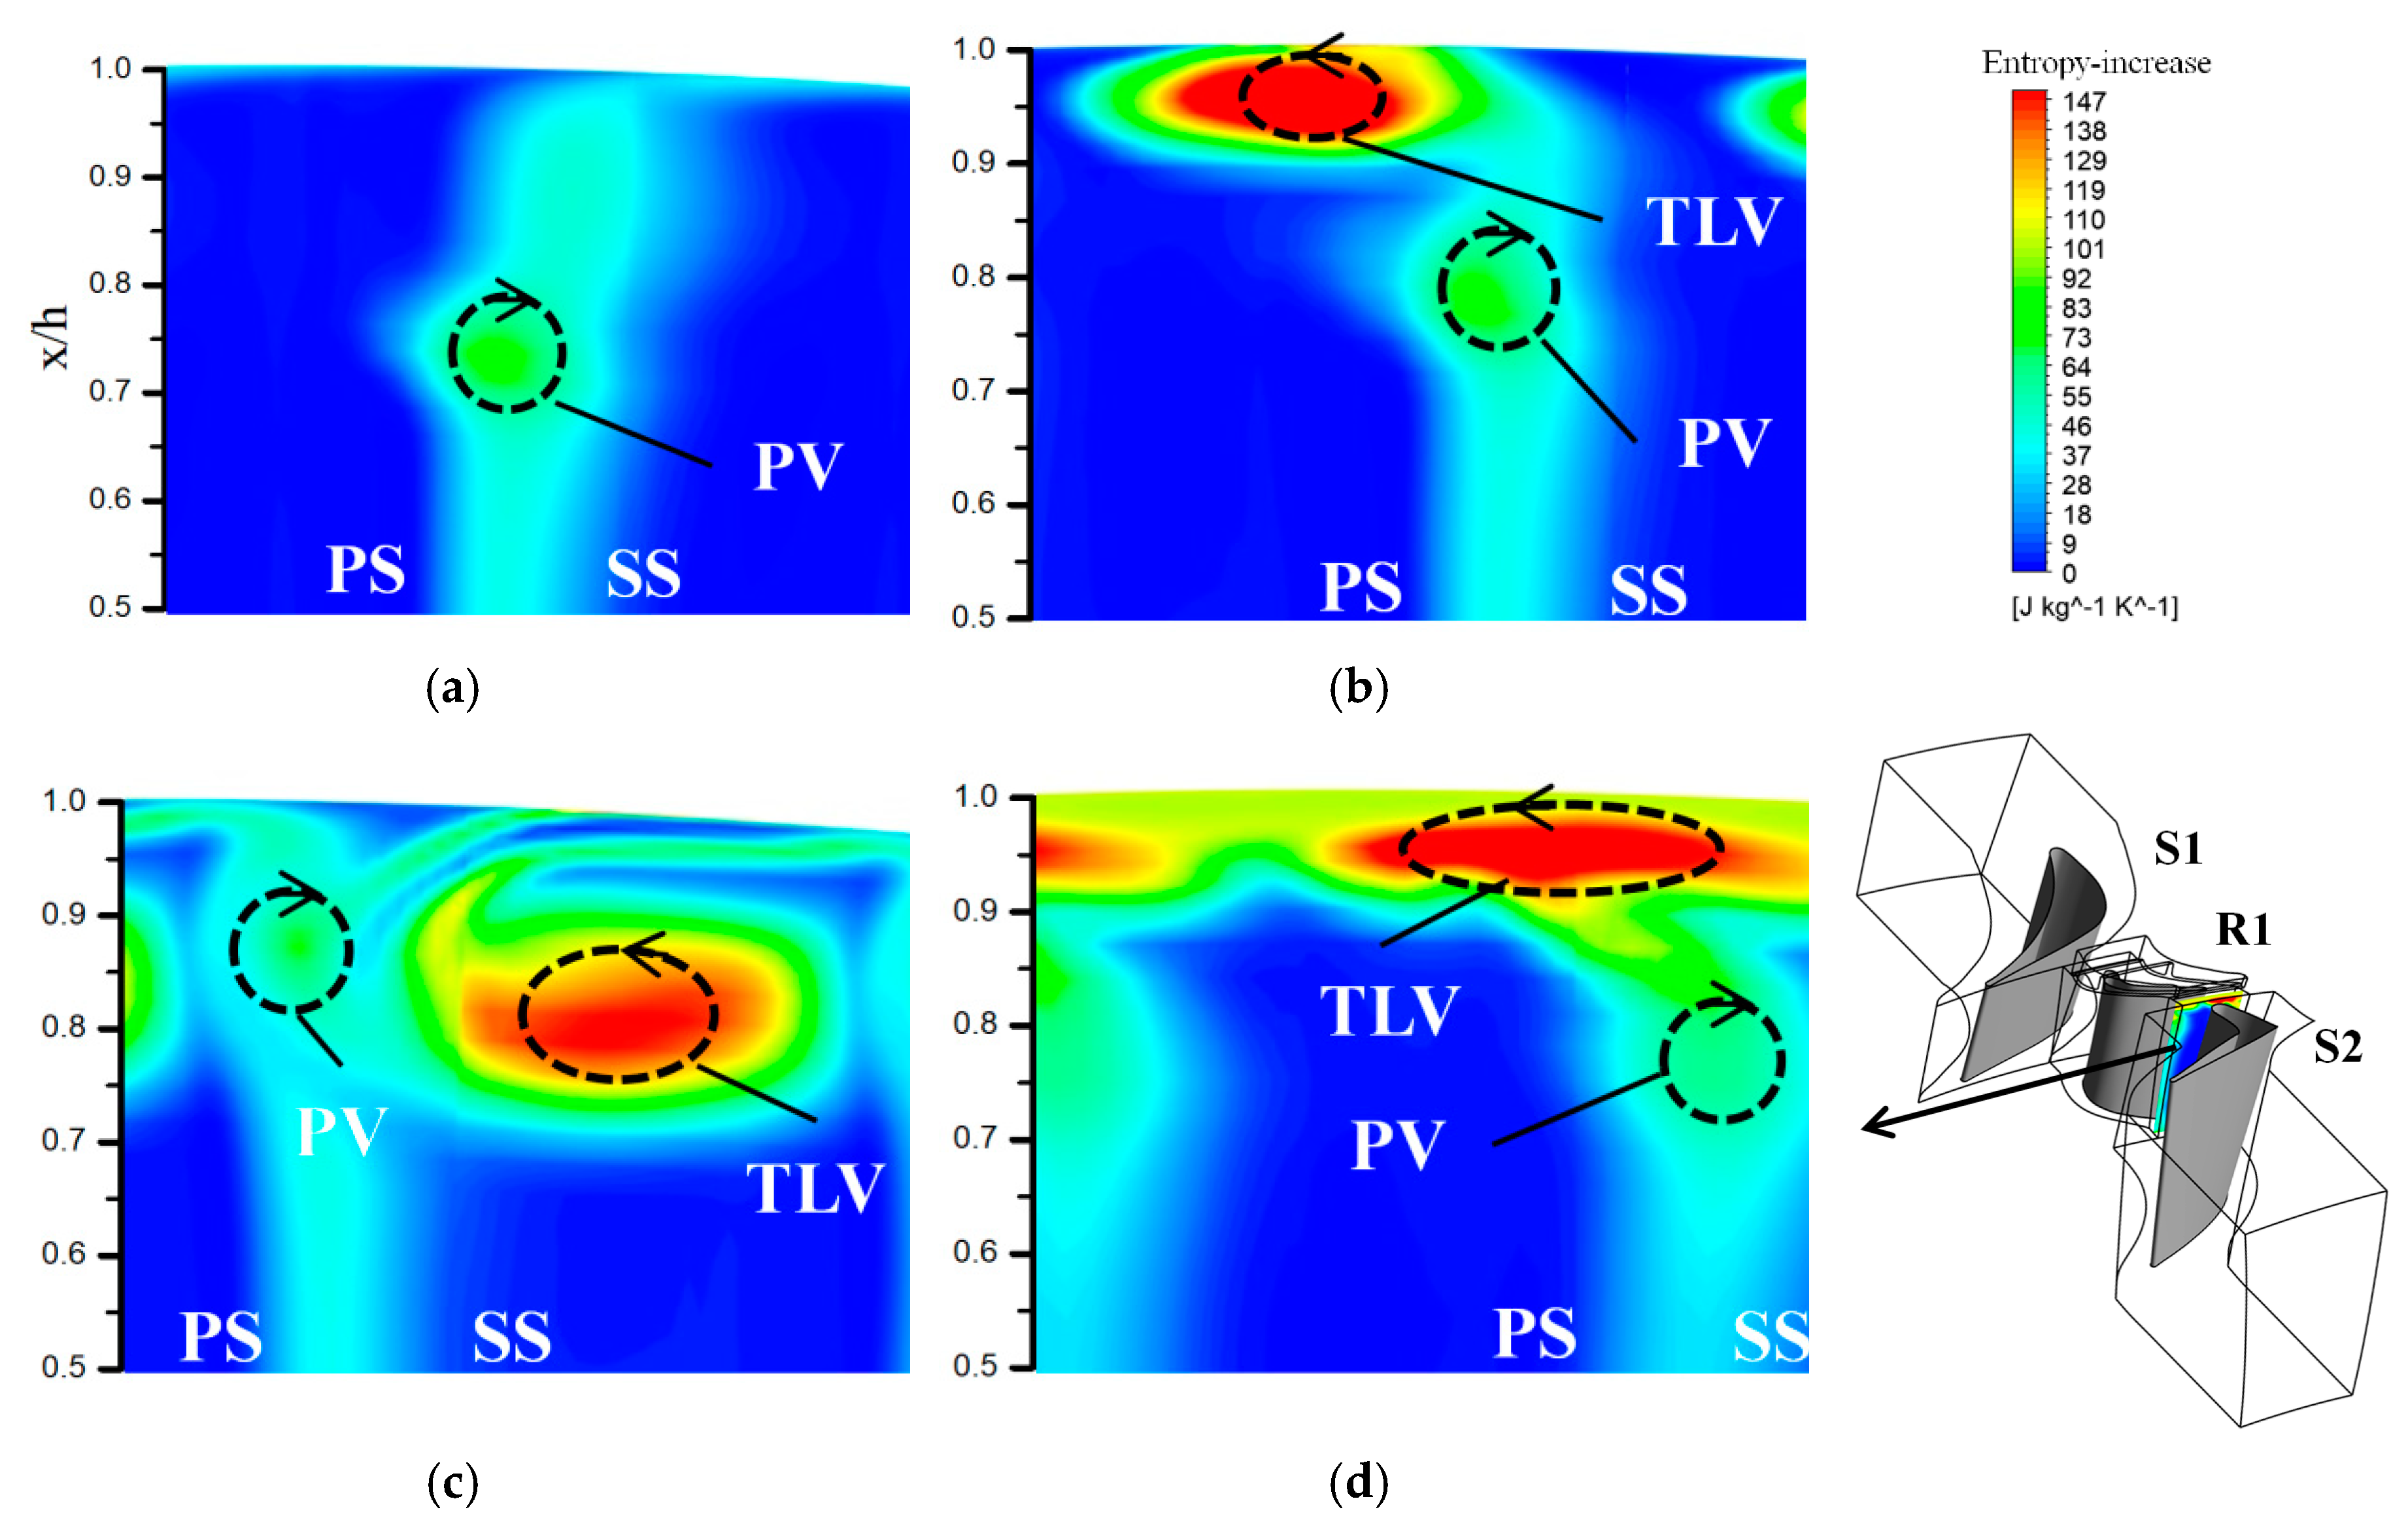
The flow condition at the outlet of the upstream rotor directly determines the inlet condition of the downstream stator. Therefore, the entropy-increase distribution cloud map at the outlet of R1 is given. The change in tip clearance mainly affects the region near the casing, and has little influence on the hub. Therefore, Figure 9 shows only the upper half of the region. It can be seen from Figure 9, that the effect of the rotor tip clearance mainly increases the strong tip leakage vortex (TLV). The TLV loss is approximately twice that of the passage vortex and rotates in the opposite direction. Compared with Figure 9a–c, it can be seen that an increase of clearance increased the strength of the TLV and made it move towards the middle of the blade passage. The effect of clearance on the passage vortex was not significant, and so could be neglected. Compared with Figure 9b,d, with the same clearance size, the tip leakage flow at the outlet of the shrouded R1 had a larger influence range in the circumferential direction and was closer to the casing. Therefore, the influence of rotor tip clearance on the flow performance of the downstream stator is reflected in the influence of the TLV.
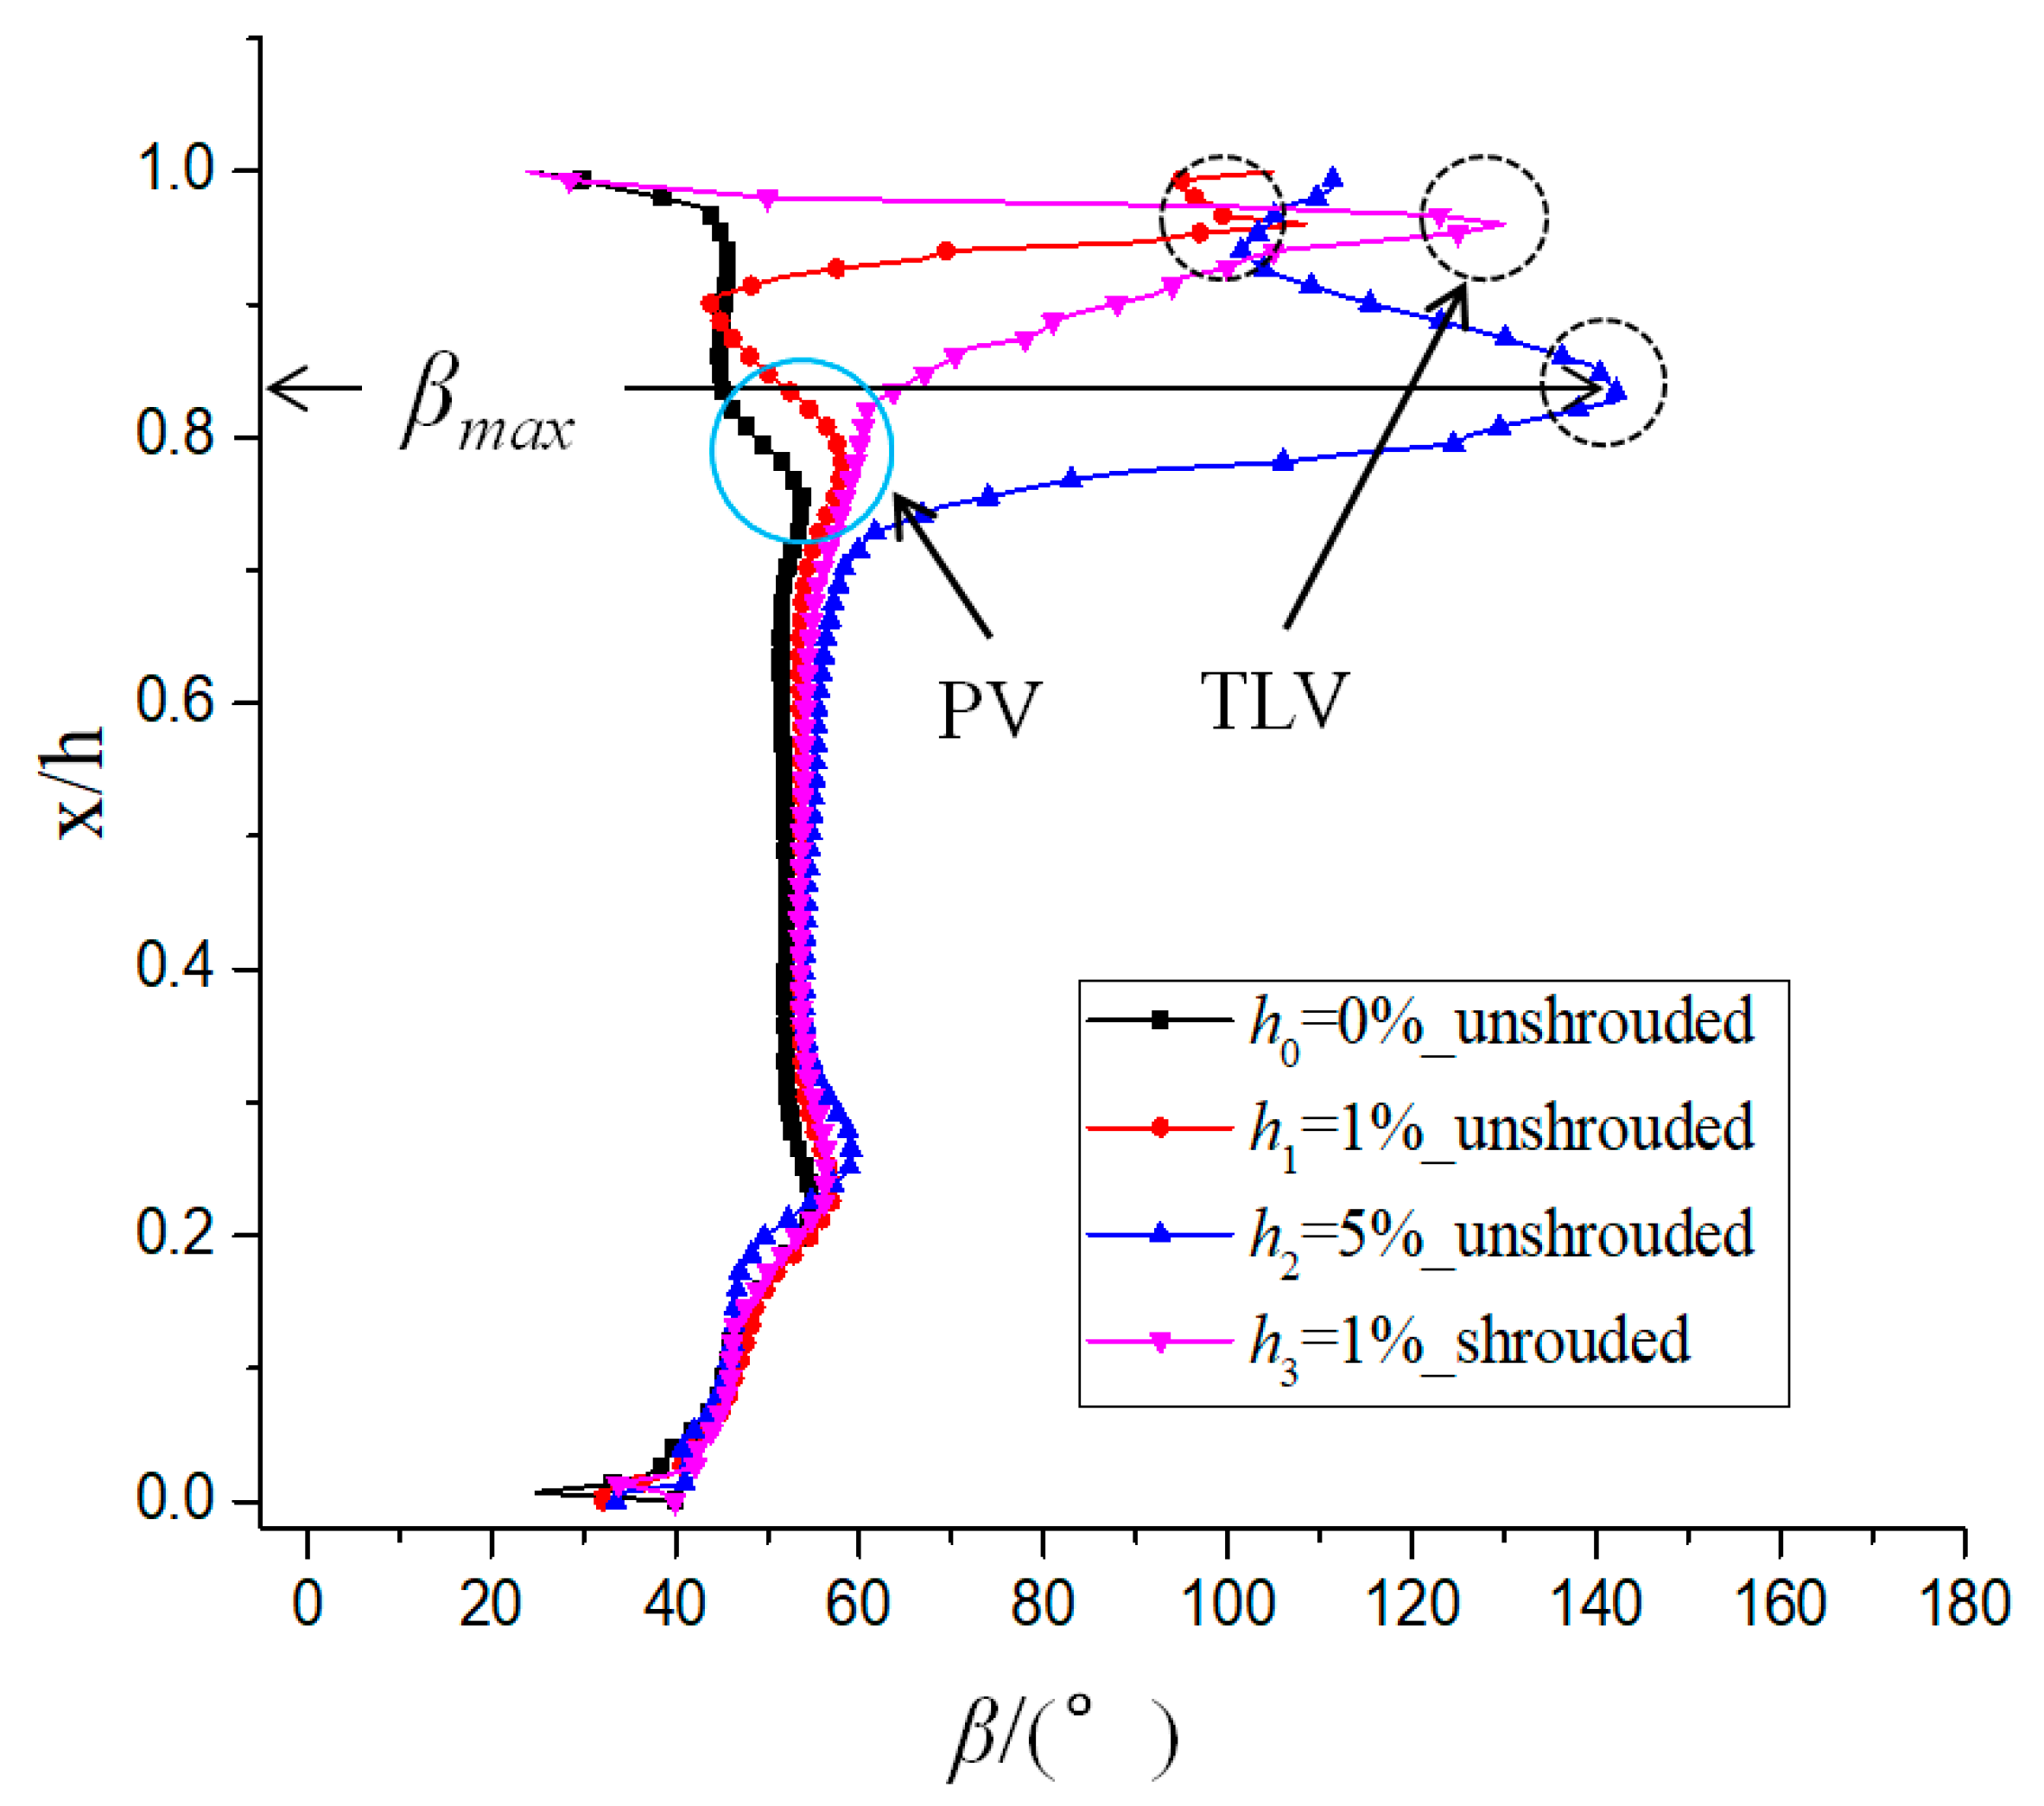
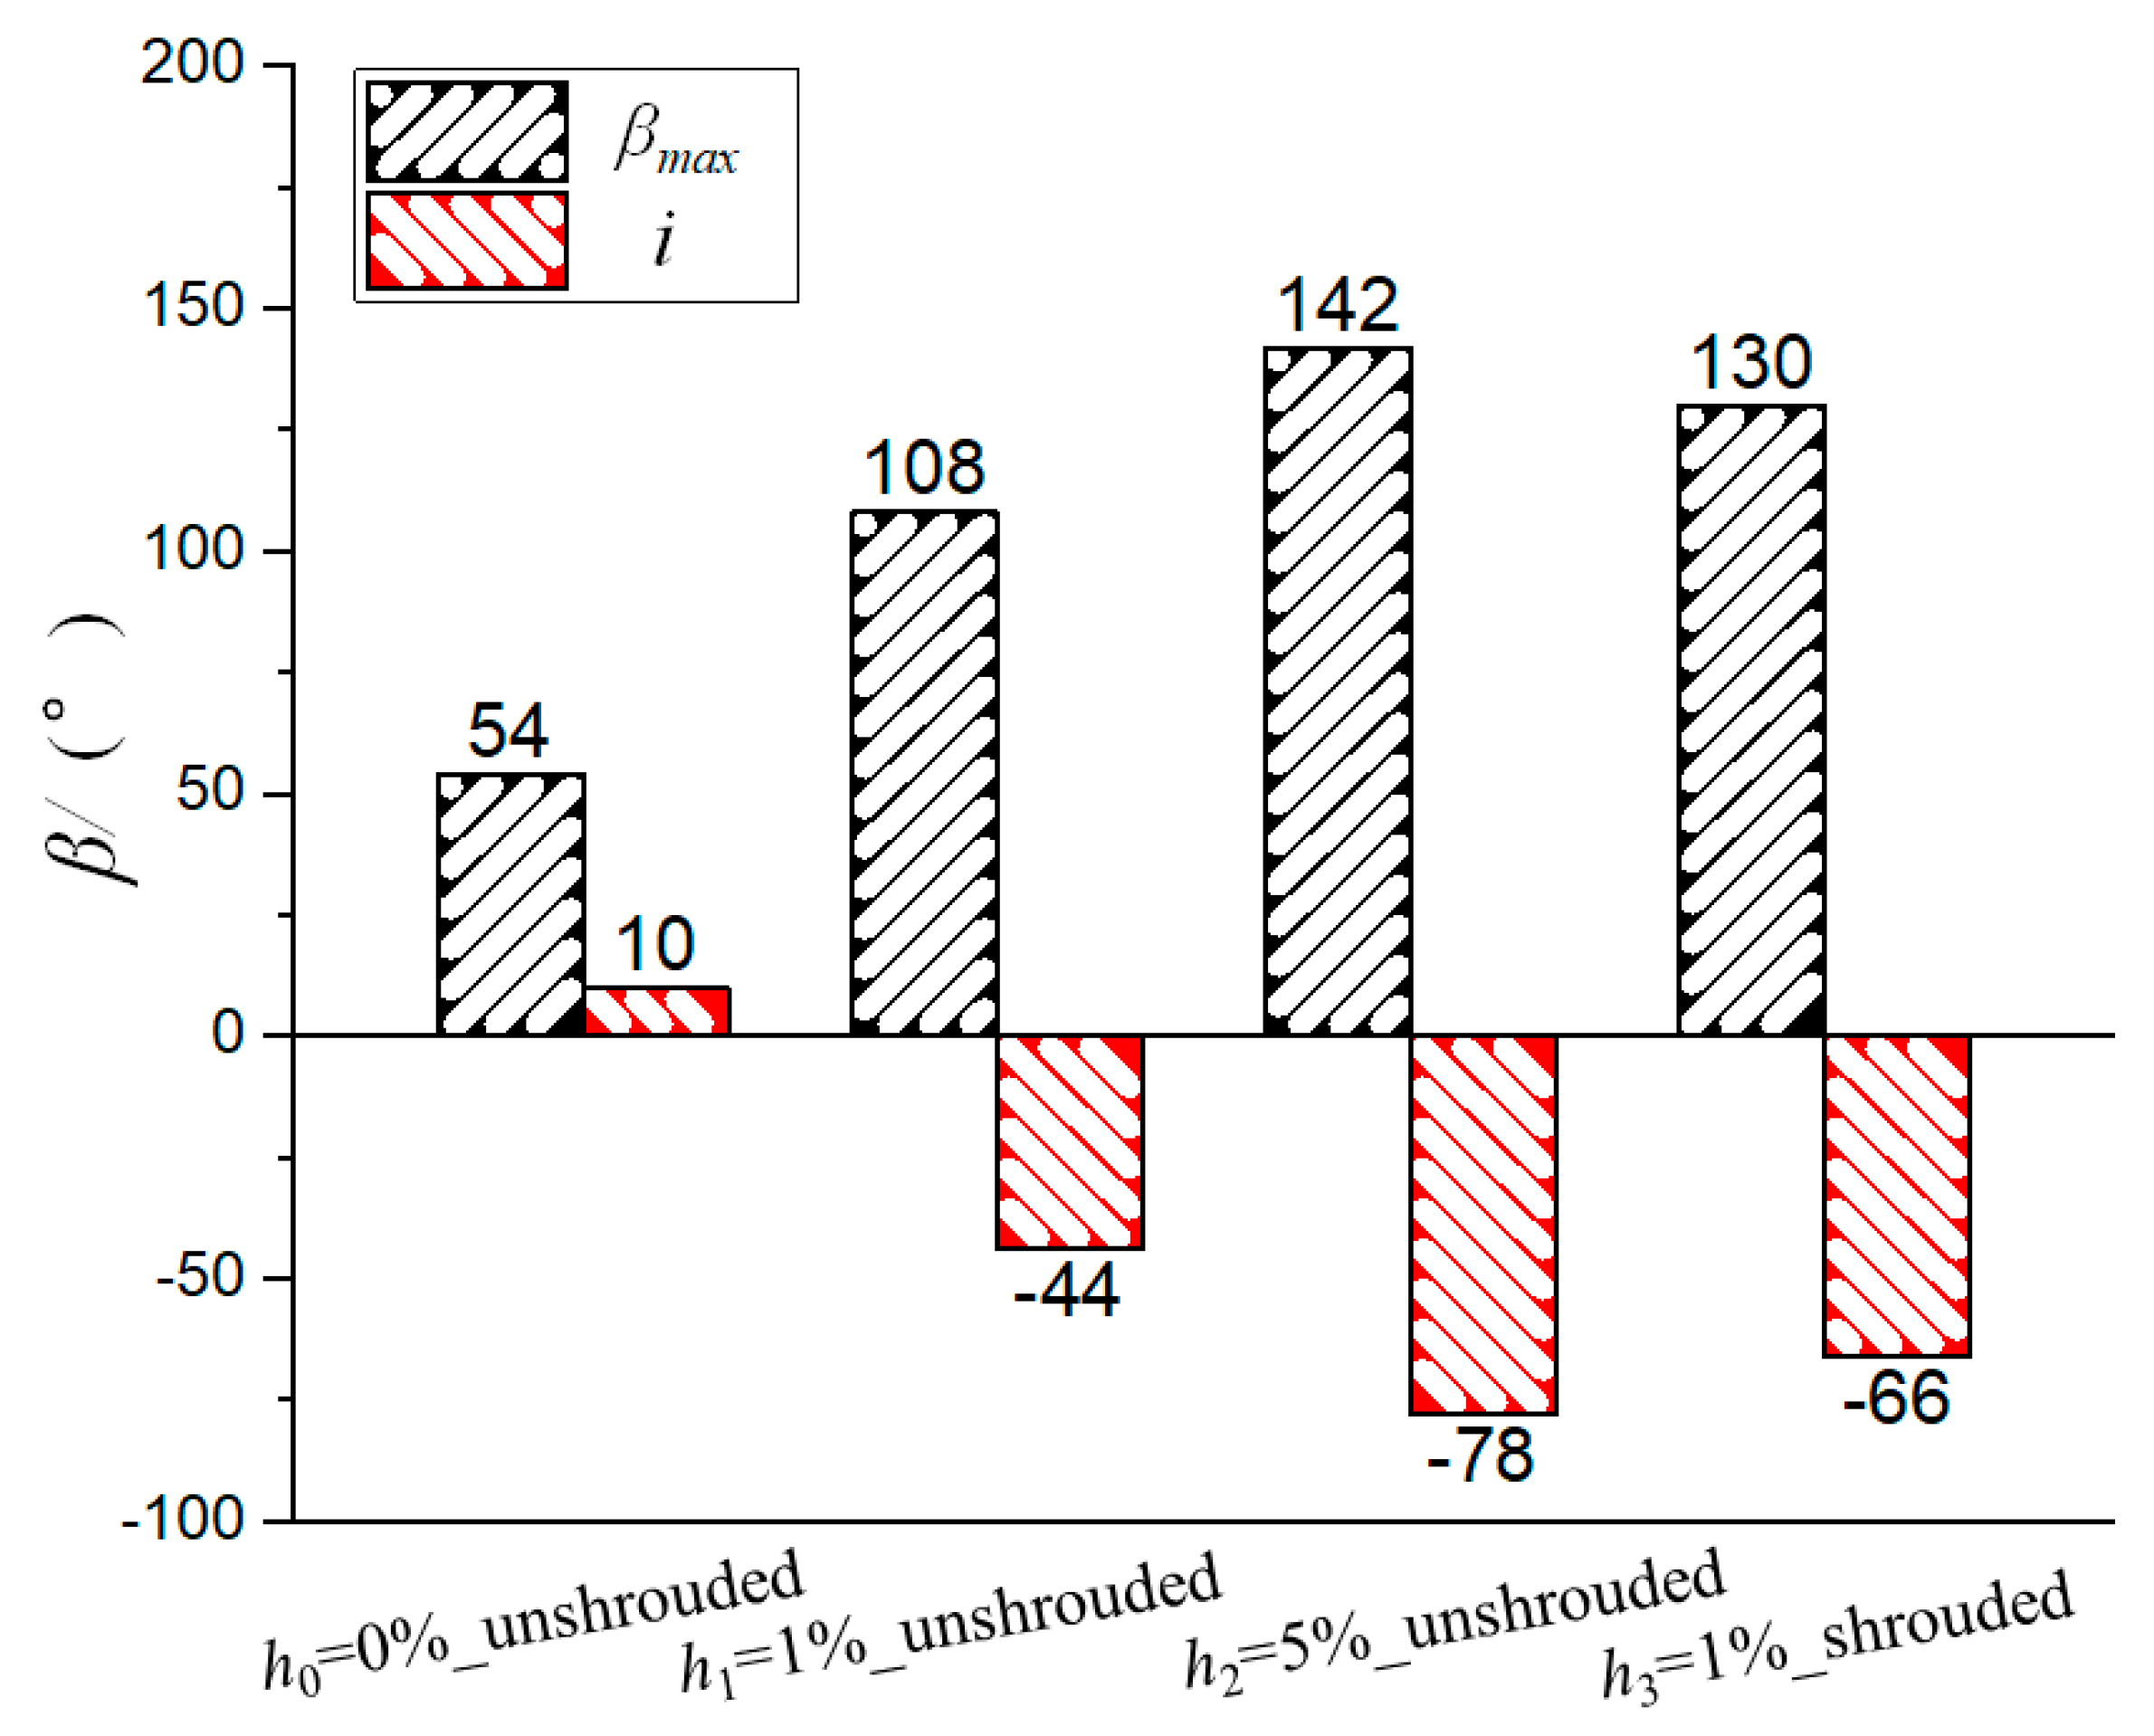
Inlet flow angle is a very important parameter which has a great influence on the flow and heat transfer performance of the stator. Therefore, the span-wise mass-averaged inlet flow angle of S2 was studied, as shown in Figure 10. Based on Figure 10, the bar chart of the maximum inlet airflow angle and the incidence angle were drawn to better show the impact, as shown in Figure 11. The incidence angle in Figure 8 is defined as:
i = β 1 β
where β is the inlet flow angle and β1 is the blade inlet angle. As can be seen from Figure 10, in the case of clearance size, there was a maximum value of the inlet airflow angle at the 20% span position near the casing. The size and position of the inlet flow angle were consistent with the distribution law of entropy increase at the outlet of R1. It can be concluded that the inlet airflow angle was mainly affected by the TLV. By further analyzing Figure 11, the maximum inlet flow angle of the h1 = 1%_unshrouded case was twice that of in the case h0 = 0%_unshrouded. Compared to the h1 = 1%_unshrouded case, the maximum inlet flow angle of the h3 = 1%_shrouded case was increased by 31%. The maximum incidence angle of the h0 = 0%_unshrouded case is positive and the maximum incidence angle of the case with tip clearance was negative.
Study of the vane static pressure coefficient (Cps) distribution can shed light on the performance and vane loading at various locations along the vane span. The strength of secondary flows downstream of a turbine has been shown to depend strongly on both the overall aerofoil loading and the loading distribution (e.g., Benner et al. [31]).
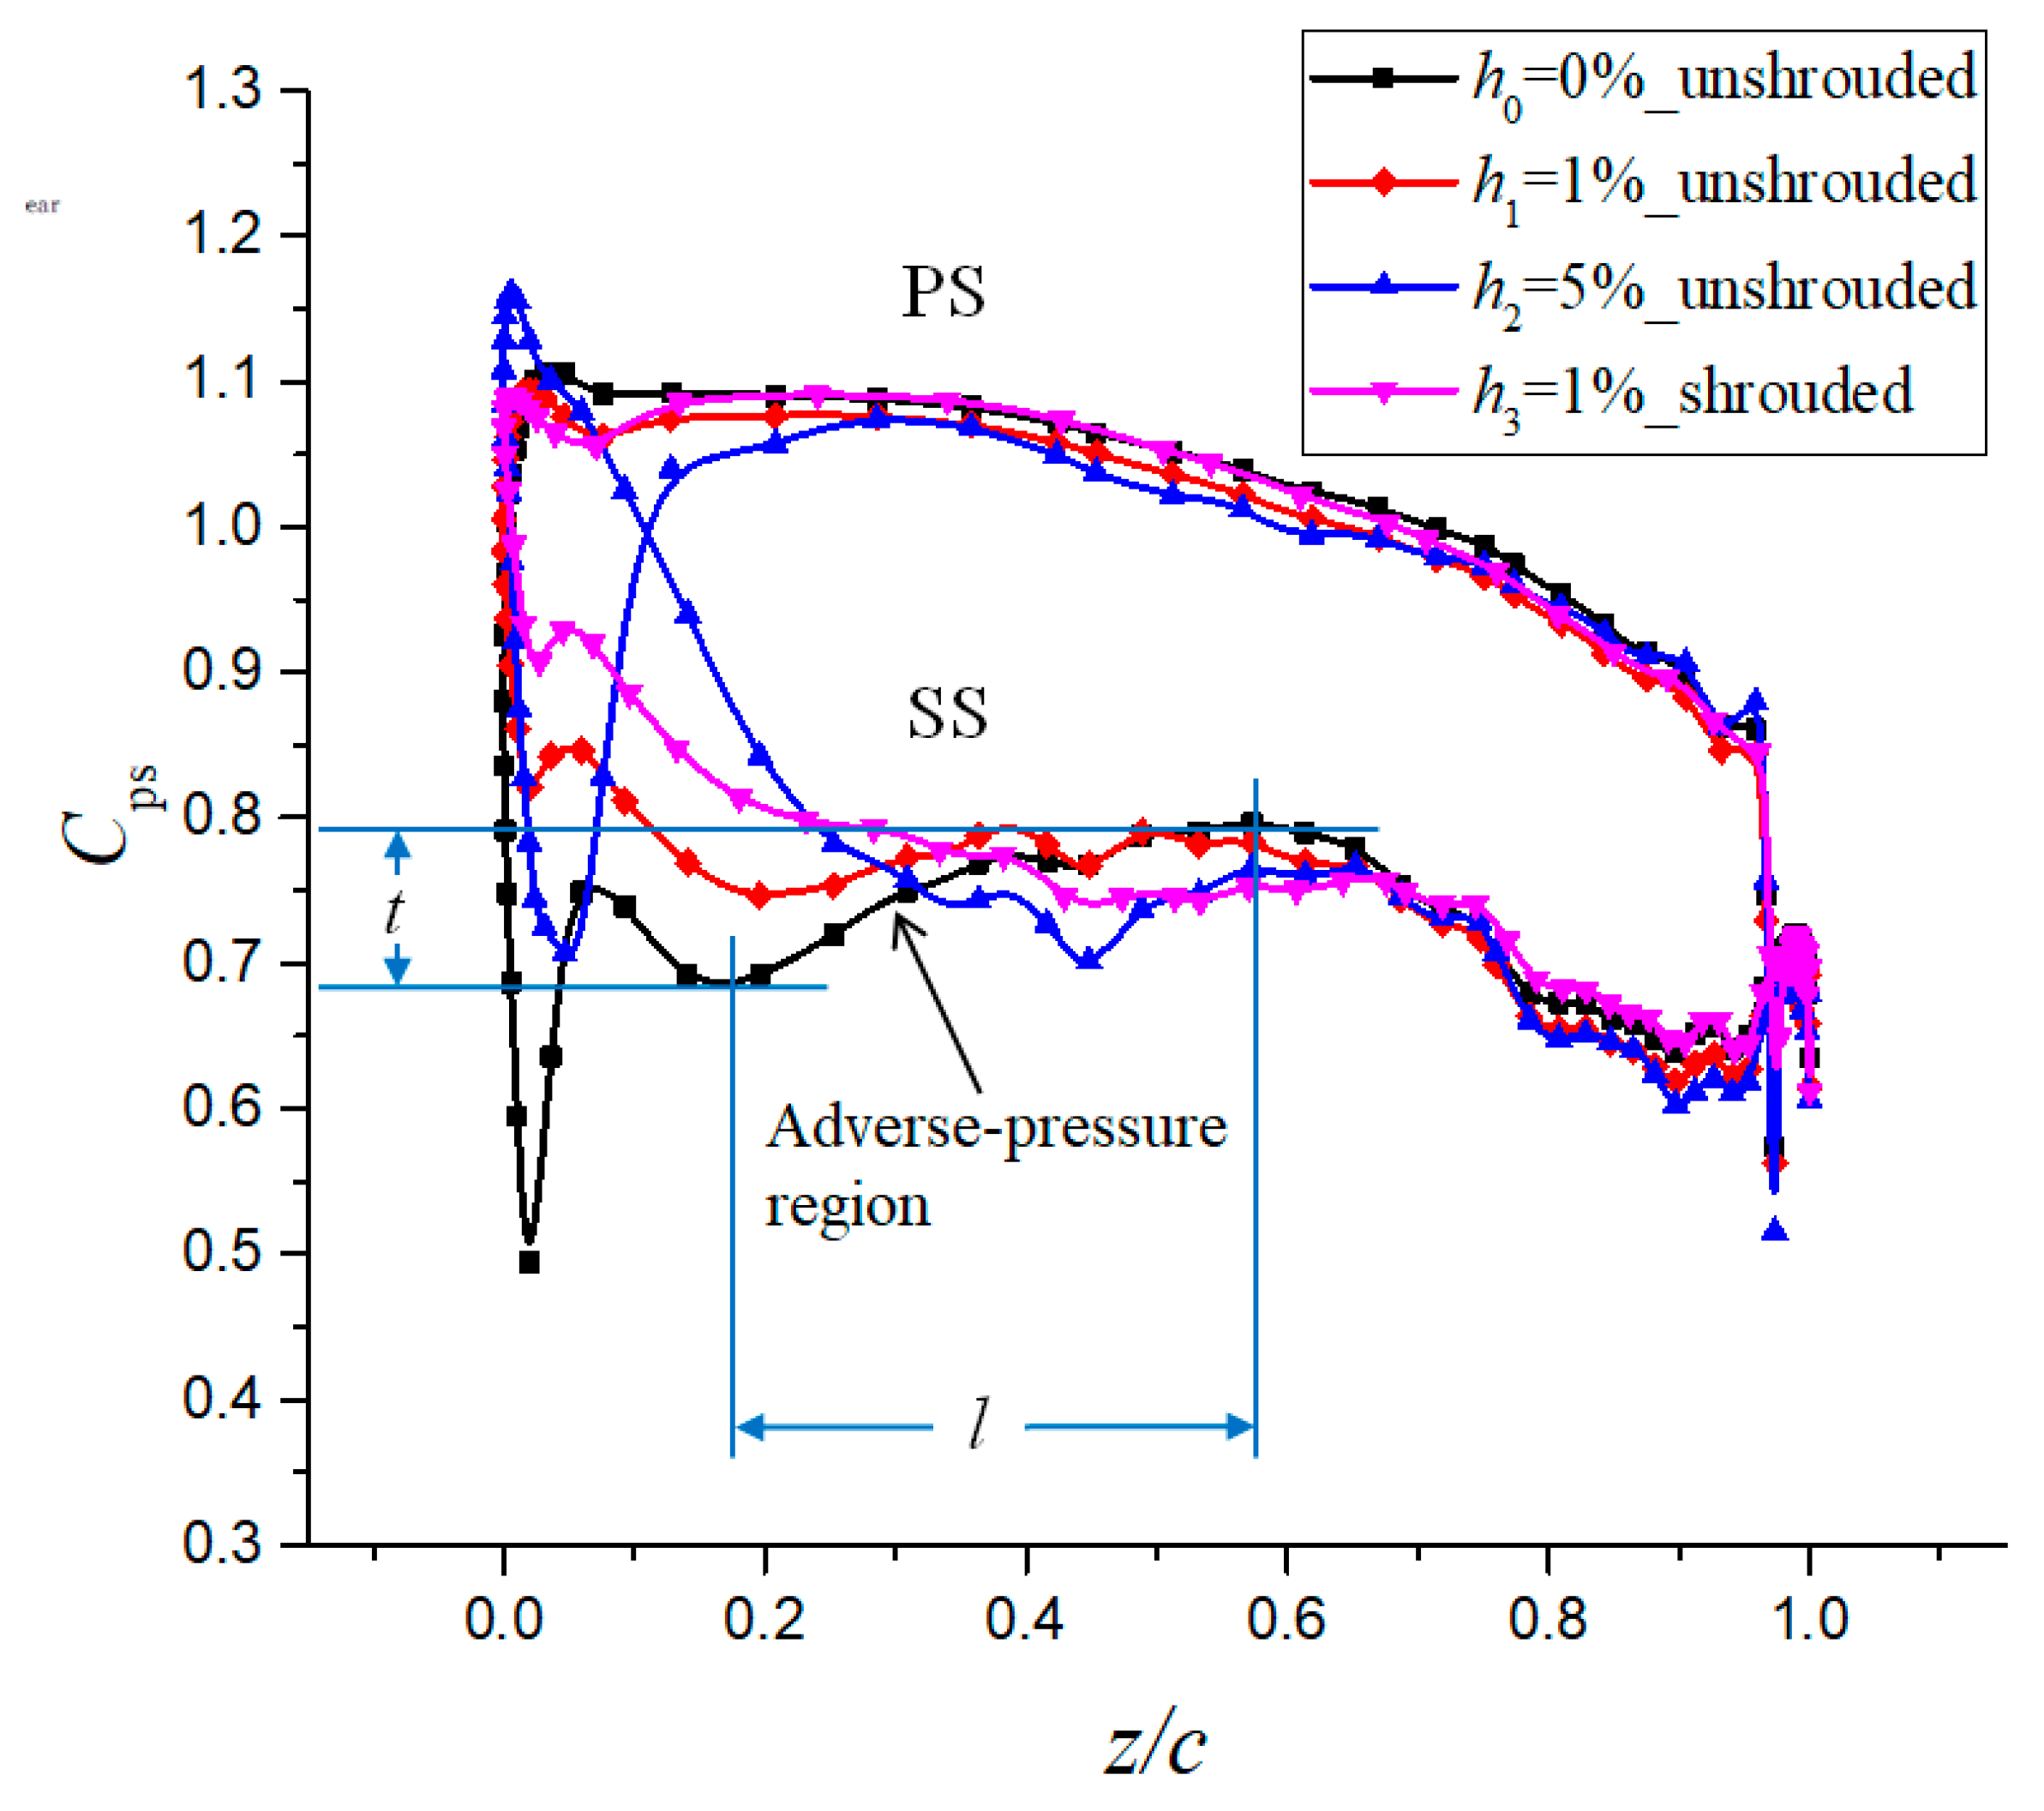
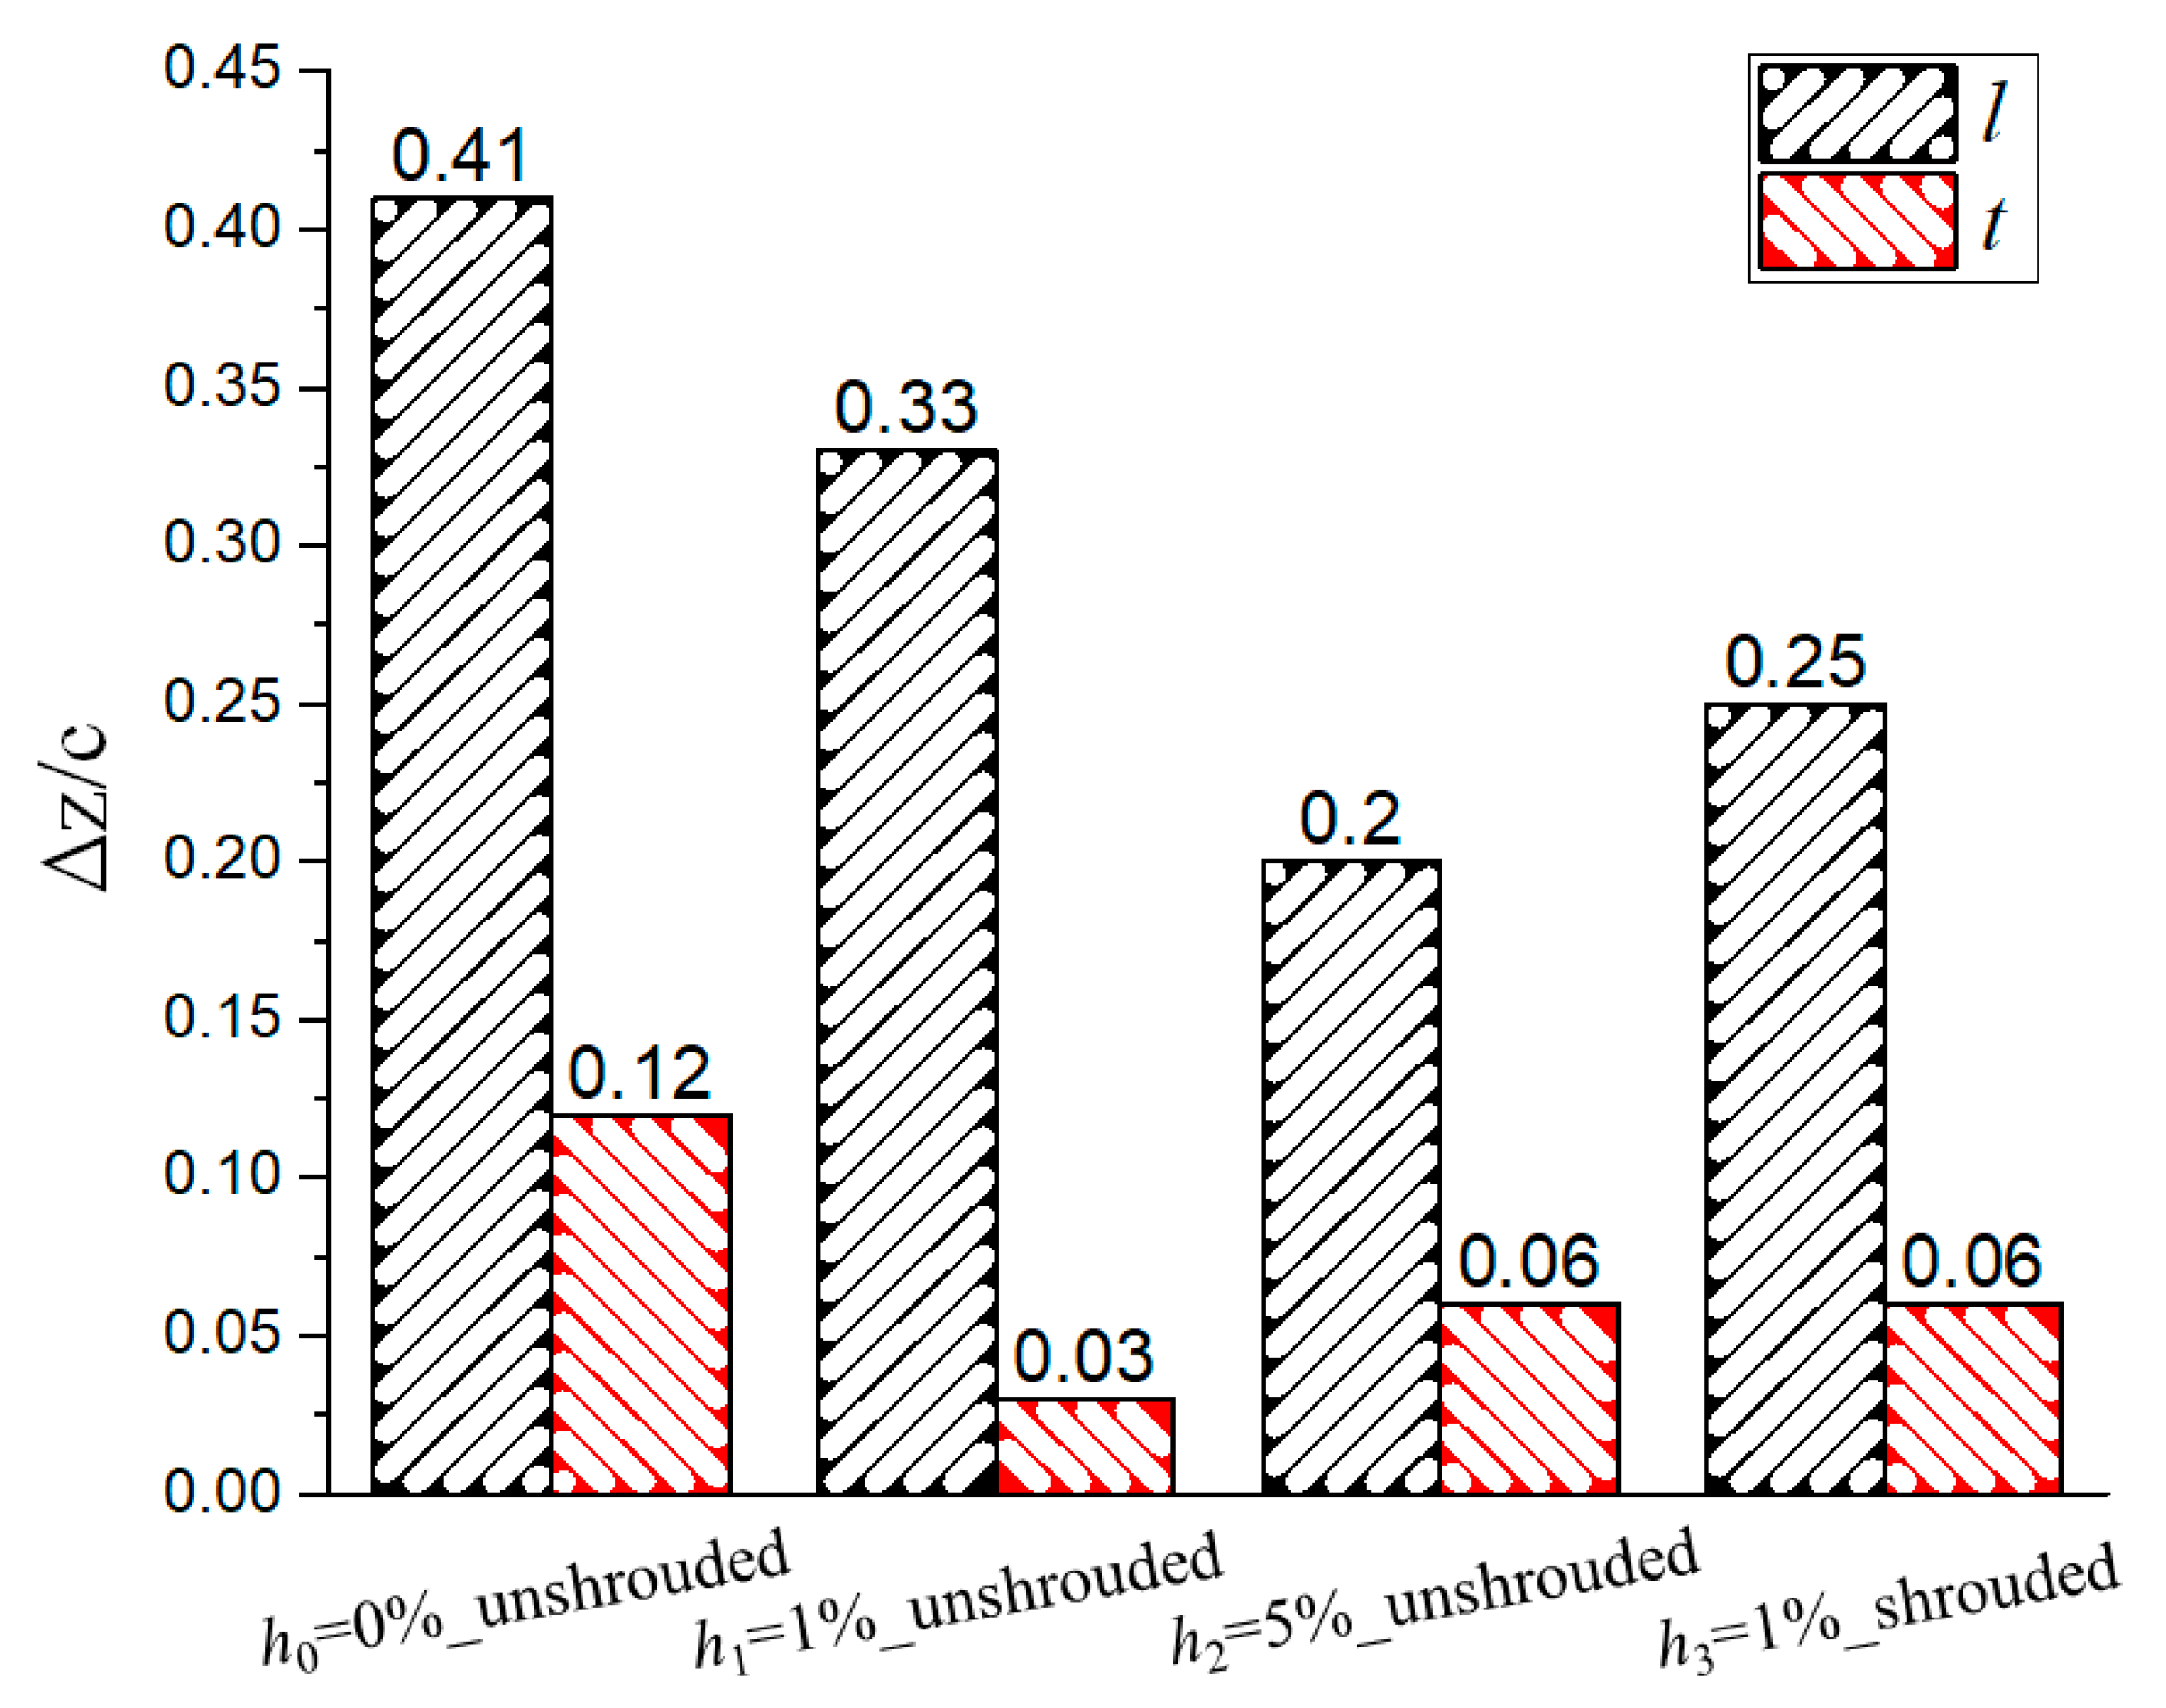
As the tip clearance mainly affects the region near the casing and has little influence on the middle and lower part of the vane, only the static pressure coefficient distribution at the 90% span of S2 was analyzed. As shown in Figure 12, the static pressure coefficient distribution of the four cases was analyzed, and it was found that the tip clearance mainly affected 60% of the area in front of SS, but had little influence on the PS. The adverse pressure gradient has an important influence on the development of the boundary layer [32,33]. Figure 13 shows the strength and range characteristics of the adverse pressure region of the suction surface based on Figure 12. With the increase of the gap size, the range of the adverse-pressure region on the suction surface decreased significantly, and the strength decreased first and then increased. In the h2 = 5%_unshrouded case, due to the large negative incidence angle on the leading edge of the S2, large gradient fluctuations were generated in the front part of the pressure side. A comparison of the h3 = 1%_shrouded case and the h1 = 1%_unshrouded case, showed that the reverse pressure region decreased by 25%, and strength doubled.
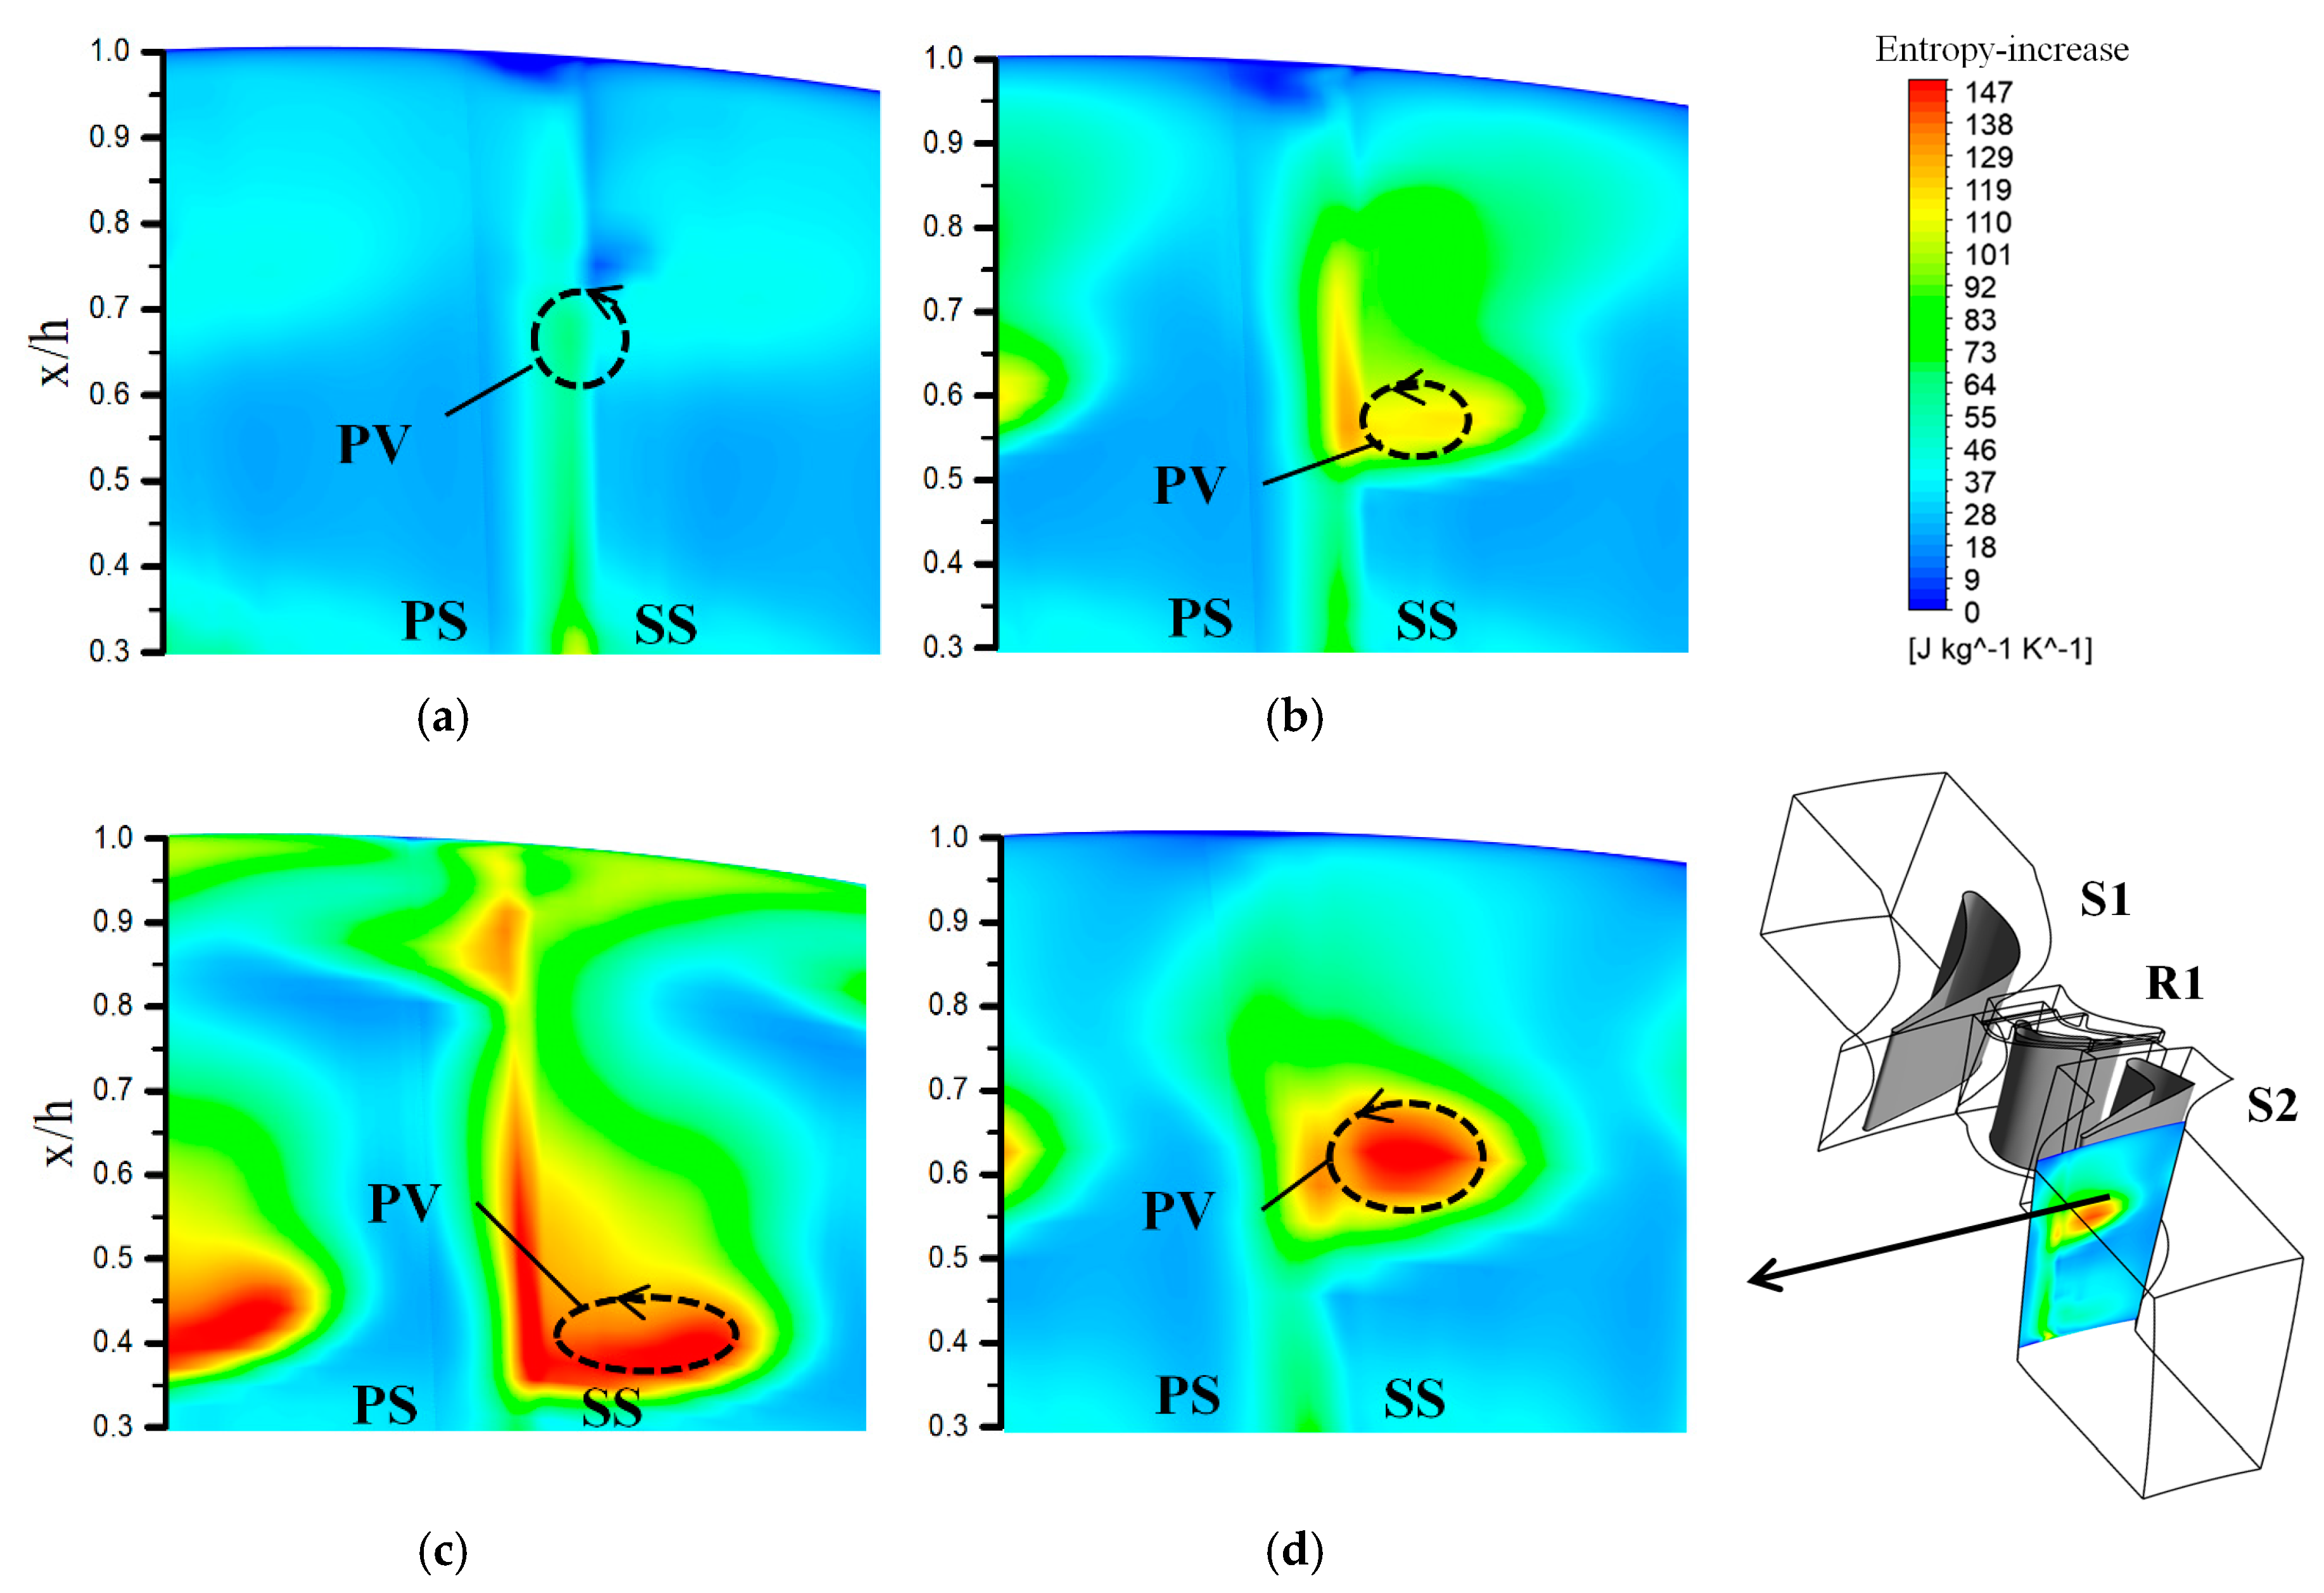
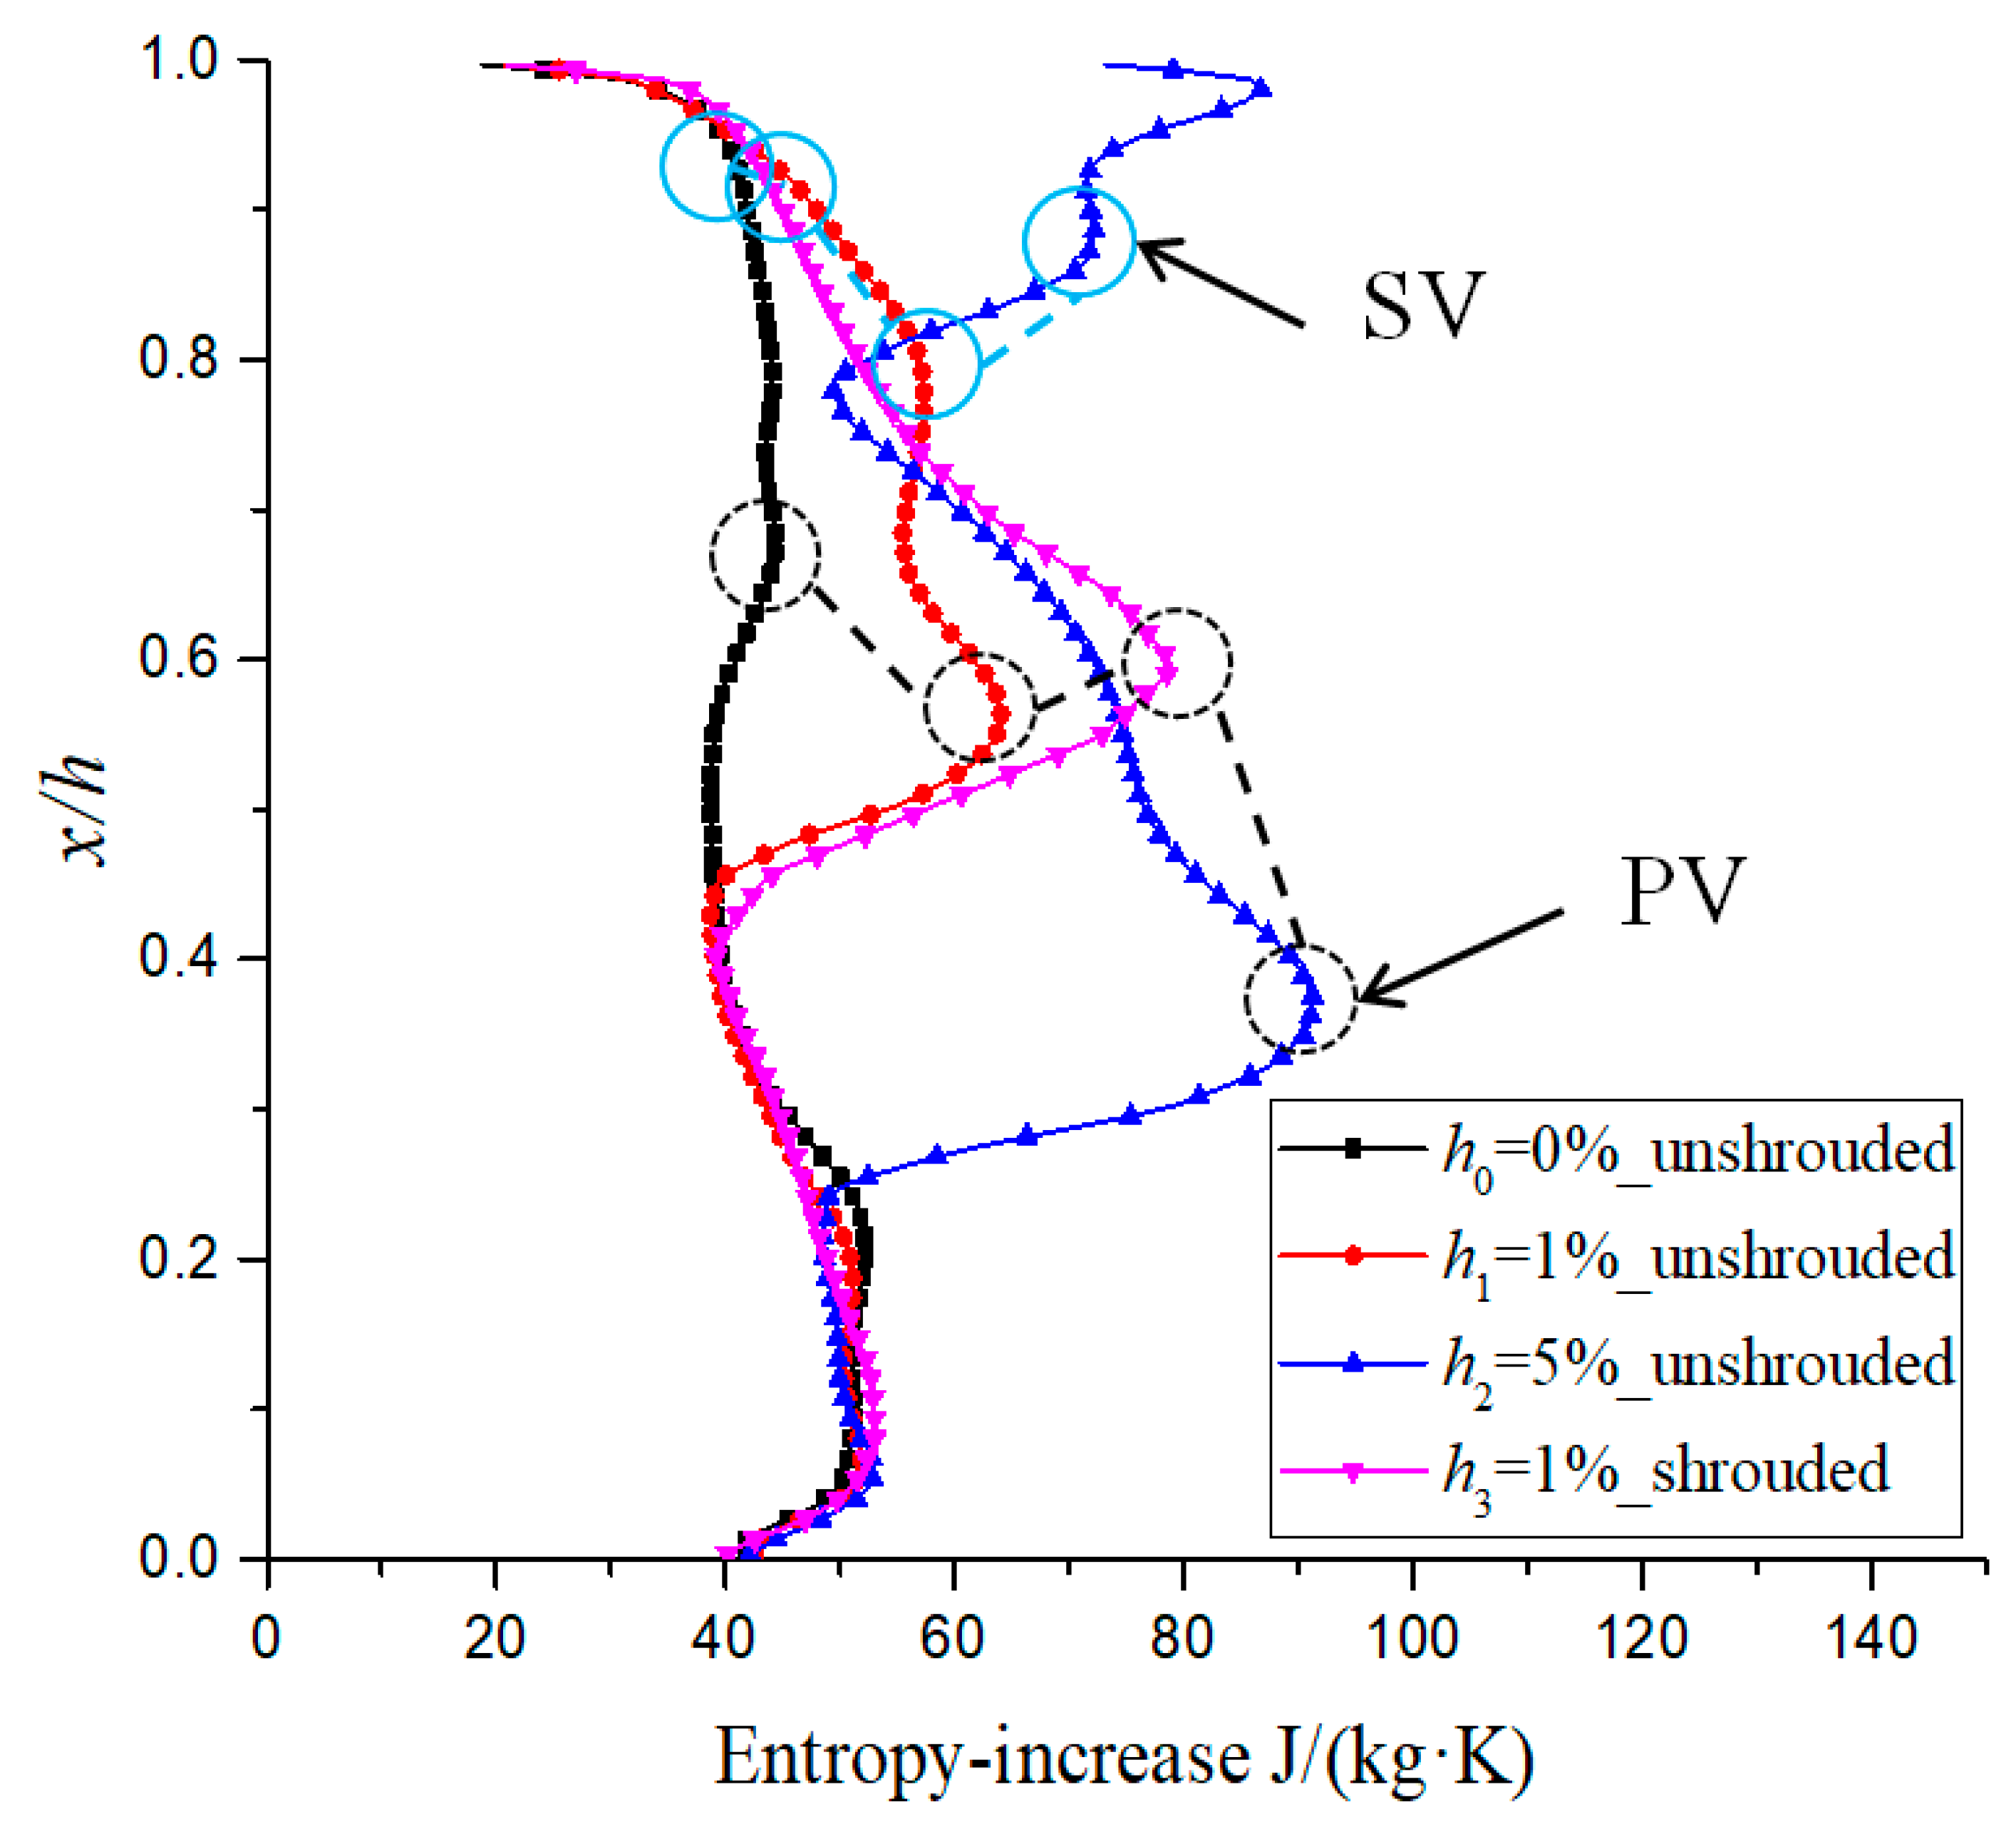
To illustrate the effects on shed vortices and passage vortices, Figure 14 shows the mass-averaged entropy-increase contour at 110% of the axial chord of S2. The change of tip clearance mainly affects the region near the casing and has little influence on the hub. Therefore, Figure 14 shows only the upper 70% span region. Figure 15 shows a quantitative curve of the mass-averaged in the circumferential direction of Figure 14. The main loss area of the exit section of S2 is caused by the upper passage vortex. From exit S2, the passage vortex rotates counterclockwise. By comparing Figure 14a–c, as the size of the clearance increased, the vortex loss at the exit section of S2 increased significantly and moved toward the middle of the blade. The passage vortex loss strength of the h2 = 5%_unshrouded case was increased by 40% compared with the h1 = 1%_unshrouded case, and the blade height was increased by 17% to the middle of the blade. Combined with Figure 14b,d, in the h3 = 1%_shrouded case relative to the h1 = 1%_unshrouded case, the intensity of the passage vortex increased by 23%, and the size of the passage vortex decreased.

3.3. Heat Transfer Analysis of S2 with Different R1 Tip Clearance

The HTC can be nondimensionalized by calculating the Nu. The Nu was calculated, as shown in Equation (5). This had the same definition as in the studies of Salvadori et al. [34] and Qureshi et al. [14], which is defined as:
N u = q ˙ C ( T aw T w ) k T 01 ,
where the parameter C is the vane mid-span true chord and kT01 is the thermal conductivity of air referenced to the mean inlet total temperature.
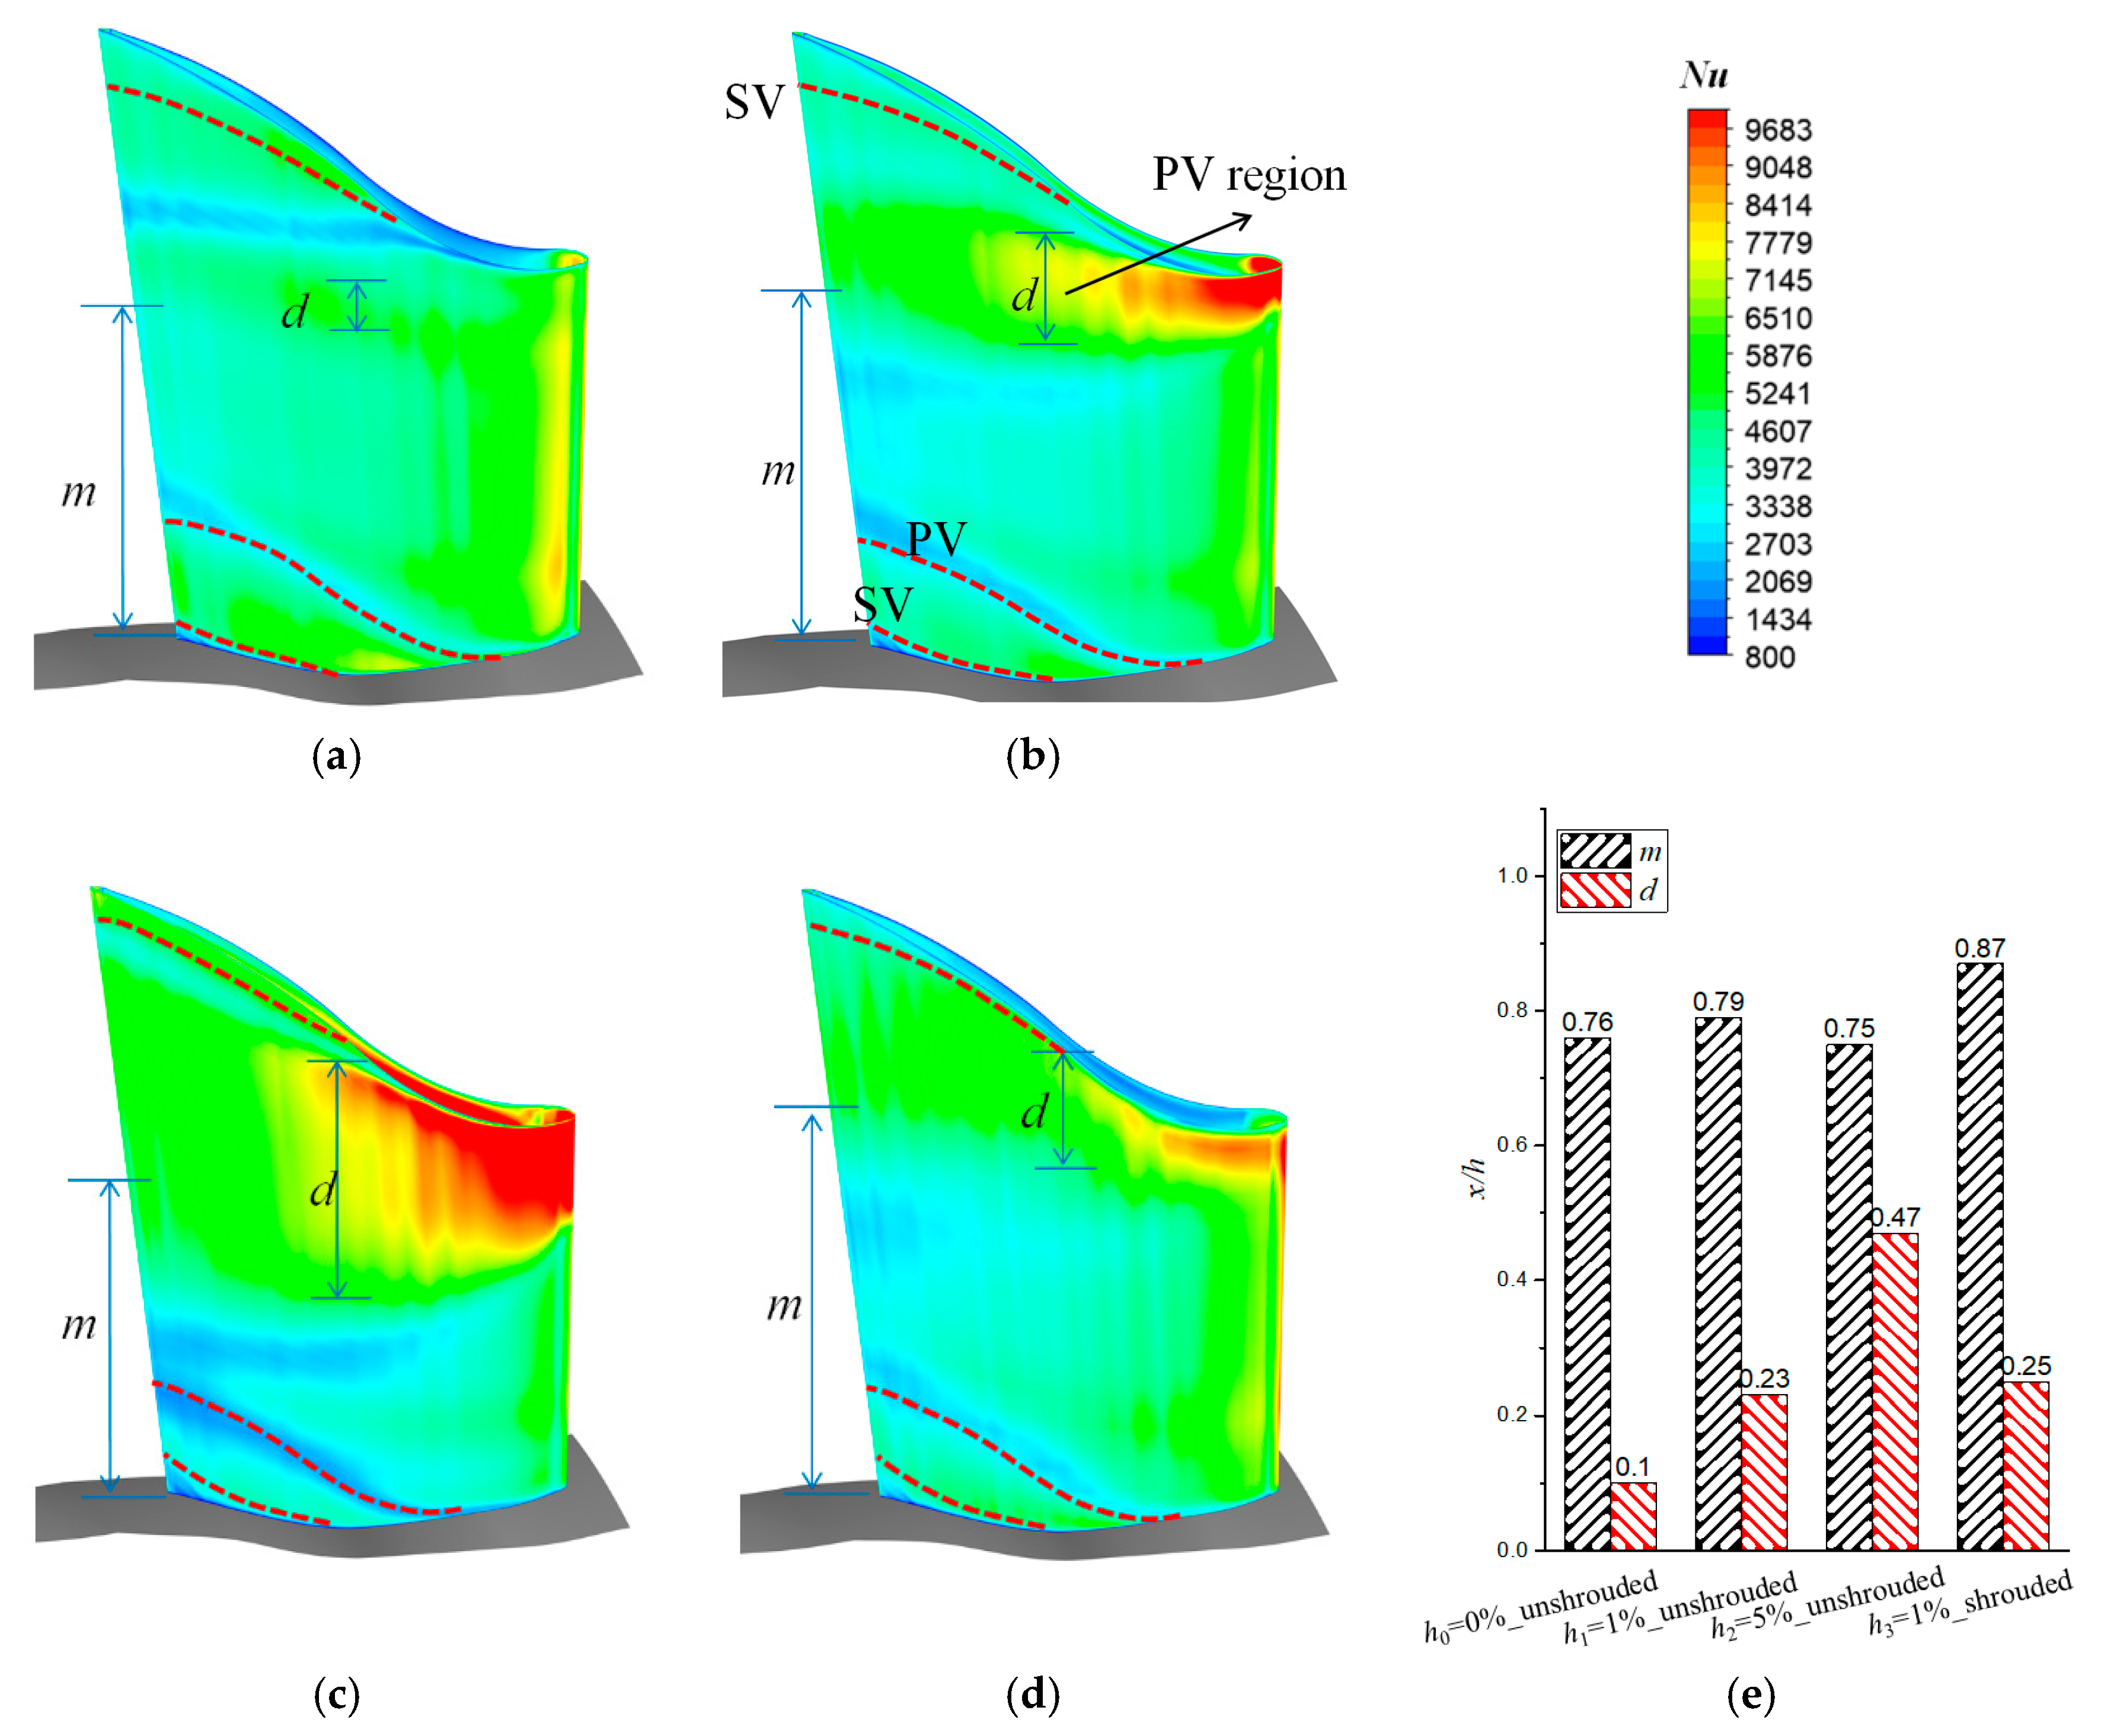
From the above aerodynamic analysis, it can be seen that the tip gap of the rotor at the first stage had a strong impact on the passage vortices of the downstream vane. The thermal load distribution of a turbine is mainly affected by the flow state, so it is necessary to analyze the heat transfer characteristics of the S2 blades. Since the PS of S2 does not have a local excessive thermal load and the HTC is little affected by the inlet TLV, only the heat transfer characteristics of the suction surface were analyzed. Figure 16 shows the Nu distribution of the S2 blade suction surface. Combined with Figure 16a–c, it can be seen that the upstream TLV significantly increased the high heat transfer area of the S2 suction surface. Referring to Figure 16e, the radial dimension of the high heat transfer area increased significantly when R1 had tip clearance. Compared with Figure 16a,d, the radial size of the high heat transfer area of the h3 = 1%_shrouded case and the h1 = 1%_unshrouded case were almost the same. Its radial position moved up by 13% span, relative to the h1 = 1%_unshrouded case.
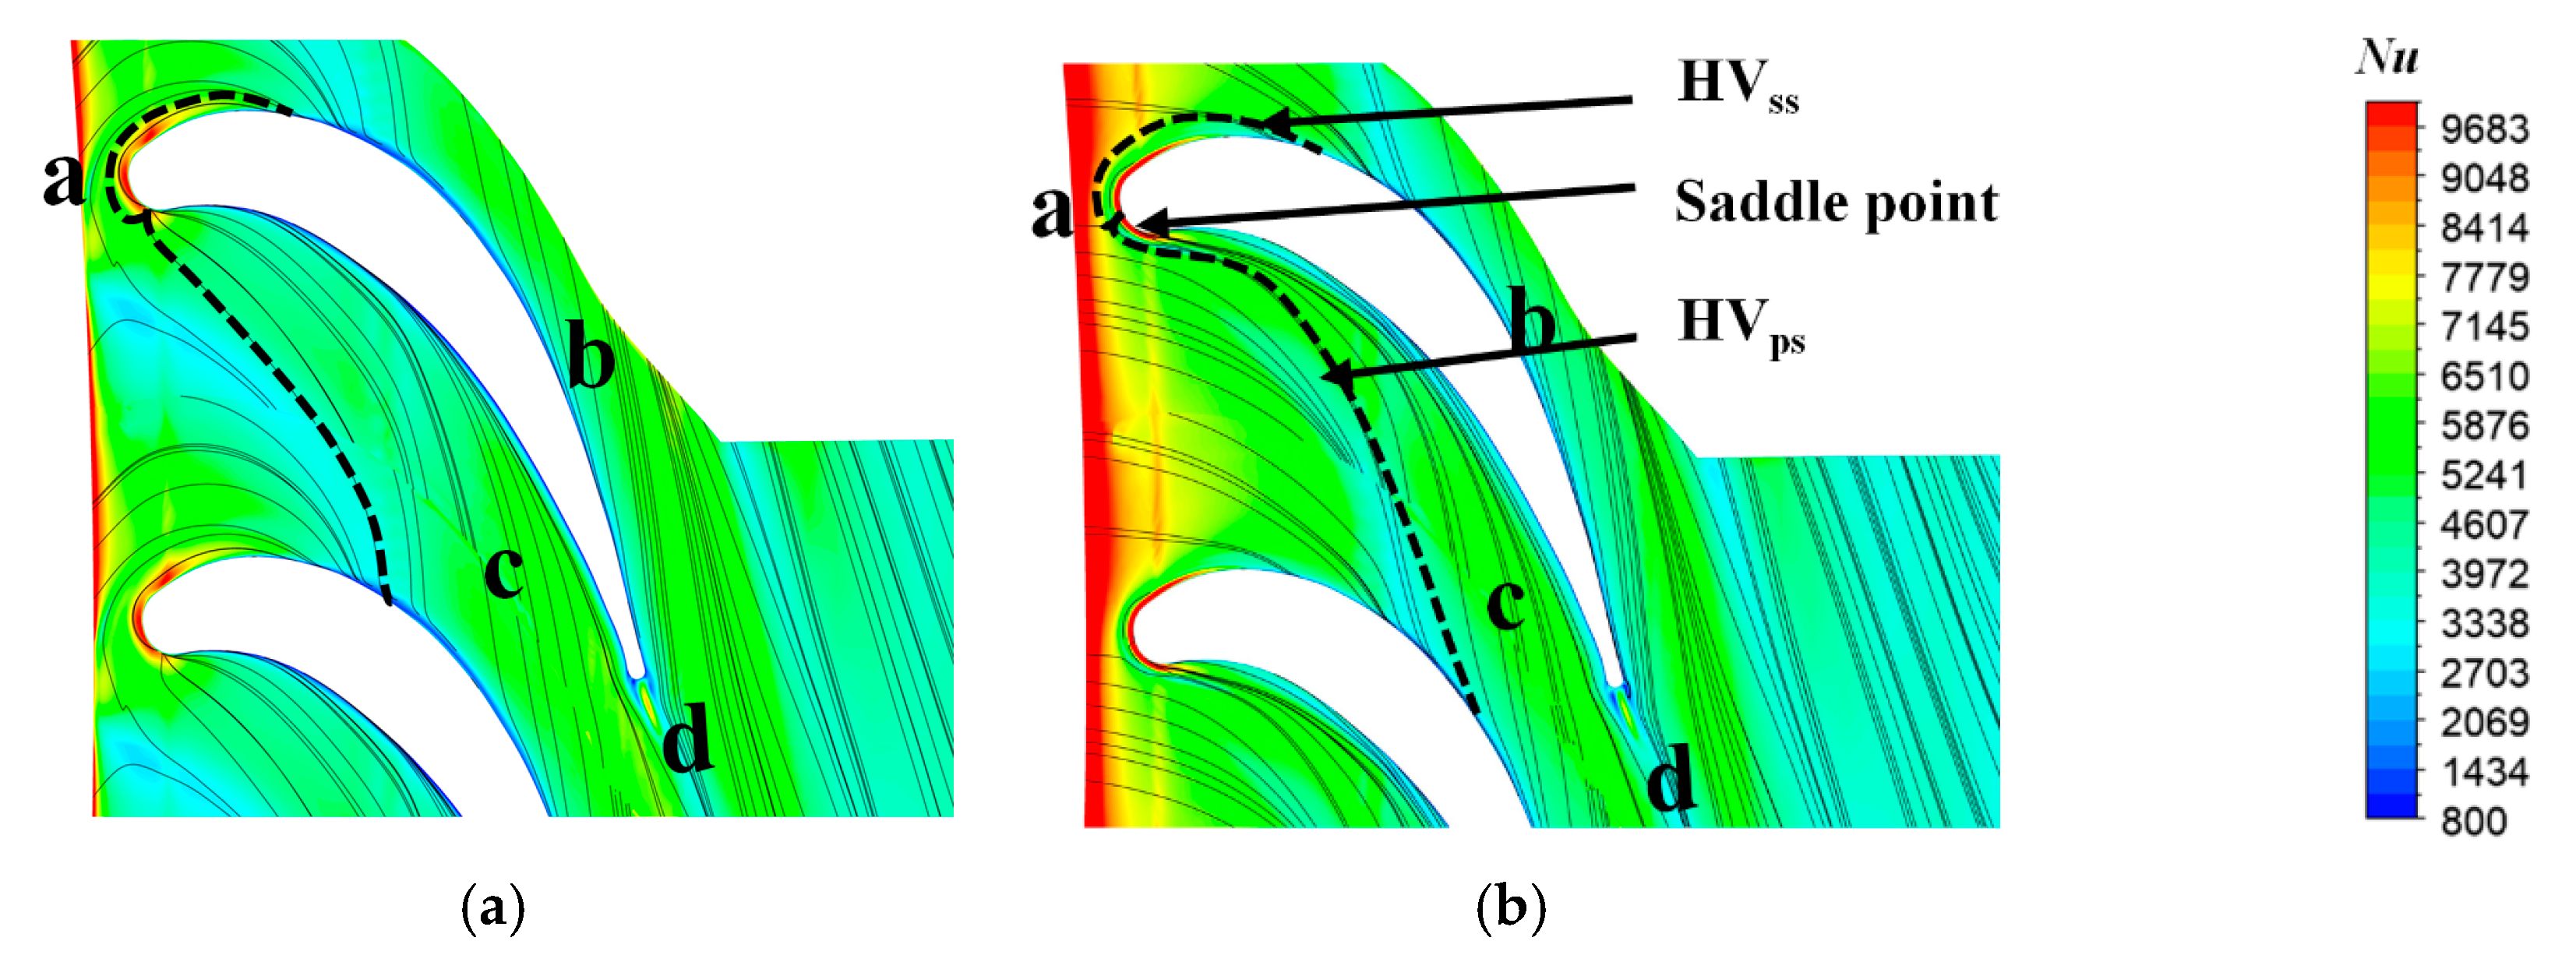
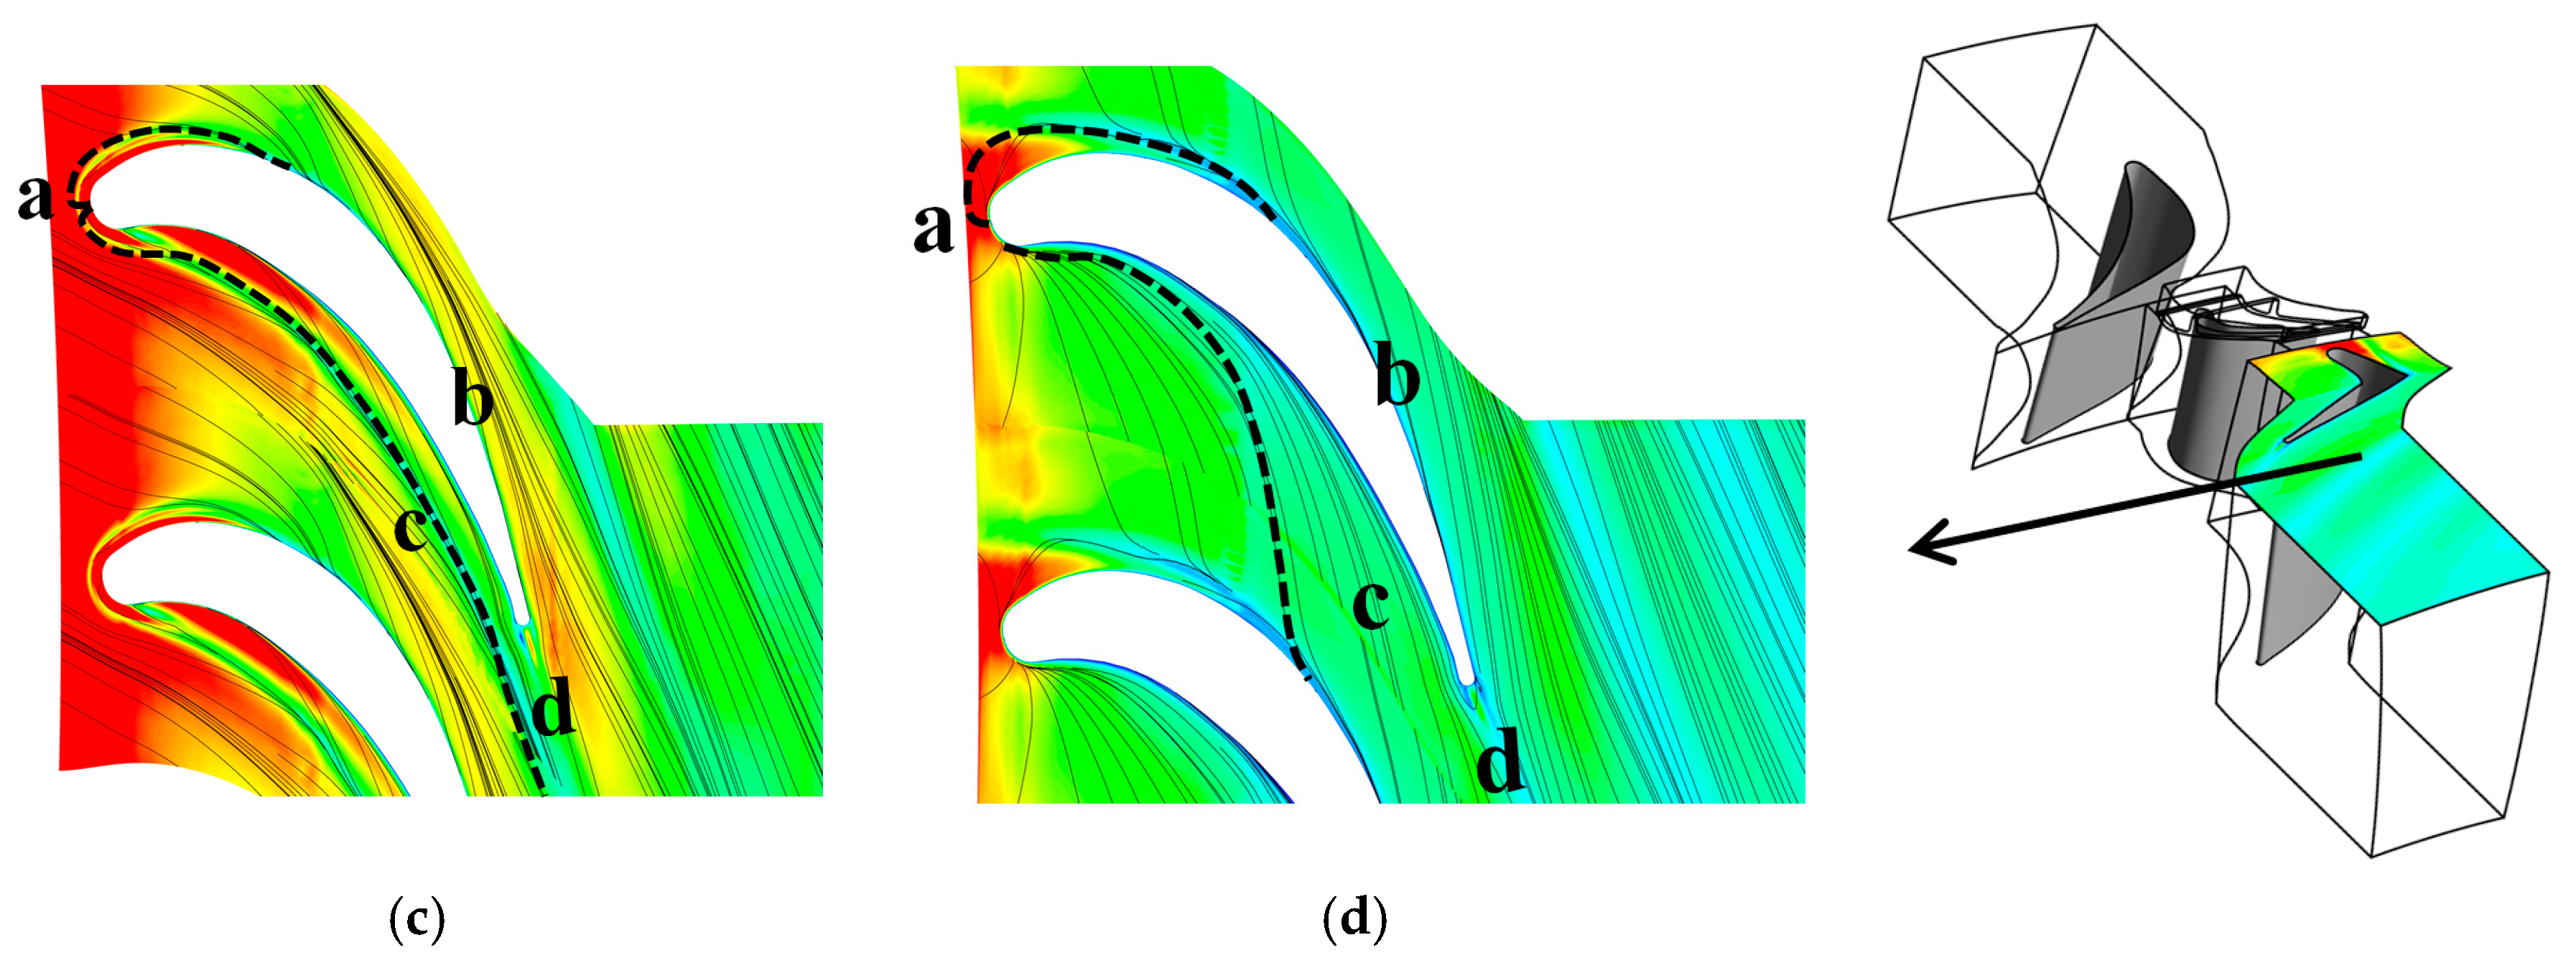
The S2 casing is also strongly affected by the upstream TLV. Figure 17 shows the distribution of the Nu on the S2 casing, which was caused by the flow field effect near the casing. At the leading edge (a), the formation of the maximum heat transfer region can be clearly recognized. The minimum heat transfer region was located at the trailing edge of SS (b). A relatively high heat transfer region was located at the rear PS (c). Ignoring the small stripe (d), the heat transfer increased in the vane’s wake. As the tip clearance of R1 increased, the intensity of the high heat transfer area (a) increased significantly, and the HTC of the region (b) and (c) increased accordingly. The attachment point of the HVps at the pressure side surface moved downstream, of which the attachment point of the h1 = 1%_unshrouded case moved downstream by 20% of the axial chord length, when compared with the h0 = 0%_unshrouded case. Analysis of Figure 17b,d, showed that the h3 = 1%_shrouded case increased the HTC of the leading edge (Figure 16a), but reduced the HTC in the middle passage.
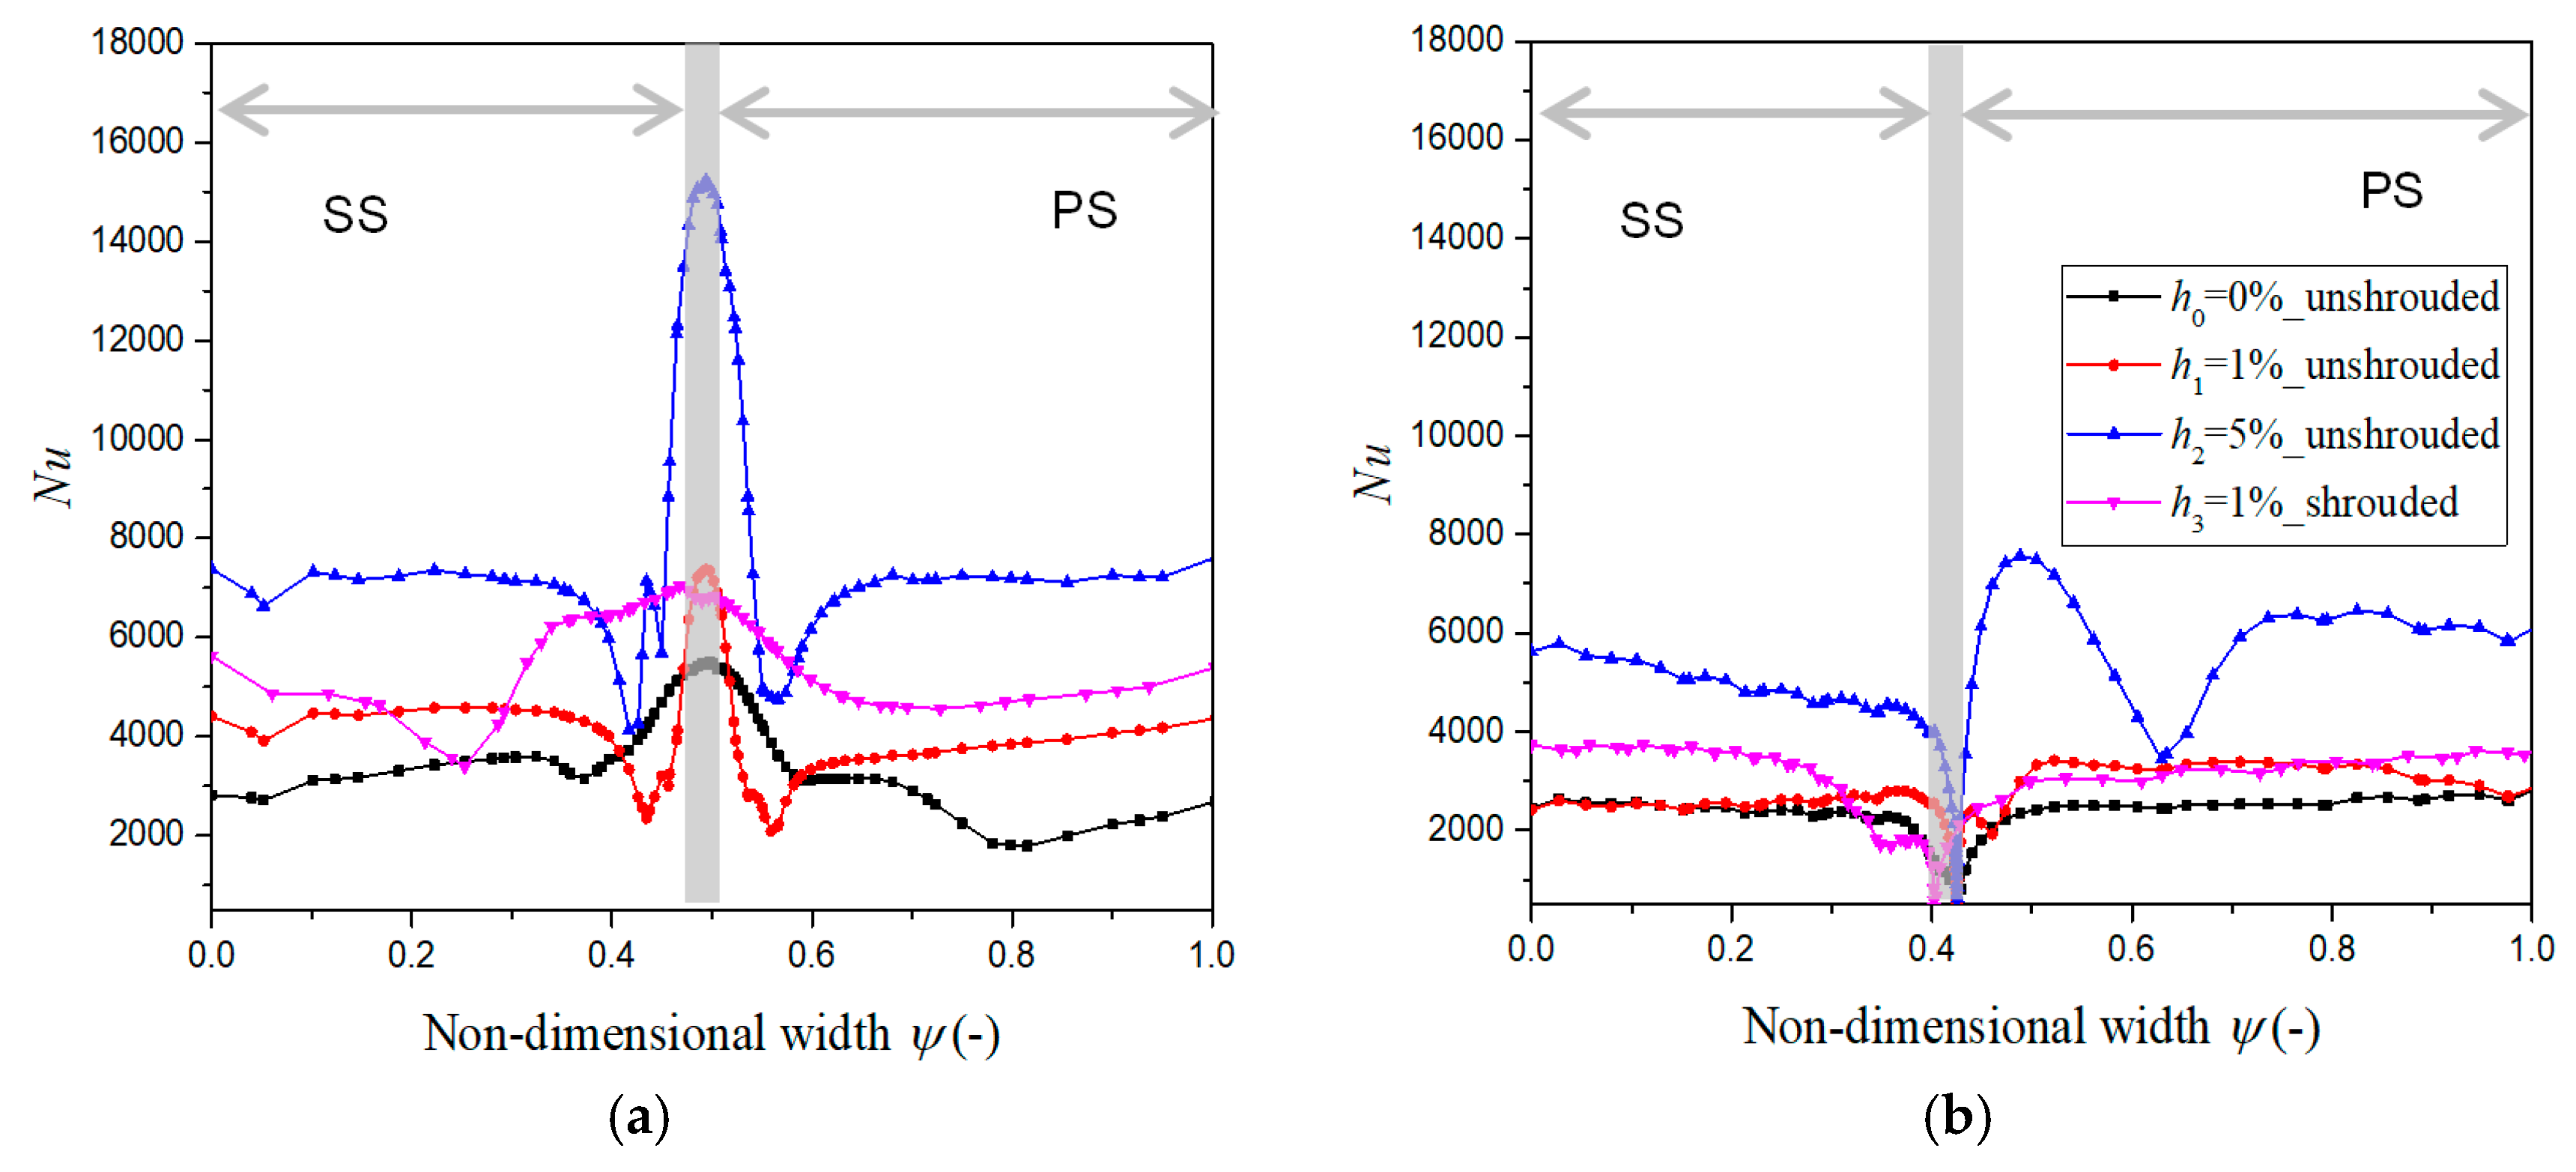
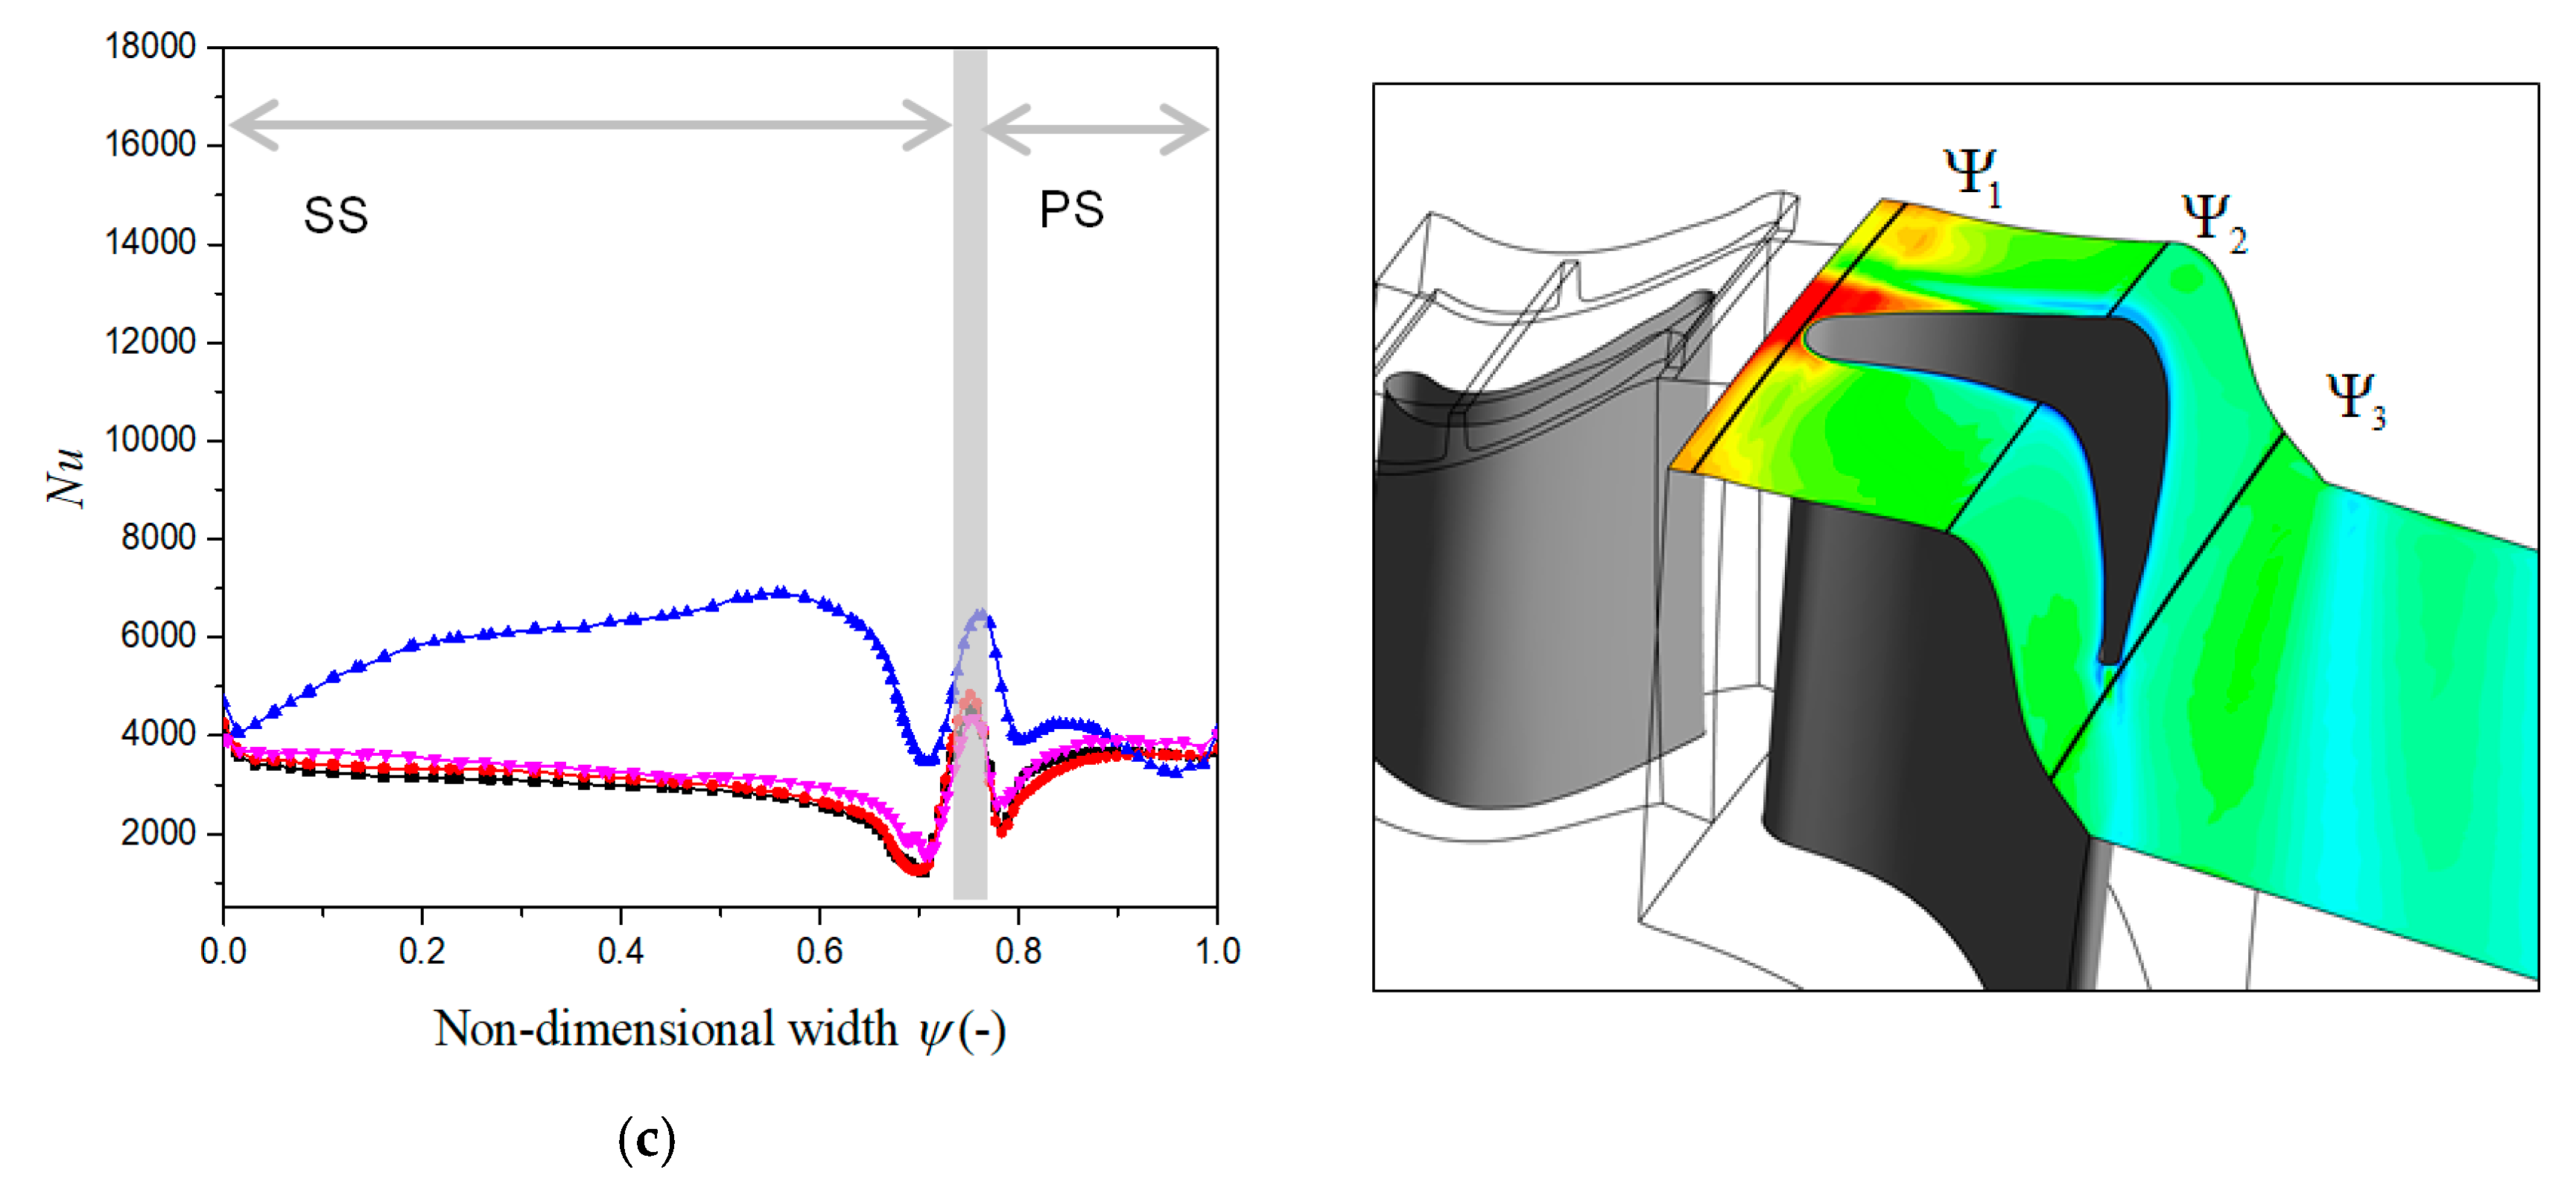
To find the local relationship between flow and heat transfer, Figure 18 shows the local Nu number distribution on the casing along the dimensionless curve width ψ for the three curves Ψ1, Ψ2 and Ψ3. Curve Ψ1 is tangent to the leading edge of S2 and parallel to the inlet cross-section. Curve Ψ2 is located at 0.5 times the axial chord strength and is parallel to curve Ψ1. Curve Ψ3 is tangent to the trailing edge and parallel to curve Ψ2. In curve Ψ1, Nu is the maximal of the vane for both cases, since the formation of the horseshoe vortex induces high velocities toward the endwall. Among the cases, the leading edge HTC and channel significantly increased with the increase oftip clearance size of R1. The HTC of the h2 = 5%_unshrouded case was 2.5 times that of the h1 = 1%_unshrouded case. The h3 = 1%_shrouded case made the leading edge heat load distribution more uniform and slightly increased the HTC of the pressure surface. In curves Ψ2 and Ψ3, only the over-sized h2 = 5%_unshrouded case had a significant influence on the HTC of the casing. In curve Ψ2, the HTC of the pressure surface was mainly increased. On curve Ψ3, the HTC of the suction surface was mainly increased. Other tip clearance models had little effect on the HTCs of curve Ψ3.

3.4. Comparison of Aerodynamics and Heat Transfer Performance of S2

The Cp and area-averaged casing heat flux of S2 for the four cases are shown in Table 4. In general, the Cp of the large meridional expansion S2 increases significantly with the increase of the upstream R1 clearance. At the same time, the heat flux of the casing also increases with increase of the clearance. Compared to the h3 = 1% _shrouded and h1 = 1% _unshrouded cases, R1 with shroud makes blade heat flux decrease 5% and casing heat flux increase by 2.6%. The shrouded R1 increases the aerodynamic loss of S2 by 1.4%.

4. Conclusions

An efficient numerical method was employed to investigate the aerodynamics and heat transfer in different tip clearances on a 1.5-stage turbine with large meridional expansion. The influence of tip leakage flow on the flow and heat transfer characteristics of the downstream large meridional expansion stator blade was discussed. Some important conclusions based on the investigation presented in the paper are summarized as follows:
  • The passage vortices moved obviously toward the middle of the large meridional expansion stator at the span position. The separation and attachment point of the horseshoe vortex on the pressure side had an advance of 15%, when compared with non-expansion stators.
  • The increase of clearance size increased the strength of the tip leakage vortex and made it move toward the middle of the blade passage. The tip leakage vortex increased the local negative incidence angle of the downstream stator.
  • For the downstream large meridional expansion stator, the upstream rotor tip clearance mainly affected the static pressure coefficient of 60% in front of the suction pressure. The shrouded rotor could reduce the adverse-pressure region by 25%.
  • The shrouded rotor increased the upper passage vortex of the downstream large meridional expansion stator.
  • The upstream tip leakage vortex significantly increased the high heat transfer area of a large meridional expansion stator suction surface. The intensity of the heat transfer area was significantly reduced by the upstream rotor with shroud.
  • The upstream tip leakage vortex mainly enhanced the heat transfer coefficient of the leading edge of the endwall, while the upstream shrouded rotor blade helped the heat transfer coefficient of the leading edge to be more uniform.

Author Contributions

F.M. wrote the paper; W.F. helped to conceive the simulations and J.G. helped with the performance. Analysis and discussion of the results were carried out by F.M. and Q.Z.

Funding

This research was funded by the National Natural Science Foundation of China (Grant No. 51779051), the Natural Science Foundation of Heilongjiang Province, China (Grant No. QC2016059) and the Fundamental Research Funds for the Central Universities of China (Number HEUCFP201720).

Conflicts of Interest

The authors declare no conflict of interest.

Nomenclature

Roman and Greek
NuNusselt number
ppressure, kPa
qheat flux, kW/ m 2
Ttemperature, K
T aw adiabatic wall temperature, K
T g gas temperature, K
T w isothermal wall temperature, K
uvelocity, m/s
T 01 inlet temperature, K
Ωrotation tensor
Sstrain tensor
Cvane midspan true chord
kthermal conductivity
p ¯ t , out average relative total pressure at the outlet, kPa
p ¯ t , i n average relative total pressure at the inlet, kPa
ptlocal relative total pressure, kPa
p ¯ s , o u t average static pressure at the outlet, kPa
Cpsstatic pressure coefficient
ψdimensionless curve width
Ψcurve
Subscripts, Superscripts, Abbreviations
R1first rotor
S1first stator
S2second stator
Expexperimental
PS, SSpressure side, suction side
CFDcomputational fluid dynamics
HTCheat transfer coefficient
SSTshear stress transport
TLVtip-leakage vortex
SVshed vortex
AITEBAerothermal Investigation in Turbine Endwalls and Blades
RANSReynolds-Averaged Navier-Stokes

References

  1. Bunker, R.S. Axial turbine blade tips: Function, design, and durability. J. Propuls. Power 2006, 22, 271–285. [Google Scholar] [CrossRef]
  2. Lin, A.; Sun, Y.; Zhang, H.; Lin, X.; Yang, L.; Zheng, Q. Fluctuating characteristics of air-mist mixture flow with conjugate wall-film motion in a compressor of gas turbine. Appl. Therm. Eng. 2018, 142, 779–792. [Google Scholar] [CrossRef]
  3. Lattime, S.B.; Steinetz, B.M. High-pressure-turbine clearance control systems: Current practices and future directions. J. Propuls. Power. 2004, 20, 302–311. [Google Scholar] [CrossRef]
  4. Ducoin, A.; Shadloo, M.S.; Roy, S. Direct Numerical Simulation of flow instabilities over Savonius style wind turbine blades. Renew. Energy 2017, 105, 374–385. [Google Scholar] [CrossRef]
  5. Denton, J.D. Loss mechanism in turbomachines. J. Turbomach. 1993, 115, 621–656. [Google Scholar] [CrossRef]
  6. Korschunov, B.A.; Döhler, S.W. Einfluß von Leckageströmungen an der Laufradspitze auf die aerodynamischen Characteristic des folgenden Leitgitters. BWKBd 1996, 48, 49–55. [Google Scholar]
  7. Anker, J.E.; Mayer, J.F. Simulation of the interaction of labyrinth seal leakage flow and main flow in an axial turbine. In Proceedings of the ASME Turbo Expo 2002: Power for Land, Sea, and Air, Amsterdam, The Netherlands, 3–6 June 2002. [Google Scholar]
  8. Peters, P.; Breisig, V.; Giboni, A.; Lerner, C.; Pfost, H. The influence of the clearance of shrouded rotor blades on the development of the flow field and losses in the subsequent stator. In Proceedings of the ASME Turbo Expo 2000: Power for Land, Sea, and Air, Munich, Germany, 8–11 May 2000. [Google Scholar]
  9. Duchaine, F.; Corpron, A.; Pons, L. Development and assessment of a coupled strategy for conjugate heat transfer with large eddy simulation: Application to a cooled turbine blade. Int. J. Heat Fluid Flow 2009, 30, 1129–1141. [Google Scholar] [CrossRef]
  10. Tafti, D.K.; He, L.; Nagendra, K. Large eddy simulation for predicting turbulent heat transfer in gas turbines. Philos. Trans. A Math. Phys. Eng. Sci. 2014, 372, 20130322. [Google Scholar] [CrossRef]
  11. Haselbach, F.; Schiffer, H.P. Aerothermal investigations on turbine endwalls and blades (AITEB). In Proceedings of the ASME Turbo Expo 2004: Power for Land, Sea, and Air, Vienna, Austria, 14–17 June 2004. [Google Scholar]
  12. Dannhauer, A. Analysis of cooling effectiveness and heat transfer variations on the endwall of a nozzle guide vane caused by turbine leakage flows. In Proceedings of the ASME Turbo Expo 2008: Power for Land, Sea, and Air, Berlin, Germany, 9–13 June 2008. [Google Scholar]
  13. Rehder, H.-J.; Dannhauer, A. Experimental Investigations of Turbine Leakage Flows on the Flow Field and Endwall Heat Transfer. J. Turbomach. 2007, 129, 608–618. [Google Scholar] [CrossRef]
  14. Qureshi, I.; Smith, A.D.; Povey, T. HP Vane Aerodynamics and Heat Transfer in the Presence of Aggressive Inlet Swirl. J. Turbomach. 2012, 135, 021040. [Google Scholar] [CrossRef]
  15. Fu, W.L.; Gao, J.; Liang, C.; Wang, F.K.; Zheng, Q.; Zhou, E.D. Experimental investigation on the annular sector cascade of a high endwall-angle turbine. In Proceedings of the ASME Turbo Expo 2016: Turbomachinery Technical Conference and Exposition, Seoul, Korea, 13–17 June 2016. [Google Scholar]
  16. Ameri, A.A.; Steinthorsson, E.; Rigby, D.L. Effect of squealer tip on rotor heat transfer and efficiency. J. Turbomach. 1998, 120, 753–759. [Google Scholar] [CrossRef]
  17. Balasubramanian, R.; Barrows, S.; Chen, J. Investigation of shear-stress transport turbulence model for turbomachinery applications. In Proceedings of the 46th AIAA Aerospace Sciences Meeting and Exhibit, Reno, NV, USA, 7–10 January 2006. [Google Scholar]
  18. Krishnababu, S.K.; Newton, P.J.; Dawes, W.N.; Lock, G.D.; Hodson, H.P.; Hannis, J.; Whitney, C. Aero-thermal investigations of tip leakage flow in axial flow turbines: Part I—Effect of tip geometry and tip clearance gap. In Proceedings of the ASME Turbo Expo 2007: Power for Land, Sea, and Air, Montreal, QC, Canada, 14–17 May 2007. [Google Scholar]
  19. Vidal, A.; Nagib, H.M.; Vinuesa, R. Vorticity fluxes and secondary flow: Relevance for turbulence modeling. Phys. Rev. Fluids 2018, 3, 072602(R). [Google Scholar] [CrossRef]
  20. Marin, O.; Vinuesa, R.; Obabko, A. Characterization of the secondary flow in hexagonal ducts. Phys. Fluids 2016, 28, 125101. [Google Scholar] [CrossRef] [Green Version]
  21. Zuckerman, N.; Lior, N. Impingement heat transfer: Correlations and numerical modeling. J. Heat Transf. 2005, 127, 544–552. [Google Scholar] [CrossRef]
  22. Bonelli, F.; Viggiano, A.; Magi, V. A numerical analysis of hydrogen underexpanded jets. In Proceedings of the Internal Combustion Engine Division Spring Technical Conference, Piemonte, Italy, 6–9 May 2012. [Google Scholar]
  23. Luo, J.; Razinsky, E.H. Prediction of heat transfer and flow transition on transonic turbine airfoils under high freestream turbulence. In Proceedings of the ASME Turbo Expo 2008: Power for Land, Sea, and Air, Berlin, Germany, 9–13 June 2008. [Google Scholar]
  24. Montomoli, F.; Adami, P.; Martelli, F. A finite-volume method for the conjugate heat transfer in film cooling devices. Proc. Inst. Mech. Eng. A J. Power Energy 2009, 223, 191–200. [Google Scholar] [CrossRef]
  25. El-Gabry, L.A.; Ameri, A.A. Comparison of steady and unsteady RANS heat transfer simulations of hub and endwall of a turbine blade passage. J. Turbomach. 2011, 133, 031010. [Google Scholar] [CrossRef]
  26. Jeong, J.; Hussain, F. On the identification of a vortex. J. Fluid Mech. 1995, 285, 69–94. [Google Scholar] [CrossRef]
  27. Sieverding, C.H. Understanding secondary flows in turbine bladings. In Proceedings of the State-of-the-Art & Impact on Blade Design, Gas Turbine Engineering Lecture Series, Orlando, FL, USA, 11–13 August 2004. [Google Scholar]
  28. Langston, L.S. Secondary flows in axial turbines—A review. Ann. N. Y. Acad. Sci. 2001, 934, 11–26. [Google Scholar] [CrossRef]
  29. Kost, F.; Nicklos, M. Film-cooled turbine endwall in a transonic flow field: Part I—Aerodynamic measurements. In Proceedings of the ASME Turbo Expo 2001: Power for Land, Sea, and Air, New Orleans, Louisiana, 4–7 June 2001. [Google Scholar]
  30. Laveau, B.; Abhari, R.S.; Crawfold, M.E.; Lutum, E. High resolution heat transfer measurements on the stator endwall of an axial turbine. In Proceedings of the ASME Turbo Expo 2014: Turbine Technical Conference and Exposition, Düsseldorf, Germany, 16–20 June 2014. [Google Scholar]
  31. Benner, M.W.; Sjolander, S.A.; Moustapha, S.H. Measurements of secondary flows in a turbine cascade at off-design incidence. In Proceedings of the ASME Turbo Expo 1997: International Gas Turbine and Aeroengine Congress and Exhibition, Orlando, FL, USA, 2–5 June 1997. [Google Scholar]
  32. Ricardo, V.; Carlos, R.Ö. Revisiting History Effects in Adverse-Pressure-Gradient Turbulent Boundary Layers. Flow Turbul. Combust. 2017, 99, 565–587. [Google Scholar] [Green Version]
  33. Méndez, M.; Shadloo, M.S.; Hadjadj, A.; Ducoin, A. Boundary Layer Transition Over a Concave Surface Caused by Centrifugal Instabilities. Comput. Fluids 2018, 171, 135–153. [Google Scholar] [CrossRef]
  34. Salvadori, S.; Montomoli, F.; Martelli, F. Analysis on the Effect of a Nonuniform Inlet Profile on Heat Transfer and Fluid Flow in Turbine Stages. ASME J. Turbomach. 2011, 134, 011012. [Google Scholar]
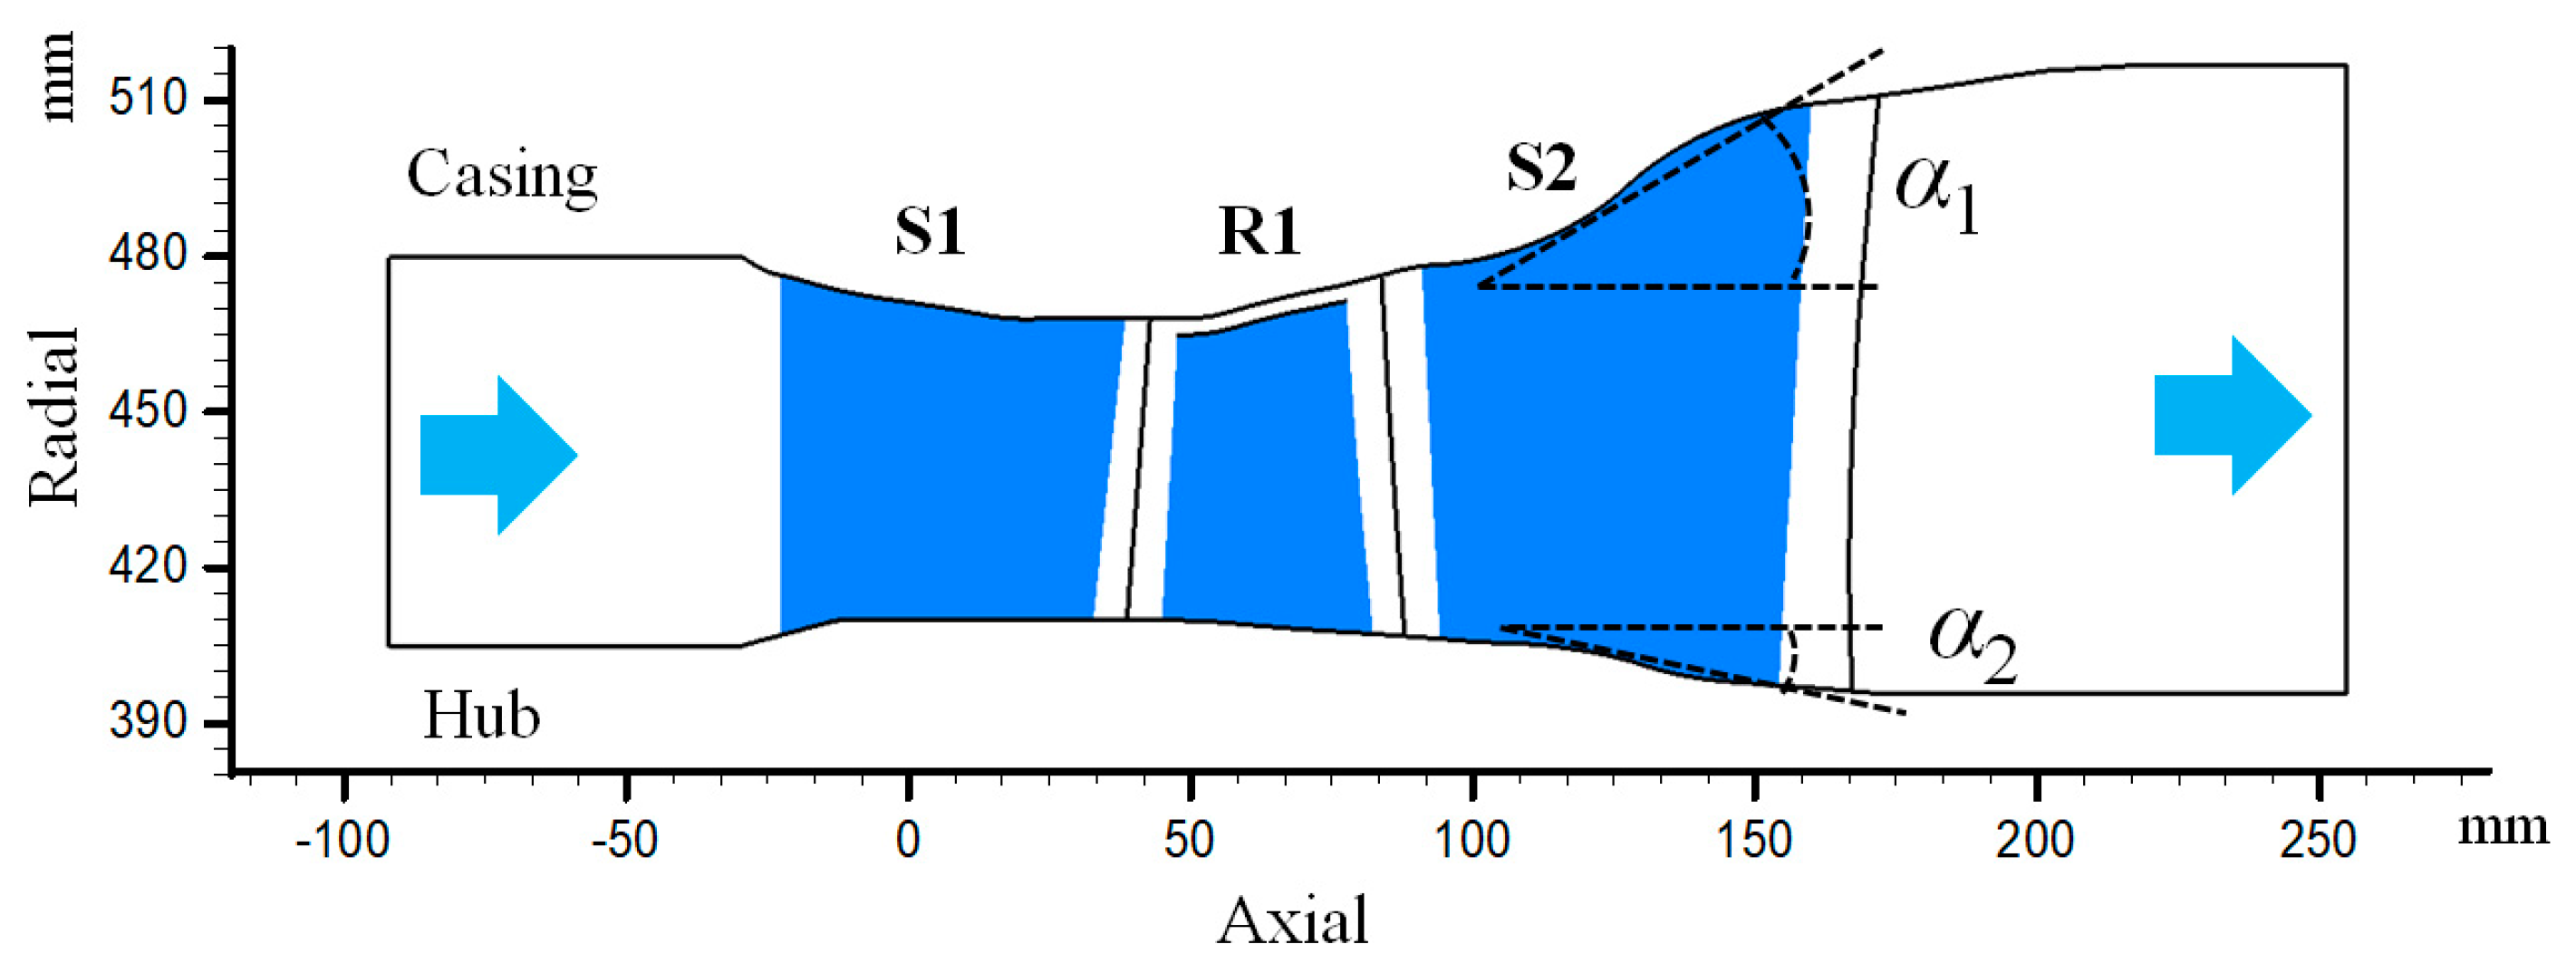
Figure 1. Meridional passage of a 1.5-stage turbine.
Energies 12 00162 g001
Figure 2. Computational mesh domain of turbine with shrouded R1.
Energies 12 00162 g002
Figure 3. Blade-to-blade grid view of the turbine with shrouded R1.
Energies 12 00162 g003
Figure 4. S2 isentropic Mach number at 90% span for uniform inlet conditions.
Energies 12 00162 g004
Figure 5. Nu distribution of the S2 casing.
Energies 12 00162 g005
Figure 6. Definition of the tip clearance of R1.
Energies 12 00162 g006
Figure 7. Vortex structures of S2 by isosurface of Q-criterion in the h0 = 0%_unshrouded case.
Energies 12 00162 g007
Figure 8. Numerical oil flow visualization on the S2 casing in the h0 = 0%_unshrouded case.
Energies 12 00162 g008
Figure 9. Entropy-increase contour at 110% of the axial chord of R1: (a) h0 = 0%_unshrouded; (b) h1 = 1%_unshrouded; (c) h2 = 5%_unshrouded; (d) h3 = 1%_shrouded.
Energies 12 00162 g009
Figure 10. Span wise mass-averaged inlet flow angle of S2.
Energies 12 00162 g010
Figure 11. Characteristics of the S2 inlet flow angle.
Energies 12 00162 g011
Figure 12. Blade static pressure coefficient distribution at the 90% span of S2.
Energies 12 00162 g012
Figure 13. Characteristics of the adverse-pressure region at the 90% span of S2.
Energies 12 00162 g013
Figure 14. Entropy-increase contour at 110% of the axial chord of S2: (a) h0 = 0%_unshrouded; (b) h1 = 1%_unshrouded; (c) h2 = 5%_unshrouded; (d) h3 = 1%_shrouded.
Energies 12 00162 g014
Figure 15. Span-wise mass-averaged entropy-increase at 110% of the axial chord of S2.
Energies 12 00162 g015
Figure 16. Nu distribution of the S2 blade suction surface and characteristics of the PV region: (a) h0 = 0%_unshrouded; (b) h1 = 1%_unshrouded; (c) h2 = 5%_unshrouded; (d) h3 = 1%_shrouded; (e) Characteristics of PV region.
Energies 12 00162 g016
Figure 17. Numerically simulated streamlines at the casing with the Nu distribution of S2: (a) h0 = 0%_unshrouded; (b) h1 = 1%_unshrouded; (c) h2 = 5%_unshrouded; (d) h3 = 1%_shrouded.
Energies 12 00162 g017aEnergies 12 00162 g017b
Figure 18. Distribution of Nu on the casing along the dimensionless curve width ψ for the three curves (Ψ1-Ψ3): (a) Curve Ψ1; (b) Curve Ψ2; (c) Curve Ψ3.
Energies 12 00162 g018aEnergies 12 00162 g018b
Table 1. Design parameters of the 1.5 stage turbine.
Parameters NameValue
Inlet total pressure (kPa)1947.4
Inlet total temperature (K)1543.9
Exit static pressure (kPa)396.7
Inlet flow angle (°)0
Design mass flow rate (kg/s)76.5
Inlet hub/tip radius ratio (S1,R1,S2)0.864, 0.886, 0.863
Exit hub/tip radius ratio (S1,R1,S2)0.886, 0.868, 0.797
Pitch at midspan (mm) (S1,R1,S2)71, 36, 61
Number of vanes (S1,R1,S2)40, 86, 45
Tg/Tw1.5
Table 2. Mesh independence of the total pressure loss coefficient and area-averaged casing heat flux of S2 with unshrouded R1.
Number of Mesh Nodes (million)Loss Coefficient CpArea-Averaged Casing Heat Flux (w/m2)Simulation Time (103 s)
Mesh-13.090.13095537815618.9
Mesh-27.260.12610238520124.7
Mesh-311.320.12608238315327.7
Table 3. Gap configuration parameter and code.
SchemesParameter Setting ValueCode
Case 0h0 = 0% blade height0 mmh0 = 0%_unshrouded
Case 1h1 = 1% blade height0.6 mmh1 = 1%_unshrouded
Case 2h2 = 5% blade height2.9 mmh2 = 5%_unshrouded
Case 3h3 = 1% blade height
h4 = 2% blade height
0.6 mm
1.2 mm
h3 = 1%_shrouded
Table 4. Loss coefficient and area-averaged casing heat flux.
CaseLoss Coefficient CpArea-Averaged Blade Heat Flux (w/m2)Area-Averaged Casing Heat Flux (w/m2)
h0 = 0%_unshrouded0.126082441894383153
h1 = 1%_unshrouded0.135743478626454382
h2 = 5%_unshrouded0.167639624361687022
h3 = 1%_shrouded0.137689454125466300