Article

Environmental Impact and Carbon Footprint Assessment of Taiwanese Agricultural Products: A Case Study on Taiwanese Dongshan Tea

1
Institute of Environmental Engineering and Management, National Taipei University of Technology, Taipei 106, Taiwan
2
School of Business, University of Western Sydney, Penrith South DC, NSW 2750, Australia
3
Natural Science, University of Western Sydney, Penrith South DC, NSW 2750, Australia
*
Author to whom correspondence should be addressed.
Energies 2019, 12(1), 138; https://doi.org/10.3390/en12010138
Submission received: 27 November 2018 / Revised: 18 December 2018 / Accepted: 26 December 2018 / Published: 1 January 2019
(This article belongs to the Special Issue Modeling and Simulation of Carbon Emission Related Issues)

Abstract

:
Climate change is an important global environmental threat. Agriculture aggravates climate change by increasing greenhouse gas (GHG) emissions, and in response, climate change reduces agricultural productivity. Consequently, the modern agricultural development mode has progressively transformed into a kind of sustainable development mode. This study aimed to determine the environmental impact and carbon footprint of Dongshan tea from Yilan County. Environmental impact was assessed with use of SimaPro version 8.0.2 and IMPACT2002+. Results showed that climate change has the largest impact upon it in general, followed by human health, natural resources, and ecosystem quality. Furthermore, with use of the IPCC 2007 100a method for carbon footprint of products (CFP), conventional tea was found to have a CFP of 7.035 kgCO2-e, and its main contributors are the raw material (35.15%) and consumer use (45.58%) phases. From this case study, we found that the hotspots of the life cycle of environmental impact of Taiwanese tea mainly come from fertilizer input during the raw material phase, electricity use during manufacturing, and electricity use during water boiling in the consumer use phase (which contributes the largest impact). We propose the ways for consumers to use of highly efficient boiling water facilities and heating preservation, and the government must market the use of organic fertilizers in the national policy subsidies, and farmers have to prudent use of fertilizers and promote the use of local raw fertilizers, and engagement in direct sales for reducing the environmental impacts and costs of agricultural products and thus advancing sustainable agriculture development.

1. Introduction

The IPCC Fifth Assessment Report states that greenhouse gas (GHG) emissions from human activity have been the major factor for global warming since the middle of the 20th century. Agriculture and relevant land use transition contributed 17% of the world’s anthropogenic GHG emissions in 2010 [1]. FAO [2] predicts a population of nine billion people by 2050, and to have sufficient food supply, agricultural production should increase by 60% by the same year. This assumption has resulted in the over-intensification of agriculture production systems that fail to consider the environmental impact of agricultural activities, causing several adverse effects on environment, such as water pollution, soil degradation and erosion, biodiversity loss, and deforestation [3,4]. Environmental sustainability is a challenge for agriculture, given that the latter is a major contributor of global environmental impacts, especially land degradation, freshwater depletion, nutrient and pesticide pollution, and GHG emissions [5,6]. Climate change can interfere with food availability; for example, temperature rise, precipitation pattern changes, extreme weather events, crop pests, disease outbreaks, and water shortage may result in the reduction of agricultural productivity [7,8]. Therefore, weakening the risks posed by climate change to food security is a major challenge.
Sustainable agriculture is based on emphasizing environmental quality, improving agronomic productivity, and minimizing global climate change. It is a type of agriculture that uses external energy inputs lightly and efficiently and may involve decreases in industrial mineral fertilizers, agrochemical input, and increases in the profit margins of farming systems [9,10]. Sustainable agricultural systems will require a conversion from the dominant industrial agriculture formation to one that conserves water and land, along with plant and animal genetic resources, and that is environmentally non-degrading, economically viable, technically appropriate, and socially acceptable [11,12]. Sustainable agriculture can raise productivity and meet sustainability criteria to satisfy increasing human needs meanwhile contributing to the recovery and sustainability of landscapes, the biosphere, and the earth systems [13].
Life cycle assessment (LCA) is a suitable and powerful means to evaluate environmental impact. It links up with a product, producing process, or activity during its life cycle from raw material extraction or production to final disposal, namely, “cradle to grave.” Moreover, LCA is the method that can assess the whole life cycle of a product or service. In the last few years, this methodology has begun to concentrate on agriculture and its affected environmental impacts, such as climate change, eutrophication, acidification, nutrients, fertilizers, and crops [14,15,16]. However, studies rarely consider the entire agricultural system, which comprises various activities (e.g., cropping, breeding, nutrient leaching) and materials (e.g., fertilizer, feeds), which would provide a systematic analysis and comprehensive strategies [17]. Environmental LCA is a significant method for presenting environmental improvements, given that it quantifies sources of impacts throughout a product’s life cycle for various environmental impacts, thereby allowing environmental improvements to be determined and ranked; this method has been confirmed to be useful [18,19,20,21]. The concept of circular economy is changing our awareness on waste. Life cycle assessment (LCA) is a method to assess environmental impacts by recycling, recycling and recycling from cradle to cradle to narrow the generation of waste [22].
Taiwan imports more than 90% of its energy and suffers from the effects of climate change, including sea level rise and the resulting energy instability and GHG emission offset, which are now serious problems facing the country [23]. Environmental sustainability is a challenge for agriculture, given that the latter substantially contributes to global environmental impacts, especially land degradation, freshwater scarcity, pesticide pollution, and GHG emissions [24]. Tea is an important domestic economic crop in Taiwan [25]. Therefore, Dongshan tea was selected as the object of this study, and the study region was Yilan County. This work specifically aimed to accomplish the following:
(1)
Comprehend the environmental impact from the carbon emission and life cycle of Dongshan tea via LCA;
(2)
Determine the carbon emission sources from Dongshan tea from cradle to grave according to the results of LCA;
(3)
Assess the study results and propose proper countermeasures for reducing environmental impact and carbon emission.
Tea is primarily produced from the leaves of the plant Camellia sinensis and is the oldest and a commonly consumed beverage in the world because of its refreshing effect and mild stimulant properties, as well as the medicinal and general health-promoting properties produced by three major characteristic secondary metabolites (catechins, theanine, and caffeine); tea has had enormous medical, economic, and cultural importance since ancient times [26,27]. Tea production is geographically limited to a few areas around the world. In 2009 to 2013, global tea production grew 20 percent rate to reach 5.06 million tonnes, as shown in Figure 1 [28]; furthermore, world tea production is projected to reach 8.07 million tonnes in 2027 [29]. Recently, the production and consumption of tea have dramatically increased. Over two billion people drink tea in more than 125 countries [30]. Its remarkable health benefits are the main reason for its consumption [31,32]. However, many studies have discovered that tea expansion causes disturbances to ecosystems, threatens biodiversity preservation, and increases carbon dioxide emissions [33]. The interaction between agriculture and the natural environment is strong, and investigations on the contribution of farming systems to environmental degradation have been increasing gradually in regions with intensive agriculture practices. As for the increasing consumer awareness and interest in sustainability issues, the assessment of environmental impact and the usage of resources in distribution systems and food production have become indispensable [34].
The life cycle concept is being increasingly emphasized and regarded as a main idea in ensuring the transition to sustainable production and consumption patterns. LCA has been used broadly for assessing agricultural systems and food processing and manufacturing activities for ensuring sufficient and thorough support in decision-making under business and policy development circumstances [15]. Therefore, an extensive review of literature was conducted by the current work to sort out studies that contained subjects related to LCA for the same agricultural products. Then, their assessment tools were assessed for the main applying direction for the cases that use LCA. Results are shown in Table 1.
Researches on LCA for tea have generally focused on cradle to grave in environmental impact and overall sustainability analyses. Farshad et al. [35] worked on an environmental–economic analysis of tea’s life cycle in Iran from cradle to grave. LCA results indicated that the major pollutant inputs were machinery and diesel fuel in farms and factories, whereas the three-layer packaging design had the smallest environmental impact. Munasinghe et al. [36] focused on environmental impacts, economic, social, and overall sustainability of the tea sector in Sri Lanka from cradle to grave. Their results showed that energy use was highest during the consumer use phase; CO2 emission was highest (44–47%) during the packaging phase; labor use was highest during the cultivation phase; and cost was highest in the cultivation and purchasing phases. Chen et al. [38] studied the Organic Tea Product Supply Chain Process Map and Carbon Footprint of Taiwan from cradle to grave. LCA results found that the carbon footprint of tea was 12.53 CO2eq/kg, which was highest (48.87%) during the raw material phase, followed by the consumer use phase (31.8%). Fertilizer use during the raw material phase and energy use during the consumer use phase were the identified hotspots.
In the field of LCA research on vegetables, Li et al. [39] studied a highly diverse vegetable multi-cropping system in Fengqiu County (China) from farm gate to farm gate. Results showed that a vegetable multi-cropping system would cause even fewer environmental impacts compared with a single-cropping system. Shen et al. [40] studied the three facility modes of vegetable production in China from farm gate to farm gate. LCA results indicated that the serious impact on fresh water depletion and human, fresh water, and terrestrial toxicity is solar greenhouse. Furthermore, the venlo-greenhouse environmental impacts are 101 and 740 times more serious than the solar greenhouse and pollution-free approaches, respectively. Theurl et al. [41] studied unheated, soil-grown winter vegetables in Austria via LCA from “cradle to gate”. LCA results found that unheated winter vegetable production was more feasible than existing systems in Austria and Italy.
In the field of LCA research on fruits, Liu et al. [42] studied fossil energy use and greenhouse emission in Chinese pear production from cradle to gate. LCA results showed that GHG emissions in the pear production chain can be reduced by the use of manure in biogas production, transition from conventional farming to organic farming, and reducing of mechanical cultivation. For reducing environmental impacts, LCA could be applied as a means to conduct selections of agricultural inputs. The work of Ingrao et al. [43] highlighted environmental hotspots in Sicilian peach production systems from cradle to grave. LCA results found that irrigation methods had the most serious impact due to the use of large volumes of water and energy. With improvements in irrigation methods, the production process and usage of agricultural machinery can reduce GHG emissions. Longo et al. [44] studied organic and conventional apple supply chains in the north of Italy from cradle to gate. LCA results showed that a considerable share of the overall energy and environmental impacts in farming was because of the diesel consumption of agricultural machines and the use of fertilizers and pesticides.
Research on the sustainability of tea production and consumption shall produce important information about means of improving the global tea industry and about output key experiences for a broad range of other agri-industries and contribute greatly to make development more sustainable [36]. According to Table 1, environmental LCA is a useful means for reporting environmental improvements, given that it quantifies causes of impacts across the product’s life cycle for a range of environmental impacts and provides relevant facts and information that can guide decisions on practice change. By contrast, substantial research methods of LCA are available, but most of them are complex and time consuming. Therefore, the simplification and standardization of LCA methods will assist in the development of sustainable agri-industries.

2. Materials and Methods

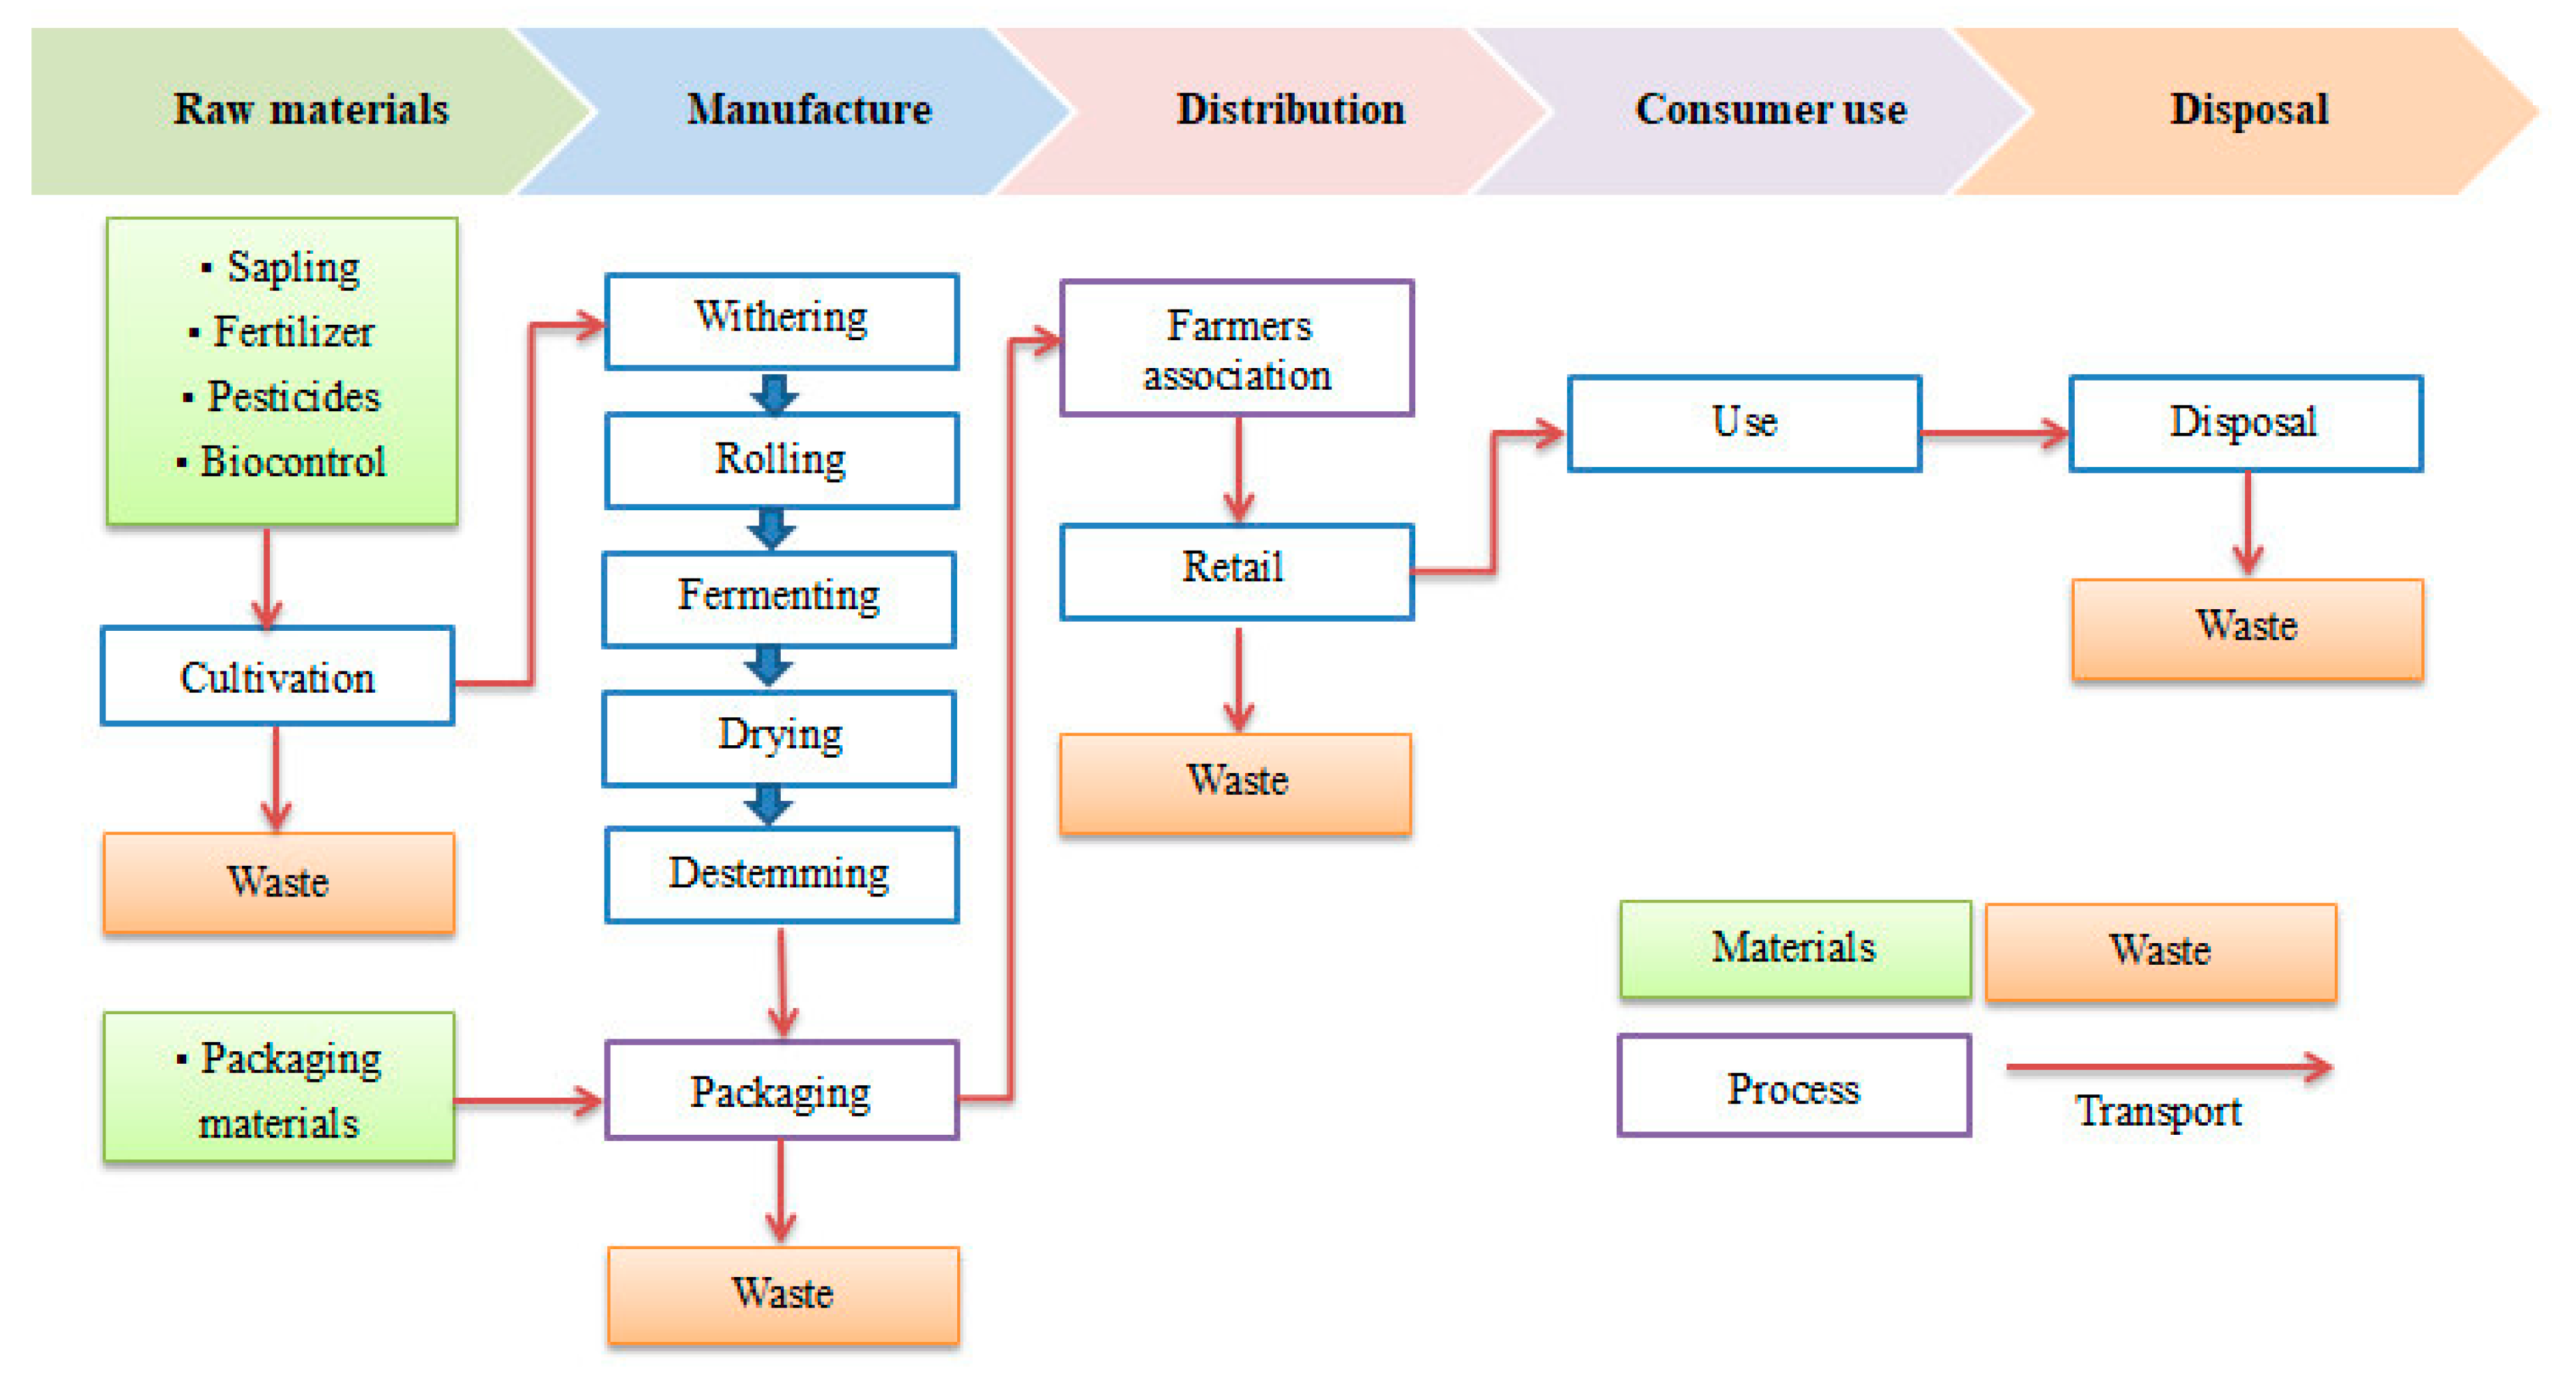
2.1. Study Scope and Goal

Defining system boundaries on the basis of related goals is the first step in LCA (Figure 2). Dongshan Township (Yilan County) in the east of Taiwan was the main field in this study. Tea is the major crop in the area, which measures approximately 0.41 hectare and tea production volume is approximately 150 kg. Teas have been produced here since 1987, and tea saplings originate from Nantou. Even without applications for organic certification, mountain spring water is being used for irrigation, and soybean meal is being applied as base fertilizer, aided with a few chemical fertilizers and pesticides. The cultivation method is relatively eco-friendly [45].
Field investigation and literature collection were conducted for assessing the cradle-to-grave data, including materials obtained, manufacturing, distribution and transportation, consumer use, and disposal and recycling phases. A PAS 2050-based LCA approach was used to evaluate the environmental impact and carbon emission from each phase through SimaPro 8.0.2 (PRé Consultants B.V., Amersfoort, the Netherlands), and the concept of LCA was employed for determining the environmental impact and carbon emission of the product and for proposing countermeasures for carbon emission reduction.

2.2. Life Cycle Inventory (LCI) Analysis and Limited

LCI analysis is the second step in LCA; it aims to obtain an accurate study of product carbon footprint. Although PAS 2050, TS-Q 0010, and Product Life Cycle Accounting and Reporting Standard and ISO14067 all consider that treatments of specific emissions and removals are given of land use change, renewable power resources, and carbon storage, as well as delayed emissions, these approaches are different and incomplete [46]. Inventory data for the study were obtained from face-to-face interviews, databases, and other studies; however, the inventory of land use change, delayed emissions, renewable power resources, and carbon storage was excluded from this study due to limited manpower and material resources [46], and CO2 absorption by growing plants was not considered [47].
Data collected from tea sapling acquisition, transport, and disposal phases were from the factories. Data for cultivation (Compound fertilizer (15-15-15 = 15% nitrogen, 15% phosphorus, and 15% potassium), Soybean meal (6.8-1.5-2.3), pesticide (herbicide), gasoline for transport, PE barrel, and PVC tube) and manufacturing (withering, rolling, fermenting, drying, sorting, and packaging) were collected from factories and other in-country studies [48]. At the consumer use phase, relevant emissions, such as boiling water used to brew tea, were assessed. In this study, 1 kg tea was assigned as the functional unit; 10 g tea and 0.5 L water were assigned for the consumer use phase; and 0.06 kWh from using an electric kettle with grid electricity for boiling a pot of water and 0.35 L wastewater was assumed to be energy consumption for assessment. The LCI result for a 150 kg production in 0.41 ha land use is shown in Table 2.

2.3. Carbon Footprint Analysis

For quantifying the GHG impact of a product, PAS 2050, TS-Q 0010, Product Life Cycle Accounting and Reporting Standard, and ISO14067 provide principles and requirements. Although methodologies and procedures of these standards are similar, some differences still exist; quantization evolving from GHG activity data multiplied by GHG emission or removal factors is recommended and in common use [46]. In this study, this equation was used to quantify the carbon footprint for Dongshan tea from cradle to grave.
Emission factors were mainly obtained from the database of Taiwan Environmental Protection Administration, and the rest were based on the SimaPro 8.0.2 database and other public data. The GWP value was used on the basis of IPCC 2007 100a, and the carbon dioxide emissions generated from electricity consumption (0.532 kg CO2e/KWh) were determined by Taiwan’s National Greenhouse Gas Registry website [49].

2.4. Life Cycle Impact Assessment (LCIA)

Environmental impacts were assessed using IMPACT2002+, with an assessment pattern involving five steps, namely, characterization, damage assessment, normalization, weighting, and single score computation [50]. This assessment method indicates a workable implementation of a combined midpoint and damage approach, integrating all kinds of life cycle inventory results from 13 midpoint categories to four damage categories. These midpoint categories can make the interpretation easier and more useful for optimizing the damage categories [51].
The 13 midpoint categories of IMPACT 2002+ are carcinogens, respiratory, noncarcinogens, inorganics, ozone layer depletion, ionizing radiation, respiratory organics, terrestrial ecotoxicity, aquatic ecotoxicity, terrestrial acidification/nutrification, land occupation, nonrenewable energy, global warming potential, and mineral extraction. The four damage categories are climate change, human health, ecosystem quality, and resources. Jolliet et al. [51] introduced the set of normalization factors, which were applied to change each category value into a new damage unit to conquer the problems. The relations between impact categories and damaged categories are shown in Table 3.

3. Results and Discussion

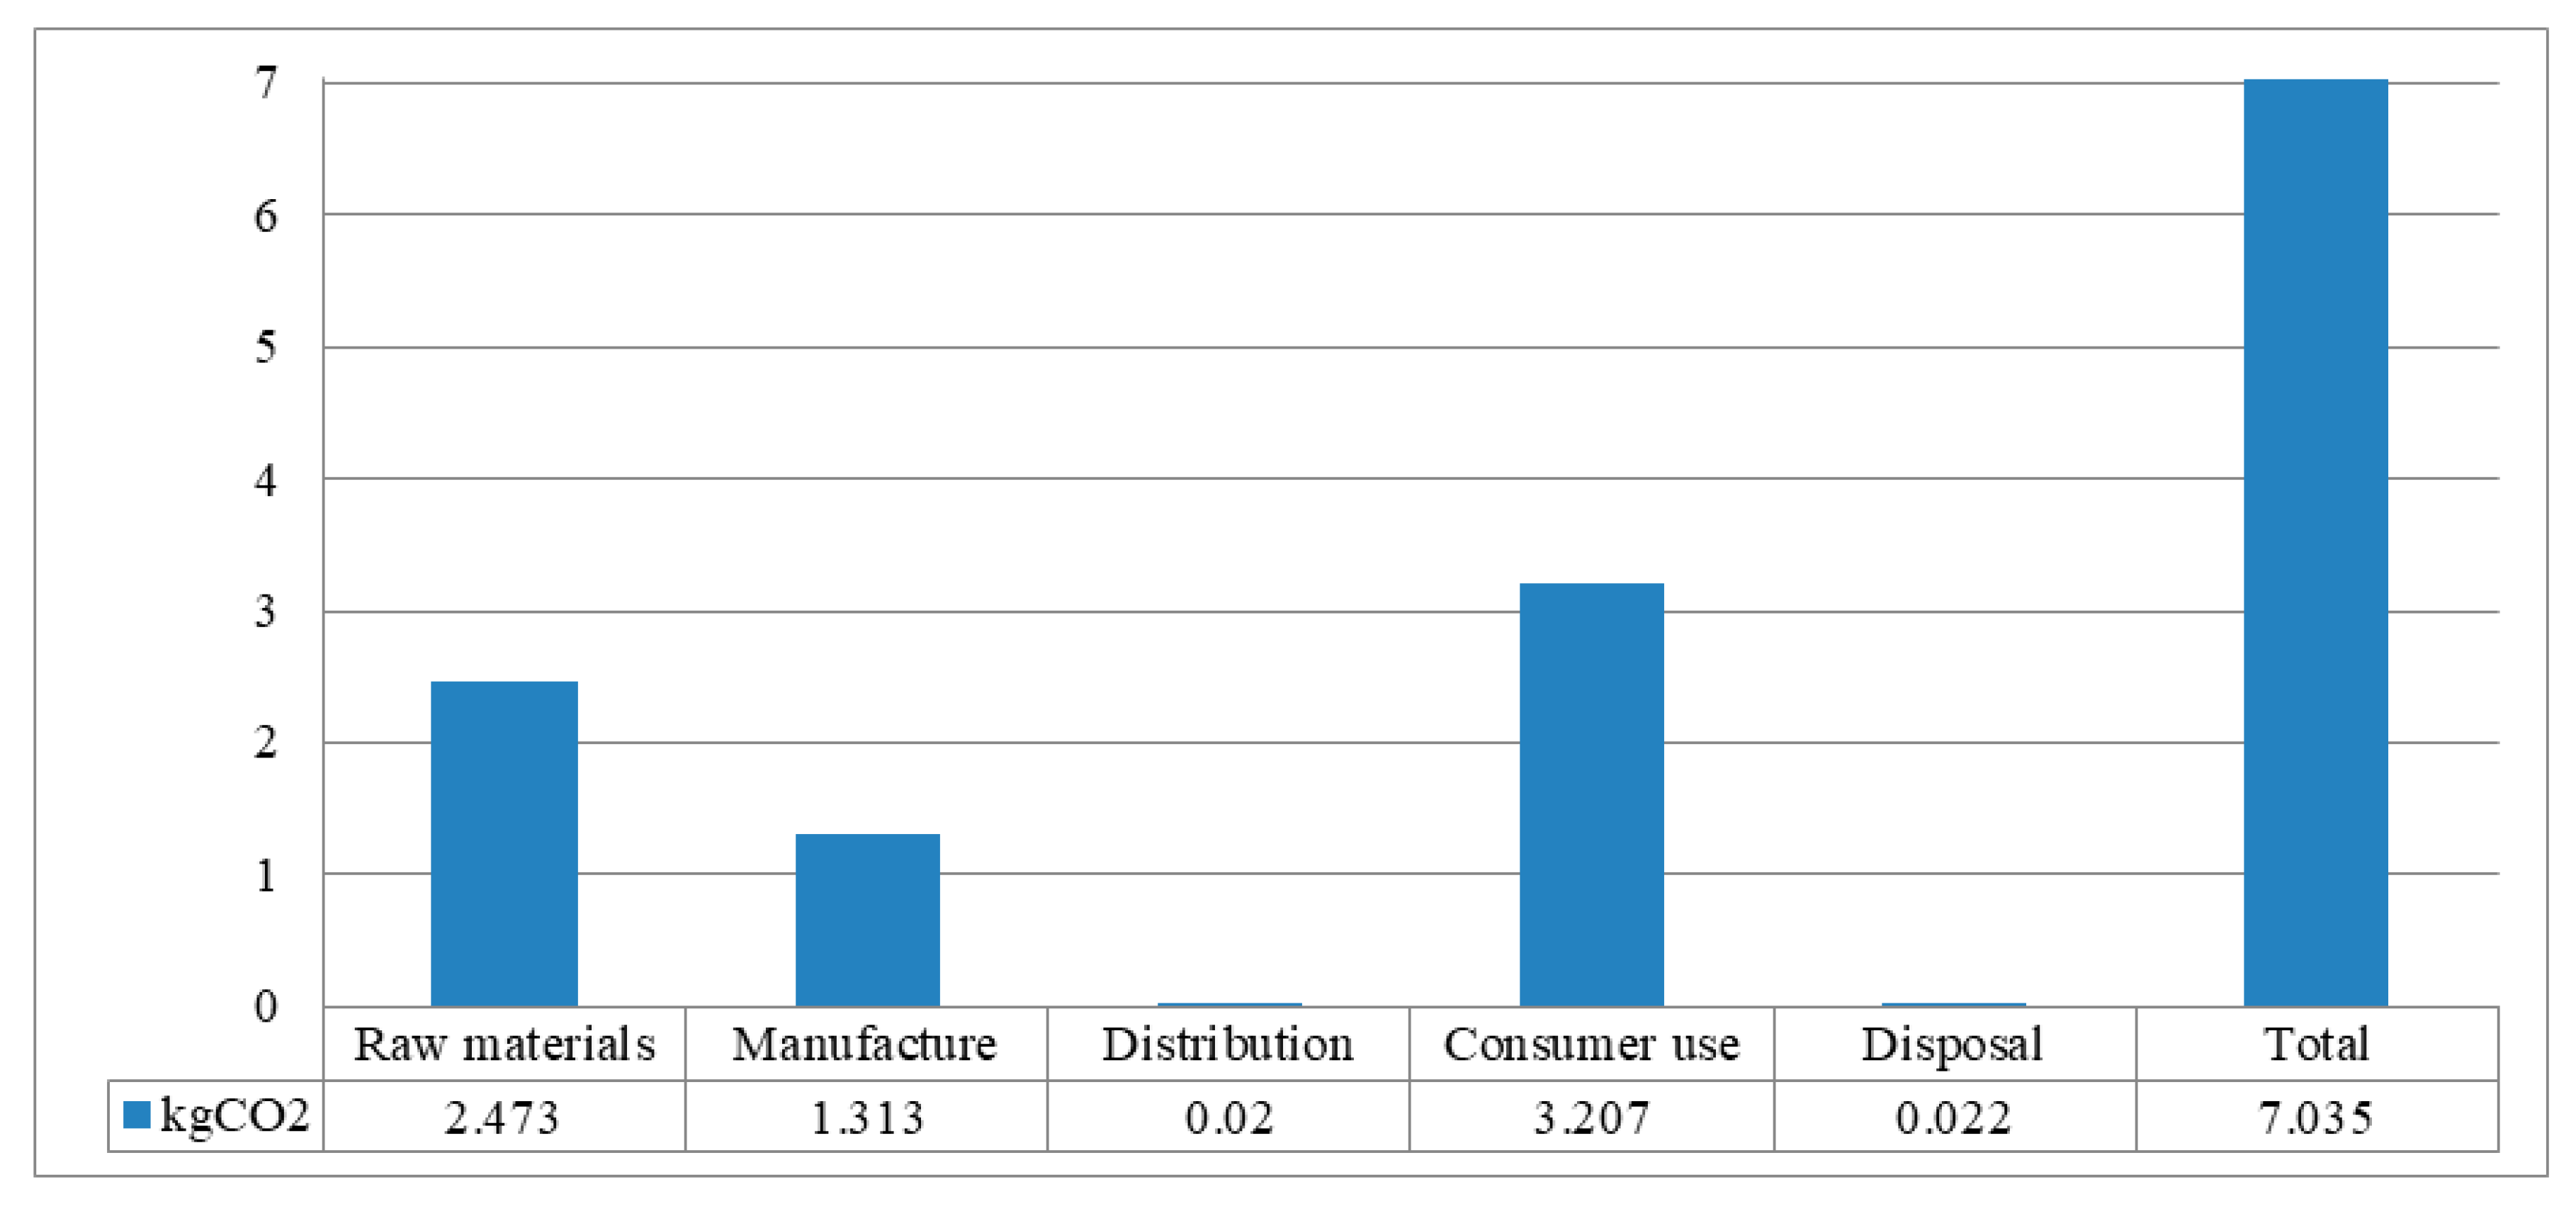
3.1. Carbon Footprint Analysis Results

In the case study of Dongshang tea, the carbon footprint is approximately 7.035 CO2eq/kg, and the ratio is roughly in accordance with the study of cradle to grave from local experts [38]. Details are specified in Figure 3. Our study found that consumer use, accounting for 45.58% of the total, is the major source of carbon emissions in the tea product life cycle. The raw material phase is the second main source of carbon emissions, accounting for 35.15% of the total, followed by the manufacturing phase, which accounts for 18.67% of the total. Distribution and disposal phases have a low percentage of emissions.
In this study, the raw material phase, which involves machinery use, fertilizer application, sapling transport, and pesticide use, contributes 2.473 CO2eq/kg per kg of tea, and nitrogen fertilizer inputs into planting and growing was identified as a hotspot. Since the 1850s, a large volume of anthropogenic nitrogen fertilizer has been applied to agricultural land to facilitate crop production. Improper nitrogen fertilizer management causes various ecological and environmental problems, and compared with the production of phosphate and potash fertilizers, that of nitrogen fertilizers demands more energy requirement. Therefore, carbon footprint can be reduced via the efficient use of nitrogen fertilizers [52,53].
The manufacturing phase contributes 1.313 CO2eq/kg per kg of tea, and the use of LPG roller fixation machine and electricity consumption for hot air drying were identified as hotspots. The four main types of tea are black, green, white, and Oolong. Although they all originate from C. sinensis, they are produced with varying fermenting degrees. Black tea is fully fermented; Oolong tea is semifermented; white tea is low fermented, and green tea is nonfermented [54].
At the consumer use phase, tap water, boiling of water, and wastewater contribute 3.207 CO2eq/kg from 10 g tea and 0.5 L water. The main source of carbon emissions in the tea product life cycle is electricity consumption from boiling a pot of water at 0.06 KWh using an electric kettle with grid electricity. Results in this study confirmed the findings of Munasinghe et al. [36], Azapagic et al. [37], and Doublet and Jungbluth [55]. Therefore, carbon footprint can be reduced through the minimization of the frequency of boiling water (such as heat preservation) or use of highly efficient boiling water facilities. The Taiwan Bureau of Energy, Ministry of Economic Affairs initiated the voluntary Energy Label program in order to urge manufacturers to invest in research and development of energy-efficient products and promote the deployment of energy efficiency technologies. A consumer environment that values highly energy-efficient products could be created, given that consumers could easily recognize such products through the “Energy Label.”

3.2. LCIA Results

The software SimaPro was used in this study to calculate the environmental impact of Dongshan tea, and the calculation was performed via the IMPACT 2002+ assessment method. Figure 4 shows the normalization environmental impact category of Dongshan tea. The figure indicates that the biggest environmental impact categories are human health, climate change, resources in the raw material phase, and climate change in the consumer use and manufacturing phases.
This study found that 96% of the impact of resource categories comes from the raw material phase, the main midpoint being nonrenewable energy. The impact of climate change categories is quite similar with carbon footprint analysis; 46%, 35%, and 19% come from the consumer use, raw material, and manufacturing phases, respectively. The distribution and disposal phases have a lower percentage of environmental impacts due to the concept of local use and consumption, which minimizes food miles and waste materials through the use of large packing sizes for tea. Ecosystem quality yielded a negative value in the raw material phase, given that mountain spring water and soybean meal are used as base fertilizer and only minimal amounts of chemical fertilizers and pesticides are applied; the cultivation method in this tea farm is relatively eco-friendly.
This study found that 97% of the impact of human health categories comes from the raw material phase, and the largest midpoint is respiratory inorganics, which contributes 76%. Paramesh et al. [56] also reported that the life cycle assessment pointed out on-farm emissions are the hotspot for respiratory inorganics, whereas fertilizers are a potential hotspot. With increased chemical fertilizer inputs and adoption of new technologies, crop yields have increased steadily, and food security has improved, although it results in soil deterioration, GHG emissions, and water contamination [57,58]. Fertilizers are held responsible as the main factor for that category; however, compared to climate change and fossil fuel depletion, these emissions are relatively low. With an optimized fertilization strategy (including use compound fertilizer, and shorten transportation distances), the environmental burden can be reduced [47]. Although the influence of organic fertilizers on crop yield is gradual and changeable in a short period of time [59], the application of organic fertilizers, instead of chemical fertilizers, is economically practical, contributes considerably to environmental sustainability, and increases agricultural production [60]. In addition to spreading awareness about the importance of environmental sustainability, national policy subsidies must market the use of organic fertilizers [61,62]. For encouraging the development of organic agriculture in the country, organic agriculture and eco-friendly farming promotion have been included in 10 key policies of the new agriculture policy by the Taiwan Council of Agriculture. Since 2017, subsidies for organic and eco-friendly farming have been in place; a user receives NTD 3 per kg by using the recommended fertilizer brand, and for every 10 t organic fertilizer applied on a hectare of land, a user receives NTD 30,000.

4. Conclusions and Perspectives

This study investigated the environmental impact of Taiwanese Dongshan tea, the carbon footprint assessment of growth in Yilan, and the consumption of tea in Taipei, covering the raw material, manufacturing, distribution and transportation, consumer use, and disposal and recycling phases. LCA results showed that energy used in the consumer use phase is the main hotspot in the case of Dongshan tea, and the biggest environmental impact in the human health category comes from the use of fertilizers in the raw material phase. Therefore, a national policy of subsidizing use of organic fertilizers and optimized fertilization strategy can reduce the environmental impact.
The largest energy consumption and life cycle environmental impact during tea processing is contributed by black tea (versus Oolong and green) [63]. Dongshan tea is a kind of black tea, where the emissions of LCA is the remaining 18.67% in the manufacture phase. In this case, solar power can be utilized directly or indirectly during leaf drying and withering, thus reducing energy use.
Tea is the most widely consumed nonalcoholic beverage in the world apart from water [64]; therefore, improving sustainability in the tea industry will facilitate sustainable production and consumption. Hence, we propose some measures for reducing carbon footprint and environmental impact, including the use of highly efficient boiling water facilities and heating preservation. The implementation of these measures will minimize the frequency of boiling water in the consumer use phase and decrease the use of nitrogen fertilizers in the raw material phase.
An entire change of the economic model is impracticable; thus, a progressive conversion of consumer behavior is feasible in achieving an environmentally sustainable society [65]. In summary, LCA is an internationally recognized approach for the environmental assessment of products and processes [66]. The methods, results, and conclusions in this study can be used as a reference by future researchers. In addition, this study provides a complete impact analysis and identifies relevant hotspots. Results provide essential data for policymakers, tea producers, and consumers, and the suggested measures for the reduction of environmental impact can contribute toward a low-carbon and sustainable agricultural development and consumption.

Author Contributions

C.-H.C. and A.H.H. analyzed the data and compiled the article. L.H.H. and M.-H.C. supported the data. Y.-C.L. and Z.C. provided technical comments on the whole work.

Funding

This research was funded by Youngsun Cultue & Education Foundation under the project of Carbon Footprint Inventory of Agricultural products in Yilan County.

Acknowledgments

The study was supported by Youngsun Cultue & Education Foundation under the project of Carbon Footprint Inventory of Agricultural products in Yilan County. In addition, it’s many thanks to the reviewers for their valuable recommendation to improve this research.

Conflicts of Interest

The authors declare no conflict of interest.

References

  1. Edenhofer, O.; Pichs-Madruga, R.; Sokona, Y.; Farahani, E.; Kadner, S.; Kadner, K.; Seyboth, A.; Adler, I.; Baum, S.; Myhre, G.; et al. Climate Change 2014: Mitigation of Climate Change; Working Group III Contribution to the IPCC Fifth Assessment Report; Cambridge University Press: Cambridge, UK, 2015. [Google Scholar]
  2. Food and Agriculture Organization of the United Nations (FAO). Regional Strategy for Sustainable Hybrid Rice Development in Asia; Food and Agriculture Organization of the United Nations Regional Office for Asia and the Pacific: Bangkok, Thailand, 2014. [Google Scholar]
  3. Irani, Z.; Sharif, A.M. Sustainable food security futures: Perspectives on food waste and information across the food supply chain. J. Enterp. Inf. Manag. 2016, 29, 171–178. [Google Scholar] [CrossRef]
  4. Runhaar, H. Tools for integrating environmental objectives into policy and practice: What works where? Environ. Impact Assess. Rev. 2016, 59, 1–9. [Google Scholar] [CrossRef]
  5. Godfray, H.C.J.; Beddington, J.R.; Crute, I.R.; Haddad, L.; Lawrence, D.; Muir, J.F.; Pretty, J.; Robinson, S.; Thomas, S.M.; Toulmin, C. Food security: The challenge of feeding 9 billion people. Science 2010, 327, 812–818. [Google Scholar] [CrossRef] [PubMed]
  6. Meyfroidt, P. Trade-offs between environment and livelihoods: Bridging the global land use and food security discussions. Glob. Food Secur. 2018, 16, 9–16. [Google Scholar] [CrossRef] [Green Version]
  7. Lobell, D.B.; Schlenker, W.; Costa-Roberts, J. Climate trends and global crop production since 1980. Science 2011, 333, 616–620. [Google Scholar] [CrossRef] [PubMed]
  8. Kangalawe, R.Y.M.; Mungongo, C.G.; Mwakaje, A.G.; Kalumanga, E.; Yanda, P.Z. Climate change and variability impacts on agricultural production and livelihood systems in Western Tanzania. Clim. Dev. 2017, 9, 202–216. [Google Scholar] [CrossRef]
  9. Sá, J.C.M.; Lal, R.; Cerri, C.C.; Lorenz, K.; Hungria, M.; Carvalho, P.C.F. Low-carbon agriculture in South America to mitigate global climate change and advance food security. Environ Int. 2017, 98, 102–112. [Google Scholar] [CrossRef]
  10. Moraes, A.; Carvalho, P.C.F.; Anghinoni, I.; Lustosa, S.B.C.; Andrade, S.E.V.G.; Kunrath, T.R. Integrated crop–livestock systems in the Brazilian subtropics. Eur. J. Agron. 2014, 57, 4–9. [Google Scholar] [CrossRef]
  11. Prost, L.; Berthet, E.T.; Cerf, M.; Jeuffroy, M.H.; Labatut, J.; Meynard, J.M. Innovative design for agriculture in the move towards sustainability: Scientific challenges. Res. Eng. Des. 2017, 28, 119–129. [Google Scholar] [CrossRef]
  12. Pigford, A.A.E.; Hickey, G.M.; Klerkx, L. Beyond agricultural innovation systems? Exploring an agricultural innovation ecosystems approach for niche design and development in sustainability transitions. Agric. Syst. 2018, 164, 116–121. [Google Scholar] [CrossRef]
  13. Rockström, J.; Williams, J.; Daily, G.; Noble, A.; Matthews, N.; Gordon, L.; Wetterstrand, H.; De Clerck, F.; Shah, M.; Steduto, P.; et al. Sustainable intensification of agriculture for human prosperity and global sustainability. Ambio 2017, 46, 4–17. [Google Scholar] [CrossRef] [PubMed]
  14. Pergola, M.; Persiani, A.; Pastore, V.; Palese, A.M.; Arous, A.; Celano, G. A comprehensive Life Cycle Assessment (LCA) of three apricot orchard systems located in Metapontino area (Southern Italy). J. Clean. Prod. 2017, 142, 4059–4071. [Google Scholar] [CrossRef]
  15. Notarnicola, B.; Salomone, R.; Petti, L.; Renzulli, P.A.; Roma, R.; Cerutti, A.K. Life Cycle Assessment in the Agri-Food Sector: Case Studies, Methodological Issues and Best Practices; Springer International Publishing: Cham, Switzerland, 2015; pp. 123–184. ISBN 978-3-319-11940-3. [Google Scholar]
  16. Bartzas, G.; Zaharaki, D.; Komnitsas, K. Life cycle assessment of open field and greenhouse cultivation of lettuce and barley. Inf. Process. Agric. 2015, 2, 191–207. [Google Scholar] [CrossRef] [Green Version]
  17. Wu, H.; Wang, S.; Gao, L.; Zhang, L.; Yuan, Z.; Fan, T.; Wei, K.; Huang, L. Nutrient-derived environmental impacts in Chinese agriculture during 1978–2015. J. Environ. Manag. 2018, 217, 762–774. [Google Scholar] [CrossRef] [PubMed]
  18. Hellweg, S.; Mila Canals, L. Emerging approaches, challenges and opportunities in life cycle assessment. Science 2014, 344, 1109–1113. [Google Scholar] [CrossRef] [PubMed]
  19. Ali, S.A.; Tedone, L.; De Mastro, G. Optimization of the environmental performance of rainfed durum wheat by adjusting the management practices. J. Clean. Prod. 2015, 87, 105–118. [Google Scholar] [CrossRef]
  20. Kulak, M.; Nemecek, T.; Frossard, E.; Gaillard, G. Eco-efficiency improvement by using integrative design and life cycle assessment. The case study of alternative bread supply chains in France. J. Clean. Prod. 2016, 112, 2452–2461. [Google Scholar] [CrossRef]
  21. Renouf, M.A.; Renaud-Gentie, C.; Perrin, A.; Kanyarushoki, C.; Jourjon, F. Effectiveness criteria for customised agricultural life cycle assessment tools. J. Clean. Prod. 2018, 179, 246–254. [Google Scholar] [CrossRef]
  22. Oldfield, T.L.; White, E.; Holden, N.M. The implications of stakeholder perspective for LCA of wasted food and green waste. J. Clean. Prod. 2018, 170, 1554–1564. [Google Scholar] [CrossRef]
  23. Kung, C.C.; McCarl, B.A.; Chen, C.C.; Chen, L.J. Environmental Impact and Bioenergy Potential: Evaluation of Agricultural Commodity and Animal Waste Based Biochar Application on Taiwanese Set-aside Land. Energy Procedia 2014, 61, 679–682. [Google Scholar] [CrossRef] [Green Version]
  24. Tilman, D.; Balzer, C.; Hill, J.; Befort, B.L. Global food demand and the sustainable intensification of agriculture. Proc. Natl. Acad. Sci. USA 2011, 108, 20260–20264. [Google Scholar] [CrossRef] [PubMed] [Green Version]
  25. Lee, S.C.; Wang, C.H.; Yen, C.E.; Chang, C. DNA barcode and identification of the varieties and provenances of Taiwan’s domestic and imported made teas using ribosomal internal transcribed spacer 2 sequences. J. Food Drug Anal. 2017, 25, 260–274. [Google Scholar] [CrossRef]
  26. Stadler, R.H.; Hughes, G.; Guillaume-Gentil, O. Safety of food and beverages: Coffee, tea and herbals, cocoa and derived products. Food Mater. Technol. Risks 2014, 3, 371–383. [Google Scholar]
  27. Xia, E.H.; Zhang, H.B.; Sheng, J.; Li, K.; Zhang, Q.J.; Kim, C.; Zhang, Y.; Liu, Y.; Zhu, T.; Li, W.; et al. The Tea Tree Genome Provides Insights into Tea Flavor and Independent Evolution of Caffeine Biosynthesis. Mol. Plant 2017, 10, 866–877. [Google Scholar] [CrossRef] [PubMed]
  28. FAO. World Tea Production and Trade Current and Future Development, Trade and Markets Division; Food and Agriculture Organization: Rome, Italy, 2015. [Google Scholar]
  29. FAO. Committee on the Commodity Problems Intergovernmental Group on Tea, Current Market Situation and Medium-Term Outlook; Food and Agriculture Organization: Beijing, China, 2015. [Google Scholar]
  30. Mei, Y. China tea production and marketing report in 2014 and situation forecast in 2015. Tea World 2015, 6, 50–59. [Google Scholar]
  31. Pinto, M.S. Tea: A new perspective on health benefits. Food Res. Int. 2013, 53, 558–567. [Google Scholar] [CrossRef]
  32. Shen, C.L.; Chyu, M.C. Tea flavonoids for bone health: From animals to humans. J. Investig. Med. 2016, 64, 1151–1157. [Google Scholar] [CrossRef] [PubMed]
  33. Zhang, Q.; Gao, W.; Su, S.; Weng, M.; Cai, Z. Biophysical and socioeconomic determinants of tea expansion: Apportioning their relative importance for sustainable land use policy. Land Use Policy 2017, 68, 438–447. [Google Scholar] [CrossRef]
  34. Rivera, X.C.S.; Bacenetti, J.; Fusi, A.; Niero, M. The influence of fertiliser and pesticide emissions model on life cycle assessment of agricultural products: The case of Danish and Italian barley. Sci. Total Environ. 2017, 592, 745–757. [Google Scholar] [CrossRef]
  35. Farshad, S.F.; Hamed, K.P.; Mahmoud, G.N.R.; Chen, G. Cradle to grave environmental-economic analysis of tea life cycle in Iran. J. Clean. Prod. 2018, 196, 953–960. [Google Scholar] [CrossRef]
  36. Munasinghe, M.; Deraniyagala, Y.; Dassanayake, N.; Karunarathna, H. Economic, social and environmental impacts and overall sustainability of the tea sector in Sri Lanka. Sustain. Prod. Consum. 2017, 12, 155–169. [Google Scholar] [CrossRef]
  37. Azapagic, A.; Bore, J.; Cheserek, B.; Kamunya, S.; Elbehri, A. The global warming potential of production and consumption of Kenyan tea. J. Clean. Prod. 2016, 112, 4031–4040. [Google Scholar] [CrossRef]
  38. Chen, L.C.; Yang, T.F. Carbon Footprint Study of Organic Tea Product. J. TungNan Univ. 2011, 37, 203–214. [Google Scholar]
  39. Li, L.; Wu, W.; Giller, P.; O’Halloran, J.; Liang, L.; Peng, P.; Zhao, G. Life cycle assessment of a highly diverse vegetable multi-cropping system in Fengqiu county, China. Sustainability 2018, 10, 983. [Google Scholar] [CrossRef]
  40. Shen, J.; Gao, L.; Chen, Q.; Zhang, Z.; Wang, Z. Life cycle assessment (LCA) on three facility modes of vegetable production. J. Jiangsu Univ. 2013, 34, 650–657. [Google Scholar]
  41. Theurl, M.C.; Hörtenhuber, S.J.; Lindenthal, T.; Palme, W. Unheated soil-grown winter vegetables in Austria: Greenhouse gas emissions and socio-economic factors of diffusion potential. J. Clean. Prod. 2017, 151, 134–144. [Google Scholar] [CrossRef] [Green Version]
  42. Liu, Y.; Langer, V.; Høgh-Jensen, H.; Egelyng, H. Life Cycle Assessment of fossil energy use and greenhouse gas emissions in Chinese pear production. J. Clean. Prod. 2010, 18, 1423–1430. [Google Scholar] [CrossRef]
  43. Ingrao, C.; Matarazzo, A.; Tricase, C.; Clasadonte, M.T.; Huisingh, D. Life cycle assessment for highlighting environmental hotspots in Sicilian peach production systems. J. Clean. Prod. 2015, 92, 109–120. [Google Scholar] [CrossRef]
  44. Longo, S.; Mistretta, M.; Guarino, F.; Cellura, M. Life Cycle Assessment of organic and conventional apple supply chains in the North of Italy. J. Clean. Prod. 2017, 140, 654–663. [Google Scholar] [CrossRef]
  45. Zhang, L.; Li, X.; Yu, J.; Yao, X. Toward Cleaner Production: What drives farmers to adopt eco-friendly agricultural production? J. Clean. Prod. 2018, 184, 550–558. [Google Scholar] [CrossRef]
  46. Gao, T.; Liu, Q.; Wang, J. A comparative study of carbon footprint and assessment standards. Int. J. Low Carbon Technol. 2014, 9, 237–243. [Google Scholar] [CrossRef]
  47. Hasler, K.; Broring, S.; Omta, S.W.F.; Olfs, H.W. Life cycle assessment (LCA) of different fertilizer producer types. Eur. J. Agron. 2015, 69, 41–51. [Google Scholar] [CrossRef]
  48. Hsieh, H.W.; Tsai, I.T.; Hsieh, C.L. Survey and Analysis of Fuel Consumption of Popular Gasoline-Type Agricultural Machinery in Taiwan. J. Agric. Mach. 2007, 16, 1–14. [Google Scholar]
  49. Taiwan Environmental Protection Administration (Taiwan EPA). Environmental Resource Database in Taiwan; Environmental Protection Administration (EPA): Taiwan, 2012. Available online: https://erdb.epa.gov.tw/DataRepository/Other/Carbon_Footprint_Emission_Factor.aspx (accessed on 18 December 2018).
  50. Prado, V.; Wender, B.A.; Seager, T.P. Interpretation of comparative LCAs: External normalization and a method of mutual differences. Int. J. Life Cycle Assess. 2017, 22, 2018–2029. [Google Scholar] [CrossRef]
  51. Jolliet, O.; Margni, M.; Charles, R.; Humbert, S.; Payet, J.; Rebitzer, G.; Rosenbaum, R. IMPACT 2002+: A new life cycle impact assessment methodology. Int. J. Life Cycle Assess. 2003, 8, 324–330. [Google Scholar] [CrossRef]
  52. Maraseni, T.N.; Cockfield, G.; Maroulis, J.; Chen, G. An assessment of greenhouse gas emissions from the Australian vegetables industry. J. Environ. Sci. Health Part B 2010, 45, 578–588. [Google Scholar] [CrossRef] [PubMed]
  53. Cao, P.; Lu, C.; Yu, Z. Historical nitrogen fertilizer use in agricultural ecosystems of the contiguous United States during 1850-2015: Application rate, timing, and fertilizer types. Earth Syst. Sci. Data 2018, 10, 969–984. [Google Scholar] [CrossRef]
  54. Sanlier, N.; Goksen, B.B.; Altug, M. Tea consumption and disease correlation. Trends Food Sci. Technol. 2018, 78, 98–106. [Google Scholar] [CrossRef]
  55. Doublet, G.; Jungbluth, N. Life Cycle Assessment of Drinking Darjeeling Tea; ESU-Services Ltd.: Schaffhausen, Switzerland, 2010. [Google Scholar]
  56. Paramesh, V.; Arunachalam, V.; Nikkhah, A.; Das, B.; Ghnimi, S. Optimization of energy consumption and environmental impacts of arecanut production through coupled data envelopment analysis and life cycle assessment. J. Clean. Prod. 2018, 203, 674–684. [Google Scholar] [CrossRef]
  57. Duan, Y.; Xu, M.; Gao, S.; Liu, H.; Huang, S.; Wang, B. Long-term incorporation of manure with chemical fertilizers reduced total nitrogen loss in rain-fed cropping systems. Sci. Rep. 2016, 6, 33611. [Google Scholar] [CrossRef] [Green Version]
  58. Norman, U.; Dazzo, F.B. Making rice production more environmentally-friendly. Environments 2016, 3, 12. [Google Scholar] [CrossRef]
  59. Hu, H.; Yang, Y. Research on farmers’ chemical fertilizers use based on resources substitution. J. Agron. Technol. Econ. 2015, 3, 84–91. [Google Scholar]
  60. Ning, C.C.; Gao, P.D.; Wang, B.Q.; Lin, W.P.; Jiang, N.H.; Cai, K.Z. Impacts of chemical fertilizer reduction and organic amendments supplementation on soil nutrient, enzyme activity and heavy metal content. J. Integr. Agric. 2017, 16, 1819–1831. [Google Scholar] [CrossRef]
  61. Jaza Folefack, A. The determinants for the adoption of compost from household waste for crop production by farmers living nearby Yaounde, Cameroon: Descriptive and logit model approaches of analysis. Int. J. Brain Cognit. Sci. 2015, 9, 308–328. [Google Scholar] [CrossRef]
  62. Lim, S.L.; Lee, L.H.; Wu, T.Y. Sustainability of using composting and vermicomposting technologies for organic solid waste biotransformation: Recent overview, greenhouse gases emissions and economic analysis. J. Clean. Prod. 2016, 111, 262–278. [Google Scholar] [CrossRef]
  63. Khanali, M.; Mobli, H.; Hosseinzadeh-Bandbafha, H. Modeling of yield and environmental impact categories in tea processing units based on artificial neural networks. Environ. Sci. Pollut. Res. 2017, 24, 1–17. [Google Scholar] [CrossRef]
  64. Pelvan, E.; Özilgen, M. Assessment of energy and exergy efficiencies and renewability of black tea, instant tea and ice tea production and waste valorization processes. Sustain. Prod. Consum. 2017, 12, 59–77. [Google Scholar] [CrossRef]
  65. Matuštík, J.; Kočí, V. Environmental impact of personal consumption from life cycle perspective—A Czech Republic case study. Sci Total Environ. 2019, 646, 177–186. [Google Scholar] [CrossRef]
  66. Dassisti, M.; Intini, F.; Chimienti, M.; Starace, G. Thermography-enhanced LCA (Life Cycle Assessment) for manufacturing sustainability assessment. The case study of an HDPE (High Density Polyethylene) net company in Italy. Energy 2016, 108, 7–18. [Google Scholar] [CrossRef]
Figure 1. System boundaries and process of Dongshan tea.
Energies 12 00138 g001
Figure 2. System boundaries and process of Dongshan tea.
Energies 12 00138 g002
Figure 3. Overall carbon emission (kgCO2eq/kg) contribution.
Energies 12 00138 g003
Figure 4. Normalization environmental impact of Dongshan tea.
Energies 12 00138 g004
Table 1. Comparison of LCA in agricultural products.
ReferenceProduct/CountrySystem BoundariesMethodResults
Farshad et al. [35]Tea/IranCradle to graveCML-IAMost pollutant inputs were machinery and diesel fuel.
Munasinghe et al. [36]Tea/Sri LankaCradle to graveLCAEnergy use was the highest in the consumer use phase, whereas CO2 emission was highest in the packaging phase.
Azapagic et al. [37]Tea/KenyanCradle to graveIPCC 100CO2 emission was highest in the consumer use phase.
Chen et al. [38]Tea/TaiwanCradle to gravePAS 2050Fertilizer use in raw material phase and energy use in consumer use phase were hotspots.
Li et al. [39]Vegetables/ChinaFarm gate to farm gateUSEtox 2.01Vegetable multicropping system use would result in reduced environmental impacts.
Shen et al. [40]Vegetables/ChinaFarm gate to farm gateLCAVenlo-greenhouse environmental impact was the most serious.
Theurl et al. [41]Vegetables/AustriaCradle to marketEcoinvent v2.2Unheated winter vegetable production was feasible.
Liu et al. [42]Pear/ChinaCradle to marketIPCC 2007Using manure for biogas production and organic farming can reduce GHG emission.
Ingrao et al. [43]Peach/SicilianCradle to graveIMPACT2002+Largest impacts were due to huge volumes of water and energy used by irrigation.
Longo et al. [44]Apple/ItalyCradle to gateILCD 2011Largest energy and environmental impacts were due to fertilizers, pesticides, and diesel.
Table 2. Inventory of data for Dongshan tea LCI.
ProcessingMaterial/EnergyQuantityUnit
Raw materialsSapling transport23.25TKM
Machine (diesel)1.5L
Machine (gasoline)55.6L
Compound fertilizer (15-15-15)240kg
Soybean meal (6.8-1.5-2.3)60kg
Pesticide (herbicide)0.5L
PE (tube and barrel)13.99kg
PVC tube1.99kg
ManufactureMachine (electricity)172.42kWh
Kerosene5L
Liquefied petroleum gas51.81L
Polythene bag1.5kg
DistributionFinished product transport8.25TKM
Consumer useBoiling of water900kWh
Tap water7.5m3
Wastewater5.63m3
DisposalRetort pouch (landfill)50kg
Papers (incineration plant)60kg
Table 3. IMPACT 2002+ damage unit values.
Damage Categories
Value/Damage Unit
Midpoint CategoryValueDamage Unit
Human health
0.0077
DALY/pers/yr
Carcinogens1.45 × 10−6DALY/kg C2H3Cl
Noncarcinogens1.45 × 10−6DALY/kg C2H3Cl
Respiratory inorganics7.00 × 10−4DALY/kg PM2.5
Ozone layer depletion1.05 × 10−3DALY/kg CFC-11
Ionizing radiation2.10 × 10−10DALY/Bq C-14
Respiratory organics2.13 × 10−6DALY/kg C2H4
Ecosystem quality
4650
PDF × m2 × yr/pers/yr
Aquatic ecotoxicity8.86 × 10−5PDF × m2 × yr/kg·TEG water
Terrestrial ecotoxicity8.86 × 10−5PDF × m2 × yr/kg·TEG soil
Terrestrial acidification/nutrification1.04PDF × m2 × yr/kg SO2
Land occupation1.09PDF × m2 × yr/m2org.arable
Climate change
9950
Kg CO2/pers/yr
Global warming potential1kg CO2/kg CO2
Resources
152,000
MJ primary/pers/yr
Nonrenewable energy5.10 × 10−2MJ primary/MJ primary
Mineral extraction45.6MJ primary/MJ surplus

