Stress-Dependent Permeability of Fractures in Tight Reservoirs


Abstract
1. Introduction
2. Experiment
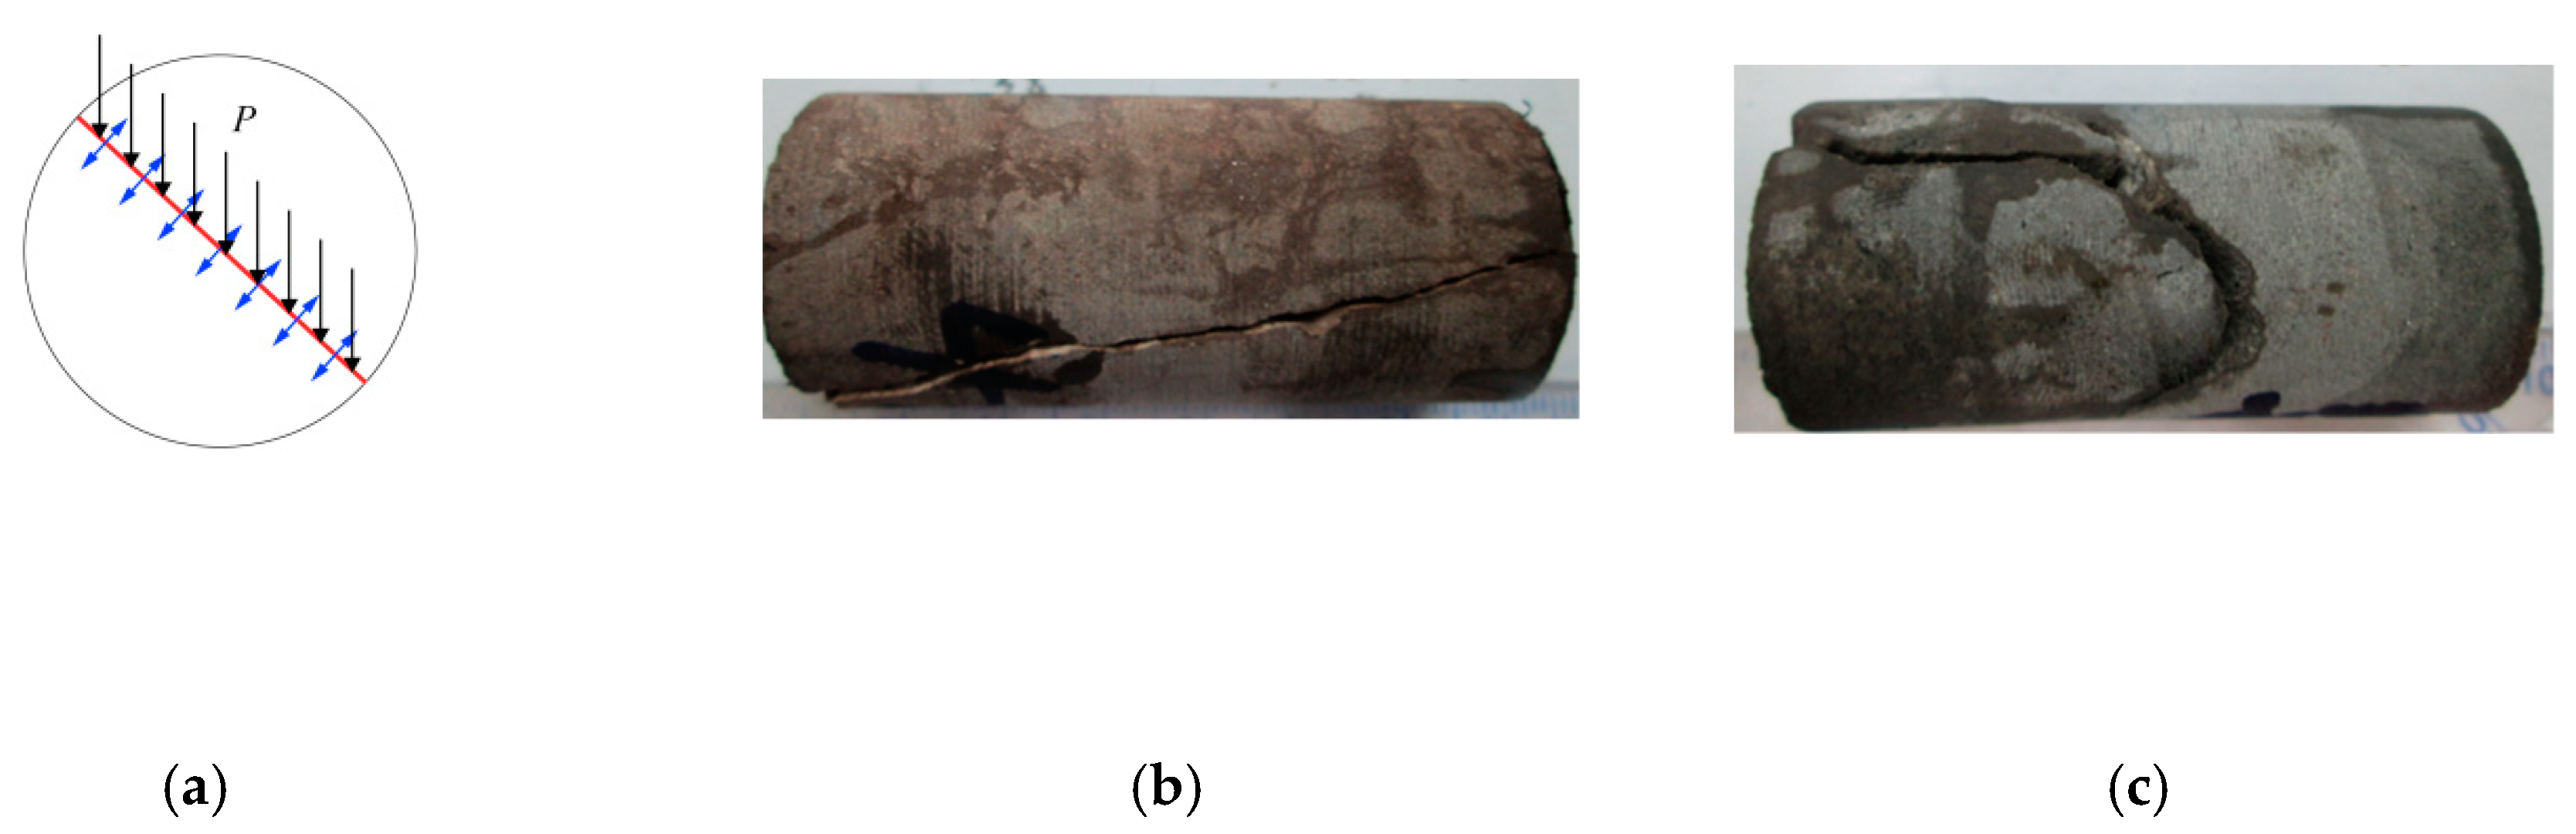
2.1. Samples
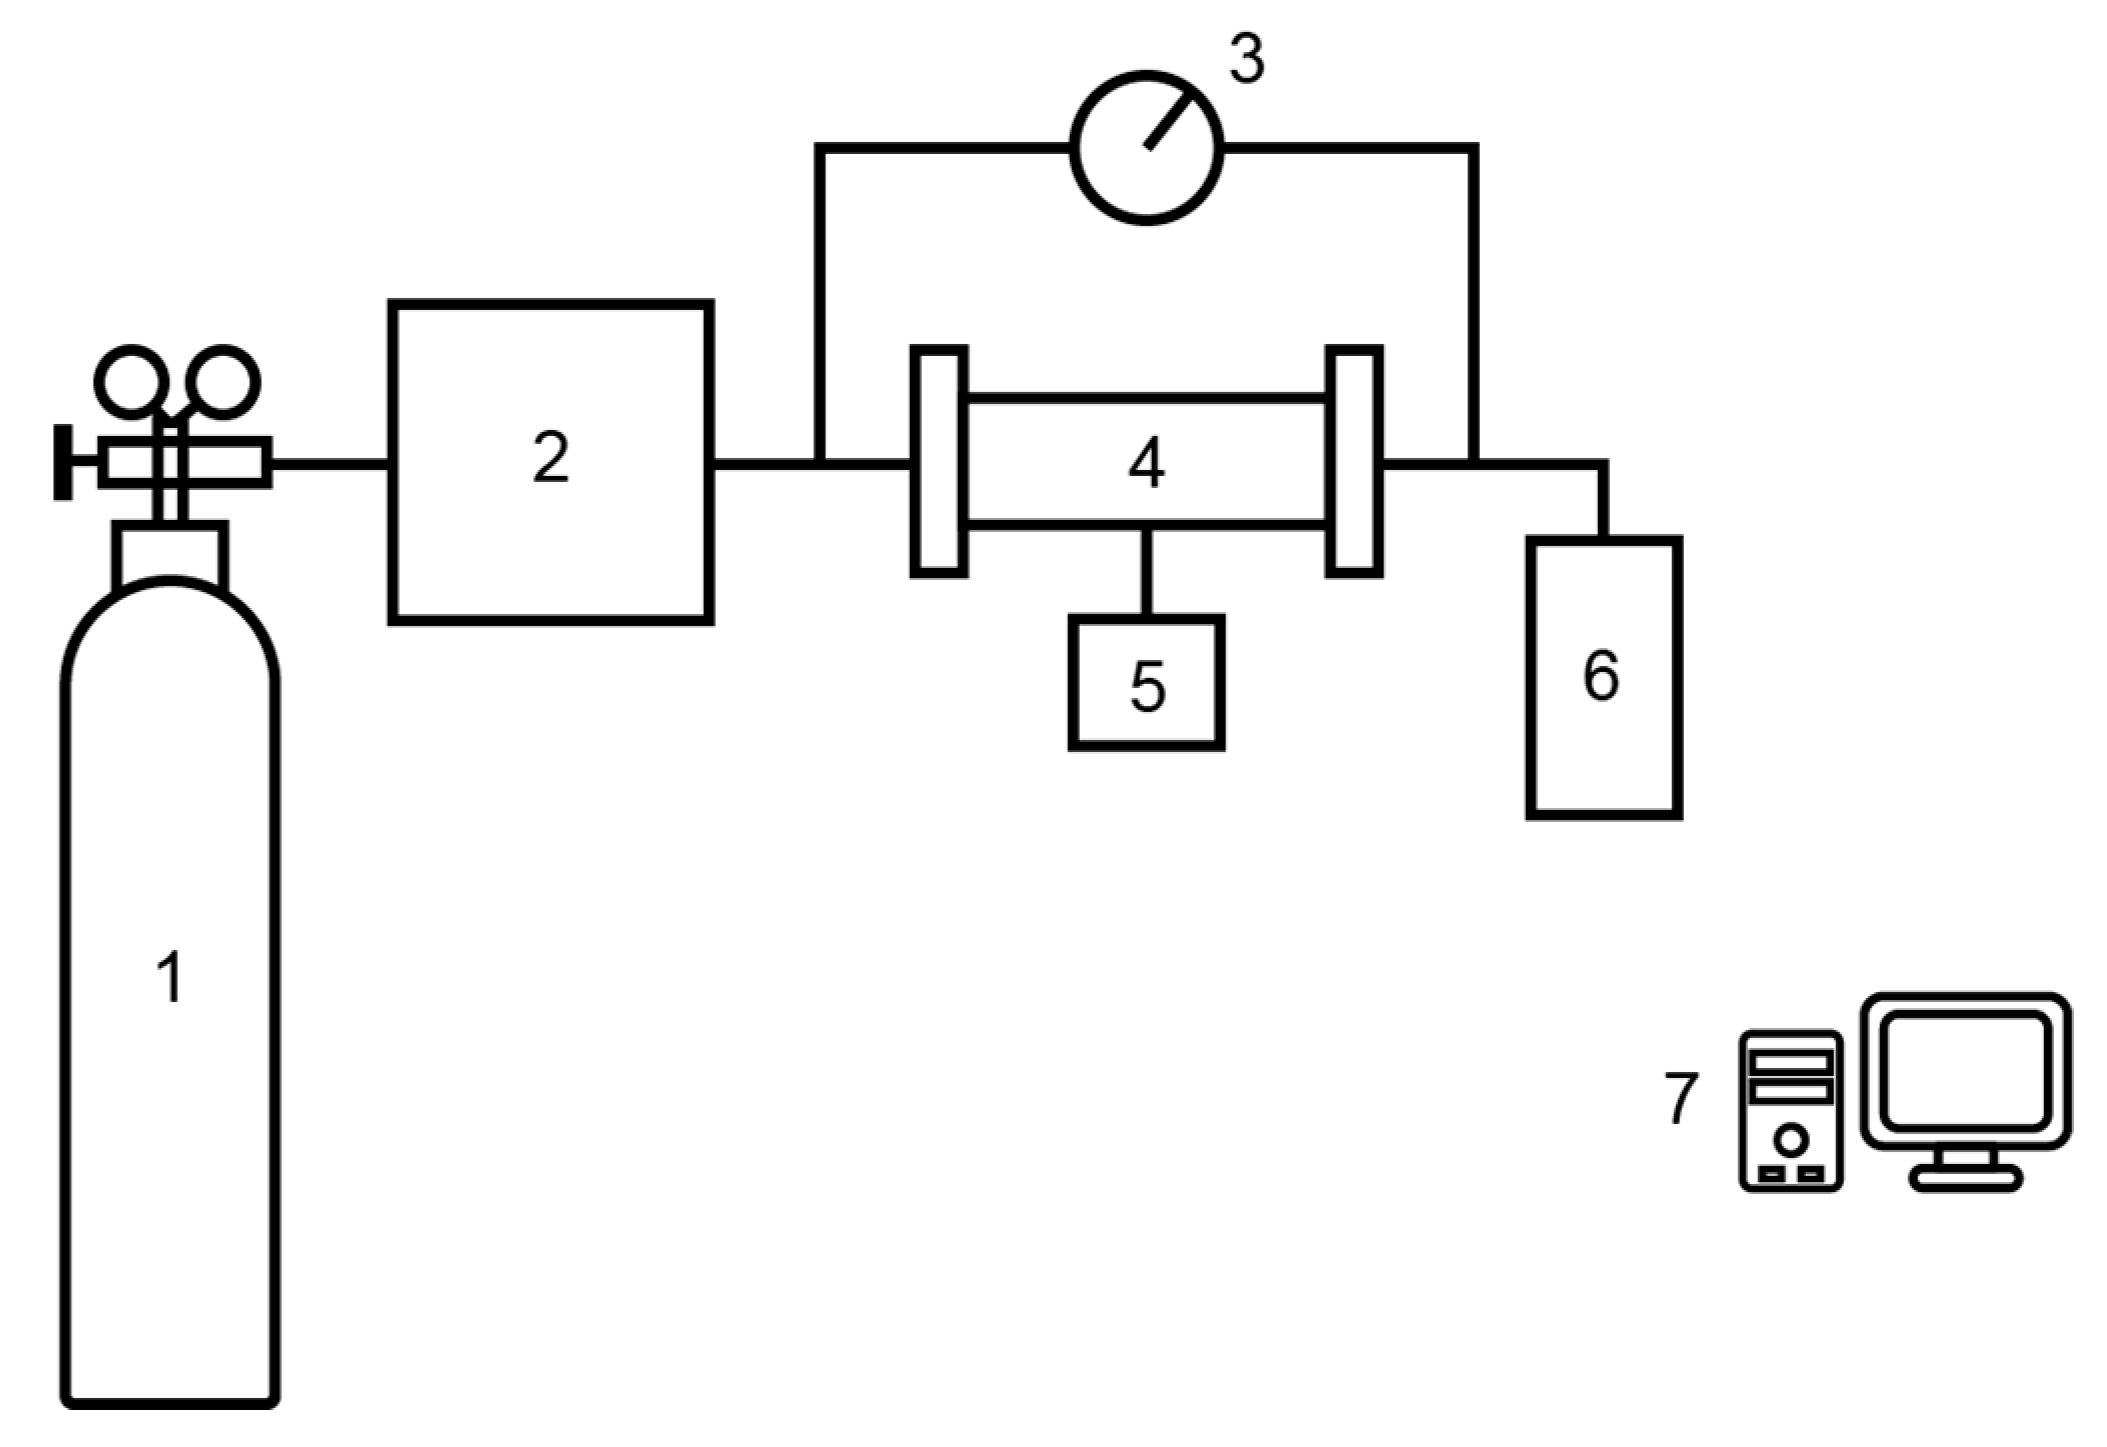
2.2. Experimental Apparatus
2.3. Experimental Procedure
3. Numerical Simulation
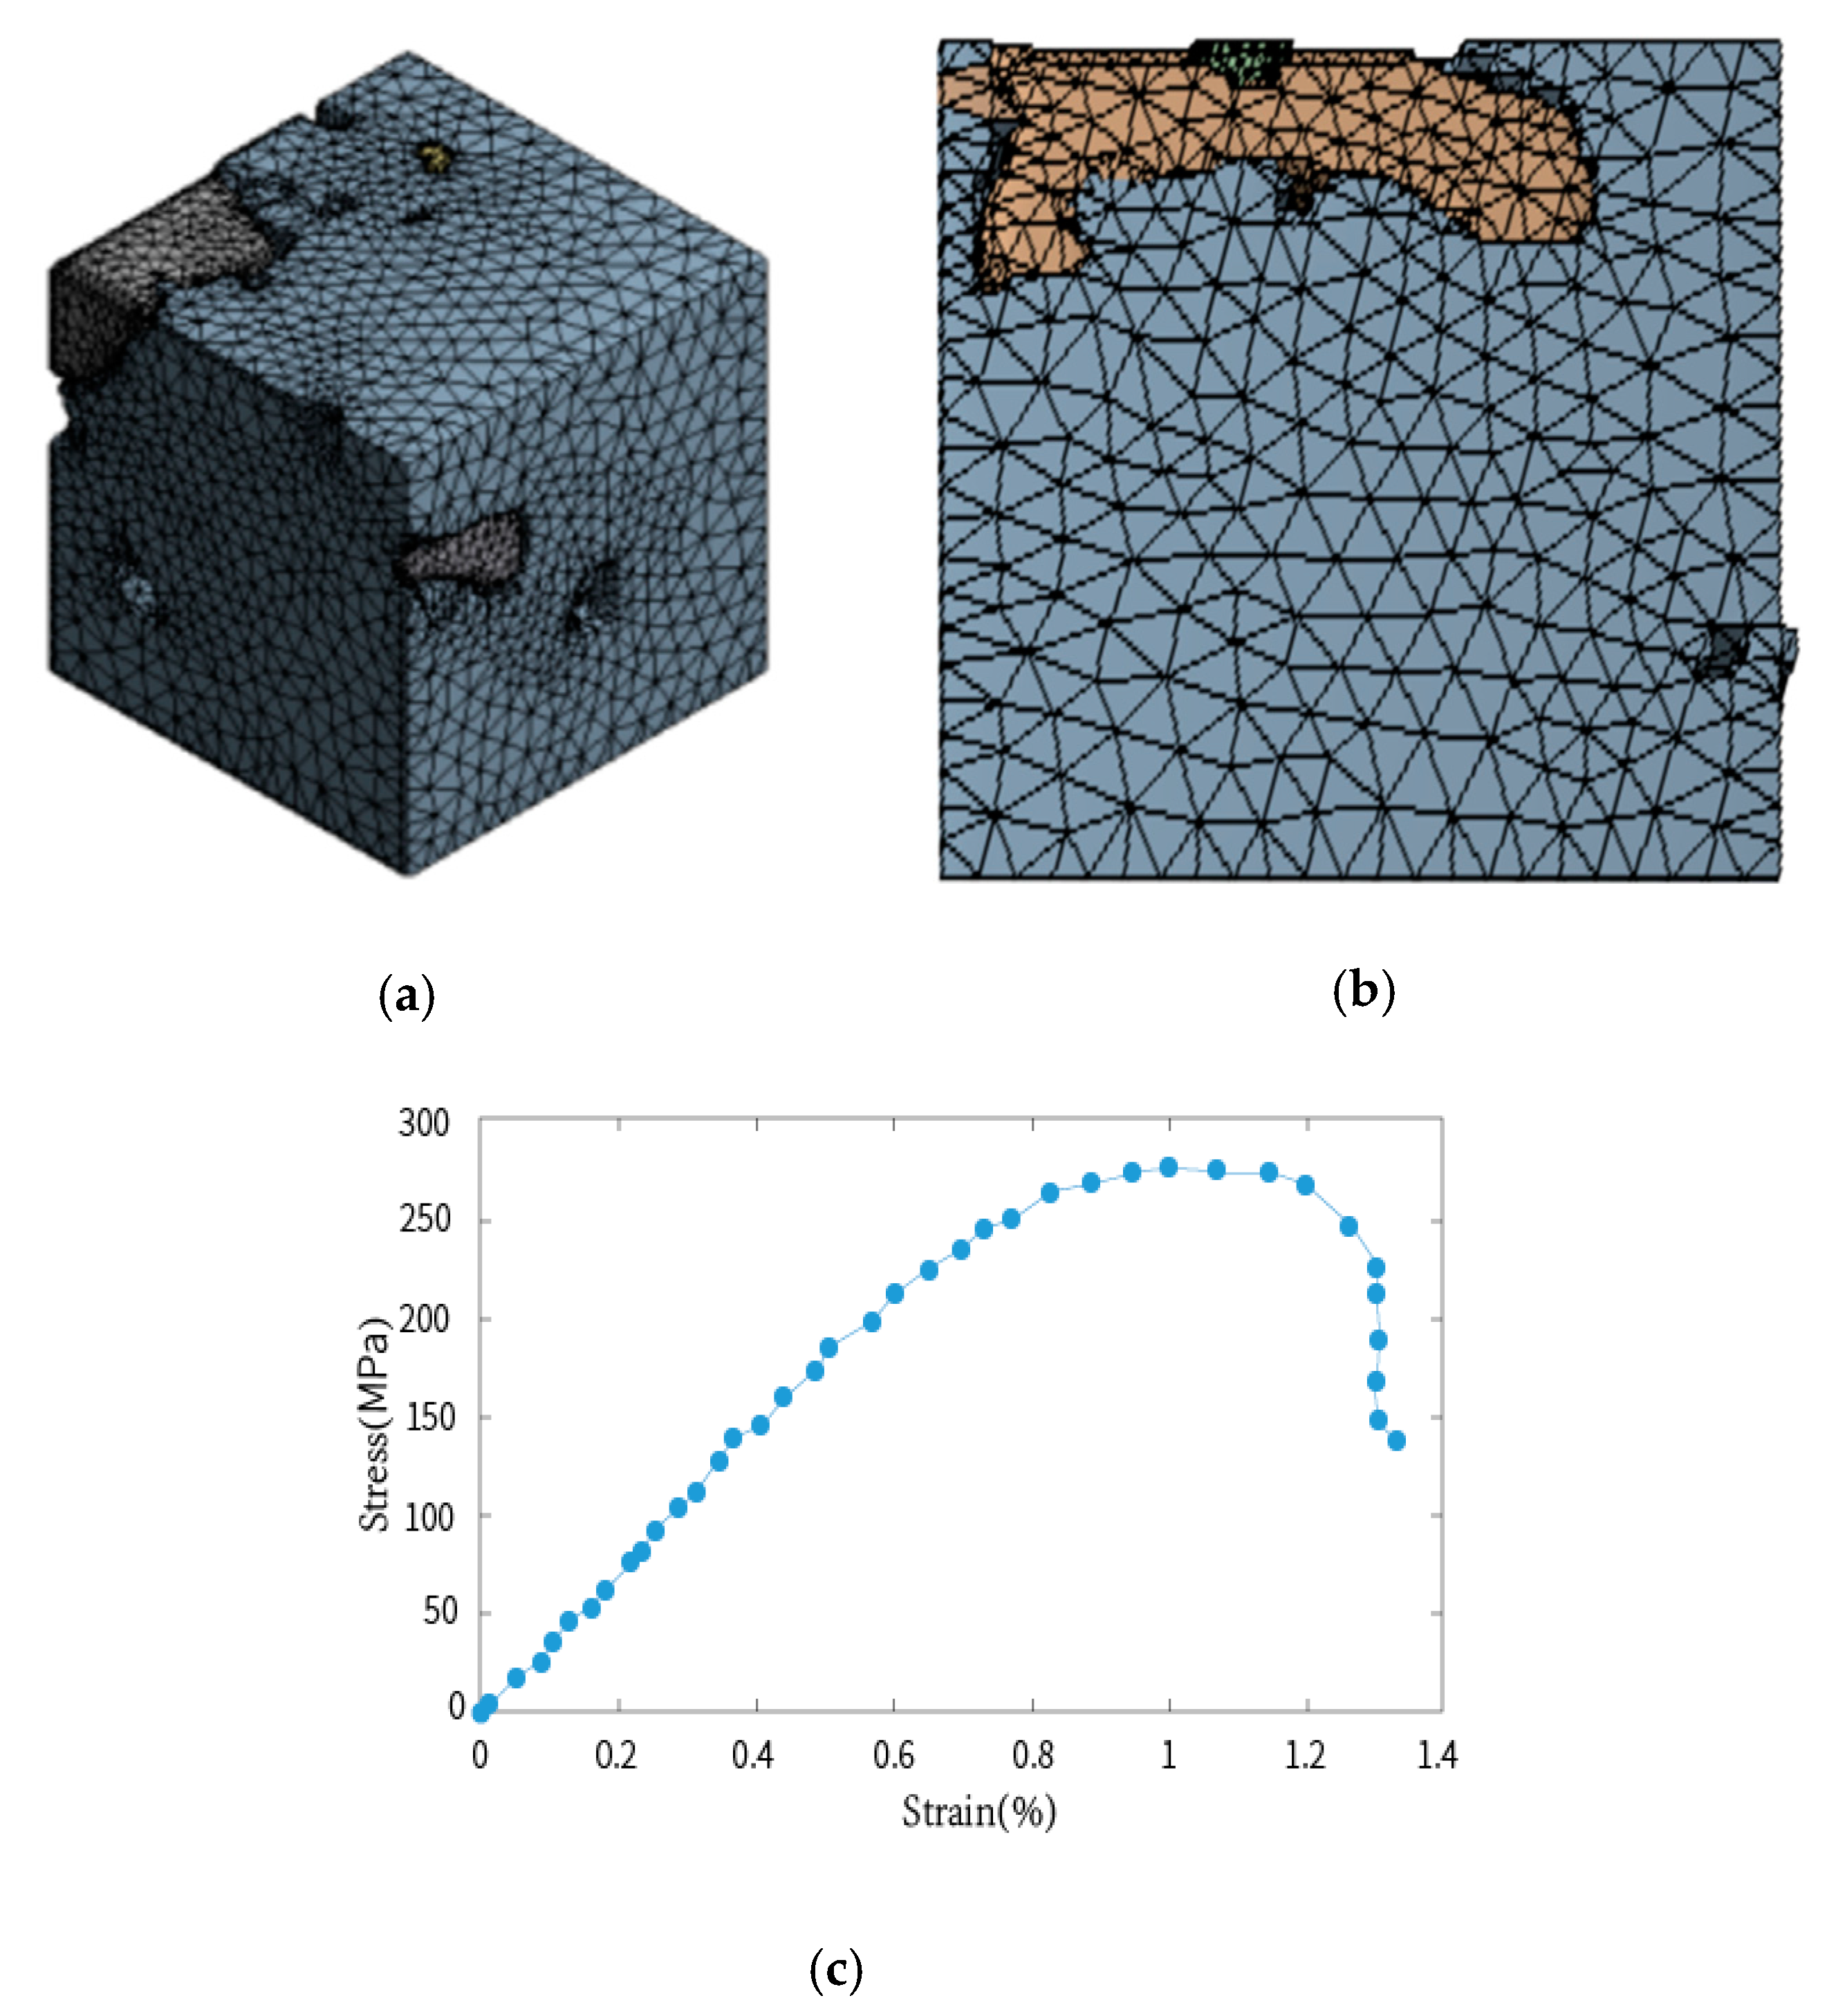
3.1. Finite Element Method
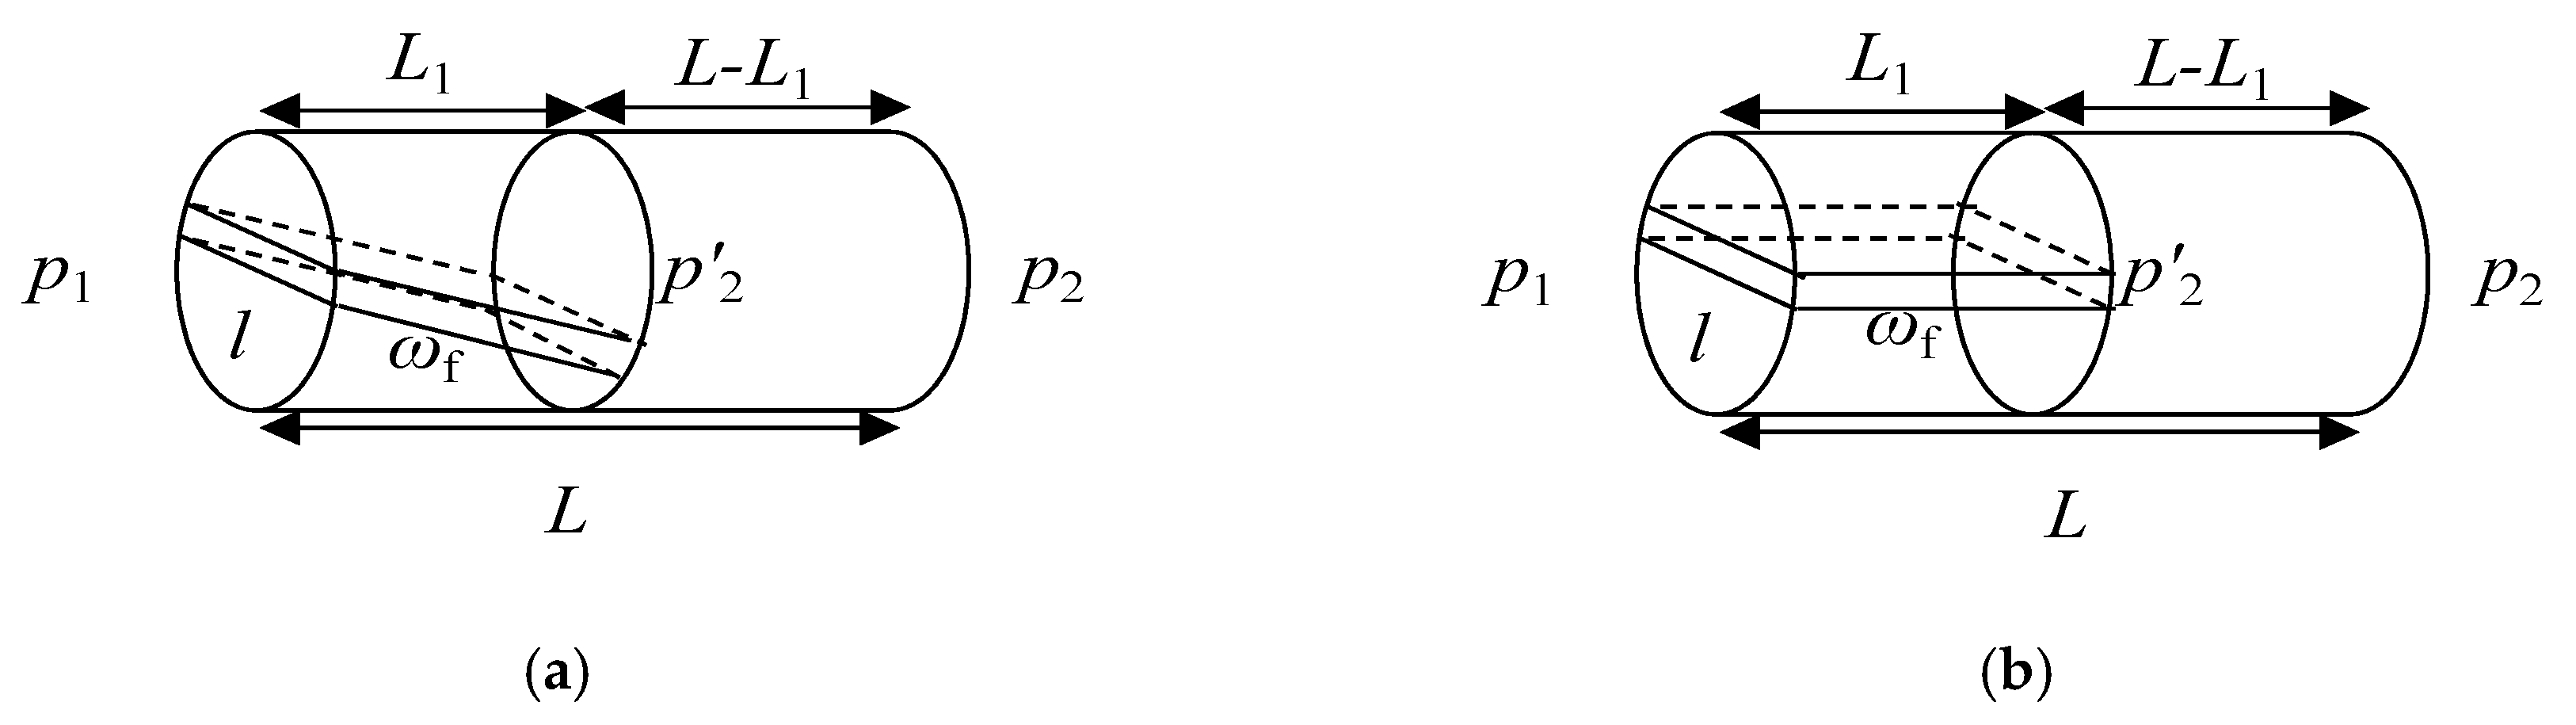
3.2. Stress-Dependent Permeability Model
4. Results and Discussion
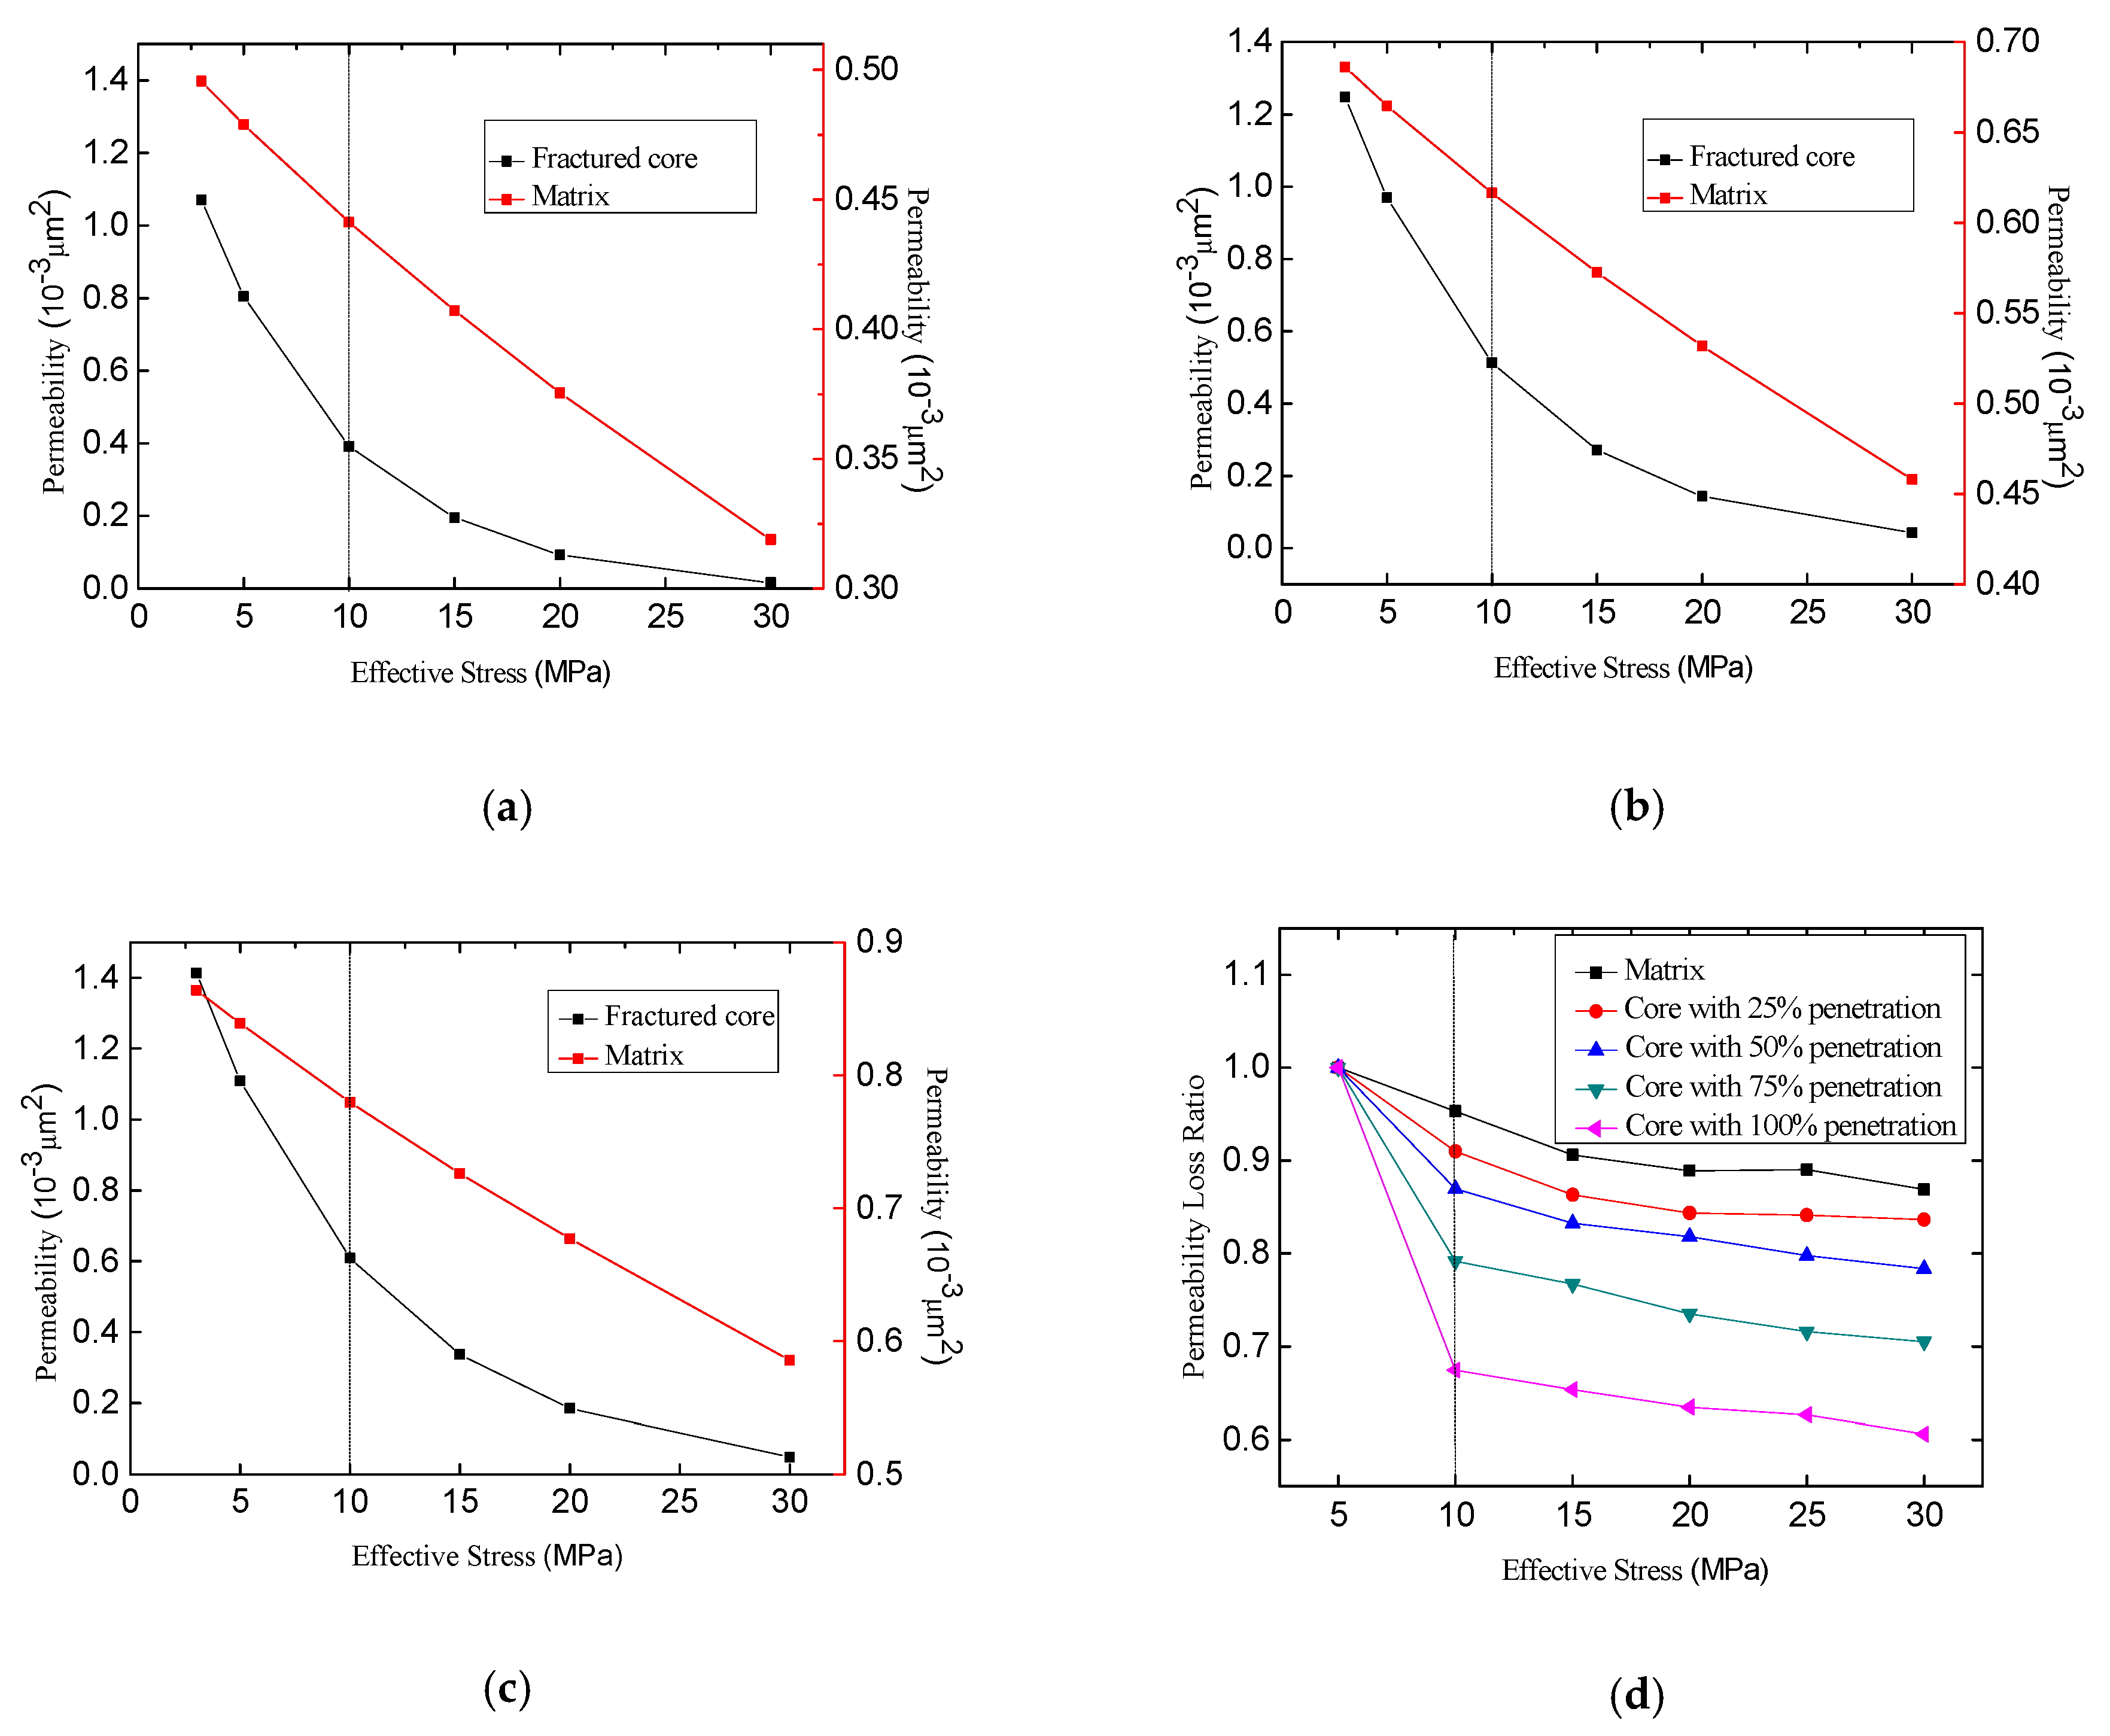
4.1. Experimental Results
4.1.1. Matrix and Fractured Cores
4.1.2. Fractured Cores with Different Fracture Penetration Extents
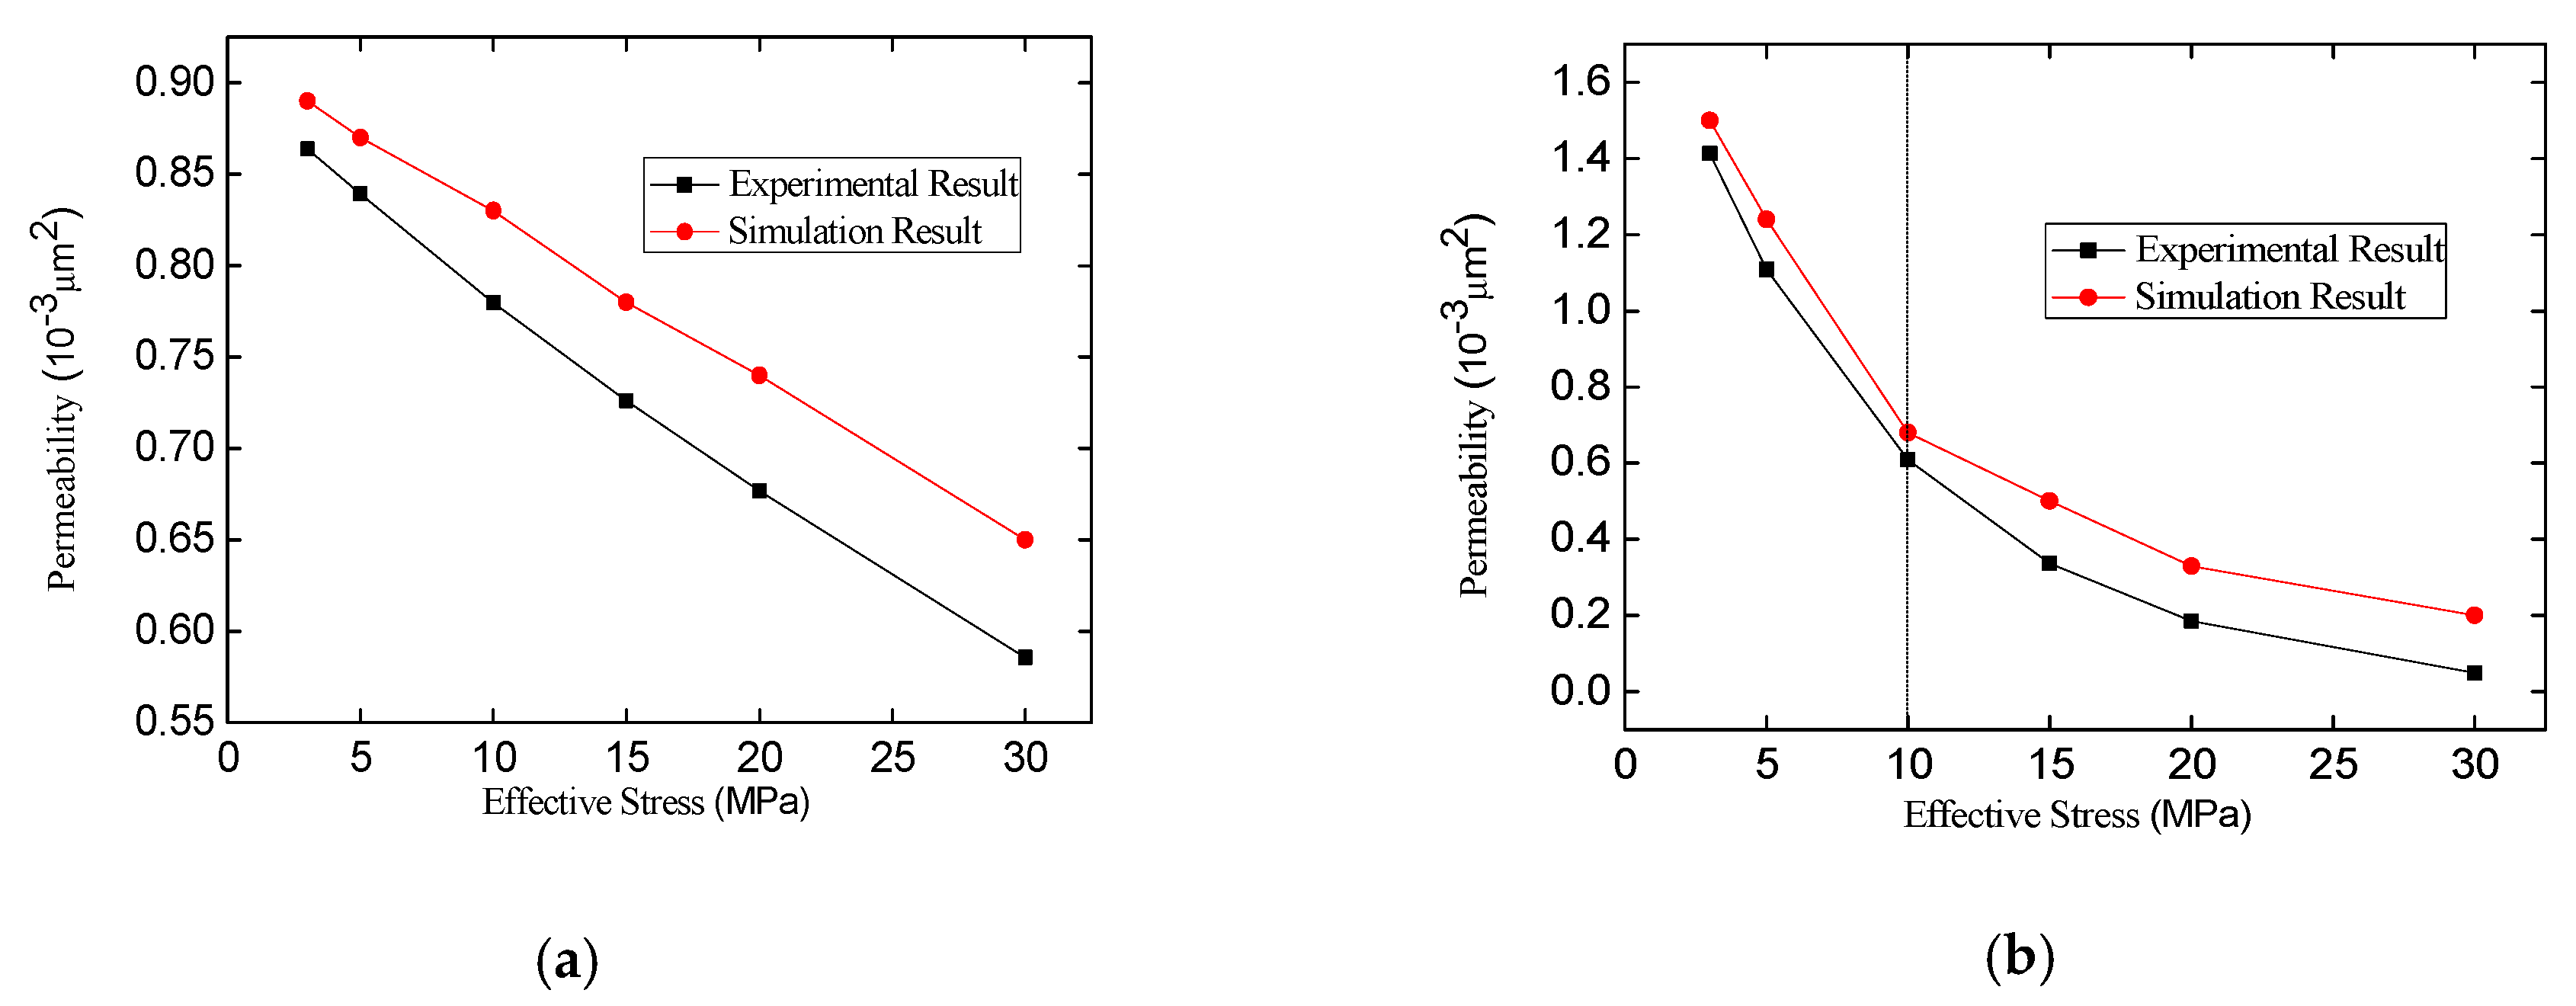
4.2. FEM Simulation Results
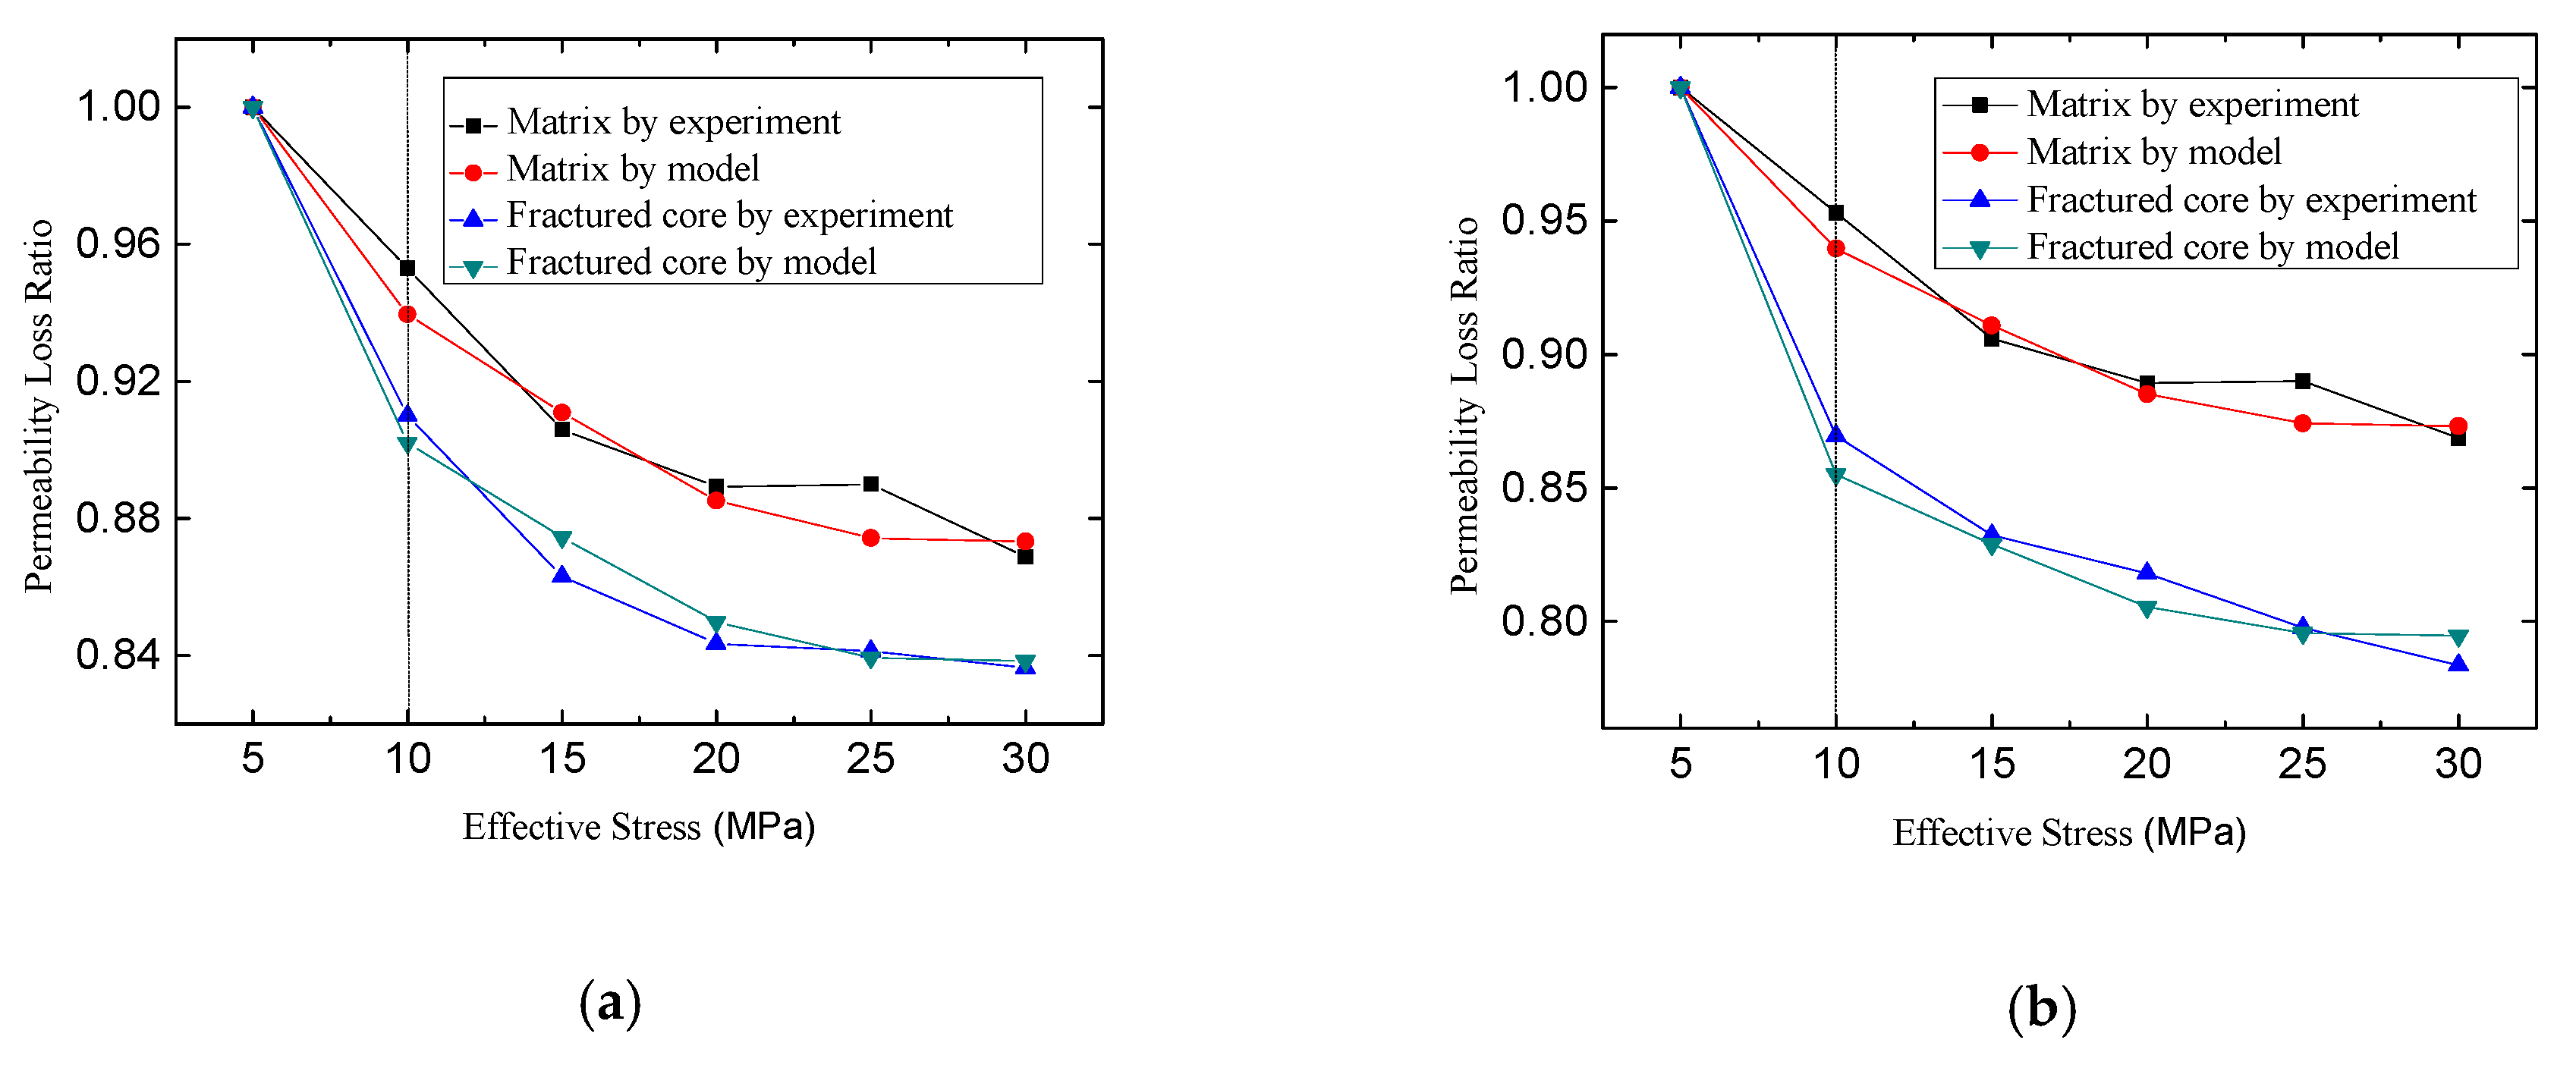
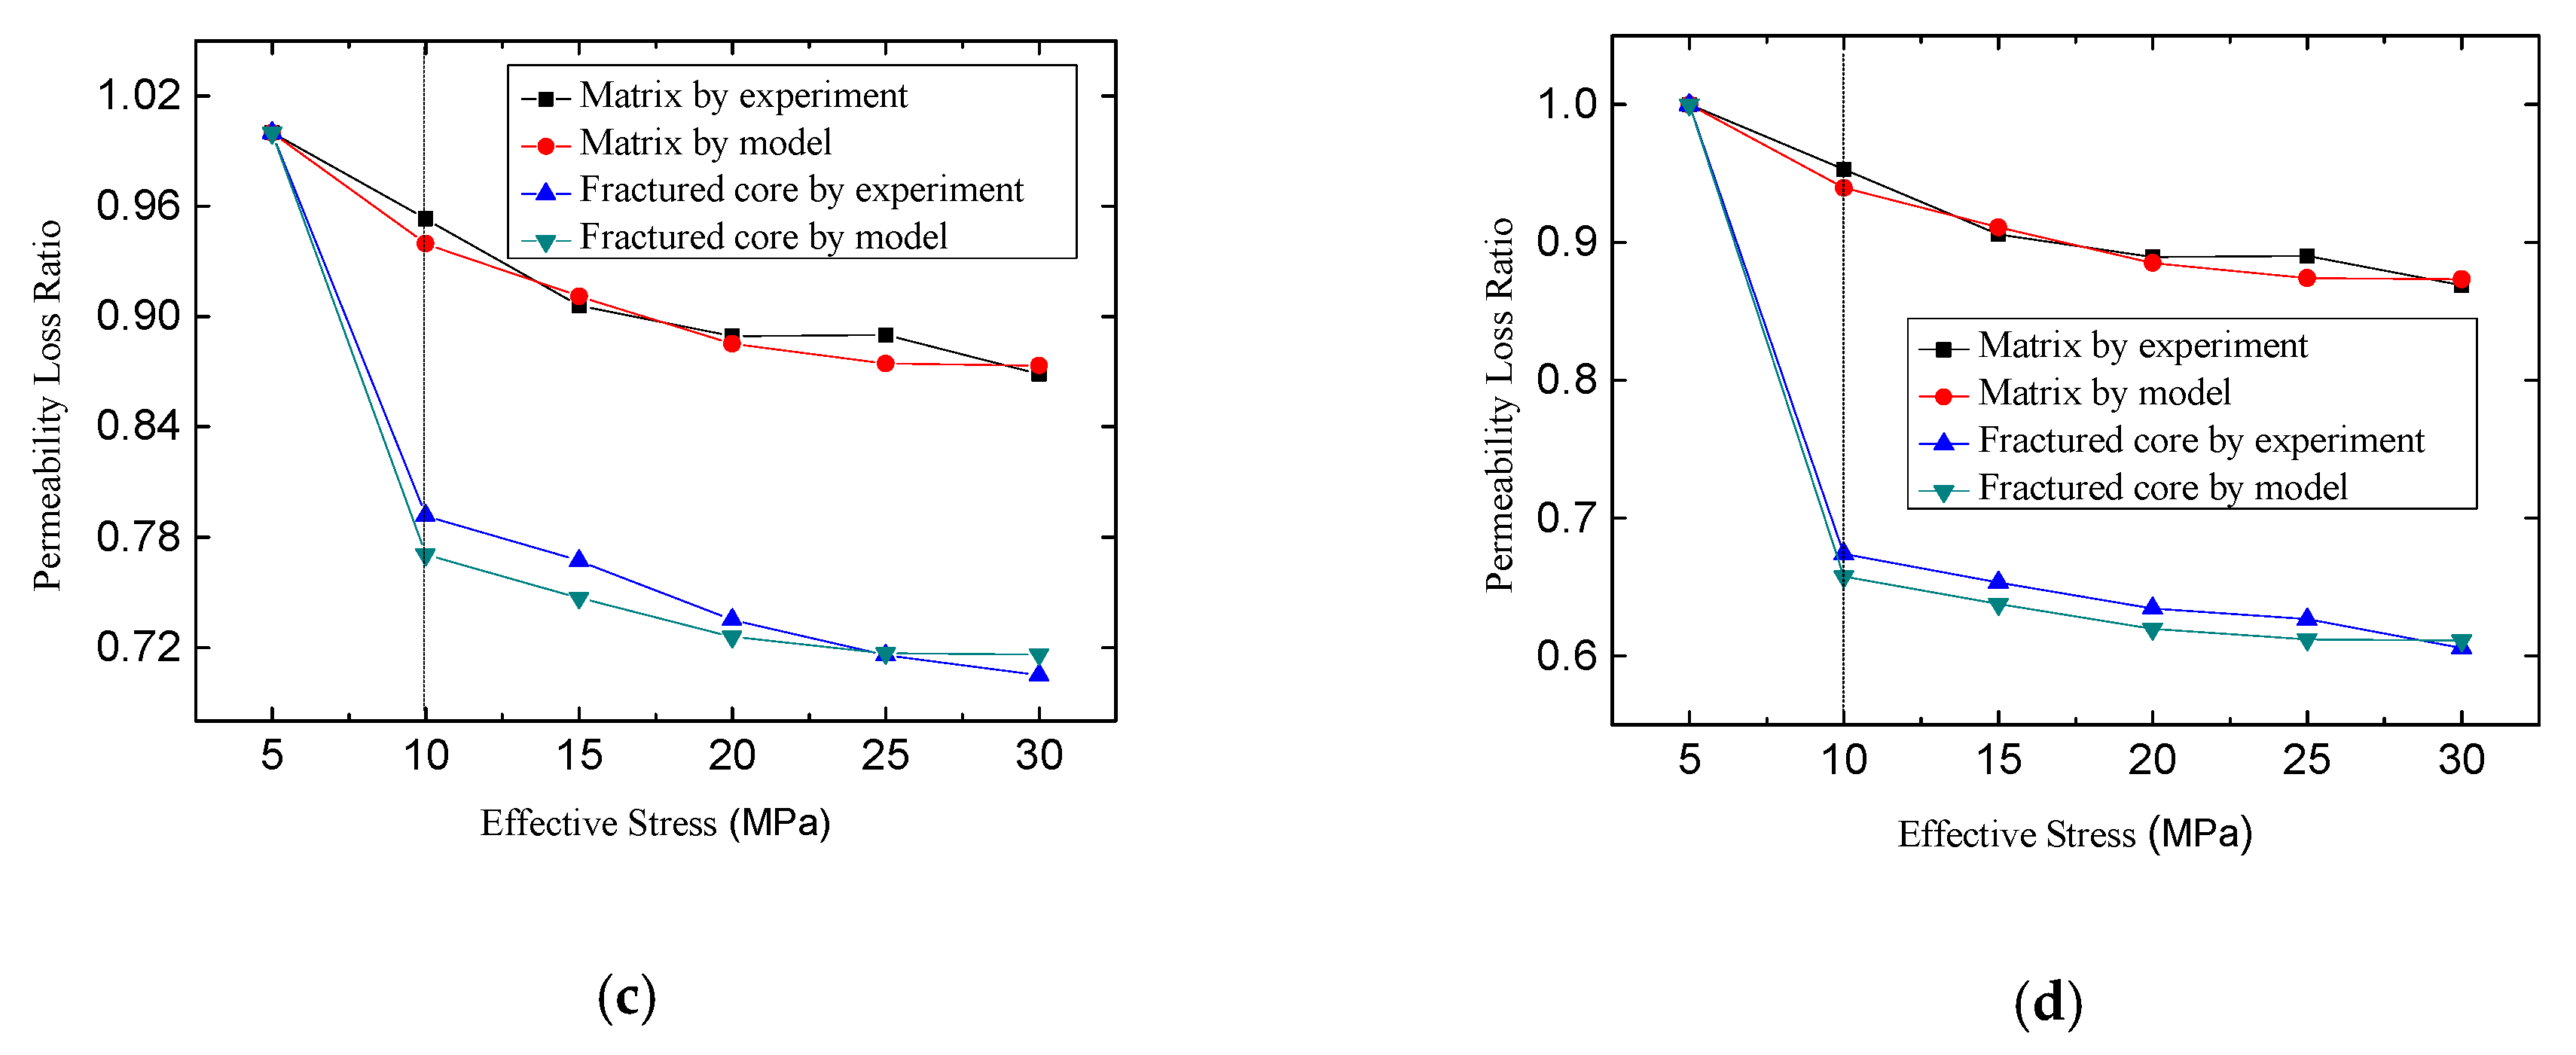
4.3. Comparison of Model and Experimental Results
4.4. Influencing Factor Analysis
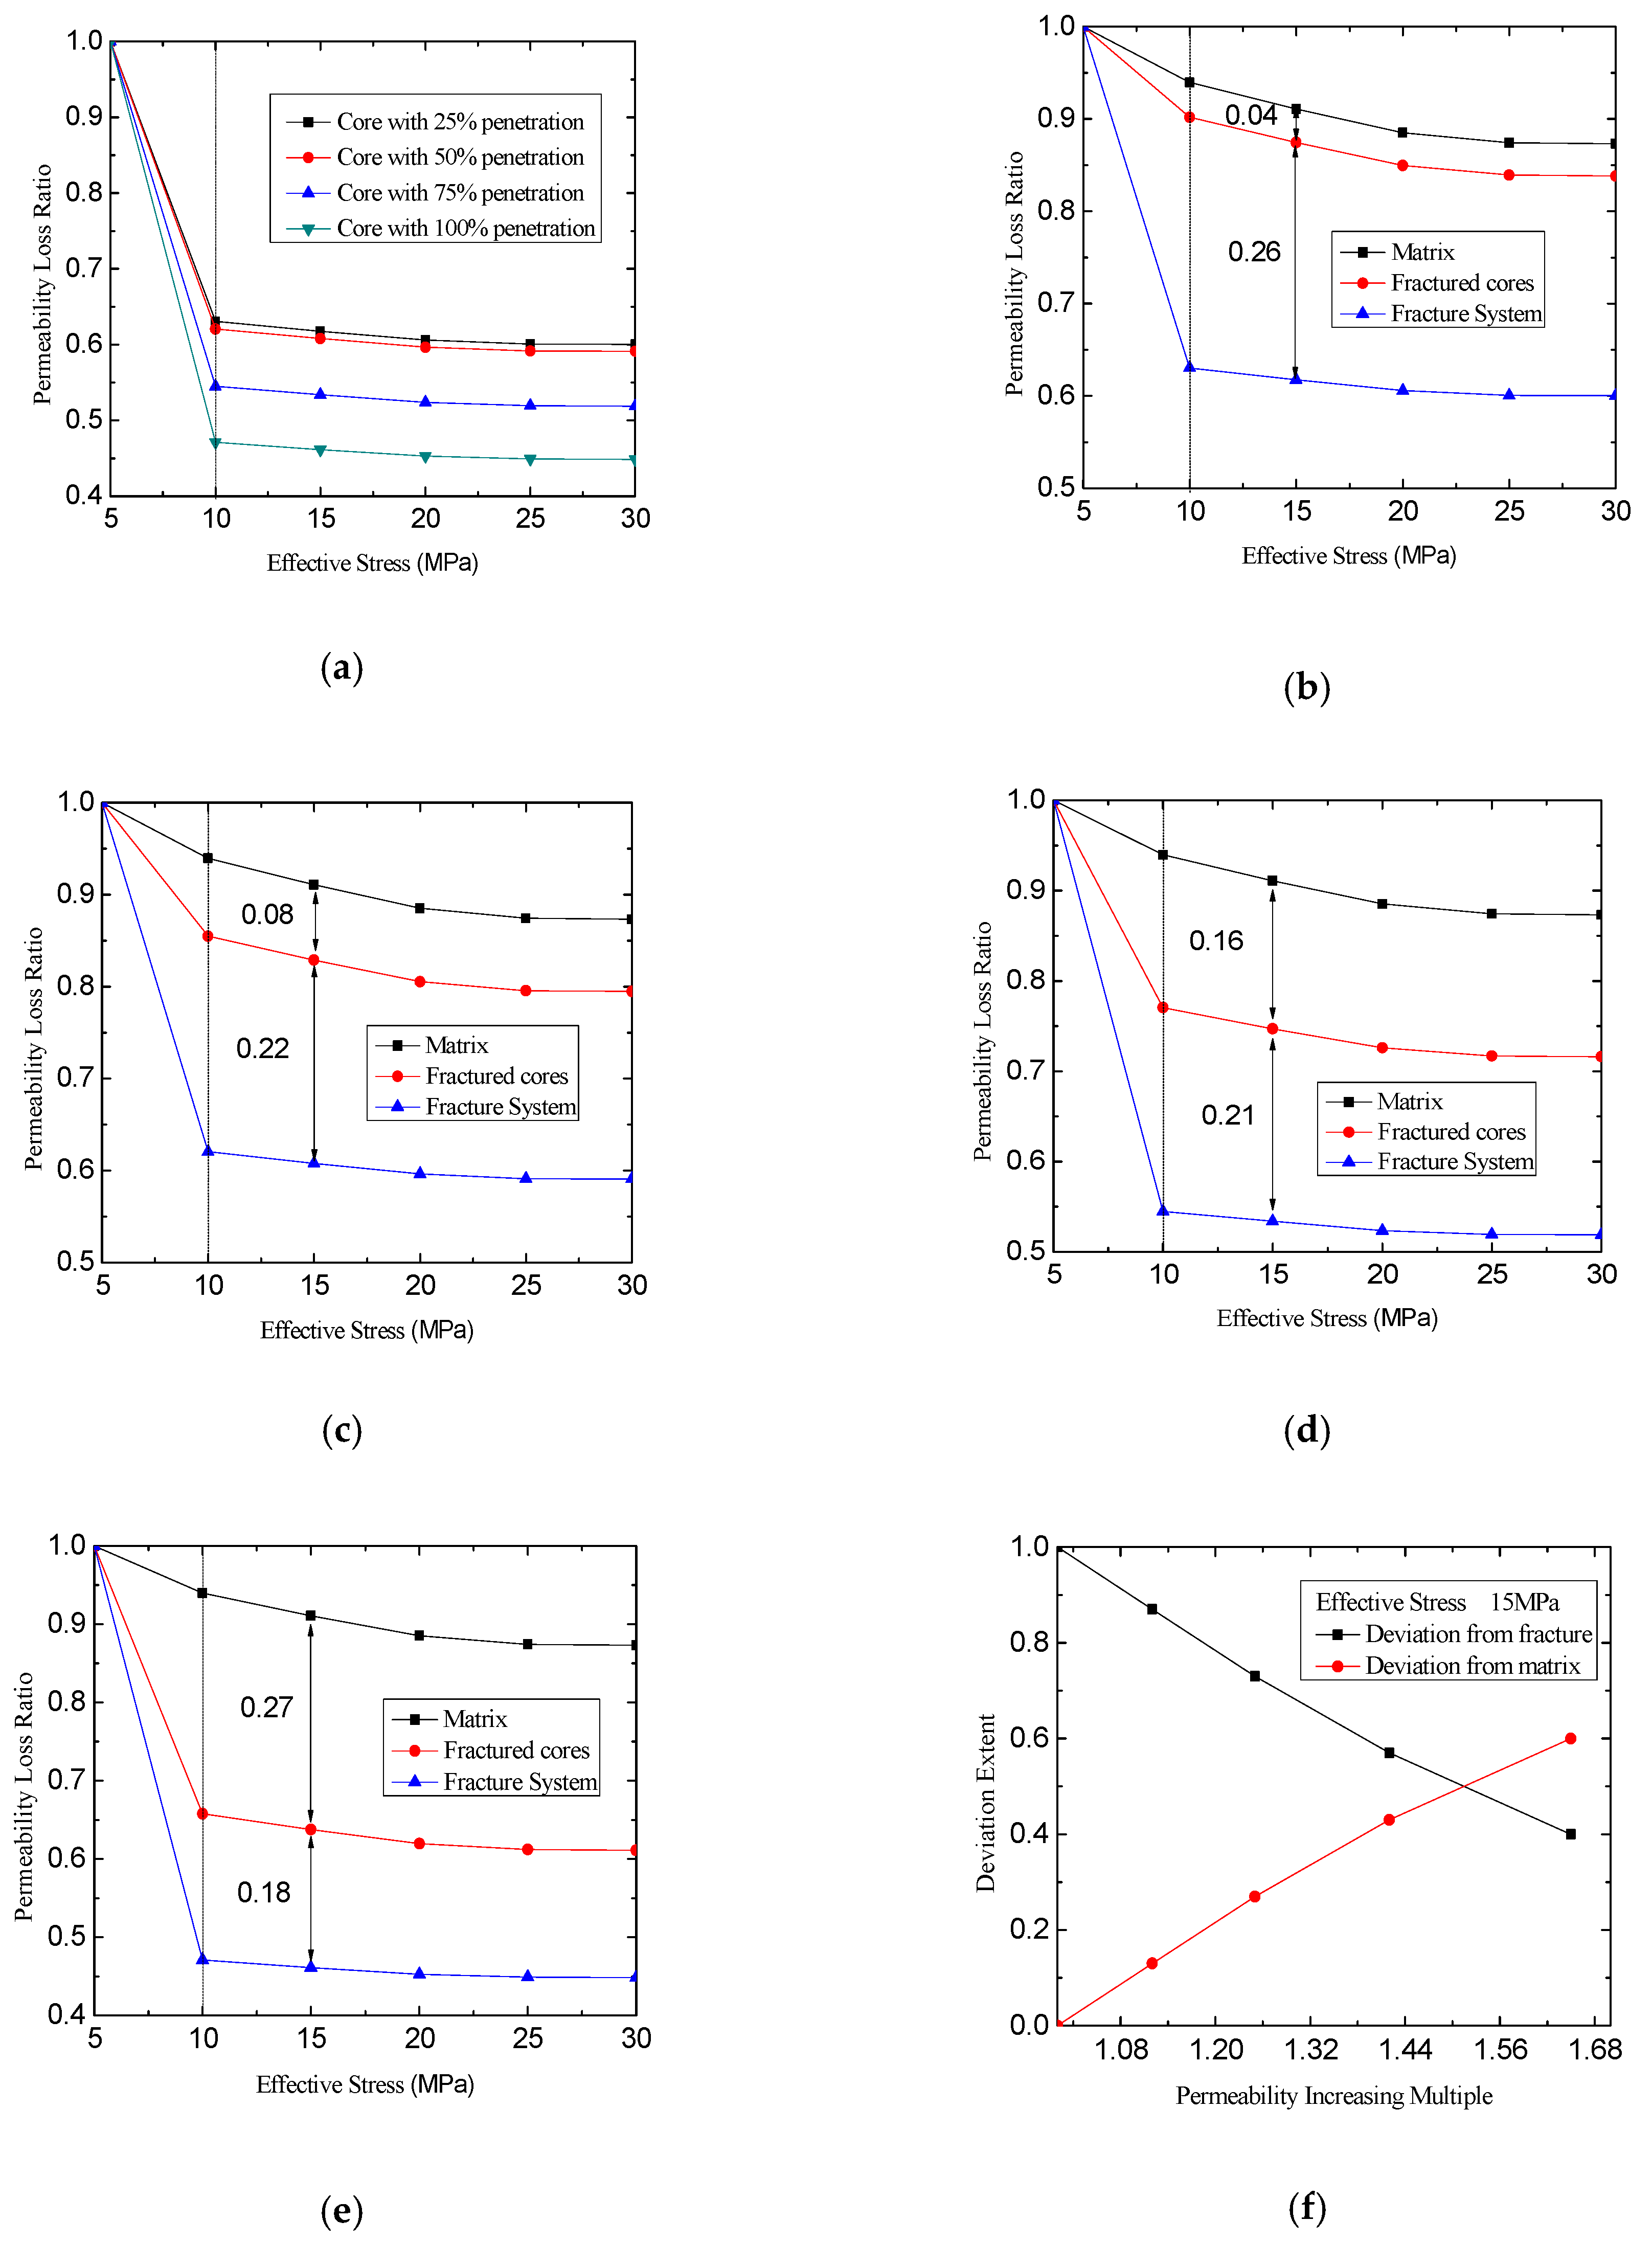
4.4.1. Fracture Penetration Extent
4.4.2. Permeability Increasing Multiples
5. Conclusions
Author Contributions
Acknowledgments
Conflicts of Interest
References
- Neto, L.B.; Kotousov, A.; Bedrikovetsky, P. Elastic properties of porous media in the vicinity of the percolation limit. J. Petrol. Sci. Eng. 2011, 78, 328–333. [Google Scholar] [CrossRef]
- Gajo, A.; Loret, B.; Hueckel, T. Electro-chemo-mechanical couplings in saturated porous media: Elastic-plastic behaviour of heteroionic expansive clays. Int. J. Solids Struct. 2002, 39, 4327–4362. [Google Scholar] [CrossRef]
- Zhang, H.J.; Jeng, D.S.; Barry, D.A.; Seymour, B.R.; Li, L. Solute transport in nearly saturated porous media under landfill clay liners: A finite deformation approach. Int. J. Solids Struct. 2013, 479, 189–199. [Google Scholar] [CrossRef]
- Wang, S.J.; Hsu, K.C. The application of the first-order second-moment method to analyze poroelastic problems in heterogeneous porous media. Int. J. Solids Struct. 2009, 369, 209–221. [Google Scholar] [CrossRef]
- Mokni, N.; Olivella, S.; Li, X.L.; Smets, S.; Valcke, E. Deformation induced by dissolution of salts in porous media. Phys. Chem. Earth 2008, 3, S436–S443. [Google Scholar] [CrossRef]
- Cao, N.; Lei, G. Stress sensitivity of tight reservoirs during pressure loading and unloading process. Petrol. Explor. Dev. 2019, 46, 1–7. [Google Scholar] [CrossRef]
- Wang, W.D.; Shahvali, M.; Su, Y.L. A semi-analytical model for production from tight oil reservoirs with hydraulically fractured horizontal wells. Fuel 2015, 158, 612–618. [Google Scholar] [CrossRef]
- Zhang, Q.; Su, Y.L.; Wang, W.D.; Lu, M.J.; Sheng, G.L. Gas transport behaviors in shale nanopores based on multiple mechanisms and macroscale modeling. Int. J. Heat Mass Transf. 2018, 125, 845–857. [Google Scholar] [CrossRef]
- Zhang, Q.; Su, Y.L.; Wang, W.D.; Lu, M.J.; Sheng, G.L. Apparent permeability for liquid transport in nanopores of shale reservoirs: Coupling flow enhancement and near wall flow. Int. J. Heat Mass Transf. 2017, 115, 224–234. [Google Scholar] [CrossRef]
- Zhang, C.; Yu, L.; Feng, R.M.; Zhang, Y.; Zhang, G.J. Numerical Study of Stress Distribution and Fracture Development above a Protective Coal Seam in Longwall Mining. Processes 2018, 6, 146. [Google Scholar] [CrossRef]
- Jiang, H.J.; Yan, J.N. Experimental study on stress sensibility of fractured reservoir. Spec. Oil Gas Reserv. 2000, 3, 39–41. (In Chinese) [Google Scholar]
- Fatt, I. Reduction in permeability with overburden pressure. J. Petrol. Technol. 1952, 4, 16. [Google Scholar] [CrossRef]
- Buchsteiner, H.; Warpinski, N.R.; Economides, M.J. Stress-Induced Permeability Reduction in Fissured Reservoirs. In Proceedings of the SPE Annual Technical Conference and Exhibition, Houston, TX, USA, 3–6 October 1993. SPE26513-MS. [Google Scholar] [CrossRef]
- Zhang, Y.; Cui, Y. Experimental study of pressure sensitivity on the gravel low permeability layer. Oil Drill. Prod. Technol. 1999, 21, 1–6. (In Chinese) [Google Scholar]
- Jones, F.O.; Owens, W.W. A laboratory study of low-permeability gas sands. J. Petrol. Technol. 1980, 32, 1631–1640. [Google Scholar] [CrossRef]
- Nelson, R.A. An experimental study of fracture permeability in porous rock. In Proceedings of the 17th US Symposium on Rock Mechanics, Snow Bird, UT, USA, 25–27 August 1976. ARMA-76-0127. [Google Scholar]
- Archer, R.A. Impact of Stress Sensitive Permeability on Production Data Analysis. In Proceedings of the SPE Unconventional Reservoirs Conference, Keystone, CO, USA, 10–12 February 2008. SPE-114166-MS. [Google Scholar] [CrossRef]
- Zimmerman, R.W.; Kumar, S.; Bodvarsson, G.S. Lubrication theory analysis of the permeability of rough-walled fractures. Int. J. Rock Mech. Min. 1991, 28, 325–331. [Google Scholar] [CrossRef]
- Dobrynin, V.M. Effect of overburden pressure on some properties of sandstones. Soc. Petrol. Eng. 1962, 4, 360–366. [Google Scholar] [CrossRef]
- Lan, L. Research on stress sensitivity and prediction of fracture width in naturally fractured sandstone reservoirs. Master’s Thesis, Southwest Petroleum University, Chengdu, China, 2005. (In Chinese). [Google Scholar]
- Gangi, A.F. Variation of whole and fractured porous rock permeability with confining pressure. Int. J. Rock Mech. Min. 1978, 15, 249–257. [Google Scholar] [CrossRef]
- Li, D.Q.; Kang, Y.L.; Zhang, H. New evaluation method of permeability stress sensitivity based on visual fracture aperture measurement. Nat. Gas Geosci. 2011, 2, 494–500. (In Chinese) [Google Scholar]
- Lei, G.; Dong, P.C.; Yang, S.; Wang, B.; Wu, Z.S. Study of stress sensitivity of low-permeability reservoir based on arrangement of particles. Rock Soil Mech. 2014, 35, 209–214. (In Chinese) [Google Scholar]
- Advani, S.H.; Lee, T.S.; Avasthi, J.M. Parametric sensitivity investigations for hydraulic fracture configuration optimization: Rock Mechanics as a Guide for Efficient Utilization of Natural Resources. In Proceedings of the 30th U.S. Symposium, Morgantown, WV, USA, 19–22 June 1989. [Google Scholar] [CrossRef]
- McKee, C.R.; Bumb, A.C.; Koenig, R.A. Stress-dependent permeability and porosity of coal and other geologic formations. SPE Form. Eval. 1988, 3, 81–91. [Google Scholar] [CrossRef]
- David, C.; Wong, T.F.; Zhu, W.; Zhang, J. Laboratory measurement of compaction-induced permeability change in porous rocks: Implications for the generation and maintenance of pore pressure excess in the crust. Pure Appl. Geophys. 1994, 143, 425–456. [Google Scholar] [CrossRef]
- Tong, S.Y.; Gu, M.; Singh, R.; Mohanty, K.K. Simulation of proppant transport in foam fracturing fluid based on experimental results. In Proceedings of the SPE/AAPG/SEG Unconventional Resources Technology Conference, Houston, TX, USA, 23–25 July 2018. URTEC-2901054-MS. [Google Scholar] [CrossRef]
- Shrivastava, K.; Sharma, M.M. Proppant transport in complex fracture networks. In Proceedings of the SPE Hydraulic Fracturing Technology Conference and Exhibition, The Woodlands, TX, USA, 23–25 January 2018. SPE-189895-MS. [Google Scholar] [CrossRef]
- Tong, S.Y.; Singh, R.; Mohanty, K.K. Proppant transport in fractures with foam-based fracturing fluids. In Proceedings of the SPE Annual Technical Conference and Exhibition, San Antonio, TX, USA, 9–11 October 2017. SPE-187376-MS. [Google Scholar] [CrossRef]
- McClure, M.W.; Babazadeh, M.; Shiozawa, S.; Huang, J. Fully coupled hydromechanical simulation of hydraulic fracturing in 3D discrete-fracture networks. SPE J. 2016. [Google Scholar] [CrossRef]
- Wang, C.Y.; Du, X.Y. Experimental study on the splitting characteristics of sandstone in Brazil based on size effect. Min. Res. Dev. 2018, 6, 44–48. (In Chinese) [Google Scholar]
- Peng, C.J.; Chen, C.C.; Xu, J.; Zhang, H.L.; Tang, Y.; Nie, W.; Zhao, K. Loading rate dependency of rock stress-strain curve based on Brazil splitting test. J. Rock Mech. Eng. 2018, A1, 3247–3252. (In Chinese) [Google Scholar]
- Zhan, Y.P.; Fu, C.L.; Li, S.Y. The artificial cracks preparation method for the tight sandstone fracture reservoir. Res. Expl. Lab. 2017, 1, 10–12. (In Chinese) [Google Scholar]
- Li, C. Double effective stress of porous media. Nat. Mag. 1999, 5, 288–292. (In Chinese) [Google Scholar]
- Qiao, L.P.; Wang, Z.C.; Li, S.C. Effective stress law for permeability of tight gas reservoir sandstone. J. Rock Mech. Eng. 2011, 7, 1422–1427. (In Chinese) [Google Scholar]
- Duan, X.G.; An, W.G.; Hu, Z.M.; Gao, S.S.; Ye, L.Y.; Chang, J. Experimental study on fracture stress sensitivity of Silurian Longmaxi shale formation, Sichuan Basin. Nat. Gas Geosci. 2017, 28, 1416–1424. (In Chinese) [Google Scholar]
- Ahammad, M.J.; Rahman, M.A.; Zheng, L.; Alam, J.M.; Butt, S.D. Numerical investigation of two-phase fluid flow in a perforation tunnel. J. Nat. Gas. Sci. Eng. 2017, 55, 606–611. [Google Scholar] [CrossRef]
- Jiang, C.B.; Xu, Z.M.; Li, X.L. Fractional step finite element formulation for solving incompressible flows. J. Tsinghua Univ. (Sci. Technol.) 2002, 42, 278–280. (In Chinese) [Google Scholar]
- Abdoulkadri, C.; Stiaan, G.; Wang, R.J. Newton–Raphson Solver for Finite Element Methods Featuring Nonlinear Hysteresis Models. IEEE. Trans. Magn. 2018, 54, 1–8. [Google Scholar] [CrossRef]
- Johari, A.; Heydari, A. Reliability analysis of seepage using an applicable procedure based on stochastic scaled boundary finite element method. Eng. Anal. Bound. Elem. 2018, 94, 44–59. [Google Scholar] [CrossRef]
- Walsh, J.B. Effect of pore and confining pressure on fracture permeability. Int. J. Rock Mech. Min. 1981, 18, 429–435. [Google Scholar] [CrossRef]
- Vahab, M.; Akhondzadeh, S.; Khoei, A.R.; Khalili, N. An X-FEM investigation of hydro-fracture evolution in naturally-layered domains. Eng. Fract. Mech. 2018, 191. [Google Scholar] [CrossRef]
- Liu, X.D.; Morita, N. Collapse and bending analysis of slotted liners by 3D FEM under various reservoir Conditions. In Proceedings of the SPE Annual Technical Conference and Exhibition, Dallas, TX, USA, 24–26 September 2018. SPE-191441-MS. [Google Scholar] [CrossRef]
- Tong, S.Y.; Mohanty, K.K. Proppant transport study in fractures with intersections. Fuel 2016, 181, 463–477. [Google Scholar] [CrossRef]
- Wang, H.Y.; Sharma, M.M. Modeling of hydraulic fracture closure on proppants with proppant settling. J. Petrol. Sci. Eng. 2018, 171, 636–645. [Google Scholar] [CrossRef]
- Tong, S.Y.; Singh, R.; Mohanty, K.K. A visualization study of proppant transport in foam fracturing fluids. J. Nat. Gas Sci. Eng. 2018, 52, 235–247. [Google Scholar] [CrossRef]
- Zheng, J.T. Study on the stress-dependent properties of low-permeability rock and 3D rock porous structure reconstruction. Ph.D. Thesis, China University of Mining & Technology, Beijing, China, 2016. [Google Scholar]
- Min, L.Y.; Lv, C.Y.; Zhang, B.W. SY/T6385—2016 Porosity and permeability measurement under overburden pressure. Petrol. Indus. Press. 2016, 1, 1–7. (In Chinese) [Google Scholar]


| No. | Core Type | Core Diameter (cm) | Core Length (cm) | Width of Fracture (cm) | Porosity (%) | Permeability (10−3 μm2) |
|---|---|---|---|---|---|---|
| 1 | Matrix | 2.46 | 7.24 | 0.00 | 14.7 | 0.52 |
| Fractured core | 2.46 | 7.24 | 2.41 | 14.7 | 1.08 | |
| 2 | Matrix | 2.53 | 6.37 | 0.00 | 15.2 | 0.72 |
| Fractured core | 2.53 | 6.37 | 2.42 | 15.2 | 1.27 | |
| 3 | Matrix | 2.48 | 8.35 | 0.00 | 15.4 | 0.90 |
| Fractured core | 2.48 | 8.35 | 2.44 | 15.4 | 1.43 |
| Core Type | Core Diameter (cm) | Core Length (cm) | Width of Fracture (cm) | Permeability (10−3 μm2) | Permeability Increase Multiple |
|---|---|---|---|---|---|
| Matrix | 24.62 | 31.30 | 0.00 | 0.052 | 1.00 |
| Fracture penetration 25% | 24.62 | 31.30 | 24.16 | 0.058 | 1.12 |
| Fracture penetration 50% | 24.62 | 31.30 | 24.16 | 0.065 | 1.25 |
| Fracture penetration 75% | 24.62 | 31.30 | 24.16 | 0.074 | 1.42 |
| Fracture penetration 100% | 24.62 | 31.30 | 24.16 | 0.086 | 1.65 |
| Calculation Unit | Elastic Modulus (GPa) | Poisson’s Ratio | Internal Friction Angle (°) | Cohesion Force (MPa) |
|---|---|---|---|---|
| Matrix | 35.6 | 0.2 | 15 | 20 |
| Fracture and Pores | 3.56 | 0.3 | 20 | 2 |
© 2018 by the authors. Licensee MDPI, Basel, Switzerland. This article is an open access article distributed under the terms and conditions of the Creative Commons Attribution (CC BY) license (http://creativecommons.org/licenses/by/4.0/).
Share and Cite
Cao, N.; Lei, G.; Dong, P.; Li, H.; Wu, Z.; Li, Y. Stress-Dependent Permeability of Fractures in Tight Reservoirs. Energies 2019, 12, 117. https://doi.org/10.3390/en12010117
Cao N, Lei G, Dong P, Li H, Wu Z, Li Y. Stress-Dependent Permeability of Fractures in Tight Reservoirs. Energies. 2019; 12(1):117. https://doi.org/10.3390/en12010117
Chicago/Turabian StyleCao, Nai, Gang Lei, Pingchuan Dong, Hong Li, Zisen Wu, and Yudan Li. 2019. "Stress-Dependent Permeability of Fractures in Tight Reservoirs" Energies 12, no. 1: 117. https://doi.org/10.3390/en12010117
APA StyleCao, N., Lei, G., Dong, P., Li, H., Wu, Z., & Li, Y. (2019). Stress-Dependent Permeability of Fractures in Tight Reservoirs. Energies, 12(1), 117. https://doi.org/10.3390/en12010117