1. Introduction
Microgrids and nanogrids are potential solutions for providing better electrical service for areas that are insufficiently served by the traditional electricity grid. The same microgrids and nanogrids could also provide economic and environmental benefits in remote areas [
1]. The term nanogrid has been suggested for defining a small microgrid [
2], for instance a single house. Nanogrids can operate in either grid connected mode or in islanded mode.
Long term measurements of power quality indices for a nanogrid during islanded operation are needed in order to evaluate the performance and long term effects on the connected equipment in the nanogrid. This paper presents 48 weeks of frequency, voltage and reliability data for a nanogrid during islanded operation, including transitions between grid operation and islanded operation. The presented data is the main contribution of the paper.
The frequency measurements are compared to European electrical standards EN 50160 [
3] and EN 50160/A1 [
4] in order to establish if the frequency variations in the nanogrid during islanded operation surpasses the range set for systems without synchronous connection to an interconnected system. The frequency variations are also compared to International Electrotechnical Commission (IEC) Standard 60034-1 [
5], computer power supply ATX12V design specifications [
6], Intel power supply design specifications [
7] and IEC Standard 60076-1 [
8] to predict possible effects on connected equipment. The frequency variations are also correlated to the number of interruptions and the total downtime that occurred during the measured 48 weeks.
1.1. The Nanogrid
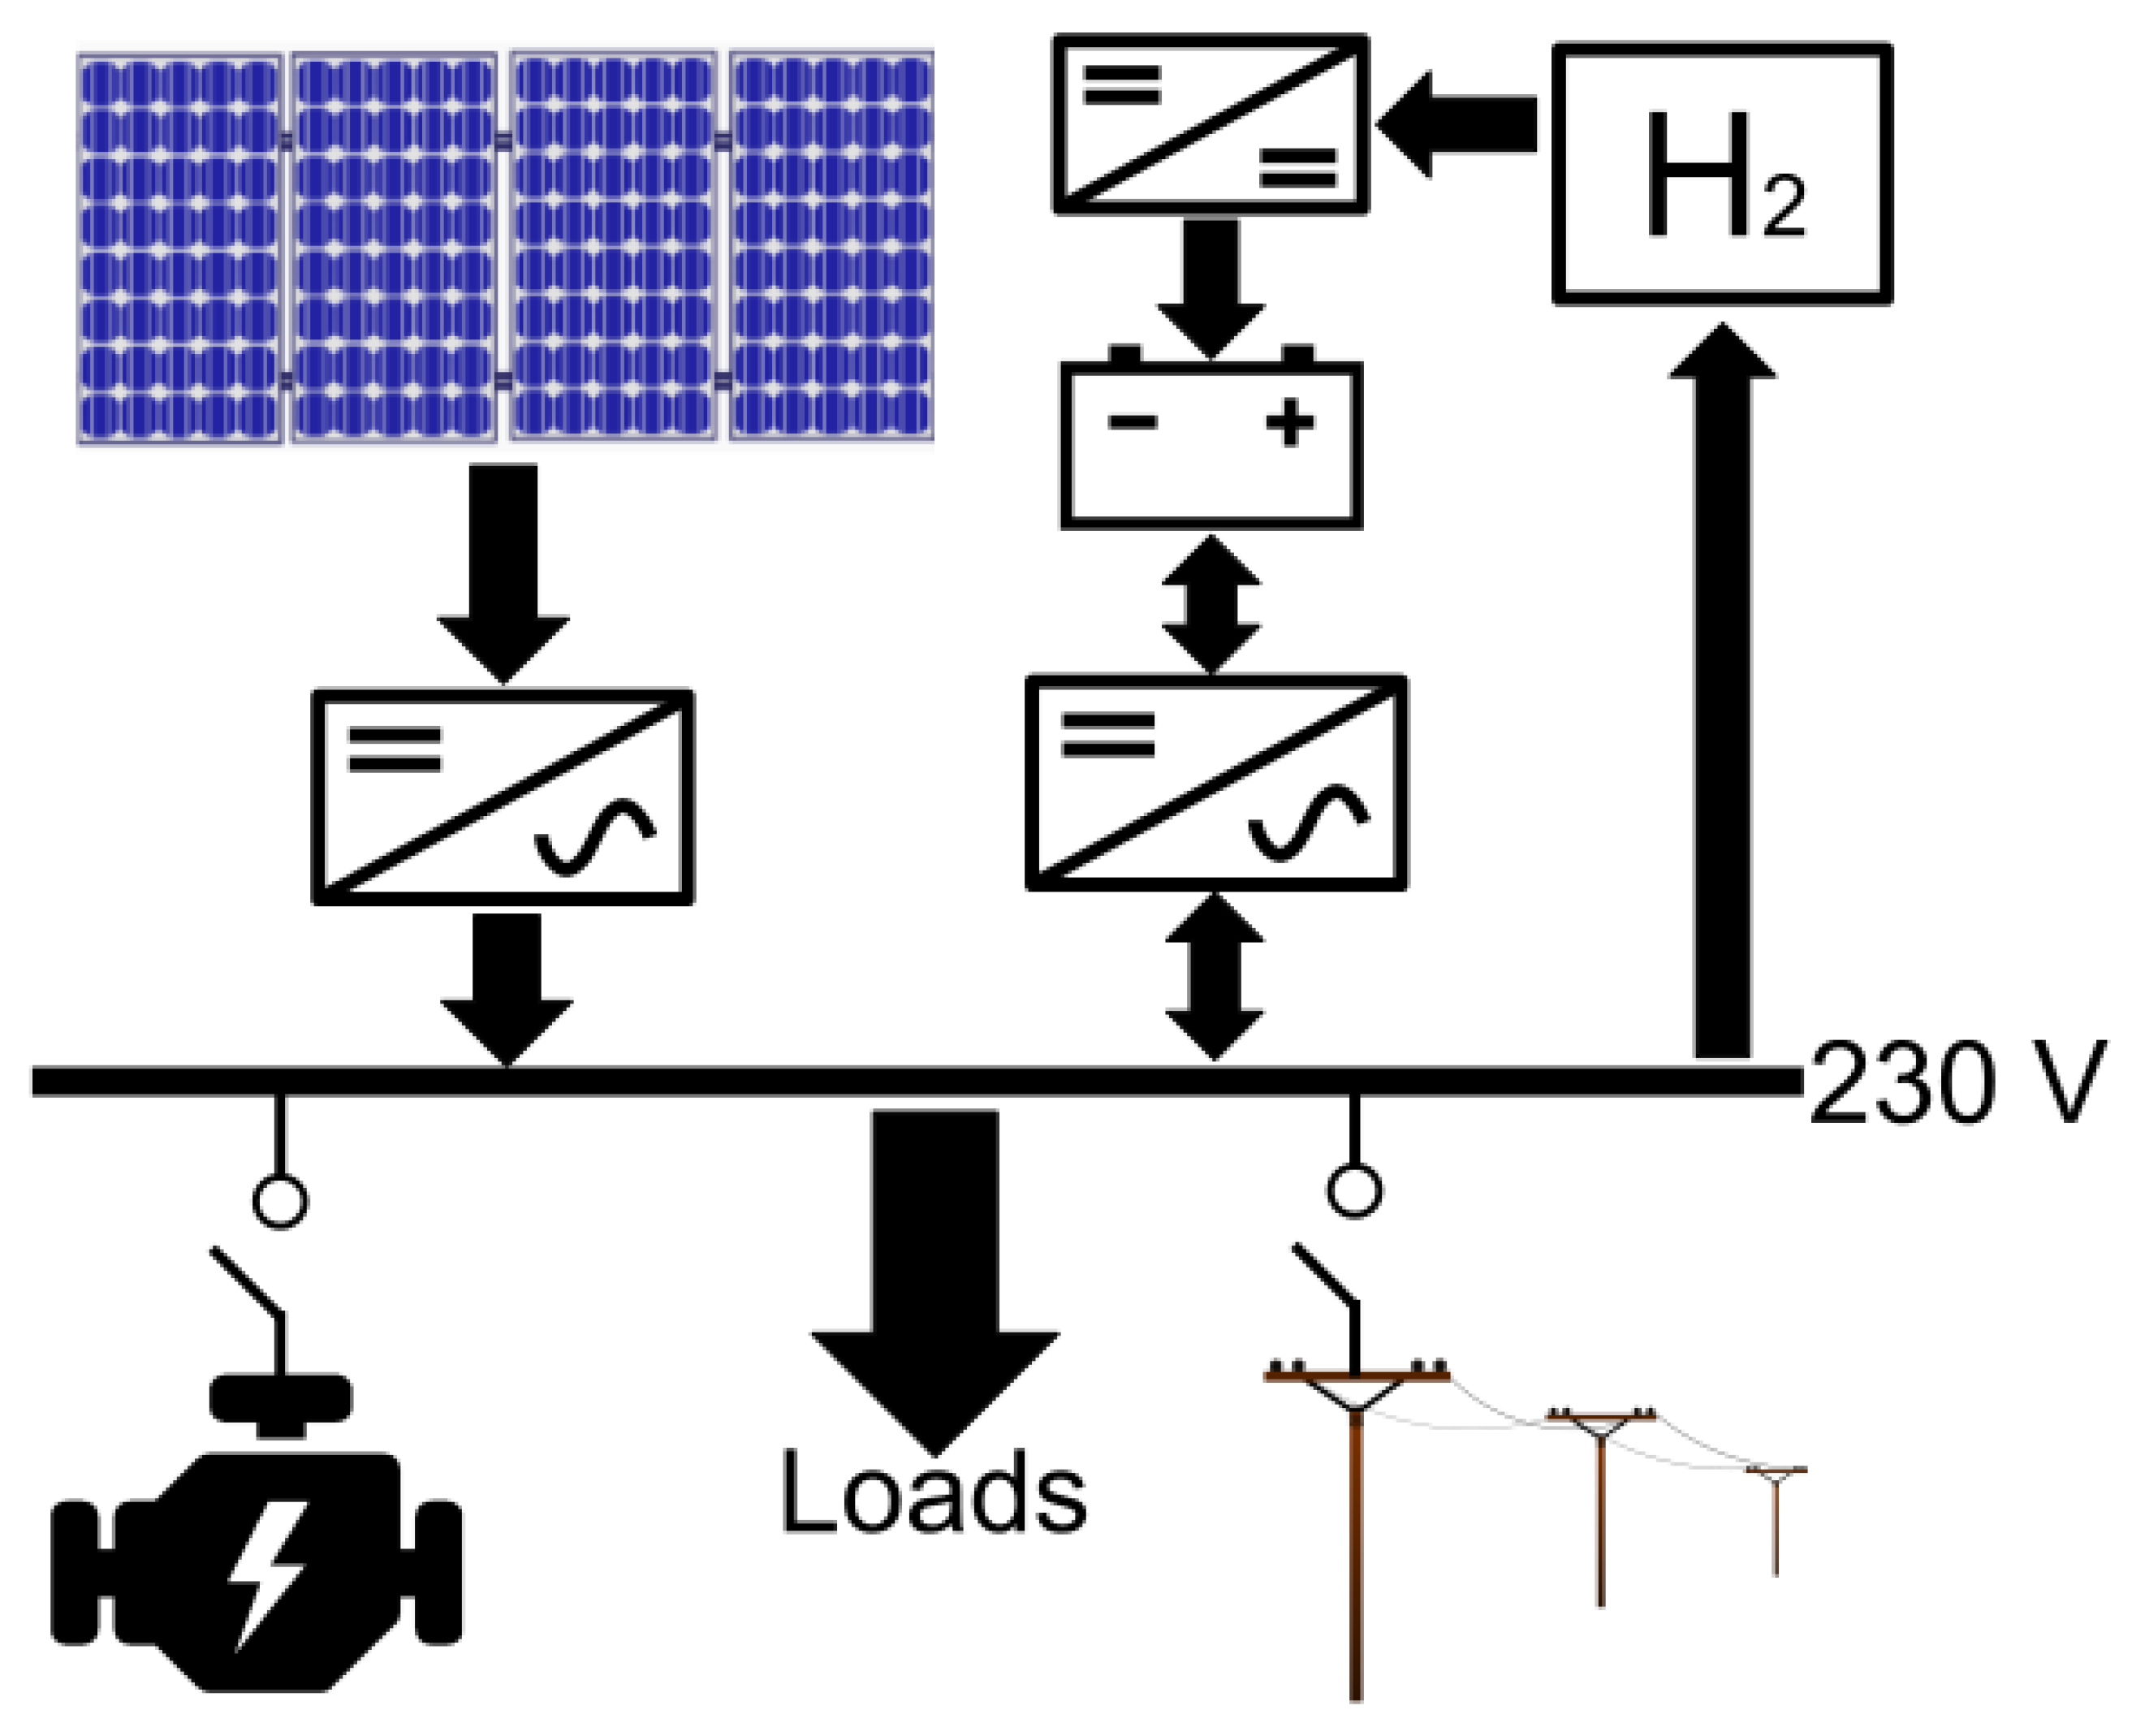
The nanogrid where the measurements have been collected is located in the southern part of Sweden. It has a 20 kWp photovoltaic installation on the roof and a 2.6 kWp photovoltaic installation on the facade. The nanogrid has a 144 kWh lead acid battery and 1100 kWh hydrogen storage. The operating topology is a 3-phase 50 Hz system with 230 V RMS phase-to-neutral voltage. The solar-battery-hydrogen system is intended to be the primary energy system where a backup 15 kVA diesel generator is intended to be the secondary energy system that starts if the primary energy system fails. If the failure is prolonged or if the diesel generator does not start, the nanogrid will then connect to the low voltage utility grid. One example of when the nanogrid connects to the utility grid is if the available energy in the primary and secondary energy system is not sufficient to supply the consumption. The basic energy system overview for the nanogrid can be seen in
Figure 1.
During island operation, the nanogrid is operated by nine different inverters, two SMA Solar Technology Sunny Tripower inverters are used for two separate 10 kWp photovoltaic installations on the roof, one SMA Sunny Boy inverter is used for a 2.6 kWp photovoltaic installations on the facade and six SMA Sunny Island inverters are used for control of the battery charging and discharging. One of the SMA Sunny Island inverters also controls the electrolysis of water for the production of hydrogen and the hydrogen fuel cell to convert hydrogen to electricity. The consumption in the house consists of normal household appliances, a 3-phase heat pump, two electric cars and the electrolyzer to produce hydrogen.
By using the battery and hydrogen storage, a certain amount of the produced solar power is lost due to the conversion losses. However, some of the conversion losses are used to heat the house during the winter. The diesel generator operated for 43 h in the measured 48 weeks of islanded operation and delivered 473 kWh to the loads in the nanogrid. The yearly electricity consumption for the house is around 17,000 kWh and 4000 kWh for the two electric cars. For more information regarding the nanogrid see [
9].
1.2. Frequency Control in the Nanogrid
The frequency in the nanogrid is controlled by the SMA Sunny Island inverters which uses frequency-shift power control (FSPC) [
10] and SMA Automatic Frequency Adjustment (AFA) [
11]. The FSPC is used to keep the balance between load and generation. During sunny days with not enough consumption, the FSPC increases the frequency to above 51 Hz to signal the SMA Tripower solar inverters that production should be curtailed. The amount of curtailment increases linearly between 51 and 52 Hz from 0 to 100%. The FSPC uses the battery voltage to determine the appropriate frequency in the islanded nanogrid depending on the amount of load that is present.
Another feature of the FSPC is the shutdown of the solar inverters by increasing the frequency towards 55 Hz. This is done in order for the Sunny Island inverters to synchronize to an external source, which for this nanogrid is the utility grid. The AFA compensates for the over frequency by temporarily shifting the frequency to 49 Hz to enable clocks to run at the correct time. This correction occurs on a 12 h basis [
11].
2. Results
2.1. Frequency Variations during Island Operation
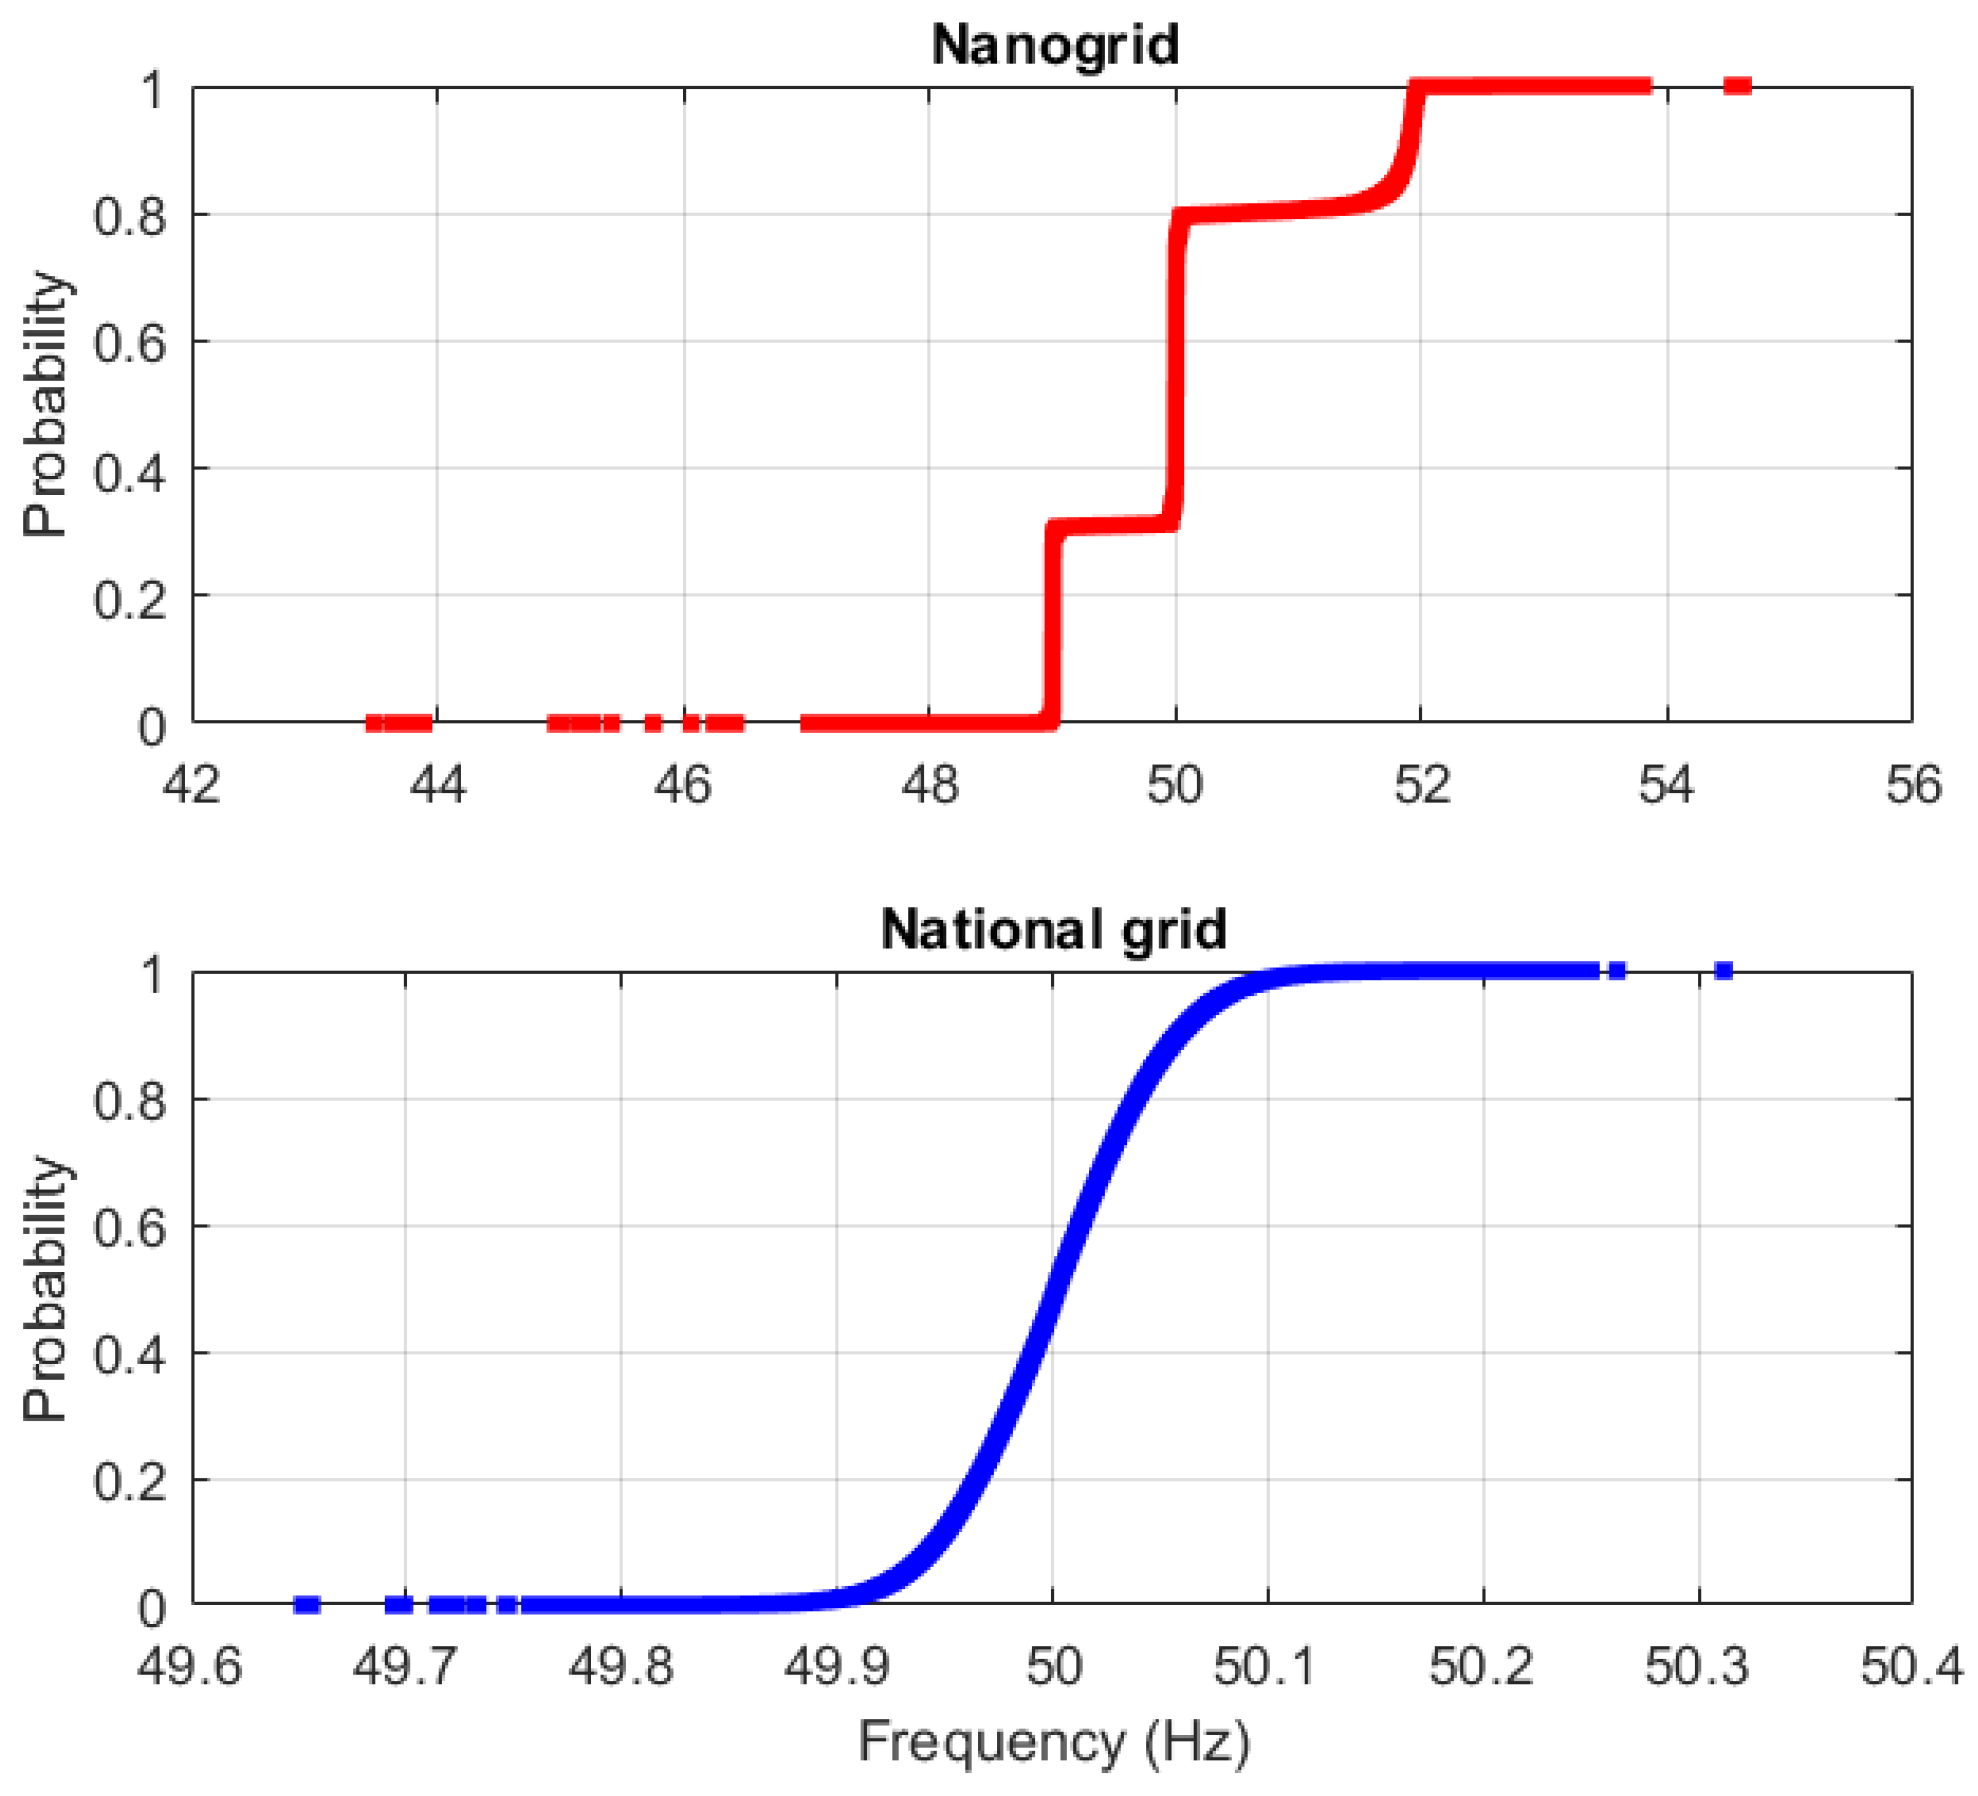
The 10 s average values of the frequency for the 48 weeks when the nanogrid operated in islanded operation was used to create an empirical cumulative distribution function. The results are shown in the top part of
Figure 2. For 19.5% of the 48 week period, the nanogrid is not utilizing the entire solar power production and the FSPC decreases power output. In the figure, this is when the frequency exceeds 51 Hz. The 49 Hz frequency value that stands for about 30.7% of the 48 week period is caused by the AFA compensating for the over frequency. The Cumulative Distribution Function (CDF) for 54 weeks of 10 s average frequency measurements when the nanogrid was in grid-connected operation mode is presented in the lower part of
Figure 2 for a comparison with the nanogrid islanded operation.
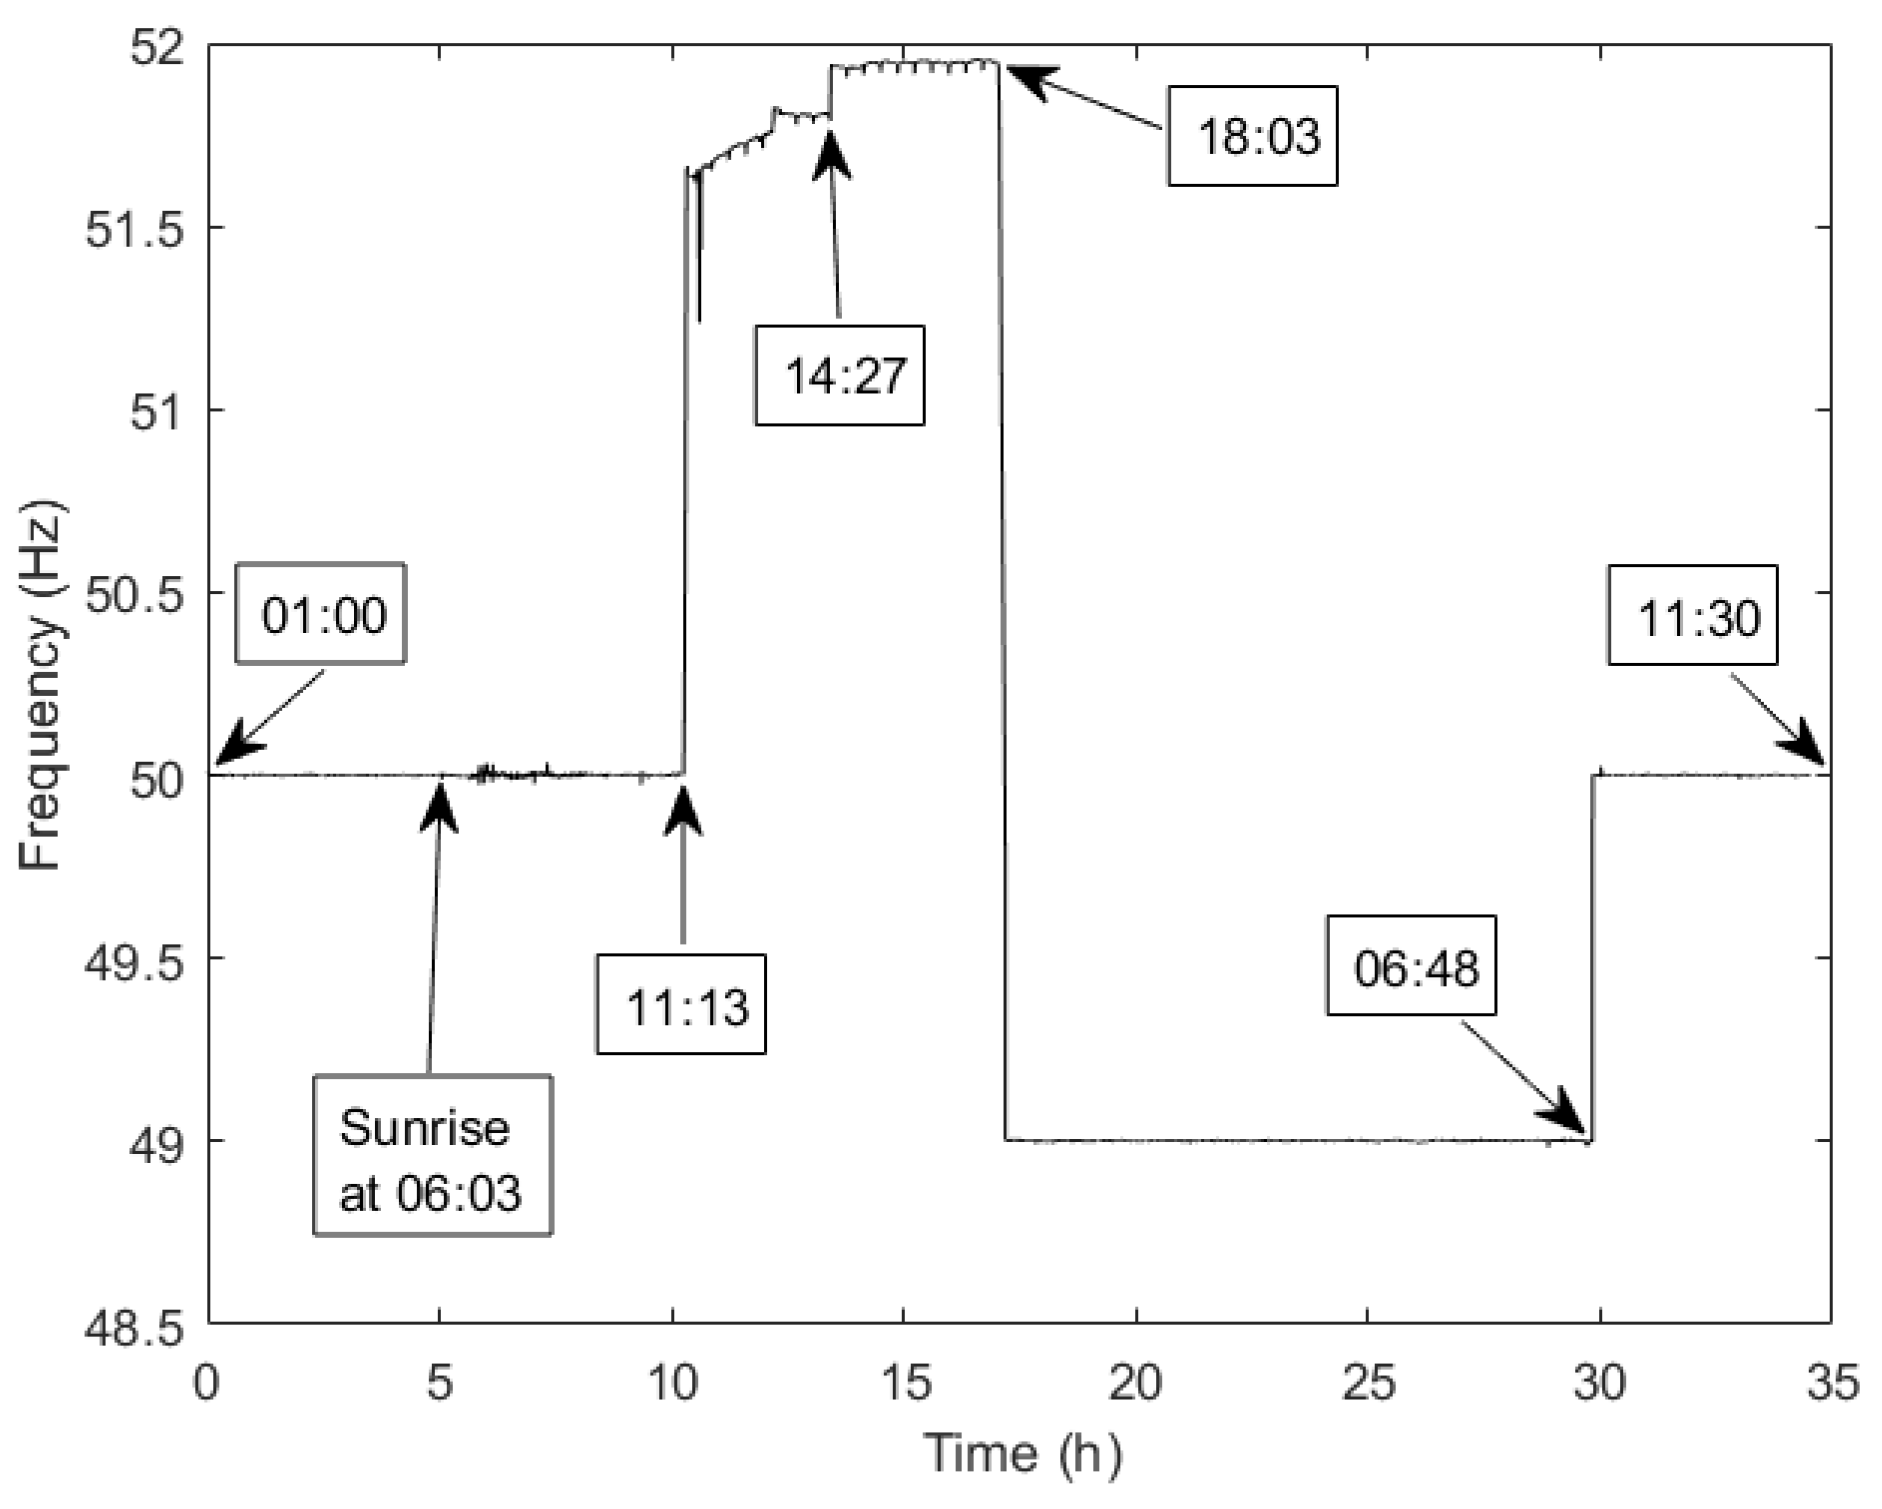
One typical frequency regulation scenario is when there is not enough consumption (including battery charging and electrolysis of water) during the day when the solar PV installation is producing power. When this happens, the FSPC increases the frequency above 51 Hz to curtail the production. During the night the AFA shifts the frequency to a lower value than 50 Hz in order to compensate the time increase for clocks. One example of this scenario can be observed in
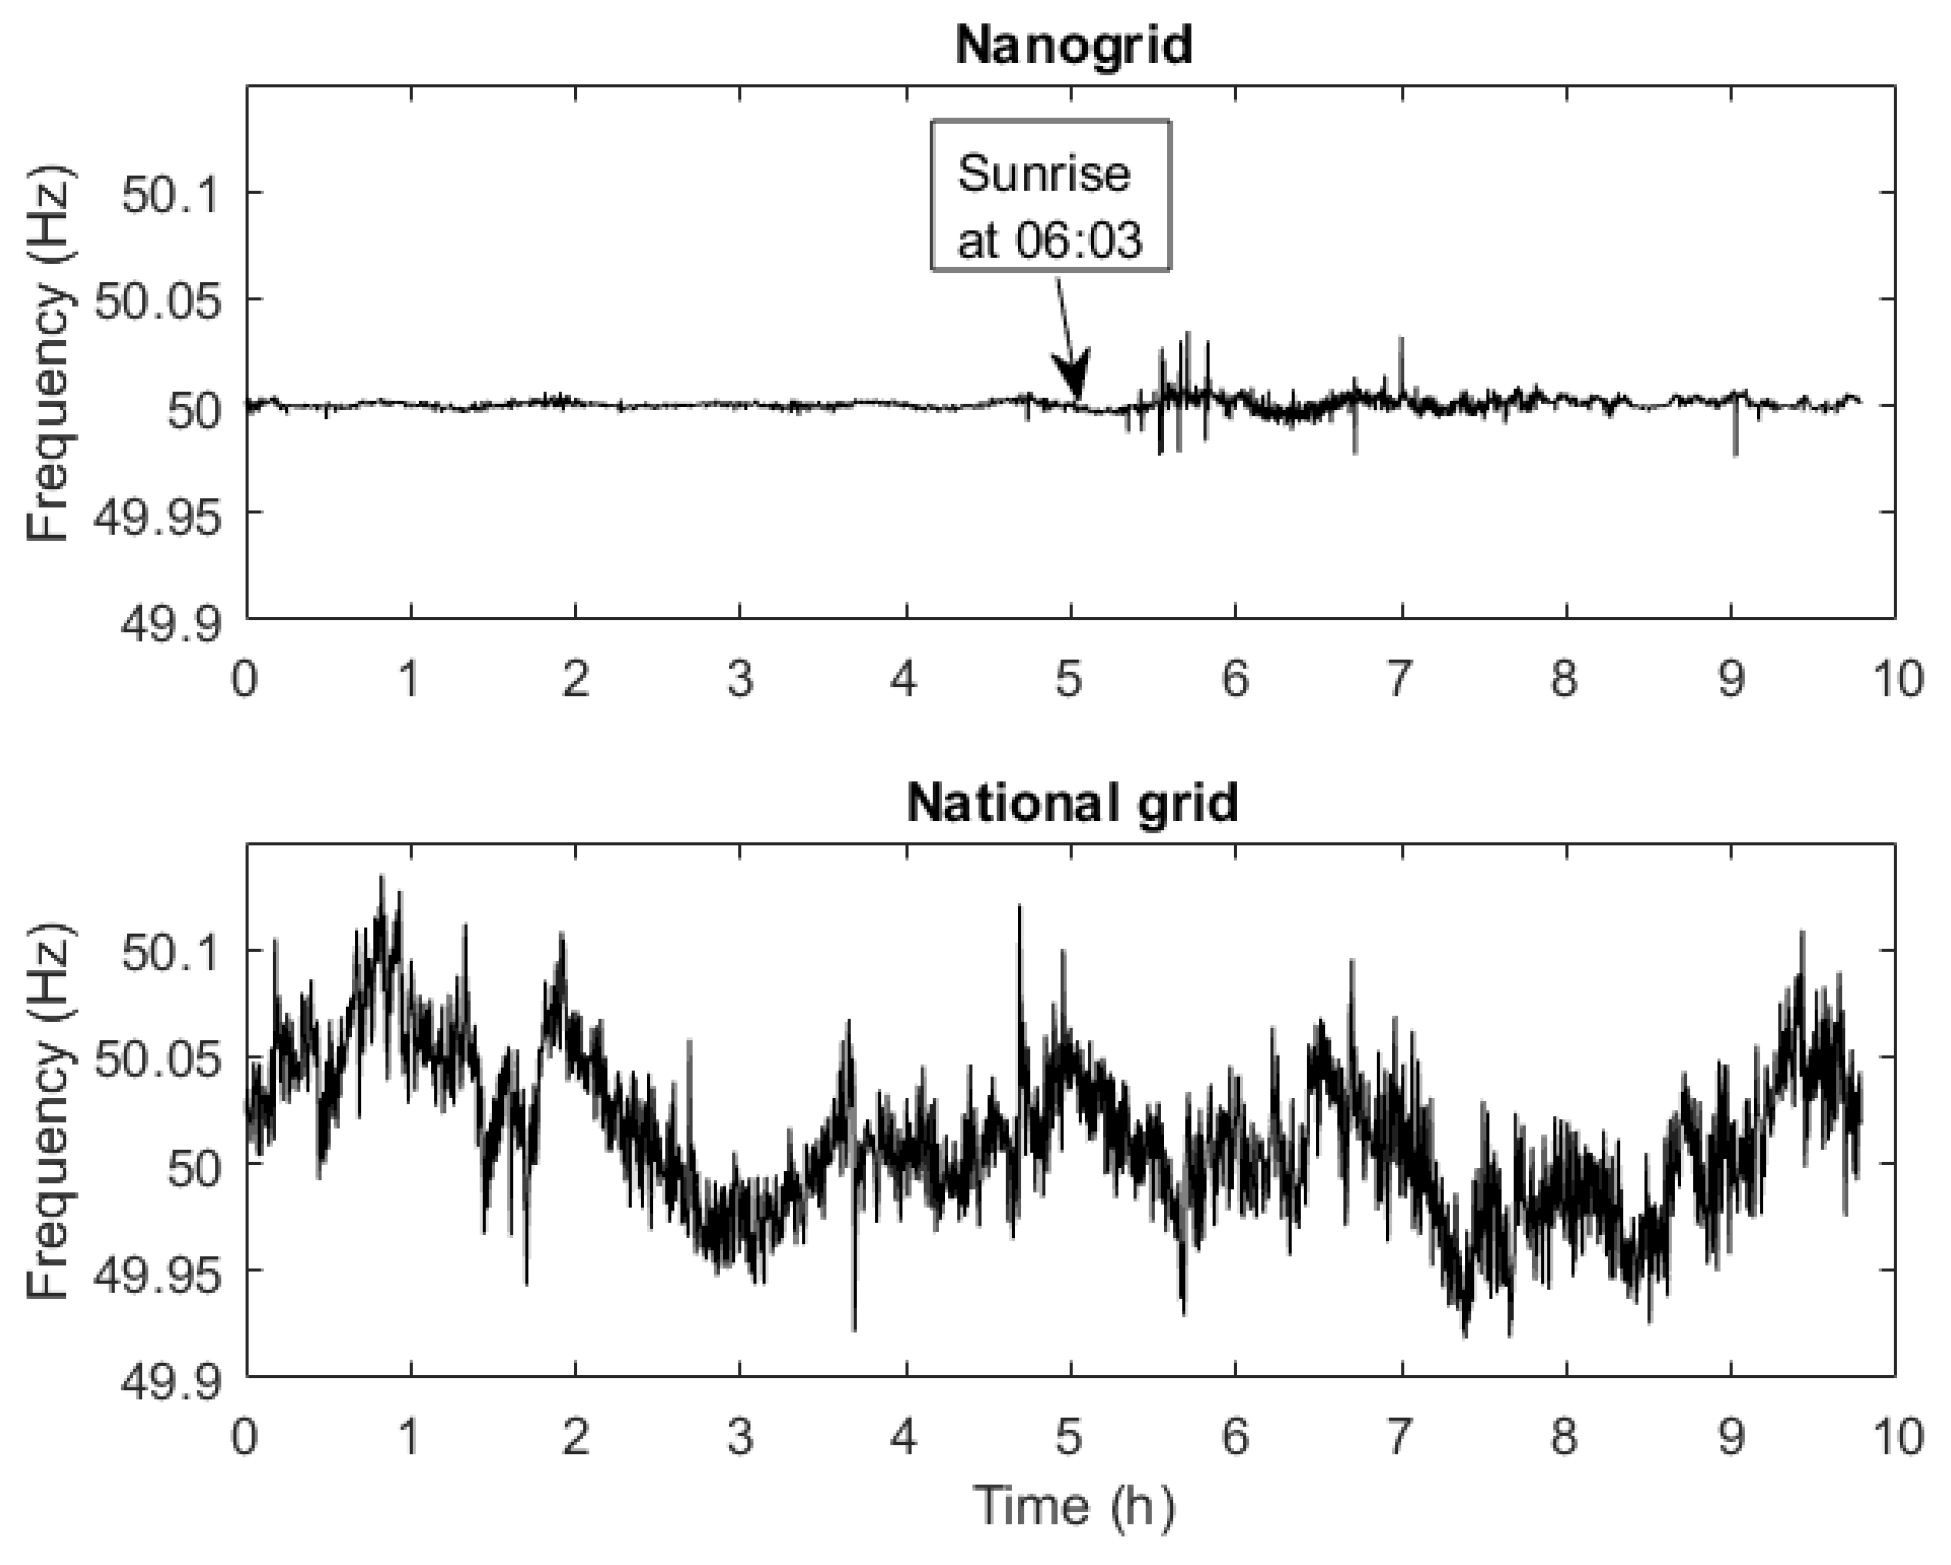
Figure 3 where the 10 s average frequency is plotted for a 34.5 h period. The plot starts at 01:00 the 15th of April 2017 and ends the 16th of April 2017 at 11:30. At the 15th between 01:00 and about 06:03 at sunrise, there is insufficient solar production and the load is drawing power from the battery storage and therefore the load is matched to the source giving a frequency value near 50 Hz. Between 06:03 and 11:13 the solar production together with the battery storage is matched to the load which gives a frequency value near 50 Hz, but with some variations that can be observed more clearly in the top part of
Figure 4. From 11:13 to 18:03 the FSPC curtails the solar production in order to match to the load. The regulation starts at 11:13 at about 60% curtailment and increases to around 90% at 14:27. Between 18:03 the 15th April and 06:48 the 16th April the load is served mainly by the battery but since there has been a substantial amount of over frequency during the day, the AFA compensates for the over frequency by operating the nanogrid at 49 Hz. Between 06:48 and 11:30 the 16th the load is served by the solar generation and battery storage, since the generation is matched by the load the frequency value is 50 Hz.
When the source is matched to the load, the frequency is much closer to 50 Hz than in the Swedish national grid. This can be observed in
Figure 4 where the top part of the plot shows a zoomed in view of
Figure 3. It can be seen that the frequency starts to vary more just after sunrise when the solar production starts to increase. The total load in the nanogrid is varying between 0.7 to 5.4 kW in the duration shown in
Figure 4.
2.2. Minimum and Maximum Values Observed
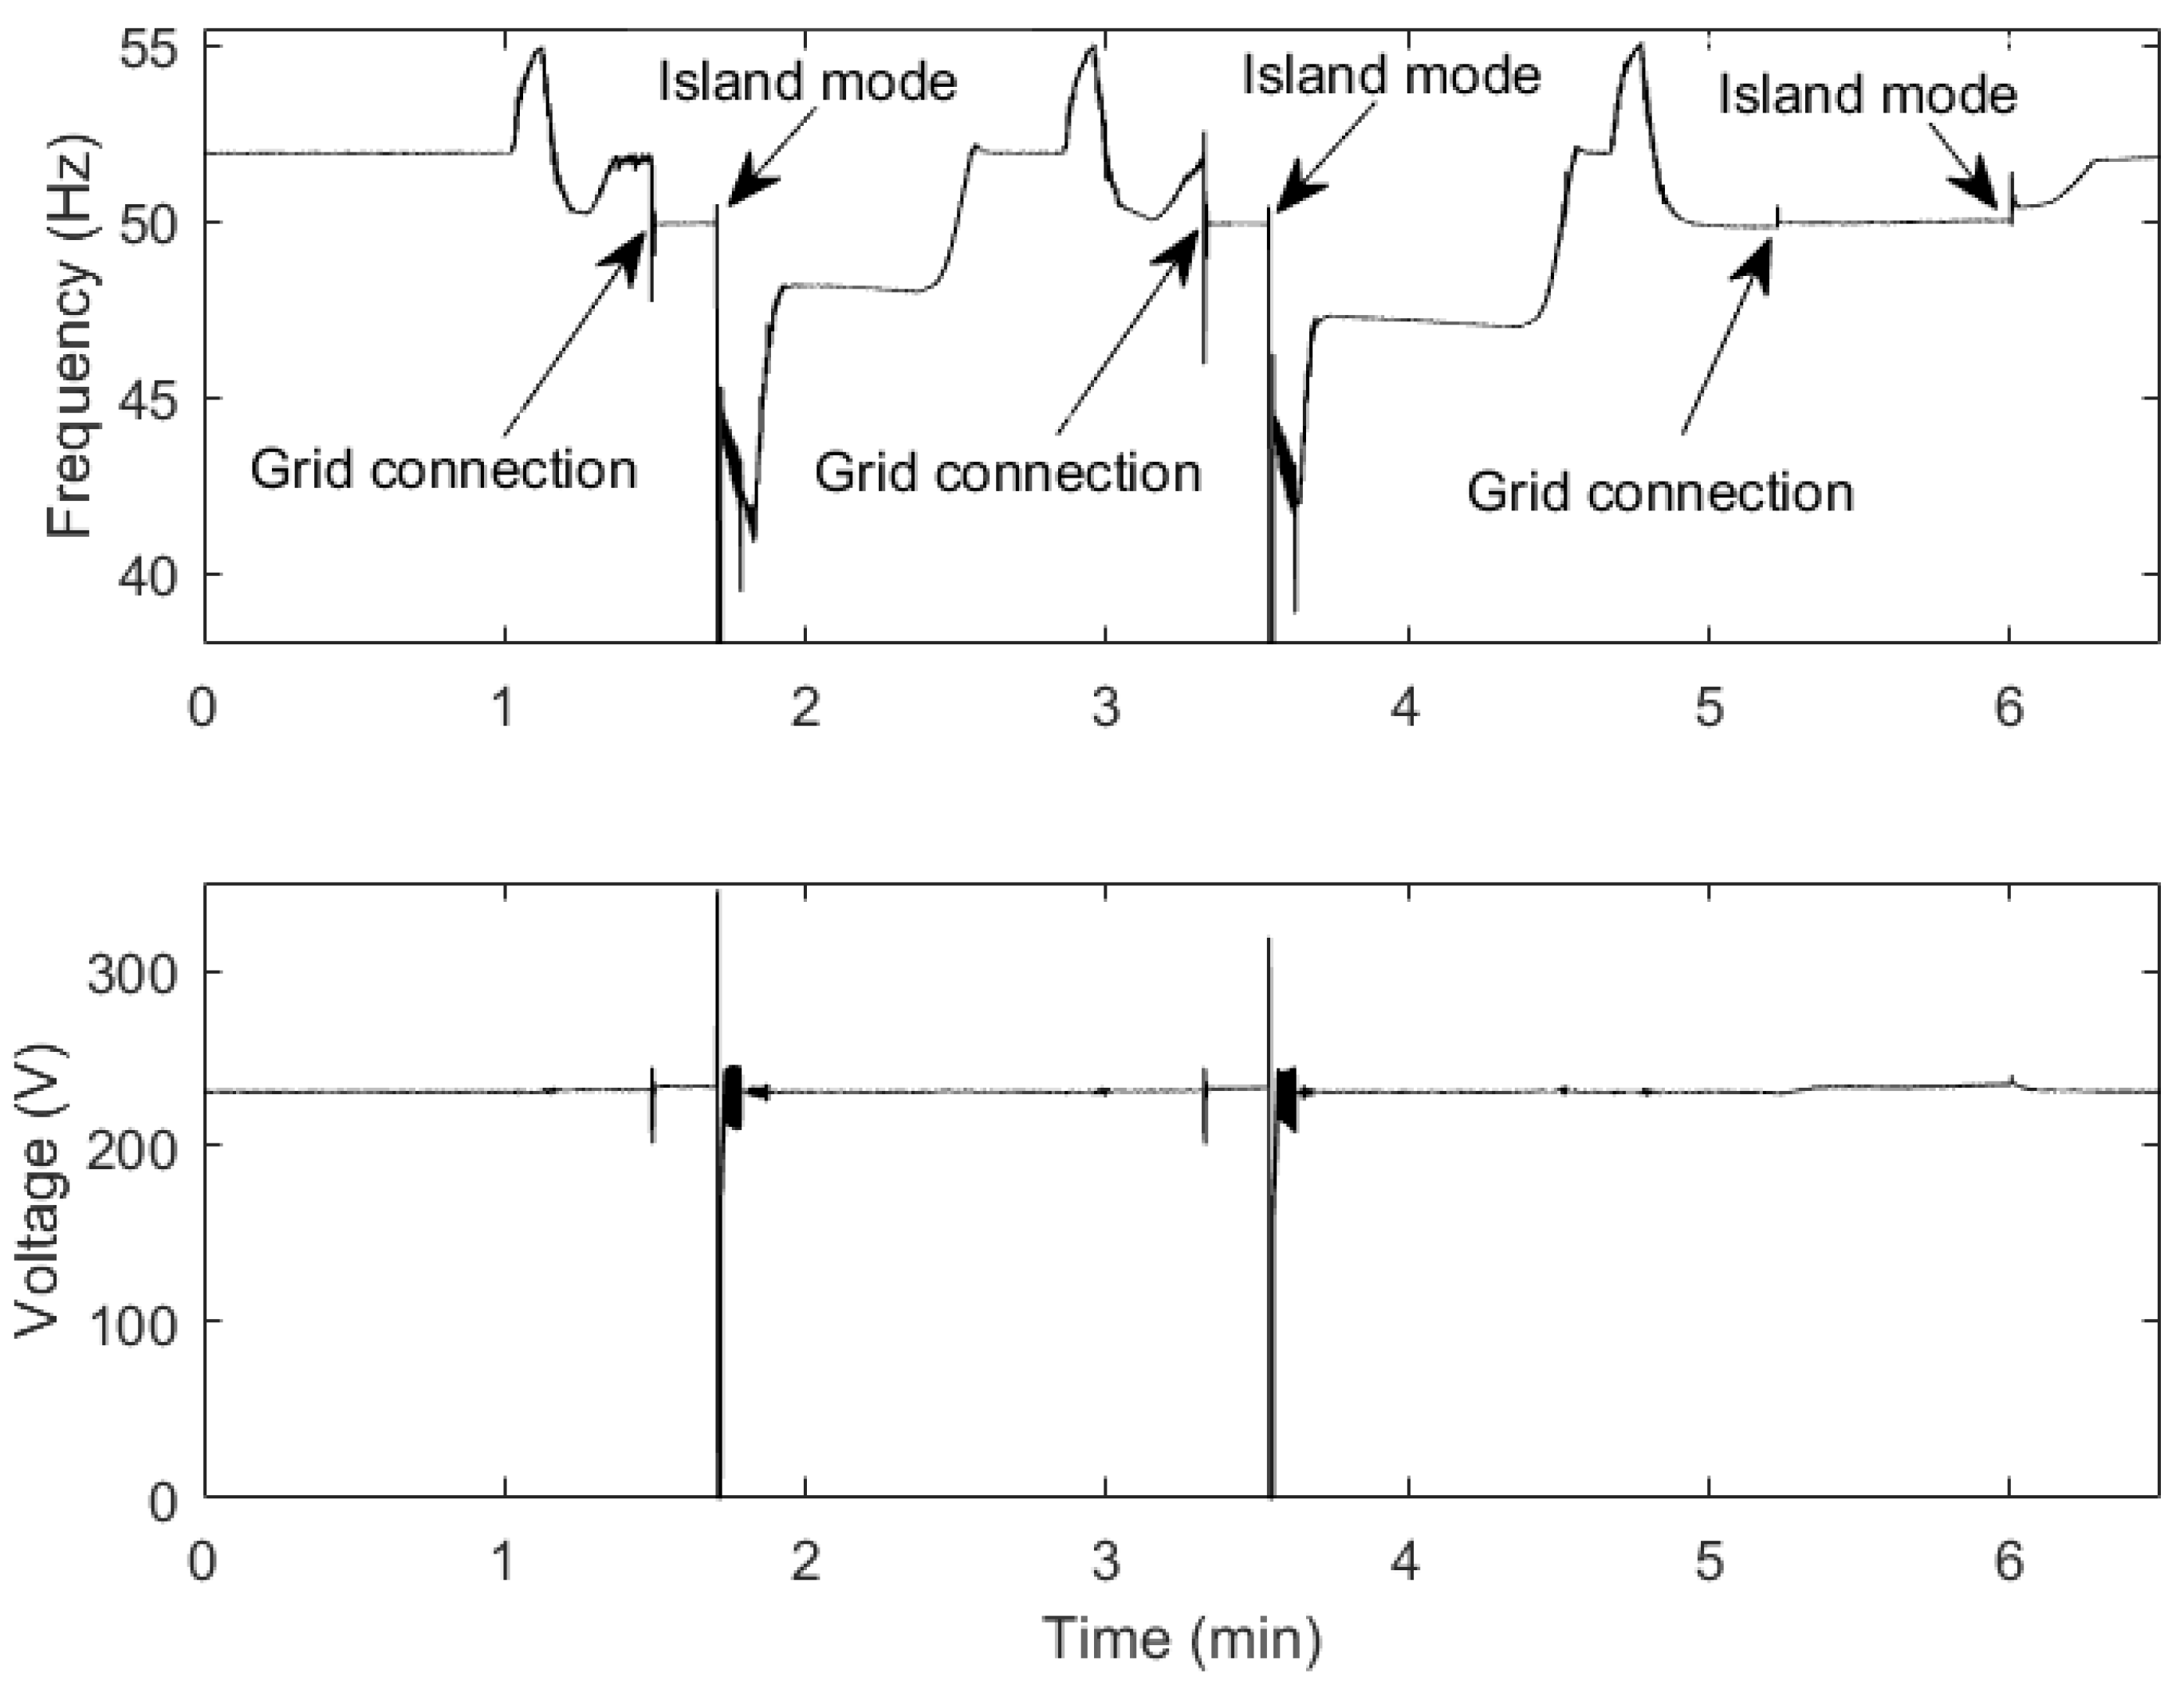
The highest frequency values of 55 Hz occur when there is not enough loads to consume the entire production from the PV installation. This happens when the batteries are fully charged, the hydrogen tank is full and the consumption in the house is low. An example of this can be observed in the top part of
Figure 5. The plot starts at 08:00 and ends at 19:00 the 25th September 2016. For this occasion, the majority of the 55 Hz values occur approximately every 23 min.
When the frequency reaches about 55 Hz the nanogrid connects to the utility grid for about 10 to 50 s after which the Sunny Island inverters switch back to island operation. Occasionally, the transition causes a short interruption, in this case at h 2:40 (10:40 real time) and 6:30 (14:30 real time) in
Figure 5. For the most part, these transitions only cause a rise in the phase-to-neutral voltage of a few volts for the duration of the grid connection which can be seen in the lower part of
Figure 5.
Examples of the lowest frequency values that occurred can be seen in the top part of
Figure 6. The lowest frequency values occur just after an interruption with duration of 0.9 s when the frequency reached 55 Hz about 10 to 50 s earlier. At this occasion, the intended grid connection failed and the nanogrid experienced an interruption.
After the short interruption, the Sunny Island inverters power up again in islanded operation with a frequency that starts at a value of about 44 Hz that shortly decreases towards 41 to 42 Hz which could then drop below 40 Hz for a one or two cycles. The frequency then gradually increases towards 49 Hz and then increase towards 52 Hz.
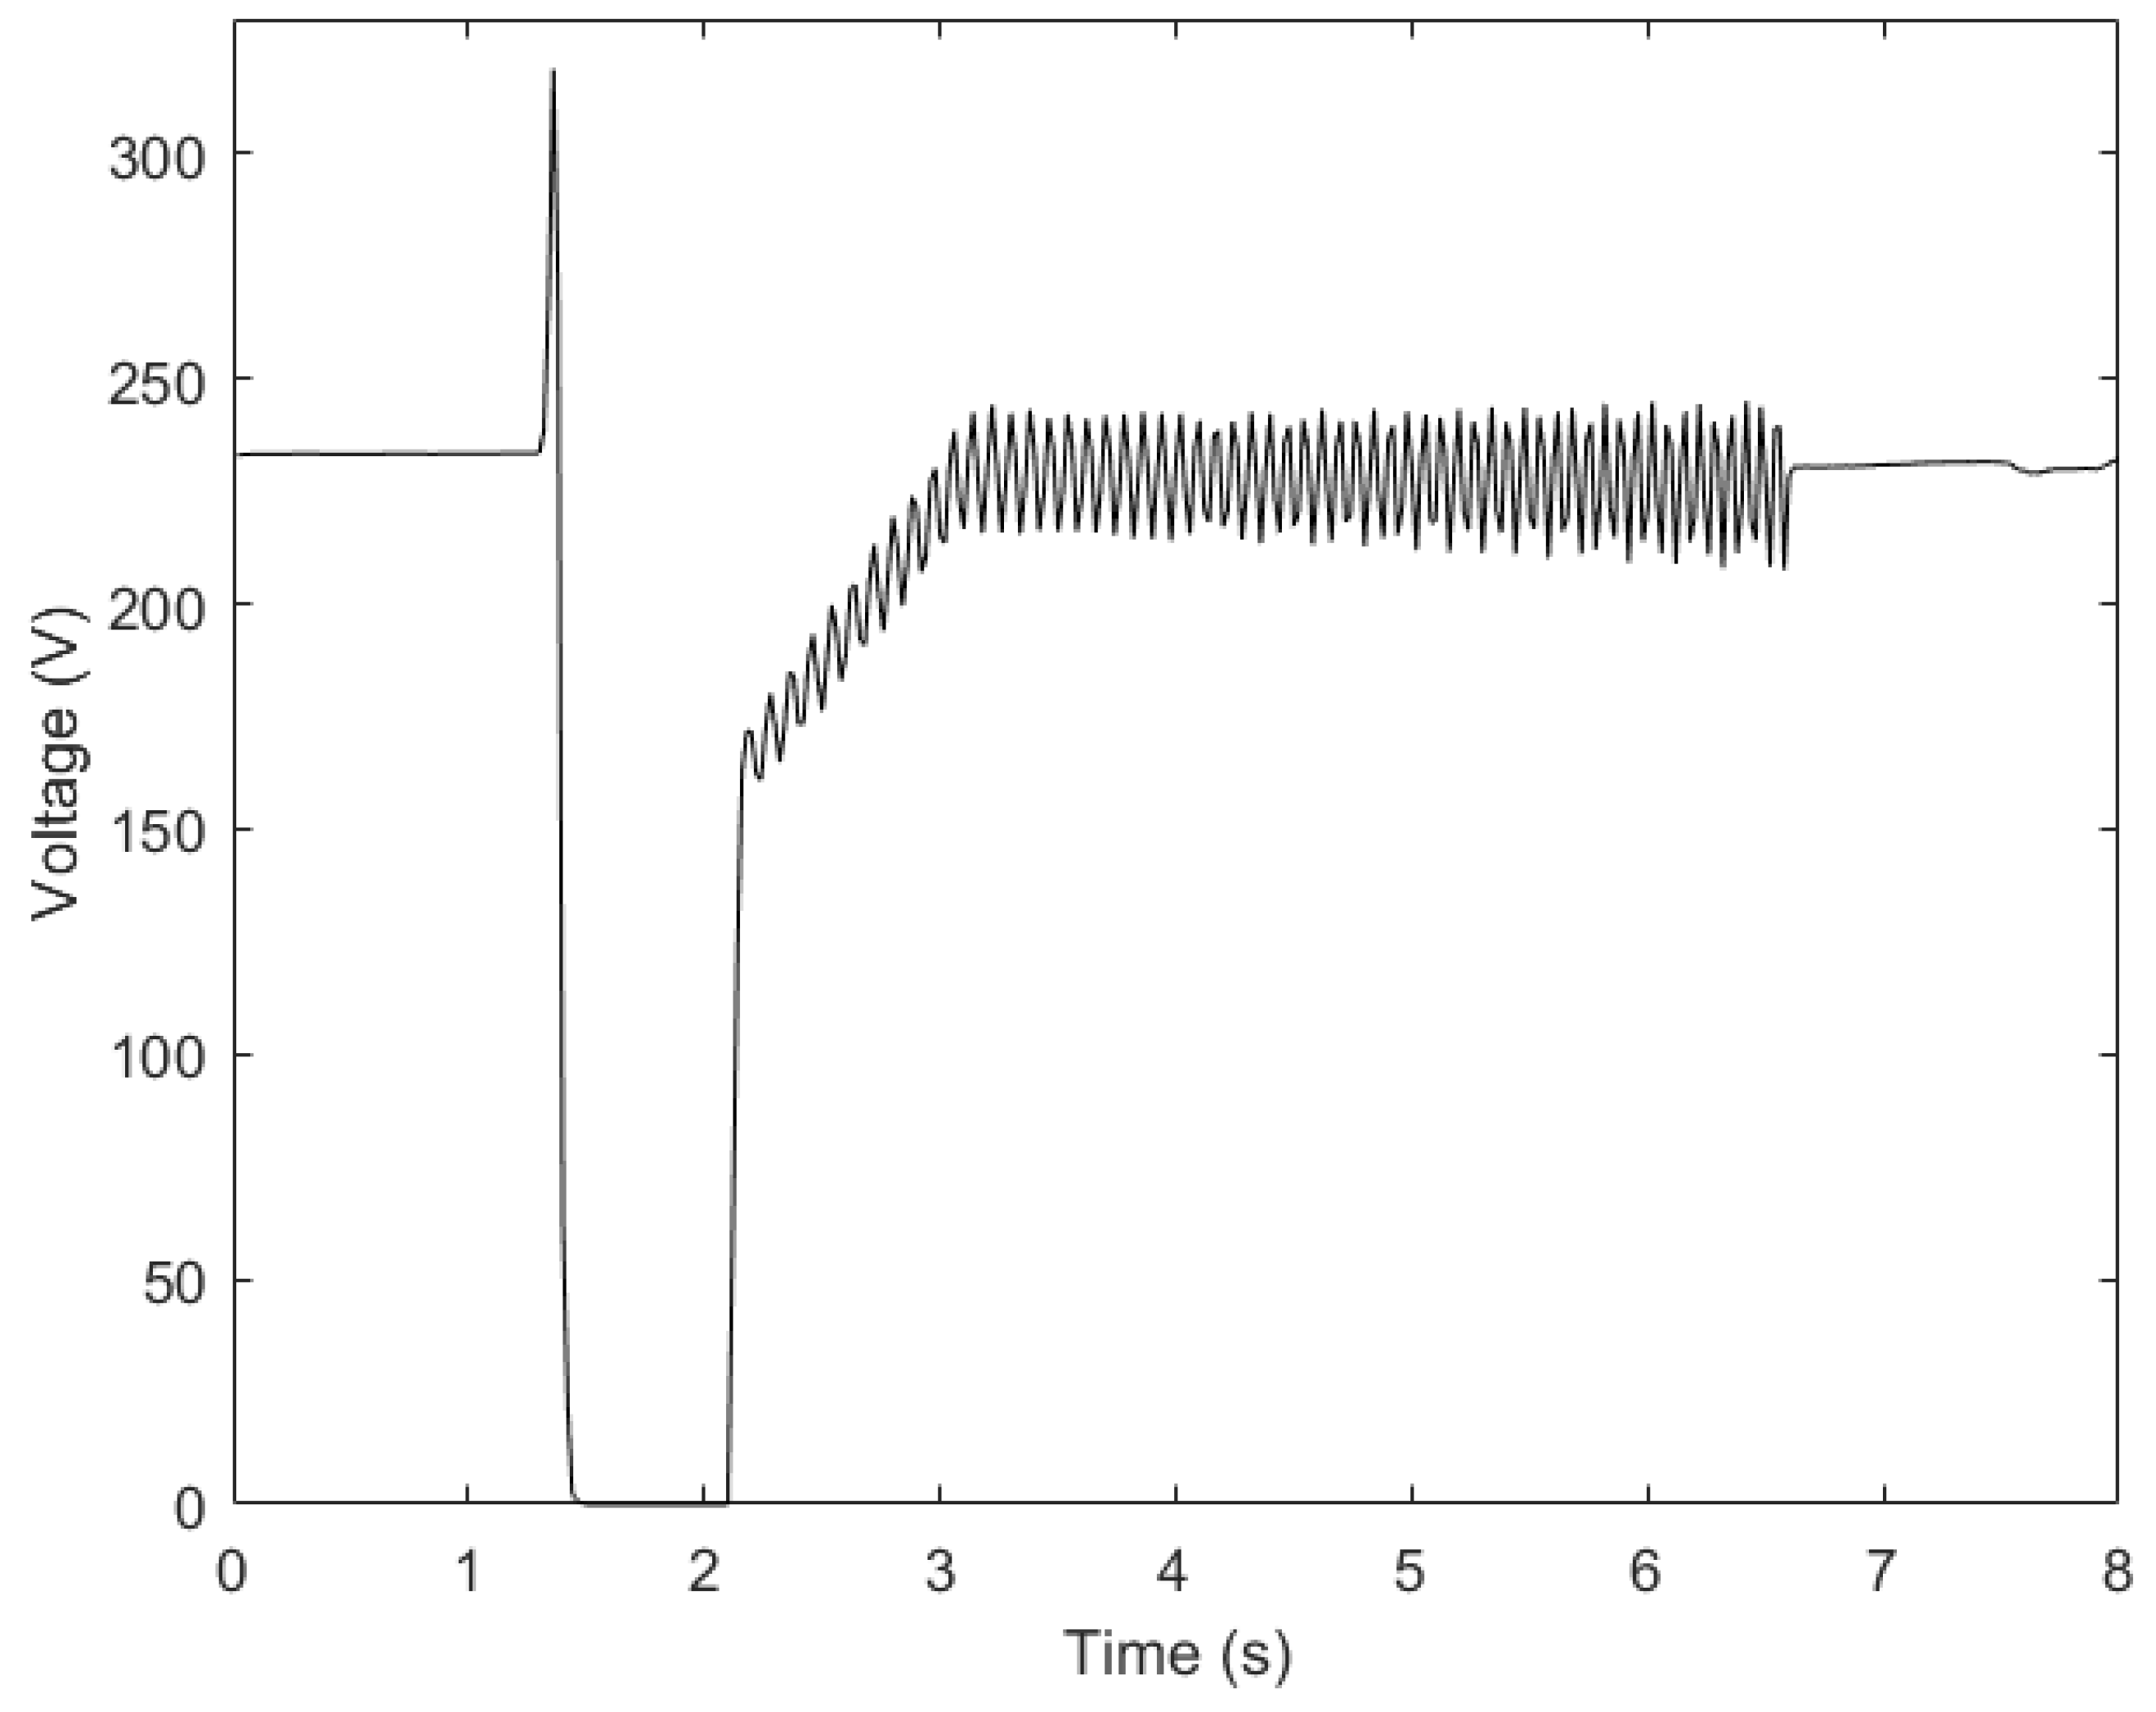
One of the phase-to-neutral voltages before and after the two interruptions can be seen in the lower part of
Figure 6 where the left interruption is seen more clearly in
Figure 7. During 4 s after the voltage recovers from the interruption, the RMS voltage fluctuates with a peak to peak magnitude of 15.2 to 35.5 V RMS at a frequency of about 12.5 to 16.7 Hz. This frequency range is in the 3 to 33 Hz span in which the eye is most sensitive to flicker [
12]. This voltage fluctuation range and frequency will cause flickering of incandescent lamps. However, in this nanogrid only LED lamps are used which could be more or less sensitive to the voltage variation magnitude and frequency in terms of flicker output [
13]. The largest and lowest 1 s average frequency value in the 48 week measurements when the nanogrid operated in islanded operation were 55.2 Hz and 41.3 Hz, respectively.
2.3. Comparison to Standards
According to European Standard EN 50160, the 10 s average frequency should remain between 49 and 51 Hz for 95% of one week and should remain between 42.5 and 57.5 Hz for 100% of the time for systems without synchronous connection to an interconnected system. The 95% confidence interval for the islanded operation CDF in
Figure 2 spans 48.99 to 51.95 Hz. The lowest 10 s average value was 43.48 Hz and the highest was 54.61 Hz.
The grid connected frequency values in
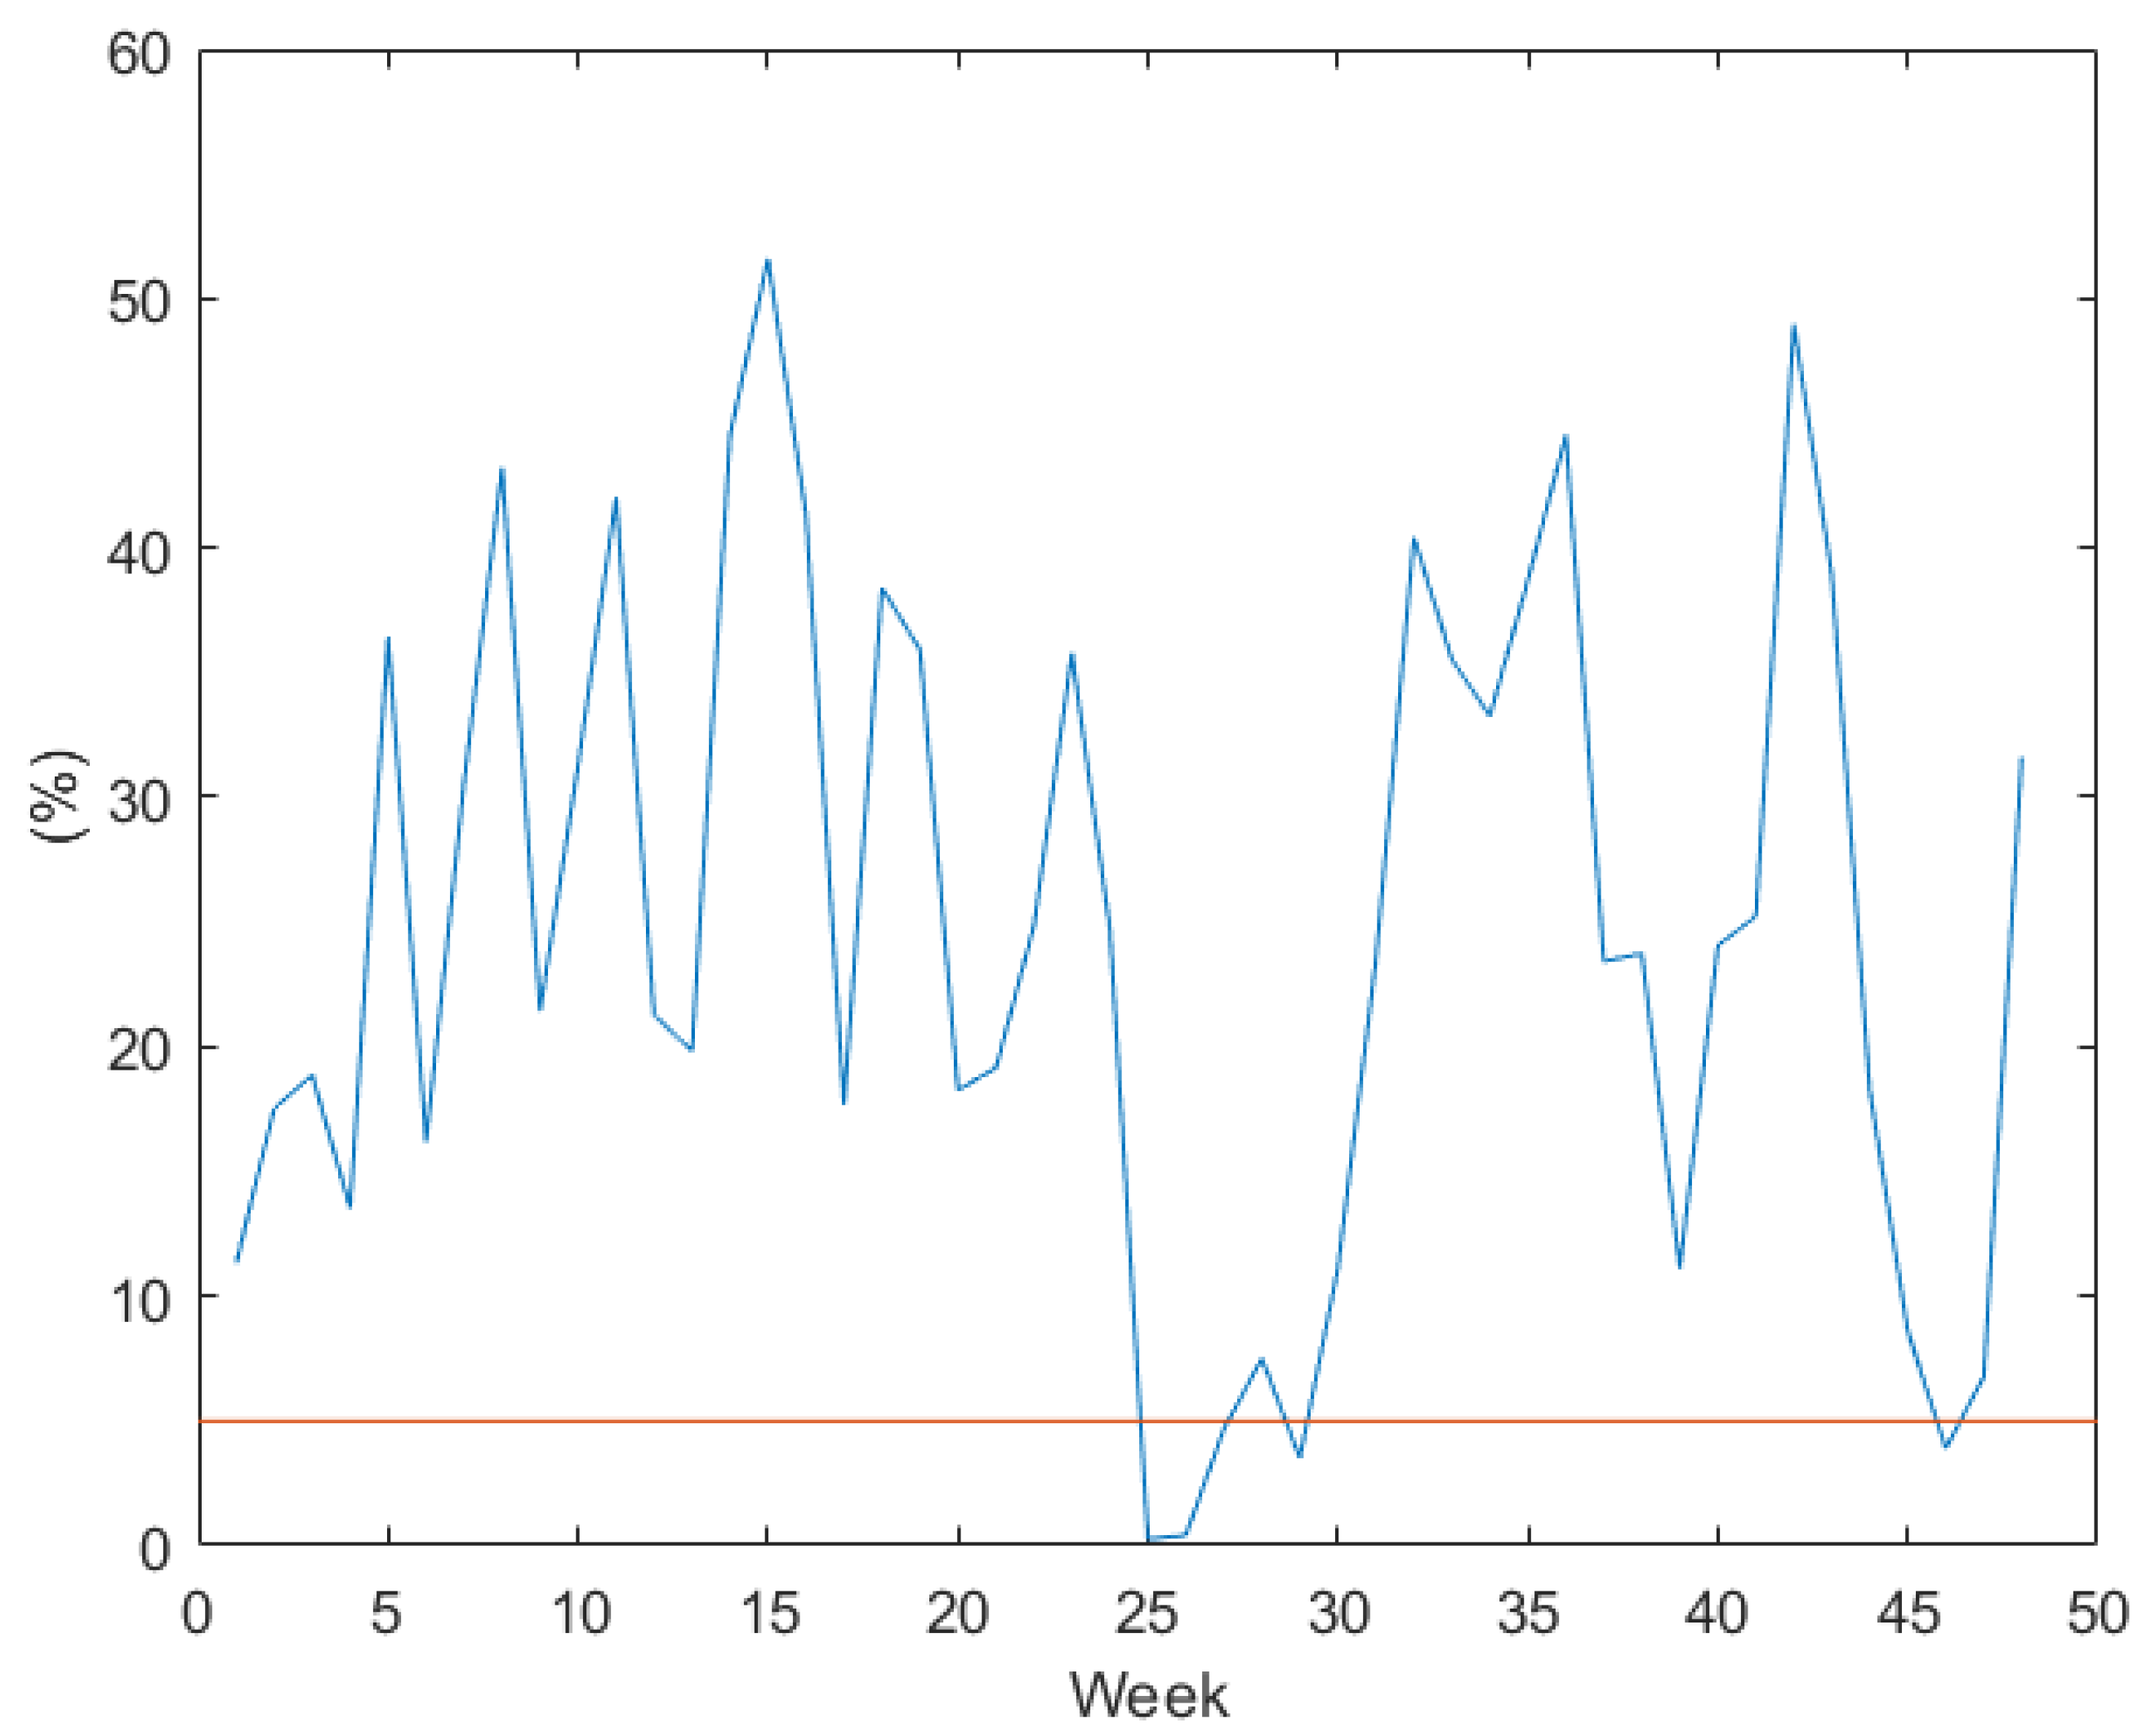
Figure 2 always remain within the specified frequency range for interconnected systems, according to EN 50160. The islanded operation data divided into weekly sections is shown in
Figure 8 where the vertical axis is the amount of 10 s average values outside of the range 49 to 51 Hz every week.
The islanded operation data is an assembly of long and short periods of time where the nanogrid is operating in islanded operation. This means that not all of the measurements are continuous and therefore
Figure 8 does not have a definitive correlation with the seasons of the year. The straight line in
Figure 8 is the 5% weekly limit of allowed values that can exceed the range 49 to 51 Hz.
In total, 89.6% of the 48 week measurements do not fall in the range that EN 50160 has set for systems without synchronous connection to an interconnected system. However, all the 10 s average frequency values remain within the maximum allowed variation set by EN 50160 for systems without synchronous connection to an interconnected system which is 42.5 to 57.5 Hz. The 95% confidence interval for the grid measurements in
Figure 2 spans 49.92 to 50.09 Hz. The nanogrid is within this range for 48.3% of the 48 week measurements. This means that one could expect almost half of the time to have the same frequency quality in the nanogrid as what is normally seen in the Swedish national grid.
If the nanogrid were to be located in the neighboring country Norway, the requirement in Annex EN 50160/A1 would apply. This document states that for systems without synchronous connection to an interconnected system, the frequency shall remain within 49 to 51 Hz for 100% of the time. With this requirement, the total probability of being outside the frequency range set by EN 50160/A1 is 25% of the 48 week period. The reason to why the EN 50160/A1 Standard has a larger acceptance number is due to the fact that the entire 48 week period is considered and not individual weeks. However, the maximum allowed variations from the rated frequency is surpassed in the EN 50160/A1 Standard, but not for the EN 50160 Standard. This is since the EN 50160 Standard allows a larger frequency span of 42.5 to 57.5 Hz while the EN 50160/A1 Standard allows a frequency of 49 to 51 Hz. However, any load connected would still see the same frequency variation, regardless of which standard would apply. A summary of
Section 2.3 can be seen in
Table 1.
3. Frequency Variations and their Effects on Equipment
In general, the frequency variations in a large interconnected grid are small, so the impact on different types of equipment is almost negligible [
14]. However, as seen in the previous sections, the frequency variations within an island-operated nanogrid are larger than in a large interconnected grid. The nanogrid in this case is a residential house and not an industrial facility that could need a precise frequency for the correct operation of the facility. The question arises of whether the frequency variations between about 41.3 and 55.2 Hz will have a large negative impact on household appliances. Universal motors that are used in for instance portable tools can be run on any input frequency and will therefore not be affected by the frequency variations [
15]. Induction motors that drive household equipment like refrigerators and heat pumps will run at different speeds depending on the frequency. A large increase in V/f ratio will cause saturation of the induction motor and therefore the induction motor could get overheated due to higher currents being drawn. IEC Standard 60034-1 [
5] defines two zones of operation for electrical AC motors. The first zone is Zone A in which the motor operation should not be affected by the variations in voltage and frequency except from a slight increase in operating temperature. The second zone is Zone B where operation should be avoided in occurrence, time and magnitude.
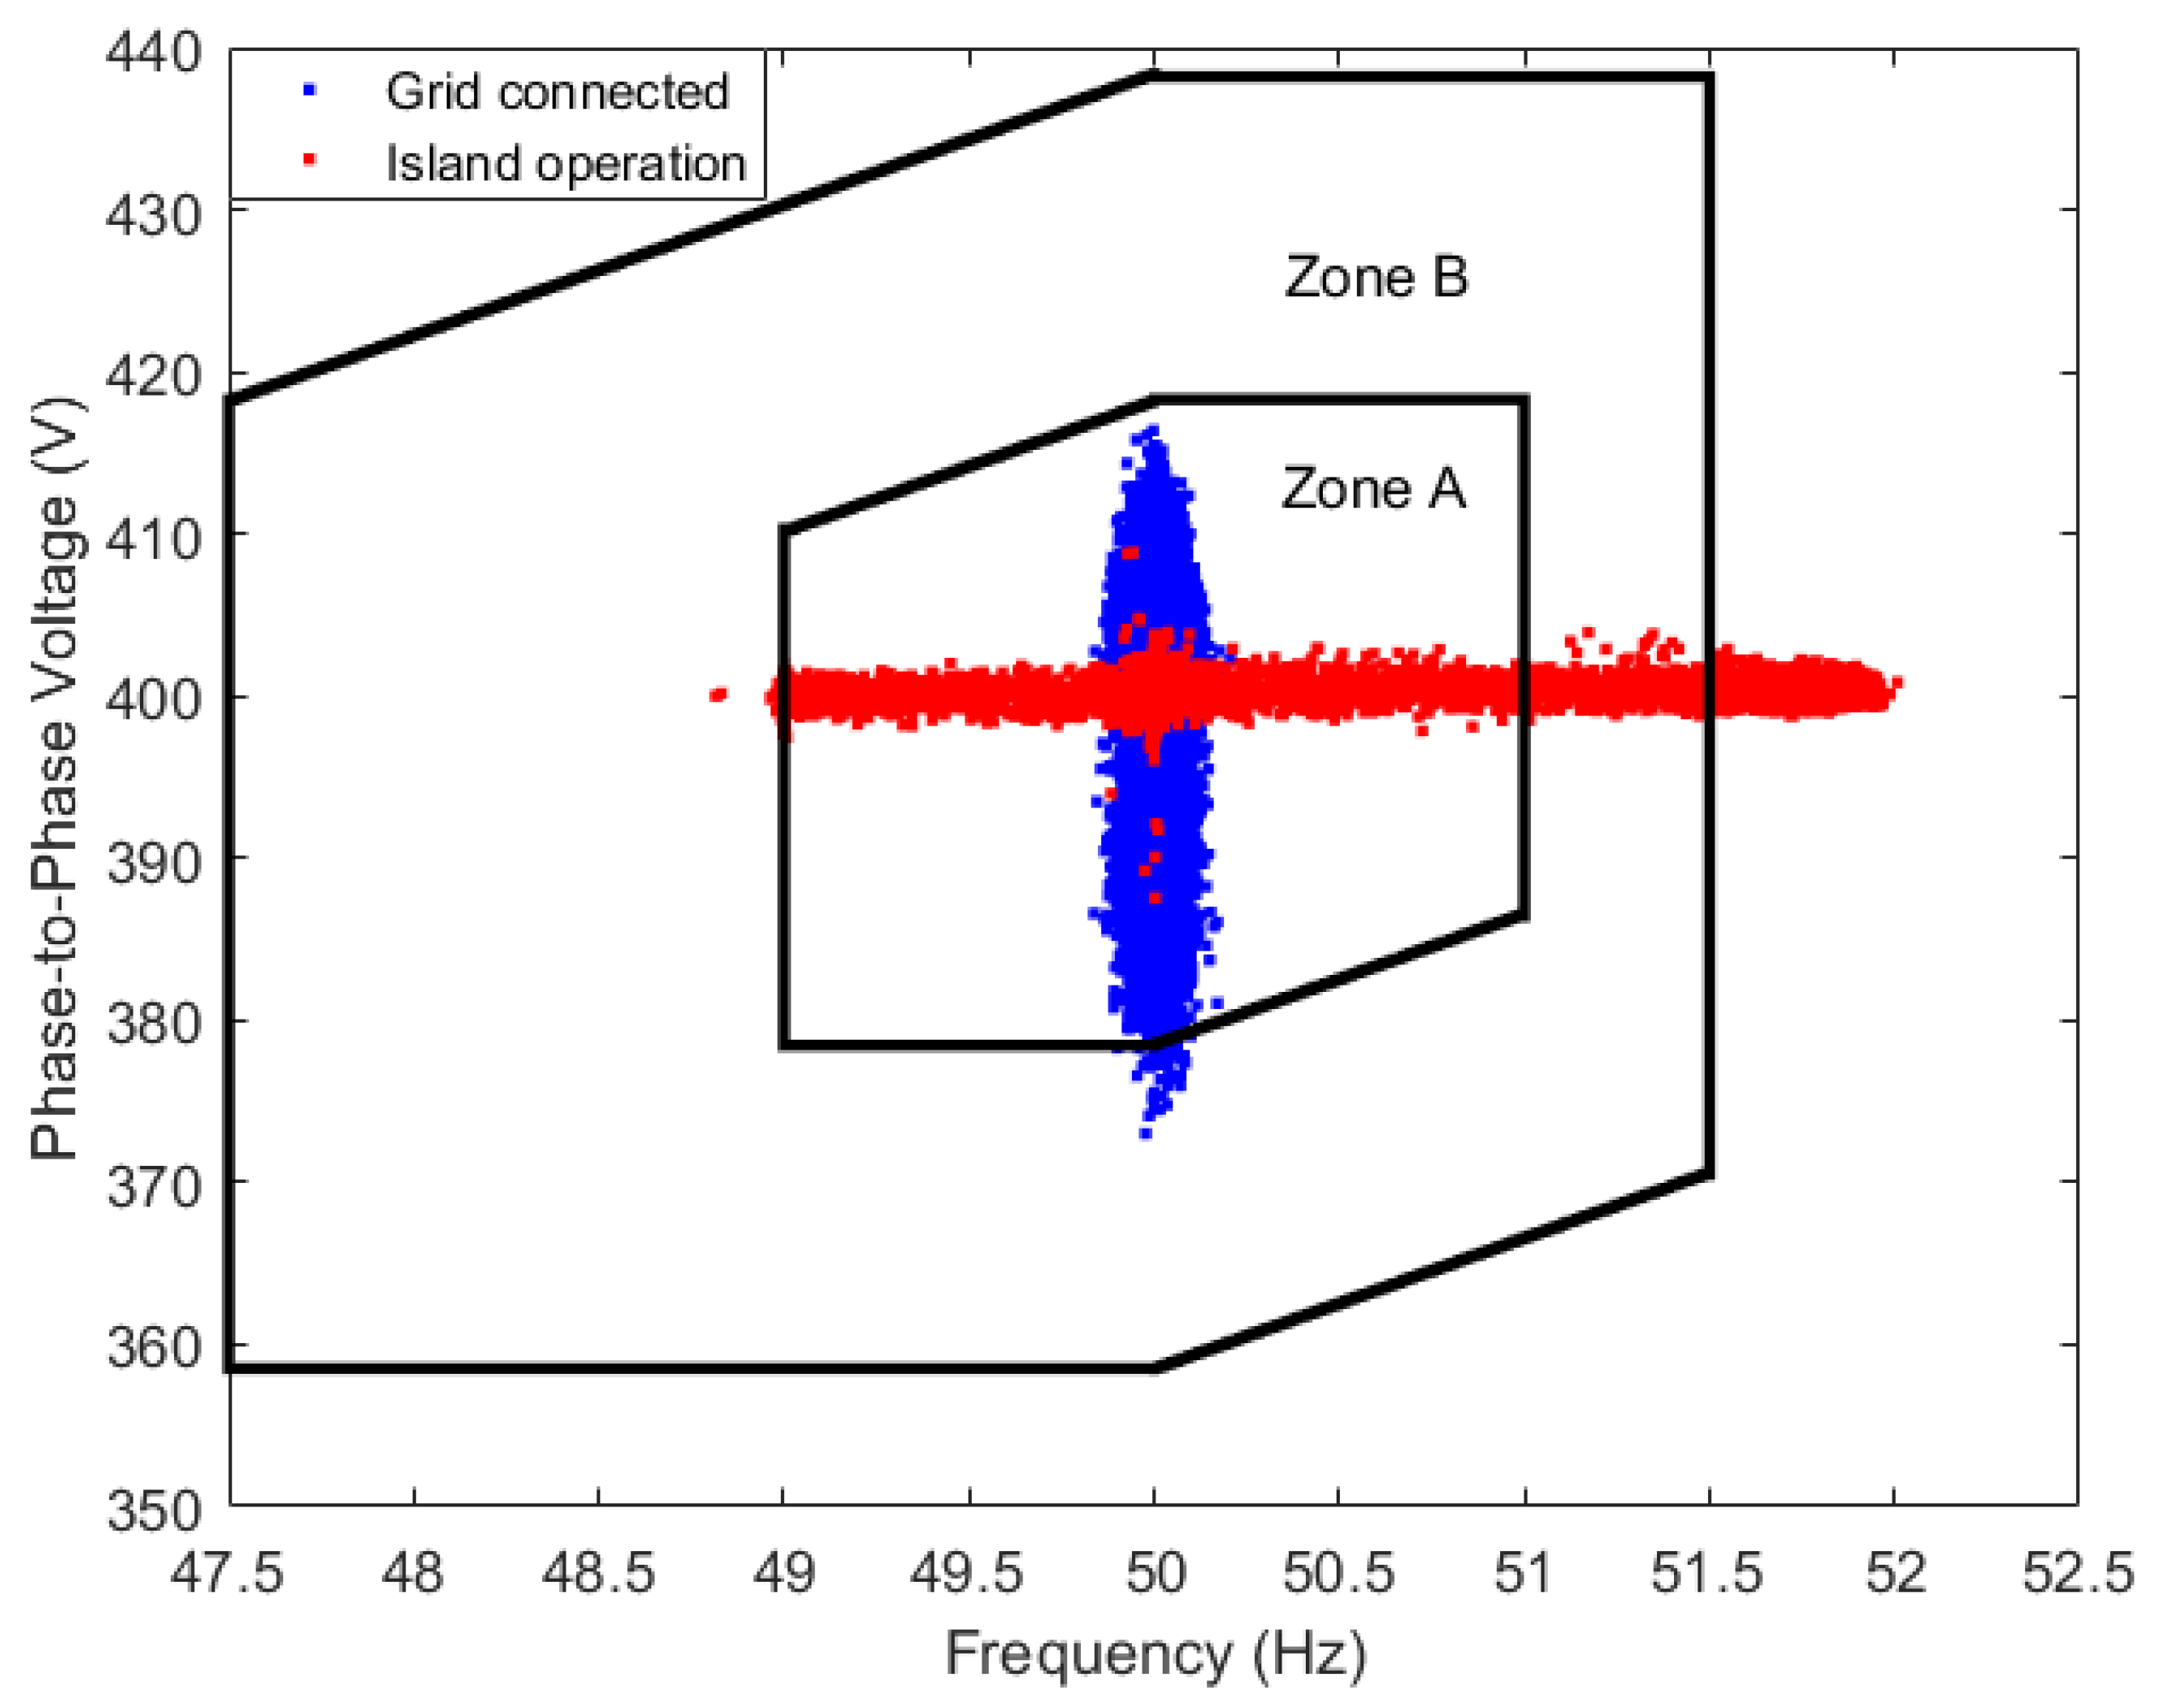
If operation in Zone B takes place often or continuously the motor should be de-rated to fit those operating conditions. The 10 min average values for the phase-to-phase voltage with the corresponding frequency for the 48 week island operated measurements are shown in
Figure 9. The 10 min average 54 week grid connected measurements are also plotted in
Figure 9 for comparison. Zone A and Zone B from IEC Standard 60034-1 is also plotted.
The frequency limits, voltage limits and the amount of time in which the nanogrid during islanded operation was within Zone A, Zone B and outside Zone B can be seen in
Table 2.
The values that are outside Zone A are caused by the curtailment of solar production since the frequency is higher than 51 Hz. The phase-to-phase voltage never exceeds the limits of Zone A. The grid connected 10 min average values are within Zone A for 99.91% of the time and 0.09% in Zone B. It can be seen in
Figure 9 that the voltage varies more for the grid connection than islanded operation which also causes some grid connected values to end up in Zone B.
3.1. Single Phase Induction Motors
Single phase induction motors have a start winding that only operates for a few seconds to get the motor spinning. During those few seconds the start winding draws a large current. The timing of the centrifugal switch that disconnects the start winding on some single phase induction motors might get affected with larger frequency variations than what the motor was designed for.
The centrifugal switch disconnects at about 75 to 90% of rated motor speed [
16,
17]. In a 50 Hz grid that range would correspond to 37.5 to 45 Hz which is a frequency range that can be partly observed in the measurements from the islanded operation.
If a single phase induction motor with a centrifugal switch would start at a supply frequency less than the disconnection speed, the centrifugal switch would not disconnect and leave the start winding operational until the supply frequency increases sufficiently. Such a case could cause the start winding to get damaged or become non-operational. The occasion where the start winding could get damaged is when the nanogrid recovers from an interruption that followed shortly after the frequency reached about 55 Hz. Such a case can be seen in
Figure 6 where the frequency was below 45 Hz for about 8 s. A total of 12 occurrences where the frequency stayed below 45 Hz during about 8 s happened during the 48 week measurement time period. In one occurrence the frequency stayed at 43.3 to 44 Hz for about 63 s.
3.2. Computer Power Supplies
Some power supplies for computers follow the ATX12V design specifications which require that the power supply should work between 47 and 63 Hz [
6]. Intel power supply design specifications also specify a frequency range of 47 to 63 Hz [
7]. Therefore only frequencies below 47 Hz could be a problem since the nanogrid frequency never exceeds 55.2 Hz. Frequencies below 47 Hz occurred 13 times in the 48 week measurements where 12 had duration of about 12 s and one for about 63 s.
3.3. Transformers
IEC Standard 60076-1 [
8] states that single phase transformers with larger power rating than 1 kVA and 3-phase transformers with larger power rating than 5 kVA must withstand +5% V/f ratio variation from rated V/f ratio at rated power and frequency. If the voltage would remain constant at rated voltage, the maximum allowed frequency drop would be down to 47.62 Hz for a +5% V/f ratio. The transformer should also withstand a V/f ratio of +10% from rated V/f ratio at no load which correspond to a frequency of 45.5 Hz at rated voltage. The frequency dropped to between 47.6 and 45.5 Hz for 12 times with duration of about 8 to 12 s in the 48 week measurements. For one occasion the frequency dropped below 45.5 Hz for about 63 s. During these instances a transformer might get affected.
3.4. Clocks and Harmonic Filters
Other types of equipment that can be affected by the frequency variations are harmonic filters since they can become de-tuned during periods where there is a large frequency deviation from rated frequency [
18]. Clocks that depend on the supply frequency will also be affected. But since over frequency in the nanogrid will be compensated by the AFA, clocks could temporarily get affected during daytime. At 52 Hz the clocks would be off by about two min every ho. In for instance
Figure 3, the offset by the evening would be about 14 min.
3.5. Equipment Testing
In order to test the effects on home appliances for the large frequency variations seen in the nanogrid, the test procedure in IEC Standard 61000-4-28 [
18] could be used. The frequency test level 2 for equipment for residential customers connected to the low voltage grid is +4% and −6% which for a 50 Hz system corresponds to 47–52 Hz. The transition period from rated frequency to the tested frequency, is 10 s. Since the frequency variations are larger in the nanogrid, test level 4 could be used which applies for non-interconnected networks where misoperation of equipment is critical. Test level 4 uses ±15% (42.5–57.5 Hz) which corresponds closest to the frequency variations measured in the nanogrid. The transition period from rated frequency to the tested frequency is 1 s in test level 4. This is something that corresponds closer to what can sometimes be seen in the nanogrid, see for example
Figure 6. Test level 4 is also more appropriate if one was to consider that some home appliances might be critical for maintaining a normal life in the residence. But since the frequency variations in the nanogrid are between 41.3 and 55.2 Hz at 1 s resolution, test level X could be used where the frequency range can be adjusted further. In order to establish the impact on equipment operation for the nanogrid reviewed in this paper, the frequency test level should be at least +10.5% and −17.4% with a transitional period of 1 s.
4. Relationship between Frequency Variations and Interruptions
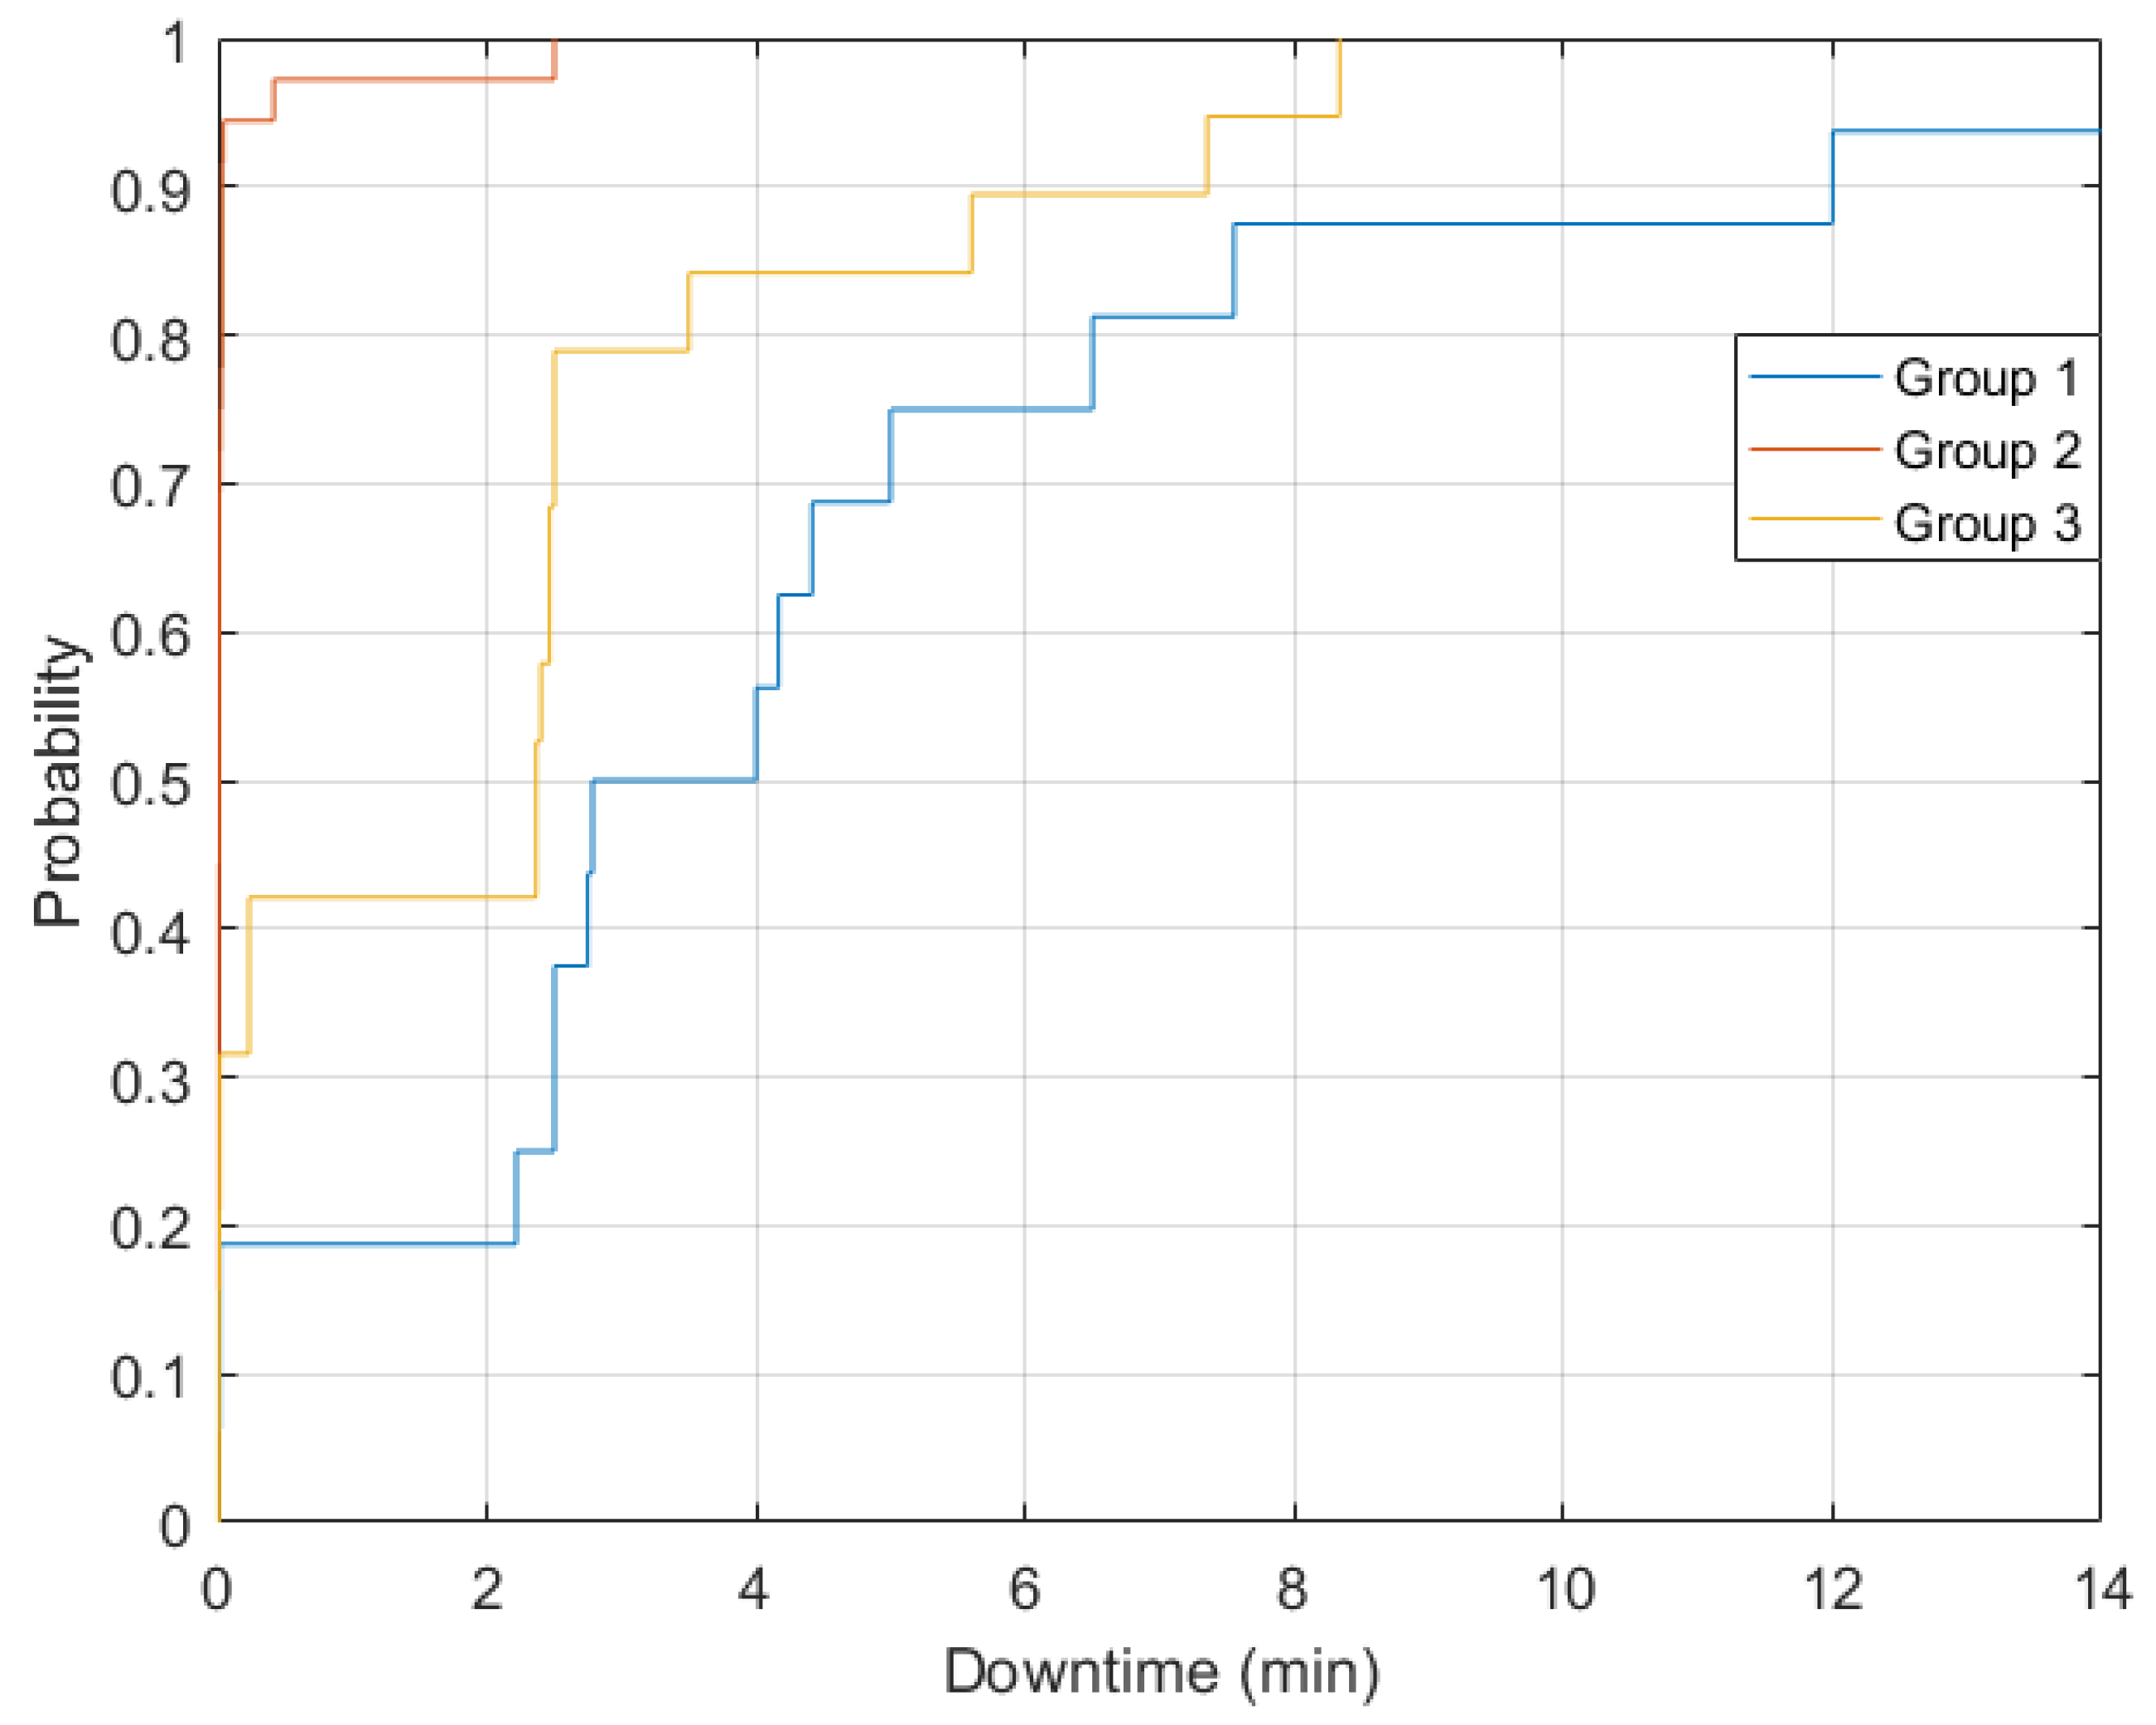
The interruptions that occurred during the 48 week measurement time period could be divided into three groups according to how the nanogrid transitioned between different operational modes:
Group 1 (Island-interruption-grid): Interruptions during islanded operation that transition into grid operation.
Group 2 (Grid-interruption-island): Interruptions during grid operation that transition into islanded operation.
Group 3 (Island-interruption-island): Interruptions during island operation that transition into islanded operation.
Grid to grid interruptions are not considered since the nanogrid internal energy system is not operational in those cases. The individual downtimes of the interruptions for each three groups are plotted in an empirical CDF in
Figure 10 where the longest interruption of 1.97 h has been truncated to give a better visualization of the plot. The primary reason to why the interruptions in each group occurred is unknown.
The total number of interruptions and downtimes for the respective groups can be seen in
Table 3. Note that the majority of the interruptions last less than 2 s.
In Group 2, 28 interruptions happened shortly after the frequency in the nanogrid reached about 55 Hz and lasted for about 0.9 s. These are the same type of interruptions that can be seen in
Figure 5 and
Figure 6 where there is a 10 to 50 second long connection to the utility grid after the frequency reached about 55 Hz. These interruptions amount to 39.4% of the total number of interruptions in 48 weeks and 78% of Group 2. This means that there is a possibility that the surplus of energy in the nanogrid causes approximately 39.4% of the total number of interruptions in the nanogrid. However, the downtime of these interruptions only corresponds to 0.19% of the total downtime in the nanogrid.
The number of transitions between operational states in Group 1 and Group 2 is approximately 1400 in 48 weeks where around 1000 transitions are caused by the 55 Hz phenomena shown in
Figure 5 and
Figure 6.
The probability of having an interruption in Group 1 and 2 with regards to the number of transitions between islanded operation and grid operation is 1.1% and 2.5%, respectively, for the 48 weeks.
The probability of having an interruption in Group 2 when the frequency reaches 55 Hz is around2.8% and if the 55 Hz transitions are excluded the probability is around 2%. Since the probability for an interruption is higher when the frequency reaches 55 Hz, the nanogrid could be more sensitive to interruptions when the nanogrid transitions to grid operation.
5. Possible Solutions for Reducing over Frequency in Islanded Operation
The over-frequency in the nanogrid is caused by the FSPC used by the Sunny Island battery inverters to signal the solar inverters to regulate the power production. This is done when there is not enough load connected in the nanogrid during islanded operation. The over-frequency caused by the FSPC will activate the AFA which lowers the frequency below 50 Hz to compensate for the occurred over frequency. If instead a direct link with a cable between the battery inverter and solar inverter would be used, the signaling with the power frequency could be avoided and therefore possibly eliminate the frequency variations. However, it is unclear if the lowest frequency variations that happen when the islanded operation initiates after an interruption would be eliminated with this method.
If this solution can’t be done practically, a simple solution would be to have a large resistive load (dump load) that can be activated when the frequency starts to rise above 51 Hz. The solution of using dump loads to regulate the power frequency in islanded operated microgrids when there is an excess amount of power in the system is described in for instance [
19,
20].
Another solution would be to increase the storage capacity (which is under construction) and/or increase the electrolyzer power in order to create more hydrogen when there is not enough consumption.
If an increase in energy storage is not feasible and if the objective is to reduce the loss of potential power production, one could shift some of the loads towards the day when the solar power production is occurring. In a single house nanogrid, such loads could be for example the dishwasher, washing machine, electric vehicles, air conditioning units or heat pumps. If such an approach would be taken, the service life of the battery would also increase since the cycling of the battery during the night is reduced.
These solutions could reduce the large frequency variations that go beyond the limits in product and grid standards described in this article. An increase in energy storage and consumption when the power production occurs would also be necessary in order to reduce the amount of transitions between islanded operation and grid operation. That could in turn reduce the amount of interruptions that occur during such transitions.
6. Conclusions
The 10 s average frequency variations in the nanogrid during islanded operation are outside the range set by EN 50160 for systems without synchronous connection to an interconnected system for 89.6% of the 48 weeks. However, for Standard EN 50160/A1 which applies in Norway the frequency variations are outside the limits for 25% of 48 weeks.
The lower and upper allowed 10 s average frequency limit (52.5 to 57.5 Hz) defined by EN 50160 is not surpassed but for EN 50160/A1 the maximum allowed range of 49 to 51 Hz is surpassed.
The frequency variations between 51 and 52 Hz are caused by the FSPC used by the Sunny Island inverters to curtail production from the solar PV installation when there is not enough consumption. The larger frequency variations from 52 to 55 Hz occur when there is not enough consumption during the daytime and when the FSPC increases the frequency towards 55 Hz to shut down the solar inverters in order to synchronize with the utility grid.
The lowest frequency values of about 41 to about 49 Hz are caused by short interruptions after the frequency reached about 55 Hz. The frequency values at about 49 Hz are caused by the AFA compensating for the occurred over frequency in order to enable clocks to run at the correct time.
There might be some adverse effects on certain equipment of these frequency variations. For instance, AC motors might be affected since 17.4% of the total time in islanded operation AC motors will operate outside the limits described by IEC Standard 60034-1. Single phase induction motors might be affected if they are started just after the short interruptions that can occur when the frequency has reached 55 Hz. This is since the frequency can be lower than the centrifugal switch opening frequency for about 8 to 63 s at 13 occurrences which in turn could cause damage to the start winding. Computer power supplies and transformers could also be affected for 13 times in the 48 week measurements for duration of about 8 to 63 s at each occurrence. The frequency variations that go beyond the allowed range described in grid and product standards could be eliminated by increasing the consumption by for instance shifting consumption to the daytime when the production occurs. Another solution would be to increase the energy storage in order to store the excess generated power or have a direct link between the Sunny Island battery inverter and solar inverter to avoid the communication through the power frequency.
Approximately 39.4% of the total number of interruptions could also possibly be eliminated by ensuring that the load is matched to the solar production. Since transitions between islanded operation and grid operation increase the risk of interruptions, a constantly islanded nanogrid could have fewer interruptions than what this case study has presented. It is unclear if the reliability of the nanogrid would increase with the removal of the possibility of connecting to the grid since there could be instability in the system causing the interruptions in Group 2 presented in this paper.
Author Contributions
Conceptualization, J.N., S.K.R. and M.H.J.B.; Methodology, J.N.; Software, J.N.; Validation, J.N., S.K.R. and M.H.J.B.; Formal Analysis, J.N.; Investigation, J.N.; Resources, S.K.R. and M.H.J.B.; Data Curation, J.N.; Writing-Original Draft Preparation, J.N.; Writing-Review & Editing, J.N., S.K.R. and M.H.J.B.; Visualization, J.N.; Supervision, S.K.R. and M.H.J.B.; Project Administration, S.K.R. and M.H.J.B.; Funding Acquisition, S.K.R. and M.H.J.B.
Funding
This paper has been funded by Skellefteå Kraft Elnät and Rönnbäret foundation.
Conflicts of Interest
The authors declare no conflict of interest.
References
- Hatziargyriou, N.; Asano, H.; Iravani, R.; Marnay, C. Microgrids. IEEE Power Energy Mag. 2007, 5, 78–94. [Google Scholar] [CrossRef]
- Burmester, D.; Rayudu, R.; Seah, W.; Akinyele, D. A Review of Nanogrid Topologies and Technologies. Renew. Sustain. Energy Rev. 2017, 67, 760–775. [Google Scholar] [CrossRef]
- Cenelec Standard EN 50160, Voltage Characteristics of Electricity Supplied by Public Electricity Networks; European Committee for Electrotechnical Standardization: Brussels, Belgium, 2010.
- Cenelec Standard EN 50160/A1, Voltage Characteristics of Electricity Supplied by Public Electricity Networks; European Committee for Electrotechnical Standardization: Brussels, Belgium, 2015.
- IEC Standard 60034-1, Rotating electrical machines—Part 1: Rating and performance; International Electrotechnical Commission: Geneva, Switzerland, 2017.
- Intel Corporation. ATX12V, Power Supply Design Guide, version 2.2; Intel Corporation: Santa Clara, CA, USA, 2005. [Google Scholar]
- Intel Corporation. Design Guide for Desktop Platform Form Factors; revision 1.31; Intel Corporation: Santa Clara, CA, USA, 2013. [Google Scholar]
- IEC Standard 60076-1:2011, Power transformers-Part 1: General; International Electrotechnical Commission: Geneva, Switzerland, 2011.
- Rönnberg, S.K.; Bollen, M.H.J.; Nömm, J. Power Quality Measurements in a Single House Microgrid. In Proceedings of the CIRED 24th International Conference on Electricity Distribution, Glasgow, Scotland, 12–15 June 2017; pp. 818–822. [Google Scholar]
- SMA. PV Inverters, Use and Settings of PV Inverters in Off-Grid Systems, version 4.2; SMA: Niestetal, Germany, 2014. [Google Scholar]
- SMA. Sunny Island 3324/4248 Installation Guide, version 4.0; SMA: Niestetal, Germany, 2005. [Google Scholar]
- IEEE Standard 1789-2015, IEEE Recommended Practices for Modulating Current in High-Brightness LEDs for Mitigating Health Risks to Viewers; The Institute of Electrical and Electronics Engineers: New York, NY, USA, 2015.
- Gil-de-Castro, A.; Rönnberg, S.K.; Bollen, M.H.J. Light intensity variation (flicker) and harmonic emission related to LED lamps. Electr. Power Syst. Res. 2017, 146, 107–114. [Google Scholar] [CrossRef]
- Bollen, M.H.J.; Gu, I.Y.H. Signal Processing of Power Quality Disturbances, 1st ed.; Wiley-IEEE Press: Hoboken, NJ, USA, 2006; p. 159. [Google Scholar]
- Rajput, R.K. Alternating Current Machines, 1st ed.; Firewall Media: New Delhi, India, 2002; p. 435. [Google Scholar]
- Brumbach, M.E. Industrial Electricity, 9th ed.; Cengage learning: Boston, MA, USA, 2017; p. 385. [Google Scholar]
- Shultz, G.P. Transformers and Motors, 1st ed.; Elsivier: New York, NY, USA, 1989; p. 129. [Google Scholar]
- IEC Standard 61000-4-28, Electromagnetic Compatibility (EMC)–Part 4–28: Testing and Measurement Techniques-Variation of Power Frequency, Immunity Test for Equipment with input Current not Exceeding 16 A per phase, edition 1.2; International Electrotechnical Commission: Geneva, Switzerland, 2009.
- Serban, E.; Serban, H. A Control Strategy for a Distributed Power Generation Microgrid Application with Voltage and Current Controlled Source Converter. IEEE Trans. Power. Electron. 2010, 25, 2981–2992. [Google Scholar] [CrossRef]
- Baudoin, S.; Vechiu, I. Review of Voltage and Frequency Control Strategies for Islanded Microgrid. In Proceedings of the 16th International Conference on System Theory, Control and Computing (ICSTCC), Sinaia, Romania, 2–14 October 2012. [Google Scholar]
© 2018 by the authors. Licensee MDPI, Basel, Switzerland. This article is an open access article distributed under the terms and conditions of the Creative Commons Attribution (CC BY) license (http://creativecommons.org/licenses/by/4.0/).


