1. Introduction
The HCPV (High Concentrator Photovoltaics) technology, with concentrations higher than 300 times, is developed on the aim of reducing the utilization of semiconductor material at the expense of replacing it by conventional concentrator optical materials [
1]. It is expected that this effort leads to a decrease of the electricity generation costs [
2], as well as to a cleaner renewable energy generation, since semiconductor materials are more expensive and their production is more contaminant than conventional optical materials (glass, plastic, etc.). In the frame of the competition of reducing generation costs among the different photovoltaic (PV) technologies, record HCPV modules have achieved the milestone of 38.9% [
3] efficiency and even 43.4% [
4] efficiency with a minimodule. Those values are, by far, greater than those of any other PV technology [
5]. Specifically, those two records utilized four-junction concentrator solar cells (FJSCs). These kinds of solar cells suppose an improvement in the development of high-efficiency concentrator multi-junction solar cells (MJSCs), since they are more efficient than the typical triple-junction concentrator solar cells (TJSCs) that are commercially available.
Concerning the theoretical analysis of Fresnel-based HCPV concentrator systems equipped with refractive secondary optical elements (SOEs) in the literature, many of them analyze the SILO (SIngle-Lens-Optical element) SOE [
6,
7,
8]. Some of these works take into account the subcells structure of an MJSC in the optical simulations [
9,
10], although none of these works applies an exhaustive optical modelling to an HCPV unit equipped with FJSCs. Therefore, it is needed to study how these new concentrator solar cell technology couples with typical high concentrator optical systems, as, in this case, with the combination of a Fresnel lens with the well-known SILO SOE. This new analysis will provide knowledge about if it is necessary to adapt the concentrator optics to the FJSC in order to properly take advantage of the increased number of p-n junctions. Furthermore, this kind of theoretical study can later be used to analyze the experimental performance of such kind of FJSCs working in typical HCPV systems, as in the experimental characterization of different HCPV units equipped with TJSCs [
11,
12].
This work is based on the application of the optical modelling developed in the previous research [
13], in which four Fresnel-based HCPV units (one lens plus one refractive SOE plus one solar cell) were optically modelled making an emphasis in the wavelength-dependent optical properties. Such kind of optical modelling is needed in order to estimate the short-circuit current generated by each subcell within a multi-junction solar cell (MJSC), as a consequence of the spectral illumination concentrated by the optics. In this study, the HCPV unit considered consists of a square Fresnel lens as POE (primary optical element), a refractive SOE, and an MJSC. Both POE and SOE are simulated to be made of PMMA (poly(methyl methacrylate)), a common material used in CPV optics [
14]. The SOE is a modification of the SILO (Single-Lens-Optical element) having a pyramidal basis, thus called SILO-Pyramid.
The spectral irradiance impinging on the HCPV unit may be mainly altered because of the spectral absorption within the materials and of the rays deviation (after reflection and refraction at the interfaces of the transparent materials). That modification of the solar spectral irradiance distribution may have a different impact of the current generation of an MJSC as a function of the different spectral responses of the component subcells [
15]. Specifically, in this work, two different MJSCs technologies are analyzed: first, a typical lattice-matched TJSC is simulated—second, an FJSC. The TJSC corresponds to a commercial model [
16], whereas the FJSC corresponds to that developed by Dimroth et al. (wafer bonded) [
17].
2. Description of the HCPV Units
Each of the two HCPV units is composed of a square PMMA Fresnel lens, a refractive (PMMA) SILO-Pyramid SOE and an MJSC. These two HCPV units only differ in the MJSC applied. The Fresnel lens and the SILO-Pyramid secondary are the same for both HCPV units whereas, in one case, a TJSC is applied and, in the other case, it is an FJSC.
The square Fresnel lens has a length of 130 mm, a thickness of 1.8 mm, a facet spacing of 0.381 mm and a focal distance of 152 mm (see
Table 1). The SILO-Pyramid SOE is a Cartesian oval of revolution with a height of around 10.5 mm and a pyramidal basis [
13]. The shape of this SOE is calculated deterministically applying geometrical and optical (Fermat) principles; therefore, it is independent of the MJSC applied in the ray-tracing simulations. The SOE is located at a distance of 2 mm closer to the POE with respect to the focal distance, i.e., at 150.0 mm with respect to the POE, in order to improve the optical performance. The geometrical concentration (ratio of lens area over solar cell area),
Cg, between POE and solar cell is around 559×. Both MJSCs are simulated to be located at the bottom of the SOE and are a square of 5.5 mm.
The TJSC is a typical lattice-matched cell composed by GaInP/GaInAs/Ge. Without any concentrator and under 1 sun of simulated standard spectrum illumination AM1.5d ASTM G173-03, 15.6 mA/cm
2 is the short-circuit current density for the top subcell, 15.7 mA/cm
2 is that of the middle (mid) subcell, and 19.2 mA/cm
2 is that of the bottom (bot) subcell. In the case of the FJSC, it corresponds to a wafer bonded four-junction composed by GaInP/GaAs//GaInAsP/GaInAs [
17]. Under the same standard spectral illumination, its simulated short-circuit current density values are: 12.5 (12.47) mA/cm
2, 12.6 mA/cm
2, 12.5 (12.49) mA/cm
2 and 13.8 mA/cm
2, for the top, mid-1, mid-2 and bot subcells, respectively. Note that the experimental data of Dimroth et al. [
17] for the short-circuit current density of the FJSC is 12.42 mA/cm
2, thus the simulation matches the experimental value with 1% deviation. Thus, possible interference effects between film layers are considered negligible in this study. The simulation data about both MJSCs are gathered in
Table 2.
3. Optical Modelling
As commented before, the optical modelling applied was described in a previous work [
13]. Many important wavelength-dependent optical properties of materials and of their interaction with the light were implemented in this optical modelling. In particular, the light absorption at the solar cell is modelled by utilizing the experimental data of the spectral responses of the component subcells. Therefore, the solar cell is not considered as a perfect absorber. Following this optical modelling, instead of obtaining irradiance values through ray tracing simulations, short-circuit current density (
Jsc) values are obtained from Equation (1):
where
Jsc,i is the short-circuit current density of the subcell
i,
SRi(
λ) is the spectral response of the subcell
i, and
E(
λ) is the spectral illumination impinging the solar cell. In order to compare the shapes of the spectral responses of each subcell of both MJSCs, the normalized spectral responses of both MJSC are plotted in
Figure 1. Note that the absolute values of
SRi(
λ) given in references [
16,
17] are used for the calculations. This figure also shows the light absorption coefficient,
αp, of the standard PMMA, modelled through the Beer–Lambert law (Equation (2)) [
13]:
where
ФA is the absorbed flux,
ФI is the incident flux, and
h is the optical path length of the light ray through the absorbent material (PMMA). The different
Jsc,i values are used to calculate the different spectral matching ratio (
SMR) parameters [
18], as defined (Equation (3)):
where
i and
k are referred to different subcells within the same MJSC.
SMR values provide information about the spectral conditions at which the MJSC operates. The obtaining of the different
Jsc,i values allows the calculation of the optical polychromatic efficiency,
ηopt, defined as (Equation (4)) [
19]:
where
Cg is the geometrical concentration ratio, the superscripts “
conc” is referred to the concentrated illumination over the solar cell and “1 sun” is referred to 1 sun (1000 W/m
2) of standard illumination, and “
n” is referred to the total number of subcells. Equation (4) takes into account the series connection of the subcells within an MJSC.
Moreover, instead of analyzing the illumination uniformity over the solar cell, the spatial distribution of
values is analyzed for each subcell and quantified through the
PAR parameter (Equation (5)):
where the maximum value of
is divided by its average for each subcell. The importance of the uniformity in the current generation is related to the series resistance losses and the efficiency of the solar cell [
20].
4. Ray Tracing Results and Discussion
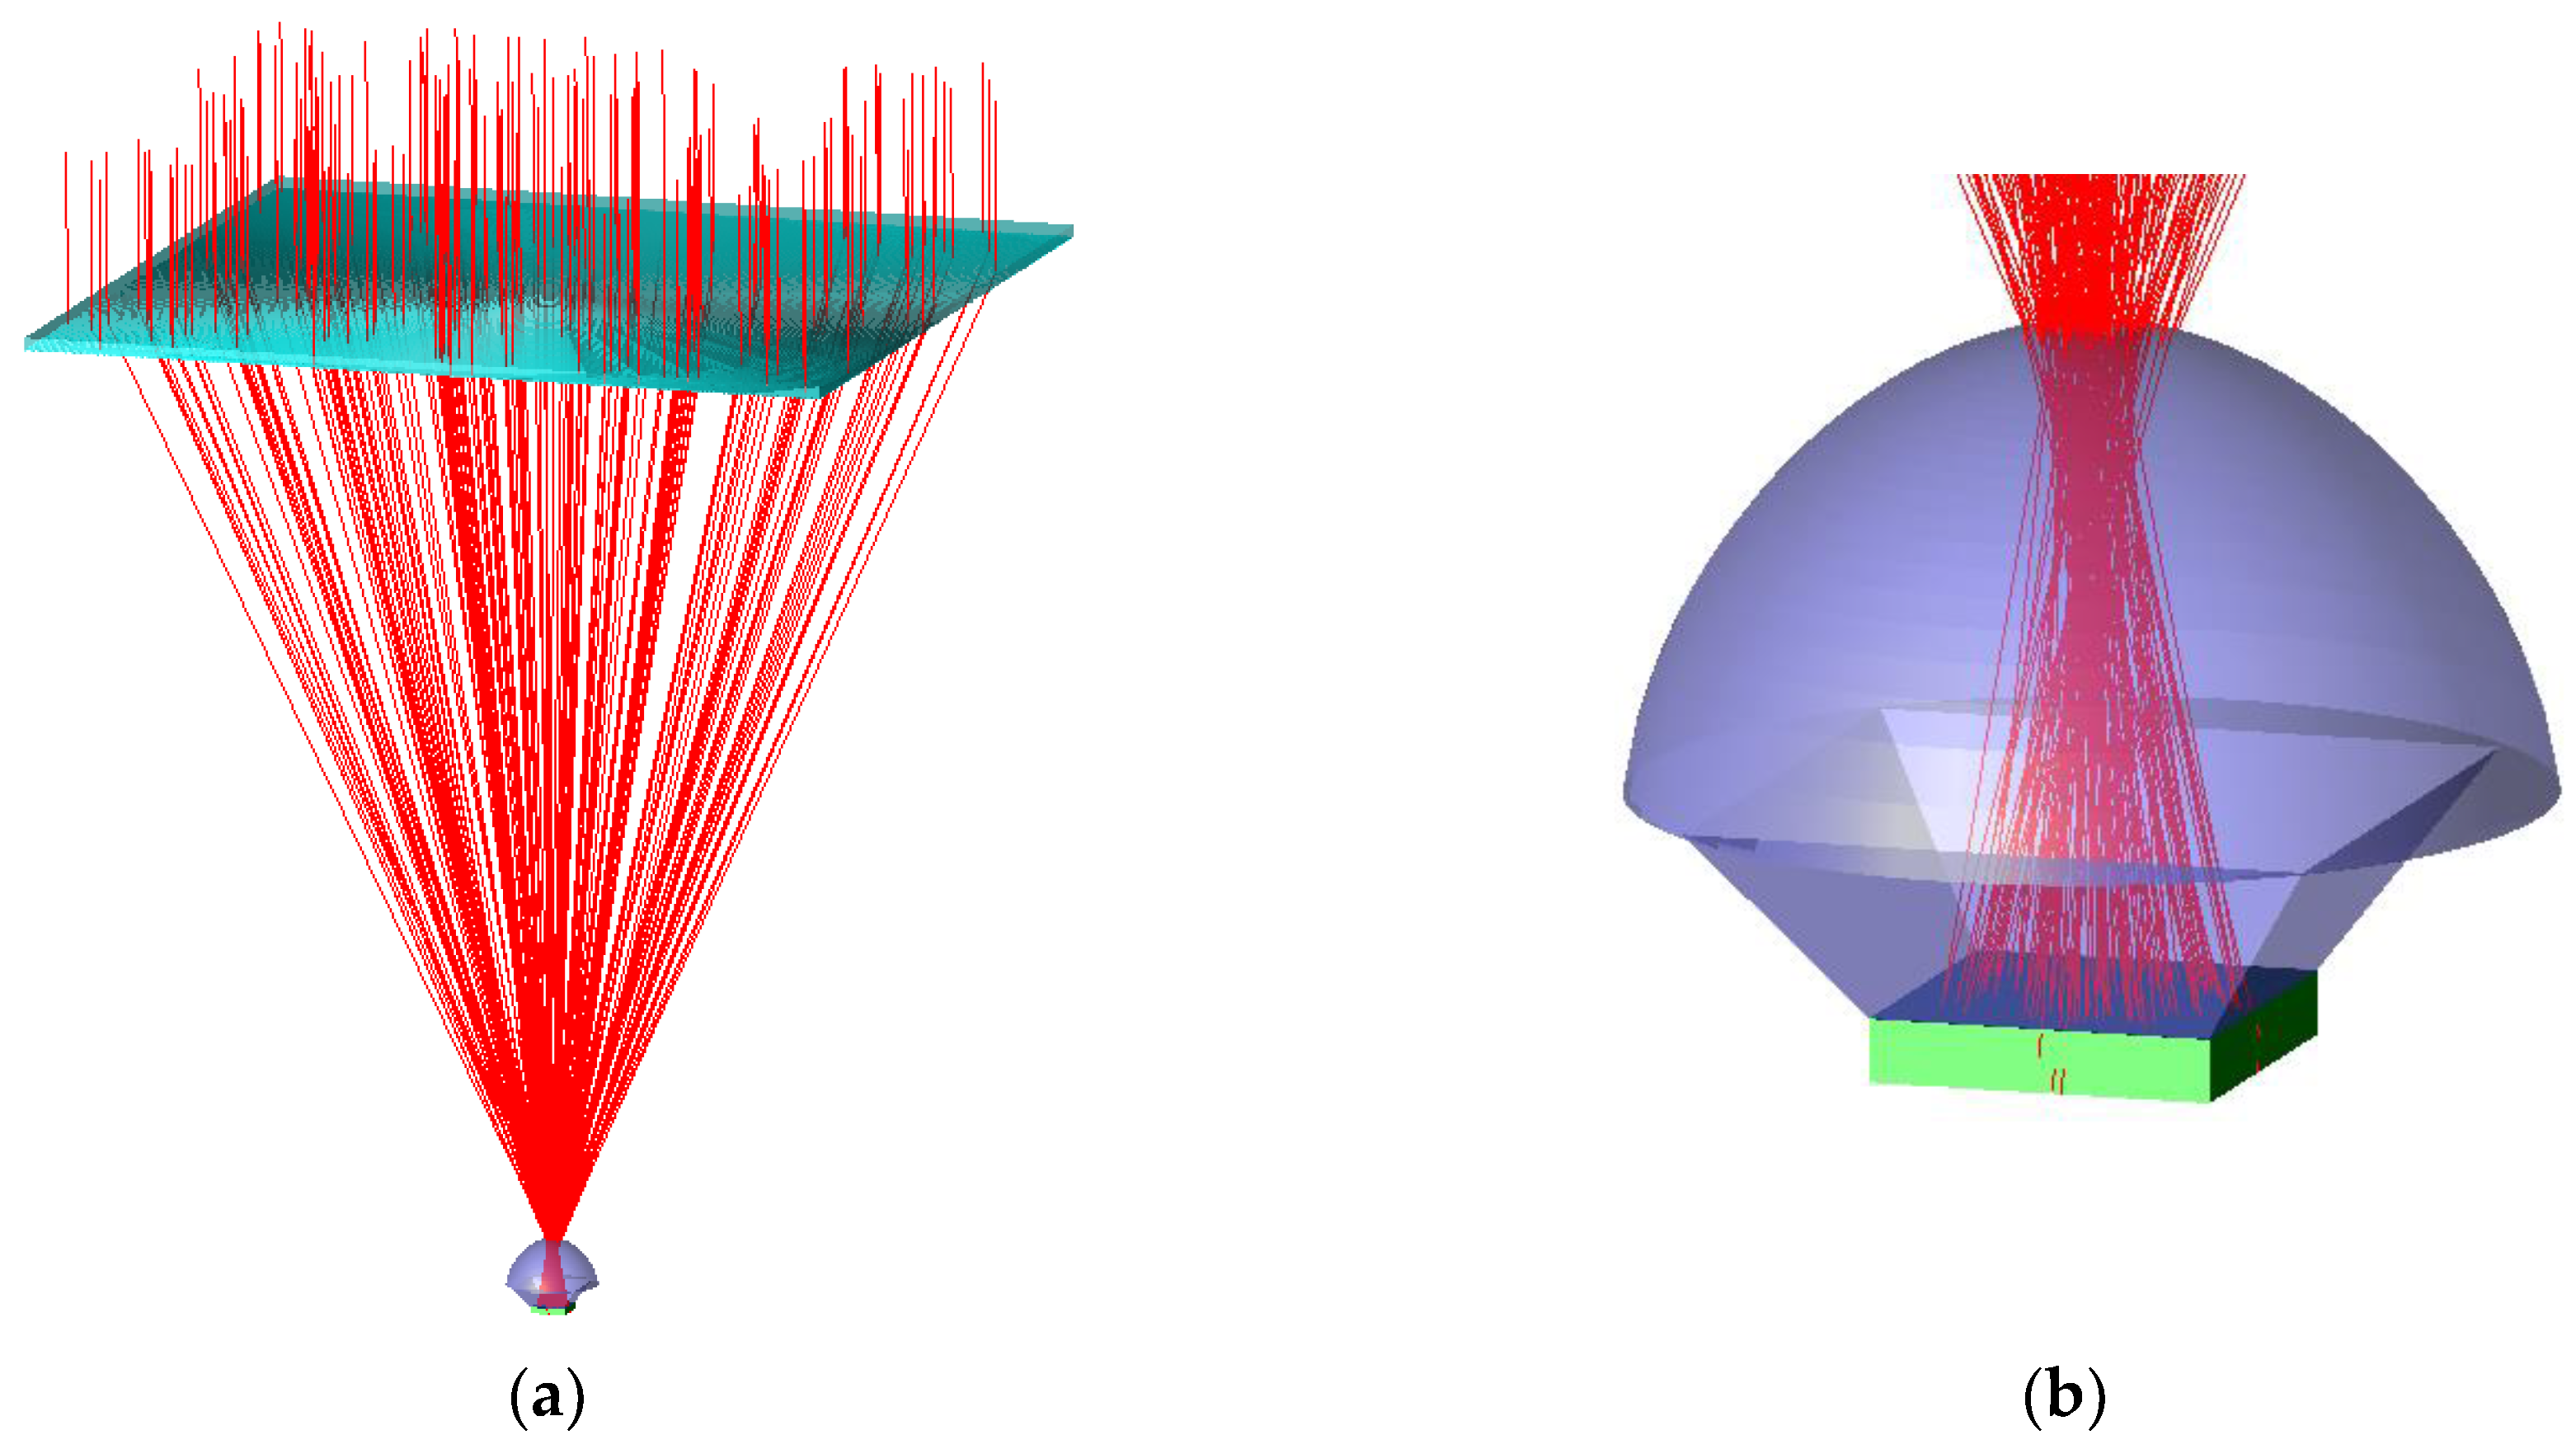
The optical modelling described is implemented utilizing the optical software TracePro® (version 18.3, Lambda Research Corporation, Littleton, MA, USA), and the optical simulations are performed through ray tracing.
Figure 2 shows a ray tracing of the HCPV unit analyzed.
Applying the optical modelling and performing the ray tracing simulations, the different
values are obtained for all of the subcells of both MJSC under normal alignment and under different tilt angles of the incoming simulated light. These last simulations represent the cases when an HCPV module (or even an HCPV unit) is not perfectly aligned to the sunrays. Although current HCPV modules present typical maximal acceptance angle values of 1.0° [
5], in this study, the theoretical angular performance, with tilt angles up to 2.0°, is analyzed. The
results are plotted in
Figure 3.
The
results of the TJSC (
Figure 3a) are taken from the previous work [
13]. These show top subcell limitations up to around 1.8° of tilt angle. These
values are around 7.6 A/cm
2 for the mid and bot subcells and around 7.3 A/cm
2 for the top subcell under normal alignment. For a tilt angle of 1.0°,
decreases up to 6.8 A/cm
2, whereas the other subcells maintain their values almost unaltered. In the case of the FJSC results (
Figure 3b), these clearly present current limitation of the bottom subcell for all of the tilt angles. The other subcells present similar
to each other up to around 0.6° of tilt angle. The
values for the top, mid-1 and mid-2 subcells are around 6 A/cm
2 under normal alignment, whereas the bot subcell is around 4.8 A/cm
2. This relative lower value is a consequence of the light absorption in the range of the bottom cell of the FJSC.
Table 3 summarizes the
values. Comparing both bottom subcells of these MJSCs (see
Figure 1), there are differences that may have an impact in the lower
of the FJSC: the reduced wavelength range of spectral response and the non-zero absorption coefficient in that range. Therefore, this bottom subcell of the FJSC is more sensitive to light absorption than that of the TJSC.
Under 1° of tilt angle, the top subcell of the FJSC shows a lower
value (5.5 A/cm
2) than those of the mid-1 and mid-2 subcells (almost unaltered respect to normal alignment). In the case of the bot subcell, this is also almost unaltered up to 1°. Note that the
values of the FJSC are lower than those of the TJSC due to the lower bandgaps of the FJSC subcells (
Figure 1).
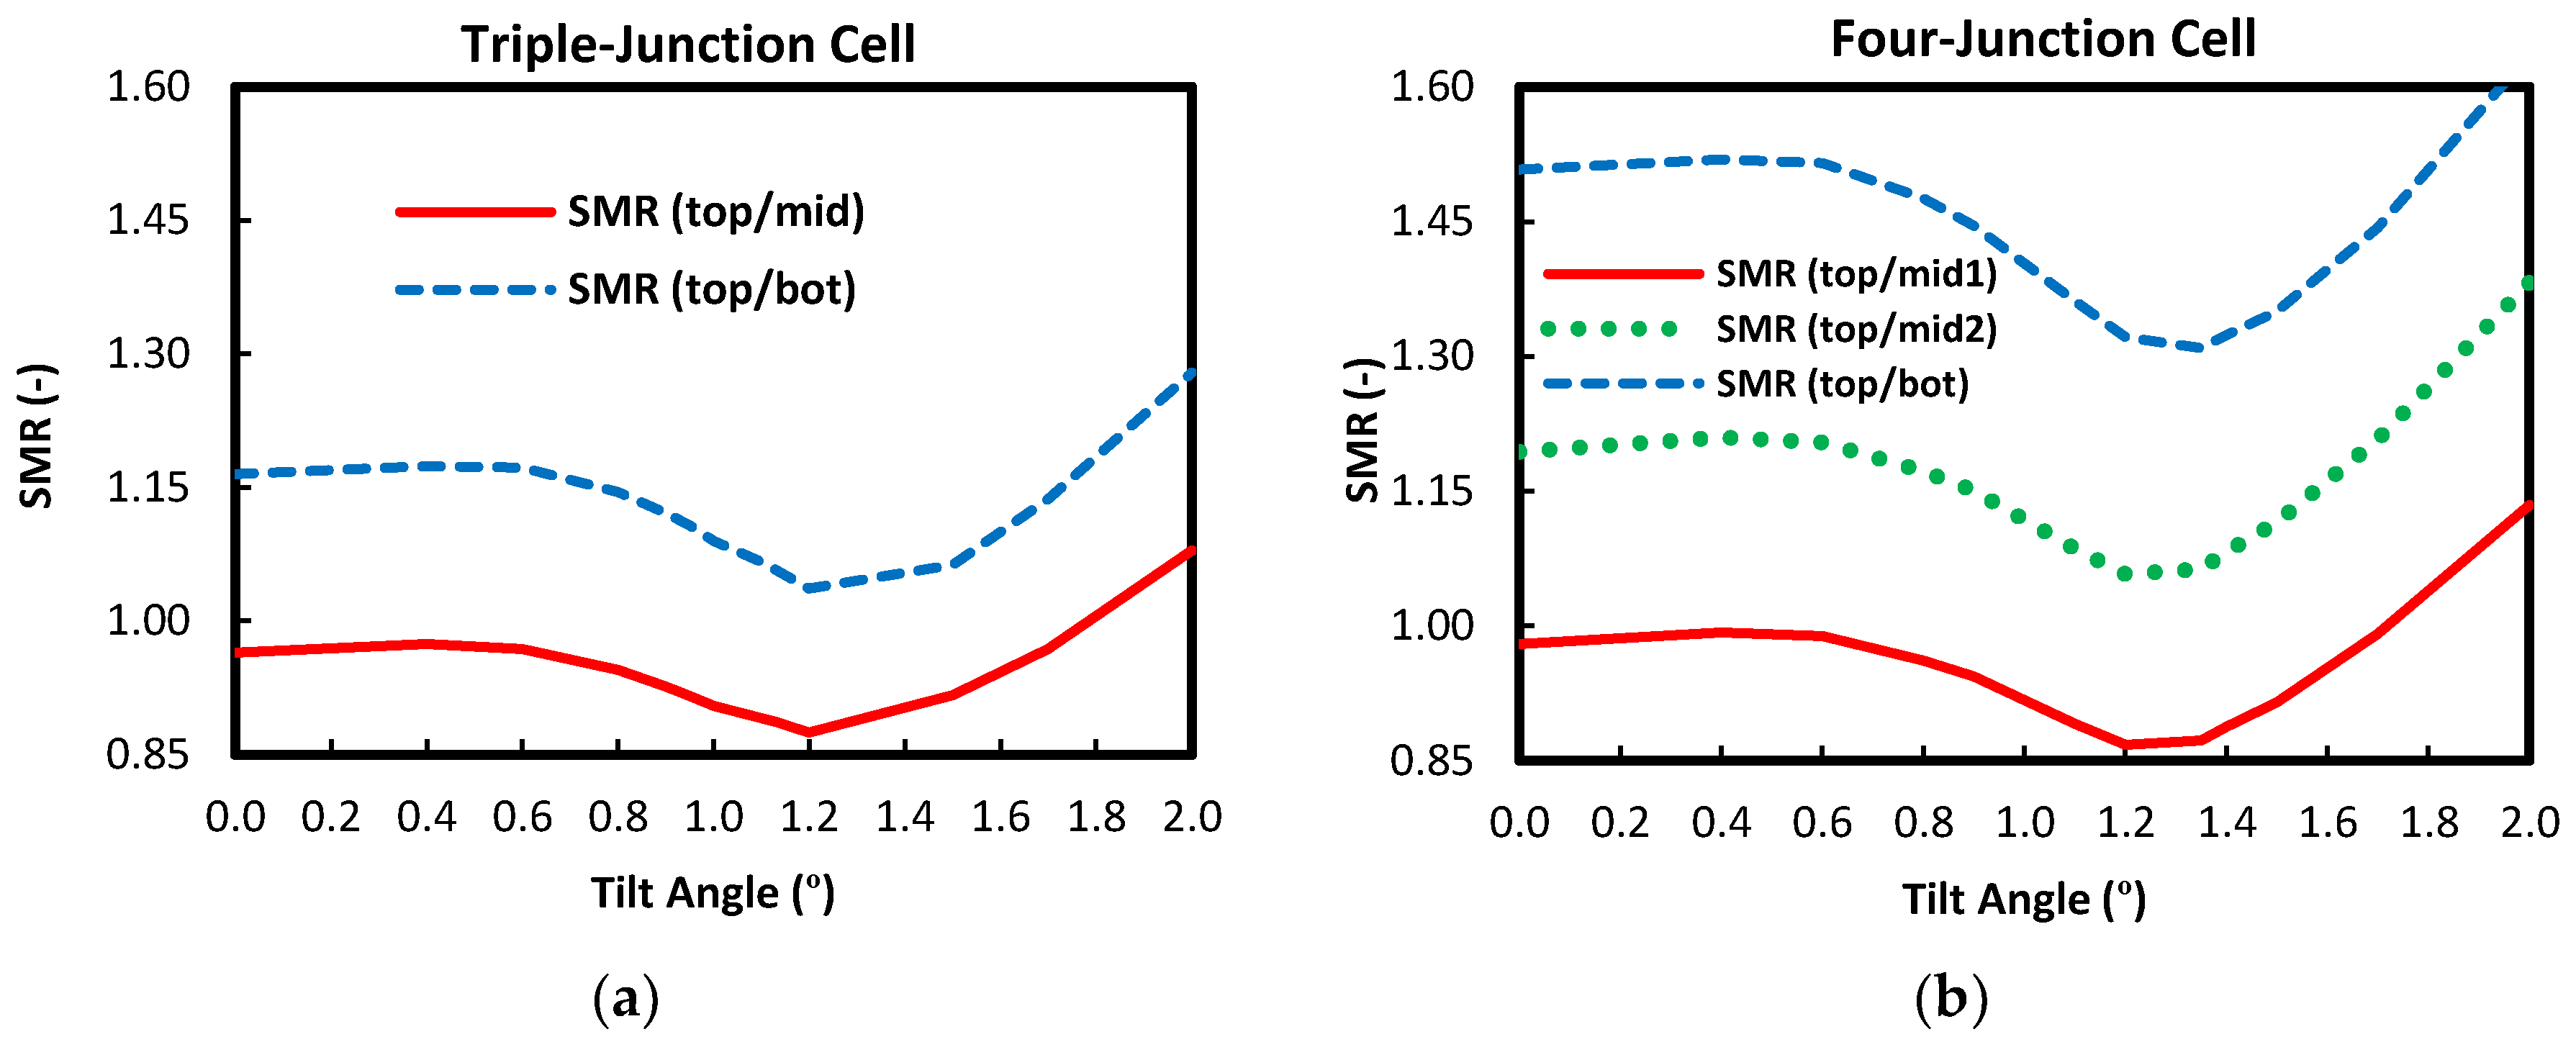
Using the
results, the
SMR values are calculated and plotted in
Figure 4. In the case of the TJSC, both
SMR values,
SMR(top/mid) and
SMR(top/bot) are minimum for around 1.2° of tilt angle, being 0.87 and 1.04, respectively, and they are never simultaneously equal to one for none of the tilt angles. Under normal alignment, these values are 0.96 and 1.17, respectively. Until 0.6°, there is no significant change in the
SMR values. For almost all of the tilt angles, it is
SMR(top/mid) < 1, which is referred to “red-rich” spectral conditions.
In the case of the FJSC, the three
SMR values,
SMR(top/mid1),
SMR(top/mid2) and
SMR(top/bot), show similar angular behavior, with a minimum at 1.2°–1.4°, with values: 0.87, 1.06 and 1.30, respectively.
SMR(top/mid1) presents a similar absolute behavior to
SMR(top/mid) of the TJSC. As in the case of the TJSC, up to around 0.6°, the three
SMR values are near constant. Under normal alignment,
SMR(top/mid1),
SMR(top/mid2) and
SMR(top/bot) are around 0.98, 1.20 and 1.51, respectively. The relative higher
SMR(top/bot) values for the FJSC are a consequence of the lower short-circuit current generation by the bot subcell, in accordance with the values of
Table 3.
Similarly to the case of the TJSC, there is no tilt angle for which all the
SMR values are simultaneously equal to one.
Table 4 gathers the different
SMR values of both cases under normal alignment.
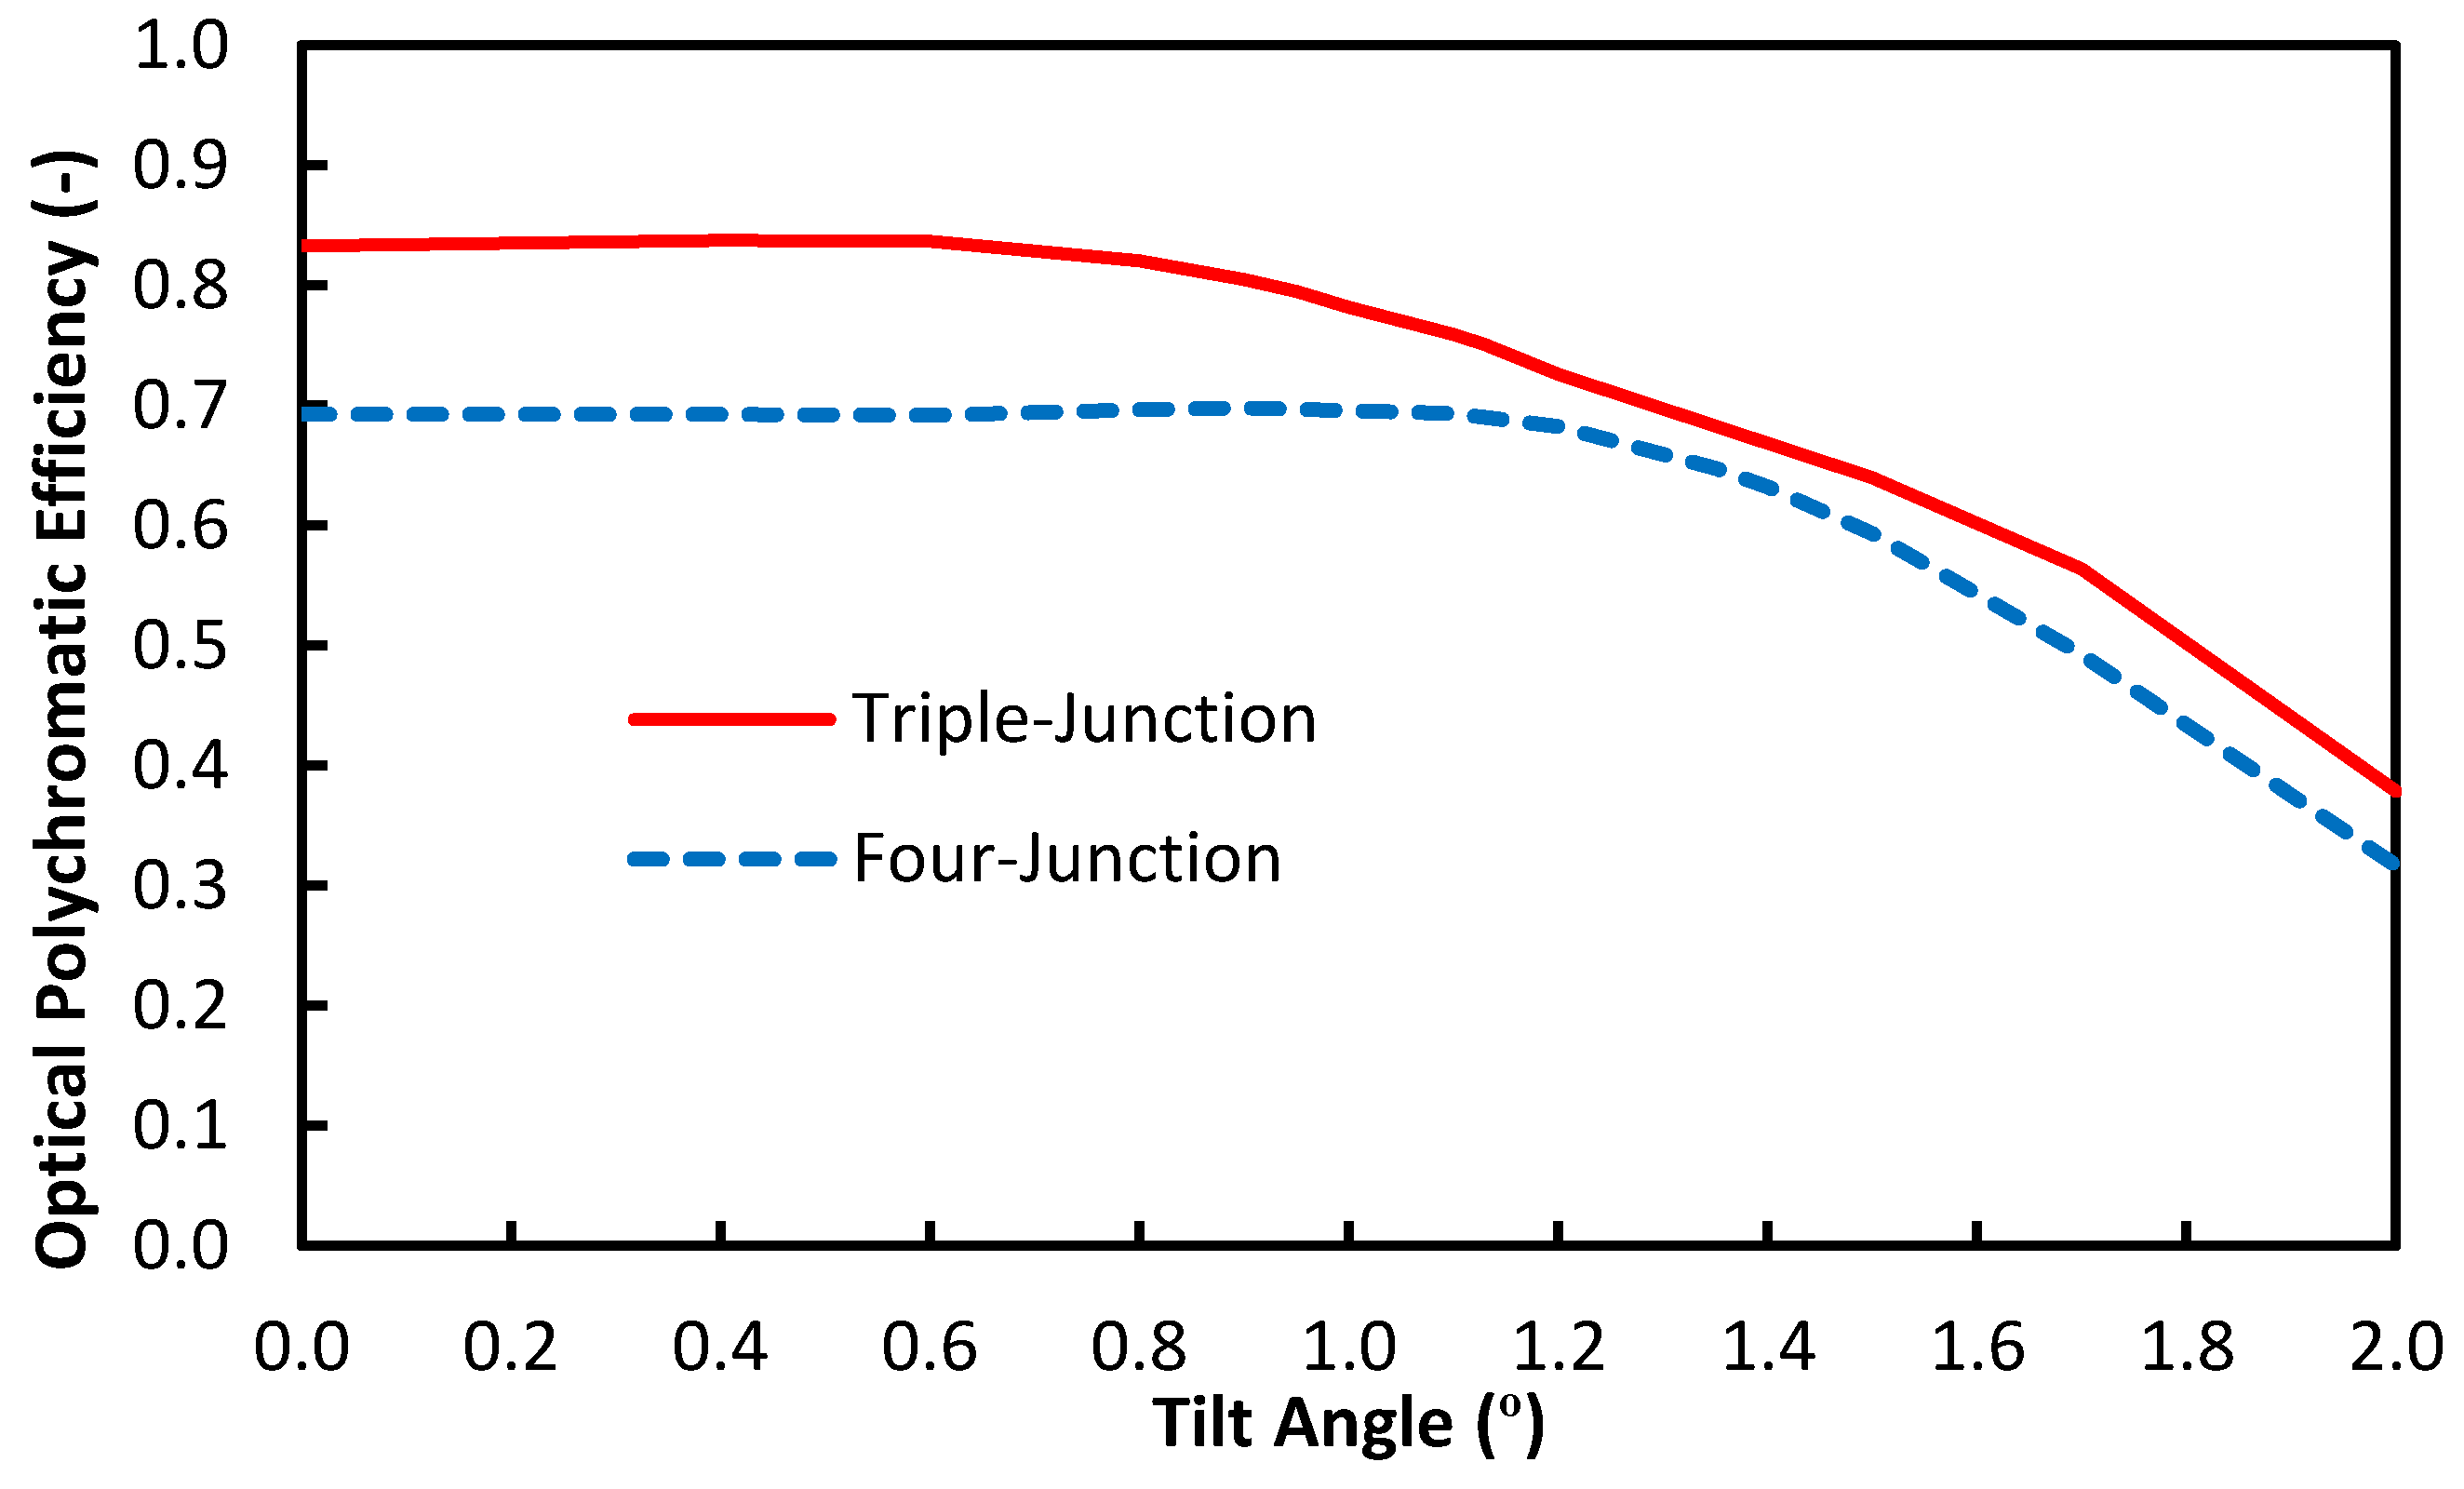
Under normal alignment, the optical polychromatic efficiency values are 0.83 and 0.69 for the TJSC and FJSC cases, respectively. For 1.0° of tilt angle, the
ηopt values are 0.78 and 0.69 for the TJSC and FJSC cases, respectively. In relation to the optical polychromatic efficiency values, the HCPV unit with the FJSC shows lower values than the case with the TJSC for all the tilt angles (see
Figure 5).
This is a consequence of the light absorption in the range of the bottom subcell of the FJSC, with the lowest
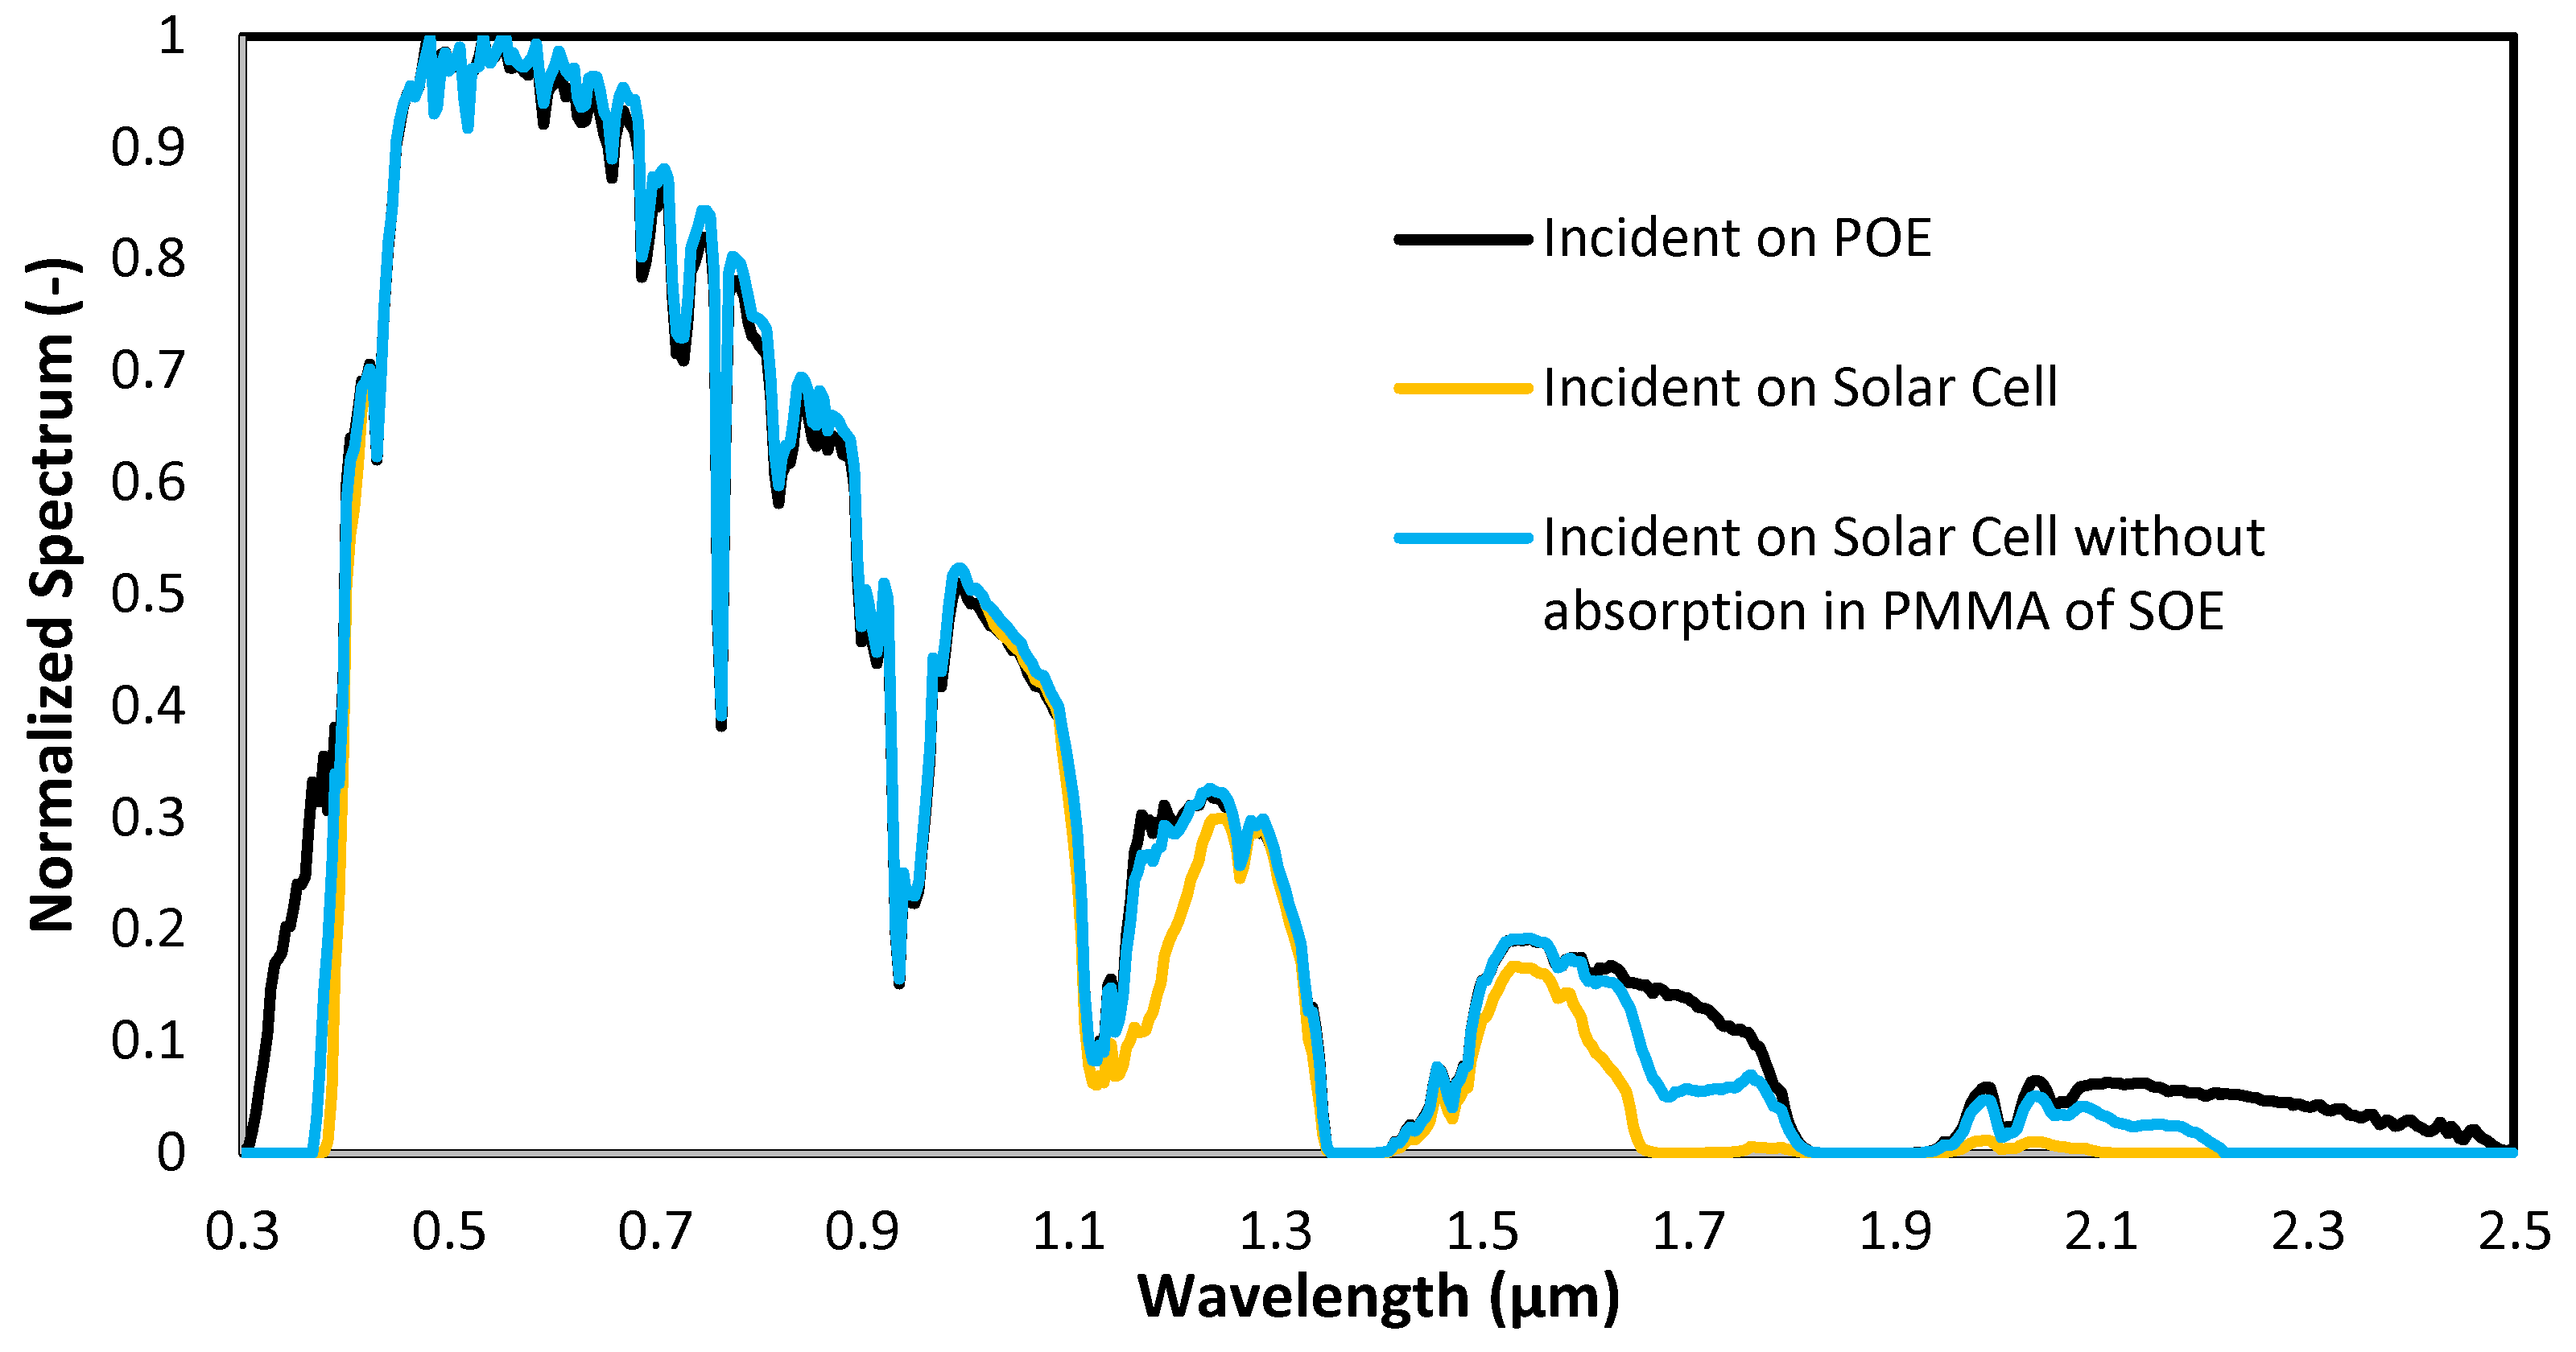
among all the subcells. Specifically, this absorption takes places mainly where the rays traverse more distance within the PMMA, i.e., inside the SOE. Indeed, if the HCPV unit with the FJSC is simulated without light absorption in the PMMA of the SOE, then
ηopt increases up to 0.86. The light absorption inside the PMMA SOE affects, to the greatest extent, the bottom subcell. This can be inferred by comparing the concentrated illumination spectra at the entrance surface of the solar cell for two different cases: (a) without any light absorption inside the PMMA material of the SOE and (b) considering light absorption in the PMMA of the SOE (see
Figure 6). The incident spectrum over the POE is included to demonstrate the effect of the spectral absorption in the concentrator system, especially in the range of the bottom subcell of the FJSC (around 1.1–1.7 μm). Therefore, it can be inferred that PMMA SOEs are not appropriate for an FJSC, in general.
The differences in the ηopt values found, depending on the MJSC used, shows that the capability of the optical system to concentrate sunrays for a later photovoltaic conversion is not an exclusive property of the optical concentrator system but of the concentrator system-solar cell combination.
Regarding the acceptance angle values, i.e., the angle at which the optical polychromatic efficiency is 10% lower than under normal alignment, these are 1.13° and 1.42° for the TJSC and the FJSC, respectively. This last greater acceptance angle value is a consequence of the reduced
ηopt value under normal alignment.
Table 5 summarizes these most relevant values.
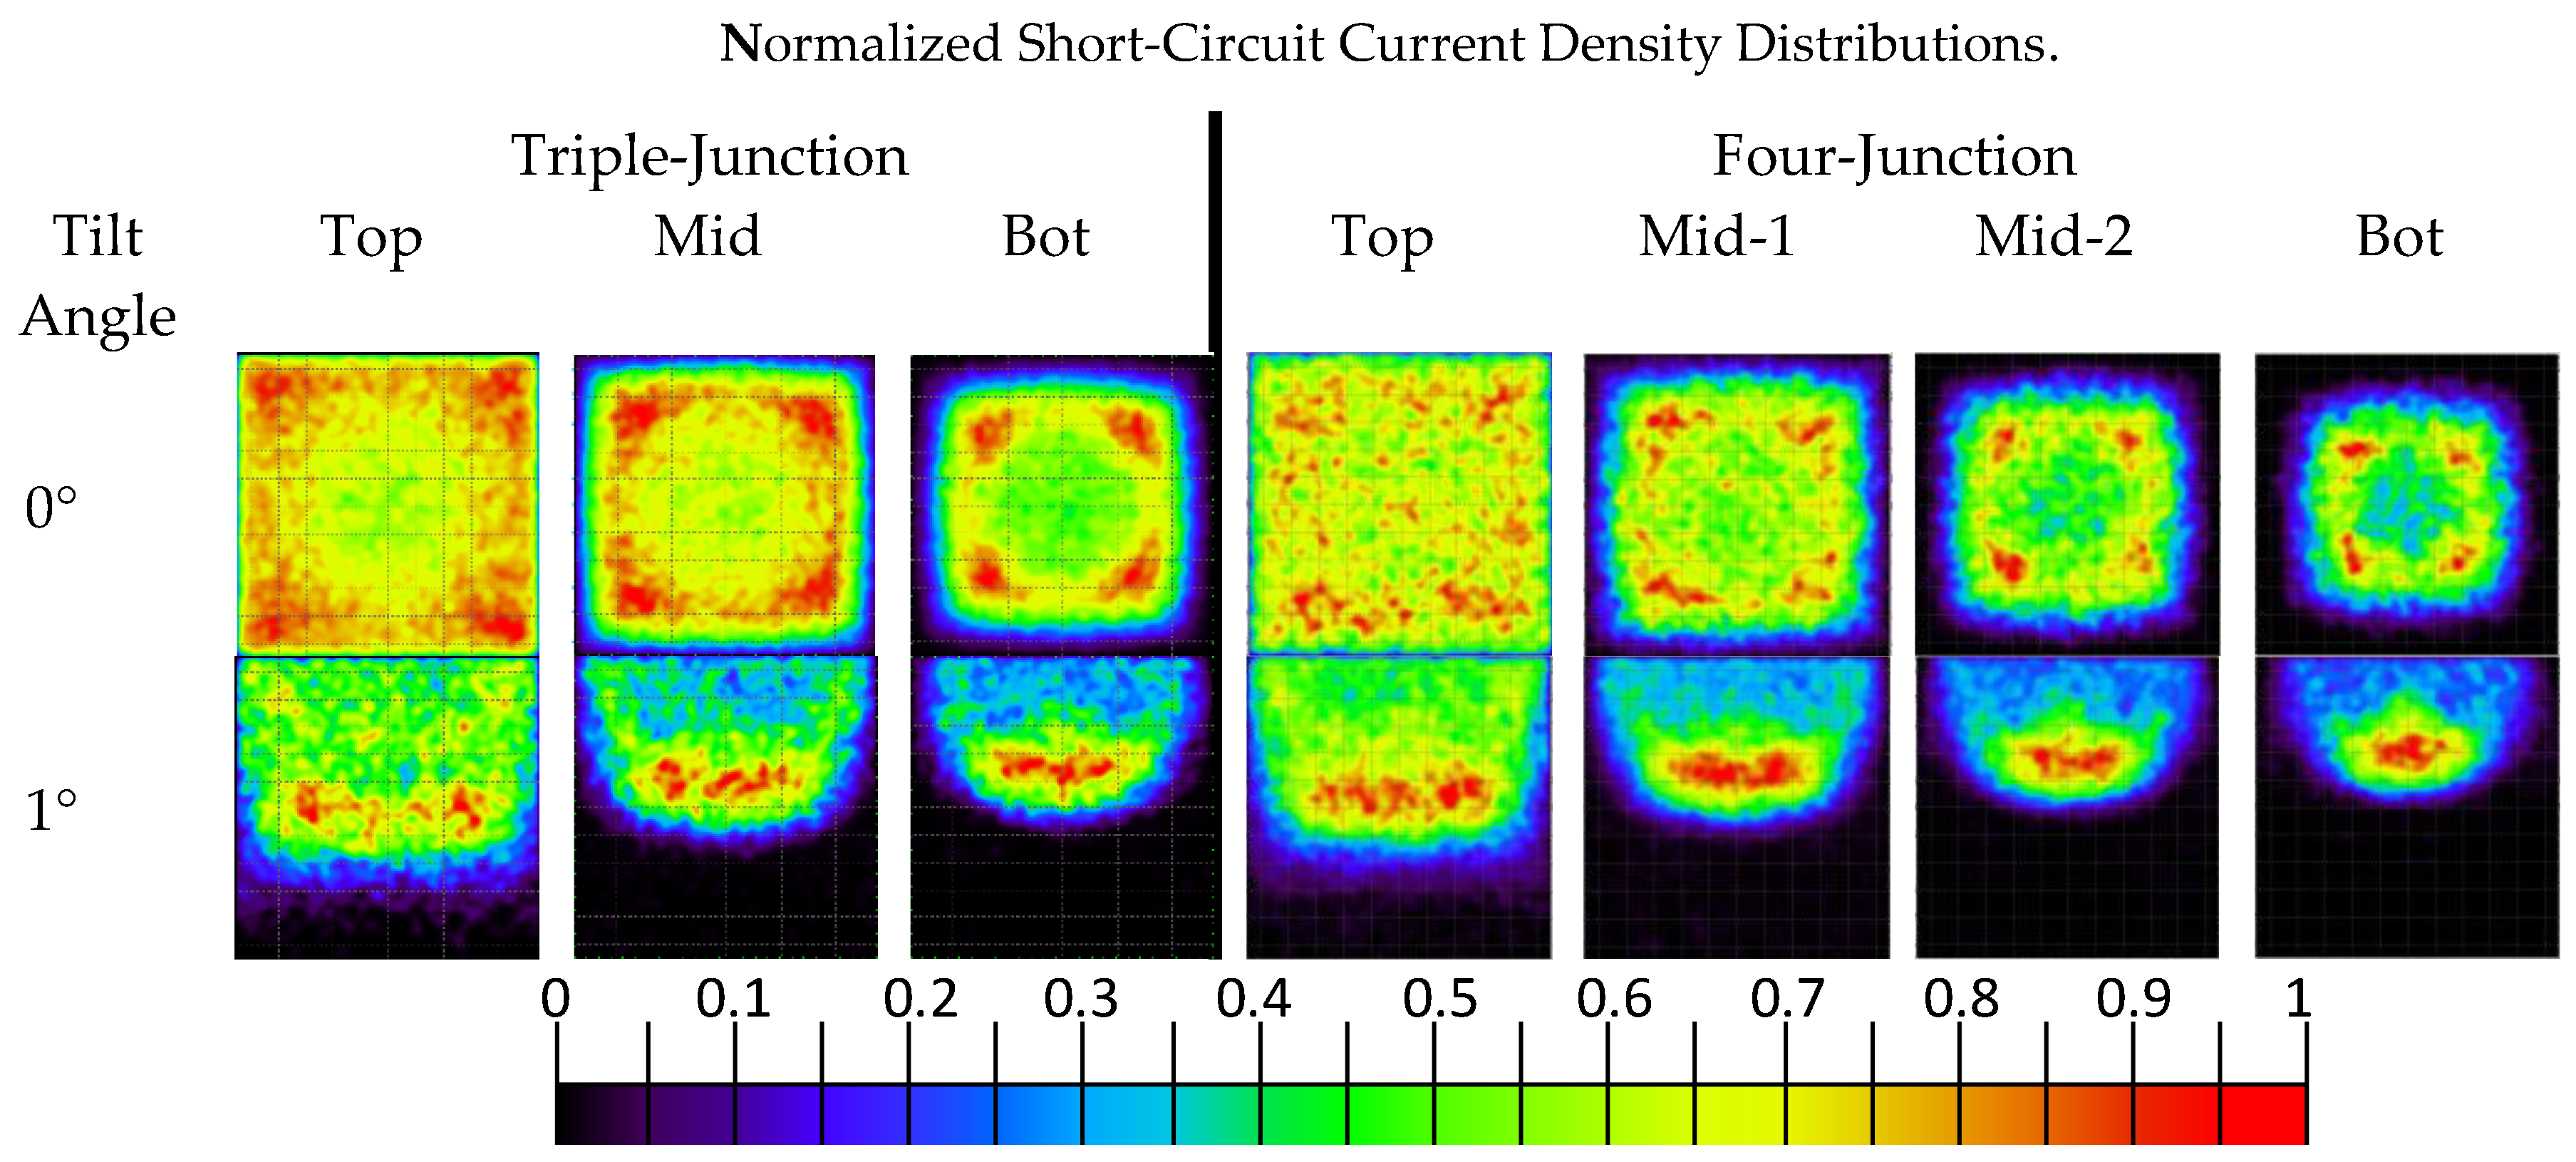
Finally, although the irradiance uniformity over the solar cell is independent of the kind of MJSC used, its effect on the current generation depends on the MJSC technology. This can be analyzed through the
spatial distributions of each subcell. Since the subcells of the TJSC and the FJSC have different spectral responses to each other, different
spatial distributions are expected, in principle.
Figure 7 presents the normalized
spatial distributions of each subcell for both cases of HCPV units. These diagrams are obtained under normal alignment and under 1° of tilt angle with respect to the incoming light. Comparing both MJSCs, these present similar uniformity distributions of the equivalent subcells in general. Both top subcells show similar uniformity patterns, as well as mid and mid-1 subcells are similar to each other too, whereas both mid-2 and bot (FJSC) are similar to the pattern of bot (TJSC), although bot (FJSC) shows a reduced current-generating surface.
These
spatial distributions of
Figure 7 can be quantified through the parameter
PAR (Equation (5)), obtaining the results gathered in
Table 6. Under normal incidence of the light, both MJSC show similar
PAR values of the equivalent subcells in general. The values range from a minimum of
PAR = 2 (top subcells) to a maximum of
PAR = 4 (bot subcells). Under 1° of tilt angle, both MJSC present similar
PAR values to each other, with a total range from
PAR = 3 (top) to 8 (FJSC(bot)). Those greater
PAR values denote much less uniformity in the current generation.
5. Conclusions and Future Work
An optical modelling, previously developed by the authors, is applied to a typical PMMA Fresnel-based HCPV system equipped with a refractive PMMA secondary optical element (SOE) coupled to a multi-junction concentrator solar cell (MJSC). The same concentrator optical system is simulated alternatively with two different MJSCs: (a) a triple-junction concentrator solar cell (TJSC), and (b) a wafer bonded four-junction concentrator solar cell (FJSC). The SILO SOE has a small modification and is called SILO-Pyramid, due to its pyramidal basis.
Applying the optical modelling and through ray tracing simulations, the performances of both MJSCs can be compared to each other. The optical simulations show a dramatic reduction in the short-circuit current density () of the bottom subcell of the FJSC due to the light absorption in the PMMA material of the SOE, which mainly takes place in the wavelength range of the spectral sensitivity of this subcell. This lower value implies a reduction in the optical polychromatic efficiency (ηopt) up to 69%, instead of the 83% of the TJSC. Therefore, PMMA SOEs may not be suitable for FJSCs in general.
Regarding the spectral conditions at which both MJSCs are working, spectral matching ratio (SMR) parameters are calculated. Moreover, the angular behavior with respect to the simulated incoming light is analyzed at the level of the different values for each subcell of the SMR values and of the ηopt. On the one hand, for the FJSC, the angular performance of the values shows current limitation by the bottom subcell for all the tilted angles analyzed (up to 2°). On the other hand, the different SMR values are never simultaneously equal to one for none of the MJSCs analyzed; thus, equivalent conditions to the standard spectrum are never achieved in the concentrated light over the solar cell. Moreover, the HCPV unit with the FJSC shows a higher acceptance angle value (1.42°) than in the case of the TJSC (1.13°) due to its lower ηopt under normal incidence.
In relation to the uniformity of the concentrated light over the solar cell, spatial distributions are obtained for each subcell in both cases (TJSC and FJSC) showing similar results—demonstrated with the calculation of the PAR (maximum/average) parameter.
For future work, this kind of theoretical analysis has to be extended to other concentrator systems to be equipped with FJSCs, since they may perform in a different way than those equipped with TJSCs. This kind of analysis may enable an optimization of a concentrator optical system and the selection of the most suitable concentrator architectures for FJSCs.

 ,
, 


