Experimental Study on Sensitivity of Porosity to Pressure and Particle Size in Loose Coal Media

 ,
,  ,
,
Abstract
1. Introduction
2. Materials and Methods
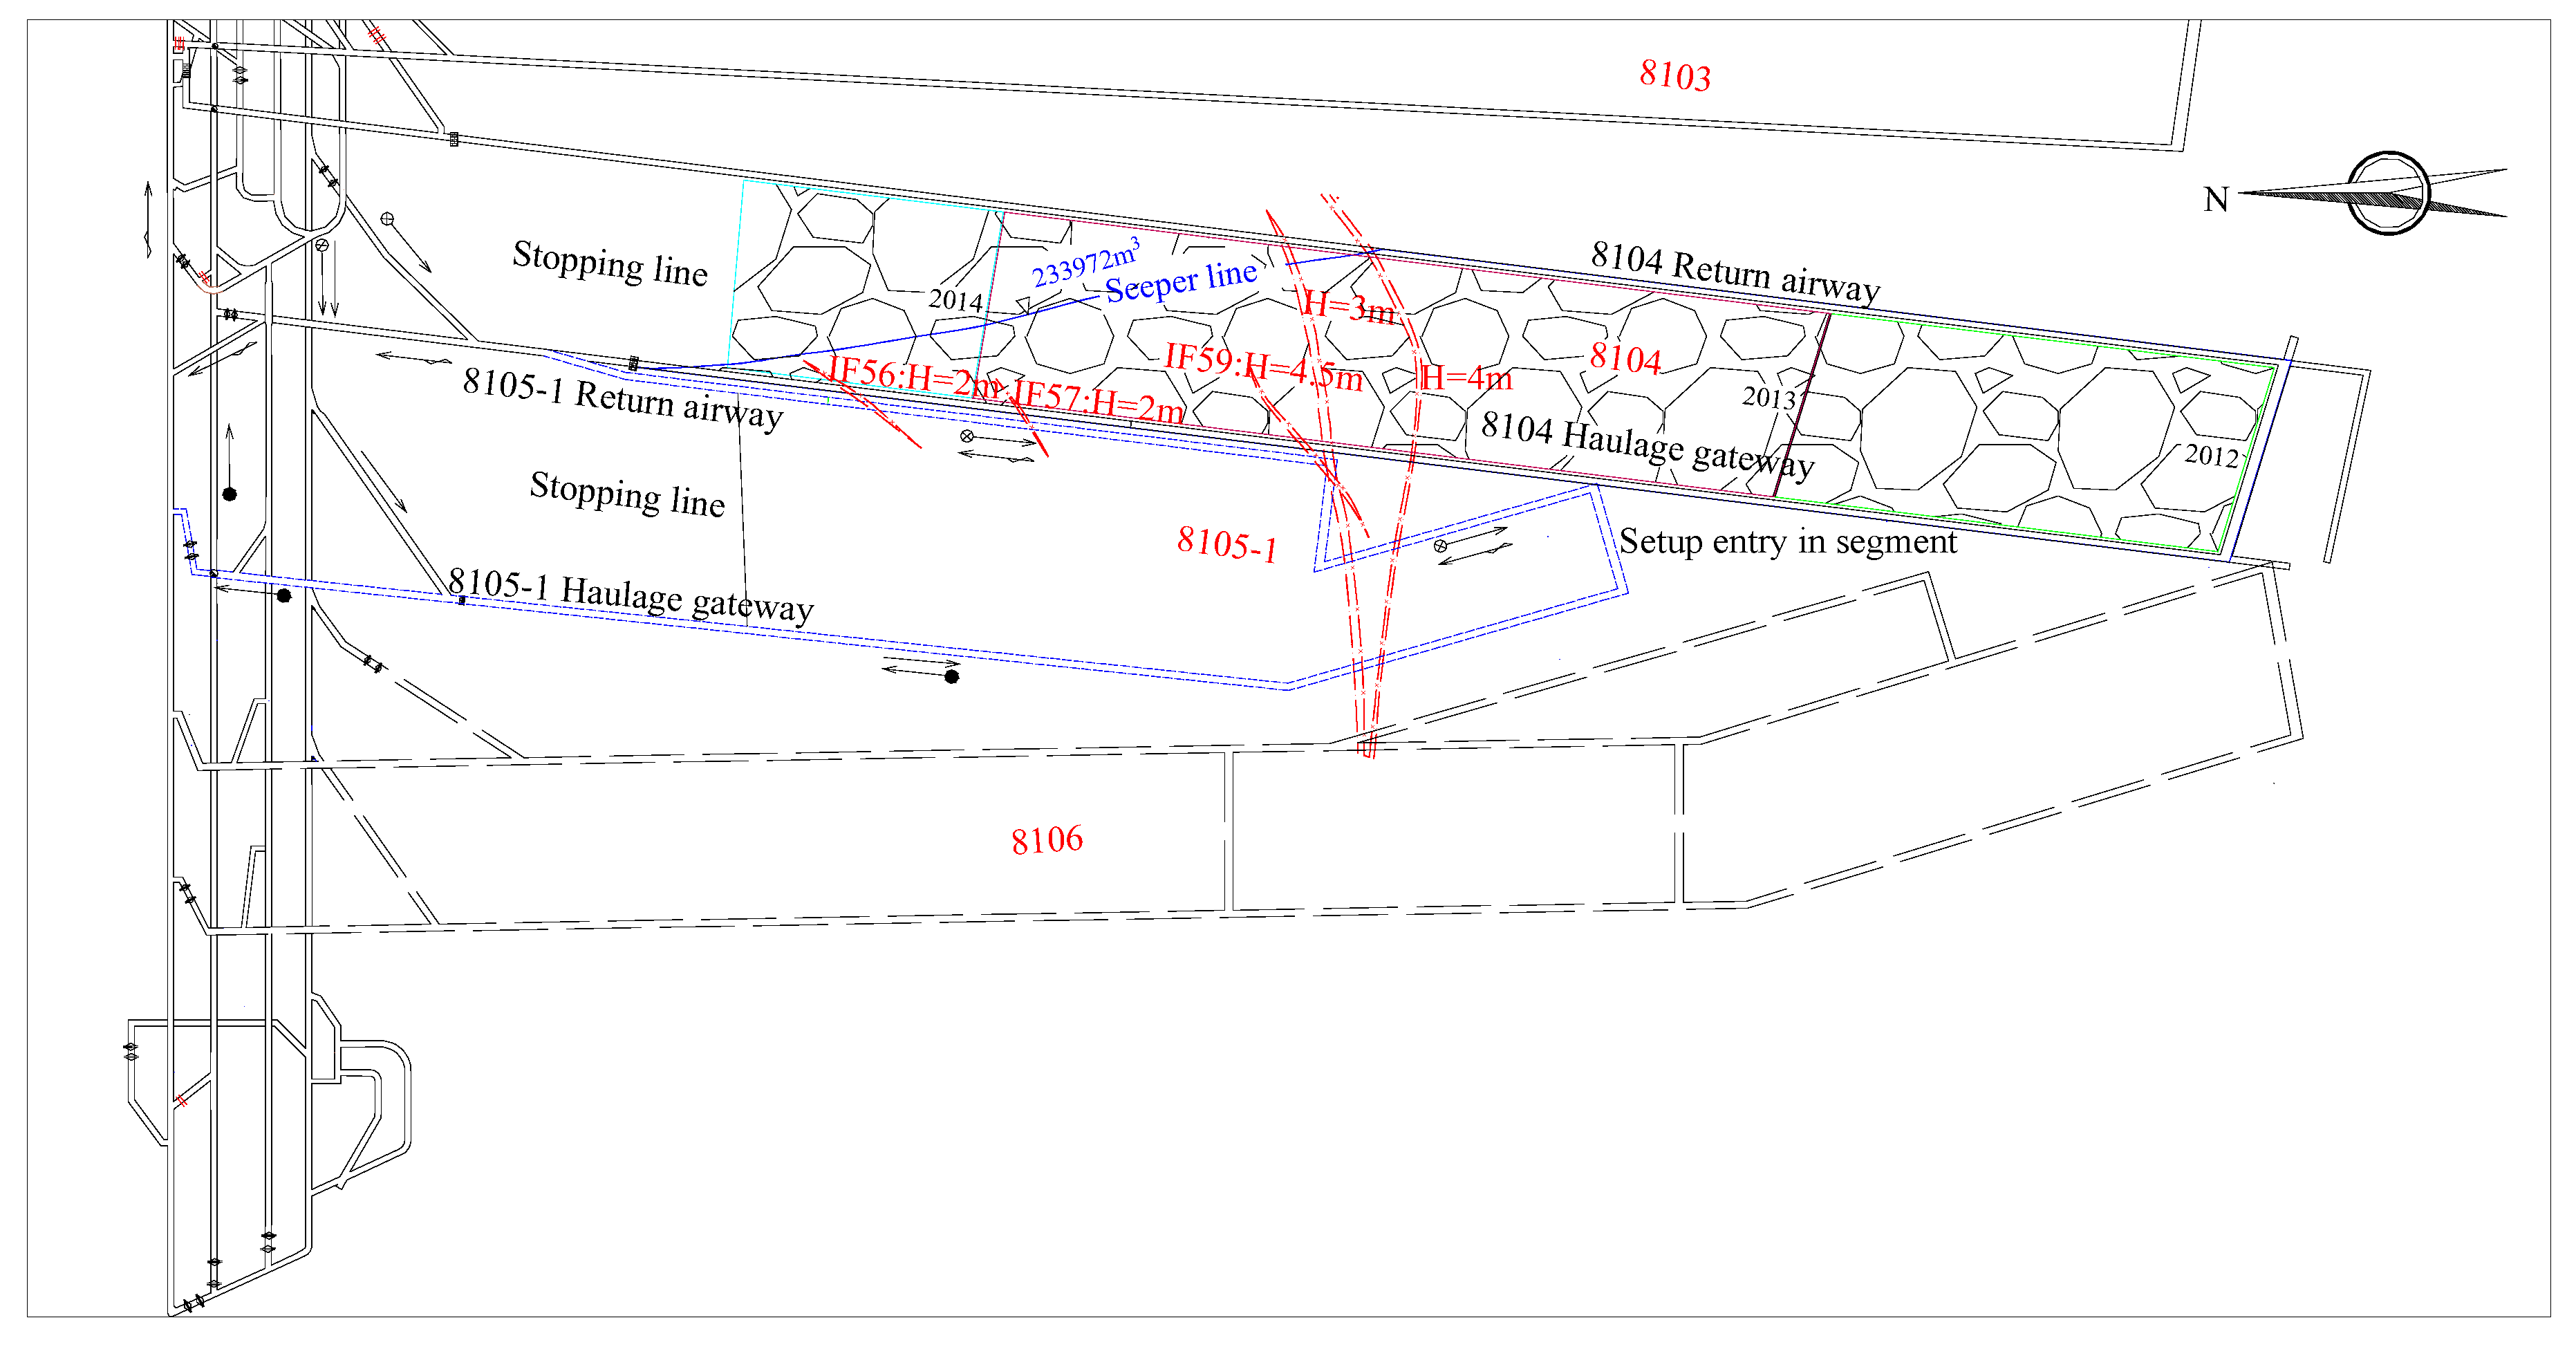
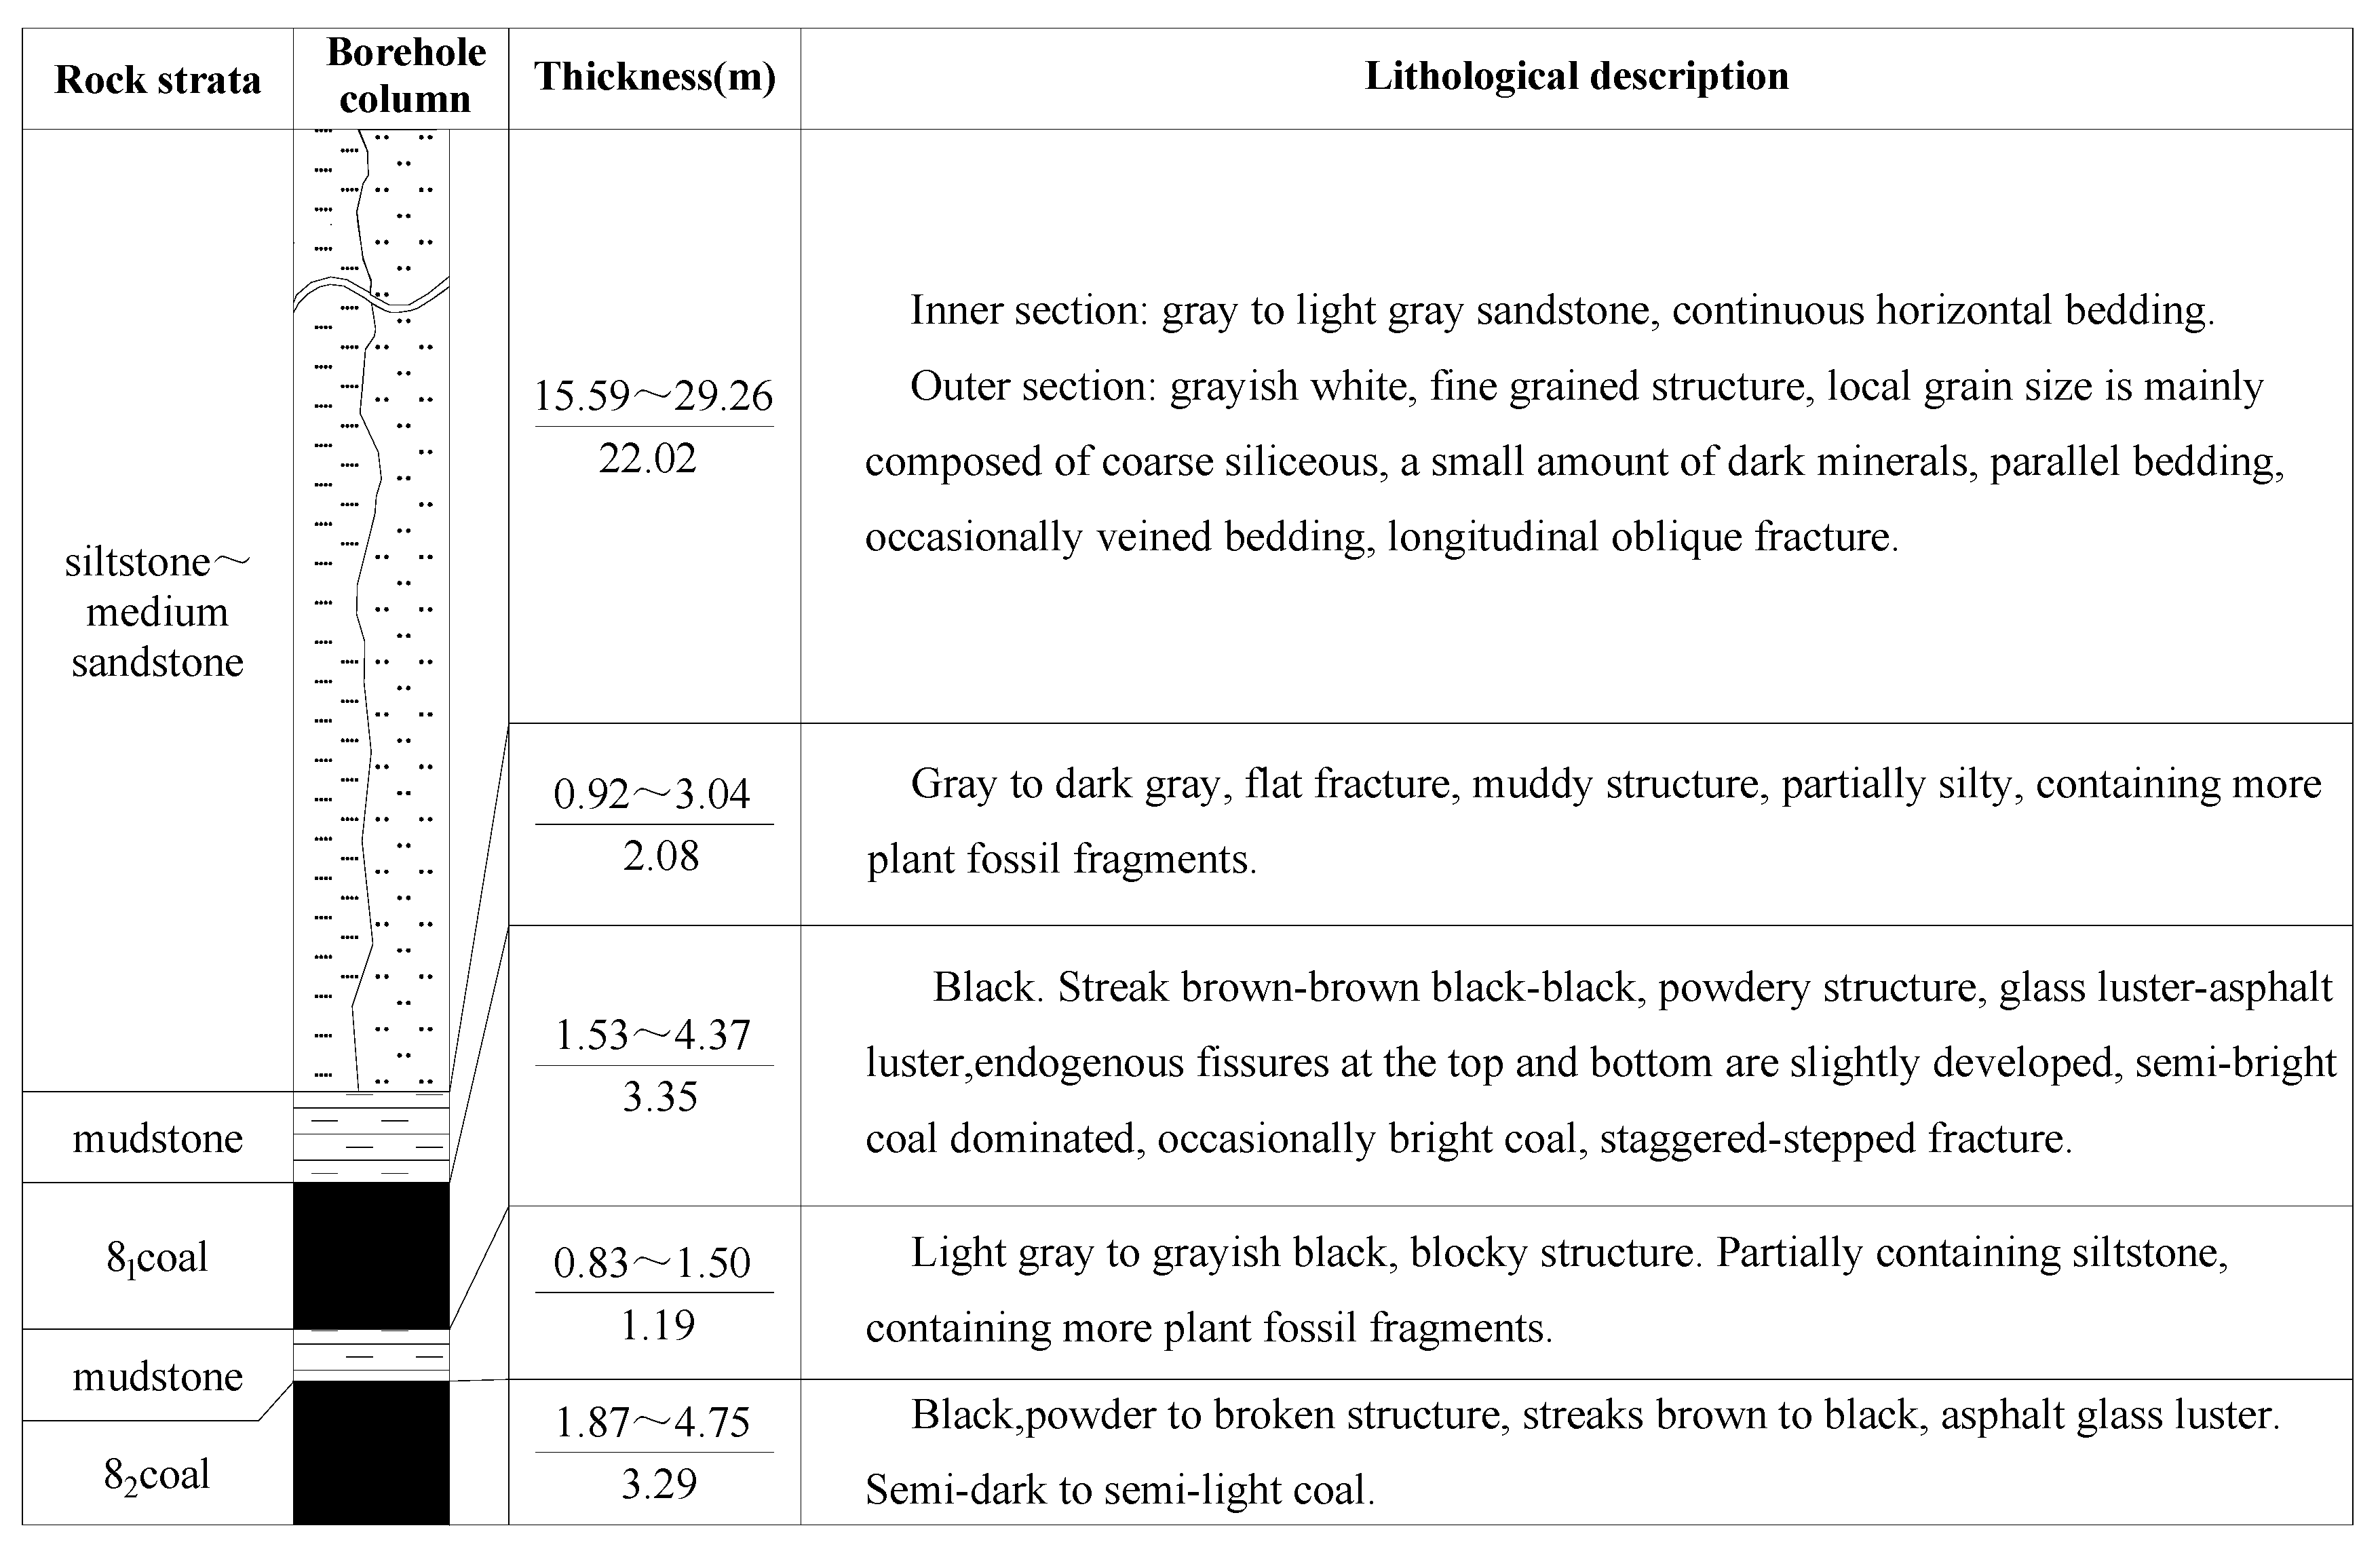
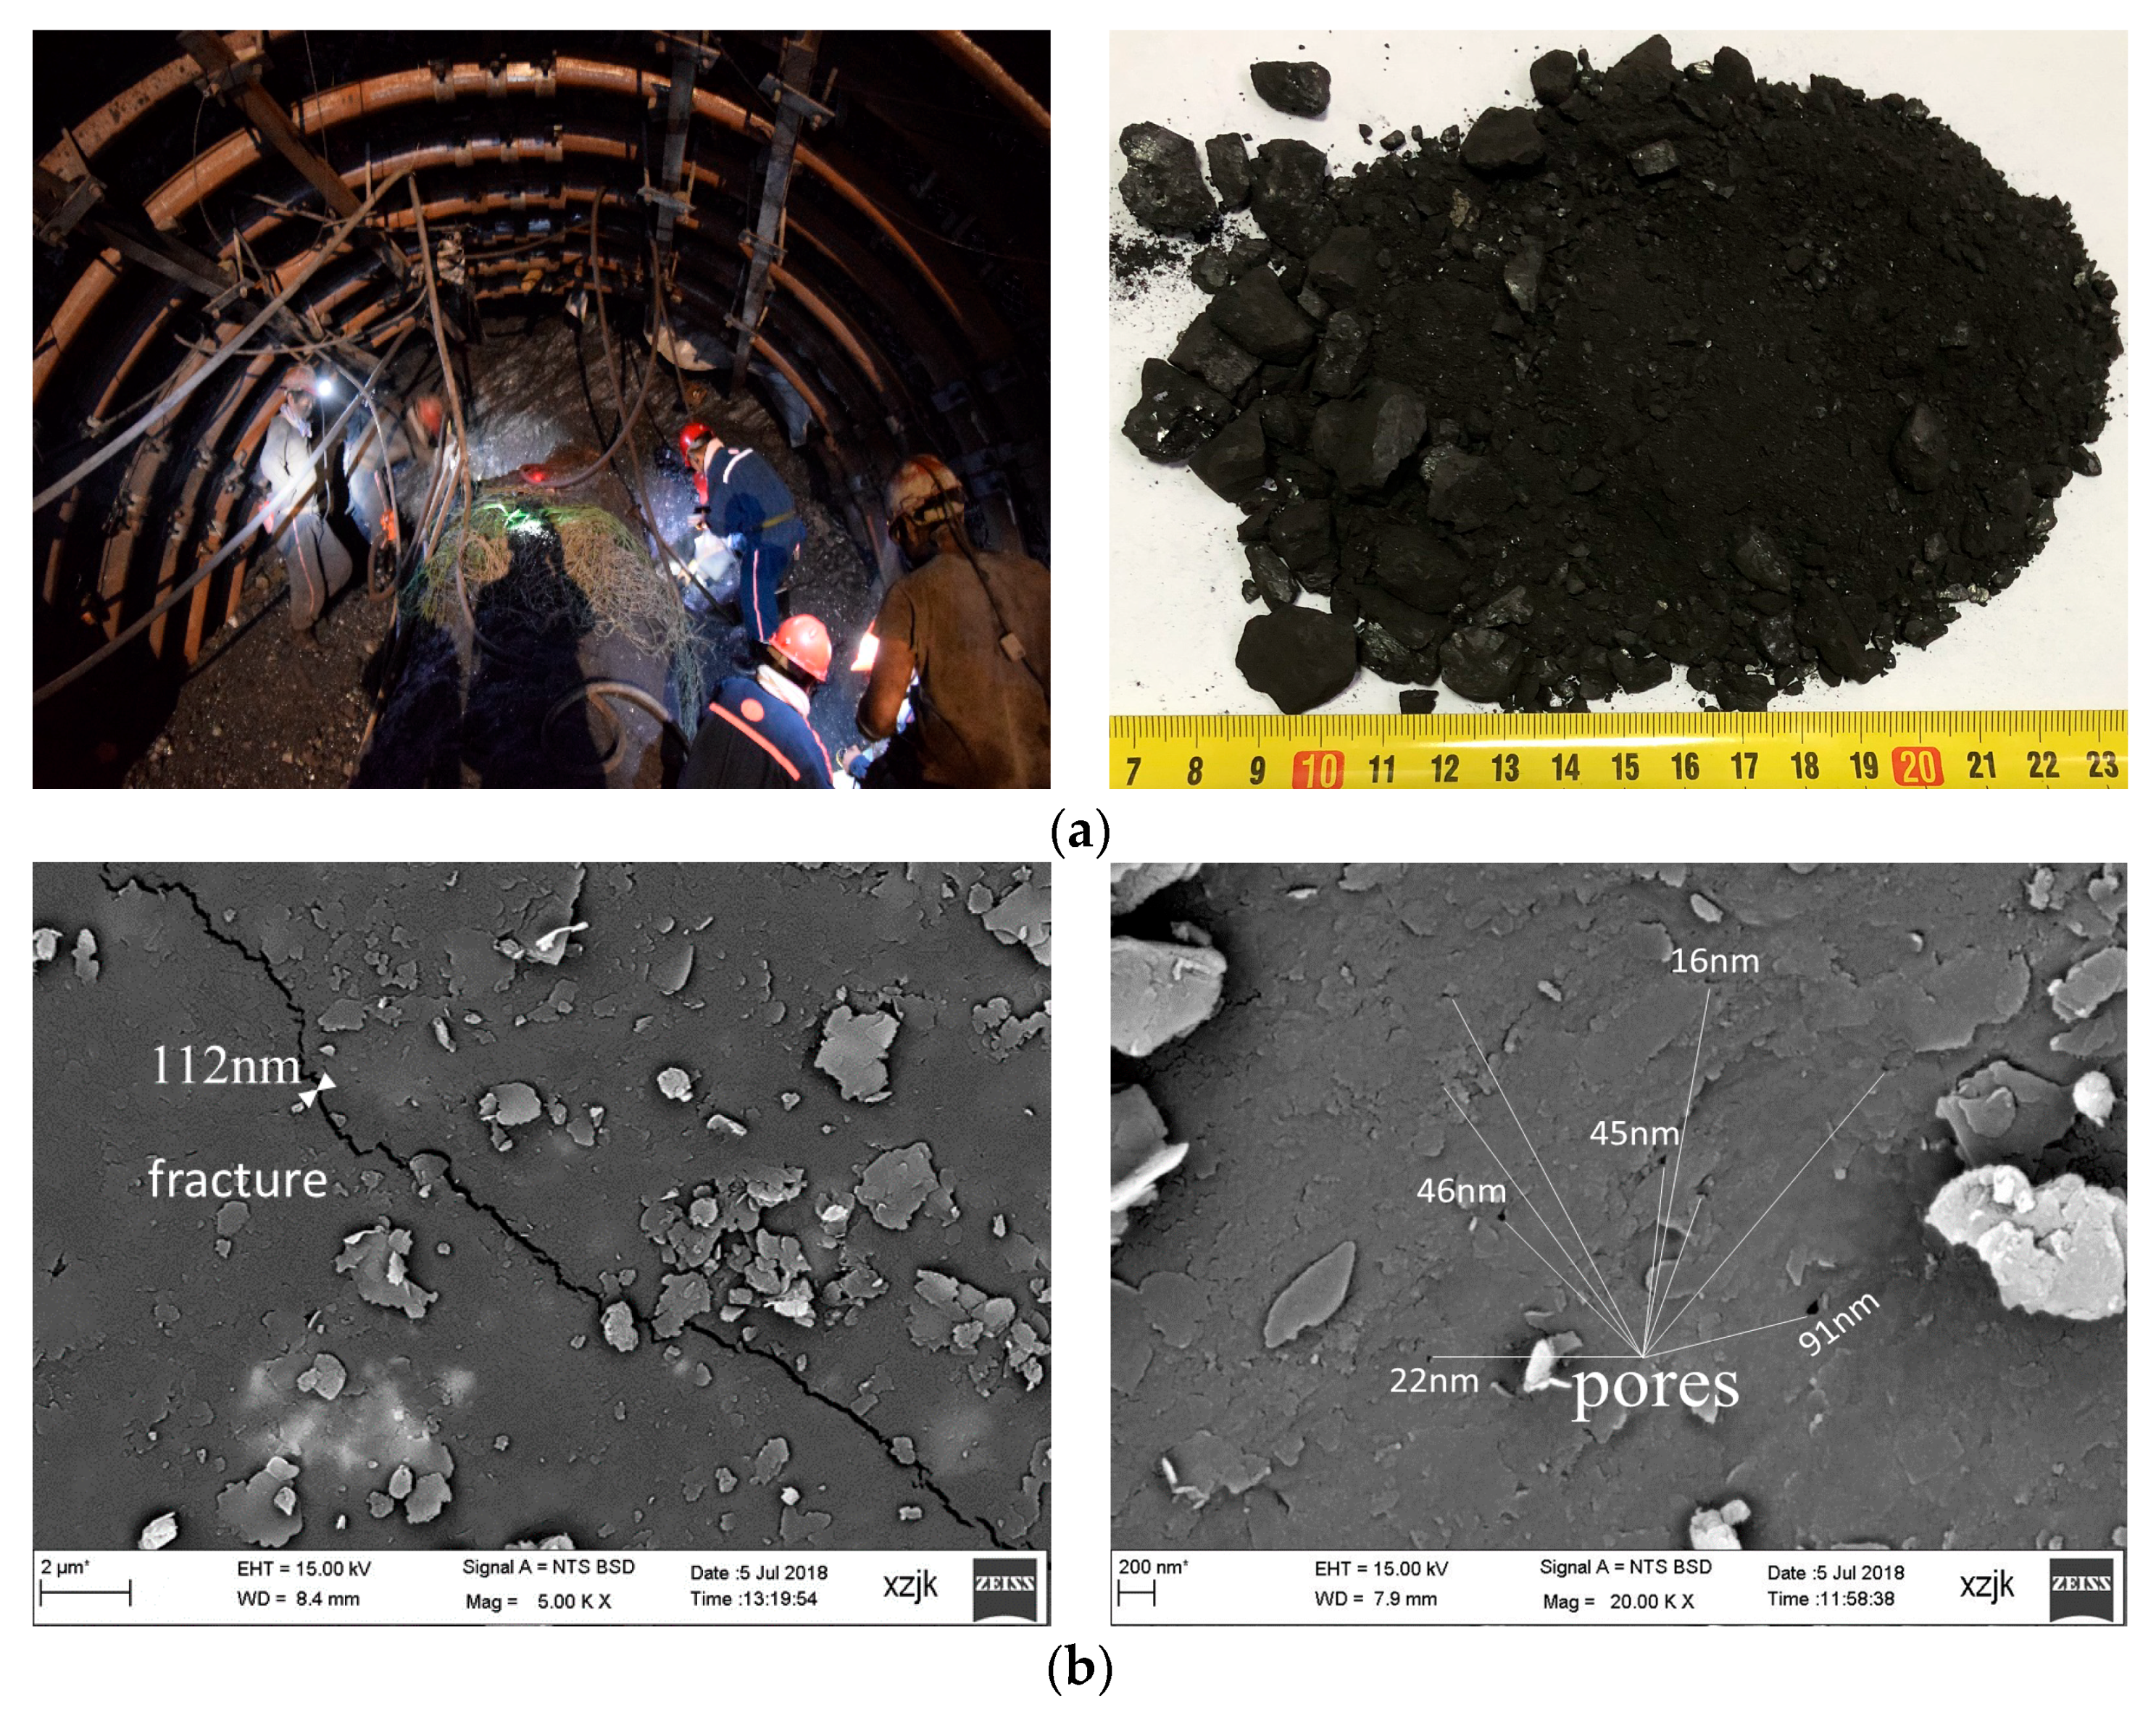
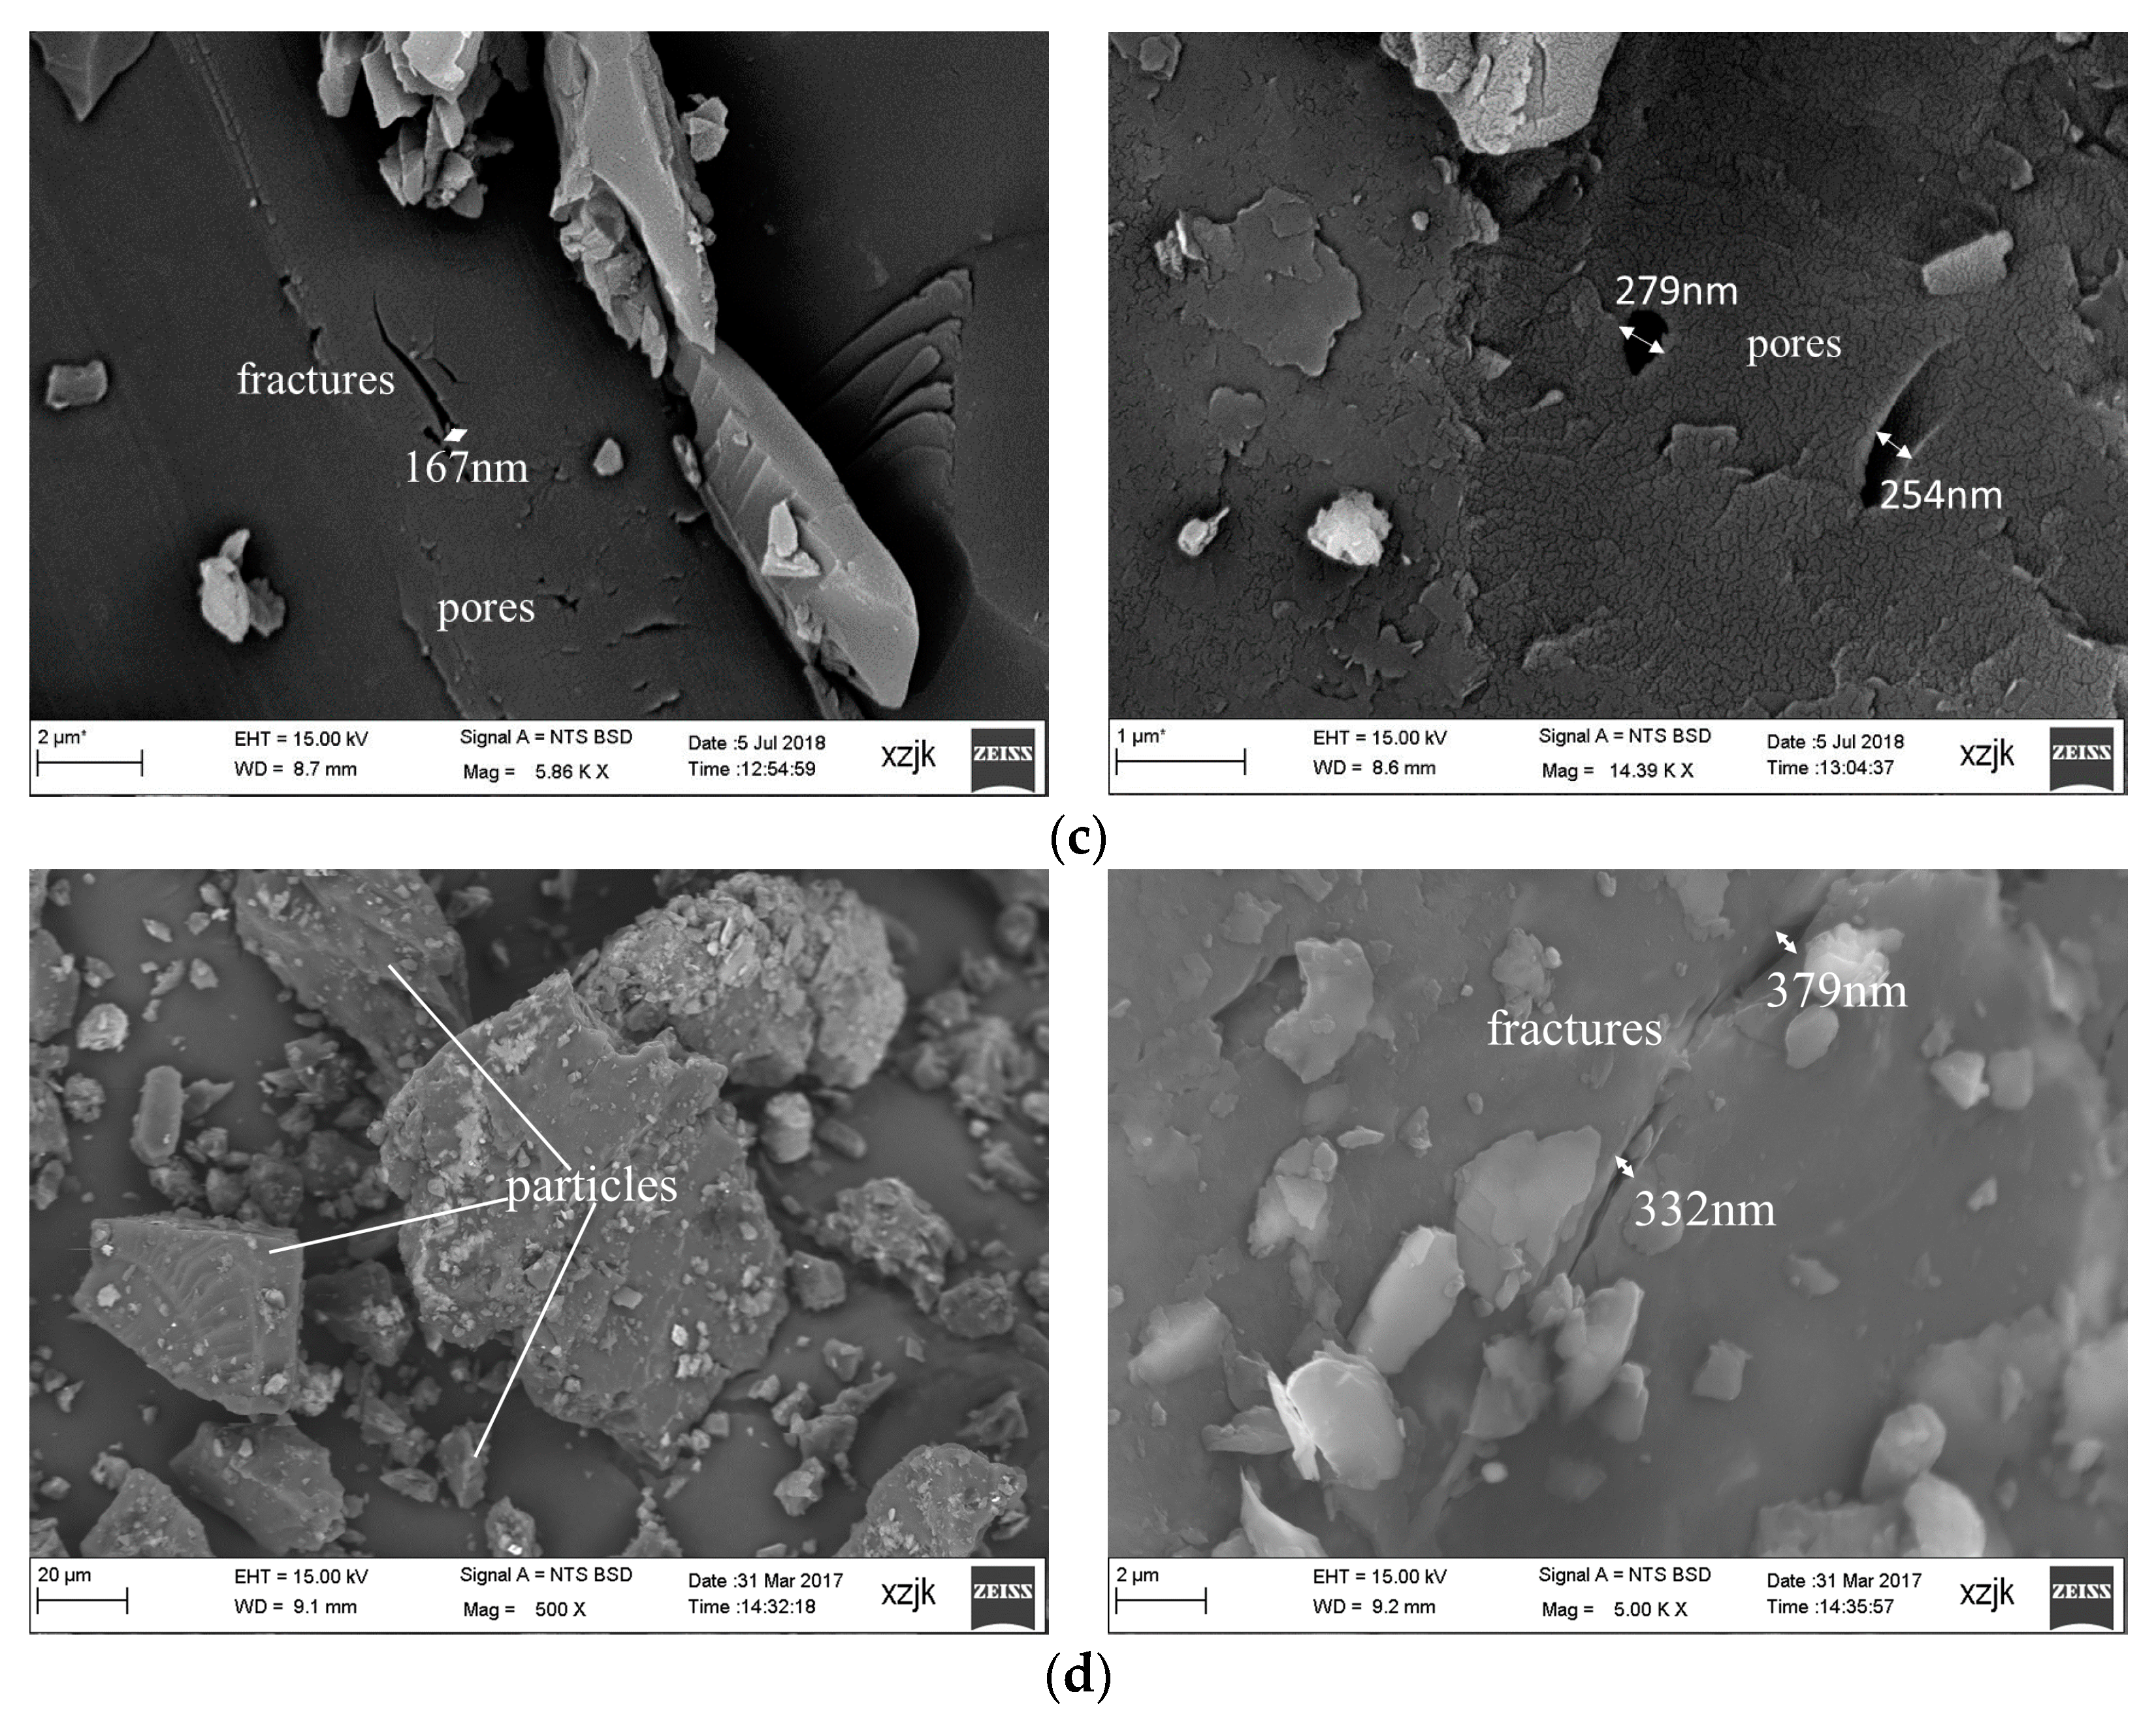
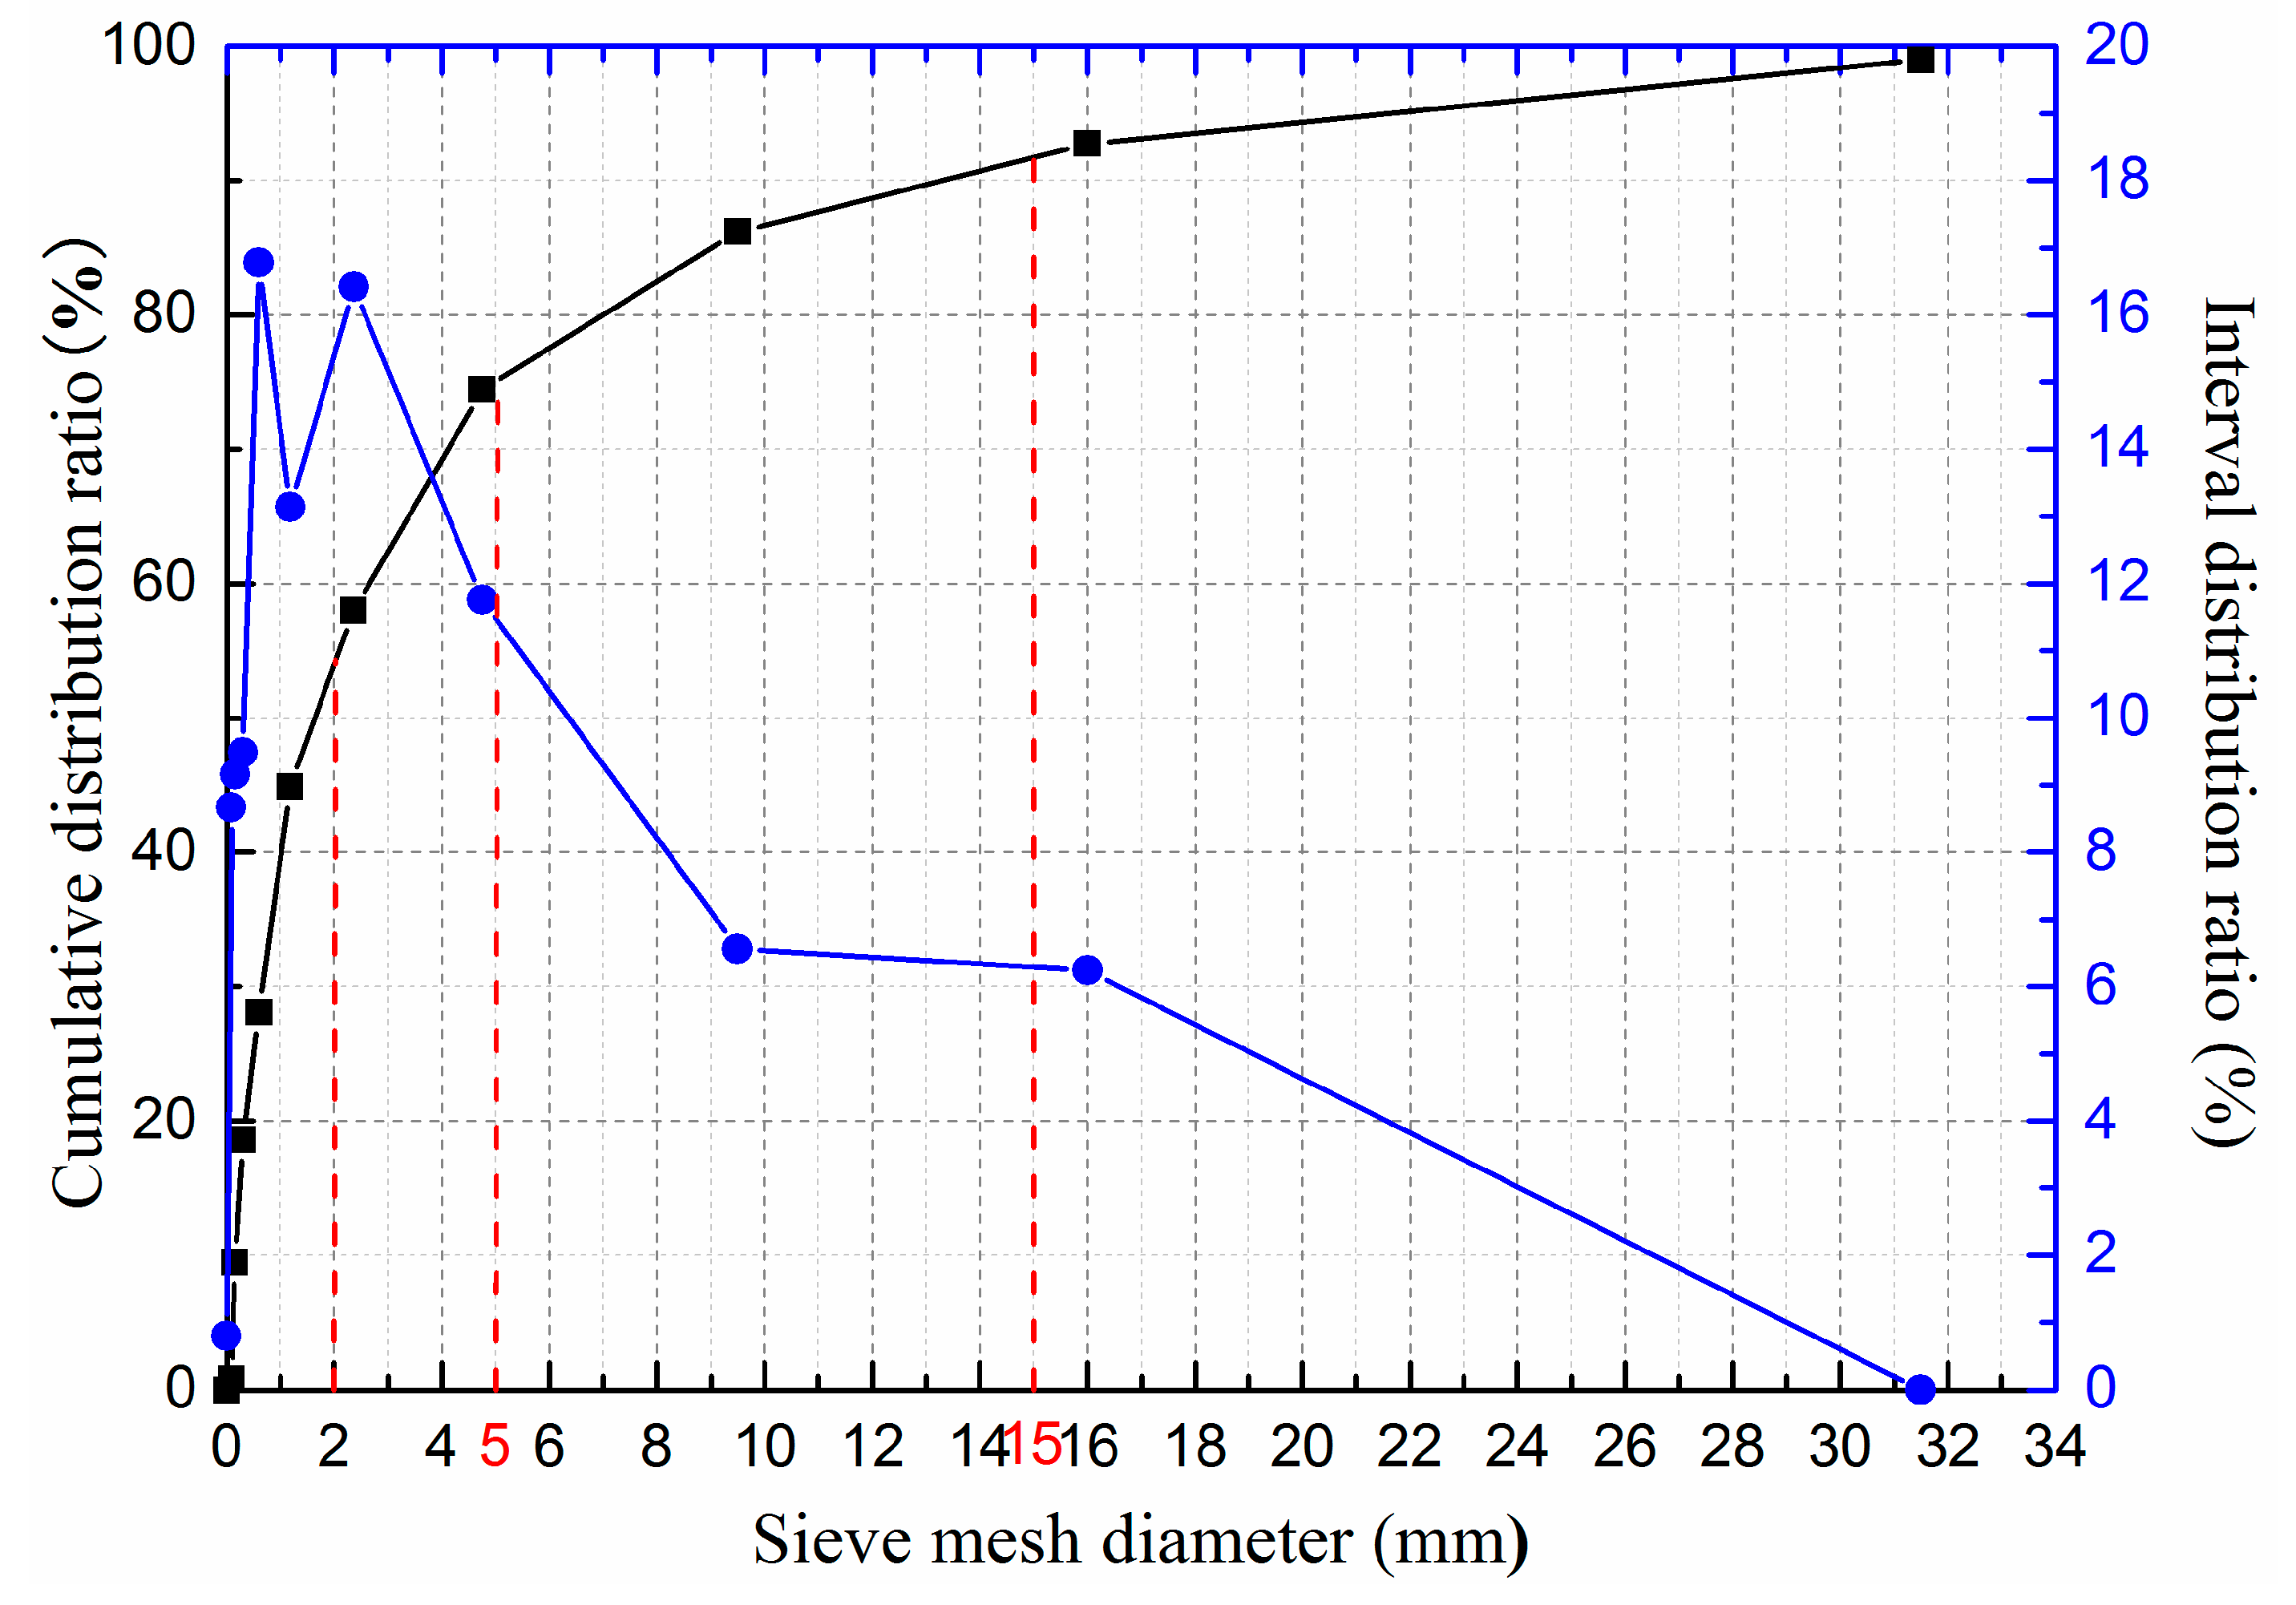
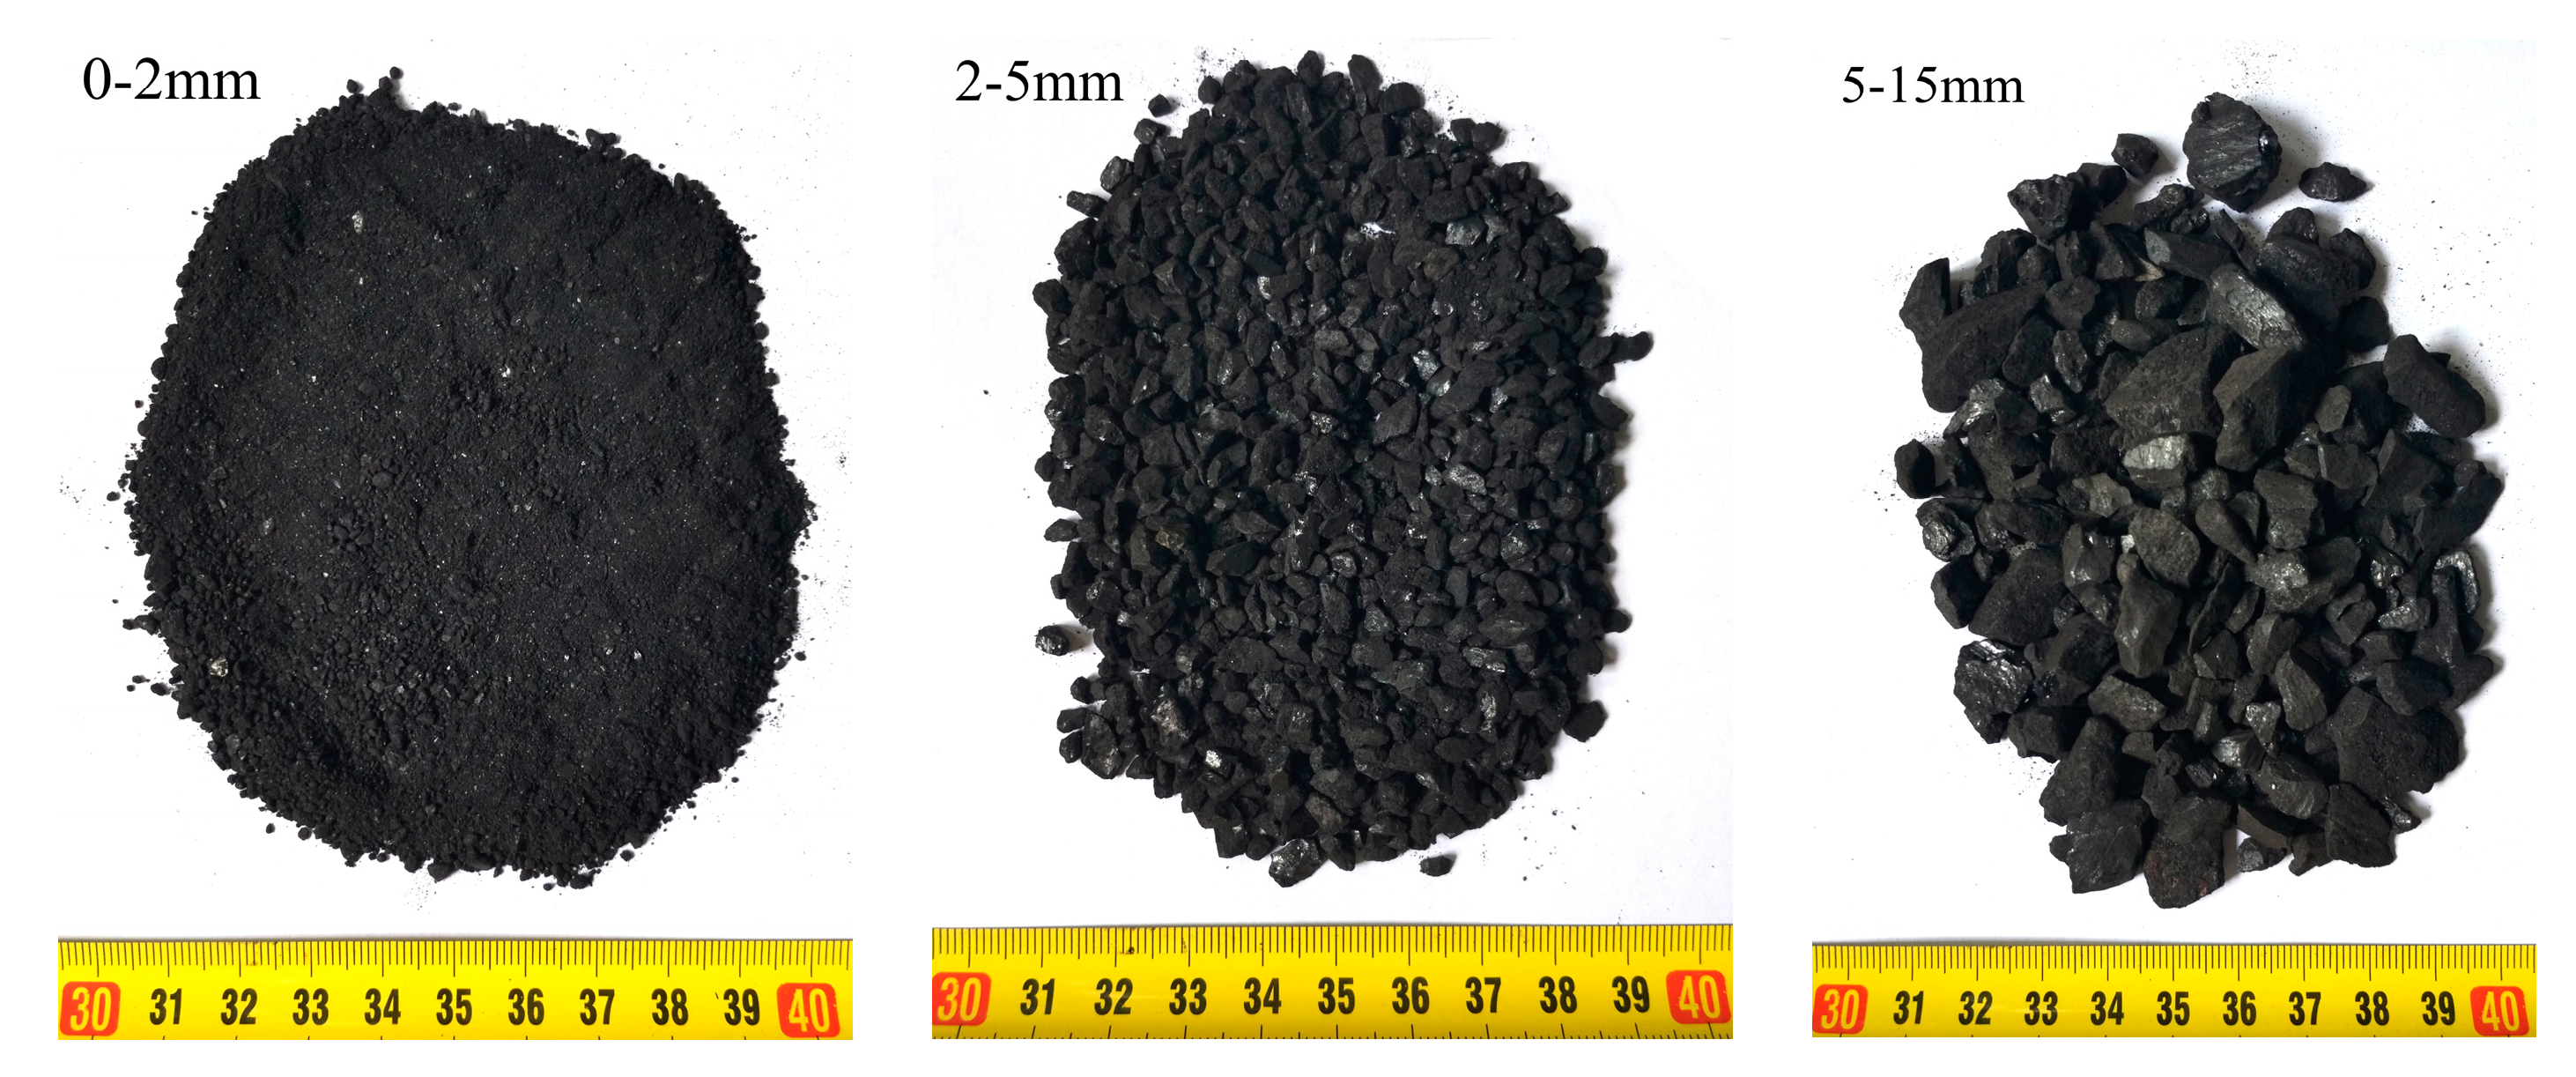
2.1. Materials
2.2. Methods
2.2.1. Porosity in the Particle Matrix
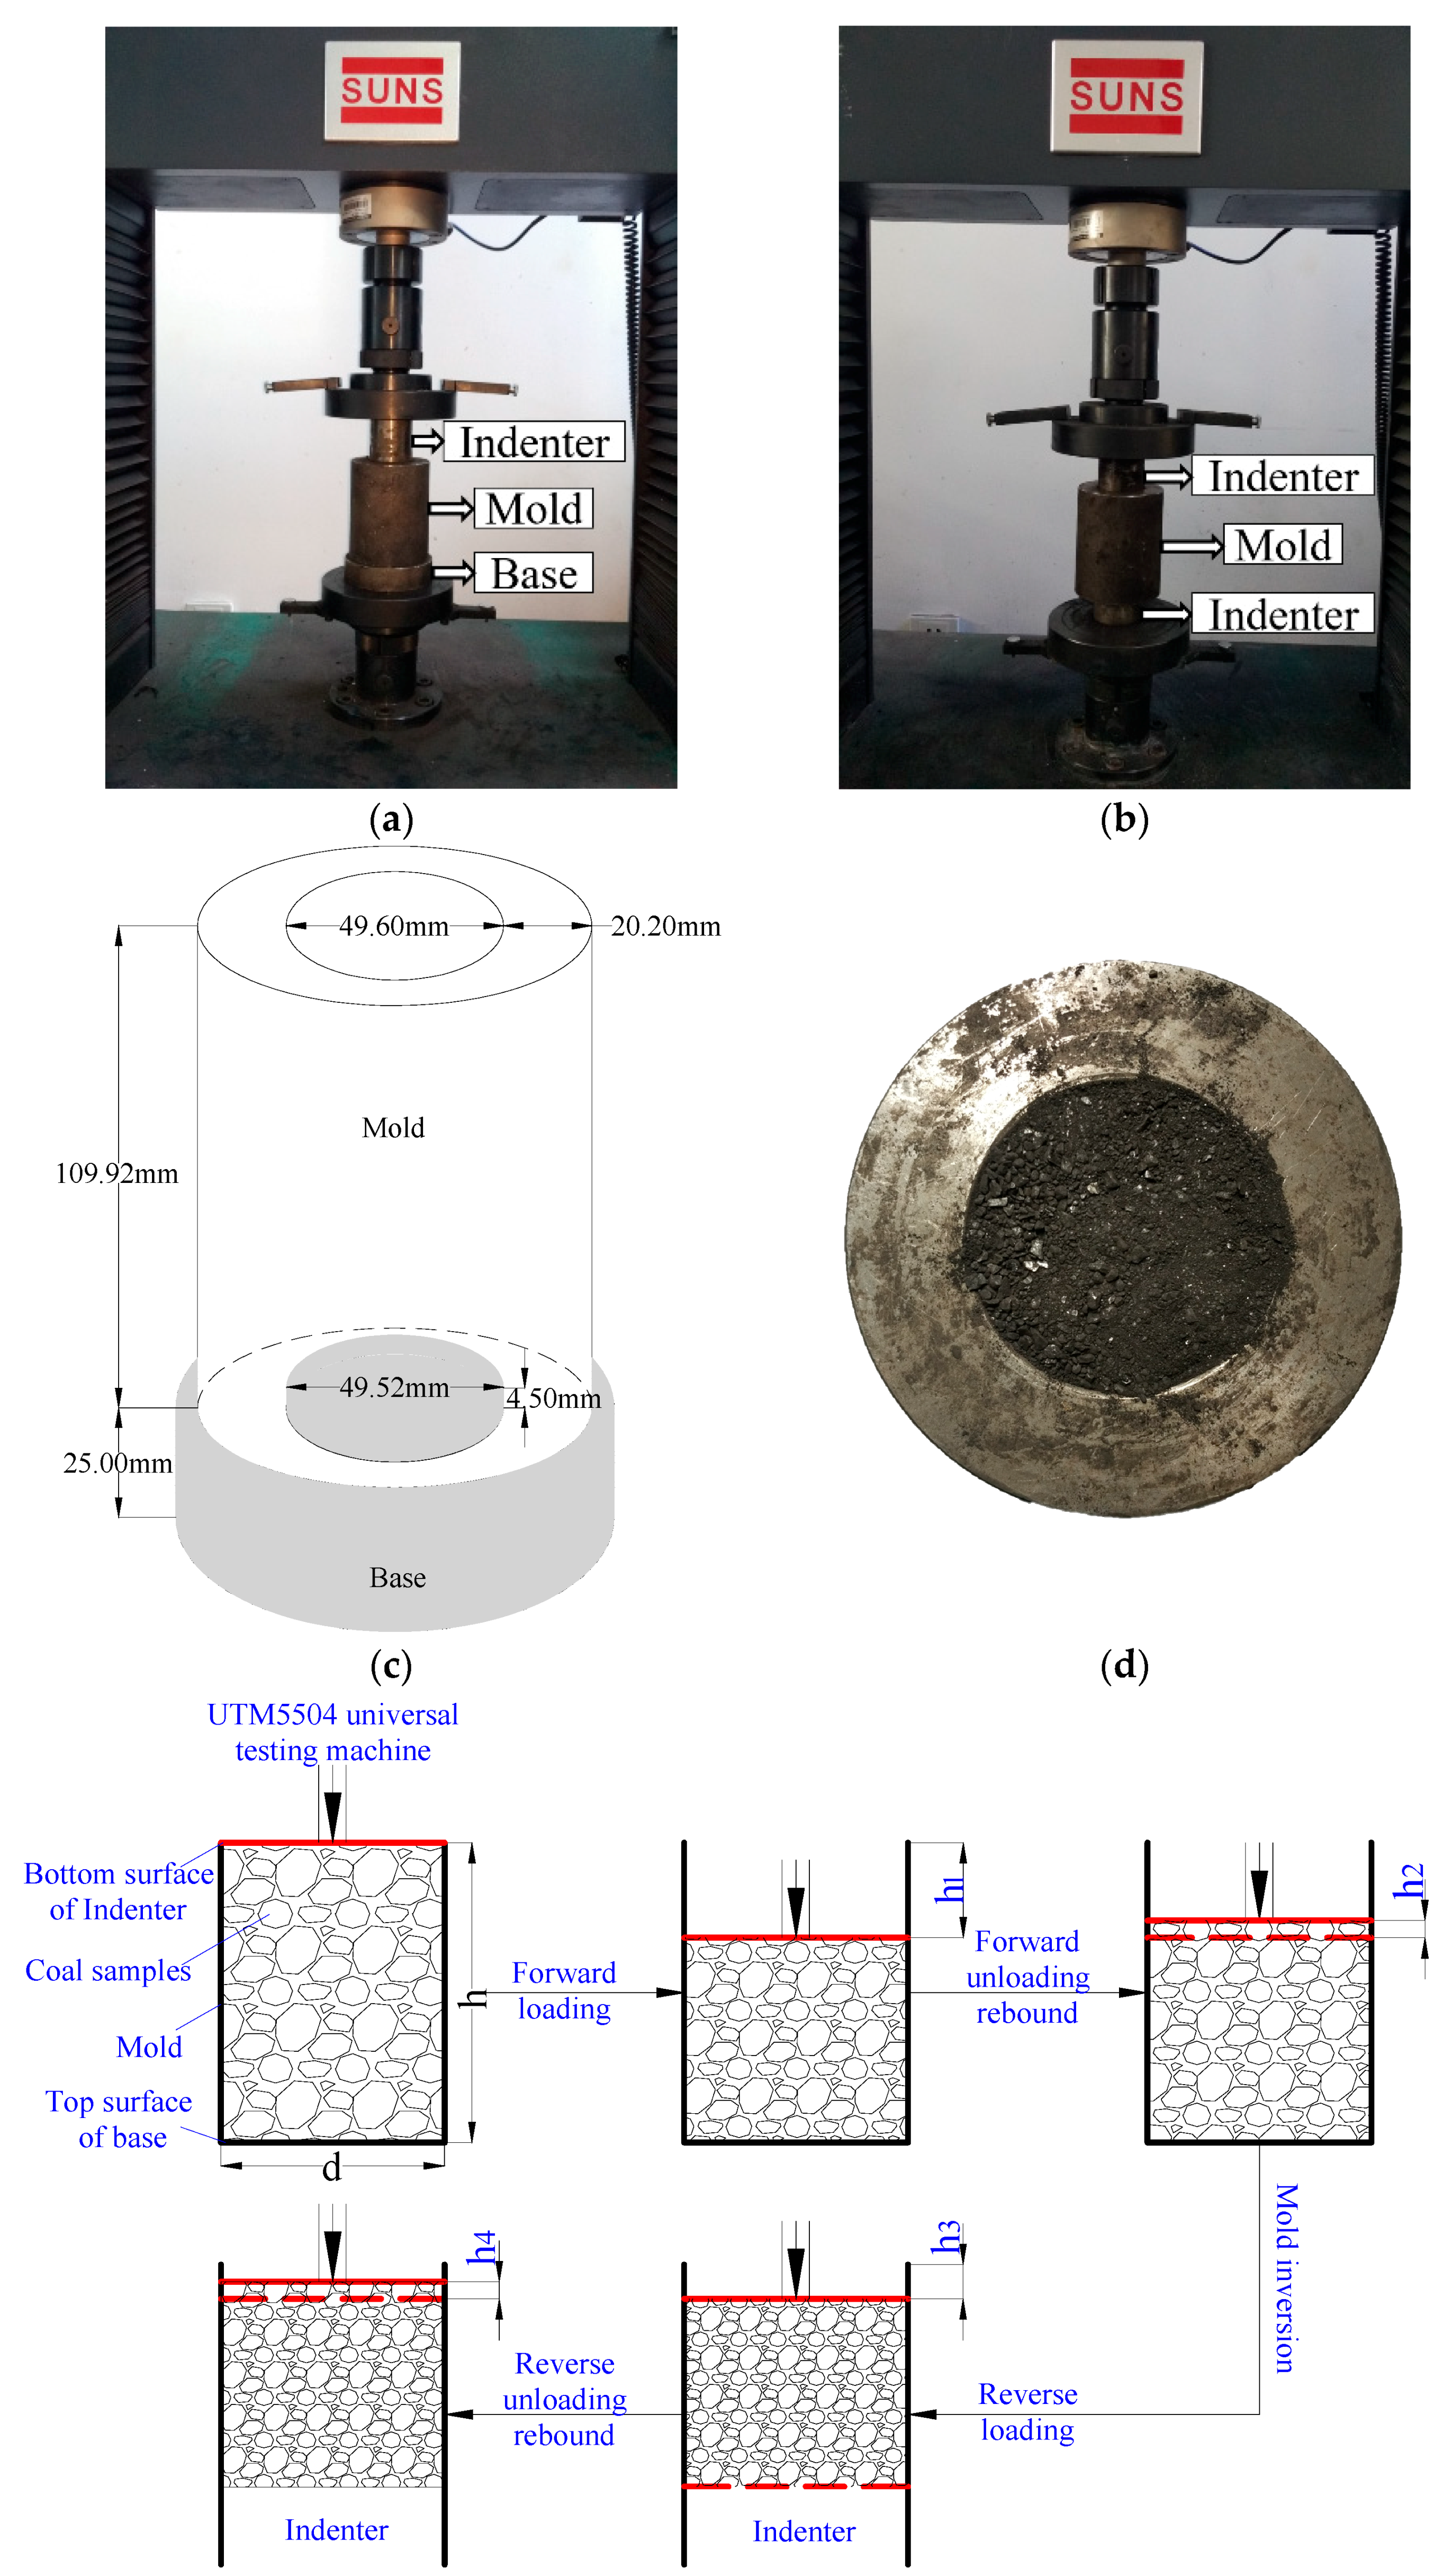
2.2.2. Total Porosity of Loose Coal
- (1)
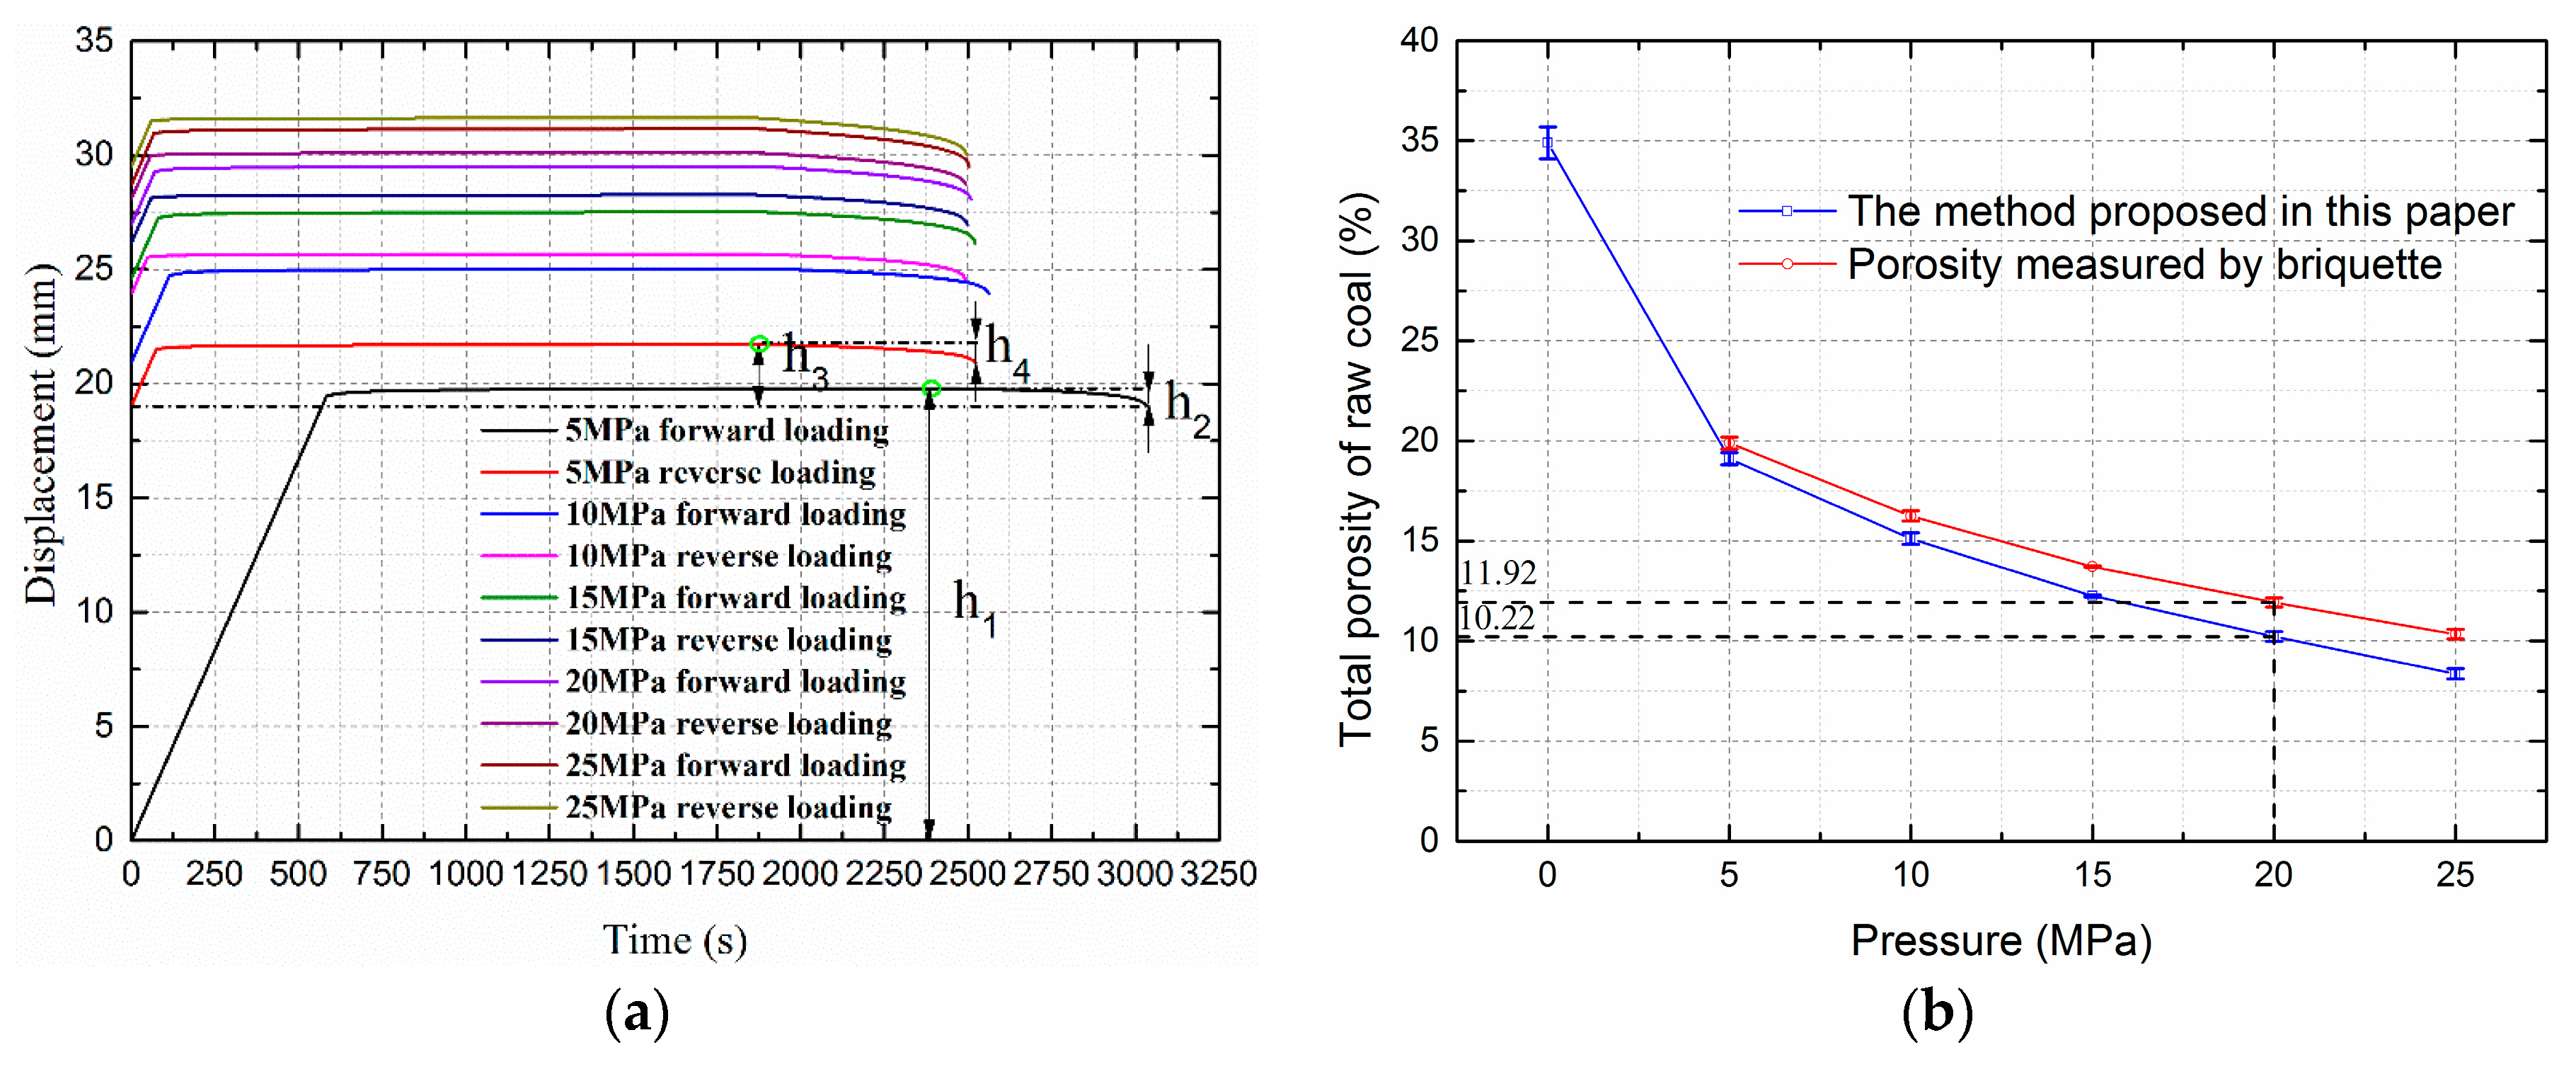
- Forward loading stage: A loading speed of 2 mm/min was used, and after the specified pressure (Determined according to the in situ stresses—5, 10, 15, 20, and 25 MPa—was selected in this test because the in situ stress of Guobei Coal Mine 8105-1 working face is 20 MPa) level was reached, the force applied was kept constant for 30 min. The loading time was referenced by some scholars’ briquette compressing schemes [24,25,36,37]. The forward decreased displacement of indenter h1 was automatically recorded by the testing machine. At each initial experiment, the coal sample should be filled with the mold, that is, the initial position of the bottom surface of the indenter was flush with the top of the coal briquette mold, as shown in Figure 6d. The purpose of the operation is to conveniently calculate the height of the coal sample after compressing. After this stage, hcoal = h − h1. h is the height of the briquette mold excluding the base embedded in the mold.
- (2)
- Forward unloading rebound stage: The unloading speeds were set to 15 N/s corresponding to experimental pressures of 5 MPa, 30 N/s→10 MPa, 45 N/s→15 MPa, 60 N/s→20 MPa, and 75 N/s→25 MPa. The purpose is to keep the consistent unloading time at each pressure. When the force returned to zero, the compressed coal sample rebounded and the forward rebound amount of the coal sample h2 was recorded.
- (3)
- Reverse loading stage: The briquette mold was reversed, and the pressure was applied continuously. The loading speed was set to 2 mm/min and after the specified pressure level (5, 10, 15, 20, and 25 MPa) was reached the applied force was kept constant for 30 min. The reverse loading parameters were exactly the same as the parameters in the forward loading stage. The reverse decreased displacement of indenter h3 was recorded.
- (4)
- Reverse unloading rebound stage: The unloading speeds were set to 15 N/s corresponding to experimental pressures of 5 MPa, 30 N/s→10 MPa, 45 N/s→15 MPa, 60 N/s→20 MPa, and 75 N/s→25 MPa. When the reverse force returned to zero, the compressed coal sample rebounded and the reverse rebound amount h4 was recorded.
- (5)
- The mold was again turned upside down and the next level of pressure was applied. The previous four stages were repeated to complete the next pressure level tests.
3. Results
3.1. Characterization of Total Porosity of Loose Coal
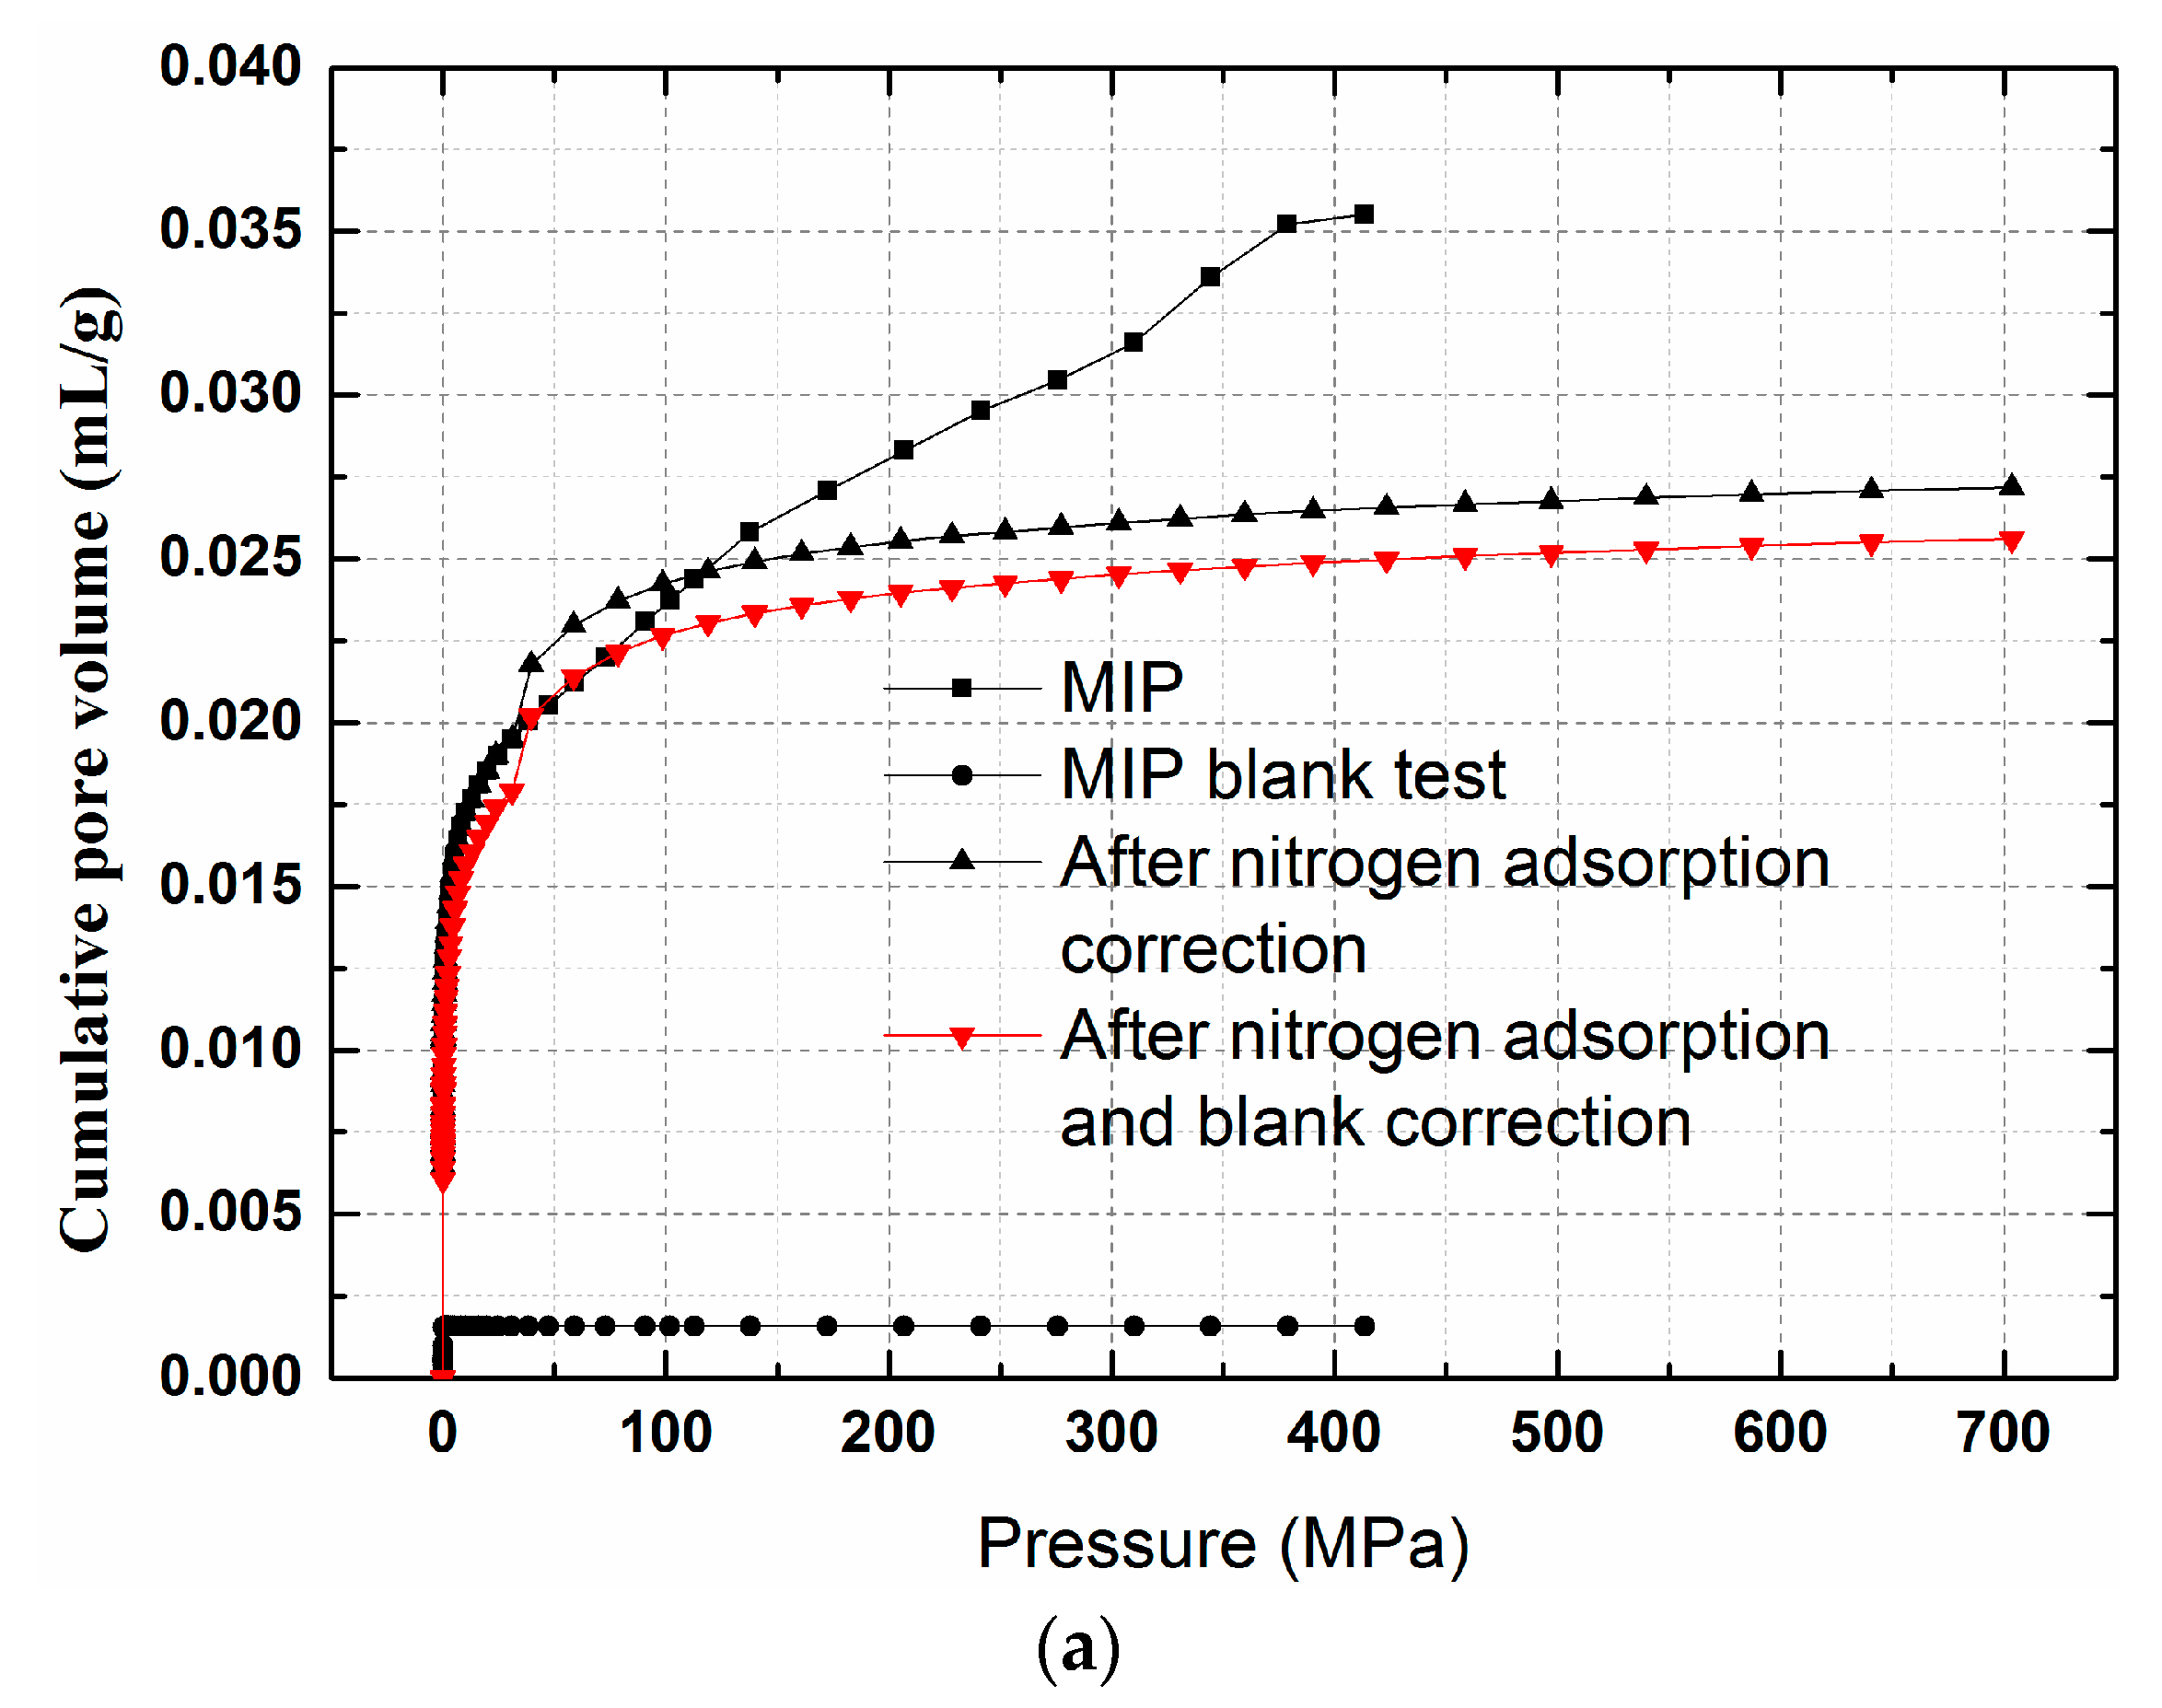
3.1.1. True Density
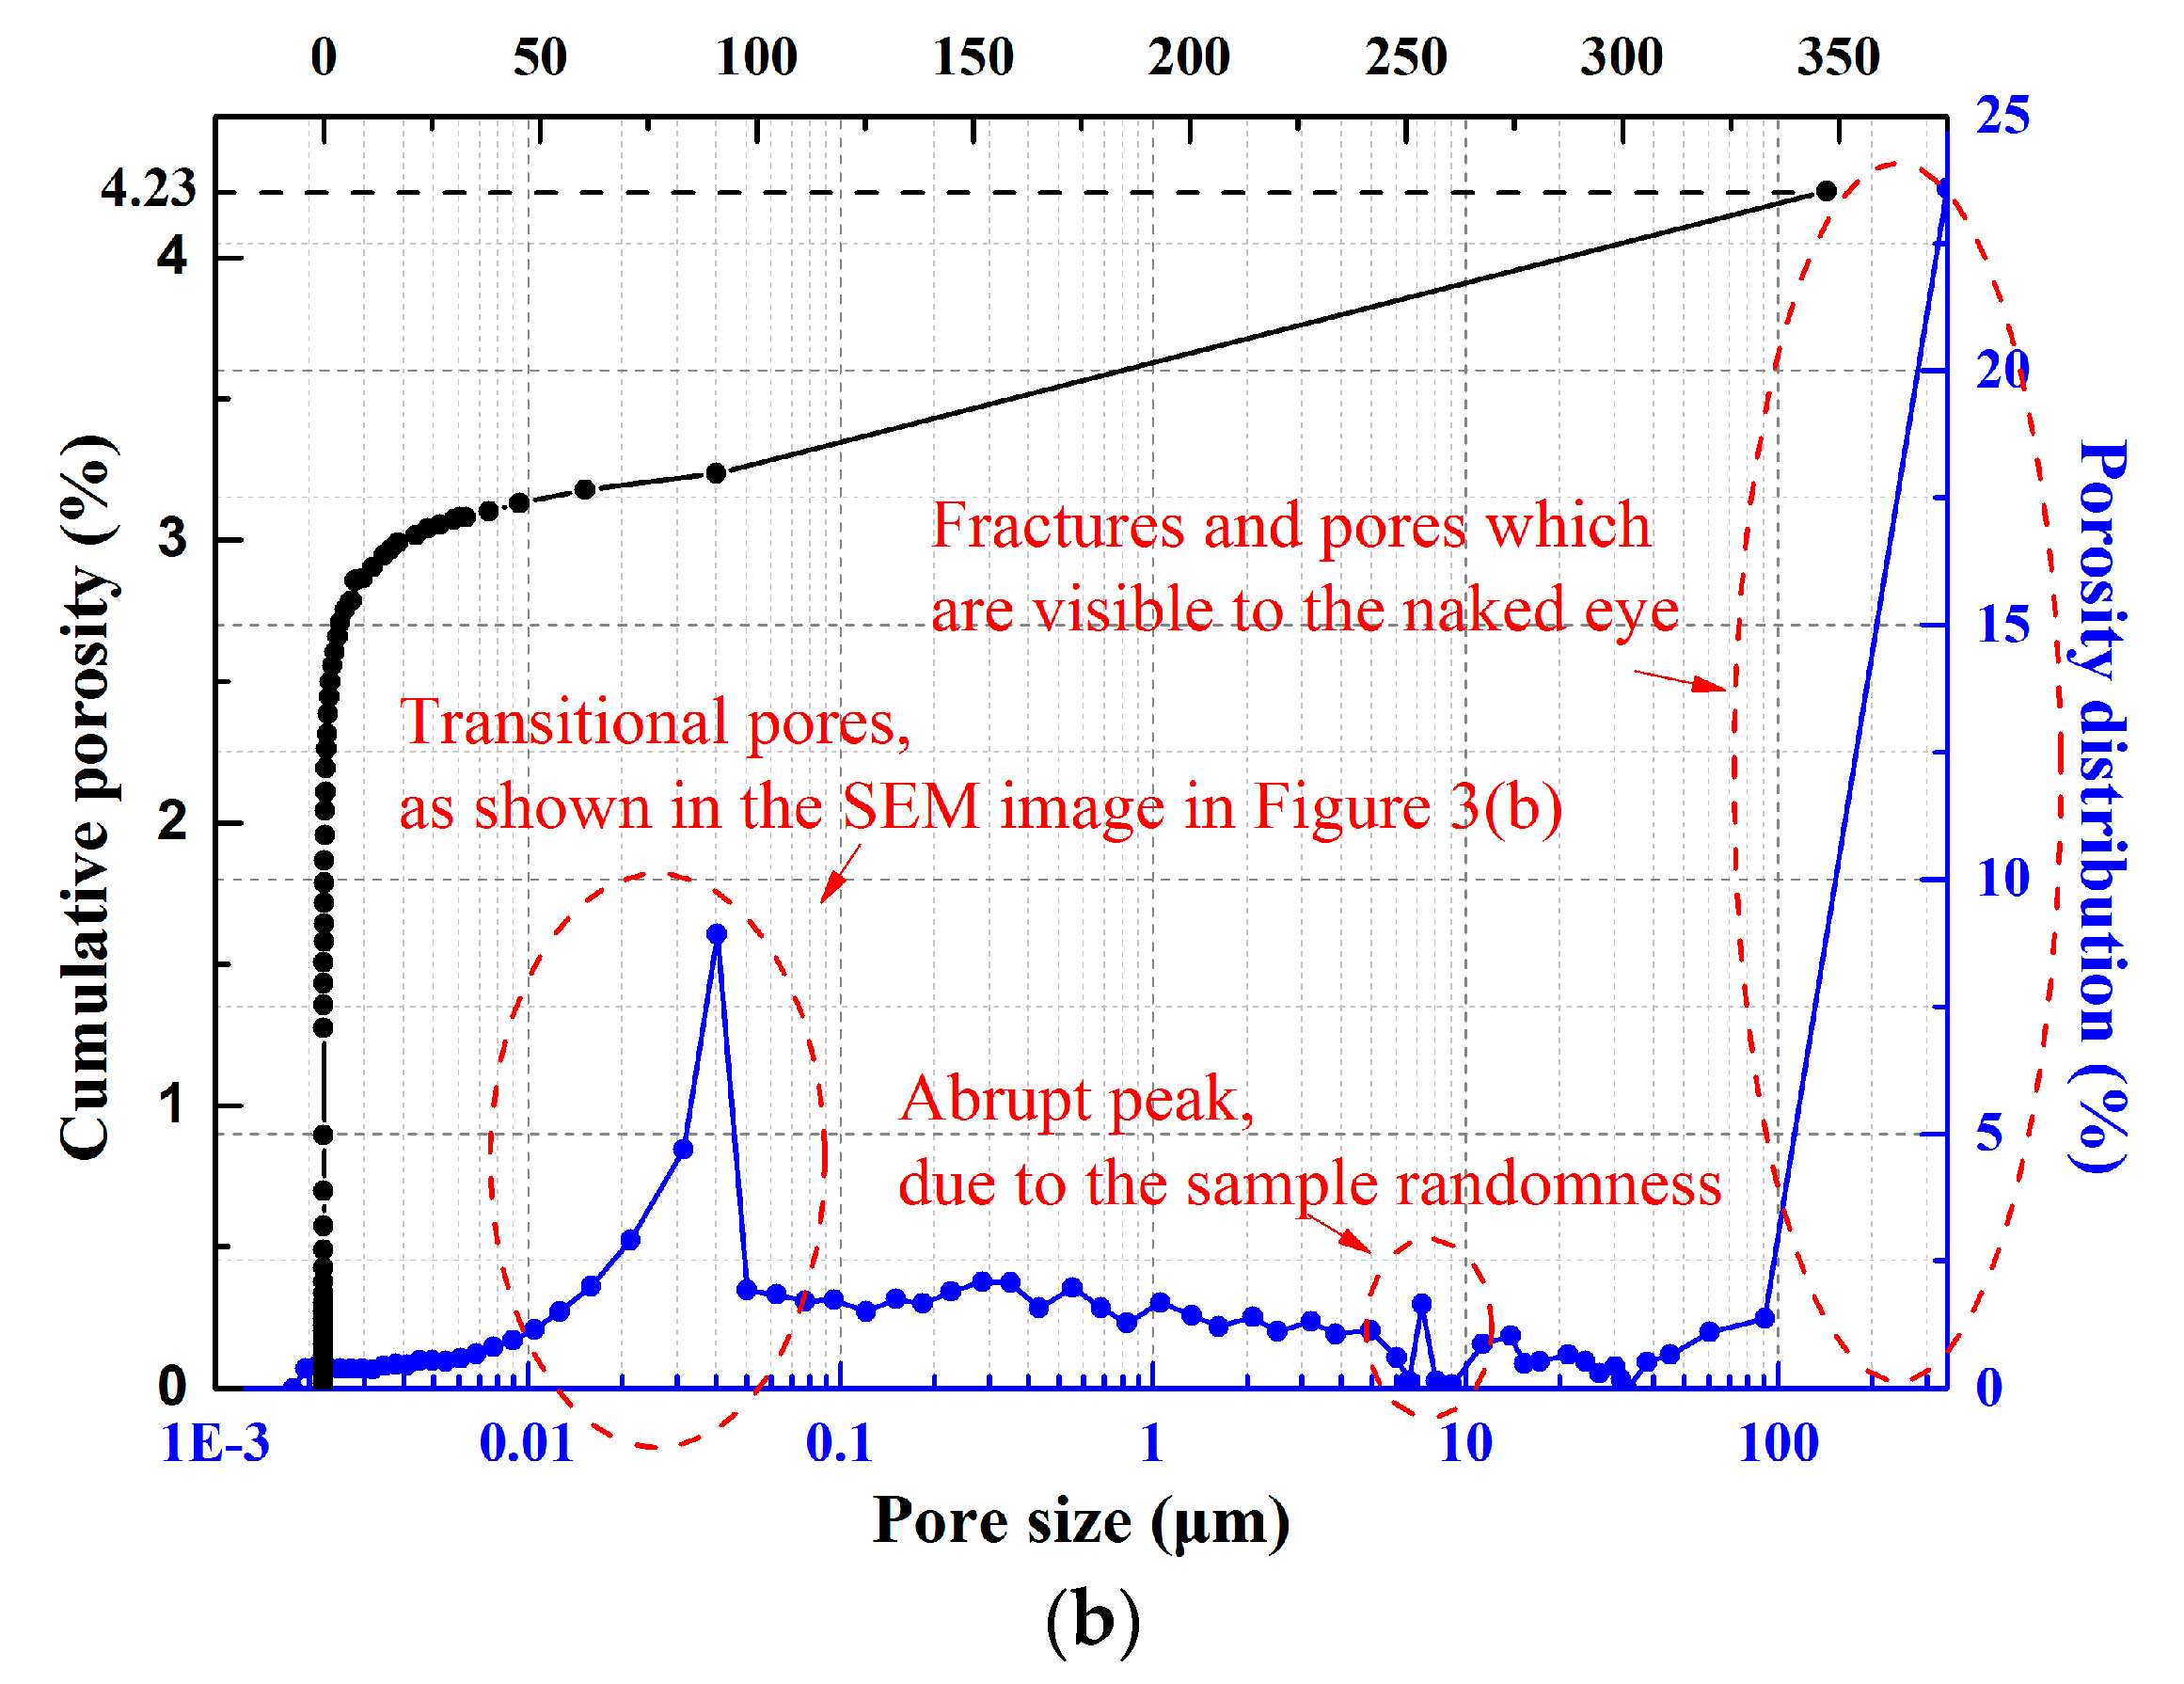
3.1.2. Porosity in the Particle Matrix
3.1.3. Total Porosity of Loose Coal
3.2. Effects of Pressure and Particle Size on Total Porosity
3.2.1. Pressure Effects on Total Porosity
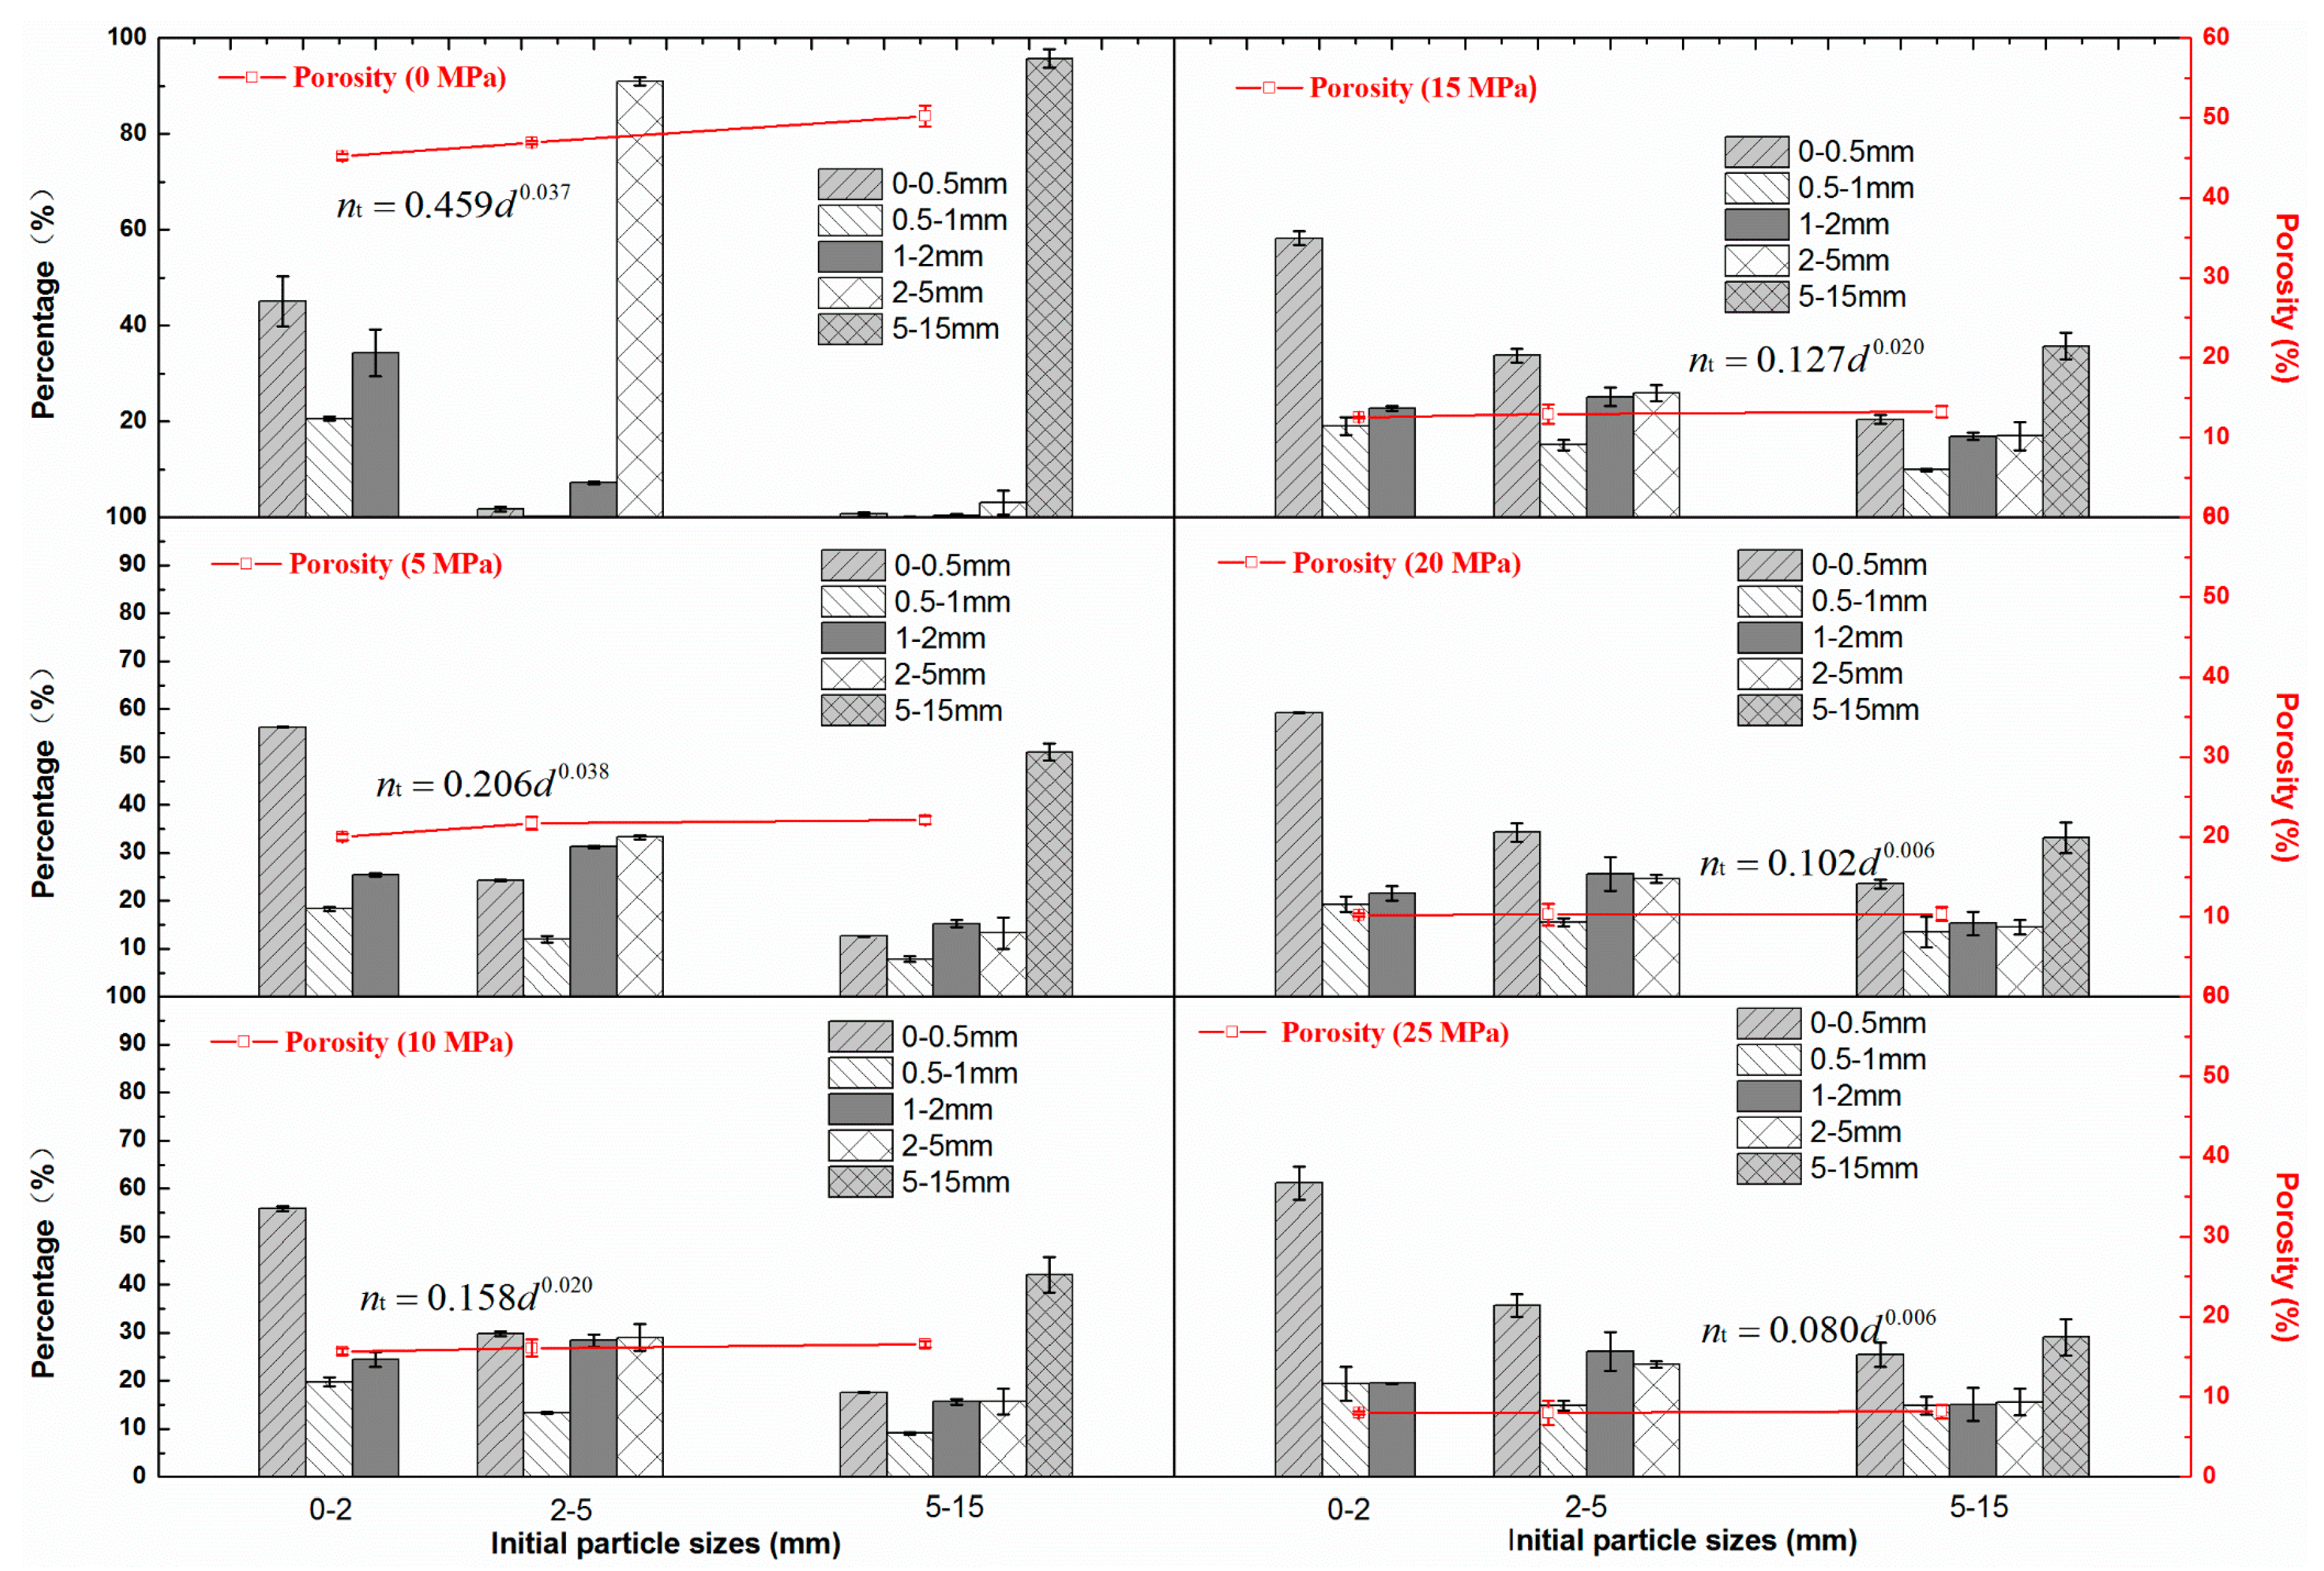
3.2.2. Particle Size Effects on Total Porosity
3.2.3. Sensitivity of Total Porosity to Pressure and Particle Size
4. Discussions
4.1. Comparison with the Method of Compressing Briquette and Testing Porosity
4.2. Quality of Measurement Results
4.3. Engineering Significance, Novelty, Applicability, and Scalability of the Method
5. Conclusions
- (1)
- A new method for characterizing total porosity in loose media subjected to overburden pressure is proposed. It is based on the functional relationship between total porosity, true density, and bulk density.
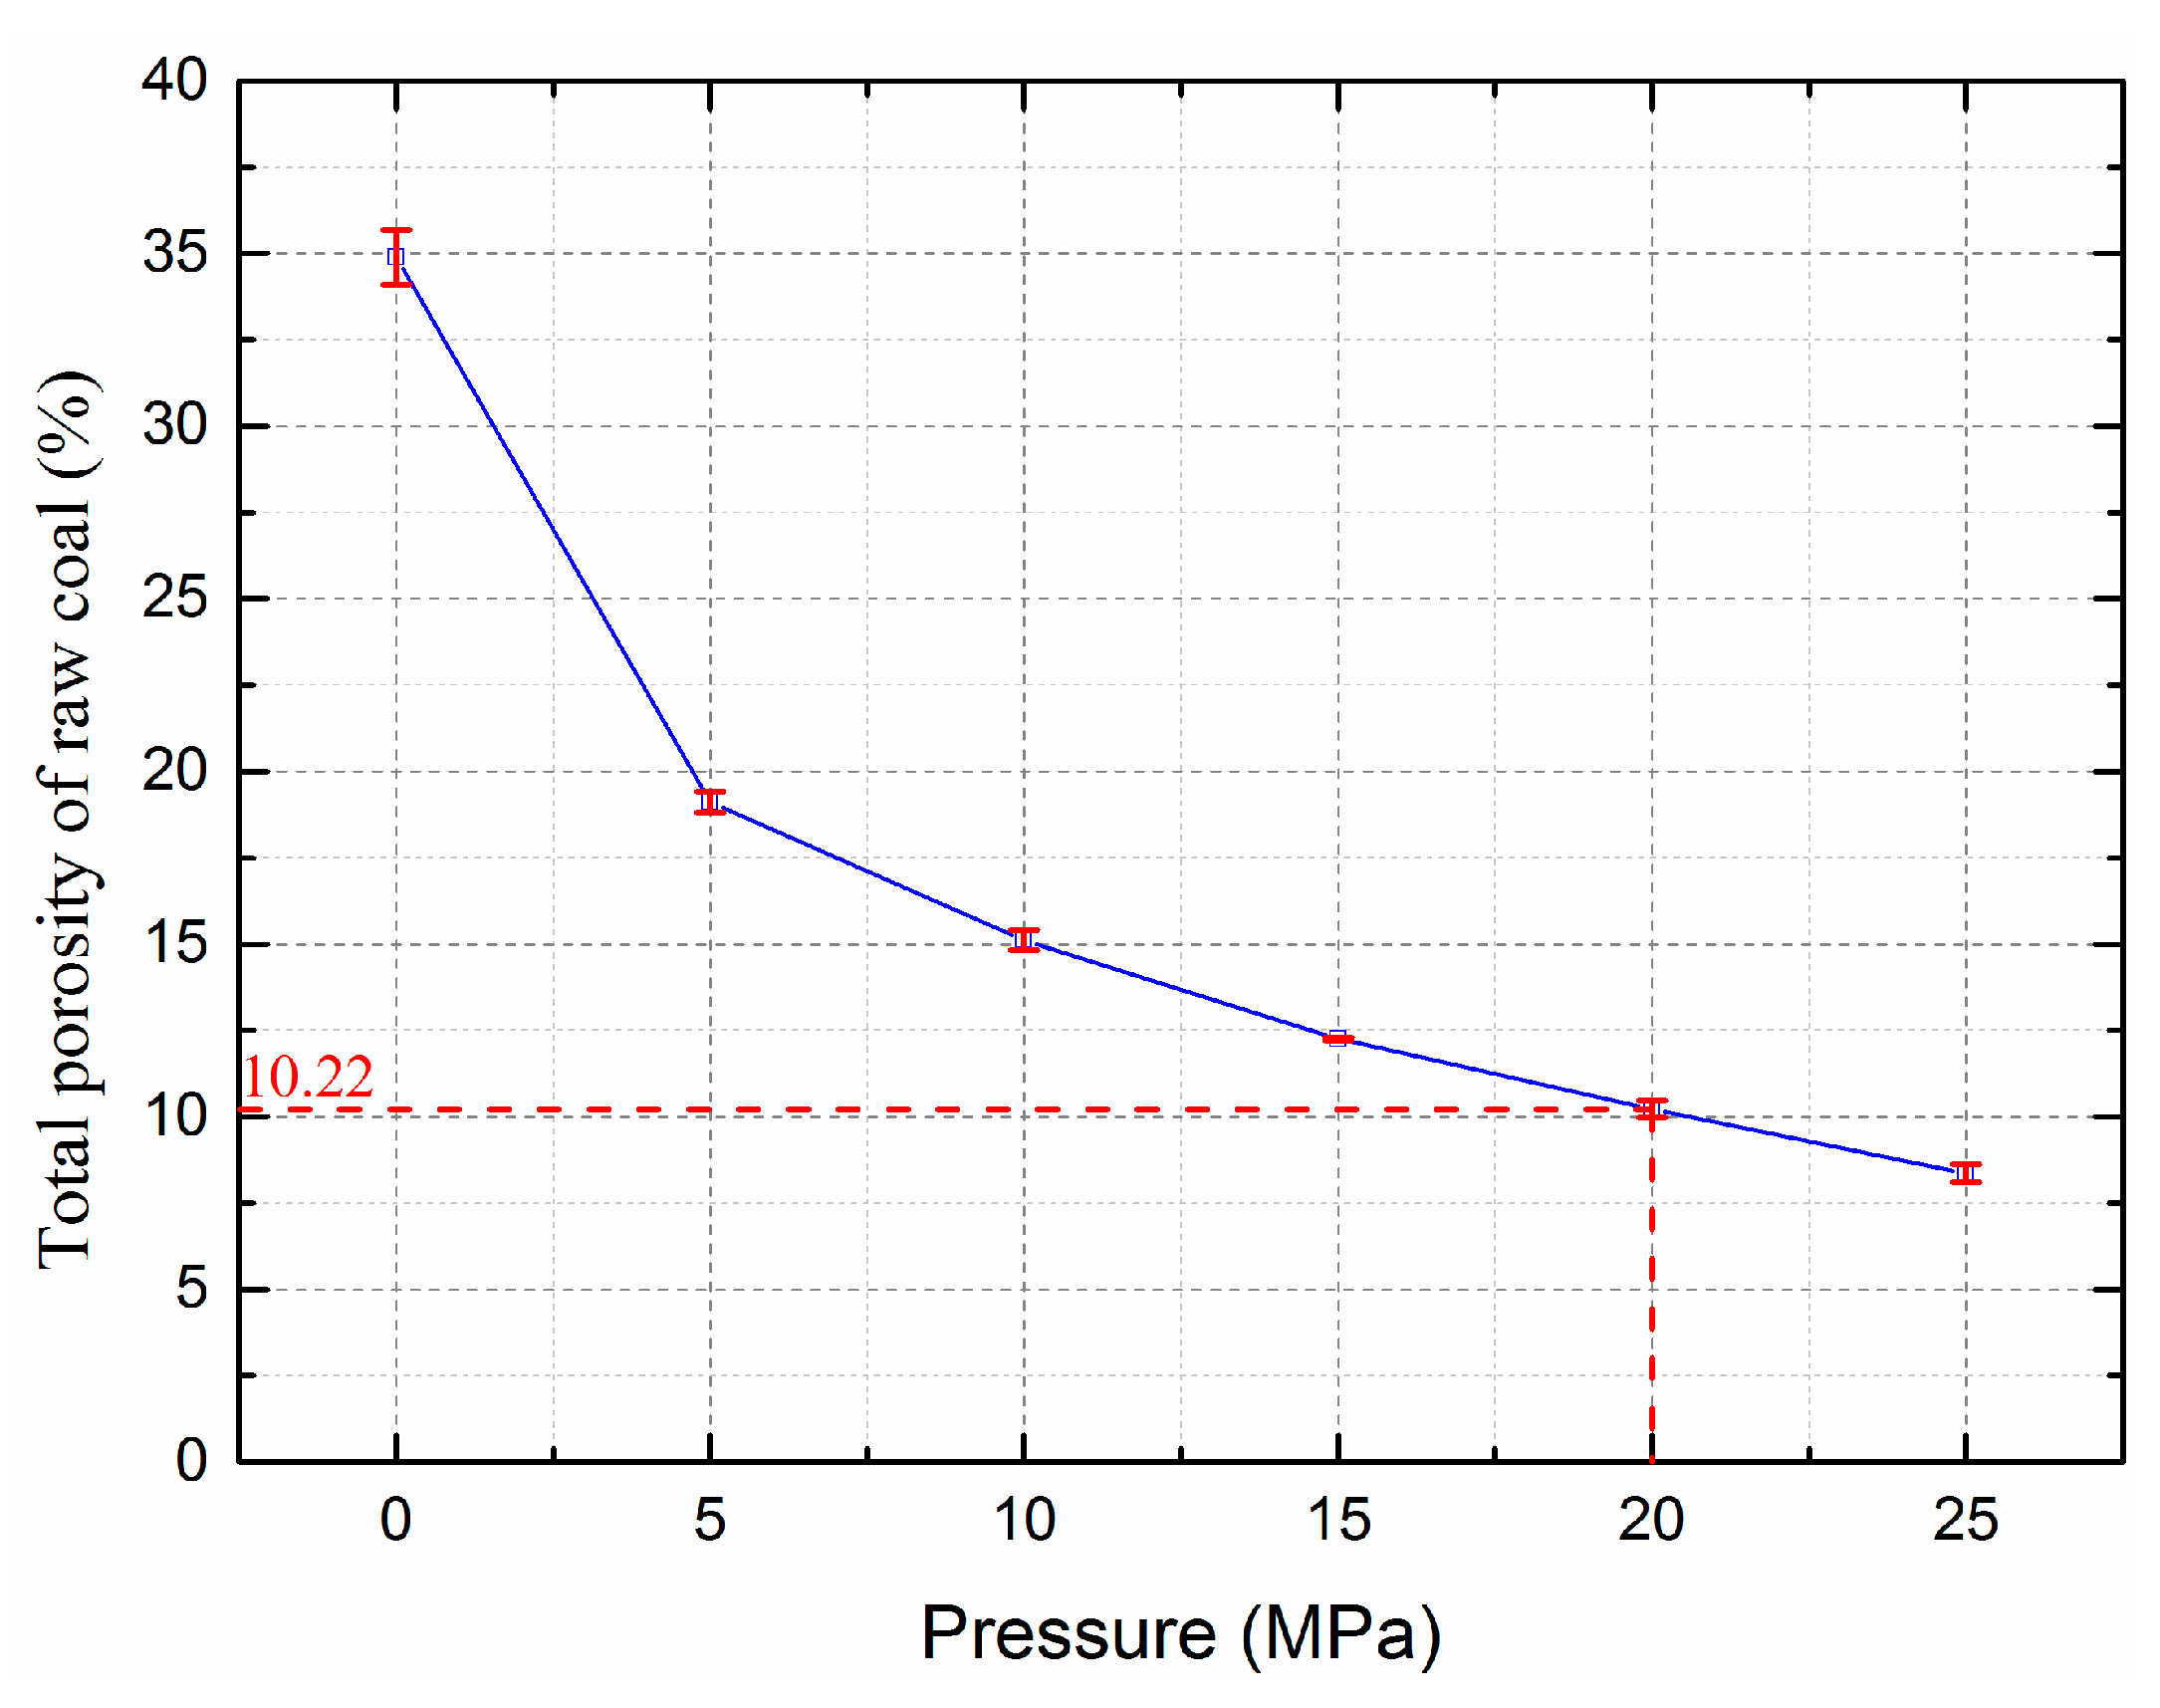
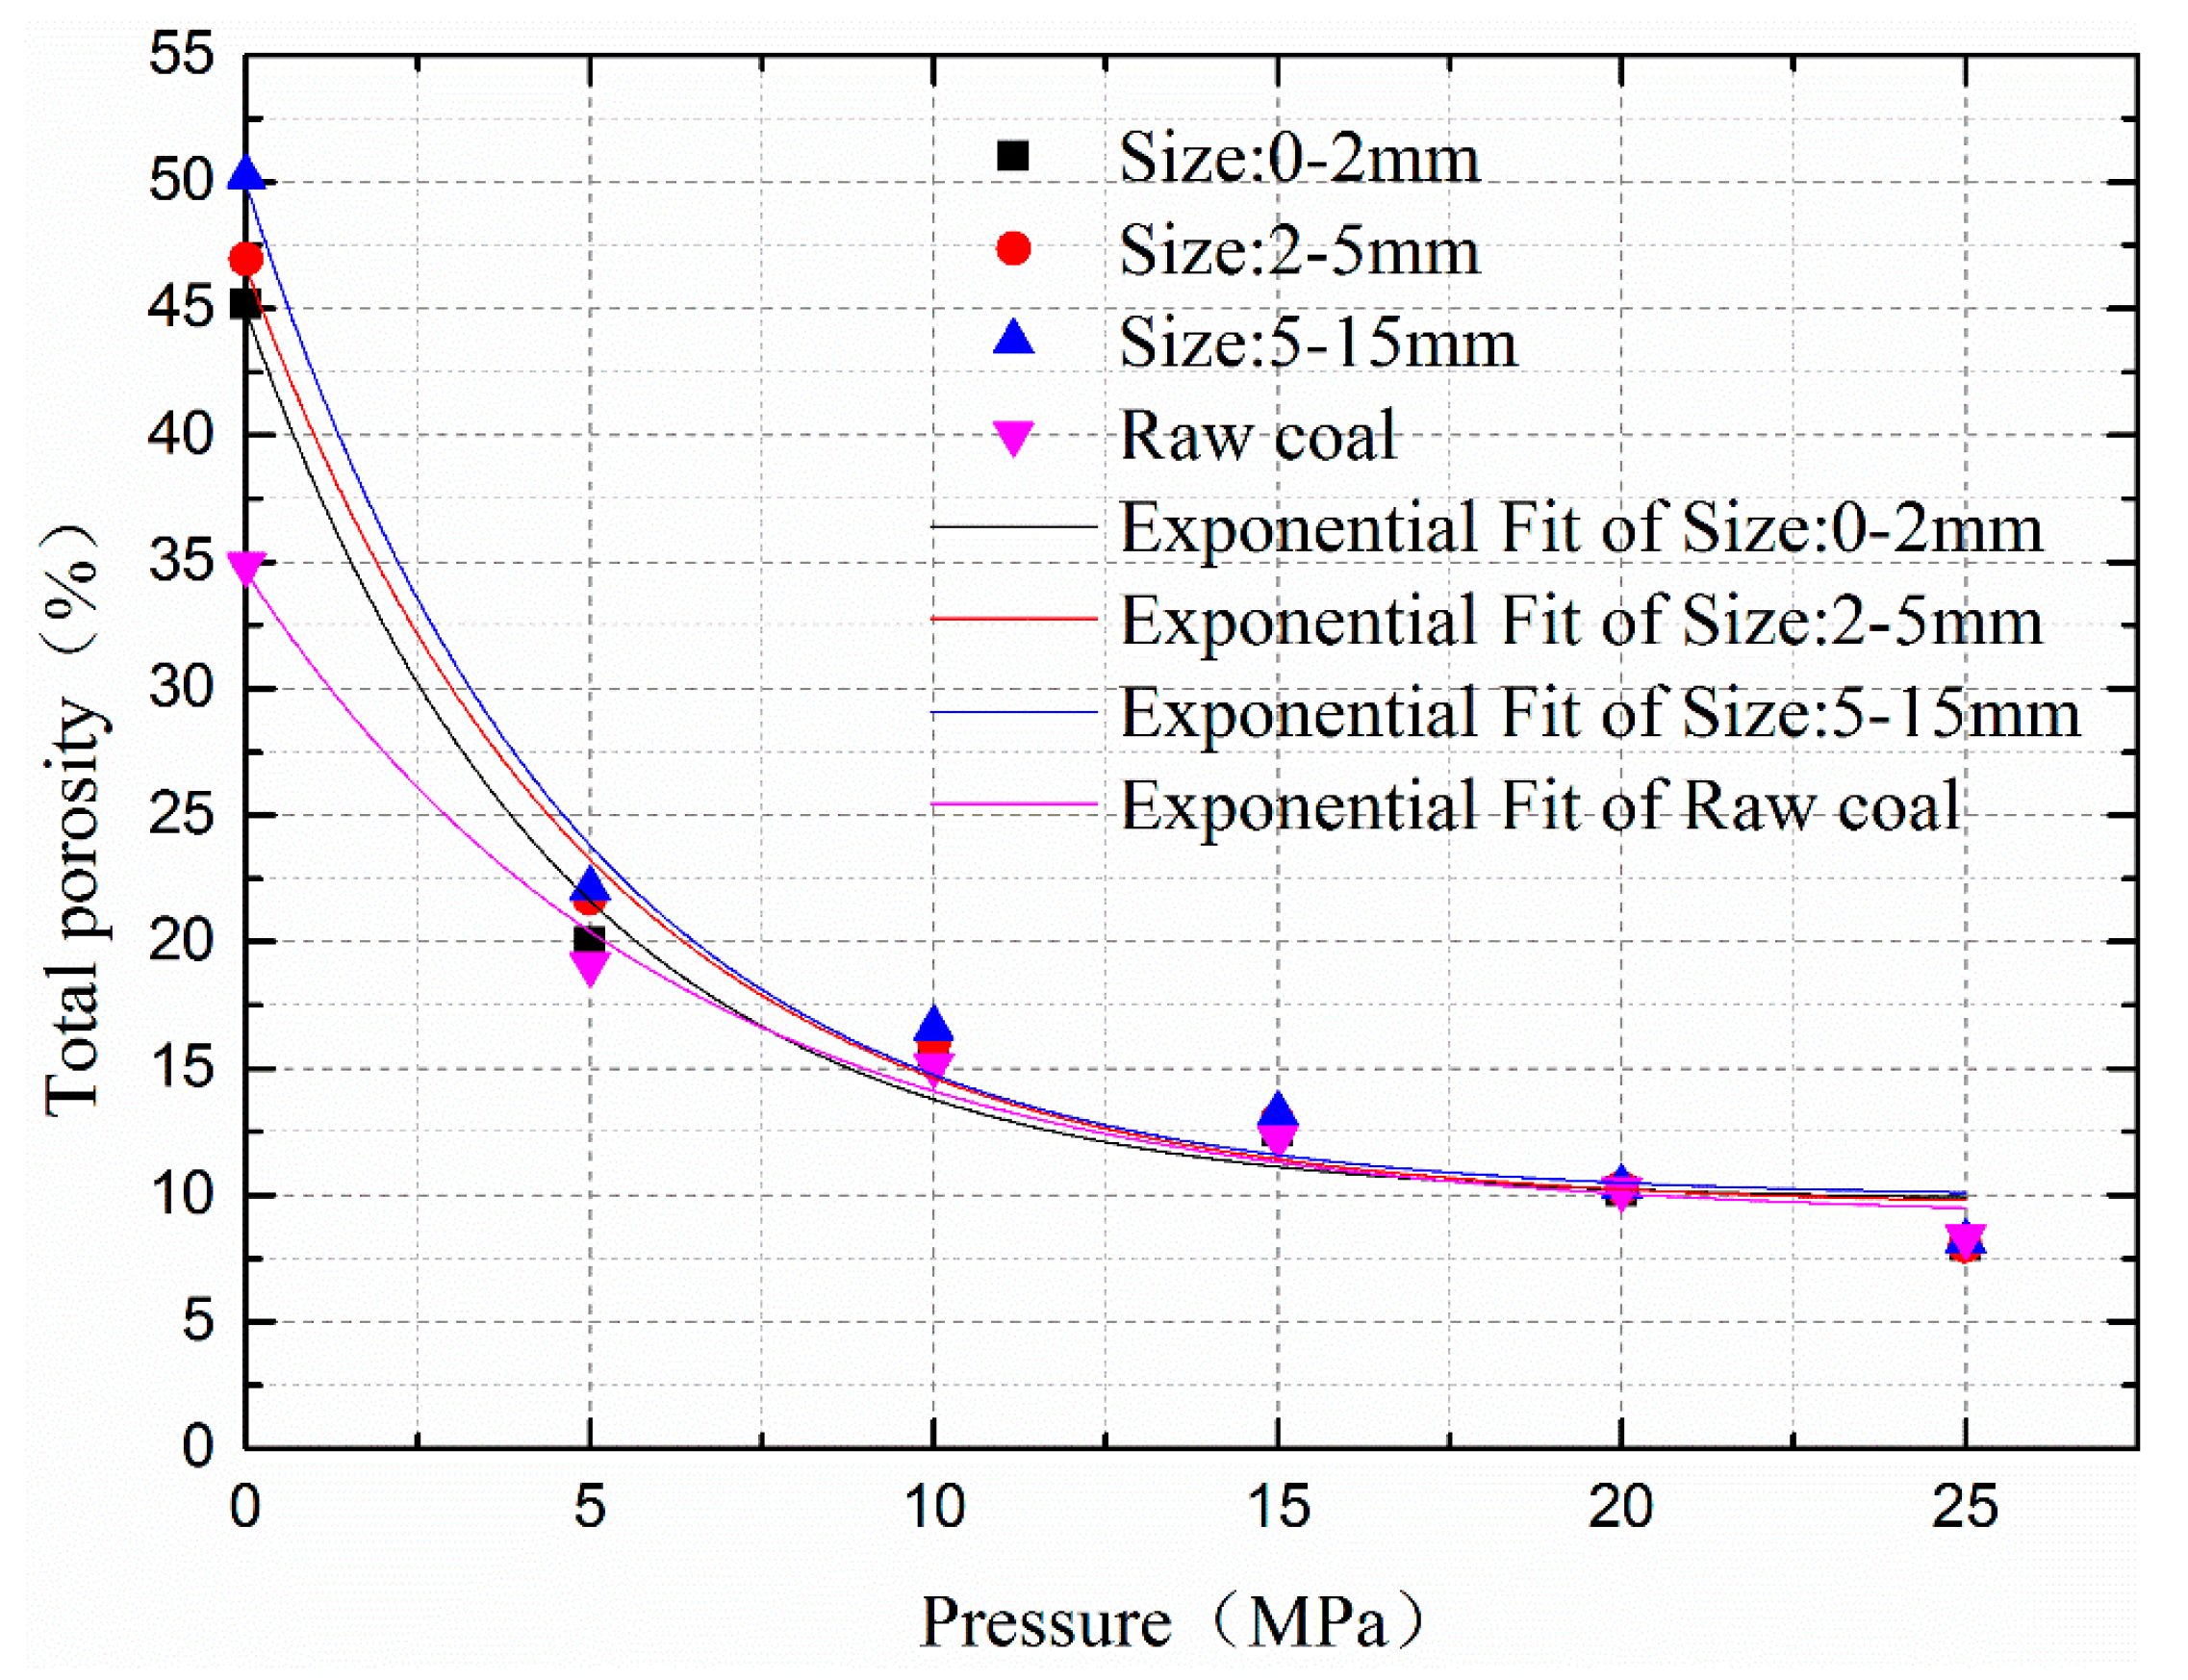
- (2)
- After testing, the porosity of loose coal from the Guobei Coal Mine at 20 MPa in situ stress is found to be ≈ 10.22%. The total porosity experiences a downward trend as pressure increases for a fixed particle size, and the total porosity and pressure obey an attenuated exponential function. The decrease in total porosity with initial single particle sizes (0–2, 2–5, and 5–15 mm) is similar to that with increasing pressure, with steep curves of total porosity vs. pressure evident. There is reduction in the rate of total porosity decrease with increasing pressure with a mixed particle sizes.
- (3)
- At each selected pressure, the total porosity increases with increasing initial particle size (large initial particle size correspond to low degree of on-site coal fragmentation), and the total porosity and initial particle size obey a power function. The rate of total porosity increase becomes gradually reduced as particle size increases at higher stress levels. The curve of initial particle size vs. total porosity approximates a horizontal line when the pressure exceeds 20 MPa, and can thus be considered indicative of total porosity being insensitive to changes in initial particle size or the degree of on-site coal fragmentation.
- (4)
- When pressures are low (e.g., burial conditions are shallow), it is found that total porosity is greatly reduced and is highly sensitive to the increase in pressure. However, total porosity is less sensitive to pressure at higher stress levels (e.g., burial conditions are deep). The effect of particle size on the total porosity reduction rate in the loose coal is not significant irrespective of the pressure conditions (e.g., low or high). In general, the sensitivity of the total porosity to pressure is found to be significantly higher than sensitivity to particle size.
Author Contributions
Funding
Acknowledgments
Conflicts of Interest
References
- Zhao, P.N. Loose Medium Mechanics; Seismological Press: Beijing, China, 1995. [Google Scholar]
- Fan, J.J.; Ju, Y.W.; Hou, Q.L.; Tan, J.Q.; Wei, M.M. Pore structure characteristics of different metamorphic-deformed coal reservoirs and its restriction on recovery of coalbed methane. Earth Sci. Front. 2010, 17, 325–335. [Google Scholar]
- Curtis, M.; Ambrose, R.; Sondergeld, C. Structural Characterization of Gas Shales on the Micro and Nano-Scales. In Proceedings of the Canadian Unconventional Resources and International Petroleum Conference, Calgary, AB, Canada, 19–21 October 2010. [Google Scholar]
- Sammartino, S.; Siitarikauppi, M.; Meunier, A.; Sardini, P.; Bouchet, A.; Tevissen, E. An Imaging Method for the Porosity of Sedimentary Rocks: Adjustment of the PMMA Method—Example of a Characterization of a Calcareous Shale. J. Sediment. Res. 2002, 72, 937–943. [Google Scholar] [CrossRef]
- Hübner, W. Studying the pore space of cuttings by NMR and μCT. J. Appl. Geophys. 2014, 104, 97–105. [Google Scholar] [CrossRef]
- Krzyżak, A.T.; Kaczmarek, A. Comparison of the Efficiency of 1H NMR and µCT for Determining the Porosity of the Selected Rock Cores. In Proceedings of the International Multidisciplinary Scientific Geoconference Green Sgem, Vienna, Austria, 11 November 2016. [Google Scholar]
- Yao, Y.B.; Liu, D.M.; Cai, Y.D.; Li, J.Q. Advanced characterization of pores and fractures in coals by nuclear magnetic resonance and X-ray computed tomography. Sci. Sin. Terrae 2010, 40, 1598–1607. [Google Scholar] [CrossRef]
- Andrew, M. Reservoir Condition Pore Scale Imaging of Multiphase Flow Using X-ray Microtomography. Ph.D. Thesis, Imperial College London, London, UK, 2014. [Google Scholar]
- Menke, H.P.; Andrew, M.G.; Blunt, M.J.; Bijeljic, B. Reservoir condition imaging of reactive transport in heterogeneous carbonates using fast synchrotron tomography—Effect of initial pore structure and flow conditions. Chem. Geol. 2016, 428, 15–26. [Google Scholar] [CrossRef]
- Andrew, M.; Menke, H.; Blunt, M.J.; Bijeljic, B. The imaging of dynamic multiphase fluid flow using synchrotron-based X-ray microtomography at reservoir conditions. Transp. Porous Med. 2015, 110, 1–24. [Google Scholar] [CrossRef]
- Hu, X.; Liang, W.; Hou, S.J.; Zhu, X.G.; Huang, W.Q. Experimental study of effect of temperature and stress on permeability characteristics of raw coal and shaped coal. Chin. J. Rock Mech. Eng. 2012, 31, 1222–1229. [Google Scholar] [CrossRef]
- Liu, X.J.; Gao, H.; Liang, L.X. Study of temperature and confining pressure effects on porosity and permeability in low permeability sandstone. Chin. J. Rock Mech. Eng. 2011, 30, 3771–3778. [Google Scholar]
- Meng, Y.; Li, Z.P. Experimental study on the porosity and permeability of coal in net confining stress and its stress sensitivity. J. China Coal Soc. 2015, 40, 154–159. [Google Scholar] [CrossRef]
- Tian, H.; Zhang, S.C.; Liu, S.B.; Ma, X.S.; Zhang, H. Parameter optimization of tight reservoir porosity determination. Pet. Geol. Exp. 2012, 334–339. [Google Scholar] [CrossRef]
- Chao, Z.M.; Wang, H.L.; Xu, W.Y.; Yang, L.L.; Zhao, K. Variation of permeability and porosity of sandstones with different degrees of saturation under stresses. Chin. J. Rock Mech. Eng. 2017, 36, 665–680. [Google Scholar] [CrossRef]
- Dong, J.J.; Hsu, J.Y.; Wu, W.J.; Shimamoto, T.; Hung, J.H.; Yeh, E.C.; Wu, Y.H.; Sone, H. Stress-dependence of the permeability and porosity of sandstone and shale from TCDP Hole-A. Int. J. Rock Mech. Min. Sci. 2010, 47, 1141–1157. [Google Scholar] [CrossRef]
- Tan, X.H.; Li, X.P.; Liu, J.Y.; Zhang, L.H.; Fan, Z. Study of the effects of stress sensitivity on the permeability and porosity of fractal porous media. Phys. Lett. A 2015, 379, 2458–2465. [Google Scholar] [CrossRef]
- Meng, Y.; Li, Z.; Lai, F. Experimental study on porosity and permeability of anthracite coal under different stresses. J. Pet. Sci. Eng. 2015, 133, 810–817. [Google Scholar] [CrossRef]
- Kong, Q.; Wang, H.L.; Xu, W.Y. Experimental study on permeability and porosity evolution of sandstone under cyclic loading and unloading. Chin. J. Geotech. Eng. 2015, 37, 1893–1900. [Google Scholar]
- Jia, C.J.; Xu, W.Y.; Wang, H.L.; Wang, R.B.; Yu, J.; Yan, L. Stress dependent permeability and porosity of low-permeability rock. J. Cent. South Univ. 2017, 24, 2396–2405. [Google Scholar] [CrossRef]
- Zheng, J.; Zheng, L.; Liu, H.H.; Ju, Y. Relationships between permeability, porosity and effective stress for low-permeability sedimentary rock. Int. J. Rock Mech. Min. Sci. 2015, 78, 304–318. [Google Scholar] [CrossRef]
- Liu, J.J.; Liu, X.G. The effect of effective pressure on porosity and permeability of low permeability porous media. J. GeoMech. 2001, 7, 41–44. [Google Scholar] [CrossRef]
- Wei, J.P.; Wang, D.K.; Wei, L. Comparison of permeability between two kinds of loaded coal containing gas samples. J. China Coal Soc. 2013, 38, 93–99. [Google Scholar] [CrossRef]
- Yue, J.W.; Wang, Z.F. Imbibition characteristics of remolded coal without gas. J. China Coal Soc. 2017, S2, 377–384. [Google Scholar] [CrossRef]
- Zhu, C.Q.; Xie, G.X.; Wang, L.; Wang, C.B. Experimental study on the influence of moisture content and porosity on soft coal strength characteristics. J. Min. Saf. Eng. 2017, 601–607. [Google Scholar]
- Xu, J.; Lu, Q.; Wu, X.; Liu, D. The fractal characteristics of the pore and development of briquettes with different coal particle sizes. J. Chongqing Univ. 2011, 9, 81–89. [Google Scholar] [CrossRef]
- Su, L.J.; Zhang, Y.J.; Wang, T.X. Investigation on permeability of sands with different particle sizes. Rock Soil Mech. Rock Soil Mech. 2014, 35, 1289–1294. [Google Scholar]
- Yu, M.G.; Chao, J.K.; Chu, T.X. Experimental study on permeability parameter evolution of pressure-bear broken coal. J. China Coal Soc. 2017, 916–922. [Google Scholar] [CrossRef]
- Yu, B.Y.; Chen, Z.Q.; Wu, Y.; Zhang, S.B; Yu, L.L. Experimental study on the seepage characteristics of cemented broken mudstone. J. Min. Saf. Eng. 2015, 853–858. [Google Scholar] [CrossRef]
- Yuan, C.F. Tectonically deformed coal and coal gas outburst. Coal Sci. Technol. 1986, 32–33. [Google Scholar] [CrossRef]
- Tang, Y.Y.; Tian, G.L.; Sun, S.Q.; Zhang, G.C. Improvement and perfect way for the classification of the shape and cause formation of coal body texture. J. Jiaozuo Inst. Technol. Nat. Sci. 2004, 161–164. [Google Scholar] [CrossRef]
- Zhang, H. One of Parameters Reflecting Coal Reservoir Permeability—Block Coal Rate. Coal Geol. Explor. 2001, 6, 21–22. [Google Scholar] [CrossRef]
- Y Leon, C.A.L. New perspectives in mercury porosimetry. Adv. Colloid Interface Sci. 1998, 76, 341–372. [Google Scholar] [CrossRef]
- Guo, X.; Yao, Y.; Liu, D. Characteristics of coal matrix compressibility: An investigation by mercury intrusion porosimetry. Energy Fuel 2014, 28, 3673–3678. [Google Scholar] [CrossRef]
- Methods for Determining the Physical and Mechanical Properties of Coal and Rock—Part 4: Methods for Calculating the Porosity of Coal and Rock; GB/T 23561.4-2009; Standards Press of China: Beijing, China, 2009; p. 6.
- Guo, D.Y.; Li, C.J.; Zhang, Y.Y. Contrast Study on Porosity and Permeability of Tectonically Deformed Coal and Indigenous Coal in Pingdingshan Mining Area, China. Earth Sci. J. China Univ. Geosci. 2014, 39, 1600–1606. [Google Scholar] [CrossRef]
- Wang, C. Research on Characteristics and Applications of the Permeability of Loaded Coal Containing Gas. Master’s Thesis, Henan Polytechnic University, Jiaozuo, China, 2014. [Google Scholar]
- Yang, X.P. Physical Mineral Processing; Metallurgical Industry Press: Beijing, China, 2014. [Google Scholar]
- Labani, M.M.; Rezaee, R.; Saeedi, A.; Al Hinai, A. Evaluation of pore size spectrum of gas shale reservoirs using low pressure nitrogen adsorption, gas expansion and mercury porosimetry: A case study from the Perth and Canning Basins, Western Australia. J. Petrol. Sci. Eng. 2013, 112, 7–16. [Google Scholar] [CrossRef]
- Zhang, S.W.; Meng, Z.Y.; Guo, Z.F.; Zhang, M.Y.; Han, C.Y. Characteristics and Major Controlling Factors of Shale Reservoirs in The Longmaxi Fm, Fuling Area, Sichuan Basin. Nat. Gas Ind. 2014, 34, 16–24. [Google Scholar] [CrossRef]
- Hodot, B.B. Outburst of Coal and Coalbed Gas (Chinese Translation); China Coal Industry Press: Beijing, China, 1966; p. 318. [Google Scholar]
- ISO (International Organization for Standardization). Guide to the Expression of Uncertainty in Measurement; ISO Tag4; ISO: Genève, Switzerland, 1995. [Google Scholar]
- JCGM (Joint Committee for Guides in Metrology). International Vocabulary of Metrology-Basic and General Concepts and Associated Terms (VIM); In BIPM: Sèvres, France, 2008. [Google Scholar]


| Mesh Diameter (mm) | Grader Retained Mass mi (g) | Grader Retained Percentage (mi/2000) (%) | Accumulated Retained Percentage (%) |
|---|---|---|---|
| 31.5 | 0 | 0 | 0 |
| 16 | 124.77 | 6.2385 | 6.2385 |
| 9.5 | 131.25 | 6.5625 | 12.801 |
| 4.75 | 235.18 | 11.759 | 24.56 |
| 2.36 | 328.3 | 16.415 | 40.975 |
| 1.18 | 262.71 | 13.1355 | 54.1105 |
| 0.6 | 335.51 | 16.7755 | 70.886 |
| 0.3 | 189.61 | 9.4805 | 80.3665 |
| 0.15 | 183.05 | 9.1525 | 89.519 |
| 0.088 | 173.26 | 8.663 | 98.182 |
| <0.088 | 15.98 | 0.799 | 98.981 |
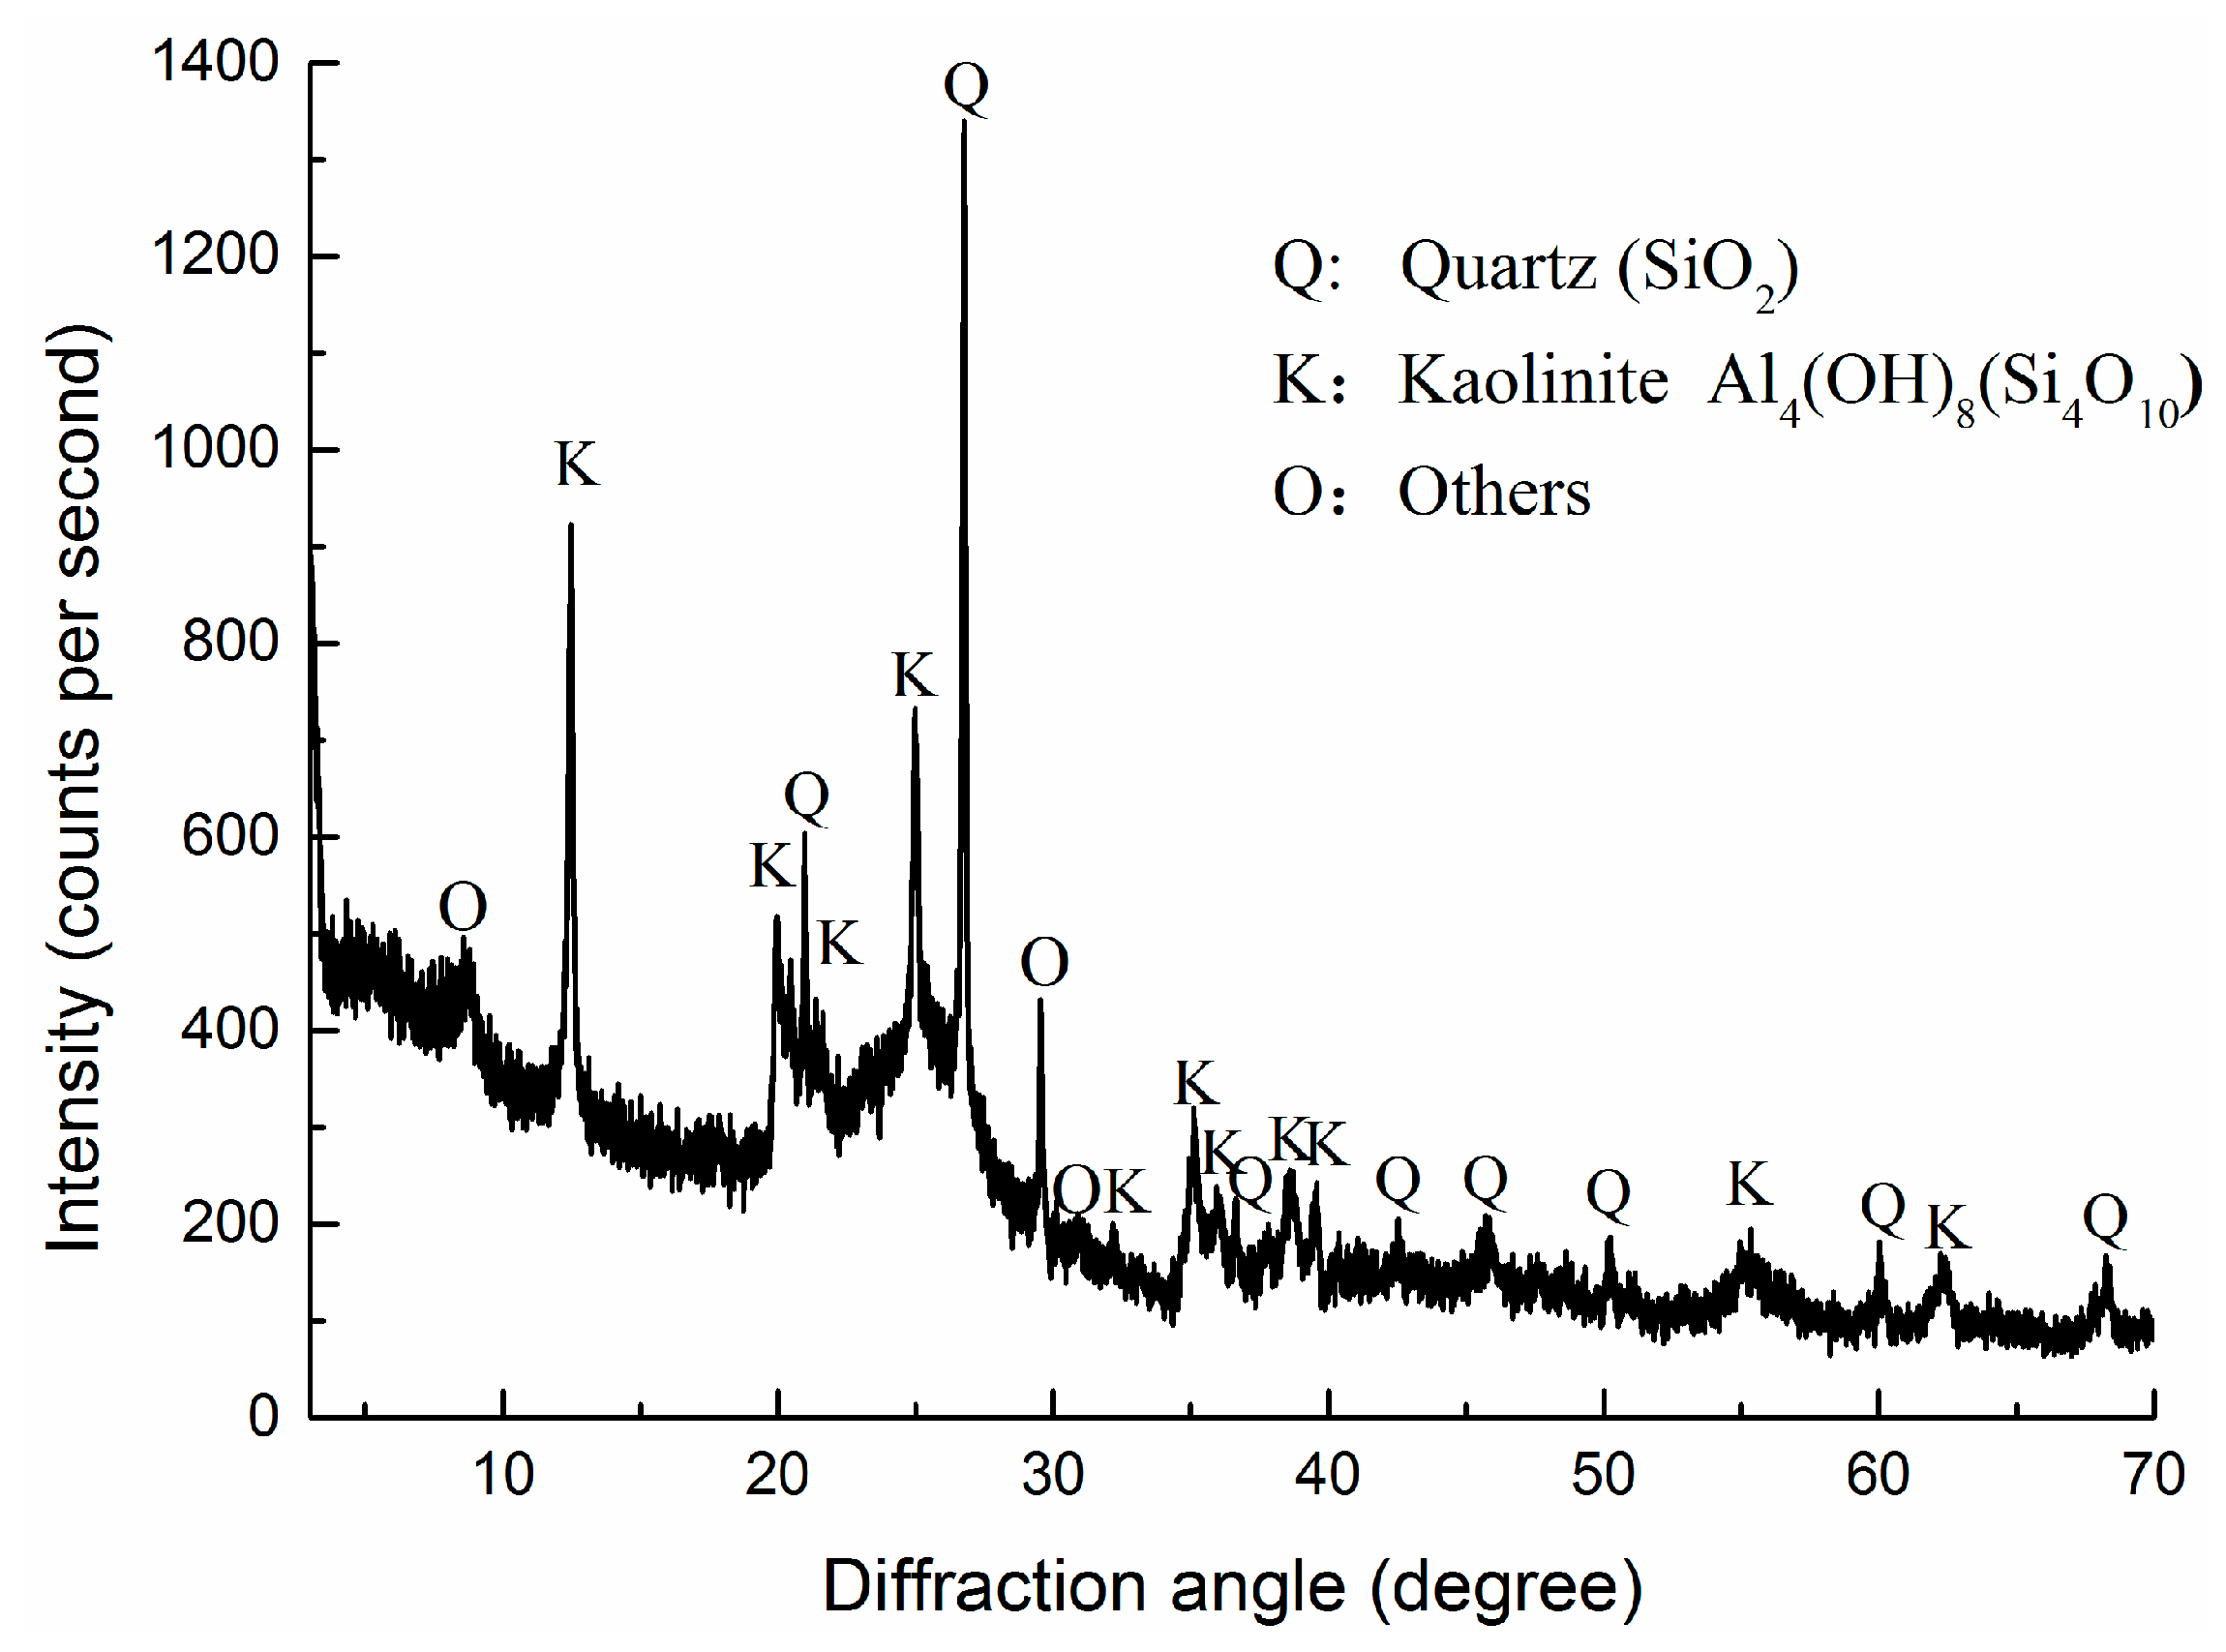
| Minerals | Quartz | Kaolinite | Others |
|---|---|---|---|
| Weight percentage | 12.04% | 9.47% | 3.79% |
| Size | 0–2 mm | 2–5 mm | 5–15 mm | Raw Coal |
|---|---|---|---|---|
| True density | 1.562 g/cm3 | 1.632 g/cm3 | 1.827 g/cm3 | 1.636 g/cm3 |
| Size | Fitting Formula | R-Square |
|---|---|---|
| 0–2 mm | ||
| 2–5 mm | ||
| 5–15 mm | ||
| Raw coal |
| Size | 5–15 mm | 2–5 mm | 0–2 mm |
|---|---|---|---|
| Pressure | |||
| 0 MPa | 0 | 6.54% | 10.03% |
| 5 MPa | 55.96% | 56.78% | 60.18% |
| 10 MPa | 66.97% | 67.96% | 68.76% |
| 15 MPa | 73.64% | 74.19% | 75.04% |
| 20 MPa | 79.41% | 79.55% | 79.73% |
| 25 MPa | 83.74% | 84.06% | 84.06% |
| Standard Uncertainty Component u(xi) | Source of Uncertainty | Value of Standard Uncertainty u(xi) | Sensitive Coefficient: ci = ∂f/∂xi | Component of uc(nt): ui(nt) = |ci|u(xi) (%) |
|---|---|---|---|---|
| u(ρ) | Instrument uncertainty (±0.03% of the indication) | 2.83 × 10⁻⁴ g/cm3 | 0.14654 | 0.00438 |
| Measurement repeatability (±0.01% of the indication) | 4.15 × 10⁻⁵ g/cm3 | |||
| u(m) | Instrument uncertainty (±0.02 g) | 0.0115 g | 0.00111 | 0.00128 |
| u(d) | Instrument uncertainty (±0.002 cm) | 0.00115 cm | 0.09667 | 0.0869 |
| Measurement repeatability | 0.00892 cm | |||
| u(h) | Instrument uncertainty (±0.002 cm) | 0.00115 cm | 0.00314 | 0.00286 |
| Measurement repeatability | 0.00904 cm | |||
| u(h1) | Instrument uncertainty (±0.5% of the indication) | 0.00730 cm | 0.00314 | 0.00229 |
| u(h3) | 0.00154 cm | 0.000484 | ||
| u(h2) | 0.000427 cm | 0.000134 | ||
| u(s) | - | - | - | 0.140 |
© 2018 by the authors. Licensee MDPI, Basel, Switzerland. This article is an open access article distributed under the terms and conditions of the Creative Commons Attribution (CC BY) license (http://creativecommons.org/licenses/by/4.0/).
Share and Cite
Zhang, C.; Zhang, N.; Pan, D.; Qian, D.; An, Y.; Yuan, Y.; Xiang, Z.; Wang, Y. Experimental Study on Sensitivity of Porosity to Pressure and Particle Size in Loose Coal Media. Energies 2018, 11, 2274. https://doi.org/10.3390/en11092274
Zhang C, Zhang N, Pan D, Qian D, An Y, Yuan Y, Xiang Z, Wang Y. Experimental Study on Sensitivity of Porosity to Pressure and Particle Size in Loose Coal Media. Energies. 2018; 11(9):2274. https://doi.org/10.3390/en11092274
Chicago/Turabian StyleZhang, Chenghao, Nong Zhang, Dongjiang Pan, Deyu Qian, Yanpei An, Yuxin Yuan, Zhe Xiang, and Yang Wang. 2018. "Experimental Study on Sensitivity of Porosity to Pressure and Particle Size in Loose Coal Media" Energies 11, no. 9: 2274. https://doi.org/10.3390/en11092274
APA StyleZhang, C., Zhang, N., Pan, D., Qian, D., An, Y., Yuan, Y., Xiang, Z., & Wang, Y. (2018). Experimental Study on Sensitivity of Porosity to Pressure and Particle Size in Loose Coal Media. Energies, 11(9), 2274. https://doi.org/10.3390/en11092274