Article

Multifractal Characteristics and Classification of Tight Sandstone Reservoirs: A Case Study from the Triassic Yanchang Formation, Ordos Basin, China

1
State Key Laboratory of Petroleum Resources and Prospecting, China University of Petroleum, Beijing 102249, China
2
Beijing Key Laboratory of Earth Prospecting and Information Technology, China University of Petroleum, Beijing 102249, China
3
Research Institute of Exploration and Development, PetroChina Changqing Oilfield Company, Xi’an 710021, China
4
National Engineering Laboratory for Exploration and Development of Low-Permeability Oil & Gas Fields, Xi’an 710018, China
*
Author to whom correspondence should be addressed.
Energies 2018, 11(9), 2242; https://doi.org/10.3390/en11092242
Submission received: 26 July 2018 / Revised: 17 August 2018 / Accepted: 17 August 2018 / Published: 27 August 2018

Abstract

:
Pore structure determines the ability of fluid storage and migration in rocks, expressed as porosity and permeability in the macroscopic aspects, and the pore throat radius in the microcosmic aspects. However, complex pore structure and strong heterogeneity make the accurate description of the tight sandstone reservoir of the Triassic Yanchang Formation, Ordos Basin, China still a problem. In this paper, mercury injection capillary pressure (MICP) parameters were applied to characterize the heterogeneity of pore structure, and three types of pore structure were divided, from high to low quality and defined as Type I, Type II and Type III, separately. Then, the multifractal analysis based on the MICP data was conducted to investigate the heterogeneity of the tight sandstone reservoir. The relationships among physical properties, MICP parameters and a series of multifractal parameters have been detailed analyzed. The results showed that four multifractal parameters, singularity exponent parameter (αmin), generalized dimension parameter (Dmax), information dimension (D1), and correlation dimension (D2) were in good correlations with the porosity and permeability, which can well characterize the pore structure and reservoir heterogeneity of the study area, while the others didn’t respond well. Meanwhile, there also were good relationships between these multifractal and MICP parameters.

1. Introduction

Since advanced technologies of hydraulic fracture and horizontal wells were developed, tight sandstones have drawn much attention due to their considerable hydrocarbon productivity [1,2]. Different from conventional reservoirs, it is the pore structure that controls flow capacity, producible pore volumes and production capability of tight sandstone reservoirs, rather than total porosity [3,4]. Tight sandstone reservoirs often have strongly laterally and vertically heterogeneous pore structures, expressed as a big and fast change in porosity and permeability. Therefore, accurate description of the pore structure of tight sandstone is conducive to evaluating the productivity of reservoirs and searching for remaining oil [5,6,7,8,9]. The diagenetic transformation of tight sandstone reservoir is strong, and the types of diagenesis are complex and varied, mainly including mechanical compaction, cementation and dissolution. Varied sedimentation [7], diagenesis [8,9] and tectonism [10] will lead to complicated pore structures, among them compaction will further reduce the porosity, aggravating reservoir heterogeneity. The complex pore structure makes it hard to evaluate and type tight sandstone reservoirs [11,12]. Meanwhile, it is a problem to quantify the heterogeneity through conventional methods, such as log facies analysis, monofractal method.
With the decline in the oil-production of conventional reservoirs after years of production, tight sandstone is becoming more and more important, being regarded as the potential reservoir of the future. Lots of advanced equipment has been applied to investigate the pore structure and heterogeneity of tight sandstones, such as scanning electron microscopy (SEM), nano computed tomography (CT)-scan, mercury injection capillary pressure (MICP), nuclear magnetic resonance (NMR) and low-temperature nitrogen adsorption [13,14,15,16,17,18,19]. Among this, SEM and nano CT-scan equipment can be used to qualitatively describe the pore types and sizes, directly. MICP, NMR and nitrogen adsorption are indirectly indicated the pore structure in rocks by some media. NMR measurement is an important and effective method for studying the pore size distributions, and also, NMR data can be measured both underground and in the laboratory. Many researchers have described the pore size distribution of tight sandstone through NMR data [20,21,22]. However, from previous studies, different types of pore fluid will affect the morphology of NMR T2 spectrum, even when the reservoir is oil-wetted, the NMR T2 spectrum will not truly reflect pore structure [23].
The MICP method assumes that the inner space of the porous material is cylindrical, each pore can be extended to the outer surface of the sample to contact with the mercury directly, and the contact angle is about 140 [24,25]. Under a certain pressure, the method assumes mercury can only penetrate into the pores of the corresponding size, and the amount of mercury injected represents the volume of the internal pores. Increasing the pressure and calculating the amount of mercury entry, the pore volume distribution of porous materials can be measured. Some scholars have also tried to construct MICP data using conventional logs curves or NMR logs [26,27].
The fractal theory was firstly proposed by Mandelbrot [28] in 1982. It is a popular method to describe the self-similar characteristics of irregular geometric figures [29,30]. However, the shapes of most natural objects show the nonuniform and multifractal features. A constant fractal dimension cannot accurately describe an inhomogeneous object. Then, the multifractal theory, a method can provide more information about the pore properties was proposed, it transforms the measurement of self-similarity into multifractal function sets, which are characterized by the multifractal spectrum α ~ f ( α ) and the generalized dimension spectrum q ~ D q [31,32].
Recently, a lot of research investigating the fractal characteristics of rocks has been done, Cai et al. [33] have shown that the multifractal features can be used to describe pore surfaces in hard rocks. Many researchers and scholars have investigated the multifractal characteristics of tight sandstone reservoirs using the NMR T2 spectra of samples at brine-saturated state [4,16,34]. Some researchers have studied the pore structures of tight sandstones using thin section images based on multifractal theory [20,35]. These studies all suggested that the multifractal theory is an effective and convenient method to study the pore structure in unconventional reservoirs.
In this study, firstly MICP data of some tight sandstone core samples from the Chang6 Formation from the later Triassic (Ordos Basin, China) were applied to characterize the heterogeneity of pore structure, and three types of pore structure were divided, from high to low quality, as Type I, Type II and Type III, separately. The pores have been divided into large pores, medium pores and small pores, and the relationships of the proportion of different pores in different types of pore structure were analyzed. Later, the multifractal parameters of MICP data were calculated. The relationships between petrophysical and multifractal parameters were investigated in detail. Through a series of comparisons, the most effective multifractal parameters for characterizing the pore structure of tight sandstone have been proposed.

2. Methodology

2.1. Geological Setting

The Ordos Basin, located in the midwest of China spanning five provinces, covers more than 370,000 square kilometers (Figure 1a,b). It is the second largest sedimentary basin in China [36,37]. The Ordos Basin is a large multicycle cratonic basin with a simple structure. The whole basin is flat, being higher in the east and lower in the west. Low porosity and low permeability are the most notable features of the Yanchang Formation sandstone reservoir. According to the standard of China’s tight oil partition [38,39], the surface air permeability of reservoirs is less than 1 mD for tight oil. The main layers of oil exploration and development in the Ordos Basin, the Chang6 oil-bearing formation, Chang7 oil-bearing formation and Chang8 oil-bearing formation all belong to the tight oil category [10]. The lithostratigraphic section is shown in Figure 1c. In this study, 24 tight sandstone samples were collected by sealing core drilling from the Chang6 Triassic Yanchang Formation to evaluate the petrophysical properties and analyze multifractal features.

2.2. Experiments

To better analyze the multifractal and petrophysical characteristics of the tight sandstone of the samples, a series of experiments were conducted, including routine petrophysical experiments, constant pressure MICP, thin section and SEM observations.
MICP measurements were performed to get the pore size distribution of the tight sandstone samples. The experiments were conducted using AutoPoreIII Mercury Injection equipment (Micromeritics, Norcross, GA, USA) under conditions of 18 °C temperature and relative air humidity (RH) of 55%, following the Chinese Oil and Gas Industry Standard SY/T 5346-2005. The maximum capillary pressure is 49.871 Mpa.
Before thin sections are made, the samples needed to be oil washed, then pumped under vacuum, and a colored epoxy resin injected into the pores. Finally, they were ground to 0.03 mm thickness. A polarizing microscope was used to observe the rock structure, mineral composition and pore characteristics.
The observation of the thin sections was conducted at a temperature of 24 °C and humidity of 35% RH at the China University of Petroleum (Beijing, China). During the course of observation, the magnification ranged from 60 to 2000 with an acceleration voltage of 20 kV.

2.3. Multifractal Analysis Theory

Compared with monofractal analysis, multifractal theory uses a continuous function, termed multifractal singularity spectrum, rather than a single fractal dimension, to characterize the multifractal features. Detailed multifractal theories have been introduced in some references [41,42]. In this paper, the box-counting algorithm multifractal method is adopted and briefly described here.
The MICP data can be distribution can be segmented in N(ε) parts within scale ε: The multifractal theory is mainly used to study the normalized probability distribution of the target objects within the scale. Denoting n as the point number of the MICP data, n could equal to j power of 2 through interpolation method, i.e., n = 2j, j = 1, 2, 3… The scale of MICP can be defined as ε = n*2k (k = 0, 1, 2, …, j). The MICP data can be segmented in N(ε) part within scale ε:
N ( ε )   =   L ε   =   2 k
For each box, the probability mass distribution of box densities can be expressed as:
  P i ( ε ) = v i ( ε ) i = 1 N ( ε ) v i ( ε )  
where v i ( ε ) is MICP data of the ith box, and N(ε) is the total number of boxes for ε.
Defined the partition function as χ q ( ε ) , equal to the q square and weighted sum of the probability P i ( ε ) . χ q ( ε ) can be expressed as:
  χ q ( ε ) = i = 1 N ( ε ) P i ( ε ) q ε τ ( q )  
where χ q ( ε ) is a partition function of q with the scale of ε ; τ ( q ) is the mass exponent.
The number of the boxes in multifractals is defined as N α ( ε ) , which is related to scale ε and can be expressed as [43,44]:
  N α ( ε ) = ε f ( α )  
Meanwhile, when taking the logarithm on both sides of Equation (3), τ ( q ) can be written as:
  τ ( q ) = L n χ q ( ε ) L n ( ε )     ε 0  
The mass exponent τ ( q ) can be taken as the slope of the curve L n χ q ( ε ) ~   L n ( ε ) . τ ( q ) can be used to calculate the generalized fractal dimension D q . With the different values of q, the generalized fractal dimension has different definitions:
D q = { τ ( q ) q 1 = 1 q 1 lim ε 0 log i = 1 N ( ε ) P i ( ε ) q log ε ,     q 1 i = 1 N ( ε ) P i ( ε ) log P i ( ε ) log ε                                       ,     q = 1  
The singularity exponent α and multifractal spectrum f ( α ) can be transformed into [45,46]:
  α ( q ) = d τ ( q ) d q  
and:
  f ( α ) = q α ( q )   τ ( q )  
In fact, the multifractal spectrum α ~ f ( α ) and the generalized dimension spectrum q ~ D q are two sets of different parameters describing the fractal characteristics [4,17,33].

2.4. Mercury Injection Capillary Pressure (MICP) Theory

The MICP method assumes that the inner space of the porous material is cylindrical, and each pore can be extended to the outer surface of the sample to contact with the mercury directly, and the contact angle is about 140° [47,48,49]. Under a certain pressure, the method assumes mercury can only penetrate into the pores of the corresponding size, and the amount of mercury injected represents the volume of the effective porosity, as the following Equation (9) (Young-Laplace law) shows [25]:
P H g = 2 σ H g cos θ H g r  
where P H g is capillary pressure, MPa; r is the pore throat radius, μm, when the capillary pressure is equal to P H g ; σ H g is surface tension, mN/m, always taken as 480 mN/m, θ H g is contact angle, (°), about 140°. So, Equation (9) can be written as:
  r = 0.735 P H g  
Increasing the pressure and calculating the amount of mercury entry, the pore volume distribution of porous materials can be measured [50,51].
In order to better analyze MICP data, several related parameters P50, R50, r ¯ , Pd, Smax and We are introduced. P50 is median pressure, MPa, referring to the capillary pressure corresponding to the mercury saturation 50%. R50 is the median radius, μm, pore radius corresponding to median pressure P50. r ¯ is the average throat radius, μm, indicating the pore structure distribution. The three front parameters, P50, R50 and r ¯ all reflect the physical properties of rock pores. Pd, Smax and We are three MICP parameters, respectively, referring to displacement pressure (MPa), maximum mercury saturation (%) and efficiency of mercury withdrawal (%). The latter three parameters, Pd, Smax and We reflect the difficulty of mercury injection and mercury withdrawal, are also the embodiment of the complexity of the pore structure and clay content [52,53].

3. Results and Discussion

3.1. Porosity, Permeability and MICP Data

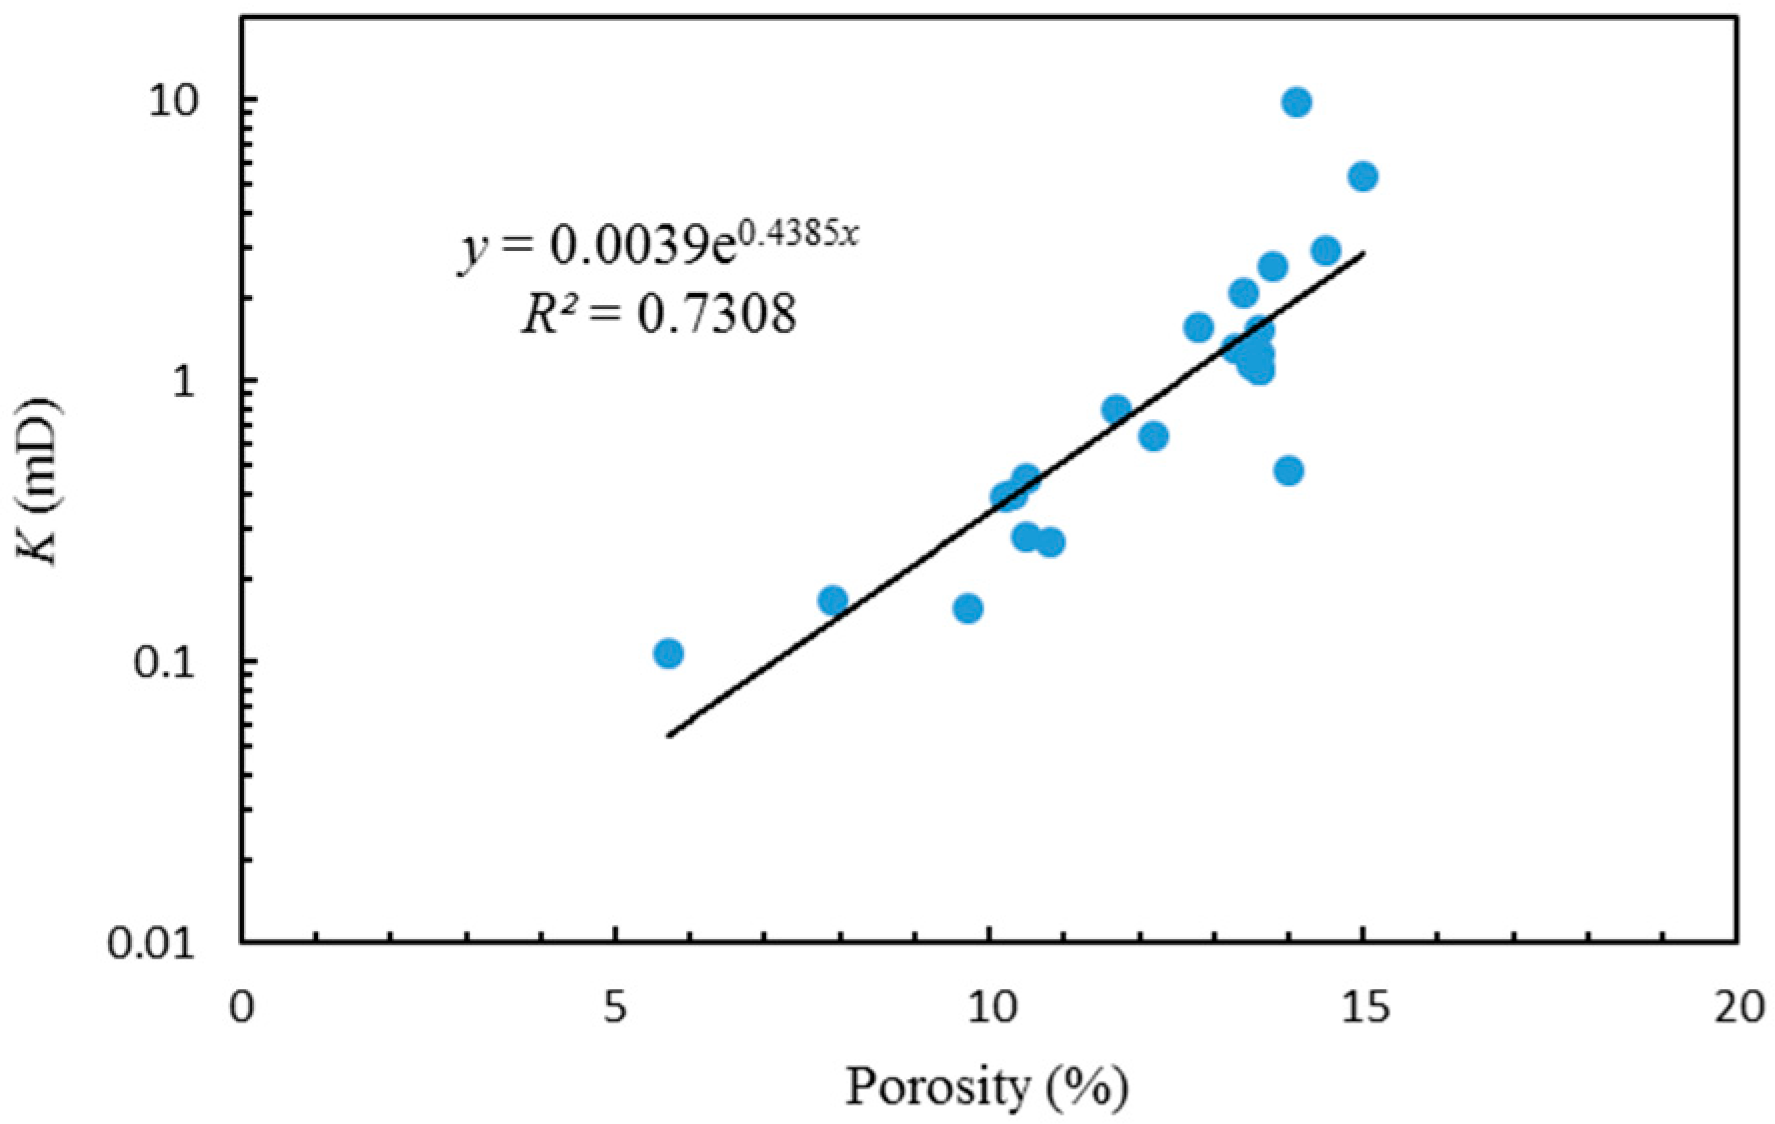
The porosity and permeability (K) values of the samples are listed in Table 1, together with a series of MICP parameters. The porosity range of the samples is from 5.7% to 15% with an average value of 12.10%. The permeability ranges from 0.108 mD to 9.987 mD with most of them less than 1 mD, and thus corresponding to tight sandstone. The relationship between the porosity and permeability is shown in Figure 2. The pore throat sizes calculated by Equation (10) are divided into three categories, large pores (pore throat sizes > 10 µm), medium pores (pore throat sizes range from 1–10 µm) and small pores (pore throat sizes < 1 µm). The proportions of different types of pores are listed in Table 1, too.
The average pore radius r   ¯ of the samples is distributed between 0.0629–5.2180 μm, with an average value of 0.4677 μm. The displacement pressure Pd ranges from 0.1289 MPa to 5.218 MPa, showing a good negative correlation with r ¯ . The sensitivity to the permeability of different parameters listed in Table 1 is diverse. Among them, only the average pore radius r ¯ and displacement pressure Pd show a good correlation (or negative correlation) with permeability ( R 2 > 0.7 ), while the correlations between permeability and the other petrophysical parameters are less the 0.25. r ¯ and Pd are good parameters to reflect the heterogeneity of tight sandstone in the study area. The maximum capillary pressure is only 49.871 Mpa, the maximum mercury saturation Smax of almost all samples reaches over 70%. This ensures that our experimental mercury injection curves can reflect most pore volume, some microporous information still will be omitted. When studying the reservoirs with lower permeability, the maximum capillary pressure should be higher than 100 MPa [54]. The mercury removal efficiency of the samples is about 30%. The efficiency of mercury withdrawal We is often influenced by physical properties, the type and content of clay. In general, the better the physical properties are, the greater mercury withdrawal efficiency is [55]. The values of Pd and We shows that the pore throats are fine and have poor connectivity and low percolation capacity.

3.2. Classification of the Pore Structure

Only partial thin sections and electron micrographs of samples were collected and observed. Through the observation and comparison of the thin sections, most of the samples belong to lithic feldspar sandstone and lithic feldspar sandstone (Table 2), and the rock particles are not well round, with a medium sorting, basically angular or sub angular. The primary intergranular pores as the most important pore space, are not developed. Plastic mica minerals are filled between particles, damaging the seepage capacity of rocks (Figure 3a,b). The surface of some particles is covered by padded chlorite, as Figure 3c shows. The development of chlorite always indicates the dominant reservoir [37]. Dissolution of feldspar particles has a constructive effect on pore structure (Figure 3a,d). In the study reservoir, the higher content of chlorite and feldspar represented the improvement of the porosity and permeability. Considering the accuracy of data from thin section observations, no further quantitative analysis of mineral content was made.
The samples with different pore structure have been divided into three types based on porosity, permeability, pore structure parameters, and the proportion of different pores. Pore structure of three types of reservoirs are represented by samples in Figure 4. The range and mean value of the parameters of different types are listed in Table 3.

3.3. Pore Characteristics of Reservoirs with Different Pore Structure Types

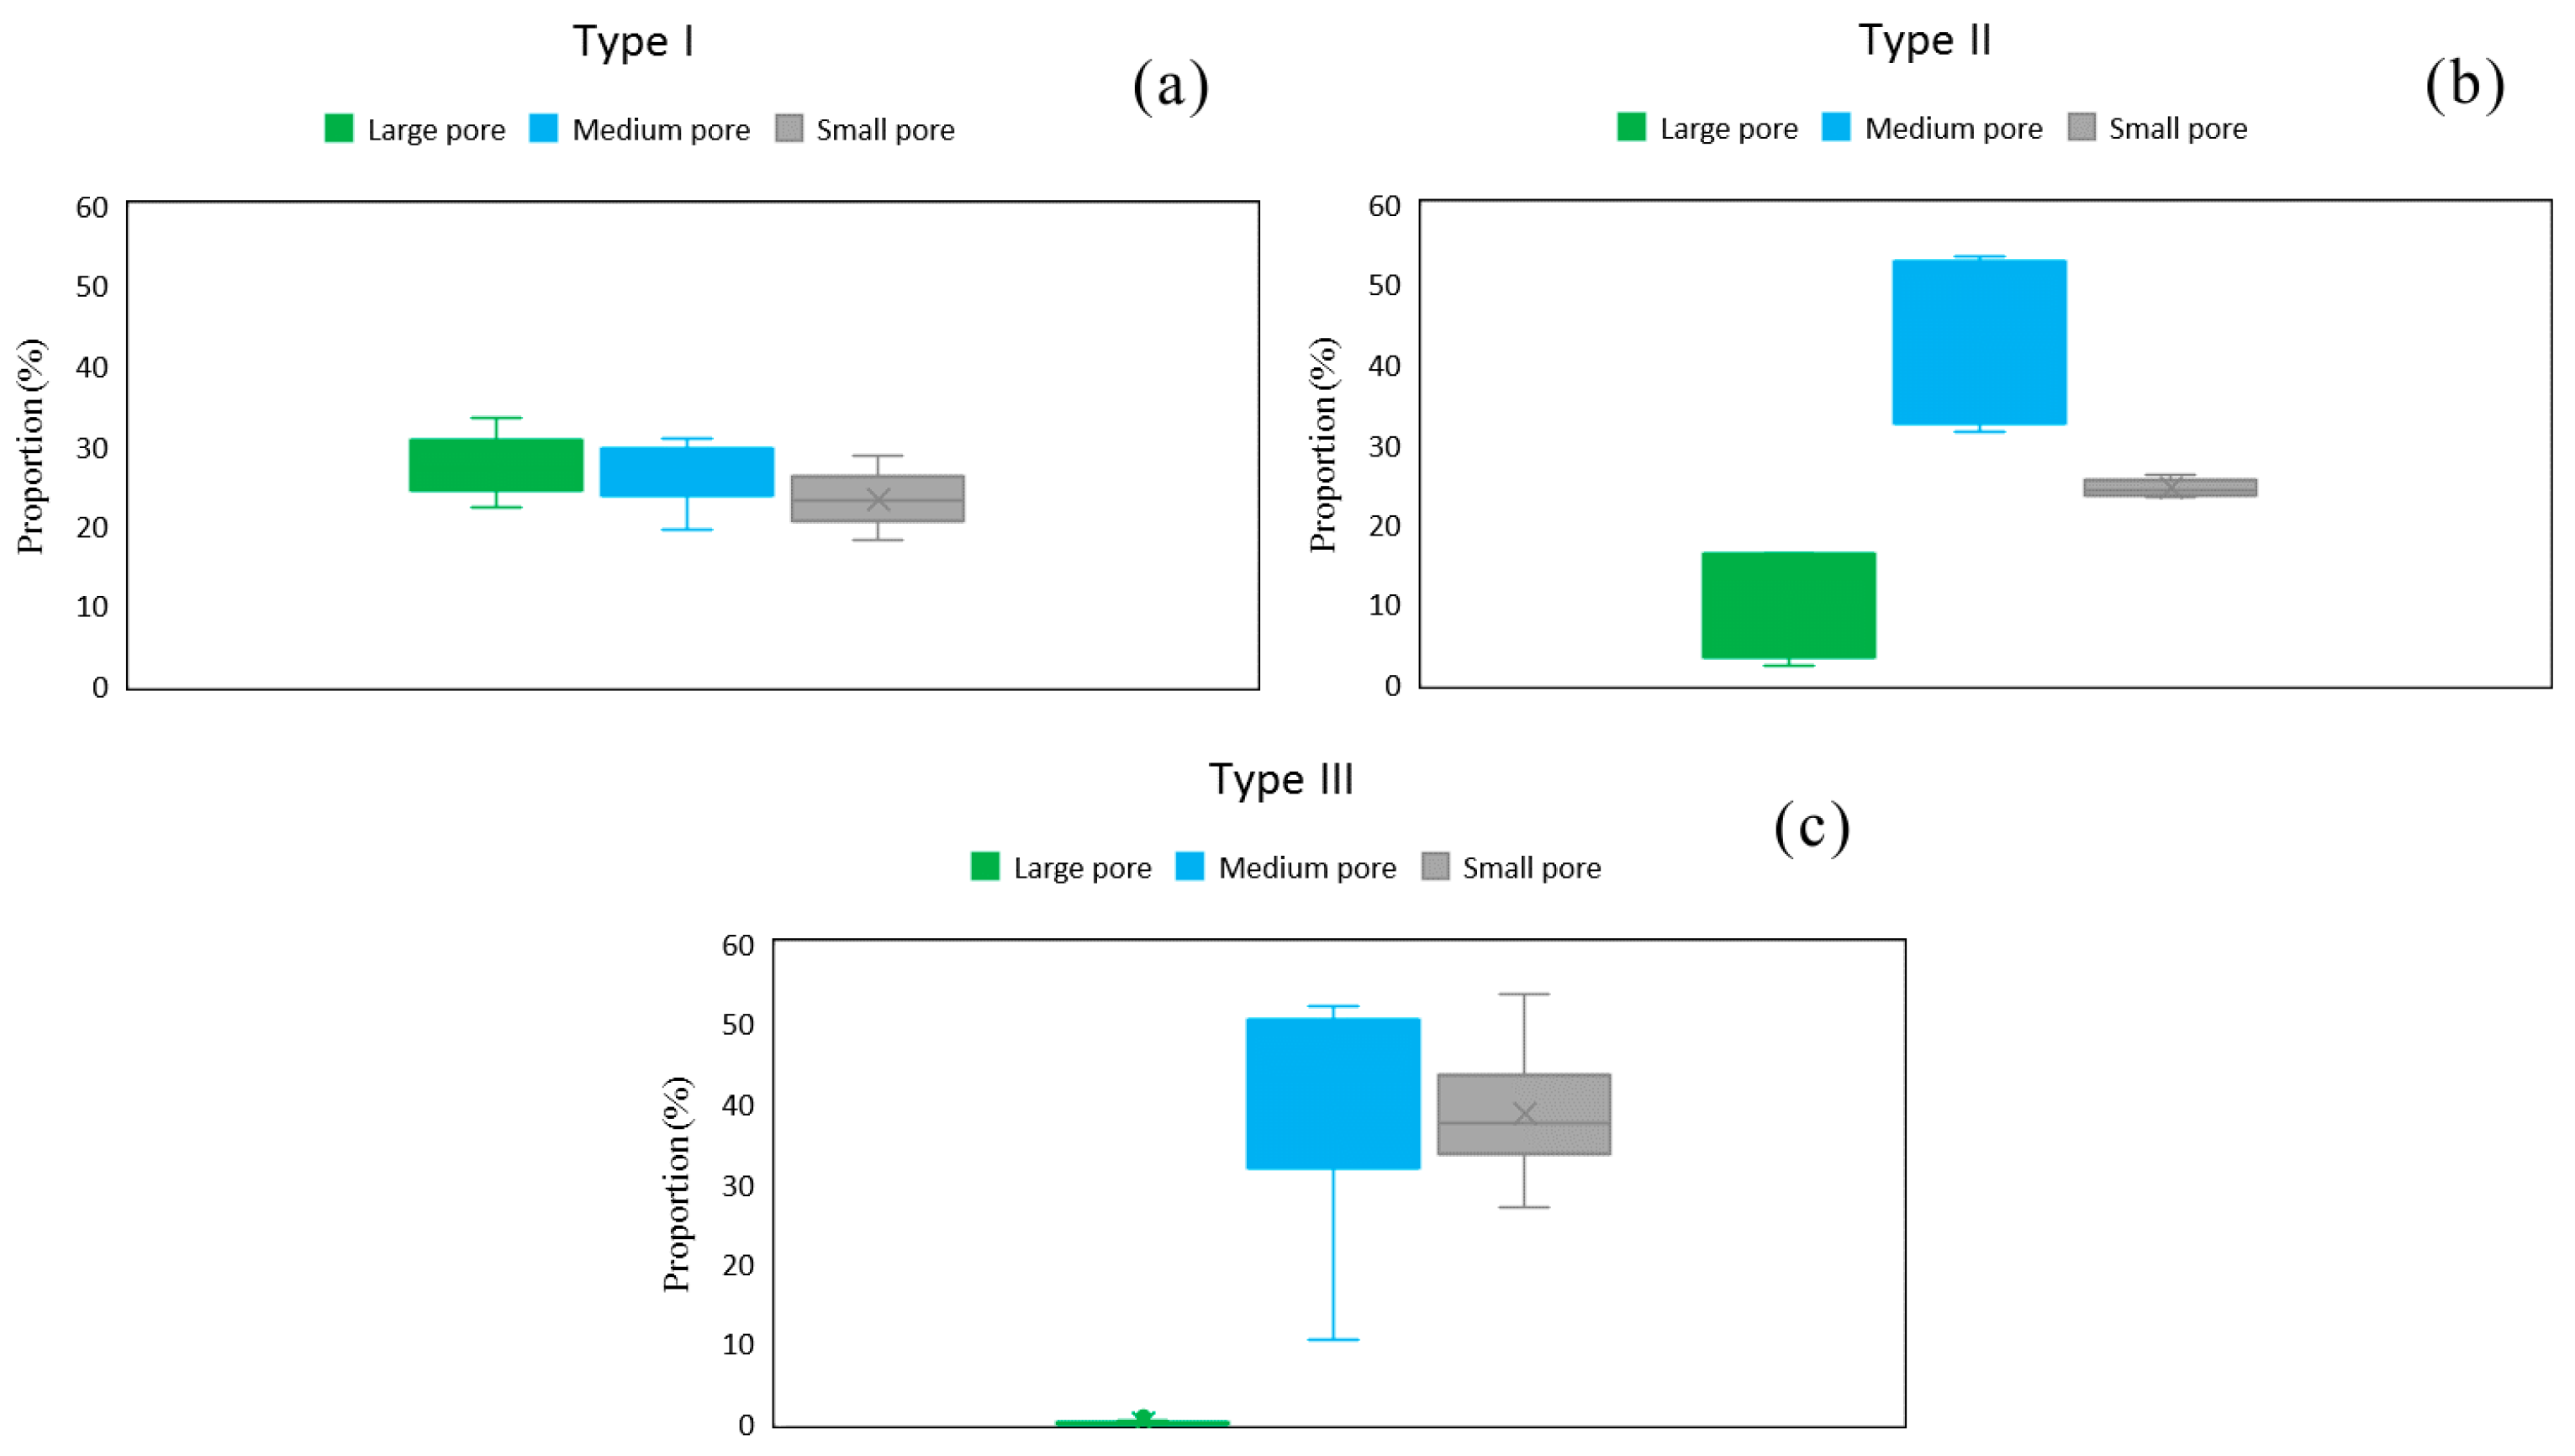
As Figure 4 and Figure 5 show, different types of samples have different pore structures. Samples of Type I belong to the best reservoir in the study formation. The average porosity and permeability are the highest among the three types, are 13.81% and 3.160 mD, respectively. Large pores and medium pores are the main channels of Type I reservoir. The average proportion of large pore and medium pore are respectively 27.5% and 26.25%. Both of them are important indicators of permeability. With the porosity and permeability increasing in Type I reservoir, the proportion of medium pore decreases and the large pore proportion increases (Figure 6). The proportion of large pore has a good positive correlation with the permeability ( R 2 = 0.56 ), while the proportion of medium pore has a better negative correlation with the permeability ( R 2 = 0.75 ). Because the contribution of the large pores to the permeability is far greater than medium pores and small pores, and with the increasing proportion of the medium pores, the proportion of the large pores will decrease. Therefore, the proportion of the medium pores seems to be negatively correlated with the permeability. Meanwhile, as a non-major seepage channel, the change of small pore proportion has little effect on the permeability of Type I reservoirs.
The average porosity and permeability of Type II reservoir are 13.68% and 1.011 mD, tighter than Type I reservoir. In Type II reservoir, the proportion of medium pore ranges from 33.5% to 53.54%, with an average value of 43.83%. The medium pores, distributed from 1 μ m to 10 μ m seem to be the main seepage channels of the Type II reservoir, with the highest proportion. But with the increasing of the proportion of medium pore, permeability shows a reduced trend. In fact, the large pores of less proportion still greatly affected the permeability of samples. With the difference in diagenesis and cementation types, there is a bad correspondence between permeability and the proportion of different pores in Type II reservoir.
In reservoirs with Type III pore structure, the distribution of the pores is very different from the two above. The values of porosity and permeability are extremely low. There are little large pores; medium pores are the most major storage space and percolation path. With the increase of medium pore proportion, the permeability increases. In this kind of reservoirs, the proportion of medium pores and small pores both have good correlations with permeability. The Type III reservoir is the tightest type among them, with an average permeability of 0.369 mD.

3.4. Multifractal Spectrum Parameters

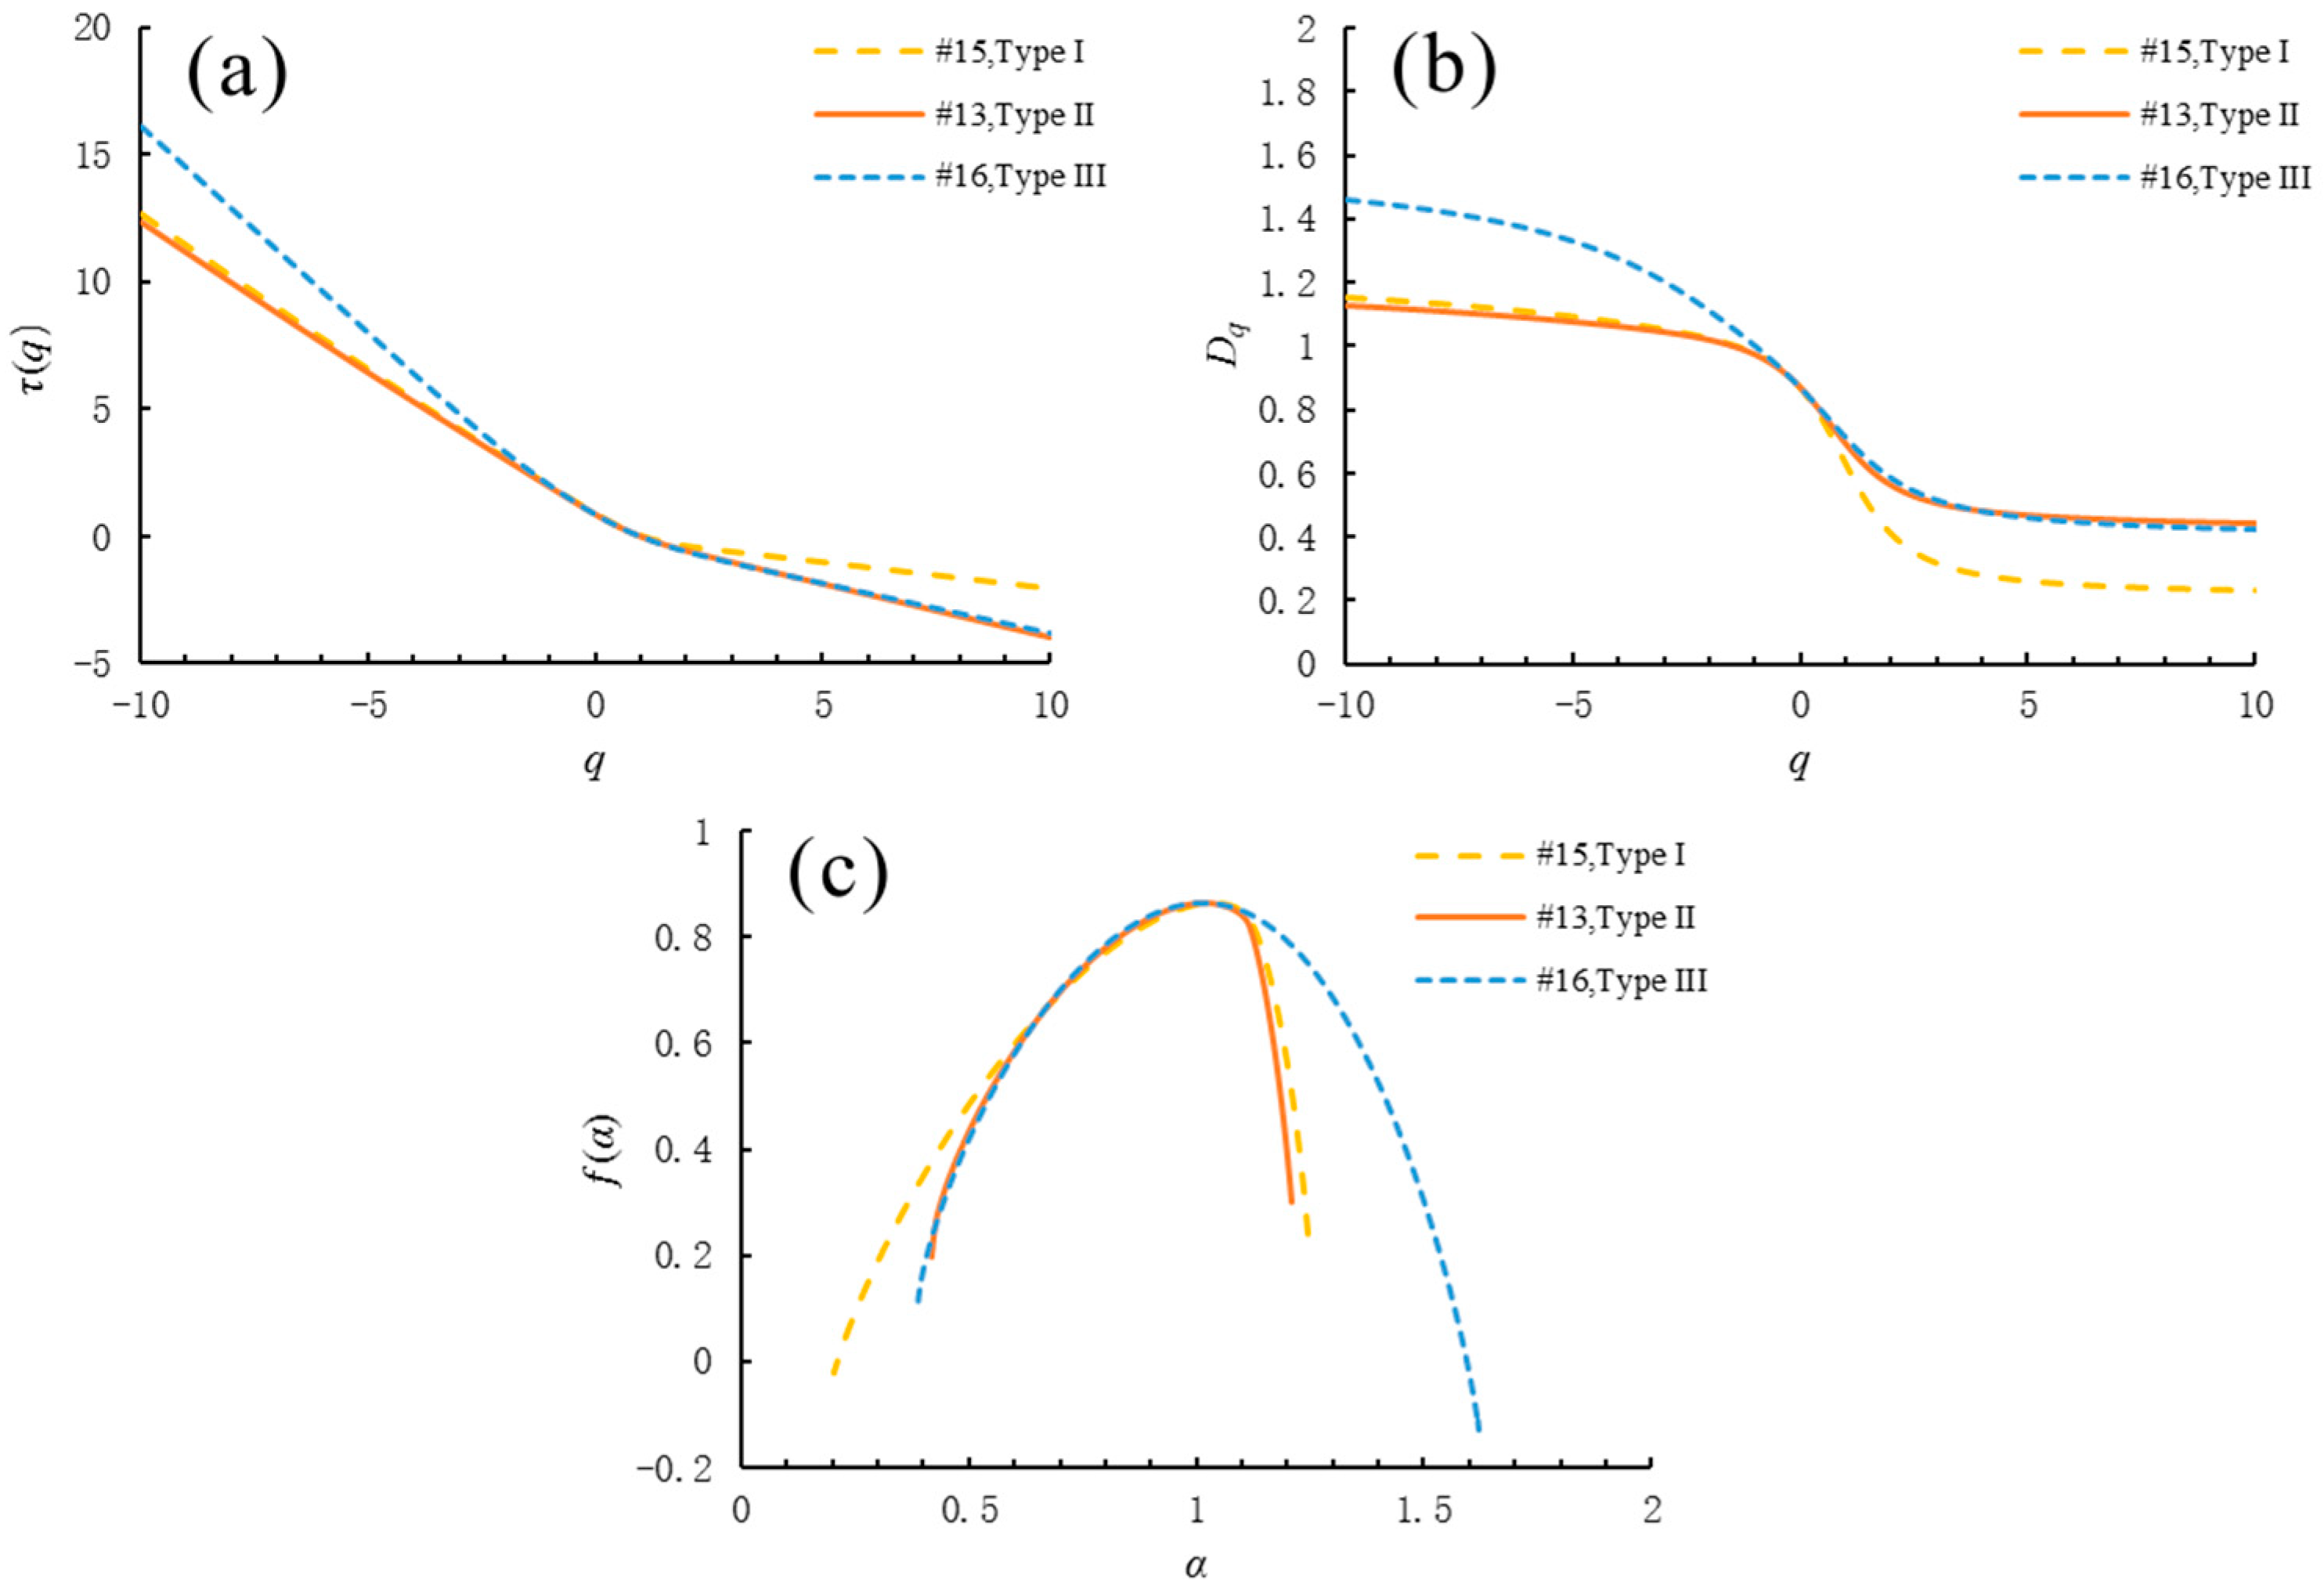
In this research, the values of q range from −10 to 10, with a step of 0.1. With the different values of q, the mass exponent τ ( q ) , the slope of the curve L n χ q ( ε ) ~   L n ( ε ) , can be described by Figure 7. The mass exponent spectrum q ~ τ ( q ) is nonlinear, indicating the multifractal characteristics of MICP data. After the determination of τ ( q ) , the multifractal spectrum α ~ f ( α ) and the generalized dimension spectrum q ~ D q can be calculated by Equations (6) and (8), and the results are shown in Figure 7.
As q increases from −10 to 10, D q gradually decreased, eventually approaching a balance, where D10 represents Dmin and D10 represents Dmax. D0, D1 and D2 also are important dimension spectrum parameters, with the meanings of the capacity dimension parameter, information dimension parameter and correlation dimension parameter, respectively.
The multifractal spectrum α ~ f ( α ) can also reveal the multifractal characteristics of the tight sandstones. αmin and αmax represent α−10 and α10, respectively. At the same time, αmin is a subset of the maximum probability, while αmax is corresponding to a subset of the minimum probability. When q < 0, f ( α ) increases as α increasing. Contrary to when q < 0, f ( α ) decreases as α increases. The singularity strength range is defined as Δ α   =   α max   α min. Δ α is used to describe the complexity and heterogeneity of multifractal objects. With the heterogeneity of the pore structure increasing, Δ α increases. The parameter Δ f is defined as the difference between the value of f ( α m a x ) and f ( α m i n ) , which is equal to the ratio of the minimum value to the maximum value of multifractal singularity spectrum [4].

3.5. Multifractal Characteristics of Pore Structure in Tight Sandstones

Multifractal analysis was performed on all the MICP data of tight sandstone samples, and the relationship trends of mass exponent spectrum q ~ τ ( q ) , the generalized dimension spectrum q ~ D q and the multifractal spectrum α ~ f ( α ) were similar to Figure 7. However, the characteristics of the multifractal spectrum of samples with different pore structures are distinctly different. All three types of tight sandstones have strong multifractal characteristics and heterogeneity, as Figure 8 shows. The mass exponent spectrum q ~ τ ( q ) and the generalized dimension spectrum q ~ D q of different rock types are monotonically decreasing. Type I pore structure has the highest values of τ max and Dmax, while Type III pore structure always has the highest values of τ min and Dmin. In the multifractal spectrum α ~ f ( α ) , the highest points of f ( α ) are almost the same. With the changes of pore structure types, the left and right hook both change a lot, which indicates the heterogeneity of pore throat distribution of different types of reservoirs.
The morphological parameters, such as αmax, αmin, Dmax, Dmin, D1, D2,   f max,   f min, Δα and △ f , were obtained from the analysis of the multifractal spectrum α ~ f ( α ) and the generalized dimension spectrum q ~ D q . Table 4 lists the multifractal parameters of three pore structure types. The average values of αmax, αmin, Dmax, Dmin, D1, D2 and f min increase from Type I to Type III reservoir, while the average values of f max and △ f decrease. In Table 4, among all the multifractal parameters, αmin, Dmax, D1, D2 and f max can be used to type the different pore structure types.

3.6. The Relationship between Multifractal Parameters and the Porosity and Permeability

In Table 4, a series of multifractal parameters αmax, αmin, Dmax, Dmin, D1, D2,   f max,   f min, Δα and △ f were used to classify the pore structure types. Figure 9 shows that the parameters αmax, αmin, Dmax, Dmin, D1, D2, and Δα are negatively correlated with porosity and permeability, whereas f max and △ f are negatively correlated with the porosity and permeability. As Figure 9 shows, some multifractal parameters, such as αmin, Dmax, D1, and D2 are in strong correlations with porosity and permeability, with the absolute values of the correlation coefficients higher than 0.57.
They can be used to effectively indicate the heterogeneity of pore structure. Meanwhile, the other multifractal parameters, αmax, Dmin,   f max,   f min, Δα and △ f display weak correlations with porosity and permeability, with correlation coefficients ranging from 0.0112 to 0.5097. Although these parameters are different in different types of reservoirs, the correlation coefficients are still not high enough, which might relate to the pore throat tortuosity and different cementation type. In conclusion, multifractal parameters, αmin, Dmax, D1, and D2 are great indicators of the porosity and permeability in tight sandstone reservoirs.

3.7. The Relationship between Multifractal Parameters and Pore Structure Parameters

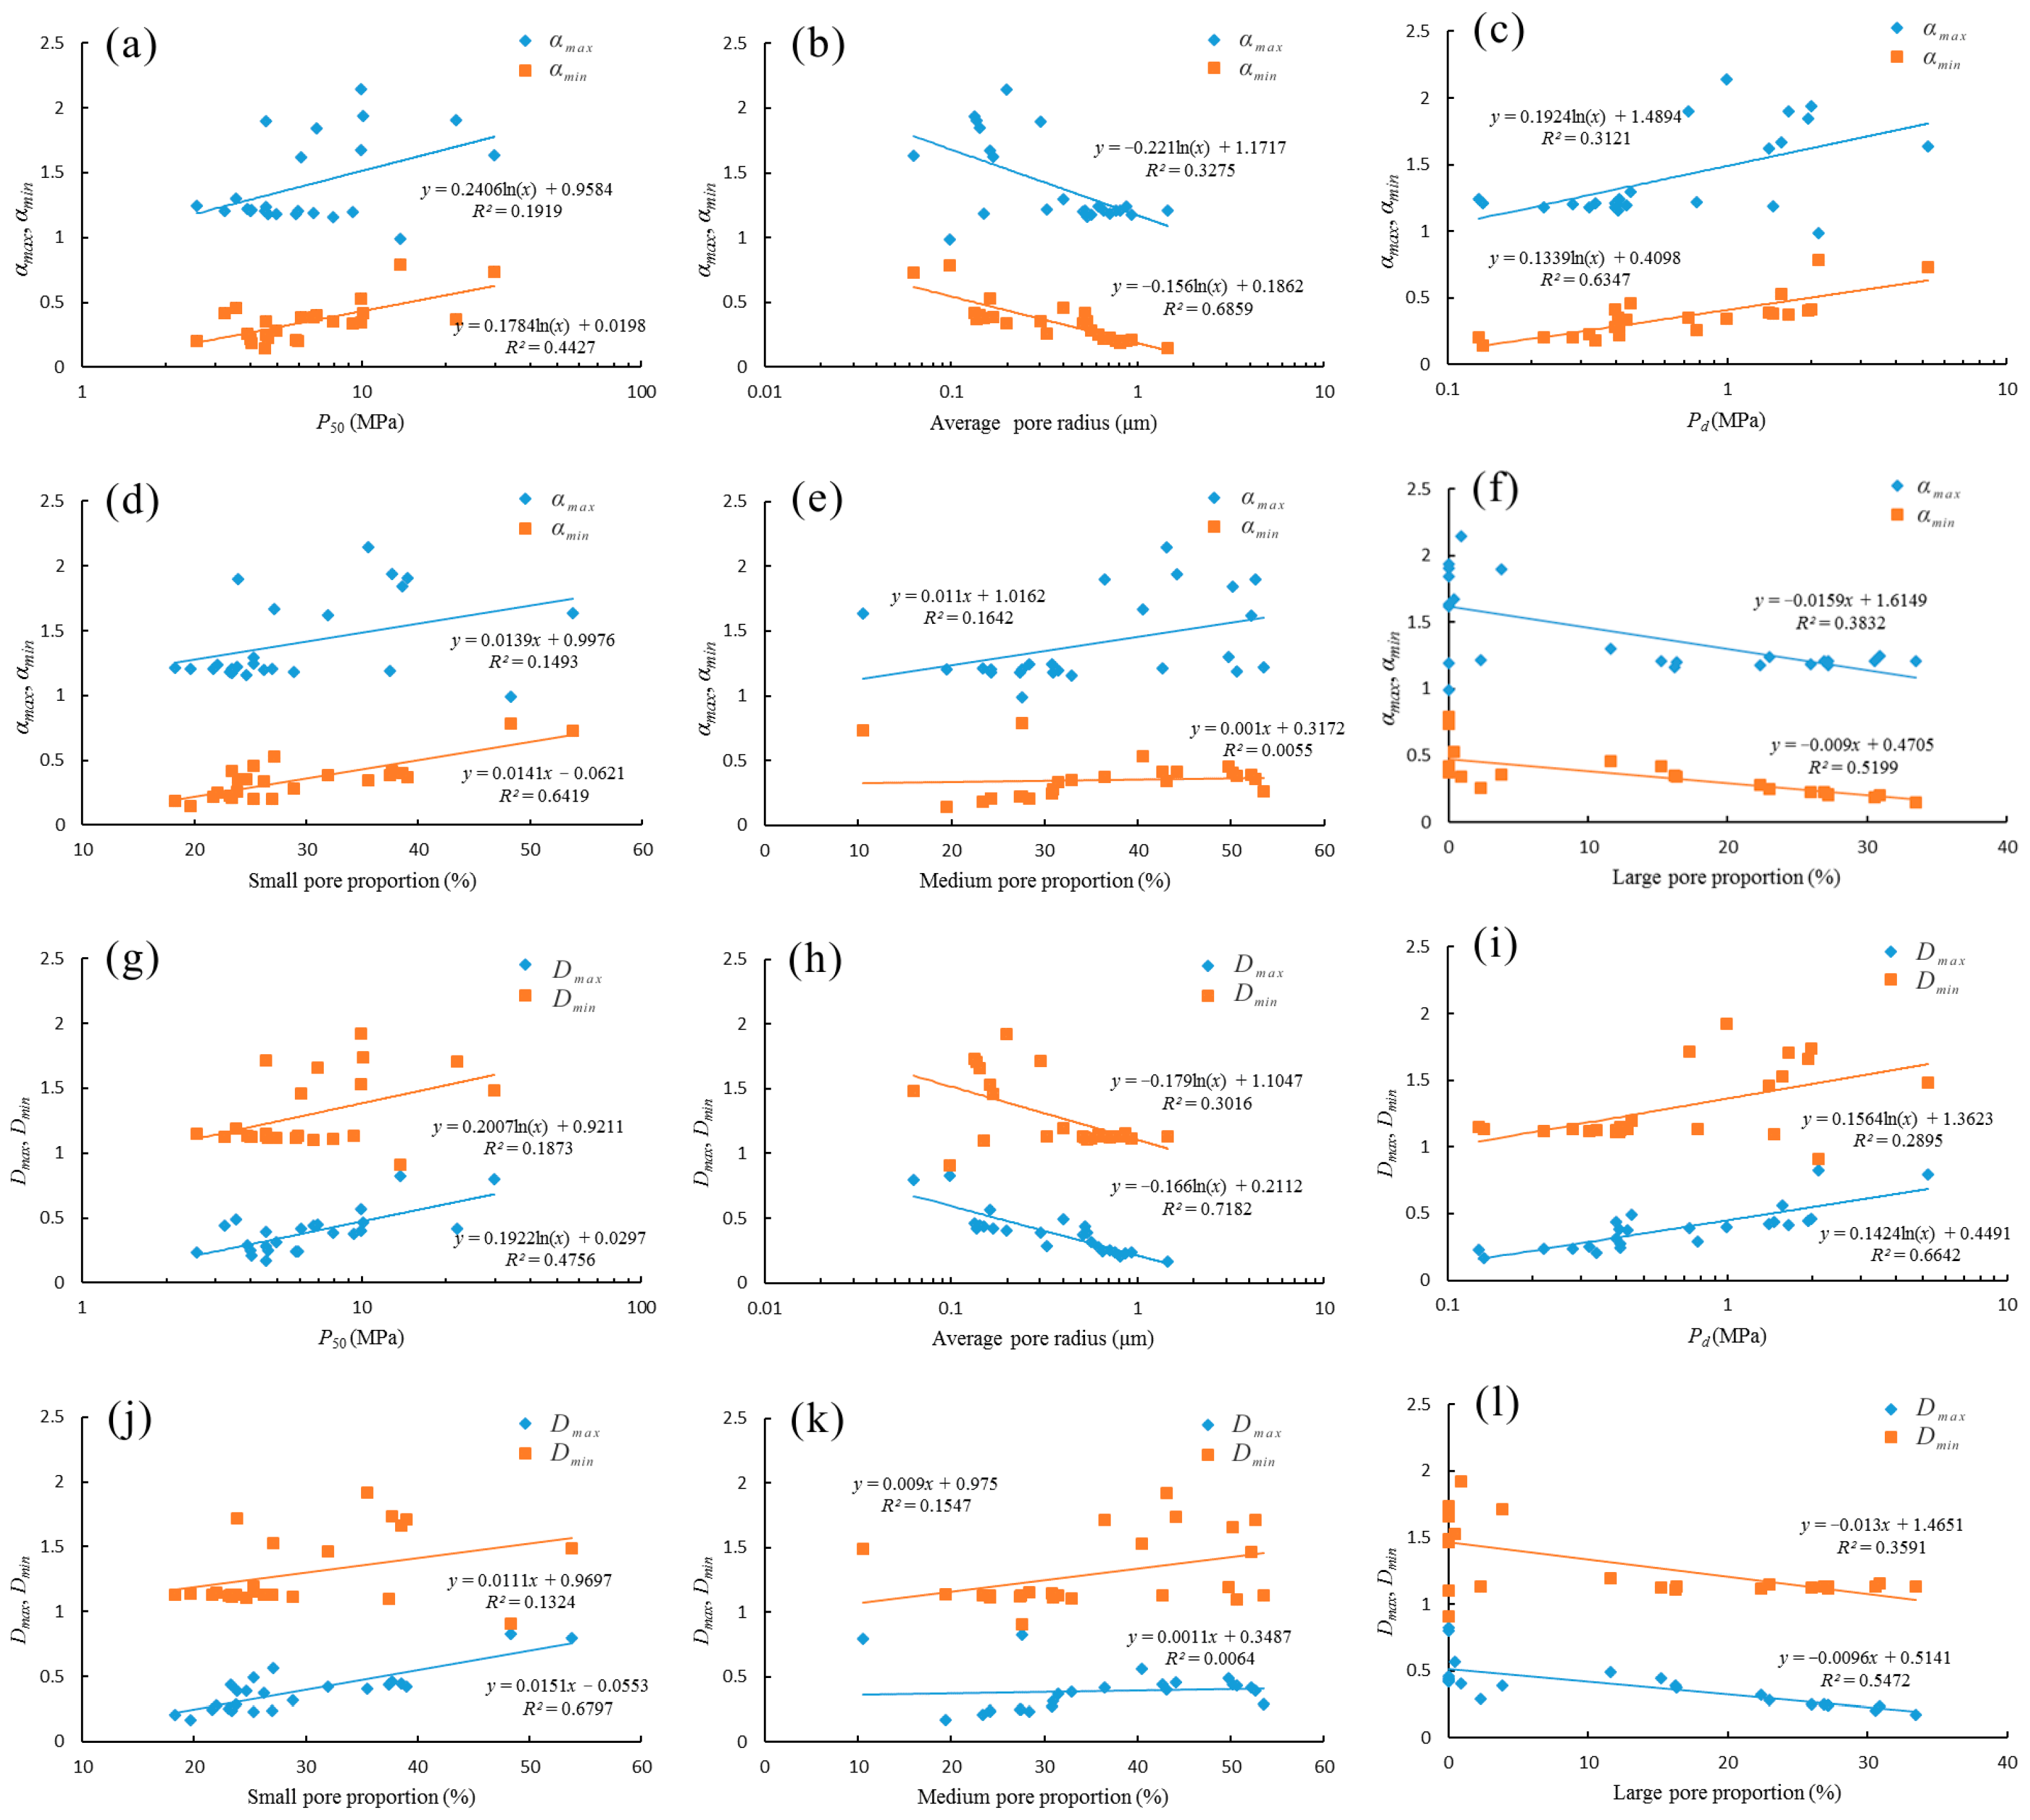
The cross plots between multifractal parameters and MICP parameters are shown in Figure 10, and the correlation coefficients are listed in Table 5. There are fine correlations between the pore structure parameters and multifractal parameters, too. P50 and Pd are positively correlated with αmax, αmin, Dmax, Dmin, D1, D2,   f min and Δα, but negatively correlated with f max and △ f , with logarithmic curve fitting. r ¯ is negatively correlated with αmax, αmin, Dmax, Dmin, D1, D2,   f min and Δα, but positively correlated with f max and △ f , with logarithmic curve fitting. The correlation coefficients between small pore proportion and large proportion to multifractal parameters are good but totally opposite, as their contributions to the permeability are different. Combined with the preceding conclusions, the average pore radius r ¯ and the displacement pressure Pd are good parameters to reflect the heterogeneity of tight sandstone in the study area; the multifractal parameters αmin, Dmax, D1 and D2 display strong correlations with porosity and permeability. The multifractal parameters αmin, Dmax, D1 and D2 are also in good correlation with both the average pore radius r ¯ and the displacement pressure Pd.

4. Conclusions

In this research, the pore structures of the Triassic Yanchang Formation in the Ordos Basin, China were studied. A series of experiments were conducted to collect more geophysical information about the tight sandstone samples. Different MICP parameters and multifractal parameters were used to characterize the heterogeneity of the tight sandstone and type the reservoirs. The following conclusions were obtained:
(1) The pore structures of the tight sandstone reservoir of the study area can be classified into three types. Type I reservoir indicates the most effective reservoir, and large pores with a pore throat bigger than 10 μ m are the main seepage channel. Type III reservoir has little large pores, the main percolation channels of Type III are small pores. The permeability of Type II reservoir is between them.
(2) Different minerals have different effects on the physical properties of tight sandstone reservoirs. Plastic mica minerals filled between particles will negatively affect the seepage capacity of rocks. The higher content of chlorite and feldspar always results in an improvement of the porosity and permeability. The qualitative relationships between them need further research.
(3) The average pore radius r ¯ and the displacement pressure Pd are sensitive and effective parameters. They can be used to reflect the heterogeneity of tight sandstone in the study area.
(4) The multifractal parameters, αmin, Dmax, D1, and D2 are great indicators of the heterogeneity of reservoirs, they are also in good correlation with the average pore radius r ¯ and the displacement pressure Pd.

Author Contributions

The main research idea was contributed by Z.J. and Z.M. The manuscript preparation and experiments parts were complicated by Z.J., with the assistance of Y.S. Z.M. and D.W. proposed several suggestions on geological knowledge and assisted on manuscript revising work. All authors revised and approved the publication of the paper.

Funding

This research was funded by the Major National Oil & Gas Specific Project of China (No. 2016ZX05050).

Acknowledgments

Research for this paper was supported by the Major National Oil & Gas Specific Project of China (No. 2016ZX05050). The authors also appreciate the help and support from State Key Laboratory of Petroleum Resources and Prospecting, and Beijing Key Laboratory of Earth Prospecting and Information Technology at China University of Petroleum, Beijing.

Conflicts of Interest

The authors declare no conflict of interest.

References

  1. Guo, C.; Xu, J.; Wei, M.; Jiang, R. Experimental study and numerical simulation of hydraulic fracturing tight sandstone reservoirs. Fuel 2015, 159, 334–344. [Google Scholar] [CrossRef]
  2. Zeng, F.; Guo, J.; Liu, H.; Yin, J. Optimization design and application of horizonal well-staged fracturing in tight gas reservoirs. Acta Pet. Sin. 2013, 34, 959–968. [Google Scholar]
  3. Sakhaee-Pour, A.; Bryant, S.L. Effect of pore structure on the producibility of tight-gas sandstones. AAPG Bull. 2014, 98, 663–694. [Google Scholar] [CrossRef]
  4. Zhao, P.; Wang, Z.; Sun, Z.; Cai, J.; Wang, L. Investigation on the pore structure and multifractal characteristics of tight oil reservoirs using NMR measurements: Permian Lucaogou Formation in Jimusaer Sag, Junggar Basin. Mar. Pet. Geol. 2017, 86, 1067–1081. [Google Scholar] [CrossRef]
  5. Cai, J.; Wei, W.; Hu, X.; Wood, D.A. Electrical conductivity models in saturated porous media: A review. Earth-Sci. Rev. 2017, 171, 419–433. [Google Scholar] [CrossRef]
  6. Anovitz, L.M.; Cole, D.R. Characterization and analysis of porosity and pore structures. Rev. Mineral. Geochem. 2015, 80, 61–164. [Google Scholar] [CrossRef]
  7. Higgs, K.E.; Zwingmann, H.; Reyes, A.G.; Funnell, R.H. Diagenesis, porosity evolution, and petroleum emplacement in tight gas reservoirs, Taranaki basin, New Zealand. J. Sediment. Res. 2007, 77, 1003–1025. [Google Scholar] [CrossRef]
  8. Hu, Q.; Ewing, R.P.; Dultz, S. Low pore connectivity in natural rock. J. Contam. Hydrol. 2012, 133, 76–83. [Google Scholar] [CrossRef] [PubMed]
  9. Hansen, J.P.; Skjeltorp, A.T. Fractal pore space and rock permeability implications. Phys. Rev. B 1988, 38, 2635–2638. [Google Scholar] [CrossRef]
  10. Fu, J.; Yu, J.; Xu, L.; Niu, X.; Feng, S.; Wang, X.; You, L.; Li, T. New progress in exploration and development of tight oil in Ordos basin and main controlling factors of large-scale enrichment and exploitable capacity. China Pet. Explor. 2015, 20, 9–19. [Google Scholar]
  11. Gao, H.; Li, H. Pore structure characterization, permeability evaluation and enhanced gas recovery techniques of tight gas sandstones. J. Nat. Gas Sci. Eng. 2016, 28, 536–547. [Google Scholar] [CrossRef]
  12. Lai, J.; Wang, G.; Cao, J.; Xiao, C.; Wang, S.; Pang, X.; Dai, Q.; He, Z.; Fan, X.; Yang, L.; et al. Investigation of pore structure and petrophysical property in tight sandstones. Mar. Pet. Geol. 2018, 91, 179–189. [Google Scholar] [CrossRef]
  13. Zou, C.; Zhu, R.; Bai, B.; Yang, Z.; Wu, S.; Li, X. First discovery of nanopore throat in oil and gas reservoir in China and its scientific value. Acta Pet. Sin. 2011, 27, 1857–1864. [Google Scholar]
  14. Shi, X.; Pan, J.; Hou, Q.; Jin, Y.; Wang, Z.; Niu, Q.; Li, M. Micrometer-scale fractures in coal related to coal rank based on micro-CT scanning and fractal theory. Fuel 2018, 212, 162–172. [Google Scholar] [CrossRef]
  15. Pan, S.; Zou, C.; Yang, Z.; Dong, D.; Wang, Y.; Wang, S.; Wu, S.; Huang, J.; Liu, Q.; Wang, D.; et al. Methods for shale gas play assessment: A comparison between Silurian Longmaxi shale and Mississippian Barnett shale. J. Earth Sci. 2015, 26, 285–294. [Google Scholar] [CrossRef]
  16. Lai, J.; Wang, G.; Fan, Z.; Chen, J.; Wang, S.; Zhou, Z.; Fan, X. Insight into the pore structure of tight sandstones using NMR and HPMI measurements. Energy Fuels 2016, 30, 10200–10214. [Google Scholar] [CrossRef]
  17. Ge, X.; Fan, Y.; Zhu, X.; Chen, Y.; Li, R. Determination of nuclear magnetic resonance T2 cutoff value based on multifractal theory—An application in sandstone with complex pore structure. Geophysics 2014, 80, D11–D21. [Google Scholar] [CrossRef]
  18. Cao, Z.; Liu, G.; Zhan, H.; Li, C.; You, Y.; Yang, C.; Jiang, H. Pore structure characterization of Chang-7 tight sandstone using MICP combined with N2GA techniques and its geological control factors. Sci. Rep. 2016, 6, 36919. [Google Scholar] [CrossRef] [PubMed] [Green Version]
  19. Shao, X.; Pang, X.; Li, H.; Zhang, X. Fractal analysis of pore network in tight gas sandstones using NMR method: A case study from the Ordos basin, China. Energy Fuels 2017, 31, 10358–10368. [Google Scholar] [CrossRef]
  20. Lai, J.; Wang, G.; Fan, Z.; Zhou, Z.; Chen, J.; Wang, S. Fractal analysis of tight shaly sandstones using nuclear magnetic resonance measurements. AAPG Bull. 2018, 102, 175–193. [Google Scholar] [CrossRef]
  21. Mao, Z.; Zhang, C.; Xiao, L. A NMR-based porosity calculation method for low porosity and low permeability gas reservoir. Oil Geophys. Prospect. 2010, 45, 105–109. [Google Scholar]
  22. Xiao, L.; Mao, Z.; Wang, Z.; Jin, Y. Application of NMR logs in tight gas reservoirs for formation evaluation: A case study of Sichuan basin in China. J. Petrol. Sci. Eng. 2012, 81, 182–195. [Google Scholar] [CrossRef]
  23. Feng, C.; Shi, Y.; Hao, J.; Wang, Z.; Mao, Z.; Li, G.; Jiang, Z. Nuclear magnetic resonance features of low-permeability reservoirs with complex wettability. Pet. Explor. Dev. 2017, 44, 274–279. [Google Scholar] [CrossRef]
  24. Xiao, L.; Liu, D.; Wang, H.; Li, J.; Lu, J.; Zou, C. The applicability analysis of models for permeability prediction using mercury injection capillary pressure (MICP) data. J. Petrol. Sci. Eng. 2017, 156, 589–593. [Google Scholar] [CrossRef]
  25. Liu, Y.; Wang, Y.; Tang, H.; Wang, F.; Chen, L. Application of capillary pressure curves and fractal theory to reservoir classification. Lithol. Reserv. 2014, 26, 89–92. [Google Scholar]
  26. Feng, C.; Shi, Y.; Li, J.; Chang, L.; Li, G.; Mao, Z. A new empirical method for constructing capillary pressure curves from conventional logs in low-permeability sandstones. J. Earth Sci. 2017, 28, 516–522. [Google Scholar] [CrossRef]
  27. Xiao, L.; Zou, C.; Mao, Z.; Jin, Y.; Zhu, J. A new technique for synthetizing capillary pressure (Pc) curves using NMR logs in tight gas sandstone reservoirs. J. Petrol. Sci. Eng. 2016, 145, 493–501. [Google Scholar] [CrossRef]
  28. Mandelbrot, B.B. The Fractal Geometry of Nature; W. H. Freeman: New York, NY, USA, 1982. [Google Scholar]
  29. García-Gutiérrez, C.; Martínez, F.S.J.; Caniego, J. A protocol for fractal studies on porosity of porous media: High quality soil porosity images. J. Earth Sci. 2017, 28, 888–896. [Google Scholar] [CrossRef]
  30. Yang, Z.Y.; Pourghasemi, H.R.; Lee, Y.H. Fractal analysis of rainfall-induced landslide and debris flow spread distribution in the Chenyulan Creek Basin, Taiwan. J. Earth Sci. 2016, 27, 151–159. [Google Scholar] [CrossRef]
  31. Mandelbrot, B.B. Multifractal measures, especially for the geophysicist. Pure Appl. Geophys. 1989, 131, 5–42. [Google Scholar] [CrossRef]
  32. Muller, J. Characterization of the North Sea chalk by multifractal analysis. J. Geophys. Res. Solid Earth. 1994, 99, 7275–7280. [Google Scholar] [CrossRef]
  33. Cai, J.; Yu, B.; Zou, M.; Mei, M. Fractal analysis of surface roughness of particles in porous media. Chin. Phys. Lett. 2010, 27, 157–160. [Google Scholar]
  34. Zhang, X.; Wu, C.; Li, T. Comparison analysis of fractal characteristics for tight sandstones using different calculation methods. J. Geophys. Eng. 2017, 14, 120–131. [Google Scholar] [CrossRef]
  35. Peng, J.; Han, H.; Xia, Q.; Li, B. Evaluation of the pore structure of tight sandstone reservoirs based on multifractal analysis: A case study from the Kepingtage Formation in the Shuntuoguole uplift, Tarim Basin, NW China. J. Geophys. Eng. 2018, 15, 1122–1136. [Google Scholar] [CrossRef]
  36. Dai, J.; Li, J.; Luo, X.; Zhang, W.; Hu, G.; Ma, C.; Guo, J.; Ge, S. Stable carbon isotope compositions and source rock geochemistry of the giant gas accumulations in the Ordos Basin, China. Org. Geochem. 2005, 36, 1617–1635. [Google Scholar] [CrossRef]
  37. Shi, Y.; Liang, X.; Mao, Z.; Guo, H. An identification method for diagenetic facies with well logs and its geological significance in low-permeability sandstones: A case study on Chang 8 reservoirs in the Jiyuan Region, Ordos Basin. Acta Pet. Sin. 2011, 32, 820–828. [Google Scholar]
  38. Zou, C.; Zhu, R.; Wu, S.; Yang, Z.; Tao, S.; Yuan, X.; Hou, L.; Yang, H.; Xu, C.; Li, D.; et al. Types, characteristics, genesis and prospects of conventional and unconventional hydrocarbon accumulations: taking tight oil and tight gas in China as an instance. Acta Pet. Sin. 2012, 33, 173–187. [Google Scholar]
  39. Jia, C.; Zou, C.; Li, J.; Li, D.; Zheng, M. Assessment criteria, main types, basic features and resource prospects of the tight oil in China. Acta Pet. Sin. 2012, 33, 343–350. [Google Scholar]
  40. Cai, J.; Wei, W.; Hu, X.; Liu, R.; Wang, J. Fractal characterization of dynamic fracture network extension in porous media. Fractals 2017, 25, 1750023. [Google Scholar] [CrossRef]
  41. Dathe, A.; Tarquis, A.M.; Perrier, E. Multifractal analysis of the pore- and solid-phases in binary two-dimensional images of natural porous structures. Geoderma 2006, 134, 318–326. [Google Scholar] [CrossRef] [Green Version]
  42. Xia, Y.; Cai, J.; Wei, W.; Hu, X.; Wang, X.I.N.; Ge, X. A new method for calculating fractal dimensions of porous media based on pore size distribution. Fractals 2018, 26, 1850006. [Google Scholar] [CrossRef]
  43. Halsey, T.C.; Jensen, M.H.; Kadanoff, L.P.; Procaccia, I.I.; Shraiman, B.I. Fractal measures and their singularities: the characterization of strange sets. Nucl. Phys. B 1987, 2, 501–511. [Google Scholar] [CrossRef]
  44. Li, K.; Zeng, F.; Cai, J.; Sheng, G.; Xia, P.; Zhang, K. Fractal characteristics of pores in Taiyuan formation shale from Hedong coal field, China. Fractals 2018, 26, 1840006. [Google Scholar] [CrossRef]
  45. Chakraborty, B.; Haris, K.; Latha, G.; Maslov, N.; Menezes, A. Multifractal approach for seafloor characterization. IEEE Geosci. Remote Sens. Lett. 2014, 11, 54–58. [Google Scholar] [CrossRef]
  46. Paz Ferreiro, J.; Vidal Vázquez, E. Multifractal analysis of Hg pore size distributions in soils with contrasting structural stability. Geoderma 2010, 160, 64–73. [Google Scholar] [CrossRef]
  47. Nelson, P.H. Pore-throat sizes in sandstones, tight sandstones, and shales. AAPG Bull. 2009, 93, 329–340. [Google Scholar] [CrossRef]
  48. Li, C.; Zhou, C.; Li, X.; Hu, F.; Zhang, L.; Wang, W. A novel model for assessing the pore structure of tight sands and its application. Appl. Geophys. 2010, 7, 283–291. [Google Scholar] [CrossRef]
  49. Wang, L.; Zhao, N.; Sima, L.; Meng, F.; Guo, Y. Pore structure characterization of the tight reservoir: Systematic integration of mercury injection and nuclear magnetic resonance. Energy Fuels 2018, 32, 7471–7484. [Google Scholar] [CrossRef]
  50. Zhao, P.; Cai, J.; Huang, Z.; Ostadhassan, M.; Ran, F. Estimating permeability of shale gas reservoirs from porosity and rock compositions. Geophysics 2018, 83, MR283–MR294. [Google Scholar] [CrossRef]
  51. Zeng, D.; Li, S. Types and characteristics of low permeability sandstone reservoirs in China. Acta Pet. Sin. 1994, 15, 38–46. [Google Scholar]
  52. Tang, W.; Tang, R. Fractal dimensions of mercury-ejection capillary pressure curves in Donghe-1 Oilfield. Acta Pet. Sin. 2005, 26, 90–93. [Google Scholar]
  53. Xiao, D.; Jiang, S.; Thul, D.; Lu, S.; Zhang, L.; Li, B. Impacts of clay on pore structure, storage and percolation of tight sandstones from the Songliao Basin, China: Implications for genetic classification of tight sandstone reservoirs. Fuel 2018, 211, 390–404. [Google Scholar] [CrossRef]
  54. Zhao, P.; Sun, Z.; Luo, X.; Wang, Z.; Mao, Z.; Wu, Y.; Xia, P. Study on the response mechanisms of nuclear magnetic resonance (NMR) log in tight oil reservoirs. Chin. J. Geophys. 2016, 59, 1927–1937. [Google Scholar]
  55. Tang, R.; Ceng, Y. Study on several factors affecting the efficiency of mercury removal from rock. Exp. Pet. Geol. 1994, 1, 84–93. [Google Scholar]
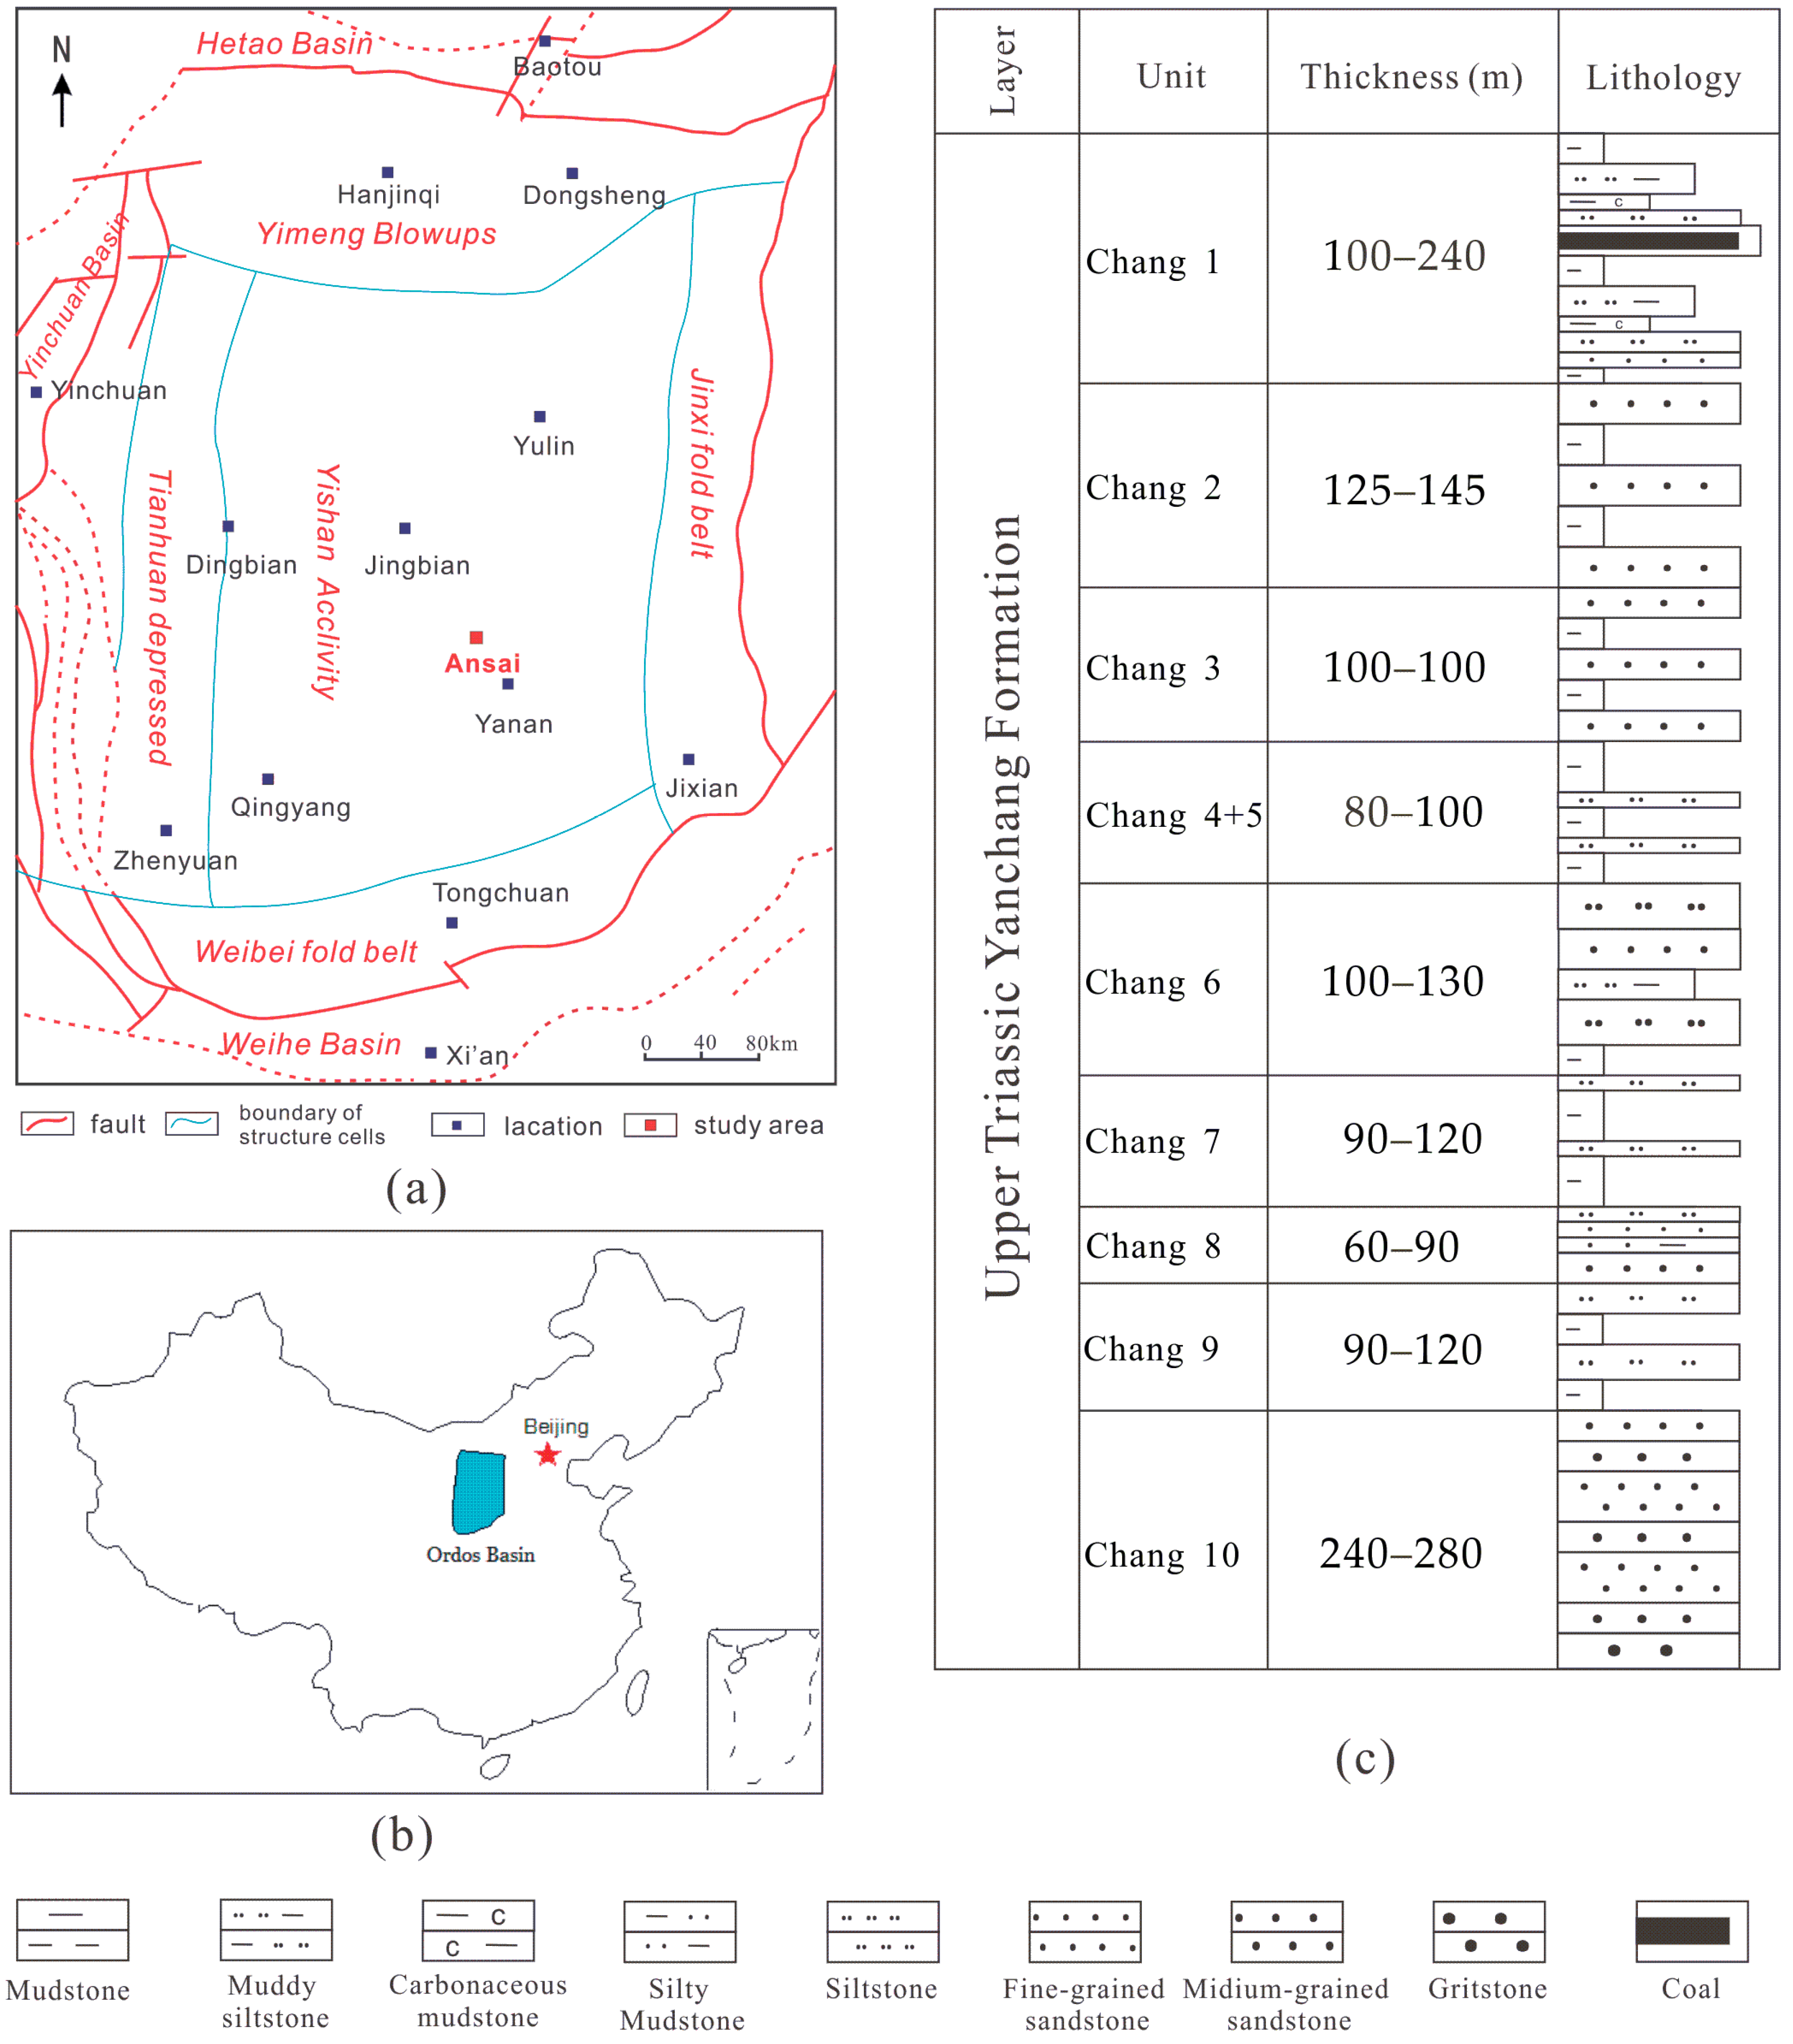
Figure 1. (a) Location of the study area, (b) location of the Ordos Basin, and (c) lithostratigraphic section of the Upper Triassic Yanchang Formation in the Ordos Basin [20,40].
Energies 11 02242 g001
Figure 2. The relationship between the porosity and permeability.
Energies 11 02242 g002
Figure 3. Thin section images and scanning electron microscopy (SEM) images of the tight sandstone in the study area: (a) intergranular pores and feldspar dissolution pore; (b) intergranular pores and enriched mica; (c) the surface of the rock particles covered with padded chlorite; (d) feldspar dissolved pore.
Energies 11 02242 g003
Figure 4. The mercury injection capillary pressure (MICP) curves of different types of reservoirs: (a) the pore throat size distributions of different types; (b) the mercury capillary pressure curves of different types.
Energies 11 02242 g004
Figure 5. Different pore proportions of different reservoir types: (a) different pore proportion of Type I; (b) different pore proportion of Type II; (c) different pore proportion of Type III.
Energies 11 02242 g005
Figure 6. Relationships of the different pore proportion of different pore structure types: (a) relationships of large pore proportion of different pore structure types; (b) relationships of medium pore proportion of different pore structure types; (c) relationships of small pore proportion of different pore structure types.
Energies 11 02242 g006
Figure 7. Multifractal analysis of the MICP data in the tight sandstone. (a) the mass exponent τ ( q ) ; (b) the generalized dimension spectrum q ~ D q ; (c) the multifractal spectrum α ~ f ( α ) .
Energies 11 02242 g007
Figure 8. Multifractal spectrum of MICP data in tight sandstone samples with different types of reservoirs. (a) the mass exponent τ ( q ) of different types; (b) the generalized dimension spectrum q ~ D q of different types; (c) the multifractal spectrum α ~ f ( α ) of different types.
Energies 11 02242 g008
Figure 9. The cross plots between multifractal parameters and the porosity & permeability. (a) the cross plots between αmax, αmin and porosity; (b) the cross plots between Dmax, Dmin and porosity; (c) the cross plots between D1, D2 and porosity; (d) the cross plots between f max,   f min and porosity; (e) the cross plot between △ f and porosity; (f) the cross plot between Δα and porosity; (g) the cross plots between αmax, αmin and permeability; (h) the cross plots between Dmax, Dmin and permeability; (i) the cross plots between D1, D2 and permeability; (j) the cross plots between f max,   f min and permeability; (k) the cross plot between △ f and permeability; (l) the cross plot between Δα and permeability.
Energies 11 02242 g009
Figure 10. The cross plots between multifractal parameters and MICP parameters. (a) the cross plots between αmax, αmin and P50; (b) the cross plots between αmax, αmin and average pore radius; (c) the cross plots between αmax, αmin and Pd; (d) the cross plots between αmax, αmin and small pore proportion; (e) the cross plots between αmax, αmin and medium pore proportion; (f) the cross plots between αmax, αmin and large pore proportion; (g) the cross plots between Dmax, Dmin and P50; (h) the cross plots between Dmax, Dmin and average pore radius; (i) the cross plots between Dmax, Dmin and Pd; (j) the cross plots between Dmax, Dmin and small pore proportion; (k) the cross plots between Dmax, Dmin and medium pore proportion; (l) the cross plots between Dmax, Dmin and large pore proportion.
Energies 11 02242 g010
Table 1. The porosity, permeability and mercury injection capillary pressure (MICP) parameters of samples.
No.Porosity (%)K (mD)P50 (MPa)R50 (µm) r ¯   ( µ m ) Pd (MPa)Smax (%)We (%)Large Pore (%)Medium Pore (%)Small Pore (%)
112.20.63521.86350.03360.13621.657775.4932.3168036.4739.02
214.19.9874.52770.16241.45370.134172.5937.262833.4719.4619.66
312.81.5534.63430.15860.71400.321076.4729.133925.9627.3823.13
413.31.3187.91850.09280.53500.407873.7830.130916.2332.924.65
514.52.9515.92480.12410.76220.280078.4231.234227.224.2326.99
613.41.2859.33230.07880.50890.436474.1130.109916.3631.526.25
713.51.1514.95140.14850.56170.397682.1532.581622.3630.9128.88
815.05.3655.83770.12590.92520.220274.7732.769027.1824.2223.37
913.61.2444.54370.16180.61620.411175.7929.76352330.7722.02
1013.61.5154.00920.18340.65370.411476.1330.563726.9127.5521.67
1113.42.0884.05210.18140.80230.338772.2328.046330.5623.3518.32
125.70.10829.78880.02470.06295.218064.3831.5089010.5853.8
1313.61.1073.23110.22750.52510.398281.2429.916715.2542.6623.33
1413.61.1073.90240.18840.32570.781279.6733.38982.3353.5423.8
1513.82.5852.56640.28640.86580.128984.5828.227230.8928.3825.31
1614.00.4866.05510.12140.16791.409784.1531.8996052.2131.94
1710.20.3926.92780.10610.14201.942188.7536.6435050.1938.56
189.70.15613.79470.05330.09792.118575.920.6429027.6148.29
197.90.1689.93550.07400.19760.994079.5328.30130.9143.1135.51
2010.80.27110.08760.07290.13351.998981.8531.1925044.1737.68
2110.30.3959.96050.07380.16091.568468.0320.19330.4340.527.1
2211.70.8004.56320.16110.30040.728780.3229.96483.8252.6423.86
2310.50.4513.54880.20710.40100.452486.6227.859011.5949.7325.3
2410.50.2796.72730.10930.15051.460288.100030.7172050.6537.45
Notes: Large pore: pore throat sizes > 10 μm; Medium pore: pore throat sizes range from 1–10 μm; Small pore: pore throat sizes < 1 μm.
Table 2. The thin section observations of samples.
No.Quartz (%)Feldspar (%)Mica (%)Chlorite (%)Iron Calcite (%)Main Particle Size (μm)SortingGrinding RoundnessCementation Type
1184223520.10–0.30MAchlorite thin film
322535460.2–0.5MAchlorite thin film
420547420.15–0.5MSA-Achlorite thin film
721553470.15–0.4MApore-chlorite thin film
923570610.1–0.3M-GSA-Achlorite thin film
11225556.510.1–0.32M-GSA-Achlorite thin film
12155070180.10–0.35MApore
1320603620.10–0.30M-GAchlorite thin film
1521565530.10–0.35MApore-chlorite thin film
1622556730.05–0.15GApore-chlorite thin film
2030398210.05–0.20MSAchlorite thin film-pore
212353.5331.50.2–0.5MSAchlorite thin film-pore
2222488.5320.12–0.38MApore-chlorite thin film
2322556320.16–0.28GApore
2422526300.12–0.24GApore-chlorite thin film
Notes: M: medium sorted; G: good sorted; A: angular; SA: sub-angular.
Table 3. Classification of reservoirs according to physical properties and MICP parameters.
TypePorosity (%)K (Md)P50 (MPa) r ¯   ( µ m ) Pd (MPa)Large Pore (%)Medium Pore (%)Small Pore (%)
Type I12.8–151.151–9.9872.57–5.920.56–1.450.13–0.4122.36–33.4719.46–30.9118.32–28.88
13.813.1604.560.820.2927.5026.2523.26
Type II10.5–13.60.451–1.3183.23–9.330.30–0.540.40–0.782.33–16.3631.5–53.5423.33–26.25
12.681.0115.420.430.5310.9343.8324.53
Type III5.7–140.108–0.6356.06–29.790.06–0.200.99–5.220–0.9110.58–52.2127.1–53.8
10.30.36911.970.151.910.5240.8137.32
Table 4. Multifractal parameters of tight sandstone samples with different types of pore structure.
TypeαmaxαminDmaxDminD1D2 f max f min α f
Type I1.18–1.240.14–0.280.17–0.321.11–1.150.56–0.700.31–0.530.22–0.50−0.01–0.000.90–1.060.22–0.50
1.210.210.241.130.630.420.370.000.990.37
Type II1.16–1.900.26–0.460.29–0.491.11–1.710.67–0.800.48–0.670.00–0.590.00–0.200.79–1.54−0.01–0.55
1.330.360.391.230.710.560.290.070.970.23
Type III0.99–2.140.34–0.790.40–0.820.91–1.920.71–0.920.58–0.93−0.28–0.19−0.19–0.550.2–1.80−0.30–0.45
1.660.480.531.500.770.69−0.070.081.170.05
Table 5. The correlation coefficients between multifractal parameters and pore structure parameters.
αmaxαminDmaxDminD1D2 f max f min Δα f
Porosity−0.278−0.5800.618−0.264−0.737−0.7300.393−0.054−0.0240.224
K−0.261−0.682−0.714−0.238−0.780−0.8310.510−0.101−0.0110.316
P500.1920.4430.4760.1880.4390.514−0.1890.0470.012−0.062
r ¯ −0.328−0.686−0.718−0.302−0.712−0.8040.582−0.114−0.0280.360
Pd0.3120.6350.6640.2900.6490.742−0.5230.0990.028−0.316
L-pore−0.383−0.512−0.547−0.359−0.598−0.6600.572−0.060−0.0690.373
M-pore0.1640.0060.0060.1550.0320.030−0.225−0.0120.133−0.205
S-pore0.1490.6420.6800.1320.6530.735−0.3630.1180.000−0.171
Notes: L-pore: Large pore proportion; M-pore: Medium pore proportion; S-pore: Small pore proportion.