Article

Development and Validation of Numerical Models for Evaluation of Foam-Vacuum Insulation Panel Composite Boards, Including Edge Effects †

Oak Ridge National Laboratory, One Bethel Valley Road, Oak Ridge, TN 37831, USA
This manuscript has been authored by UT-Battelle, LLC, under Contract No. DE-AC05-00OR22725 with the U.S. Department of Energy. The United States Government retains and the publisher, by accepting the article for publication, acknowledges that the United States Government retains a non-exclusive, paid-up, irrevocable, world-wide license to publish or reproduce the published form of this manuscript, or allow others to do so, for United States Government purposes. DOE will provide public access to these results of federally sponsored research in accordance with the DOE Public Access Plan (http://energy.gov/downloads/doe-public-access-plan).
Energies 2018, 11(9), 2228; https://doi.org/10.3390/en11092228
Submission received: 31 July 2018 / Revised: 22 August 2018 / Accepted: 23 August 2018 / Published: 25 August 2018

Abstract

:
A combined finite element analysis (FEA) and experimental validation approach to estimating effective edge conductivities of vacuum insulation panels (VIPs) embedded in foam-VIP composites is presented. The edge conductivities were estimated by comparing the simulation results with measurements of small-scale (0.61 × 0.61 m) foam-VIP composites and using an error minimization method. The two composites contained multiple VIPs that were butt-jointed with each other in one composite and separated by foam insulation in the other. Edge conductivities were estimated by considering the neighboring materials, i.e., whether the VIPs were adjacent to other VIPs or foam insulation. Models incorporating the edge conductivities were then used to simulate additional small- and large-scale (2.44 × 1.22 m) composites for validation and evaluation of the overall thermal transmission properties. The simulations used either the same boundary conditions as the experiments or used the experimental parameters to define the appropriate boundary conditions.

1. Introduction

Vacuum insulation panels (VIPs) are considered a more effective alternative to conventional building insulation materials for reducing heat losses through the building fabric and developing energy efficient buildings [1]. VIPs have been demonstrated in an additively-manufactured, prototype building [2], building retrofit in a subarctic climate [3], apartments and office buildings [4], among others. Yang et al. [5] described the development of thin, translucent VIPs for use in windows.
VIPs typically contain open-celled, porous materials that are evacuated and sealed within an impermeable envelope or barrier film [6]. Evacuation of the interior porous structure yields significantly improved thermal performance compared to conventional insulation materials. VIPs can achieve center-of-panel (COP) conductivities of 0.003–0.005 W/m-K compared to 0.02 W/m-K or higher for traditional foam and fibrous insulation materials [7]. However, when used as part of the building fabric or envelope, the overall or effective thermal conductance of the VIPs need to be considered [8]. Including edge effects due to the barrier films, which are typically highly conductive, can provide a more realistic effective thermal conductivity of VIPs [9].
Schiedel et al. [10] performed finite element analyses of wall systems incorporating VIPs. When using the COP thermal conductivity of VIPs, the theoretical estimate of the wall thermal resistance was higher by 41% than the experimental results. On implementing the effective VIP conductivity based on in-situ experimental data, the theoretical result was within 3% of the measured thermal resistance. Lim et al. [11] modeled VIPs of different thicknesses incorporated in external walls for building energy performance. The authors utilized different thermal conductances for different VIP thicknesses but did not explicitly describe how the U-values were calculated and if the edge effects of VIPs were considered [11]. Park et al. [4] modeled external insulation systems using VIPs to determine their effectiveness in high-performance insulation systems for high-rise apartment buildings. They calculated effective VIP conductivity using a combination of the COP conductivity and a linear thermal transmittance of the barrier film coupled with the VIP dimensions [4].
Wakili et al. [9] reported one the earliest works defining the effective VIP thermal conductivity as the COP conductivity augmented by an additional term due to the edge effect. The edge effect was defined in terms of a linear thermal transmittance of the barrier film and the VIP dimensions (area, perimeter and thickness). The linear thermal transmittance was estimated from heat flow measurements through COP of VIPs and joints between VIPs. The authors noted that their definition of effective VIP thermal conductivity was only dependent on the VIP itself and not on the assembly details when the VIPs are incorporated in a building envelope system [9]. Tenpierik and Cauberg [8] developed an analytical equation that predicts the effect of the thermal bridge induced by a VIP barrier laminate. Tenpierik et al. [12] performed a follow-on study to expand the analytical equation of [8] to evaluate building panels incorporating VIPs, which often contain thick facings and spacers between VIP edges. The authors used series and parallel resistance networks to calculate the effective thermal conductivities of the facings and edge spacers. Choi and Song [13] defined the edge conductivity of a VIP with an aluminum (Al) foil barrier as a function of the product of the Al foil conductivity and thickness, divided by the width of the VIP.
Wakili et al. [9] performed numerical simulations of VIPs by resolving the multi-layered barrier films using very fine grids in the vicinity of the high-conductivity films. The only simplification was to consolidate multiple layers of identical materials into one layer of equivalent thickness. The authors found excellent agreement between measured and calculated thermal resistances of two adjacent VIPs [9]. However, such fully-resolved models are inapplicable for large-scale systems containing VIPs due to the multitude of very thin and highly conductive layers [14]. Van Den Bossche [15] also performed simulations while resolving the barrier film, but artificially increased the film thickness so the whole model could be meshed using a single grid size. Simulations were done with combinations of multi-layered films, folded edges and an air gap; the best agreements (10–20%) with experimentally-determined edge transmittance were obtained when all three were considered [15]. Wakili et al. [16] also assumed an artificial nominal thickness of the barrier envelope and determined the corresponding thermal conductivity by calibrating simulation results with measurements. The authors noted the strong dependence of the modeled barrier conductivity on the air gaps between VIP joints and materials adjacent to the VIPs [16].
Sprengard and Holm [17] simulated VIPs and constructions incorporating VIPs by considering the thermal transmittance of the components, including the elements without thermal bridging (e.g., COP conductivity), linear thermal transmittance (e.g., panel edges) and point thermal transmittance (e.g., mechanical fasteners). Non-uniform meshes were used to resolve the barrier film layers. However, the simulations were limited to VIPs alone and other building components were not modeled, except to simulate the effects of boundary layers and mechanical fasteners. Capozzoli et al. [18] investigated the effect of thermal bridging in real building applications in which VIPs were coupled to other layers and jointed/fixed to proper frames. Thermal bridging effects due to the VIP edges and structural joints were considered. Linear thermal transmittances of the thermal bridges were obtained from a steady-state numerical model, and by combining with measurements of COP conductivities of VIPs, a suitably modified effective thermal transmittance of the VIPs was assessed [18]. Kim et al. [19] numerically studied walls incorporating VIPs; different configurations such as VIPs with and without Al foil barrier as well as VIPs encapsulated within expanded polystyrene (EPS) were investigated. Simulation results of linear thermal transmittance of thermal bridges and effective thermal transmittance of the walls were presented, but the calculation methodology was not explained in detail [19].
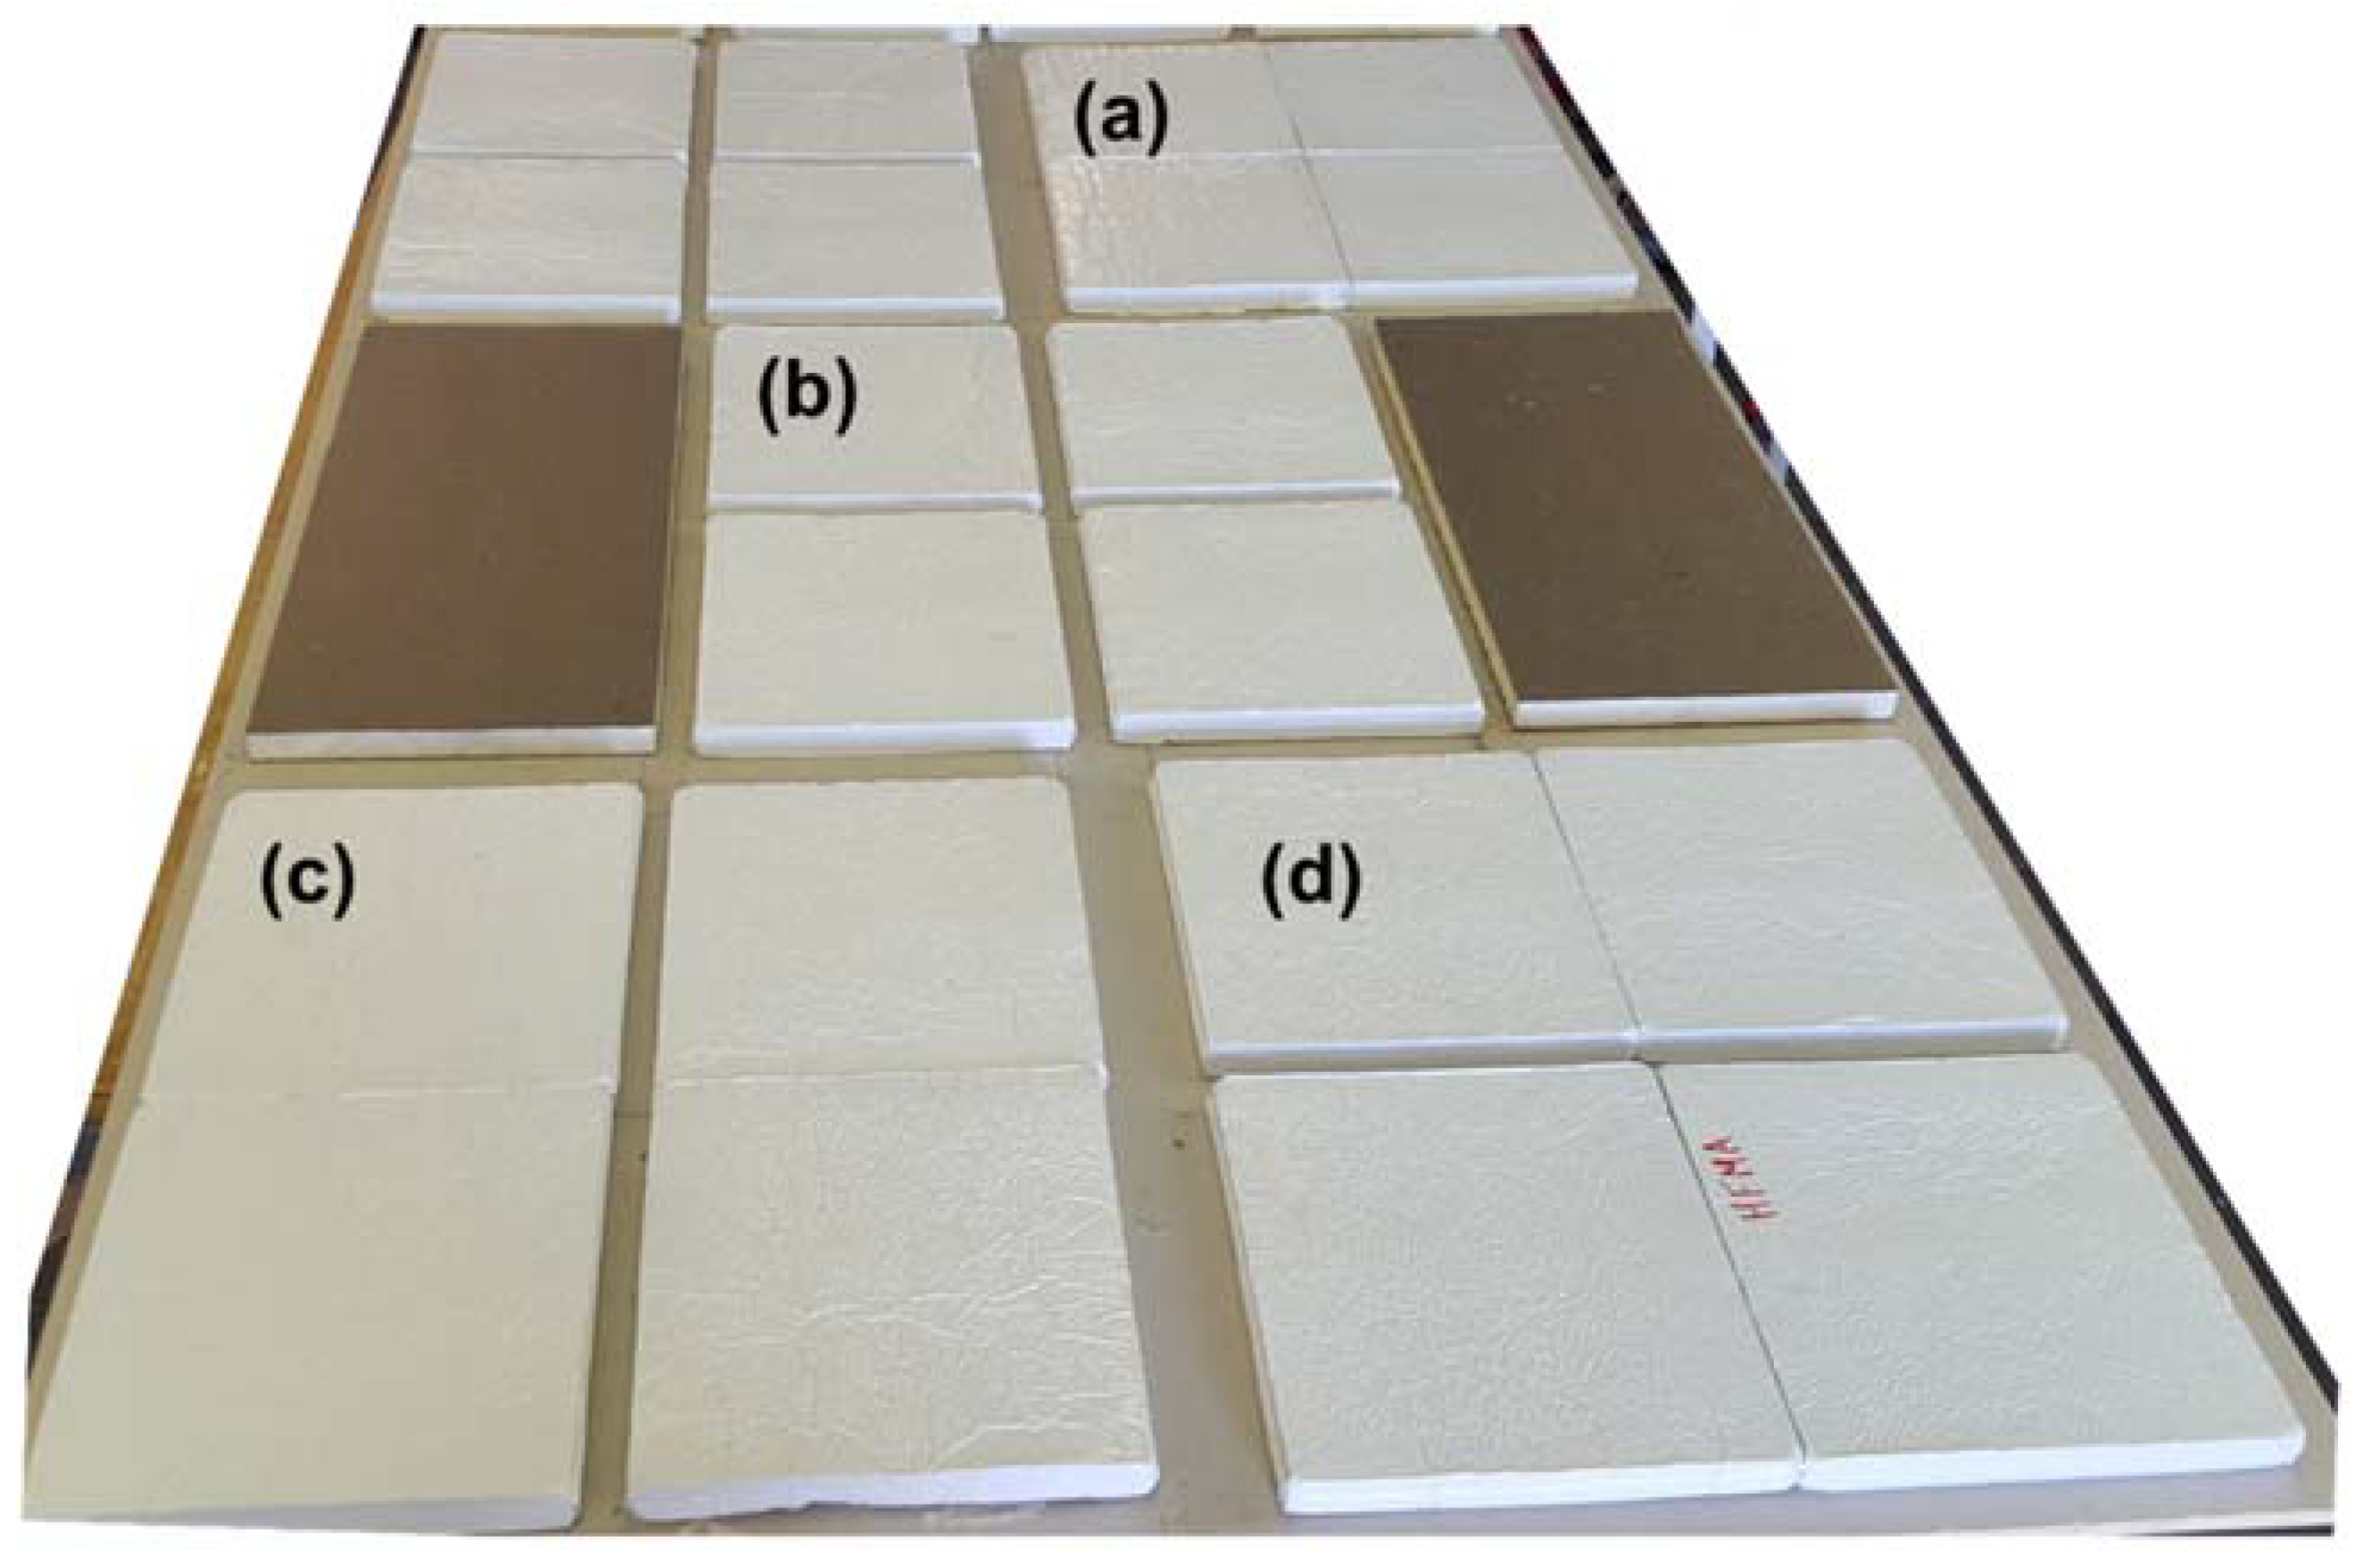
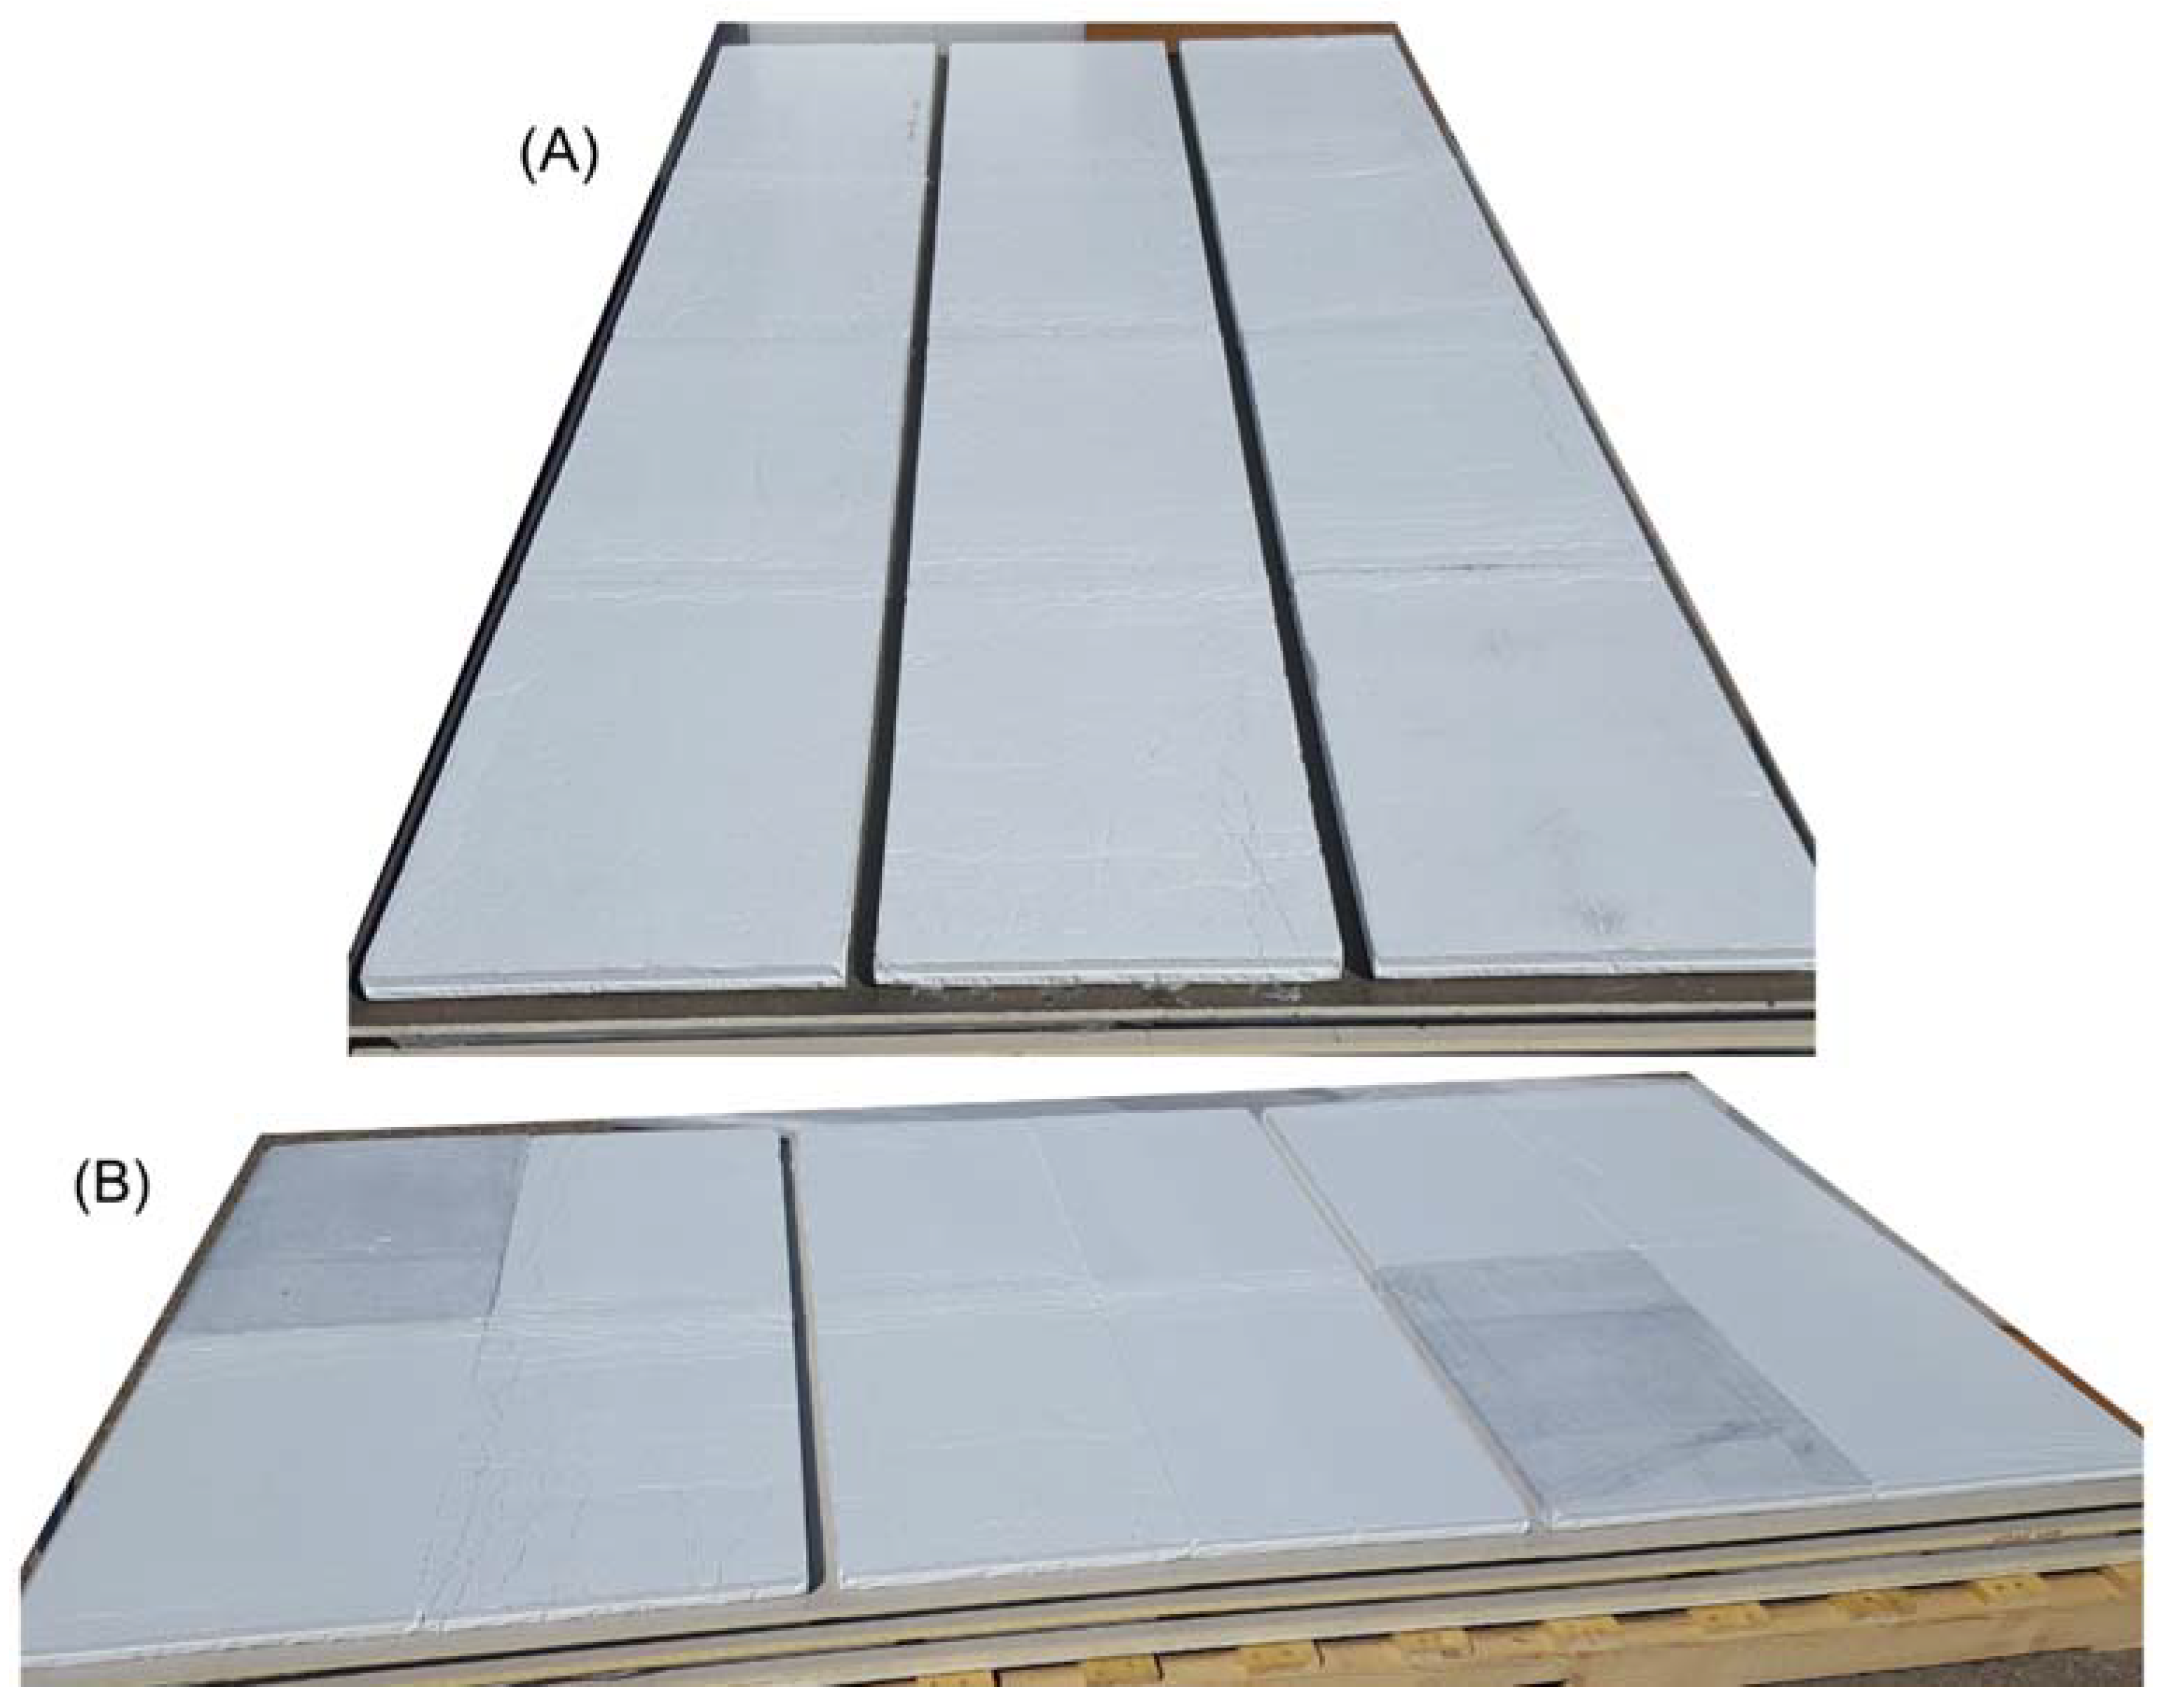
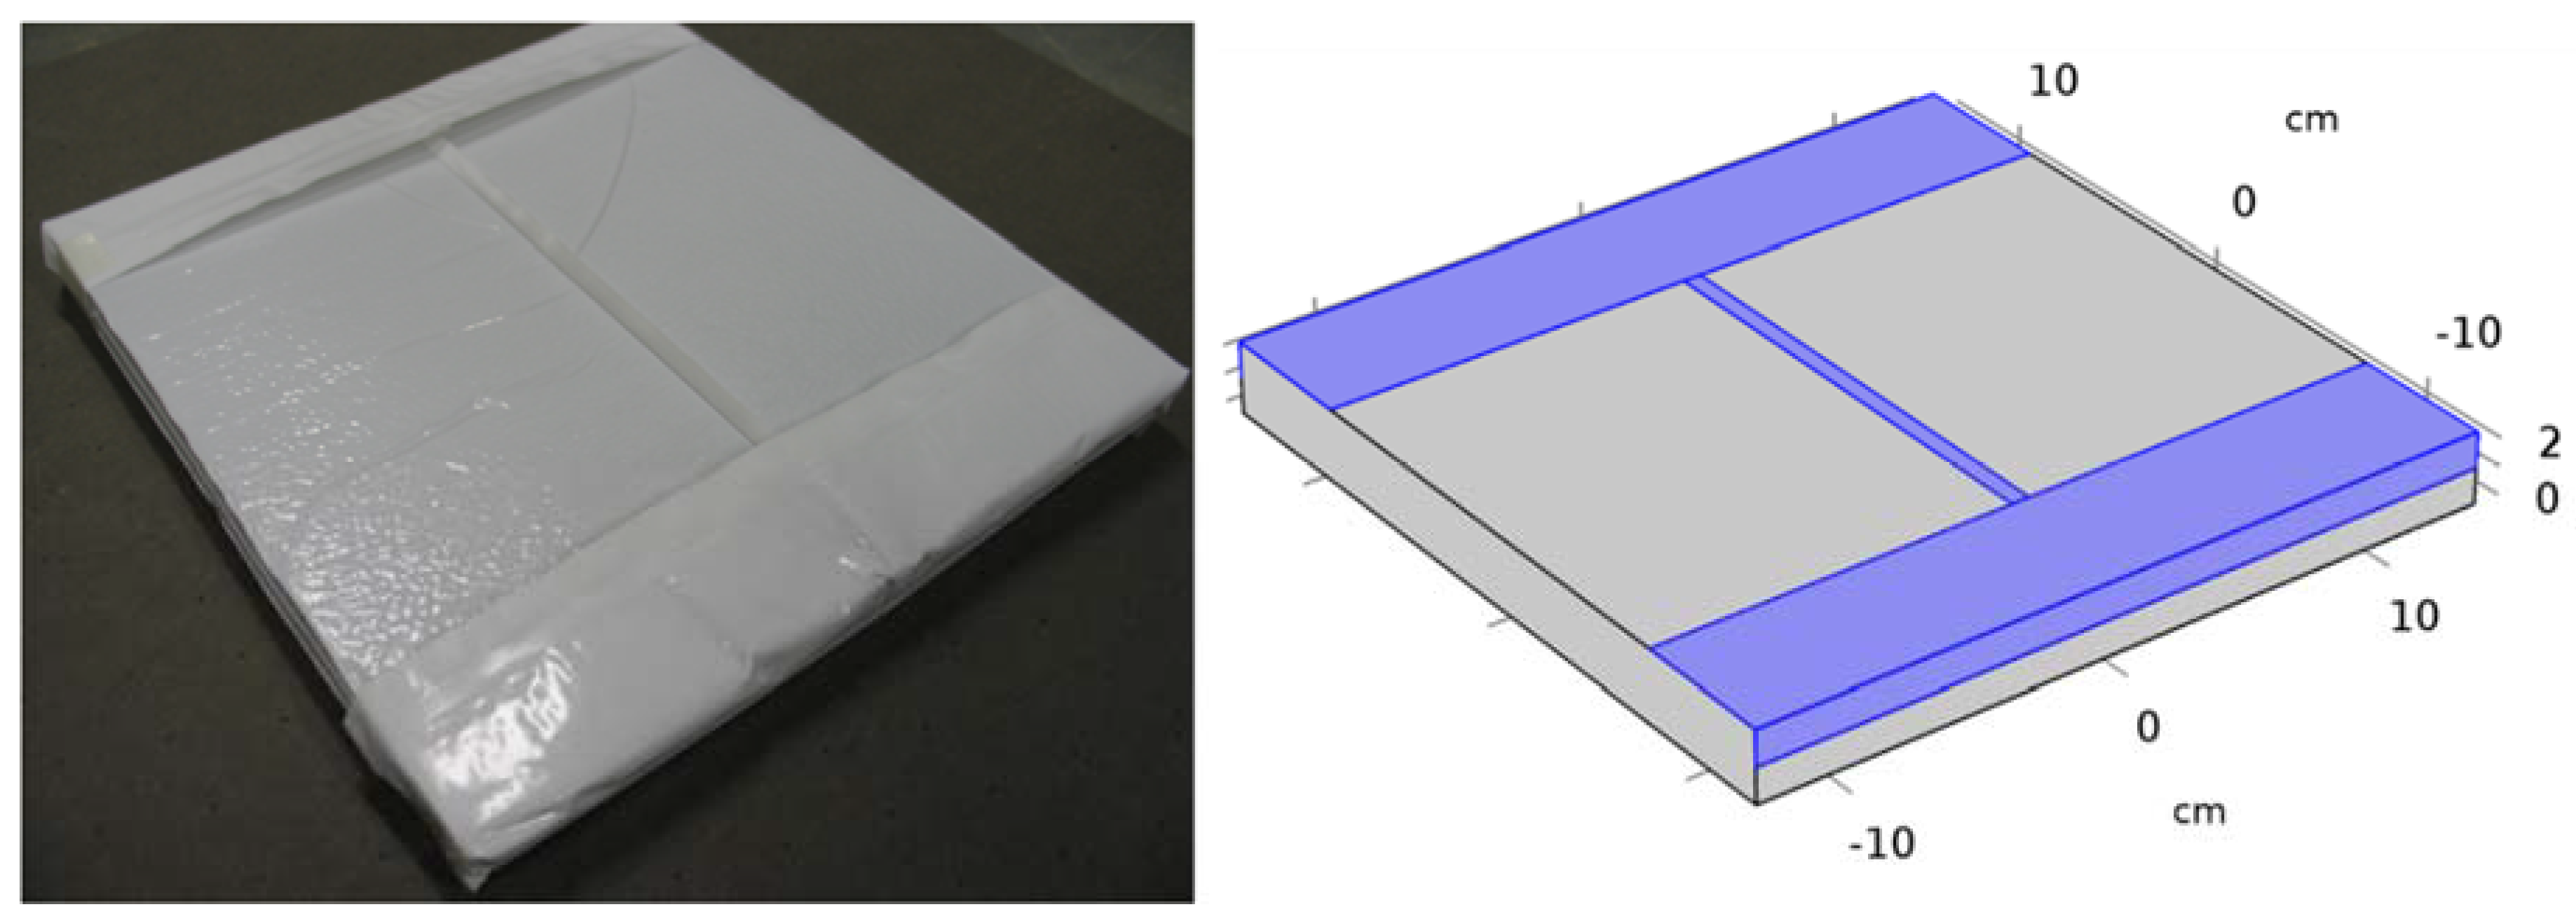
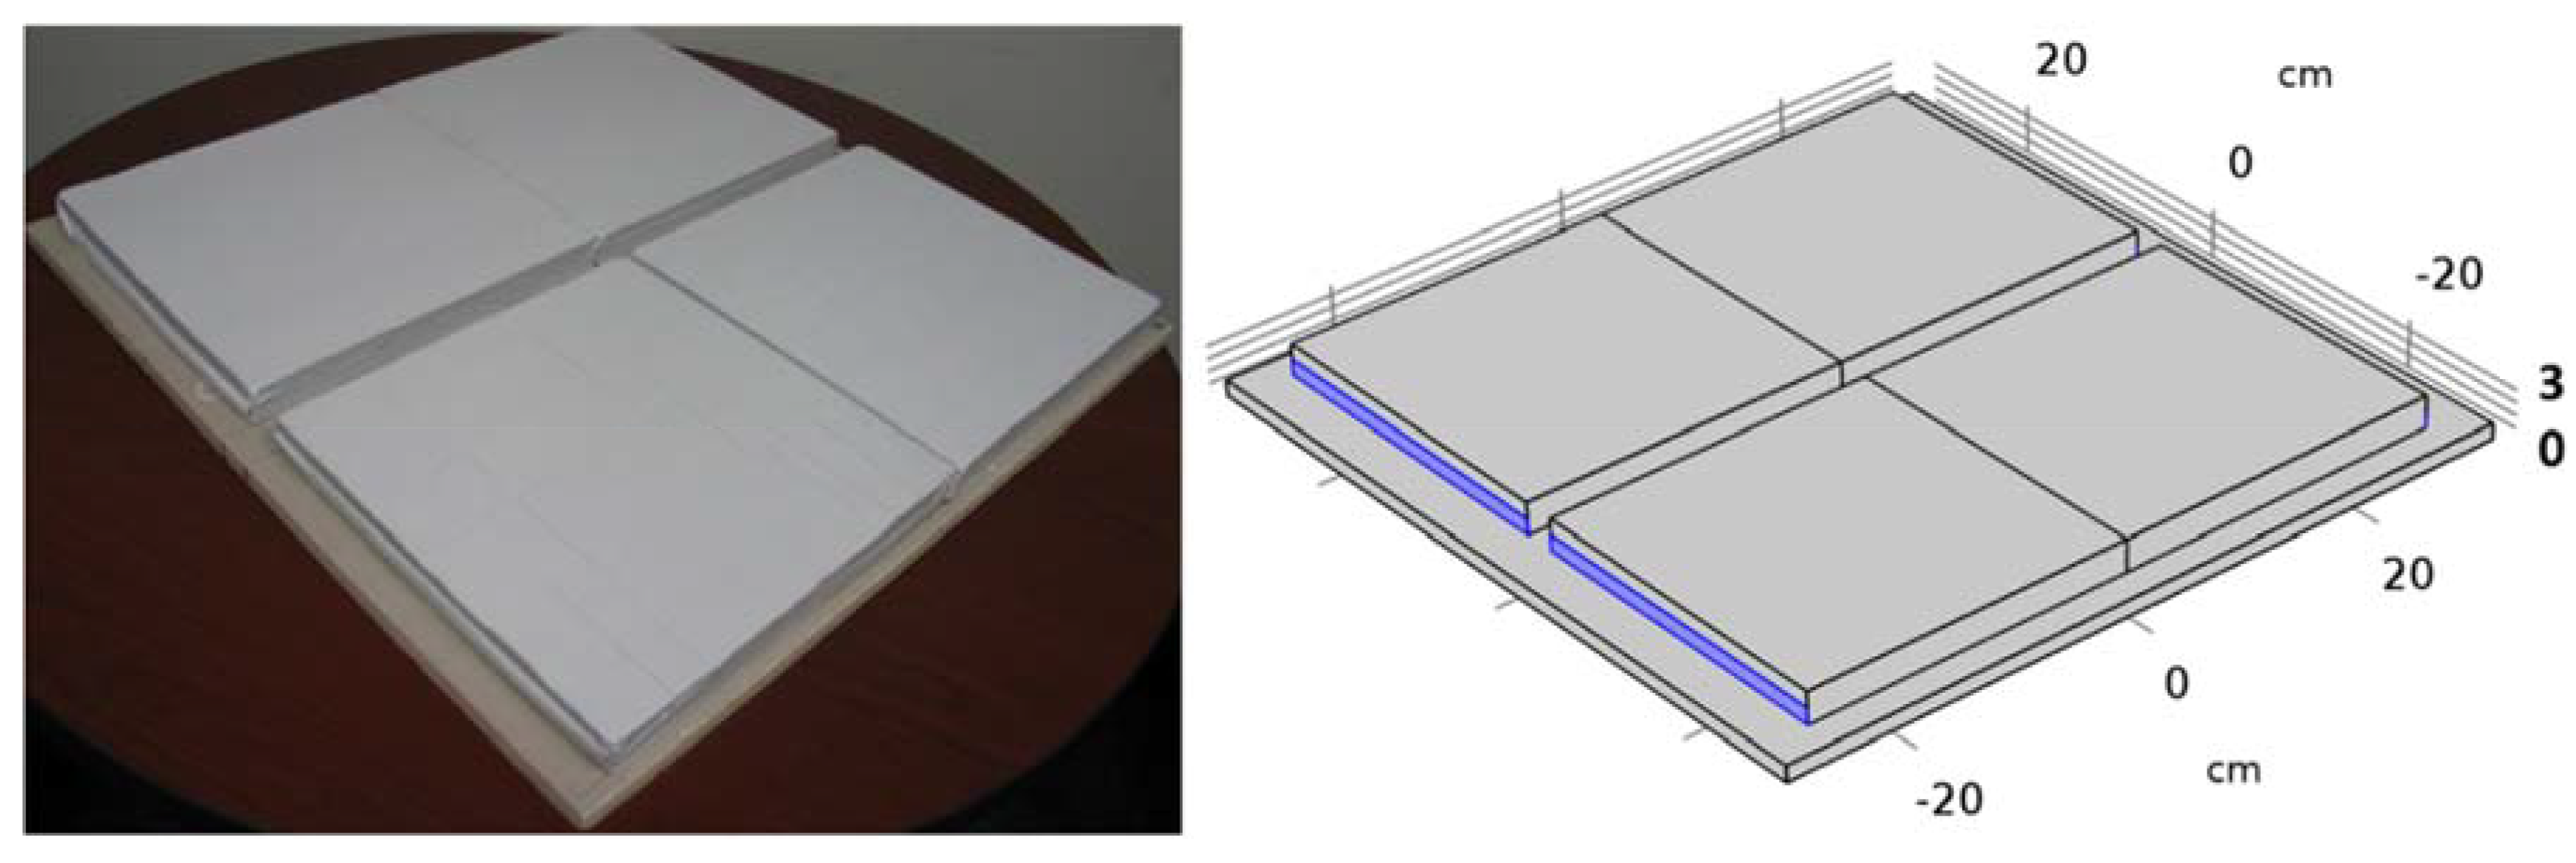
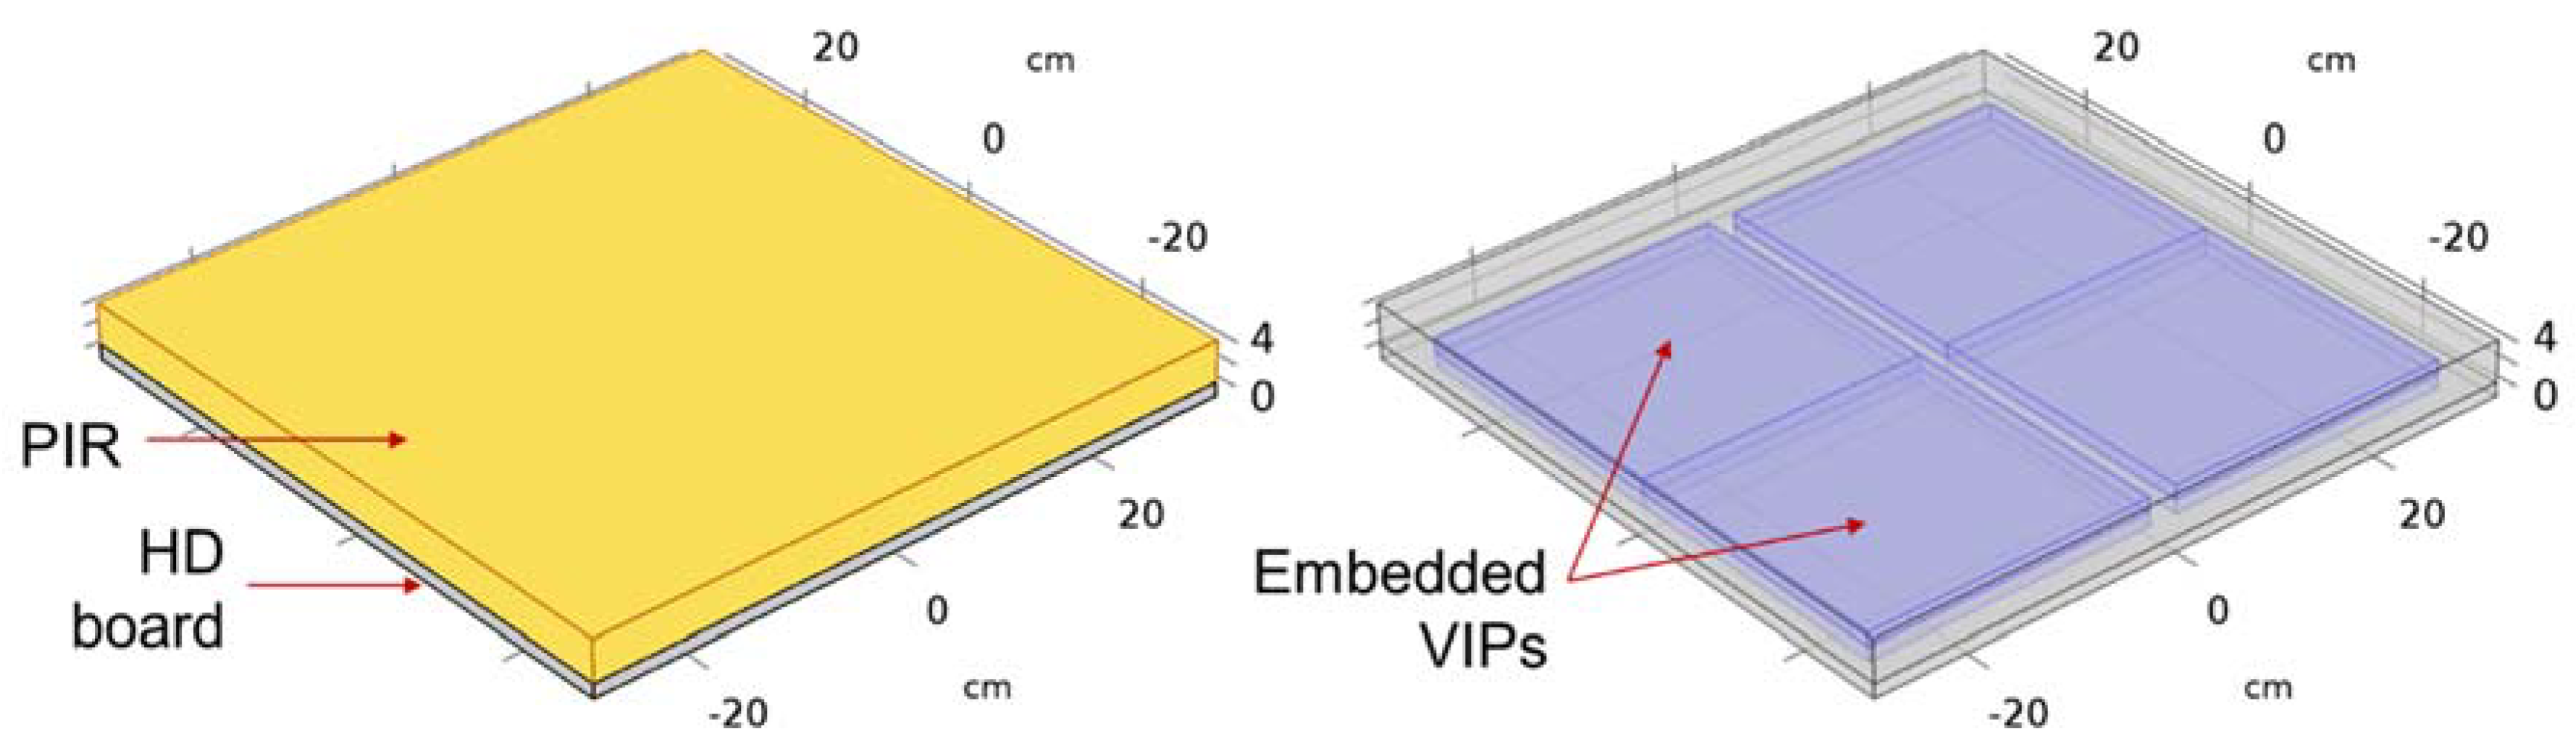
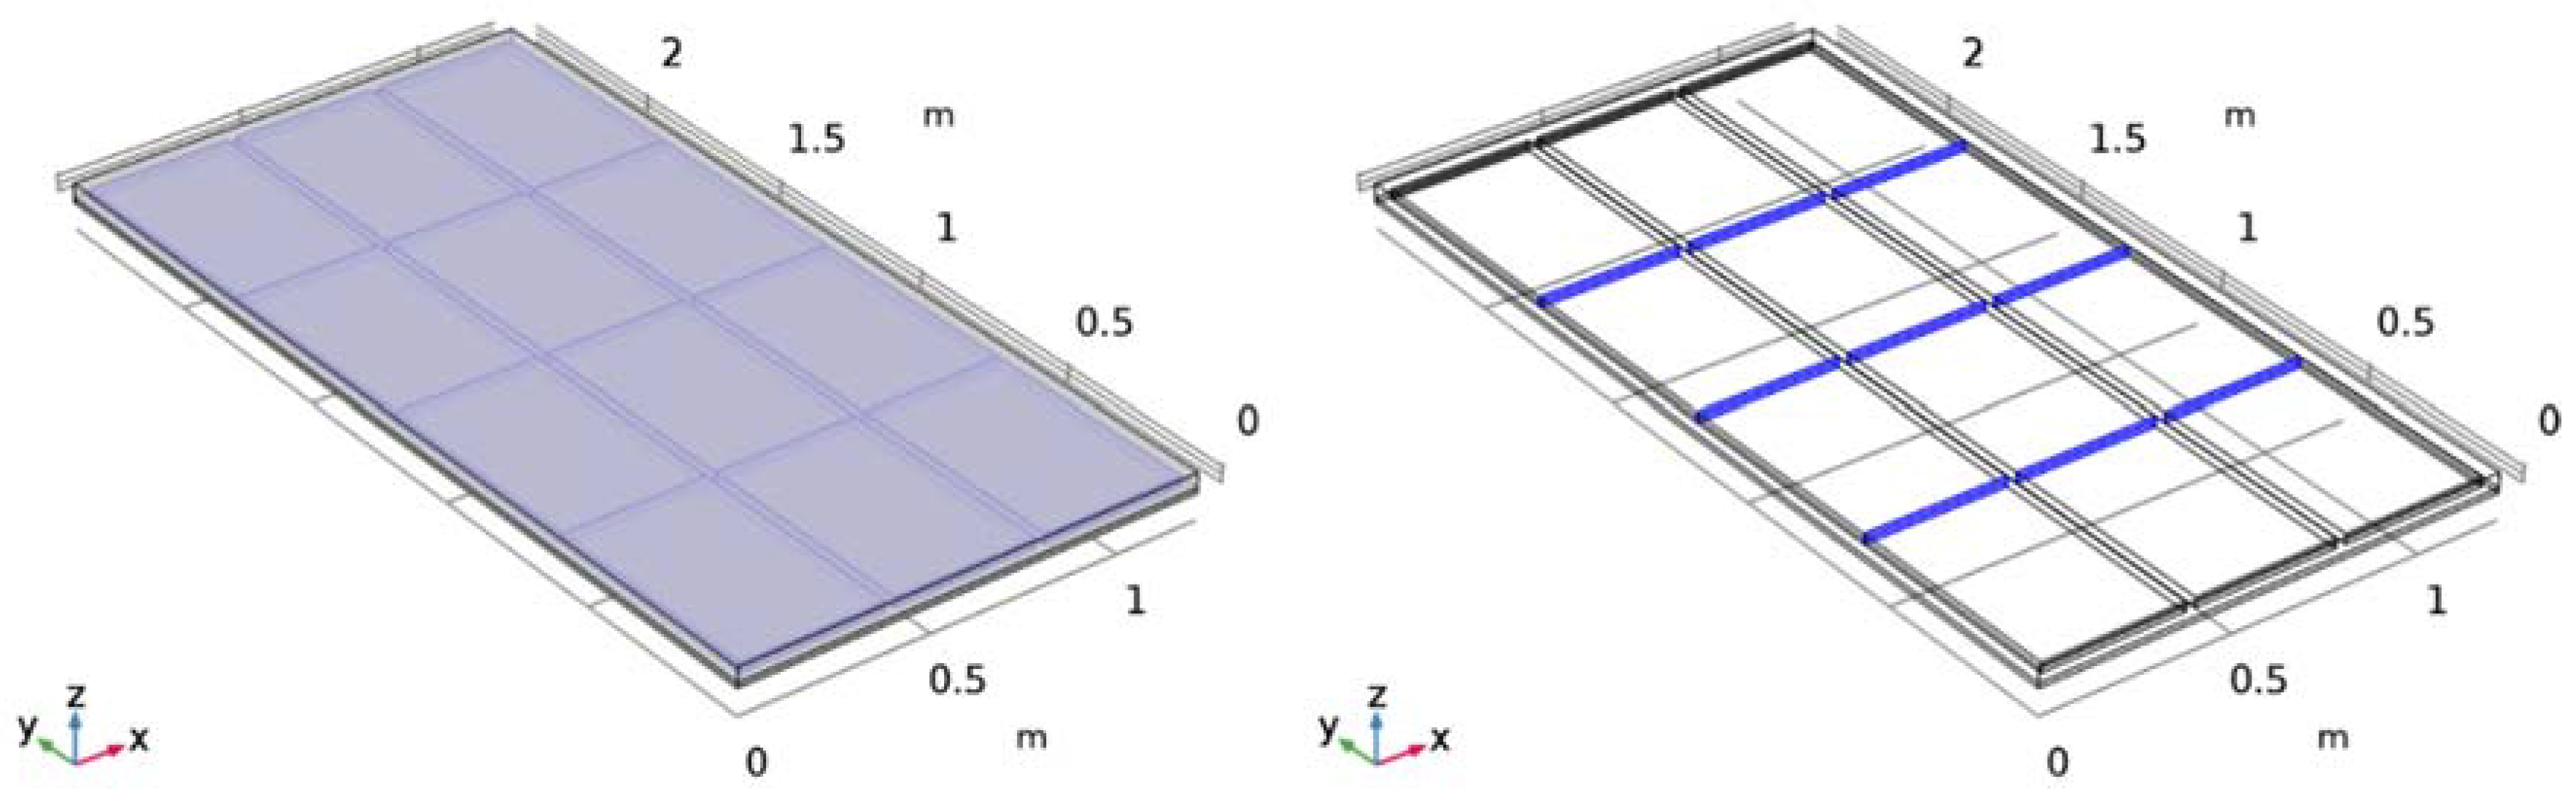
The current work presents finite element analysis (FEA) models of small (0.61 × 0.61 m) and large (1.22 × 2.44 m) composite insulation boards containing VIPs that are completely embedded within foam insulation. The development and experimental evaluations of the composite boards have been described by Biswas et al. [20]. The foam-VIP composite insulation described in the previous study [20] is suitable for widespread implementation in buildings. Their production method is similar to existing manufacturing processes. The foam serves to protect the VIPs and the composite is structurally-similar to existing foam insulation boards in terms of handling and installation; thus, the composites can be installed without major changes to construction practices and there is no need to handle individual VIPs at construction sites.
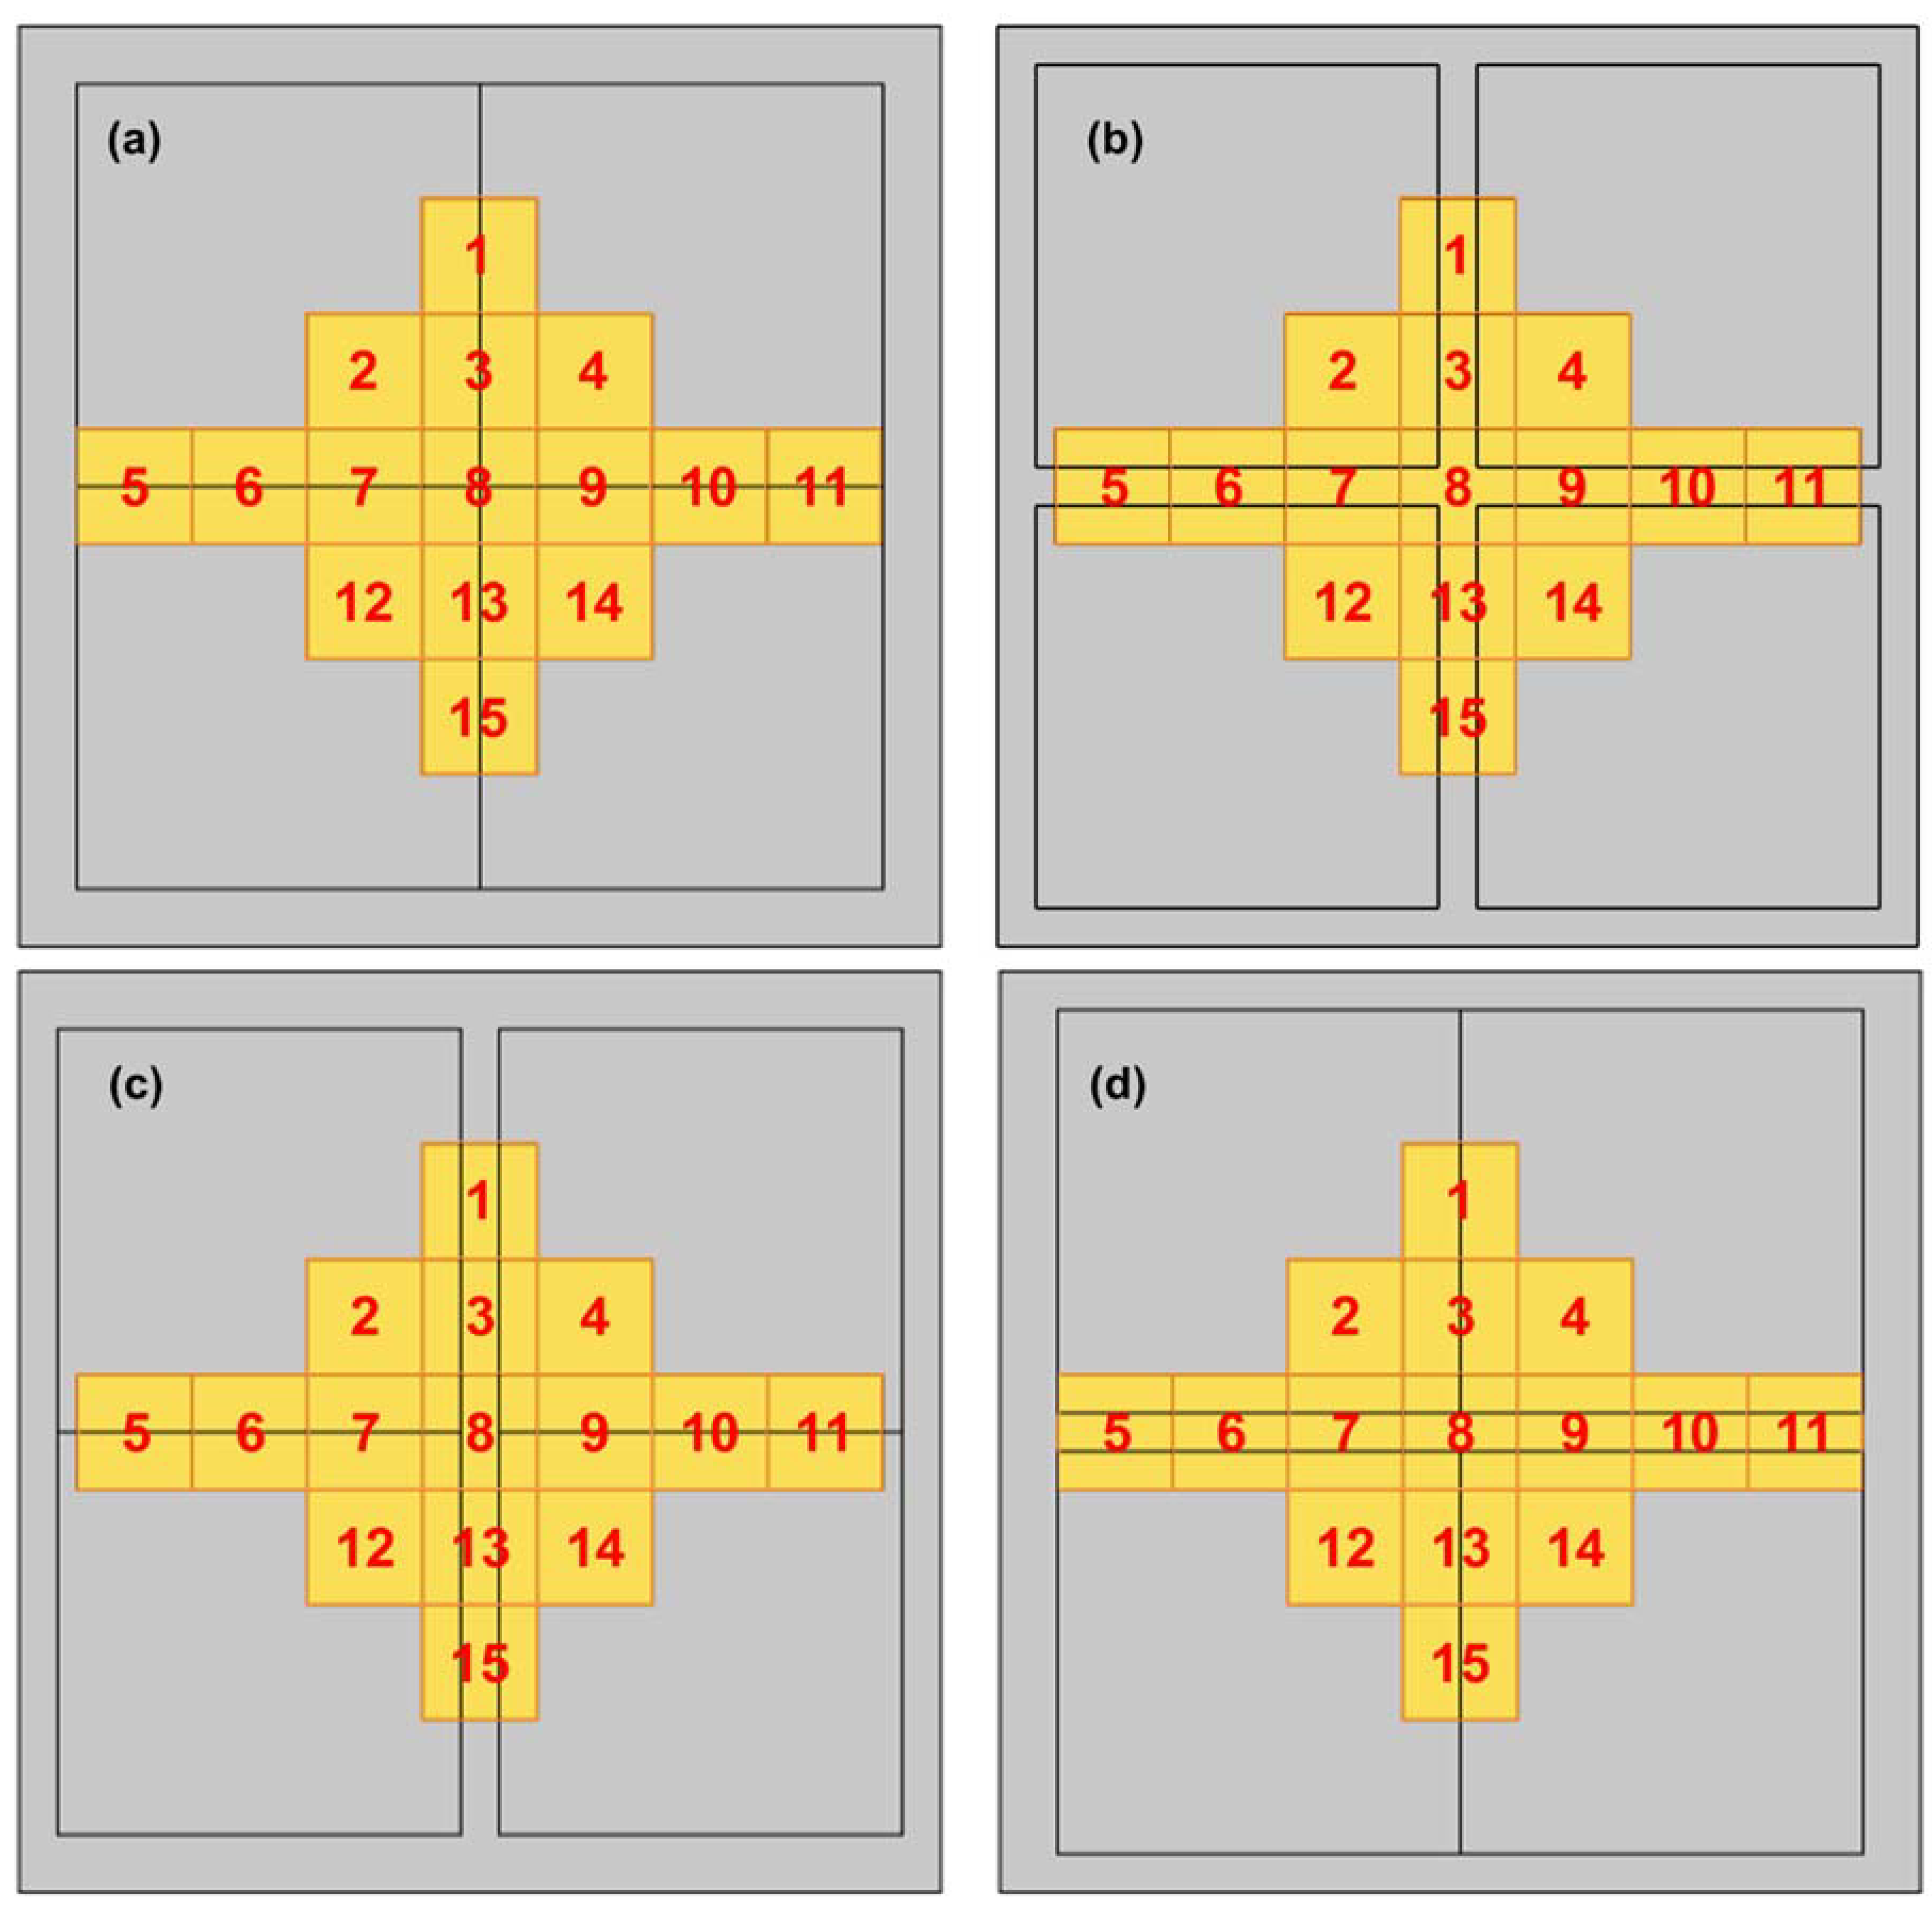
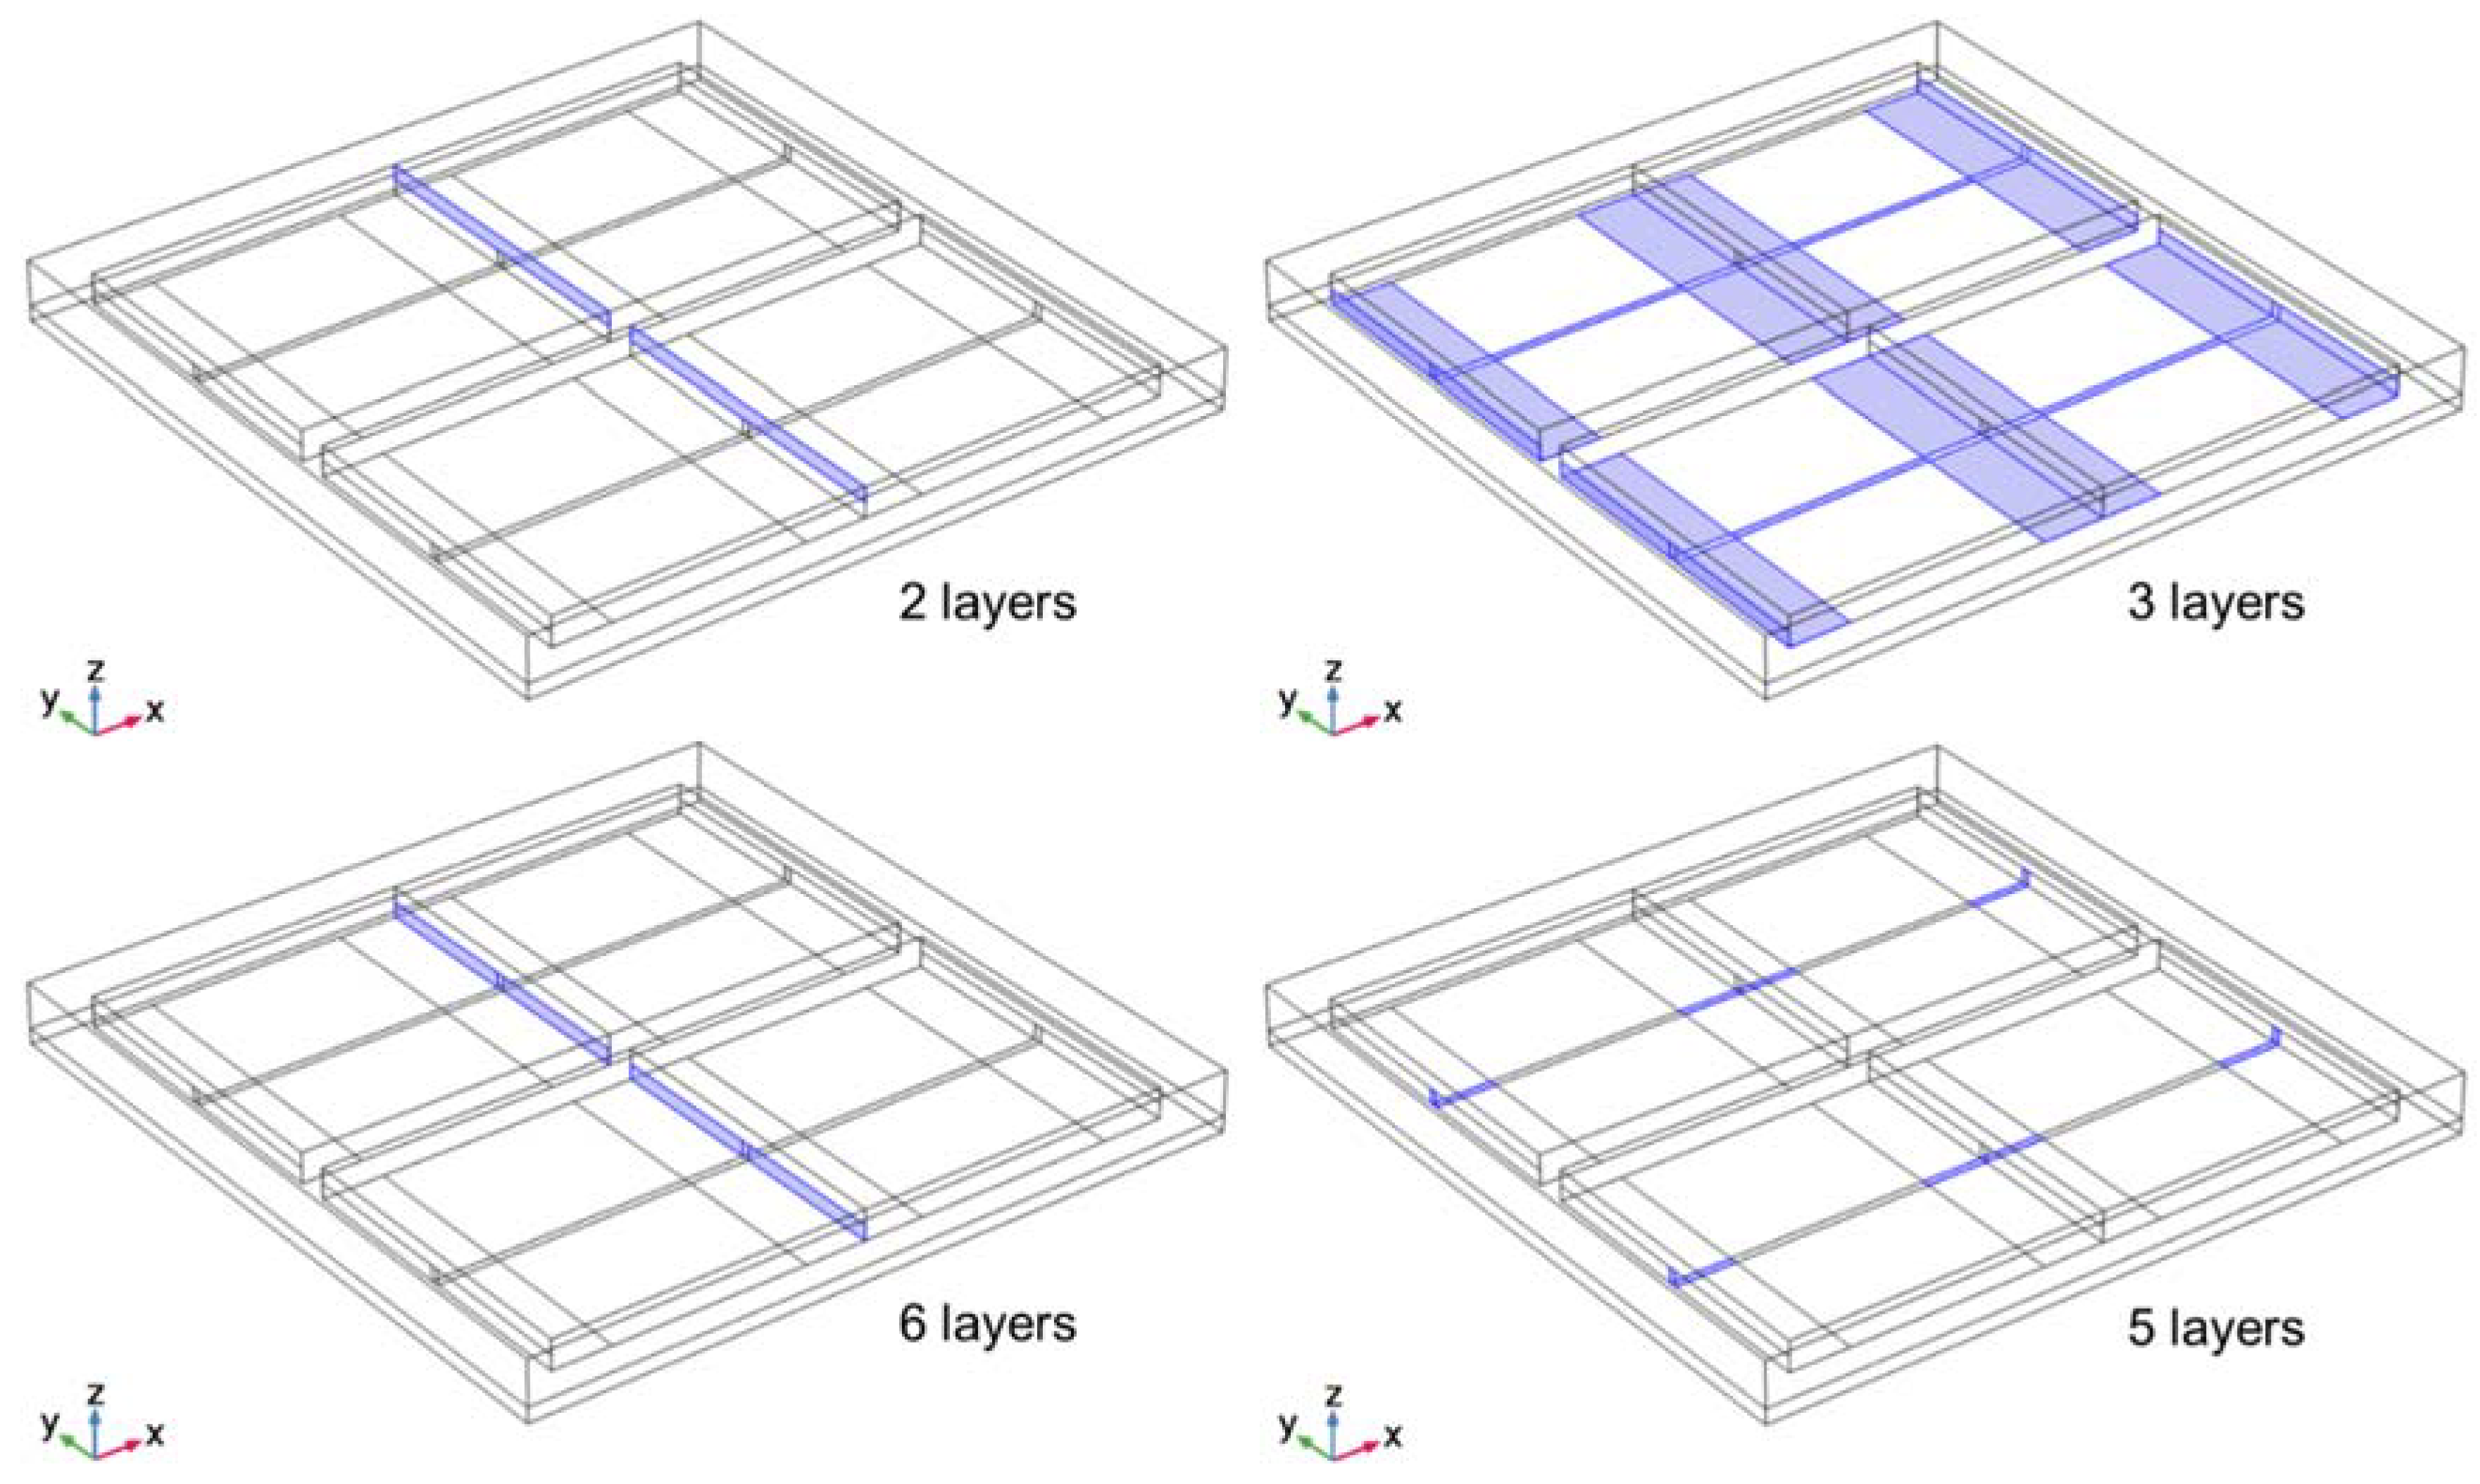
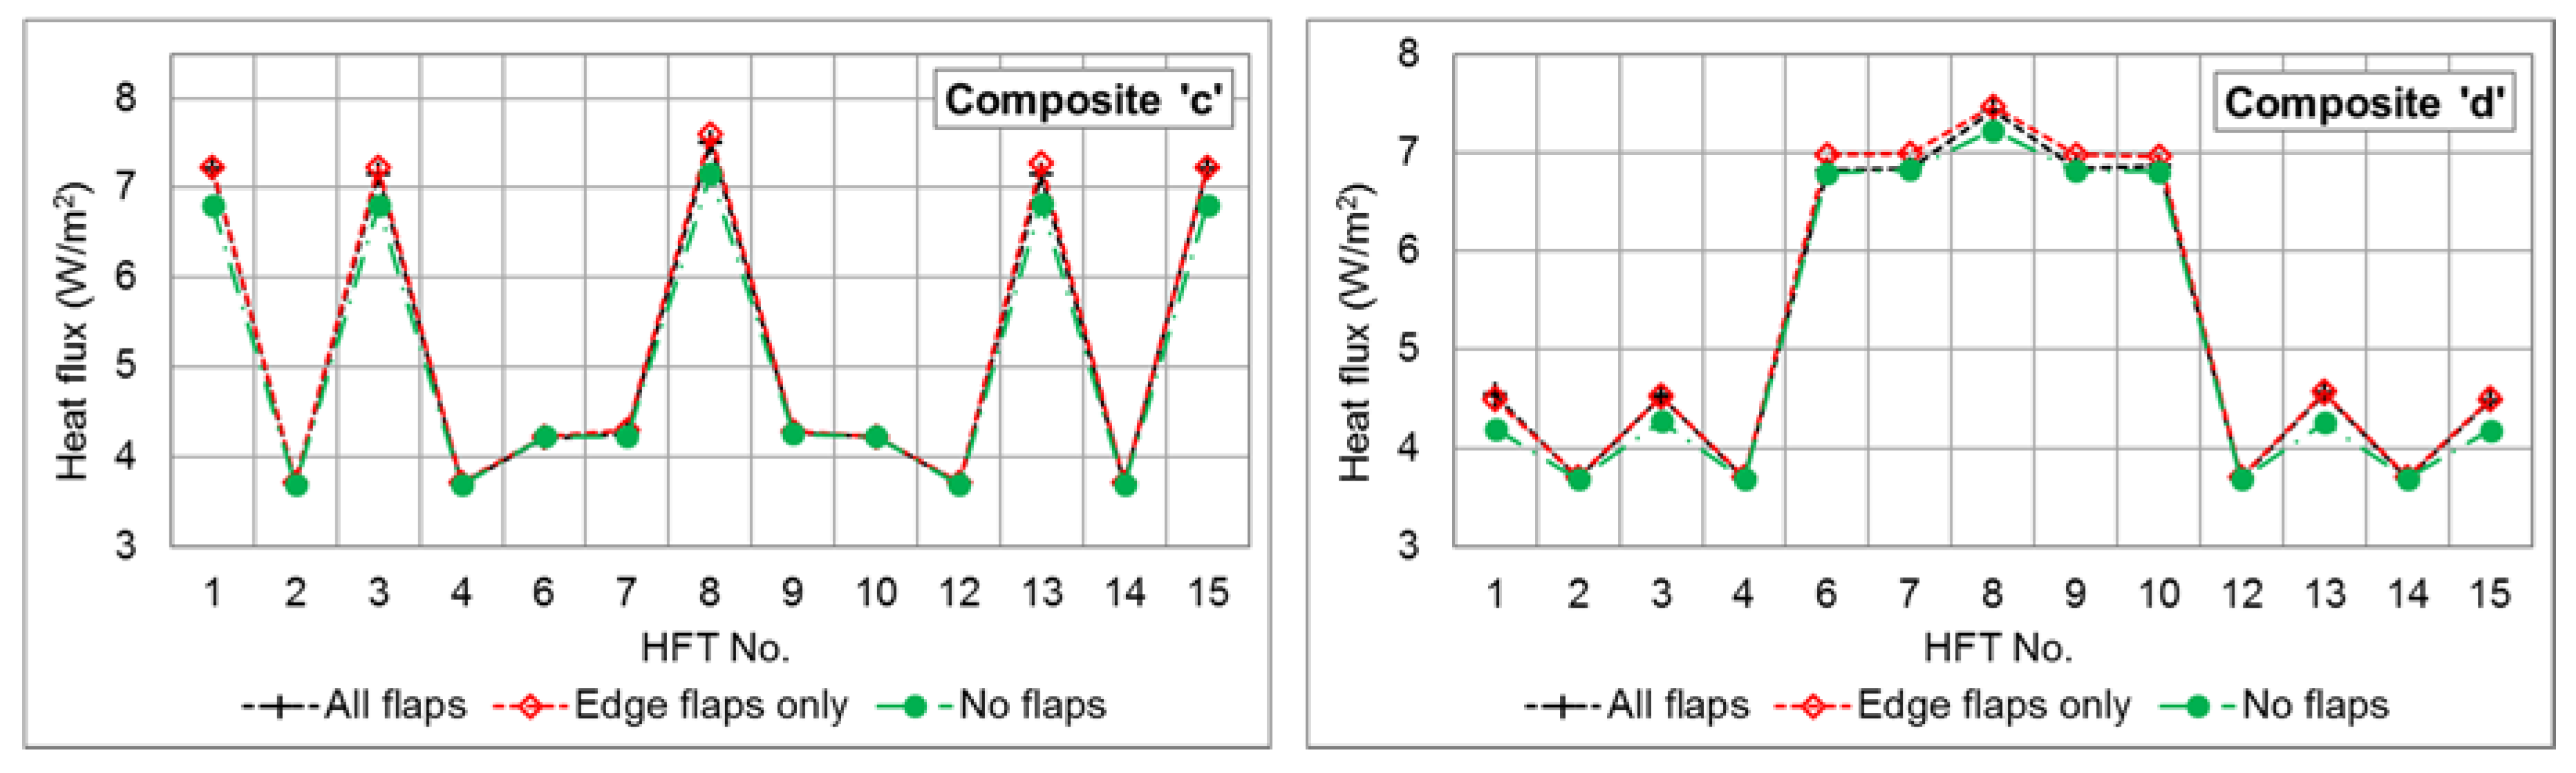
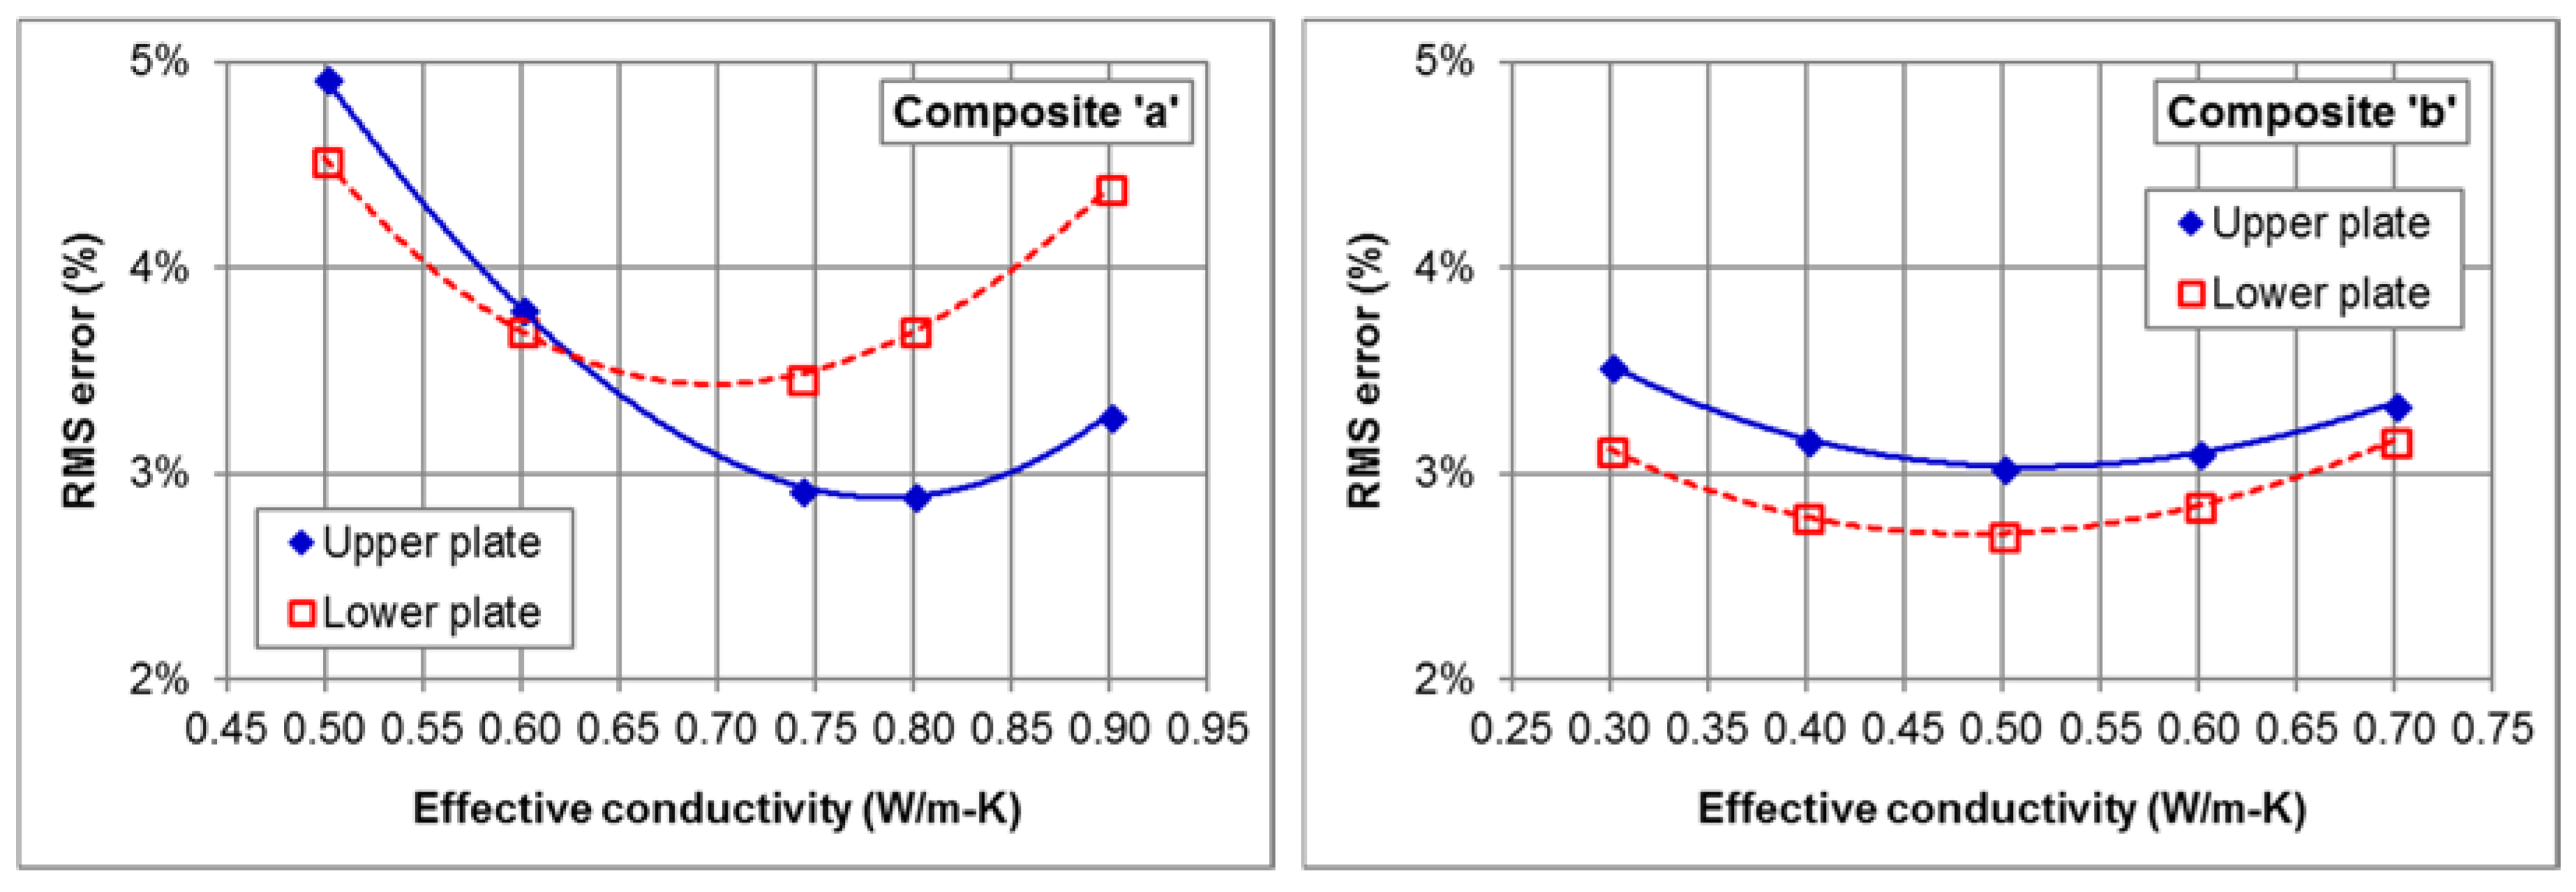
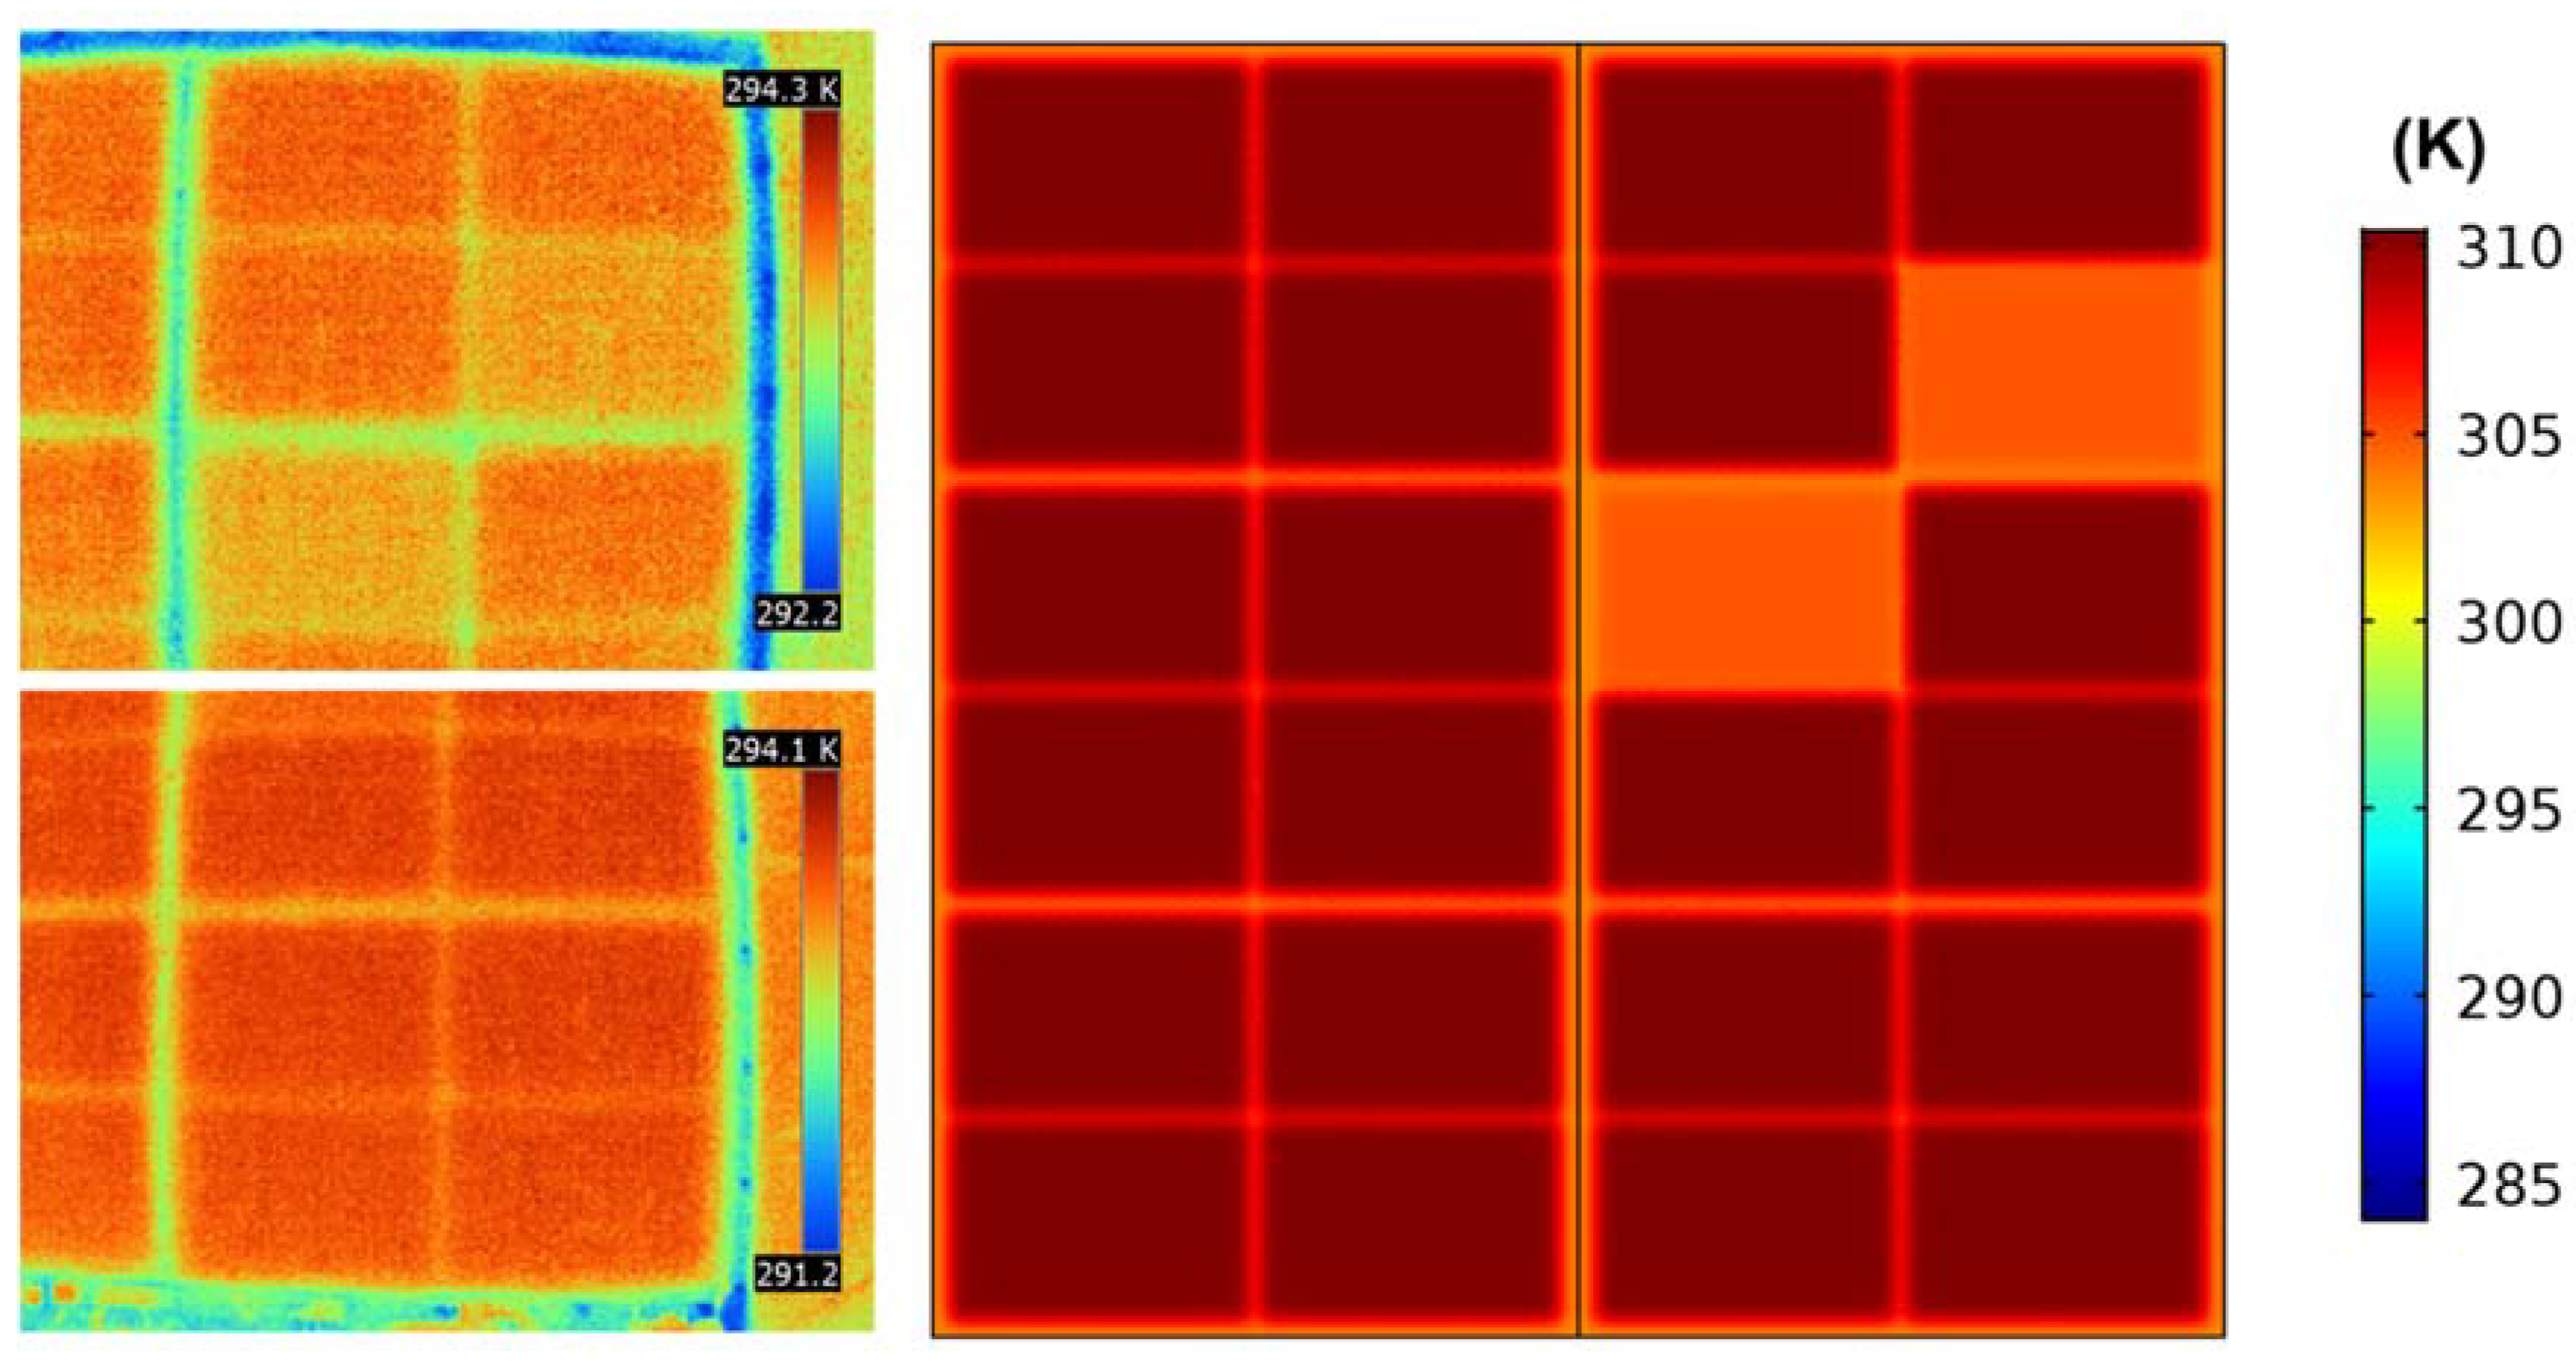
Here, effective edge conductivities of the VIPs at the different interfaces within the composites were estimated by parametric modeling and error-minimization of the differences between the simulation results and experimental data from selected 0.61 × 0.61 m composites. Different edge conductivities were determined based on the material adjacent to the VIPs, i.e., VIP-VIP or foam-VIP interfaces. Impacts of folds were also included by assuming adequate numbers of layers of the barrier films. Next, the estimated edge conductivities were verified by simulations of a separate set of foam-VIP composites and comparing the simulated results of heat flows and thermal resistance with experimental data. Thus, different sets of experimental data were used for estimation and validation of the edge conductivities. Further, the validations were done with experimental measurements of both small- and large-scale samples, with different types of boundary conditions, providing a stringent test of the modeling approach.
This article is organized as follows: Section 2 and Section 3 briefly describe the foam-VIP composites and the experimental characterization methods; these have previously been described by Biswas et al. [20], but are briefly summarized here for ease of understanding; Section 4 describes the model development, input parameters and boundary conditions; finally, Section 5 describes the results of the estimation and verification of the effective edge conductivities.

2. Foam-VIP Composites

As described by Biswas et al. [20], small-scale foam-VIP composites of dimensions 0.61 × 0.61 m and full-scale composites of dimensions 2.44 × 1.22 m were produced for evaluation. The composites consisted of 2.5 cm thick VIPs that were sandwiched by 1.3 cm high-density (HD) polyisocyanurate (PIR) cover boards and 1.3 cm standard polyisocyanurate foam. The composites were created in a foam insulation manufacturing facility in a semi-automatic manner [20]. The HD boards acted as rigid substrates to which the VIPs were adhered, followed by lamination with standard PIR insulation in an in-line manufacturing process. Figure 1 and Figure 2 show the small- and full-scale samples before lamination. The standard PIR insulation was spray-applied to fill the gaps between the VIPs and add a 1.3 cm layer on top. The PIR insulation in the gaps bonded with the HD substrate to act as anchors and improve the overall structural strength of the composite boards.
All VIP-HD composites shown in Figure 1 and Figure 2 were 2.44 m × 1.22 m in dimensions. The small-scale samples were cut to the desired size of 0.61 × 0.61 m post-lamination and four composites sections marked as ‘a’–‘d’ were used for further evaluation. The VIPs in the small-scale composites were nominally 26.7 × 26.7 cm. VIPs in the large scale composites were: (A) 59.5 × 37.1 cm, and (B) 58.2 × 38.6 cm. All VIPs within each large-scale composite were of the same dimensions.

3. Experimental Methods

The small-scale samples were tested in a multi-transducer heat flow meter (HFM) and the large-scale samples were tested in a guarded hot box (GHB) following ASTM International (https://www.astm.org/) standard test methods [20]. The HFM consists of two independently temperature-controlled plates that sandwich a test specimen. The plates contain embedded surface heat flux transducers (HFTs) to measure the heat flow through the test specimen. Figure 3 shows the HFTs of the HFM plates with respect to the locations of the VIPs in the small-scale composites. The HFTs overlapped regions of VIP-only, VIP-VIP joint and foam-VIP interface, thus providing a map of the heat flows through the different regions of the composite.
The large-scale samples were tested in a hot box that consists of a hot chamber and a cold chamber with the test specimen in between, as shown in Figure 4. The hot chamber consists of a meter chamber and guard chamber. The meter chamber opening is nominally 2.44 × 2.44 m, which are the typical test specimen dimensions. Both the meter and guard chambers contain heaters to maintain the same temperature conditions and prevent any heat losses to the surroundings. The hot and cold chambers are equipped with fans for air circulation and creating uniform temperature conditions. For each hot box test, two 2.44 × 1.22 m composite samples were used to create the 2.44 × 2.44 m test specimens. The test specimen surfaces are instrumented with thermocouples. The measured power input to the meter chamber and the temperature difference across the test specimen are used to determine the overall thermal resistance or conductance. Further details of both the small- and large-scale tests are provided in [20].

4. Simulation Methodology

4.1. Numerical Model Development

The model development and simulations were performed using the Heat Transfer module of COMSOL Multiphysics® (https://www.comsol.com/heat-transfer-module, version 5.3a, COMSOL, Inc., Burlington, MA, USA). Three dimensional (3D) models of small- and large-scale composites were created to match the geometries of the actual foam-VIP composites. The VIPs used in the composite boards contained a coextruded polymeric barrier film with a nominal thickness of 140 µm. Rather than resolving the barrier film thickness and individual film layers, the ‘general thin layer’ approximation of COMSOL was used to model the barrier film as a single layer (https://www.comsol.com/heat-transfer-module#features).
Figure 5 illustrates models of a VIP and a VIP-HD board composite compared to the physical specimens. The thin layer approximation was applied for the barrier film on all faces of the VIPs. The flaps or folds of the VIPs were modeled using multiple thicknesses of the barrier film layer. In the models shown in Figure 5, the folds are represented by the sections shaded in blue, with three (3) layers of the barrier film (i.e., 3 × 140 µm). In all VIP-HD board composites, the flaps were taped to one of the faces of the VIPs and the faces containing the flaps were adhered to the HD board, as indicated in the bottom row of Figure 5.
Figure 6 illustrates the complete model of the small-scale composite ‘c’, with 26.7 × 26.7 × 2.5 cm VIPs attached to the 1.3 cm HD board substrate and fully encapsulated by PIR foam. The total composite thickness is 5.1 cm. The barrier films were modeled as a 140 µm single thin layer on all faces of the VIPs, except at the flaps and joints between VIPs. Figure 7 illustrates the different numbers of layers of flaps and joints at different locations. For example, the edges of the VIPs parallel to the x-axis contain the flaps and are butt-jointed. Thus, the top halves of the joints (without the flaps) are modeled as two 140 µm layers and the bottom halves (with the flaps) are modeled as six layers. Further, there are locations of five layers where the x- and y-directional flaps overlap. Finally, there are two small sections with ten layers (not shown in Figure 7), at the joints between the five layered sections. The same model development approach was used to create all small- and large-scale composite models. Figure 8 shows the model of the large-scale composite ‘A’.

4.2. Simulation Parameters and Boundary Conditions

The following steady-state conduction heat transfer equation was solved:
q = k T
q’ is the heat flux vector (W/m2), ‘k’ is thermal conductivity (W/m-K) and ‘T’ is the temperature (K). The thermal conductivities (k) used in the simulations are listed in Table 1. The VIP conductivity is the center-of-panel (COP) value. ‘VIPatm’ represents a damaged VIP with the internal pressure equal to atmospheric pressure. The conductivities of all materials were measured following ASTM C518 [21], except the polymer-based barrier film. The nominal barrier film conductivity listed in Table 1 is based on literature and was only used for preliminary simulations.
Boundary conditions used in the simulations were based on the experimental conditions utilized in [20]. In the small-scale models, the top (PIR) surface temperature was set to 285.93 K and the bottom surface (HD board) was set to 308.15 K. The perimeter was assumed to be insulated or adiabatic, similar to the insulated perimeter of the HFM.
In the large-scale tests, the meter and climate chamber air temperatures were nominally set to 310.93 K and 283.15 K, respectively. In these tests, the HD board was facing the meter chamber and the PIR surface was facing the climate chamber. The perimeter of the test walls were assumed to be adiabatic. The heat fluxes at the composite board surfaces (qsurf, W/m2) facing the meter and climate chambers were calculated using convection (qconv, W/m2) and radiation (qrad, W/m2) heat transfer equations from Incropera and DeWitt [22]. The first term on the right side of Equation (2) represents qconv and the second term represents qrad.
q s u r f = h · ( T a i r T s u r f ) + σ ( T a i r 4 T s u r f 4 ) ( 1 e 1 + 1 e 2 1 )
In Equation (2), the measured air temperatures (Tair, K) from the hot box tests were specified as boundary conditions for the surfaces facing the meter and climate chambers. The surface temperatures (Tsurf, K) were calculated within the simulation. The convection coefficient, h (W/m2-K), was calculated using the empirical relationships for forced, natural and combined convection heat transfer for flat plates [22]; a spreadsheet showing the calculations has been provided as Supplementary Materials. The air film temperature (average of surface and air temperatures) and wind velocities used for calculating ‘h’ were obtained from the hot box tests. The radiation heat transfer was based on the assumption of two large parallel plates [22]. Figure 4 shows black painted surfaces in the climate and meter chamber that face the test specimen surfaces once the climate and meter chambers are closed and clamped across the test specimen holder. The surface emissivities of the test surfaces (e1) and the black painted surfaces (e2) were assumed to be 0.9 and 0.95, respectively. The black surface temperatures were assumed to be the same as the air temperatures in the respective chambers. Finally, ‘σ’ is the Stefan-Boltzmann constant (5.67 × 10⁻⁸ W/m2/K4).
The overall thermal resistance (R, m2-K/W) of the large-scale composites is calculated as:
R = Δ T Q m e t e r · A t e s t
In Equation (3), ‘∆T’ is the area-weighted average temperature difference between the hot and cold surfaces, ‘Qmeter’ is the heat input to the meter side, and ‘Atest’ is the test wall area equal to 5.95 m2. As mentioned in Section 3, two large scale composite boards were combined to make the test walls. ∆T is calculated as:
Δ T = Δ T V I P · ( A V I P A t e s t ) Δ T f o a m · ( 1 A V I P A t e s t )
‘∆TVIP’ and ‘∆Tfoam’ are the average of the surface temperature differences between the hot and cold surfaces of the composite boards over the VIP and foam sections. ‘AVIPAtest’ is the area fraction of the VIPs within the composite foam boards. Figure 9 shows the locations of the temperature ‘sensors’ on the meter-side surface of the test wall ‘A’. The ‘sensors’ represent points at which the surface temperatures were calculated and used to determine the area-weighted temperature difference between the meter and climate-facing surfaces. Similar temperature calculation points were utilized for the test wall with large-scale composite ‘B’. The locations of the model ‘sensors’ are identical to the actual sensors used in the hot box tests described in [20].

5. Simulation Results and Discussion

5.1. Impact of Flaps

Initial simulations were performed to check the impact of the VIP flaps on the heat transfer through the foam-VIP composites. Simulations of small-scale composites ‘c’ and ‘d’ were performed under three scenarios: (1) with all flaps as shown in Figure 7, (2) with only the edge flaps, i.e., the edges were modeled with the requisite number of multiple layers of barrier films while the larger VIP surfaces were assumed to contain a single barrier layer, and (3) with no flaps, i.e., only a single layer of the barrier film was assumed on all faces of the VIPs.
Figure 10 compares the simulated heat fluxes with the aforementioned scenarios at the top surfaces of the composites; similar results were observed at the lower surfaces. Heat fluxes were underestimated at certain locations when no flaps are assumed. However, the simulated heat fluxes with ‘edge flaps only’ were within 3.5% of the heat fluxes calculated with all the flaps. Thus, for simplicity, all simulations presented in the remainder of this article were performed with edge flaps only while ignoring the flaps on the larger VIP surfaces.

5.2. Effective Edge Conductivities

Effective edge conductivities were estimated for the foam-VIP and VIP-VIP interfaces by parametric simulations of small-scale composites ‘a’ and ‘b’. The effective conductivities include the effects of interfacial features like any air pockets within the flaps and between the VIP-VIP joints. The simulations were performed assuming a range of conductivities and the effective conductivities were estimated using an error minimization method between the calculated and measured heat fluxes. Area-averaged heat fluxes were calculated at identical locations in the models as the locations of the HFTs in the heat flow meter used for testing the small-scale composites. Using symmetry, calculated heat fluxes corresponding to HFTs 1, 3, 6, 7 and 8 were used for comparison with the measurements. HFT 5 is usually ignored for analysis purposes as it is too close to the edge of the heat flow meter and may be influenced by two-dimensional heat transfer effects. The measured heat fluxes were the averages of corresponding HFTs, i.e., similar locations within the composites ‘a’–‘d’ as shown in Figure 3. Table 2 shows the average measured heat fluxes at the upper (up) and lower (low) heat flow meter plates used for estimating the effective edge conductivities.
Figure 11 shows the percent root mean squared (RMS) errors between the measured (meas.) and calculated (cal.) heat fluxes as a function of the assumed edge conductivities. The RMS errors were calculated as follows, with n = 5 (i.e., number of HFTs used for comparison):
R M S   e r r o r = 1 n [ i = 1 n ( q m e a s . q c a l . q m e a s . ) 2 ] 1 / 2
In composite ‘a’, all the VIPs are butt-jointed and in composite ‘b’, the VIPs are separated by foam-filled gaps. Hence, the assumed edge conductivities corresponding to the minimum RMS errors were 0.7422 and 0.5002 W/m-K, respectively. The effects of flaps were included in the estimations by assuming the appropriate number of layers (1, 2, 3 or 6) of barrier films at the VIP edges as shown in Figure 7.

5.3. Validation of Edge Conductivities using Small-scale Composite Models

The calculations of the edge conductivities were checked for their efficacy by using them to simulate the heat fluxes through the small-scale composites ‘c’ and ‘d’. In both ‘c’ and ‘d’, the VIPs are butt jointed along one axis but are separated by foam-filled gaps along the other axis. In these simulations, the effective edge conductivities were assumed to be 0.7422 W/m-K along the VIP-VIP joints and 0.5002 W/m-K at the VIP-foam interfaces. Again, flaps were included by assuming the appropriate numbers of layers of barrier films at the joints. Table 3 and Table 4 compare the calculated and measured heat fluxes from composites ‘c’ and ‘d’. The resulting RMS errors were:
  • Composite ‘c’: upper—4.16%; lower—3.80%.
  • Composite ‘d’: upper—0.48%; lower—1.78%.

5.4. Validation and Evaluation Using Large-scale Composite Models

Next, the barrier film conductivities at the VIP-VIP and VIP-foam interfaces were utilized to simulate the large-scale models using the conditions from the guarded hot box tests. Table 5 lists the test parameters that were used as inputs to the simulations of the large-scale composites ‘A’ and ‘B’. The average air temperatures (Tavg,air) and average surface temperatures (Tavg,surf) were calculated using individual thermocouple measurements; the average surface temperatures were area-weighted calculations using the VIP and foam sections. Wind speeds are based on measurements. It is noted that the surface temperatures and wind speeds were not used as direct inputs to the models. Instead, they were used in conjunction with the air temperatures to calculate ‘h’ using convection correlations [22]; calculations details of ‘h’ are included as Supplementary Materials.
Infrared (IR) images of the composite ‘B’ test wall indicated two failed VIPs and were modeled similarly. Figure 12 shows a qualitative comparison of the apparent temperature map of sections of composite ‘B’ containing the failed VIPs as well as the temperature map from the simulations. The temperature maps are on the warm side of the samples; the higher conductivity of the failed VIPs results in higher heat flow and lower surface temperatures compared to intact VIPs. The IR imaging was done with the warm side at room temperature, so the apparent and calculated surface temperatures are not expected to be the same; hence, Figure 12 is only intended to show a qualitative comparison of the impact of the failed VIPs.
Table 6 compares the calculated (cal.) and measured (meas.) area-weighted surface temperature differences (ΔT), heat flow through the meter-side surface (Qmeter) and overall thermal resistance (R) of the composite test walls calculated using Equation (3). Overall, good agreement was observed between the measurements and calculations. The calculated surface heat flows and thermal resistances were within 7.0–9.9% and 4.7–9.2% of the measurements, respectively.
The differences can be partly attributed to the fact that the simulations assumed adiabatic perimeters of the test walls, while there may have been some minor unaccounted perimeter heat losses in the experiments. The higher uncertainties in composite ‘B’ may also result from the presence of the failed VIPs, which were not considered in the estimations of the effective edge conductivities. However, if no failed VIPs are assumed, the model estimates the thermal resistance of composite ‘B’ to be 4.83 m2-K/W. Similarly, estimates of thermal resistance of foam-VIP composites with different configurations of VIPs can be obtained from these simulations and, in turn, can be used for energy savings analyses via whole-building simulations.

6. Conclusions and Future Work

This article presents detailed development and validation of finite element models of foam-VIP composites to estimate effective edge conductivities of VIPs and their impacts on the overall thermal resistance of the composites. The edge conductivities were estimated by comparing the simulation results with measurements of 0.61 × 0.61 m foam-VIP composites and using an error minimization method. The edge conductivities were estimated by taking into account the neighboring materials, i.e., whether the VIPs were adjacent to other VIPs or foam insulation. Models incorporating the edge conductivities were then used to simulate additional 0.61 × 0.61 m and 2.44 × 1.22 m composites. The simulations used either the same boundary conditions as the experiments or used the experimental parameters to define the appropriate boundary conditions. The model predicted thermal resistance of a large-scale composite with all intact VIPs was within 4.7% of the measured value.
Overall, the simulation results were in good agreement with the experimental results, verifying the efficacy of the modeling approach presented here. Thus, using measurements of a limited number of small-scale foam-VIP composites from heat flow meter tests or similar, appropriate thermal transmission properties of embedded VIPs can be obtained. Those thermal transmission properties can then be utilized for modeling full-scale foam-VIP composites for building applications and generate useful energy saving estimates.
The proposed modeling approach has broad applicability to VIP-based systems and composites. However, accurate knowledge of the thermal transmission properties of the different interfaces are required. The proposed method shows that simulations combined with measurements from small-scale samples, which are suitable for heat flow meters, are adequate to estimate the overall thermal resistance or conductance of full-scale systems containing VIPs; the advantage is that heat flow meters are quite commonly used by the industry and research organizations.

Supplementary Materials

The following are available online at https://www.mdpi.com/1996-1073/11/9/2228/s1.

Funding

This work was supported by the Building Technologies Office of the United States Department of Energy under Contract No. DE-AC05-00OR22725 with UT-Battelle, LLC.

Acknowledgments

The author is grateful to Douglas Smith, Ron Esperza and John Jones of NanoPore as well as John Letts, Jennifer Yao, Mike Hubbard, Randy Strauser, Joseph Nelson and Wayne Vernon of Firestone Building Products for their efforts and support in making the VIPs and foam-VIP composite boards. Thanks are due to Jerald Atchley of ORNL and Timothy Jiang of Vanderbilt University for performing the hot box and HFM tests, respectively. The development of the VIPs and foam-VIP composites as well as the hot box and HFM tests have been reported in [20] and are utilized in the current work for explanatory and model validation purposes only.

Conflicts of Interest

The author declares no conflict of interest.

Nomenclature

Nomenclaturedefinition
eSurface emissivity
hConvection heat transfer coefficient (W/m2-K)
kThermal conductivity (W/m-K)
RThermal resistance (m2-K/W)
QHeat input (W)
qHeat flux (W/m2)
TTemperature (K)
σStefan-Boltzmann constant (5.67 × 10⁻⁸ W/m2/K4)
Subscriptdefinition
atmAtmospheric
avgAverage
cal.Calculated
convConvection
lowLower plate
meas.Measured
meterMeters-side
radRadiation
surfSurface
upUpper plate
Abbreviationsdefinition
COPCenter-of-panel
EPSExpanded polystyrene
FEAFinite element analysis
GHBGuarded hot box
HDHigh-density
HFMHeat flow meter
HFTHeat flux transducer
IRInfrared
PIRPolyisocyanurate
RMSRoot mean squared
VIPVacuum insulation panel

References

  1. Alam, M.; Singh, H.; Limbachiya, M.C. Vacuum Insulation Panels (VIPs) for building construction industry-A review of the contemporary developments and future directions. Appl. Energy 2011, 88, 3592–3602. [Google Scholar] [CrossRef]
  2. Biswas, K.; Rose, J.; Eikevik, L.; Guerguis, M.; Enquist, P.; Lee, B.; Love, L.; Green, J.; Jackson, R. Additive Manufacturing Integrated Energy-Enabling Innovative Solutions for Buildings of the Future. J. Sol. Energy Eng. 2017, 139. [Google Scholar] [CrossRef]
  3. Mukhopadhyaya, P.; MacLean, D.; Korn, J.; van Reenen, D.; Molleti, S. Building application and thermal performance of vacuum insulation panels (VIPs) in Canadian subarctic climate. Energy Build. 2014, 85, 672–680. [Google Scholar] [CrossRef] [Green Version]
  4. Park, S.; Choi, B.-H.; Lim, J.-H.; Song, S.-Y. Evaluation of Mechanically and Adhesively Fixed External Insulation Systems Using Vacuum Insulation Panels for High-Rise Apartment Buildings. Energies 2014, 7, 5764–5786. [Google Scholar] [CrossRef] [Green Version]
  5. Yang, Z.; Katsura, T.; Aihara, M.; Nakamura, M.; Nagano, K. Development of Numerical Heat Transfer and the Structural Model to Design Slim and Translucent Vacuum Layer Type Insulation Panels to Retrofitting Insulation in Existing Buildings. Energies 2017, 10, 2108. [Google Scholar] [CrossRef]
  6. IEA/ECBCS Annex 39. Vacuum Insulation Panels—Study on VIP-Components and Panels for Service Life Prediction of VIP in Building Applications (Subtask A). Available online: http://www.iea-ebc.org/Data/publications/EBC_Annex_39_Report_Subtask-A.pdf (accessed on 22 August 2018).
  7. Jelle, B.P. Traditional, state-of-the-art and future thermal building insulation materials and solutions—Properties, requirements and possibilities. Energy Build. 2011, 43, 2549–2563. [Google Scholar] [CrossRef]
  8. Tenpierik, M.; Cauberg, H. Analytical models for calculating thermal bridge effects caused by thin high barrier envelopes around vacuum insulation panels. J. Build. Phys. 2007, 30, 185–215. [Google Scholar] [CrossRef]
  9. Wakili, K.G.; Bundi, R.; Binder, B. Effective thermal conductivity of vacuum insulation panels. Build. Res. Inf. 2004, 32, 293–299. [Google Scholar] [CrossRef]
  10. Schiedel, M.J.; Cruickshank, C.A.; Baldwin, C.M. In Situ Experimental Validation of THERM Finite Element Analysis for a High R-Value Wall Using Vacuum Insulation Panels. J. Solar Energy Eng. 2015, 137. [Google Scholar] [CrossRef]
  11. Lim, T.; Seok, J.; Kim, D.D. A Comparative Study of Energy Performance of Fumed Silica Vacuum Insulation Panels in an Apartment Building. Energies 2017, 10, 2000. [Google Scholar] [CrossRef]
  12. Tenpierik, M.; van Der Spoel, W.; Cauberg, H. An analytical model for calculating thermal bridge effects in high performance building enclosure. J. Build. Phys. 2008, 31, 361–387. [Google Scholar] [CrossRef]
  13. Choi, B.; Song, T.H. Investigation of edge taping method applied to vacuum insulation panels. Energy Build. 2017, 134, 52–60. [Google Scholar] [CrossRef]
  14. IEA/ECBCS Annex 39. Vacuum Insulation in the Building Sector—Systems and Applications (Subtask B). Available online: http://www.iea-ebc.org/Data/publications/EBC_Annex_39_Report_Subtask-B.pdf (accessed on 22 August 2018).
  15. Bossche, N.V.D.; Moens, J.; Janssens, A.; Delvoye, E. Thermal performance of VIP panels: assessment of the edge effect by experimental and numerical analysis. In Proceedings of the 1st Central European Symposium on Building Physics (CESBP 2010), Cracow, Lodz, Poland, 13–15 September 2010. [Google Scholar]
  16. Wakili, K.G.; Stahl, T.; Brunner, S. Effective thermal conductivity of a staggered double layer of vacuum insulation panels. Energy Build. 2011, 43, 1241–1246. [Google Scholar] [CrossRef]
  17. Sprengard, C.; Holm, A.H. Numerical examination of thermal bridging effects at the edges of vacuum-insulation-panels (VIP) in various constructions. Energy Build. 2014, 85, 638–643. [Google Scholar] [CrossRef]
  18. Capozzoli, A.; Fantucci, S.; Favoino, F.; Perino, M. Vacuum Insulation Panels: Analysis of the Thermal Performance of Both Single Panel and Multilayer Boards. Energies 2015, 8, 2528–2547. [Google Scholar] [CrossRef] [Green Version]
  19. Kim, J.H.; Kim, S.M.; Kim, J.T. Simulation performance of building wall with vacuum insulation panel. Procedia Eng. 2016, 180, 1247–1255. [Google Scholar] [CrossRef]
  20. Biswas, K.; Desjarlais, A.; Smith, D.; Letts, J.; Yao, J.; Jiang, T. Development and thermal performance verification of composite insulation boards containing foam-encapsulated vacuum insulation panels. Appl. Energy 2018, 228, 1159–1172. [Google Scholar] [CrossRef]
  21. Farmer, D.; Gorse, C.; Swan, W.; Fitton, R.; Brooke-Peat, M.; Miles-Shenton, D.; Johnston, D. Measuring thermal performance in steady-state conditions at each stage of a full fabric retrofit to a solid wall dwelling. Energy Build. 2017, 156, 404–414. [Google Scholar] [CrossRef]
  22. Incropera, F.P.; DeWitt, D.P. Fundamentals of Heat and Mass Transfer, 4th ed.; Wiley & Sons Inc.: Hoboken, NJ, USA, 1996. [Google Scholar]
Figure 1. VIP (vacuum insulation panel)-HD (high-density) board composite for 0.61 m × 0.61 m samples. Samples ‘a’–‘d’ contain different configurations of VIPs (with and without foam gaps) and were used for testing and evaluation. (a) all VIPs butt-jointed; (b) foam gaps between all VIPs; (c) VIPs butt-jointed along the length and with a foam gap along the width; (d) VIPs butt-jointed along the width and with a foam gap along the length.
Energies 11 02228 g001
Figure 2. VIP-HD board composites for 2.44 m × 1.22 m samples. Samples ‘A’ and ‘B’ contain VIPs of two different dimensions and in two different configurations. (A) VIP butt-jointed along the length in three rows with foam gaps between the rows; (B) three groups of four butt-jointed VIPs with foam gaps between the groups.
Energies 11 02228 g002
Figure 3. Location of HFTs (heat flux transducers) with respect to the VIPs in the small-scale composites. The samples ‘a’–‘d’ correspond to the small-scale composites with different VIP configurations. (a) all VIPs butt-jointed; (b) foam gaps between all VIPs; (c) VIPs butt-jointed along the length and with a foam gap along the width; (d) VIPs butt-jointed along the width and with a foam gap along the length.
Energies 11 02228 g003
Figure 4. Guarded hot box for testing large-scale composites.
Energies 11 02228 g004
Figure 5. Illustration of physical and modeled VIP (top row) and VIP-HD board composite ‘d’ (bottom row).
Energies 11 02228 g005aEnergies 11 02228 g005b
Figure 6. Model of composite ‘c’ with VIPs embedded within PIR (polyisocyanurate) foam and HD board.
Energies 11 02228 g006
Figure 7. Highlighted barrier film flaps and joints between VIPs in composite ‘d’ model. The model dimensions are the same as composite ‘c’ shown in Figure 6.
Energies 11 02228 g007
Figure 8. Model of large-scale composite ‘A’, with the embedded VIPs (left) and VIP-VIP interfaces (right) highlighted in blue.
Energies 11 02228 g008
Figure 9. Locations of calculated surface temperatures with respect to the VIPs (highlighted in yellow), VIP-VIP joints and foam gaps; the point calculations of surface temperatures were used to calculate the area-weighted surface temperature difference.
Energies 11 02228 g009
Figure 10. Comparison of simulated heat fluxes with ‘All flaps’, ‘Edge flaps only’ and ‘No flaps’.
Energies 11 02228 g010
Figure 11. Root mean square errors between the calculated and measured heat fluxes.
Energies 11 02228 g011
Figure 12. Temperature maps of composite ‘B’ using infrared imaging (left) and simulations (right), comparing heat flows through intact and failed VIPs.
Energies 11 02228 g012
Table 1. Materials and thermal conductivities.
Materialk (W/m-K)
PIR0.026
HD board0.029
VIP0.0049
VIPatm0.01924
Barrier film0.341
Table 2. Average measured heat fluxes from composite ‘a’ and ‘b’ used for estimating effective edge conductivities.
Model HFT (Heat Flux Transducer)HFTs Used for Averaging (Figure 3)Composite ‘a’Composite ‘b’
qup (W/m2)qlow (W/m2)qup (W/m2)qlow (W/m2)
11, 154.9804.7127.1296.918
33, 134.9584.8517.2227.305
66, 105.3255.0877.9447.578
77, 95.2325.1717.9217.833
886.3136.2929.3889.444
Table 3. Comparison of measured and calculated heat fluxes through composite ‘c’.
Model HFTHFTs Used for Averaging (Figure 3)MeasuredCalculatedPercent Error (%)
qup (W/m2)qlow (W/m2)qup (W/m2)qlow (W/m2)UpperLower
11, 156.9906.8007.4807.483−7.0−10.0
33, 137.0396.9897.5087.426−6.7−6.3
66, 105.5025.2584.7454.78213.89.1
77, 95.4985.5314.8324.90212.111.4
888.0778.1238.2278.375−1.9−3.1
Table 4. Comparison of measured and calculated heat fluxes through composite ‘d’.
Model HFTHFTs Used for Averaging (Figure 3)MeasuredCalculatedPercent error (%)
qup (W/m2)qlow (W/m2)qup (W/m2)qlow (W/m2)UpperLower
11, 155.1824.9055.1345.1450.9−4.9
33, 135.1985.2395.0905.2402.10.0
66, 107.1826.7737.1517.1570.4−5.7
77, 97.1536.9317.1497.1010.1−2.4
887.9537.8607.9938.186−0.5−4.1
Table 5. Hot box test parameters and simulation inputs.
ParameterComposite ‘A’Composite ‘B’
MeterClimateMeterClimate
VIP area fraction0.8980.913
Tavg,air (K)310.97283.07311.03283.24
Tavg,surf (K)310.11283.54310.06283.71
Wind speed (m/s)0.1850.8980.1781.725
h (W/m2-K)1.0220.6281.4030.871
Table 6. Comparison measurements and calculations of large-scale composites.
ParameterComposite ‘A’Composite ‘B’
Cal.Meas.% Diff.Cal.Meas.% Diff.
ΔT (K)25.8826.5825.8826.30
Qmeter (W)112.59121.12−7.0119.34132.43−9.9
R (m2-K/W)4.664.454.74.404.039.2

