Article

A Study to Investigate Fluid-Solid Interaction Effects on Fluid Flow in Micro Scales

State Key Laboratory of Petroleum Resources and Prospecting, China University of Petroleum, Beijing 102249, China
*
Author to whom correspondence should be addressed.
Energies 2018, 11(9), 2197; https://doi.org/10.3390/en11092197
Submission received: 17 July 2018 / Revised: 17 August 2018 / Accepted: 20 August 2018 / Published: 22 August 2018
(This article belongs to the Special Issue Flow and Transport Properties of Unconventional Reservoirs 2018)

Abstract

:
Due to micro-nanopores in tight formation, fluid-solid interaction effects on fluid flow in porous media cannot be ignored. In this paper, a novel model which can characterize micro-fluid flow in micro scales is proposed. This novel model has a more definite physical meaning compared with other empirical models. And it is validated by micro tube experiments. In addition, the application range of the model is rigorously analyzed from a mathematical view, which indicates a wider application scope. Based on the novel model, the velocity profile, the average flow velocity and flow resistance in consideration of fluid-solid interaction are obtained. Furthermore, the novel model is incorporated into a representative pore scale network model to study fluid-solid interactions on fluid flow in porous media. Results show that due to fluid-solid interaction in micro scales, the change rules of the velocity profile, the average flow velocity and flow resistance generate obvious deviations from traditional Hagen-Poiseuille’s law. The smaller the radius and the lower the displacement pressure gradient (∇P), the more obvious the deviations will be. Moreover, the apparent permeability in consideration of fluid-solid interaction is no longer a constant, it increases with the increase of ∇P and non-linear flow appears at low ∇P. This study lays a good foundation for studying fluid flow in tight formation.

1. Introduction

With the development of petroleum industry, tight oil is gradually becoming one of the main fields to improve oil recovery [1,2,3]. However, there are large numbers of micro-nanopores in tight formation [4,5,6,7]. The large specific surface area and surface effect exhibiting in micro-nanoscales cause micro scale flow different from fluid flow in macro scales [8,9]. Therefore, figuring out microscopic flow law in consideration of micro scale effect is of great importance to the development of tight oil reservoirs. The research of micro-machining technology and micro-electro-mechanical system triggers a new field for the study of micro scale flow, which provides a new insight for studying fluid flow in tight reservoirs [10,11,12,13].
Recently, many micro flow experiments have been carried out and results show obvious deviations from traditionally theoretical prediction, which indicates that fluid flow in micro tubes no longer abides by traditional N-S equation [14,15,16,17,18]. Pfaler et al. [19] found that the experimental result is consistent with theoretical prediction when the micro channel size is large enough. However, an obvious deviation occurs when the size is reduced to 0.8 μm. Makihara et al. [20] conducted a water flow experiment in micro tubes with Silica and stainless steel and found that the relationship of the Reynolds number versus displacement pressure gradient did not obey theoretical values when the micro-tube diameter was smaller than 150 μm. Qu et al. [21] performed a water flow experiment in Trapezoidal microtubules and concluded that fluid flow deviated from the theoretical value of N-S equation. Wu [22] carried out a deionized water flow experiment in micro tubes with radii ranging from 1.38–10.03 μm at low ∇P and found that water flow did not agree with classical Hagen-Poiseuille law; the boundary layer was formed in the near wall area.
Fluid-solid interactions are used to account for these deviations. With the decrease of flow scale, microscopic forces acting on fluid flow become dominated, which eventually results in micro flow characteristics different from macro flow [23,24]. The Coulomb force generated by the wall molecules on the liquid, the Van der Waals force by the molecular polarization and the space configuration force affect micro fluid flow greatly [25]. Due to strong interaction between fluid and solid, the fluid near the solid wall is adsorbed on the wall surface and cannot move. Researchers define the immovable layer as boundary layer [26]. Under the influence of fluid-solid interaction, the effective flow space is compressed and the flow resistance becomes larger. Pertsin et al. [27] theoretically proved that there exists a density profile in a cylindrical pore. The closer the distance is away from the solid wall, the larger the density will be. Rene et al. [28] studied the meniscus thickness of pure water extended on clean quartz surface by image analysis interferometer and found that the thickness near the solid wall is larger than 0.1 μm, indicating the great effect of boundary layer on fluid flow in micro scales. The boundary layer thickness is not a constant [29,30,31], it is a function of hydrodynamics. The boundary layer thickness is large due to strong fluid-solid interaction at low ∇P. With the increase of ∇P, the shear force of the wall fluid increases, more and more fluid begins to flow, the boundary layer becomes thinner and the flow curve is closer to classical Hagen-Poiseuille’s law [32,33,34,35].
Boundary layer effect on micro scale flow cannot be neglected owing to strong fluid-solid interaction. Its effect on fluid flow will become more and more significant with the decrease of flow scale. In addition, the wettability of the fluid on the solid surface will also affect micro fluid flow. When fluid has a strong wettability on the solid surface, the microscopic forces such as electrostatic forces and Van der Waals forces play a dominant role in micro fluid flow. The fluid in micro tubes is strongly affected by the fluid-solid interaction. There will be a large portion of fluid absorbed on the solid surface, which results in large boundary layer thickness. In order to characterize fluid flow in micro scales, boundary layer thickness must be described quantitatively in advance. While molecular dynamics simulation offers a good way to characterize fluid-solid interaction [36], it is very time-consuming and powerless for large-scale flow simulation, especially for porous media with thousands of pores and throats. In addition, the theoretical model which can characterize boundary layer thickness is hard to propose as fluid- solid interaction is very complex. Therefore, many empirical models combined with micro tube experiments have been developed so as to characterize boundary layer thickness [26,33,37,38,39]. At present, many empirical models are obtained in a traditional way. In addition, these models either have limited application range or lack physical meaning. Therefore, it is necessary to establish a novel model which not only offers definite physical meaning but also has a wider application range so as to study fluid flow in porous media with various pores.
In this work, a novel model which can characterize boundary layer thickness and fluid flow in micro scales is developed from a new prospective. Different micro tube experiments are used to validate the novel model. Furthermore, its application range is strictly proved mathematically, indicating a wide application scope. Based on the novel model, fluid-solid interaction effects on micro flow in micro tubes are studied, mainly including three parts: velocity profile, the average flow velocity and flow resistance. Finally, the novel model is incorporated into pore scale network model to study fluid-solid effects on fluid flow in tight formation.

2. Establishment of a Novel Model Considering Fluid-Solid Interaction

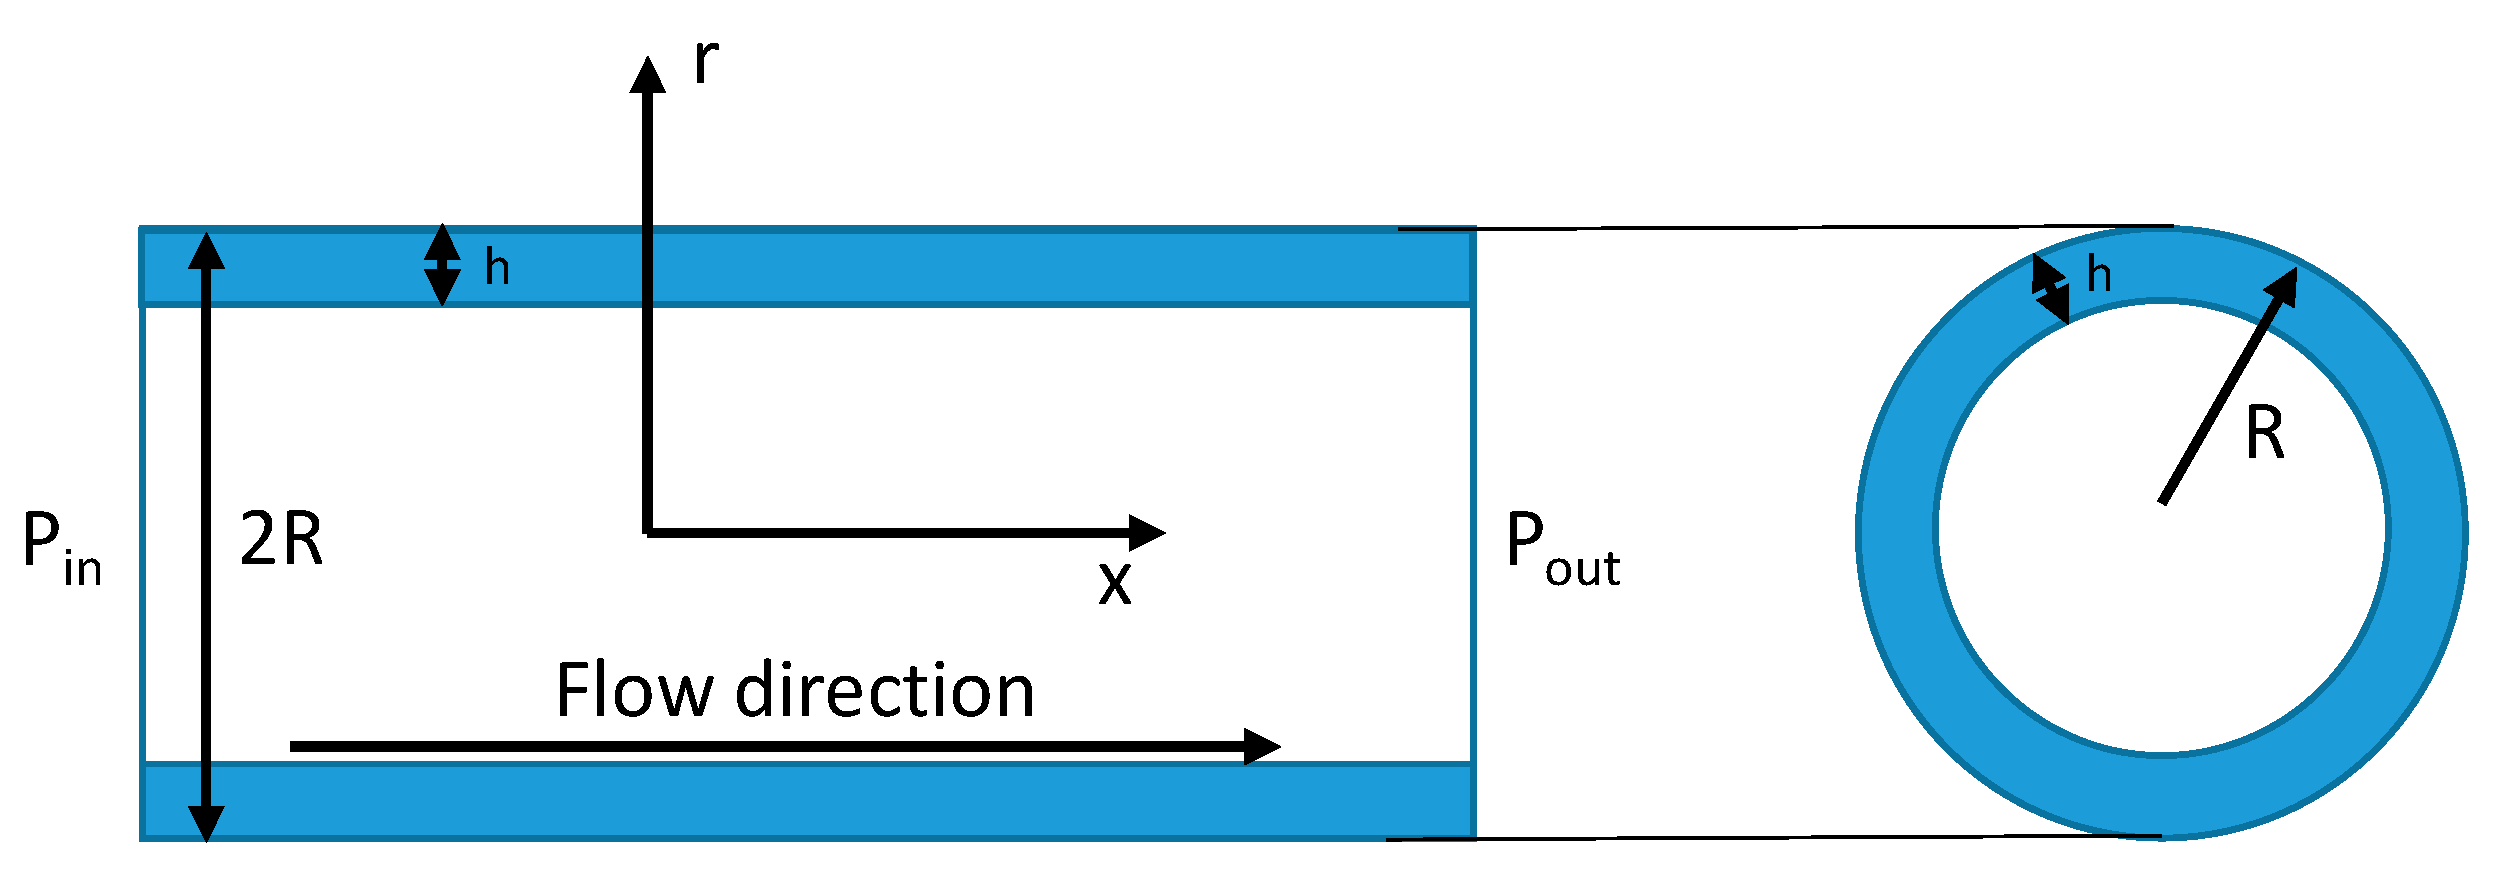
2.1. Construction of Modified Hagen-Poiseuille’s Formula

So as to obtain the modified model in consideration of boundary layer effect which is caused by fluid-solid interaction, we assume that fluid flow belongs to steady flow in lateral micro tubes. Since the radius is small and the micro-tube is laterally placed (see Figure 1), gravity can be ignored. X-axis is set along the flow direction in micro tubes, while r-axis is set vertically to the flow direction with its origin located in the center of micro tube. The radial and circumferential velocity component is zero. The velocity component parallel to the micro tube axis is ux (only depends on r) and the pressure gradient along X-axis is a constant. The fluid viscosity is μ. The radius and the length of the micro tube is R and l respectively. The boundary layer thickness is h (caused by fluid-solid interaction).
The modified Hagen-Poiseuille’s formation is derived in terms of Newton’s law of viscosity. The detailed derivation process is shown as follows.
Based on the element of cylindrical fluid, the pressure difference in the horizontal direction is,
Δ F = Δ P π r 2  
The viscous force of the surrounding fluid acting on the surface of the cylindrical fluid is,
f = μ 2 π r l d v   d r
With the increase of micro tube radius, the velocity decreases. Therefore, the velocity gradient d v d r < 0 .
As fluid flow in micro tube belongs to steady flow, the resultant force above is zero. That is,
Δ F + f = 0  
Equations (1) and (2) are then incorporated into (3). After simplification, the expression is,
d ν = r 2 μ   P d r
Integrate the Equation (4) from r to Rh,
v 0 d ν   = r R h r 2 μ P d r
The velocity distribution in micro tube in consideration of boundary layer effect is obtained,
v = [ ( R h   ) 2 r 2 4 μ ] P
Integrate (6) along the flow section and the flow flux expression is acquired,
Q = 0 R h   v ( r ) × 2 π r d r = π ( R h ) 4 8 μ P
The average flow velocity can be calculated as follow,
v ¯ = Q A = ( R h   ) 4 8 μ R 2 P
If boundary layer effect is ignored, the Equations (7) and (8) degenerate into classical Hagen-Poiseuille’s law.
Boundary layer thickness should be known in advance so as to predict the velocity and flow flux in micro tubes.

2.2. Establishment of Boundary Layer Thickness Expression

In this section, the expression of boundary layer thickness is developed from a new perspective based on Li ’s micro tube experiment [31].

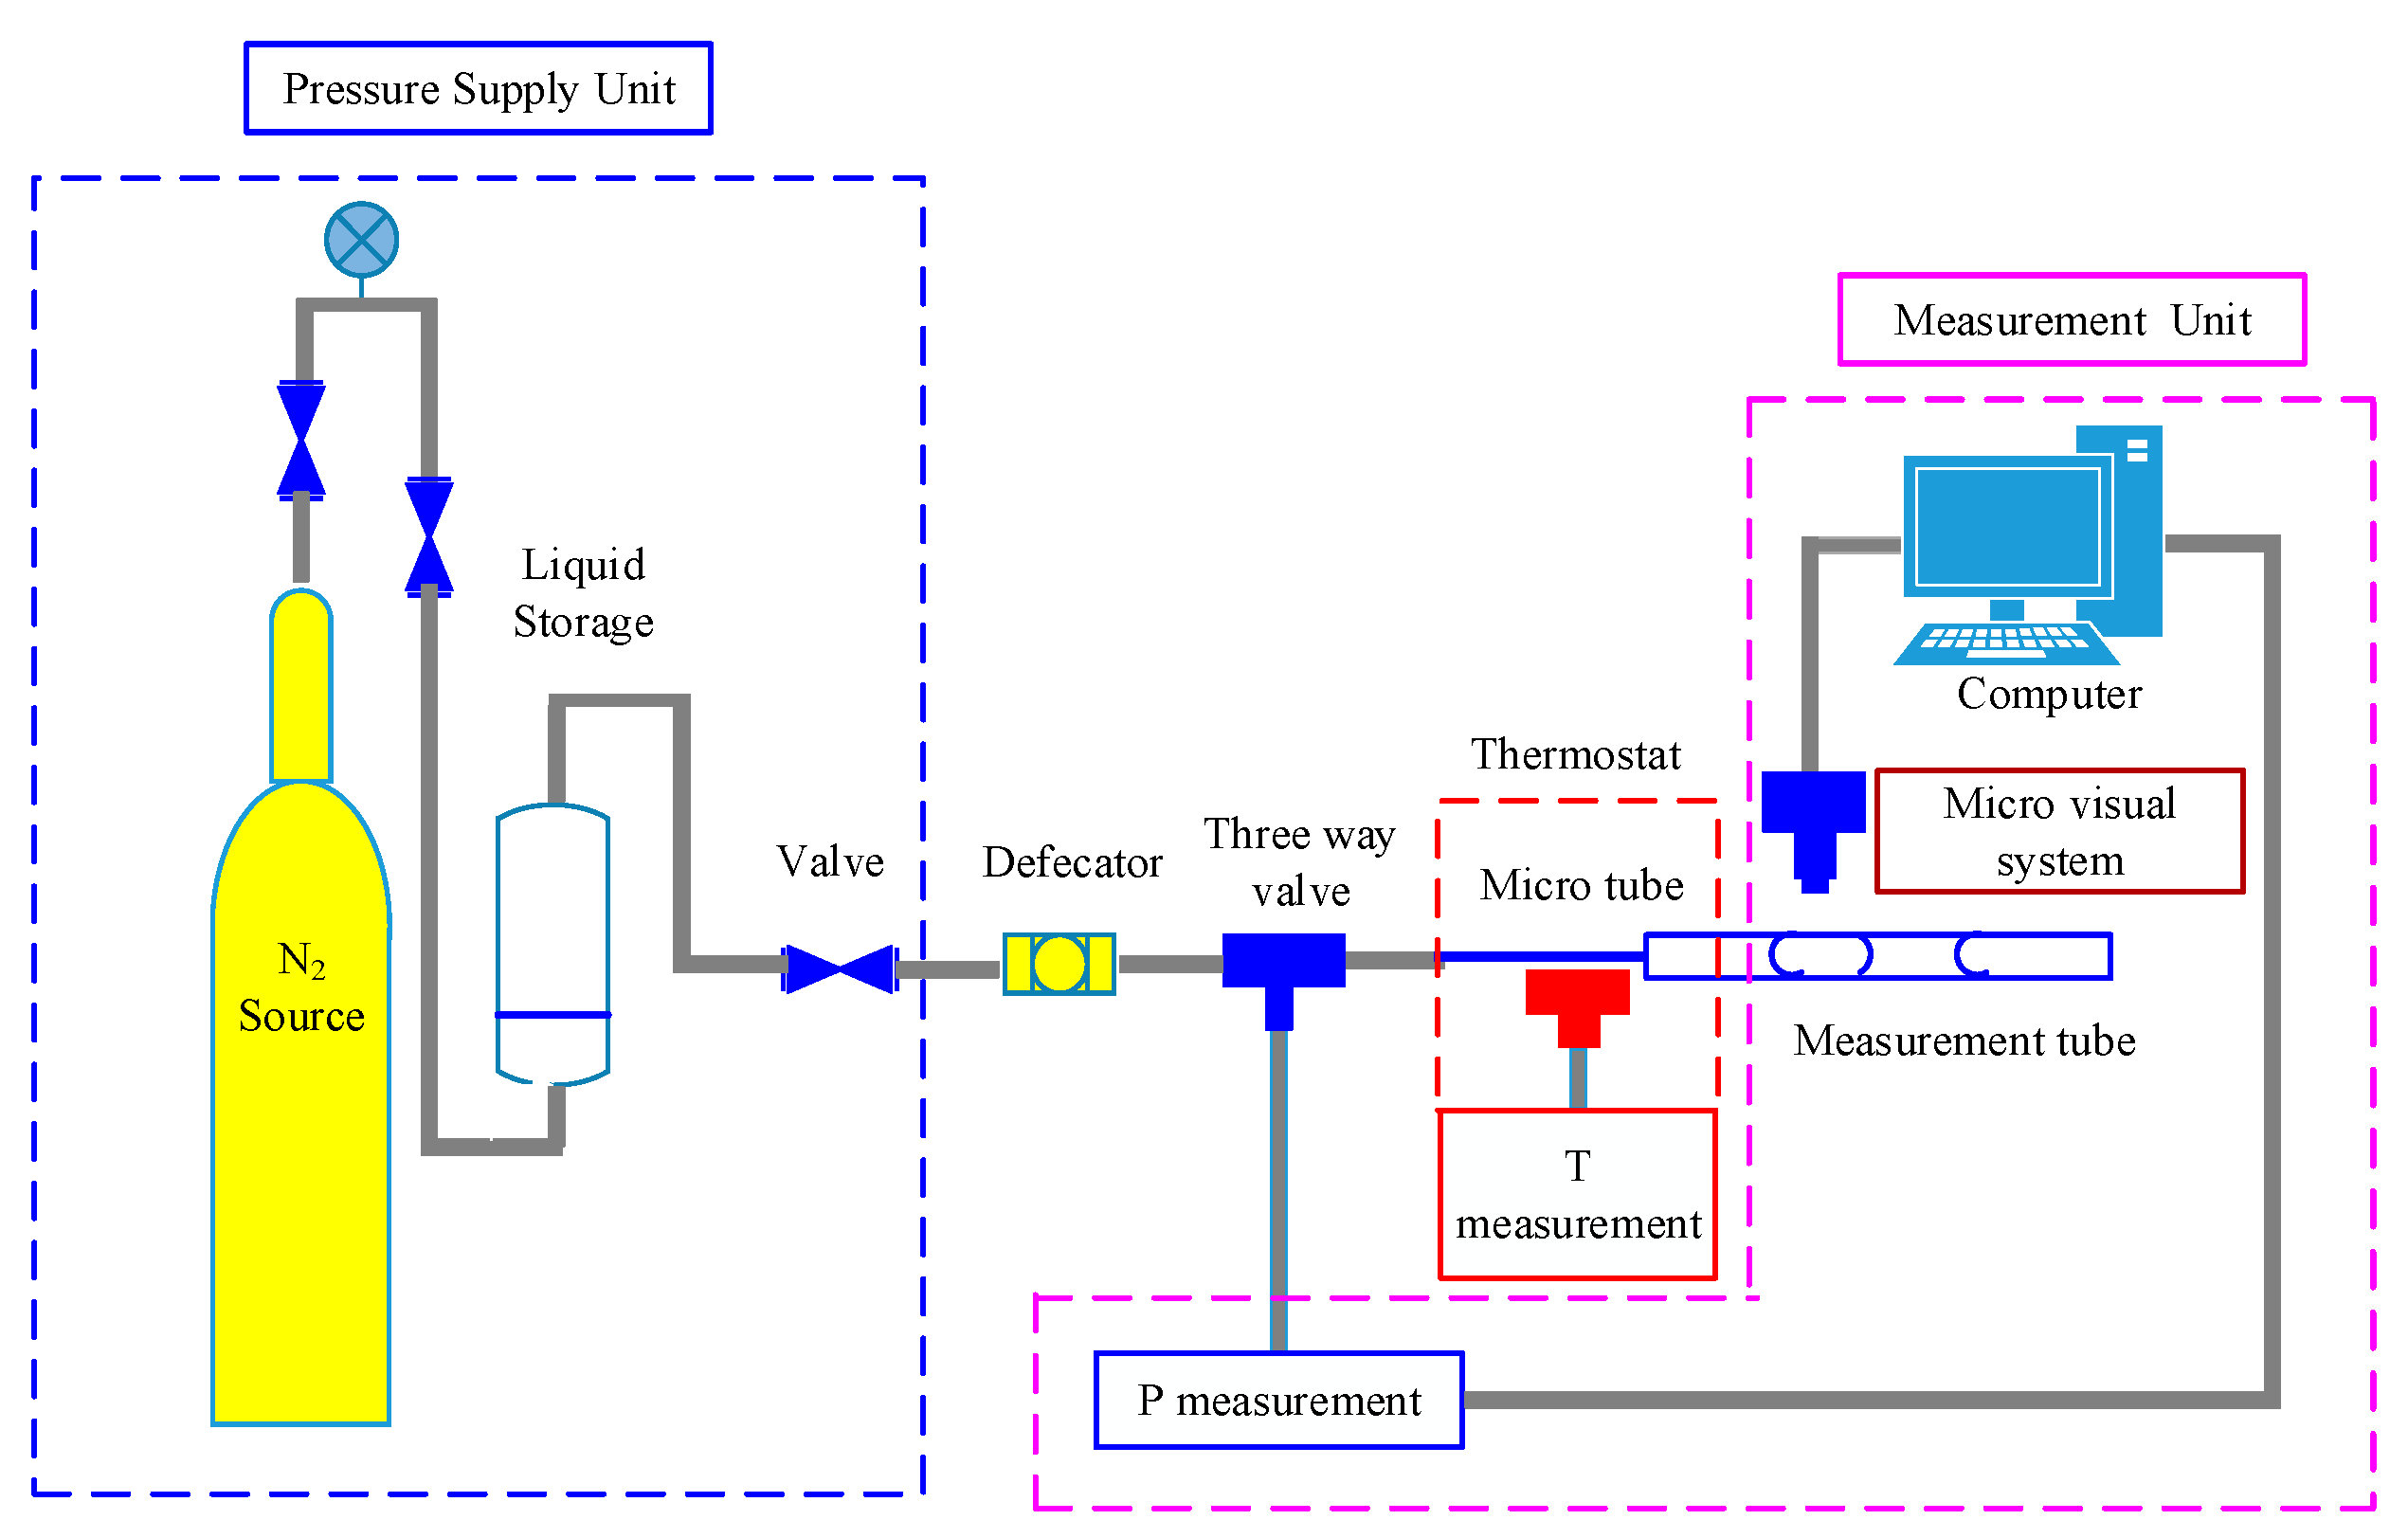
2.2.1. Micro Tube Experiment

The system of micro tube experiment and micro-flow parameters are satisfied with the assumption of micro fluid flow in Section 2.1. The micro tube system mainly consists of three parts: pressure supply unit, micro flow unit and measurement unit (See Figure 2). Every unit is specially designed to guarantee the accuracy of the experimental results.
1. Pressure Supply Unit
In core scale displacement experiment, high precision displacement pump is usually chosen as the driving source. However, the actual pressure presents periodic fluctuations within a certain range in micro tube experiment. Constant pressure nitrogen is selected as the driving source after many experiments and screening, which guarantees the constant pressure boundary conditions at both ends of the micro tube.
2. Micro Flow Unit
Micro tube is the most important part in the experimental system. A fused silica micro tube made in the world’s most advanced micro capillary manufacturing company—Polymicro Technologies, Inc. (Phoenix, AZ, USA)—is used. The micro tube is coated with polymide on the outer wall, which guarantees its flexibility and intensity. Quanta200 environmental scanning electron microscopy (ESEM) made in the company of FEI (Eindhoven, The Netherlands) is used to measure the radius of micro tube with its measurement accuracy 0.05 μm. And the measured radius is used for further calculation rather than nominal size. Fluid flow in micro tubes cannot be considered as Hagen-Poiseuille flow when roughness is large enough. After measurement through atomic force microscope, the relative roughness is much lower than 5%, which can be considered as hydraulic smooth pipe.
In micro tube experiment, deionized water is used as the flow medium. As the flow scale is extremely small, a small amount of impurity may lead to pipeline jam. Therefore, the deionized water must experience the process of sterilization, filtration and degassing before the experiment.
3. Measurement Unit
In order to reduce the error of measurement, capillary glass tube made in Sutter instrument Company is used as the measuring tube. The tube is treated with quenching and polishing. And its radius is uniform and the character is stable. As the flow rate in micro tube is rather small, photoelectric sensor is used to measure the process of displacement.
The process of the experiment is as follow.
N2 is expelled out from high pressure nitrogen cylinder. Through the pressure relief valve, the pressure reduces to required value. Then, N2 flows into liquid storage device to displace deionized water to micro tube and measurement tube. Photoelectric sensor is used to record the time that is elapsed after a period of distance in measurement tube.
Fluid flow in micro tubes with the nominal radius of 10 μm, 7.5 μm, 5 μm and 2.5 μm (the measured radius is actually 10.03 μm, 6.79 μm, 5.62 μm and 2.62 μm) is respectively carried out. The experimental velocity can be calculated by Equation (9),
v exp   = l Δ t
where l is the distance of deionized water in measurement tube; ∆t represents the time that deionized water travels through l.
The Hagen-Poiseuille’s velocity can be calculated by Equation (10),
v H P   = Q H P A = R 2 8 μ P
The deviation is defined as follow,
S v = v H P   v exp v H P
Through data processing, the relationship of flow velocity versus displacement pressure gradient is obtained (See Figure 3).
As can be seen from Figure 3, the deviation between experimental velocity and traditional Hagen-Poiseuille’s velocity becomes larger with the decrease of micro-tube radius, which indicates that boundary layer effect (caused by fluid-solid interaction) on micro fluid flow cannot be ignored.

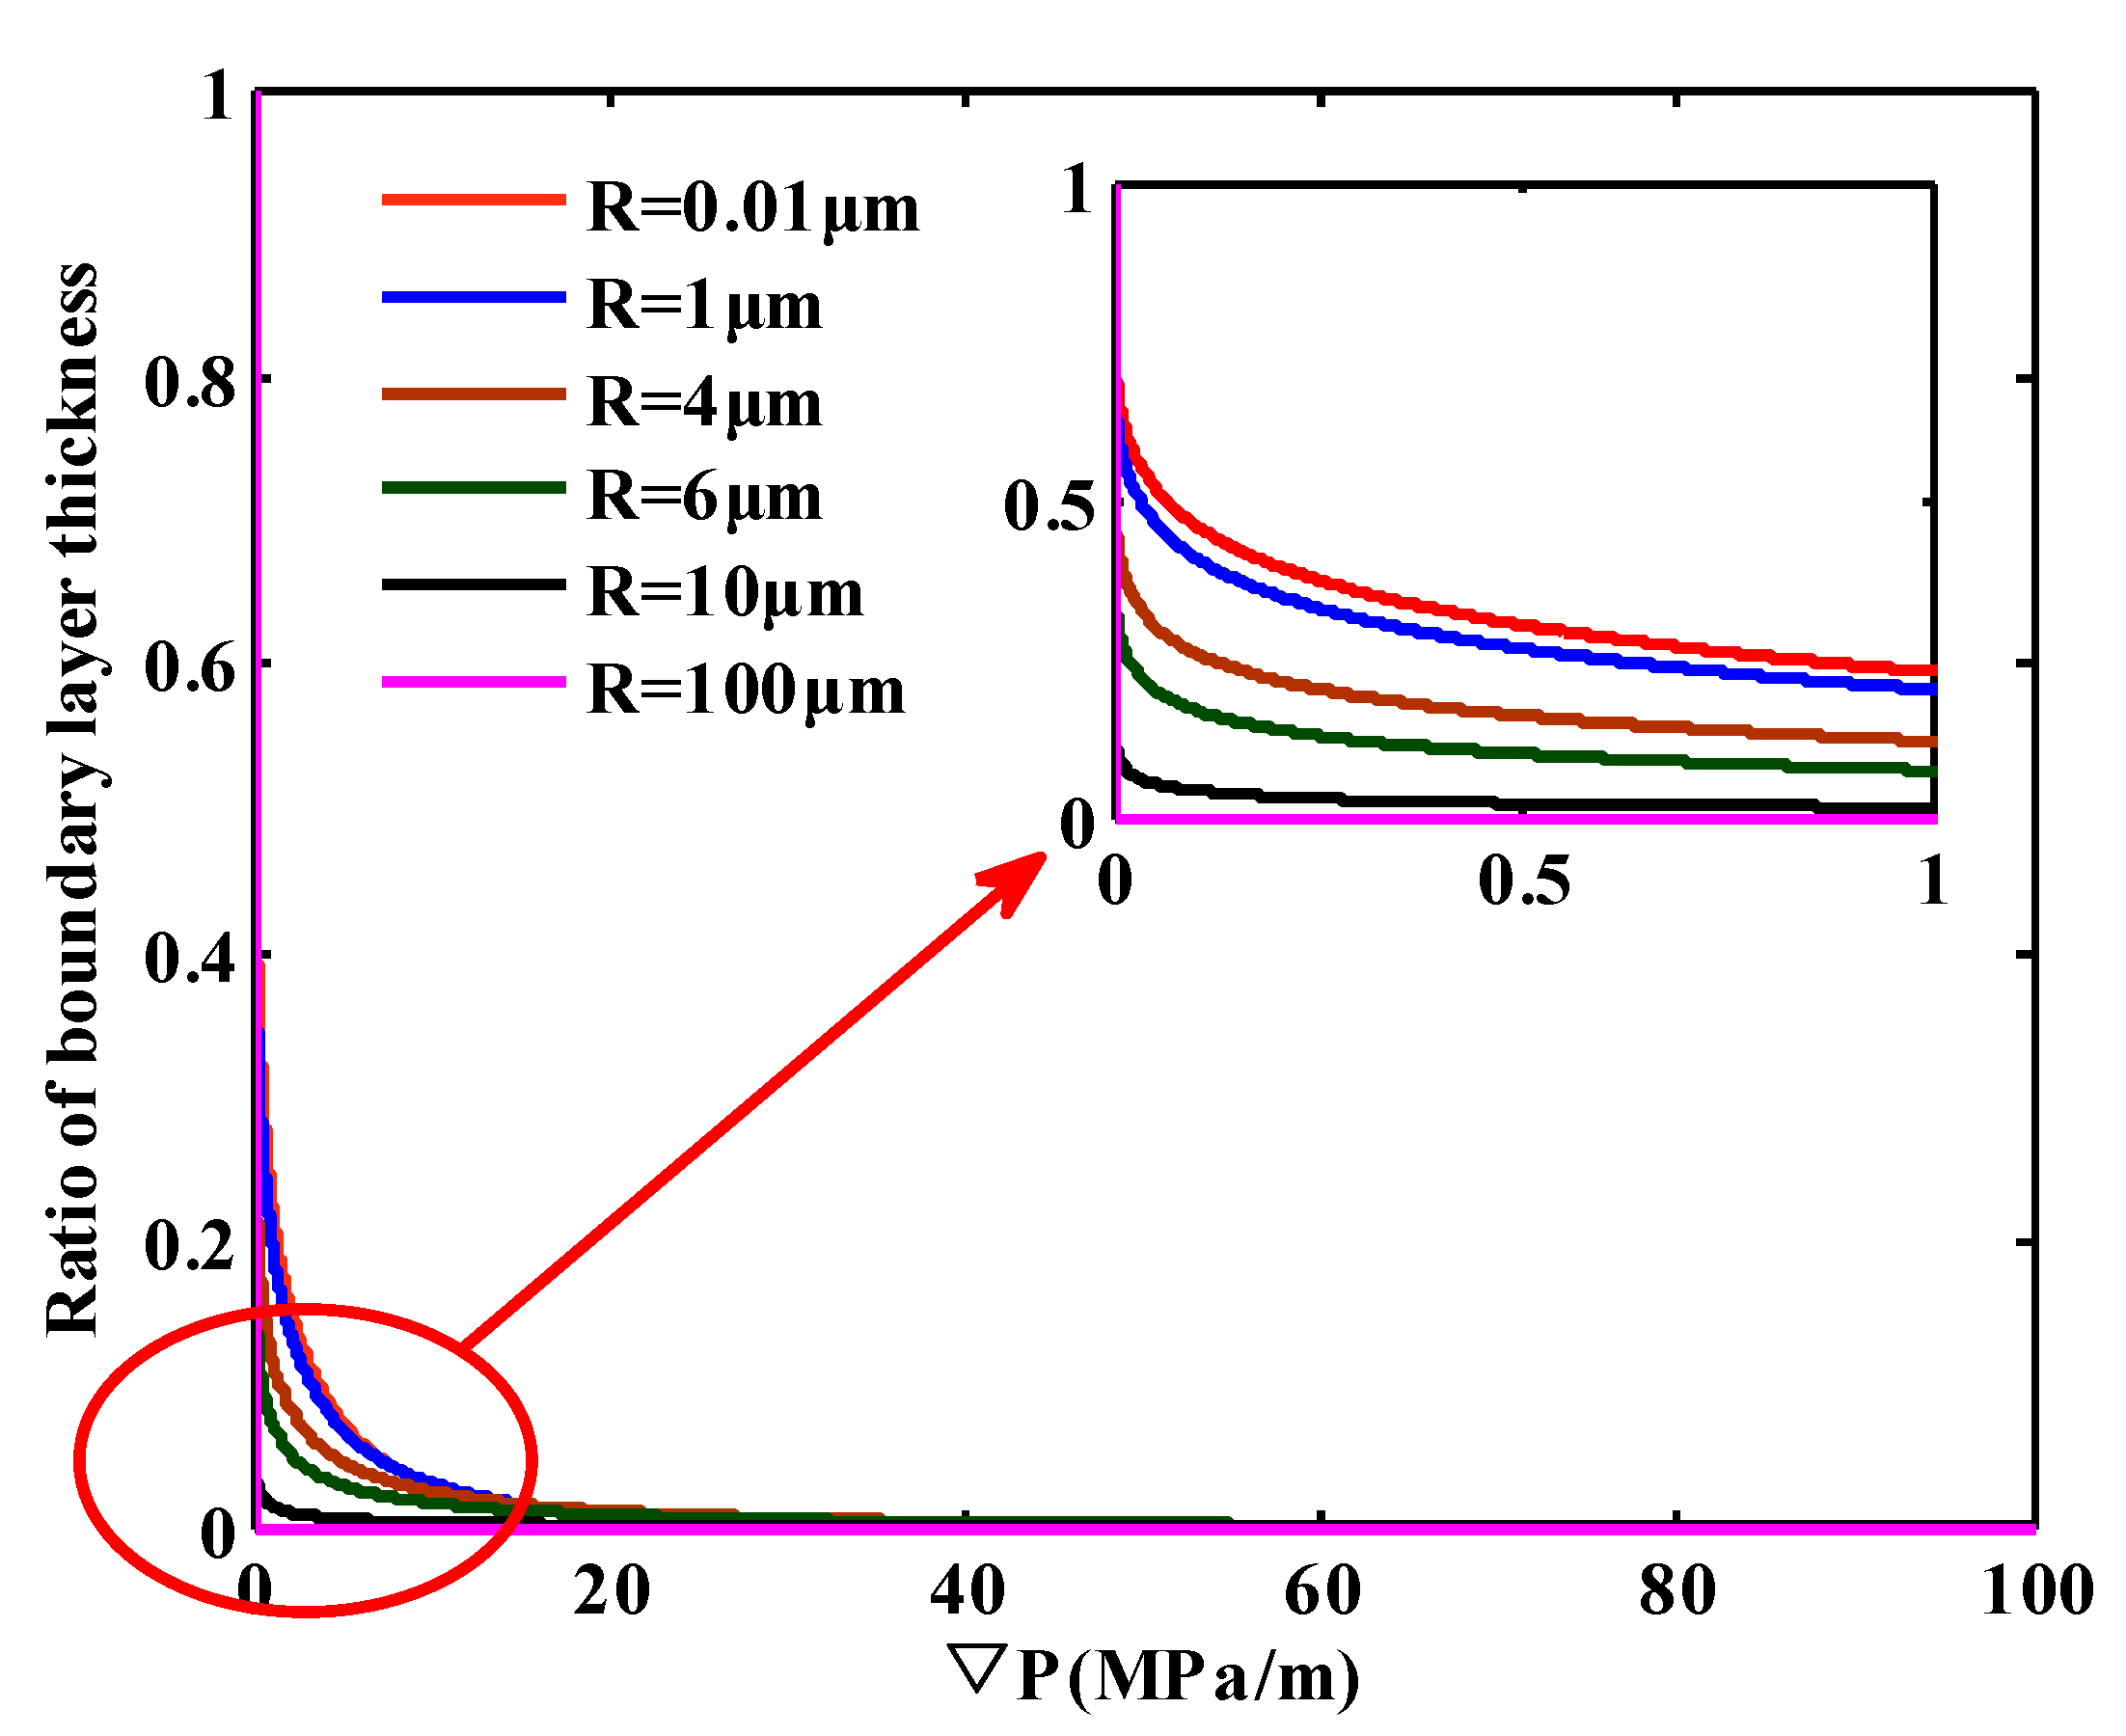
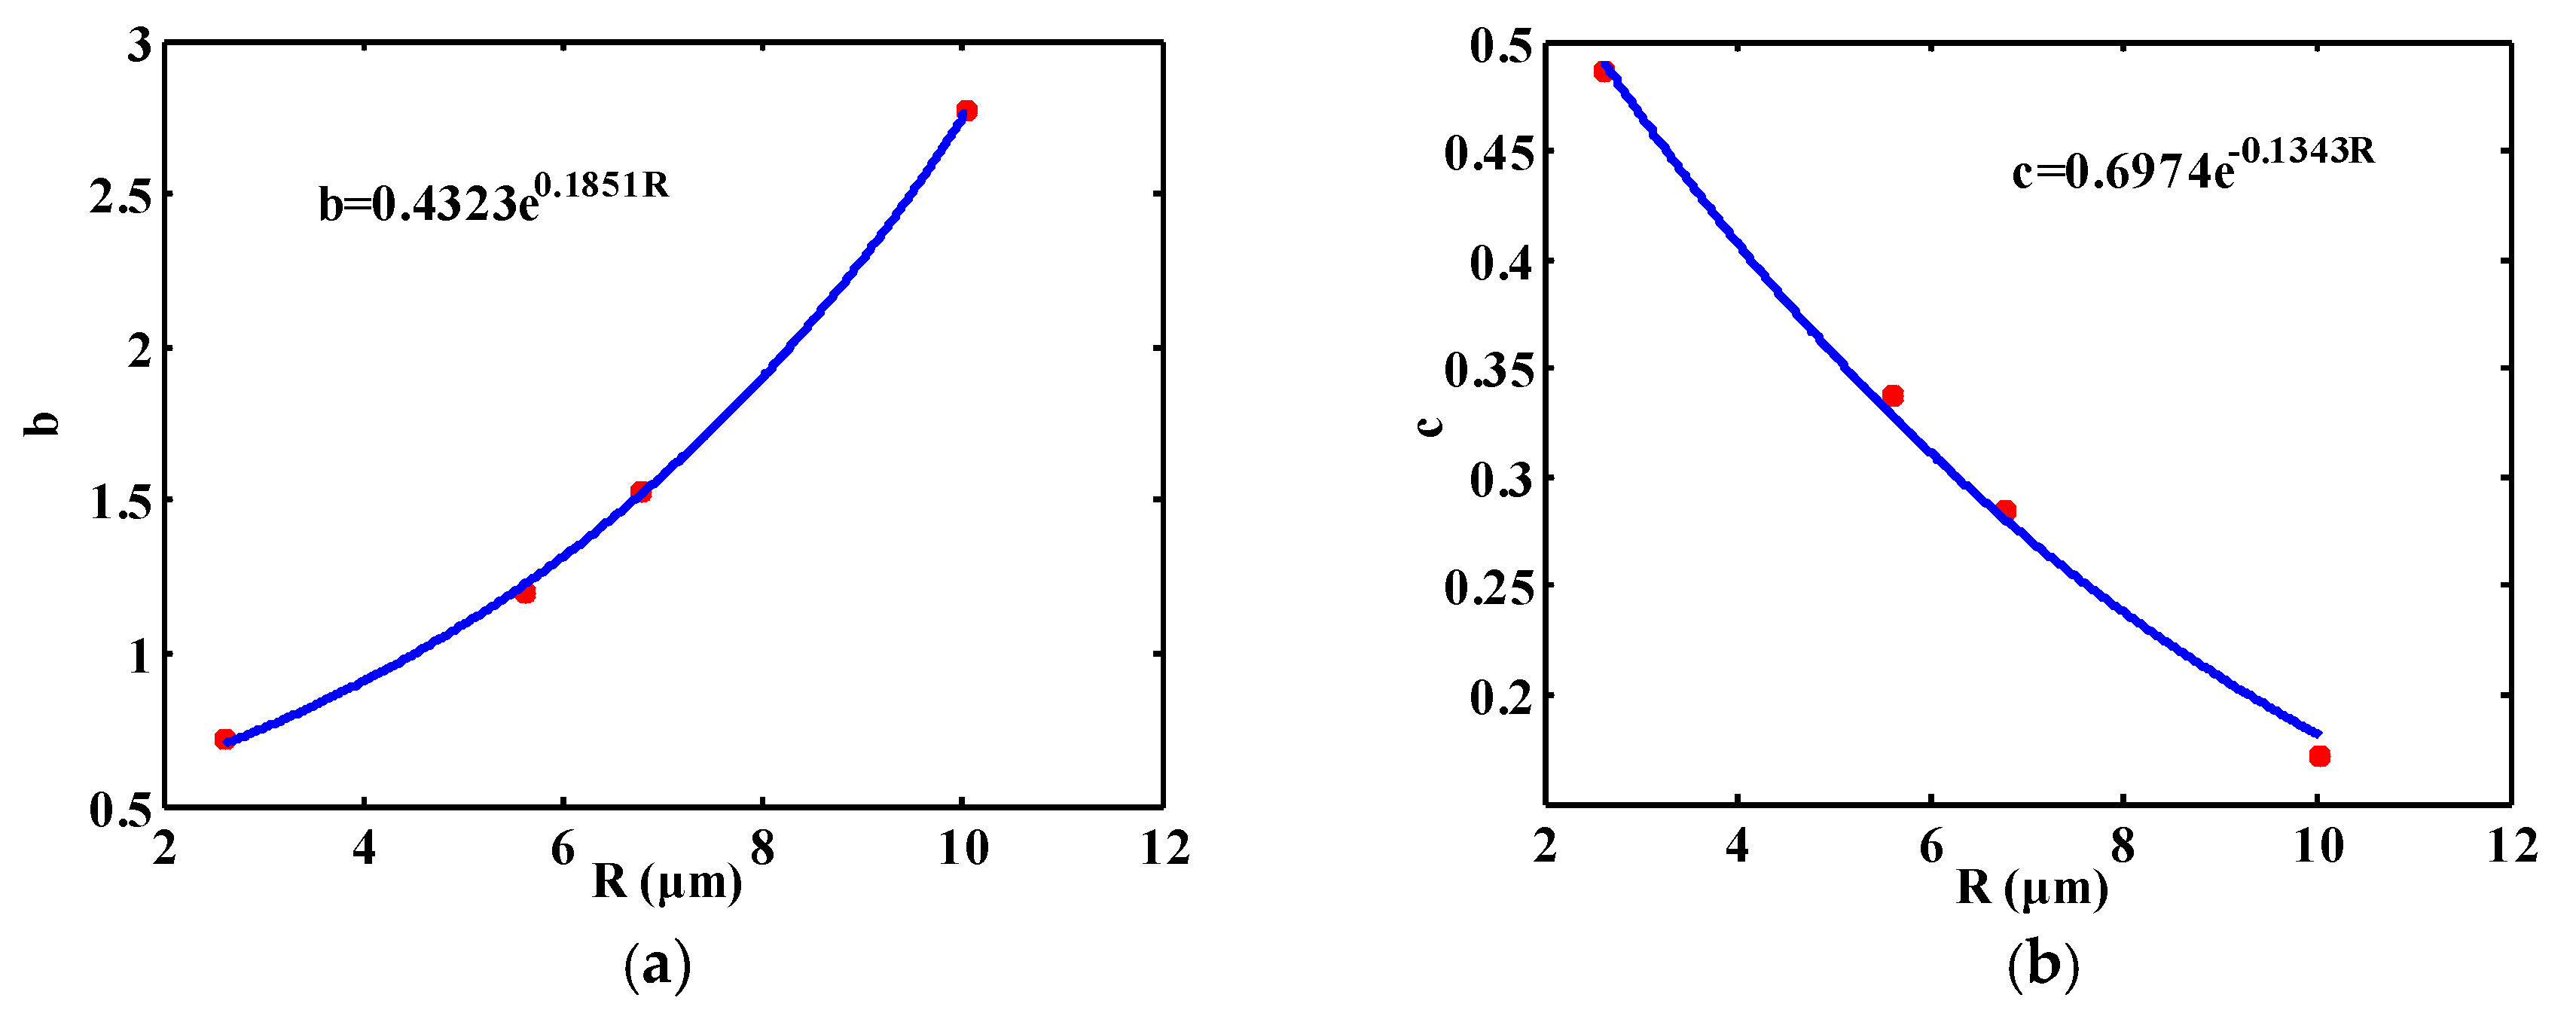
2.2.2. Representation of Boundary Layer Thickness

In this part, we will develop a representative boundary layer thickness model from the perspective of deviation between the experimental and traditional Hagen-Poiseuille’s velocity.
As can be known, boundary layer forms near the wall surface due to fluid-solid interaction. When the displacement pressure gradient is zero, it can be reckoned that the boundary layer thickness is equivalent to the radius of the micro tube since there is no fluid flow in micro tubes. With the increase of the displacement pressure gradient, the shear force of the wall fluid becomes larger and the proportion of movable fluid grows, indicating a thinner boundary layer [22] (See Figure 4).
From Equations (8), (10) and (11), the expression of boundary layer thickness can be obtained.
h = R R 1 S v   4
From Equation (12), we can know that boundary layer thickness can be obtained through determining the expression of deviation between the Hagen-Poiseuille’s velocity and experimental velocity.
According to the above analysis of boundary layer thickness and Equation (12), the deviation (Sv) reaches the maximal value 1 when the displacement pressure gradient is zero. And the deviation declines in the form of exponential function with the increase of ∇P (See Figure 3). So as to reflect the physical meaning when ∇P is zero and changing trend of deviation. The deviation model can be expressed as follow,
S v = e b P c  
Parameters (b and c) in Equation (13) need to be determined so as to obtain Sv. Here, single variable method is used to obtain the parameters. Through fitting the experimental result of Sv by Equation (13) (See Figure 5), the parameters versus radius of micro tubes are obtained (See Table 1).
In order to make the model appropriate to wilder range, the exponential form is used to represent the relationship between the parameters and radius. The fitting result is shown in Figure 6.
The exponential expression is shown as follow,
{ b = 0.4323 e 0.1851 R   c = 0.6974 e 0.1343 R
Through substituting Equations (13) and (14) into (12), the boundary layer expression is eventually obtained,
h = R R 1 e 0.4323 e 0.1851 R   P 0.6974 e 0.1343 R 4
Finally, the modified Hagen-Poiseuille’s Formula can be expressed as,
Q = π ( R h   ) 4 8 μ P h = R R 1 e 0.4323 e 0.1851 R P 0.6974 e 0.1343 R 4

3. Validation and Application Range Analysis of the Model

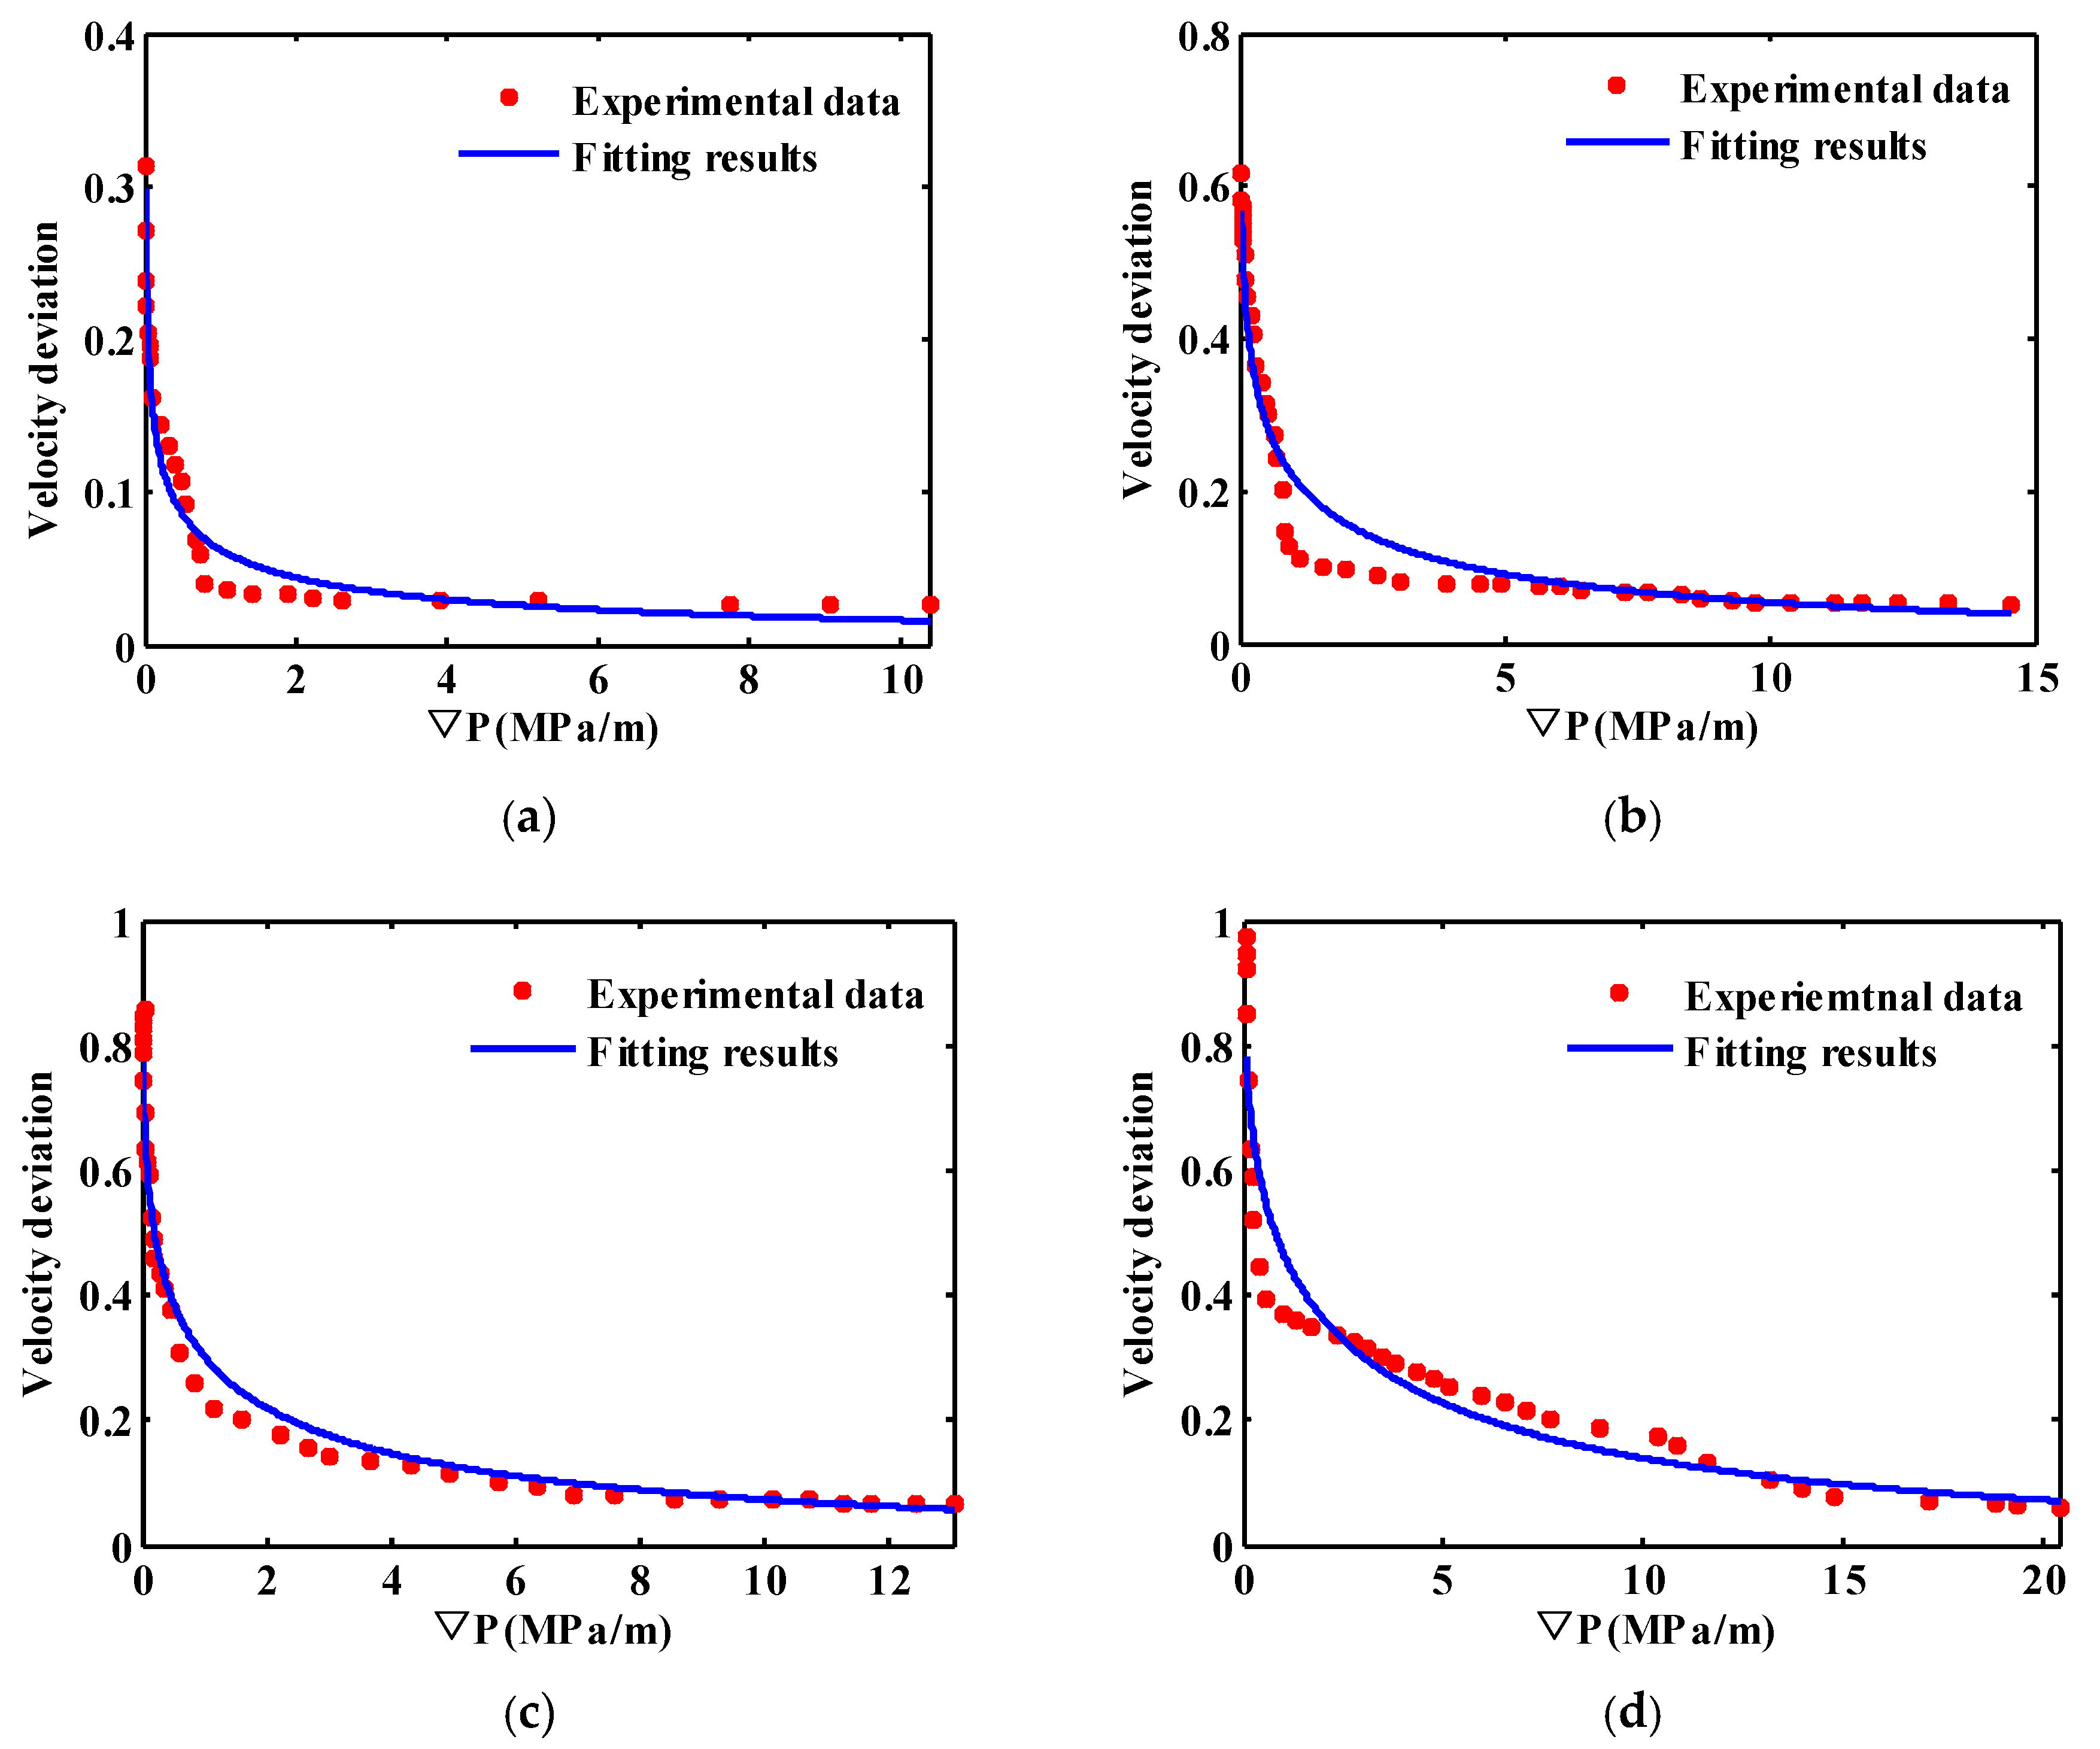
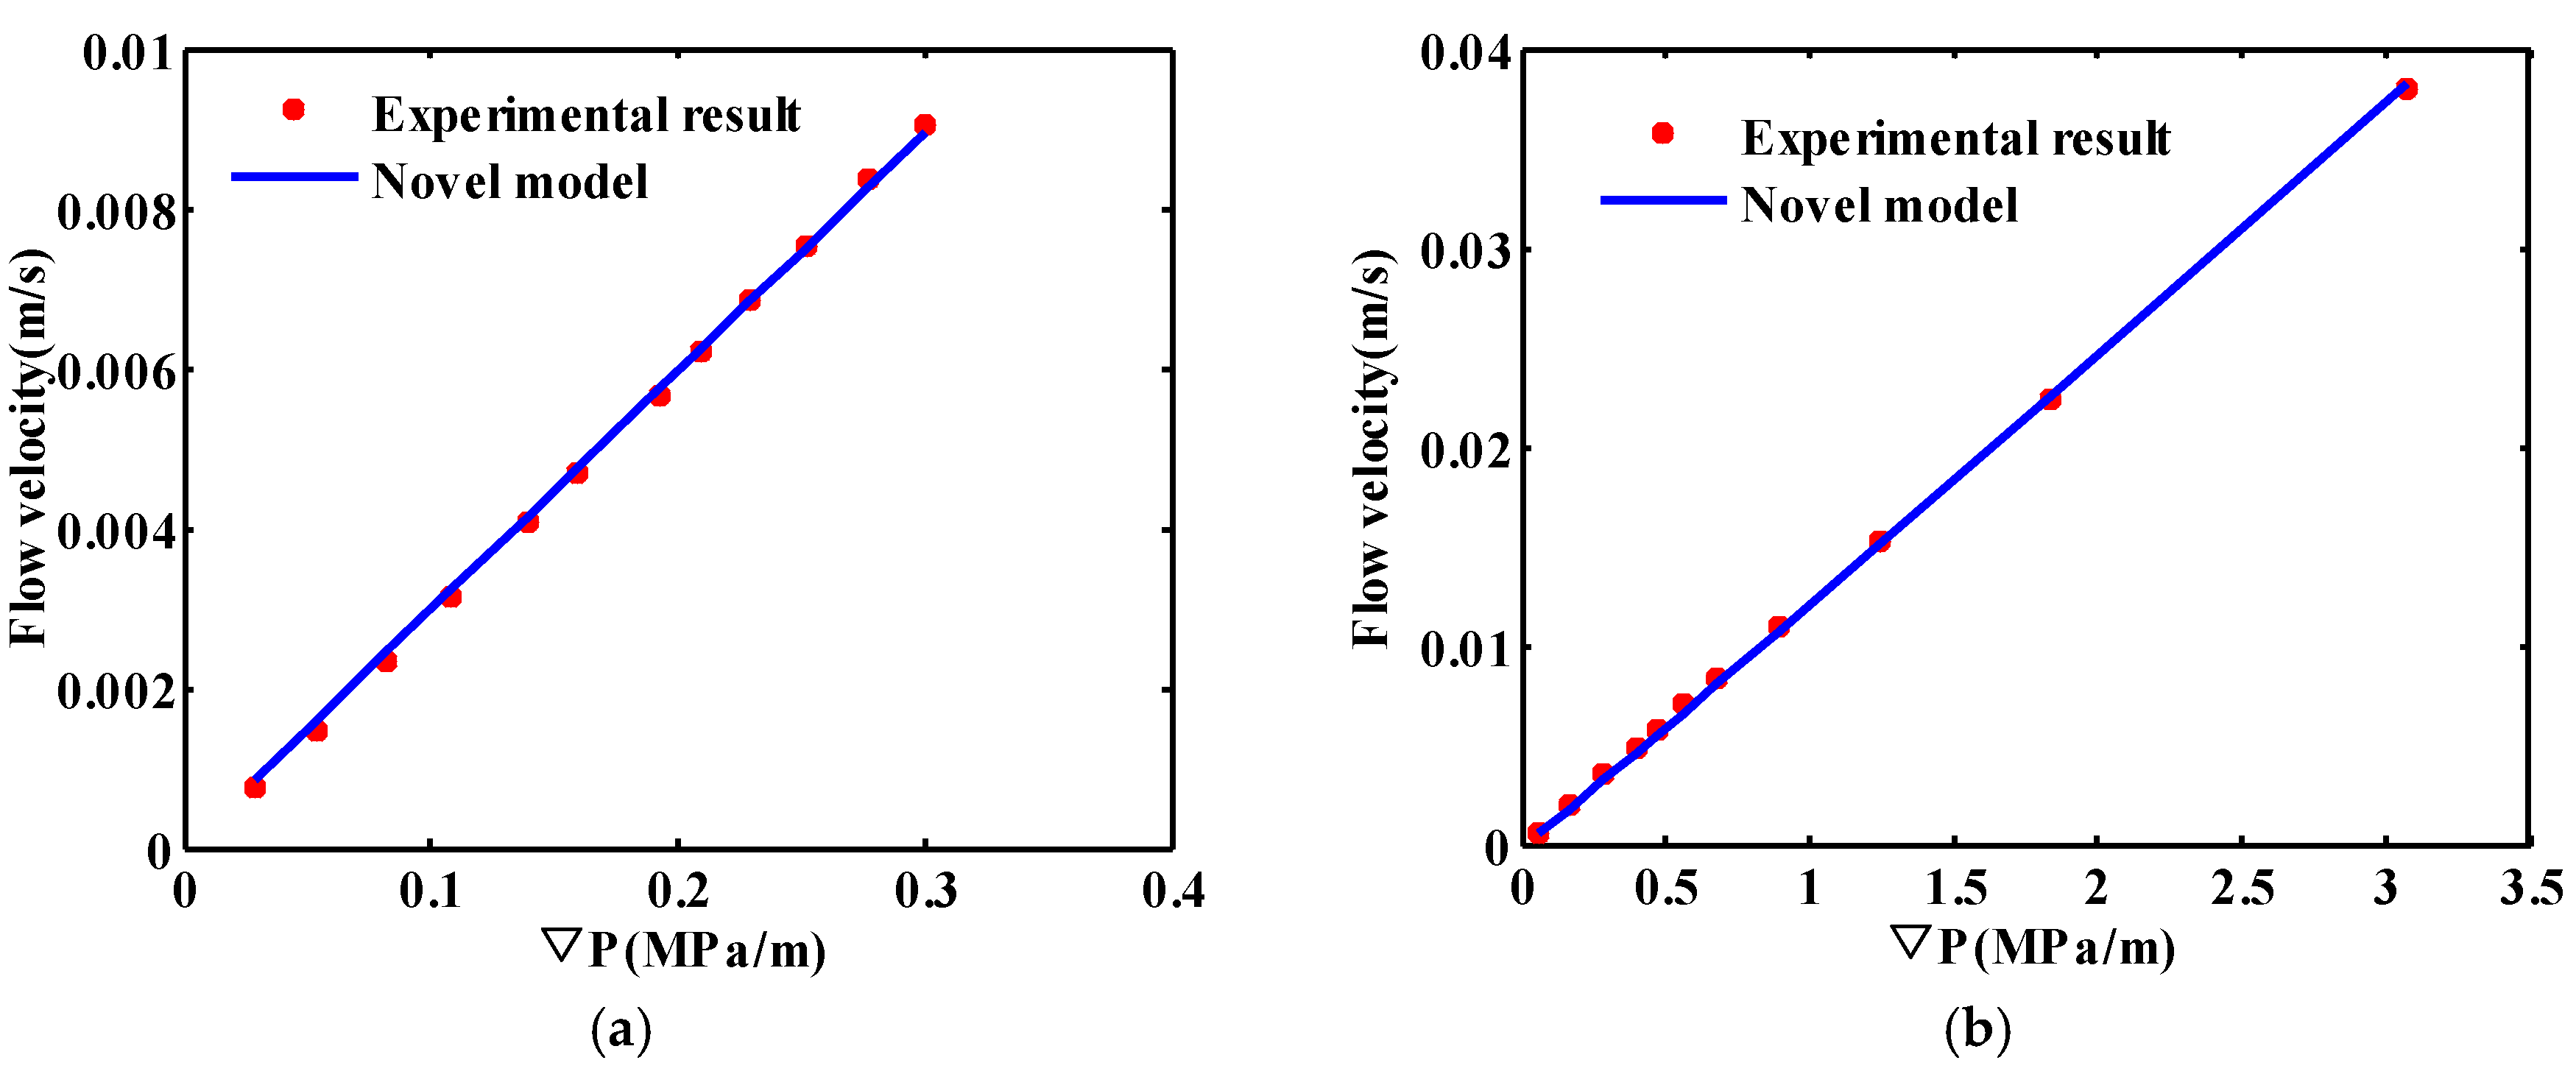
3.1. Validation of the Model

As there exists some deviation in fitting the relationship of Sv versus ∇P and the parameters (b and c) versus radius, we will firstly use the modified model to predict Li’s micro-tube experimental results in turn. The predictive results in contrast with Li’s experiments are shown in Figure 7. We can see that the predictive results are consistent with the experimental ones, indicating the accuracy of the modified model.
Furthermore, micro-tube experimental experiments at low ∇P conducted by Wu [22,40] are used to validate the accuracy and reliability of the novel model (See Figure 8). The predictive values by the novel model are still in agreement with the experimental results.
Through validation by the experimental results of Li [31] and Wu [22,40], it can be seen that the novel model can accurately characterize fluid flow in micro tubes. In addition, it has a definite physical meaning, which provides a good foundation for studying fluid-solid interaction effects on fluid flow in porous media.

3.2. Application Range Analysis of the Model

As there exist different sizes of pores and throats in tight formation, the model’s application range and change rule must be discussed in advance when applied to microscopic flow in porous media. Otherwise, there may appear some singular values in some pores and throats, which may lead to inaccurate flow law in porous media. In this part, the application range and change rule of this novel model will be analyzed mathematically.
From the novel model (16) and Equation (12), we can obtain its range and change rule through analyzing the range of the deviation between experimental and traditional Hagen-Poiseuille’s velocity. By taking the partial derivative of Equation (13) with respect to ∇P, the following equation can be obtained,
S v   P = b c P c 1 e b P c 1
As b > 0, c > 0 and ∇P ≥ 0, then S v P 0 . That is to say Sv declines with the increase of ∇P. When ∇P equals to zero, both Sv and the ratio of the boundary layer thickness arrive at the maximal value 1, which obeys to the physical meaning. When ∇P tends to infinite, almost all the fluids in micro tubes start to flow, Sv and the ratio of boundary layer thickness tend to zero, which is also consistent with common sense. The detailed changing rule of the ratio of boundary layer thickness versus ∇P is shown in Figure 9.
As can be seen from Figure 9, the ratio of boundary layer thickness declines sharply with the increase of ∇P at first and then goes down as ∇P increases further. The larger the radius is, the quicker the decline rate will be. In addition, the boundary layer thickness will not be out of range at any ∇P as long as the radius is given and the flow pattern belongs to laminar flow.
From the above analysis, the novel model has a broader application range than traditional empirical models. And singular values can be avoided in flow simulation in porous media with various sizes of pores and throats.

4. Fluid-Solid Interaction Effects on Microscopic Flow

In this section, the novel model will be applied to study fluid-solid interaction effects on microscopic flow from three aspects: the velocity profile, the average flow velocity and flow resistance. Furthermore, we will incorporate the novel model into porous media to study fluid-solid interaction in tight formation.

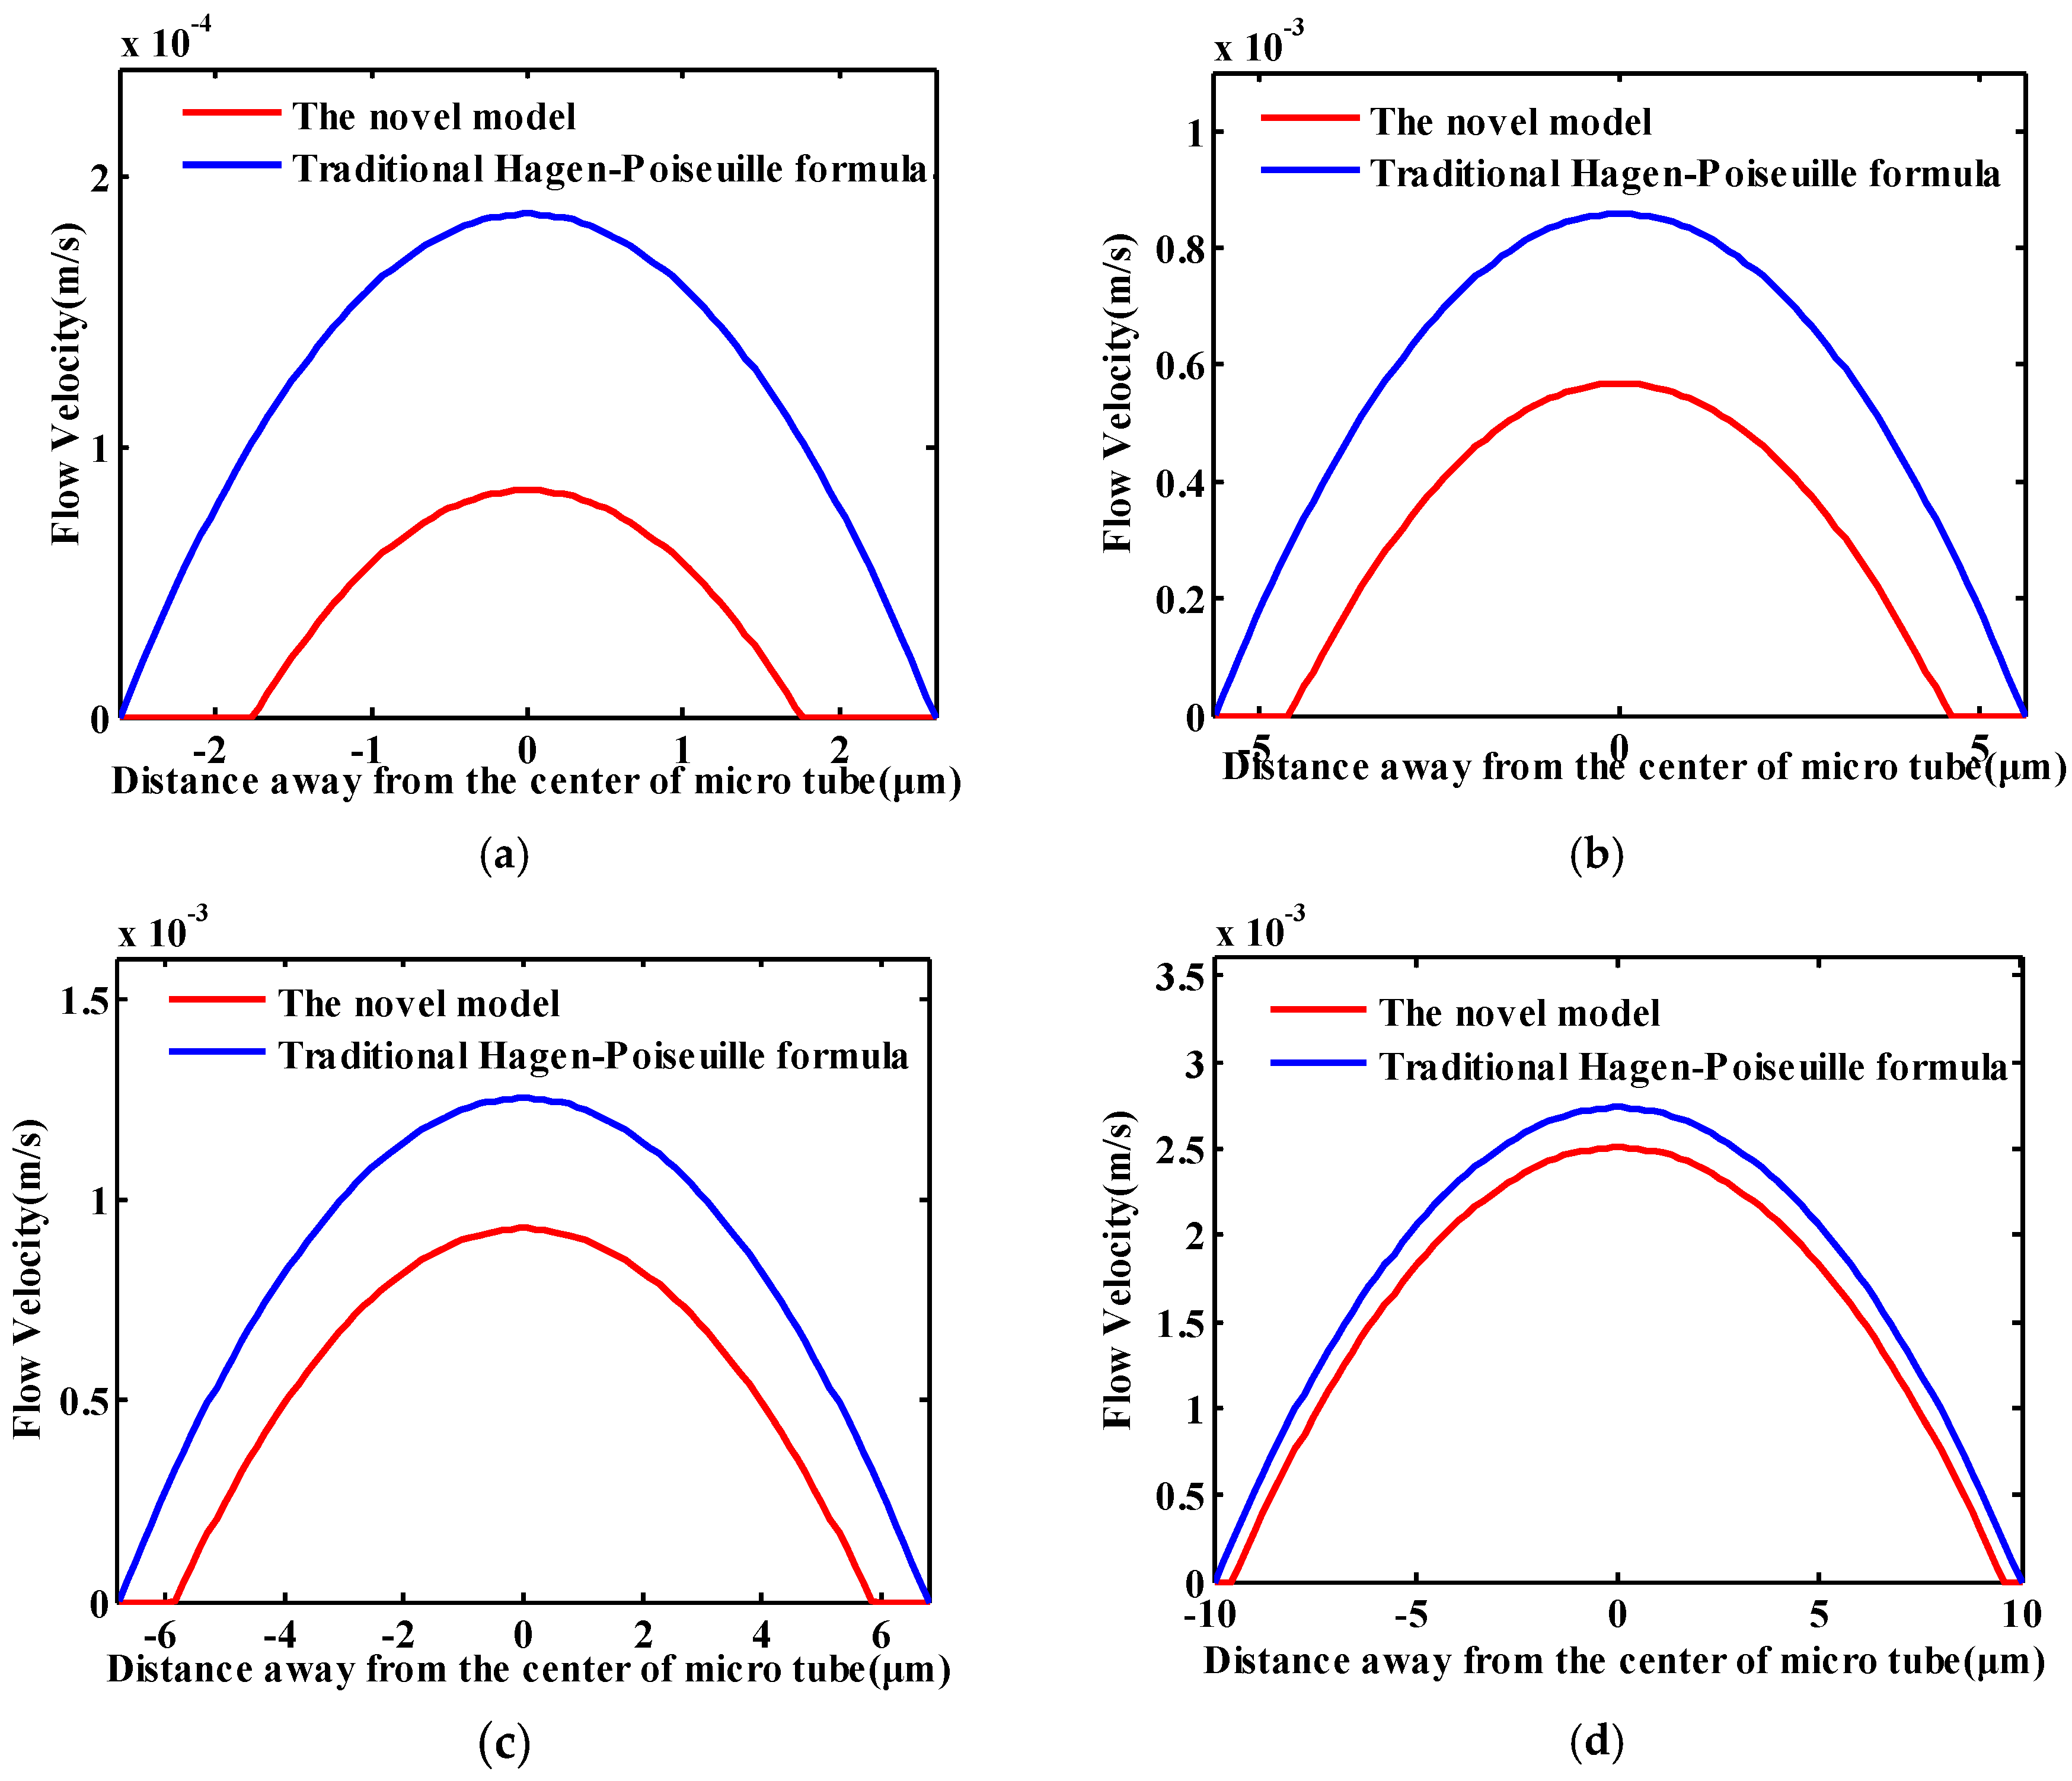
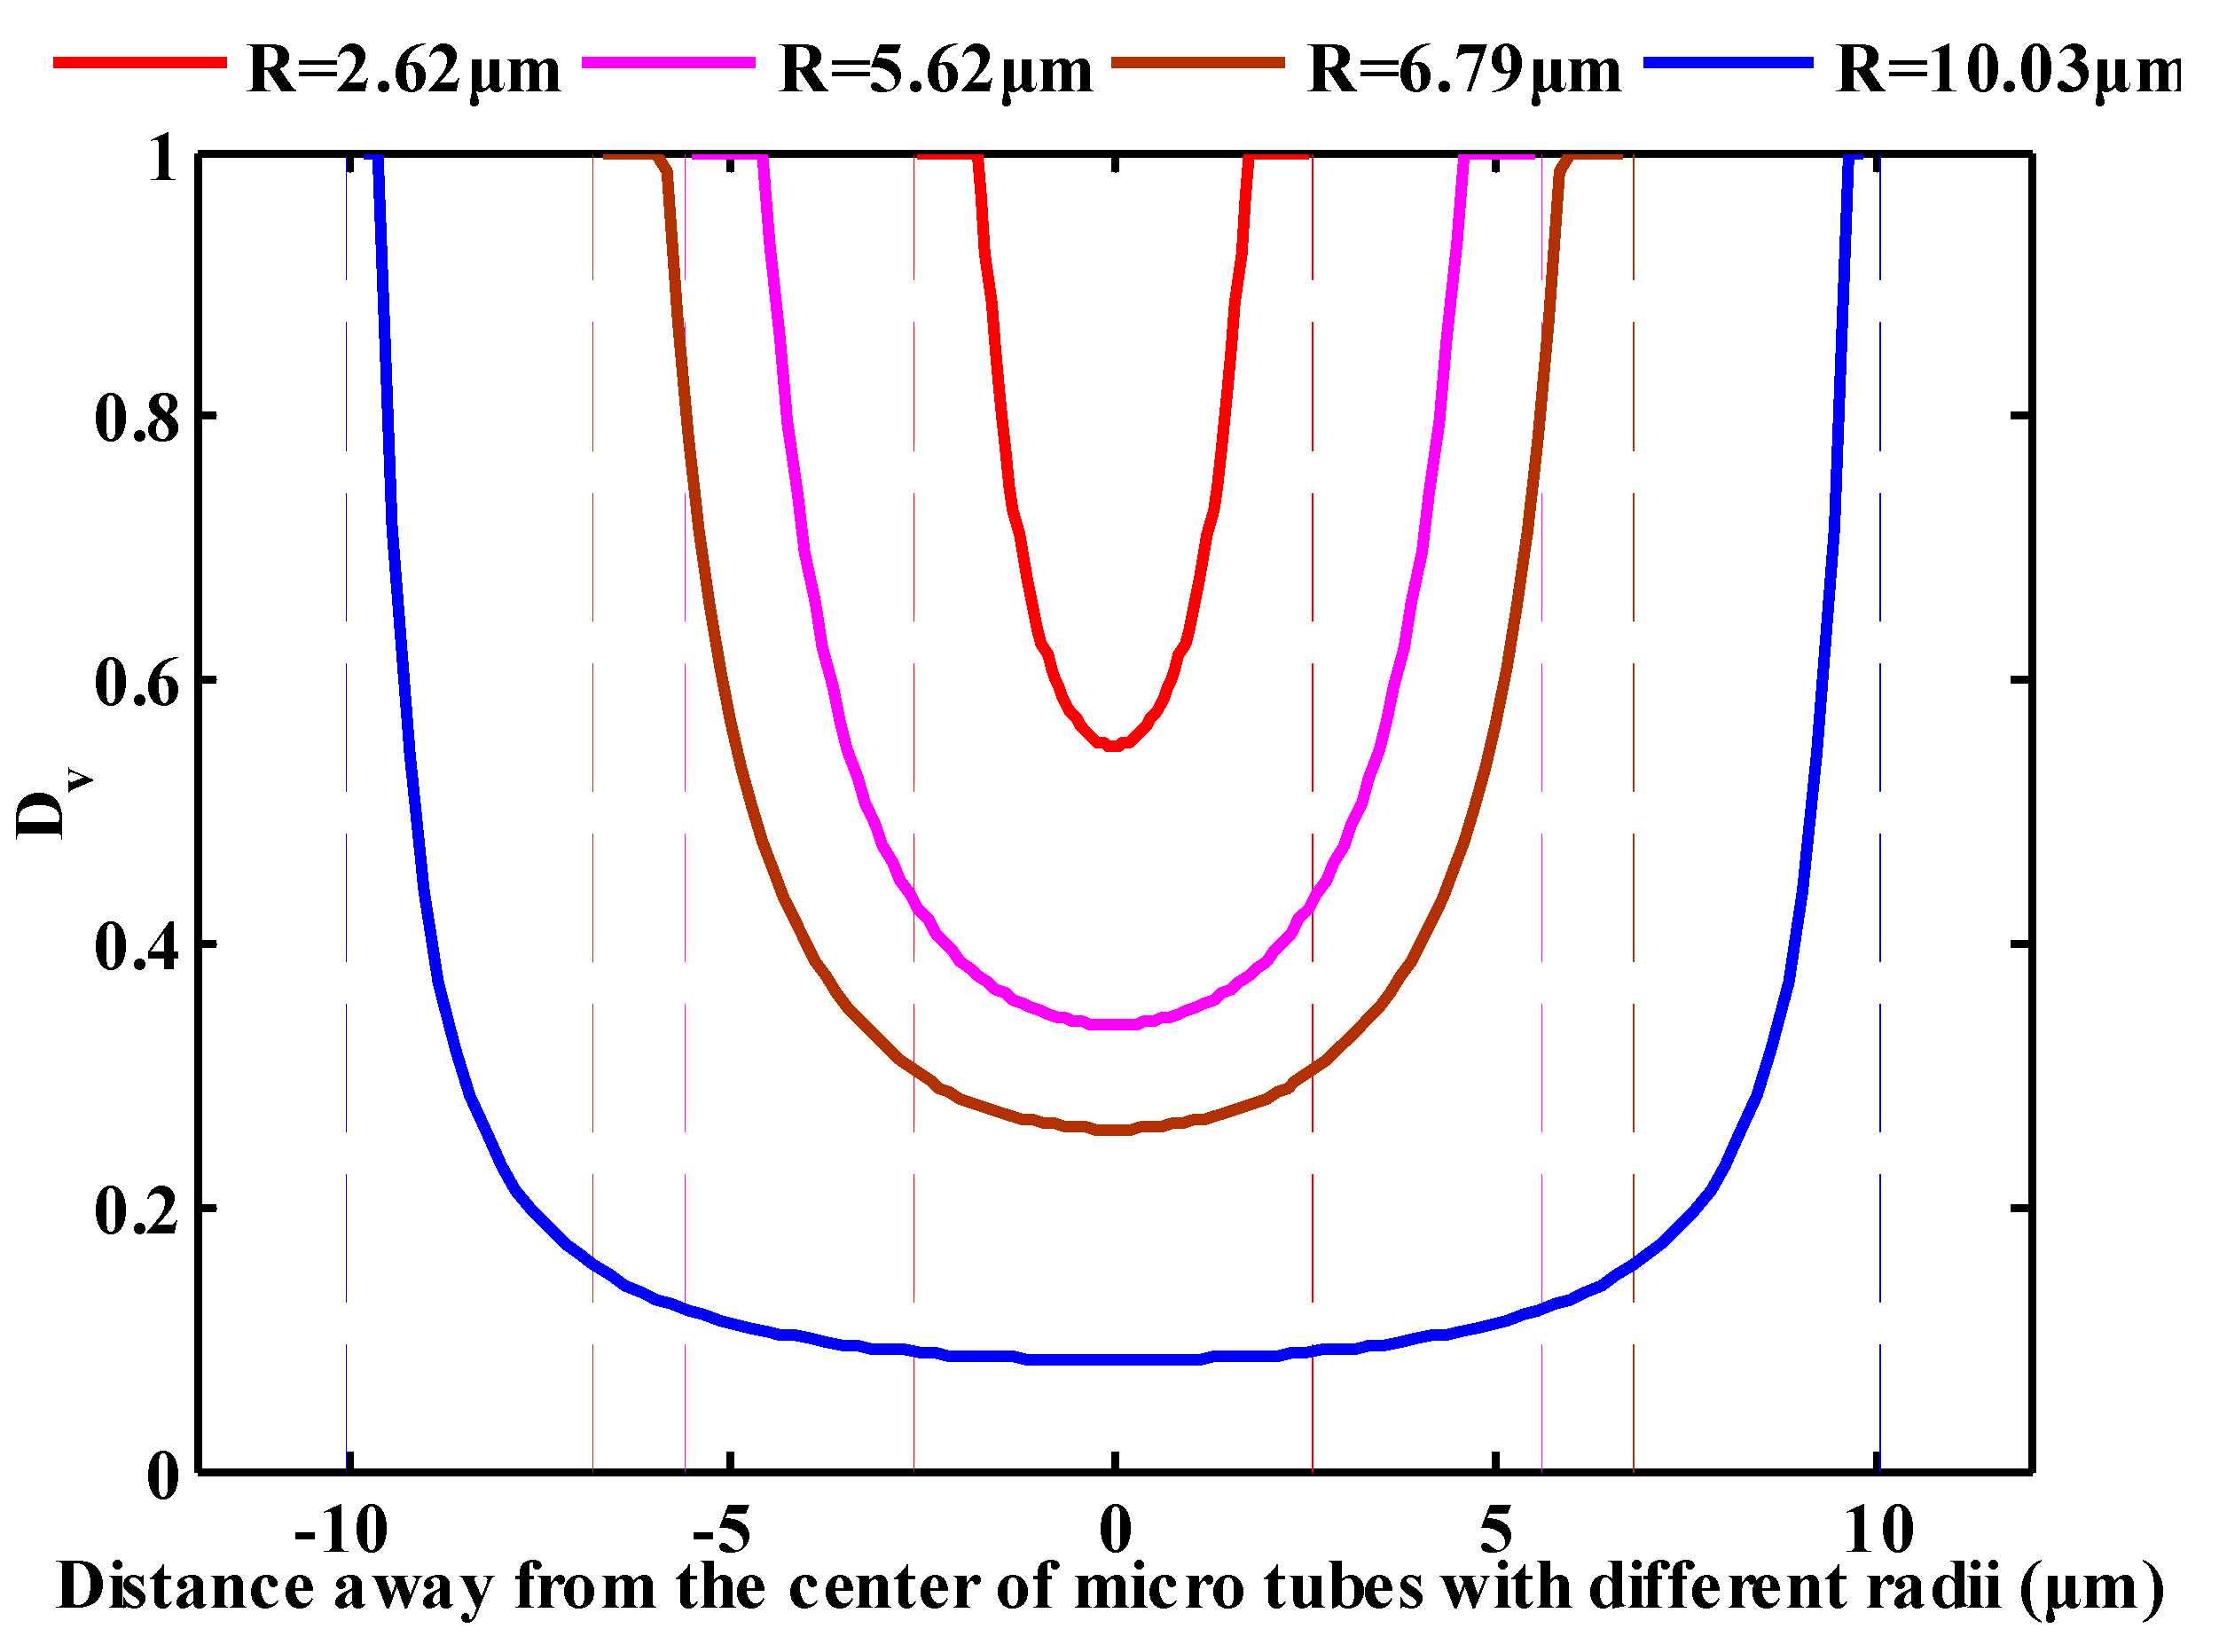
4.1. Velocity Profile

Micro-tube radii of 2.62 μm, 5.62 μm, 6.79 μm and 10.03 μm are selected to study fluid-solid interaction effects on velocity profile. The viscosity and displacement pressure gradients are respectively set to be 0.92 mPa·s and 0.1 MPa/m.
As can be inferred from Figure 10, the velocity in the micro tube is smaller than that predicted by the traditional Hagen-Poiseullie’s formula due to fluid-solid interaction while the velocity profile is still parabolic. The closer fluid is away from the wall surface, the stronger the fluid-solid interaction will be, which results in an immovable layer (boundary layer) near the surface. The velocity profile in consideration of fluid-solid interaction is consistent with the simulation result of dissipative particle dynamics (DPD) [41], which further confirms the accuracy of the model.
In order to see the influence degree of fluid-solid interaction on fluid flow at different positions in micro tubes quantitatively, a velocity deviation which is described by Equation (18) is defined,
D v = V H P   - V m o d e l V H P
where VHP represents Hagen-Poiseullie’s velocity in the micro tubes; Vmodel represents the velocity, in consideration of the fluid-solid interaction in the micro tubes.
The calculated velocity deviations in different radial micro tubes are shown in Figure 11.
As can be seen from Figure 11, the velocity deviation at different positions in every radial micro tube varies a lot. When the fluid is close to the wall surface, the fluid-solid interaction is strong enough to adsorb the boundary fluid to the wall and generates an immovable layer, which results in the maximal deviation 1. As the distance away from the wall surface increases, the decline rate of velocity deviation goes down quickly at first and then slows down, which indicates that the forces of the fluid-solid interaction belong to a short-range force. With the increase of the distance away from the wall surface, fluid-solid interaction effects on fluid flow decreases significantly. The fluid-solid interaction is the weakest in the center of the micro tube, which leads to minimal deviation. The smaller the radius of micro tube, the stronger the fluid-solid interaction, the larger the deviation will be.

4.2. The Average Flow Velocity

In this part, fluid-solid interaction on average flow velocity will be studied under the same micro tube radius and the same displacement pressure gradient respectively. The parameters used are shown in Table 2.
The calculation results are shown in Figure 12.
As shown in Figure 12a, the average flow velocity in consideration of fluid-solid interaction (Vnew model) is smaller than traditional Hagen-Poiseuille’s velocity (VHP) at the same micro tube radius. With the increase of displacement pressure gradient, fluid-solid interaction effects on fluid flow decline and the boundary layer thickness is reduced, resulting in larger effective flow space and smaller deviation between Vnew model and VHP. It can be known from Figure 12b that Vnew model is smaller than VHP and decreases with the increase of radius at the same displacement pressure gradient, which indicates that the effect of fluid-solid interaction on fluid flow declines as micro-tube radius increases.

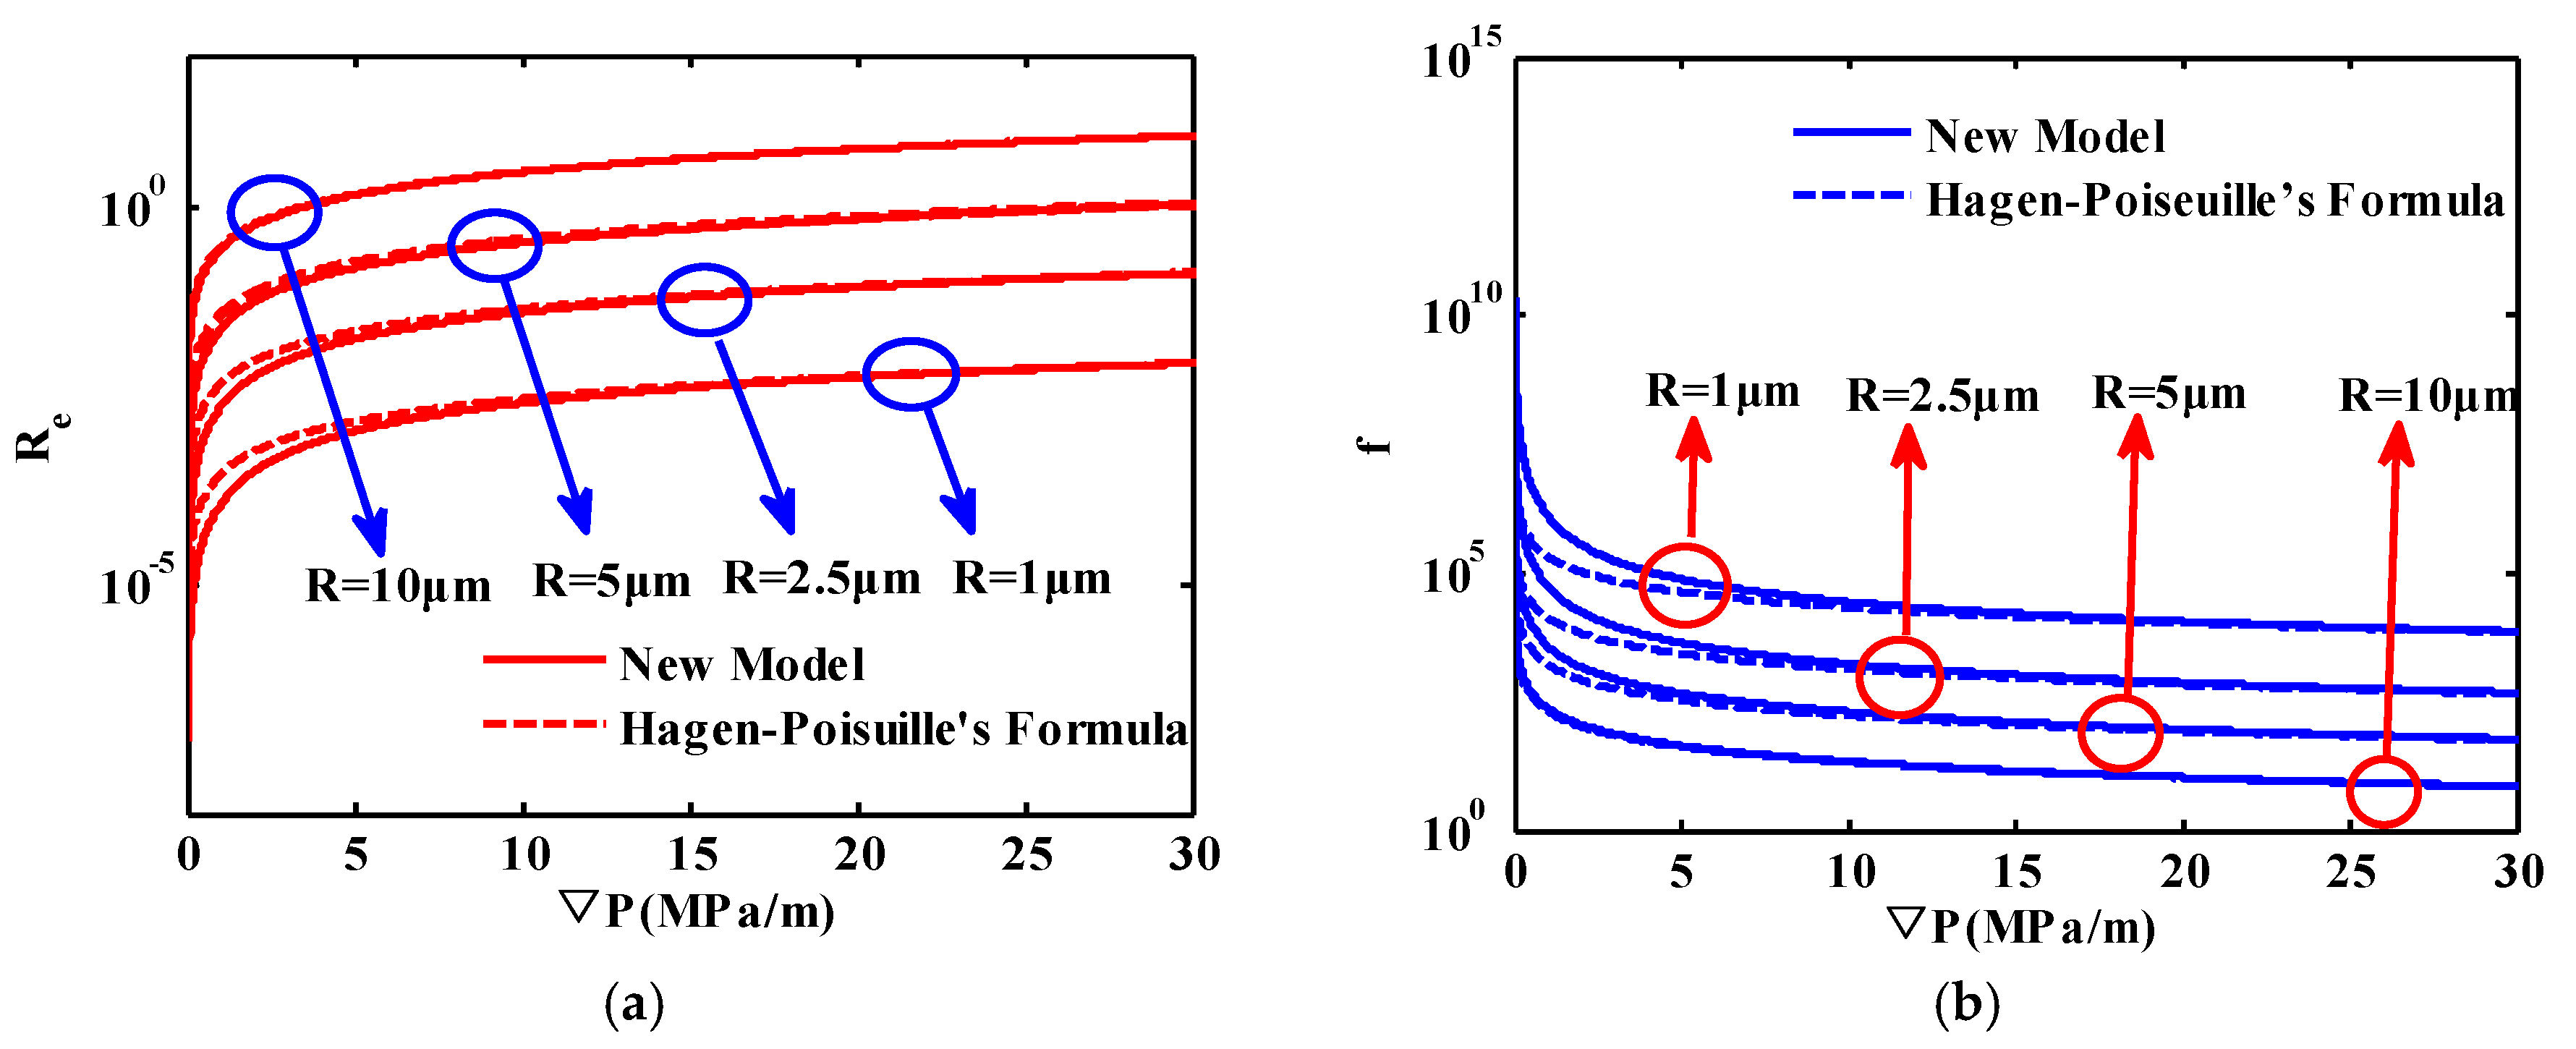
4.3. Flow Resistance

As can be seen from the above analysis, the flow law in micro scale is different from traditional Hagen-Poiseuille’s law due to fluid-solid interaction. In this part, the flow resistance in micro tubes in consideration of fluid-solid interaction will be further analyzed. The Reynolds number (Re), Resistance coefficient (f) and Poiseuille number (Po) after considering fluid-solid interaction can be respectively calculated as,
R e = ρ v D   μ = ρ D ( R h ) 4 P 8 μ 2 R 2
f = 2 D   ρ v 2 P = 2 D ρ ( ( R h ) 4 8 μ R 2 P ) 2 P
P o = f R e = 16 R 2 D 2   ( R h ) 4
where D is diameter of micro tubes; ρ is fluid density.
The relationships of Re and f versus ∇P are shown in Figure 13. With the increase of displacement pressure gradient, the fluid initially adsorbed on solid wall begins to flow reducing the boundary layer thickness. The average flow velocity increases which eventually leads to the increase of Re and decrease of resistance coefficient. Since the fluid-solid interaction effects on micro fluid flow weaken with the decrease of flow scale at the same displacement pressure gradient, the deviations of Re and f between the novel model and traditional Hagen-Poiseuille’s Formula becomes smaller and smaller as flow scale increases. In addition, we notice that the Reynolds number in micro fluid flow is far less than 2300 which suggests that the fluid flow in micro tubes belongs to laminar flow. This phenomenon further declares the reality of the novel model’s assumption. It can be seen that the resistance coefficient is always larger than 1, which demonstrates the non-negligible effects of fluid-solid interaction on micro scale flow.
In terms of classical laminar flow, the Poiseuille number is a constant with the value of 64 when fluid flow in horizontal circular tube is fully developed. However, some researchers hold the idea that the Poiseuille number is no longer a constant as the flow scale becomes smaller. Here, the change rule of Poiseuille number in micro tubes is analyzed based on the novel model. And the calculated results are shown in Figure 14.
As can be seen from Figure 14, the Poiseuille number is indeed no longer a constant when considering fluid-solid interaction. It declines with the increase of ∇P. When ∇P is large enough, the effect of fluid-solid interaction on fluid flow is reduced and the boundary layer thickness becomes thinner. As a result, the Poiseuille number in consideration of fluid-solid interaction is more and more close to traditional Poiseuille number. The deviation between the Poiseuille number considering fluid-solid interaction and traditional one increases with the decrease of micro-tube radius at the same displacement pressure gradient.

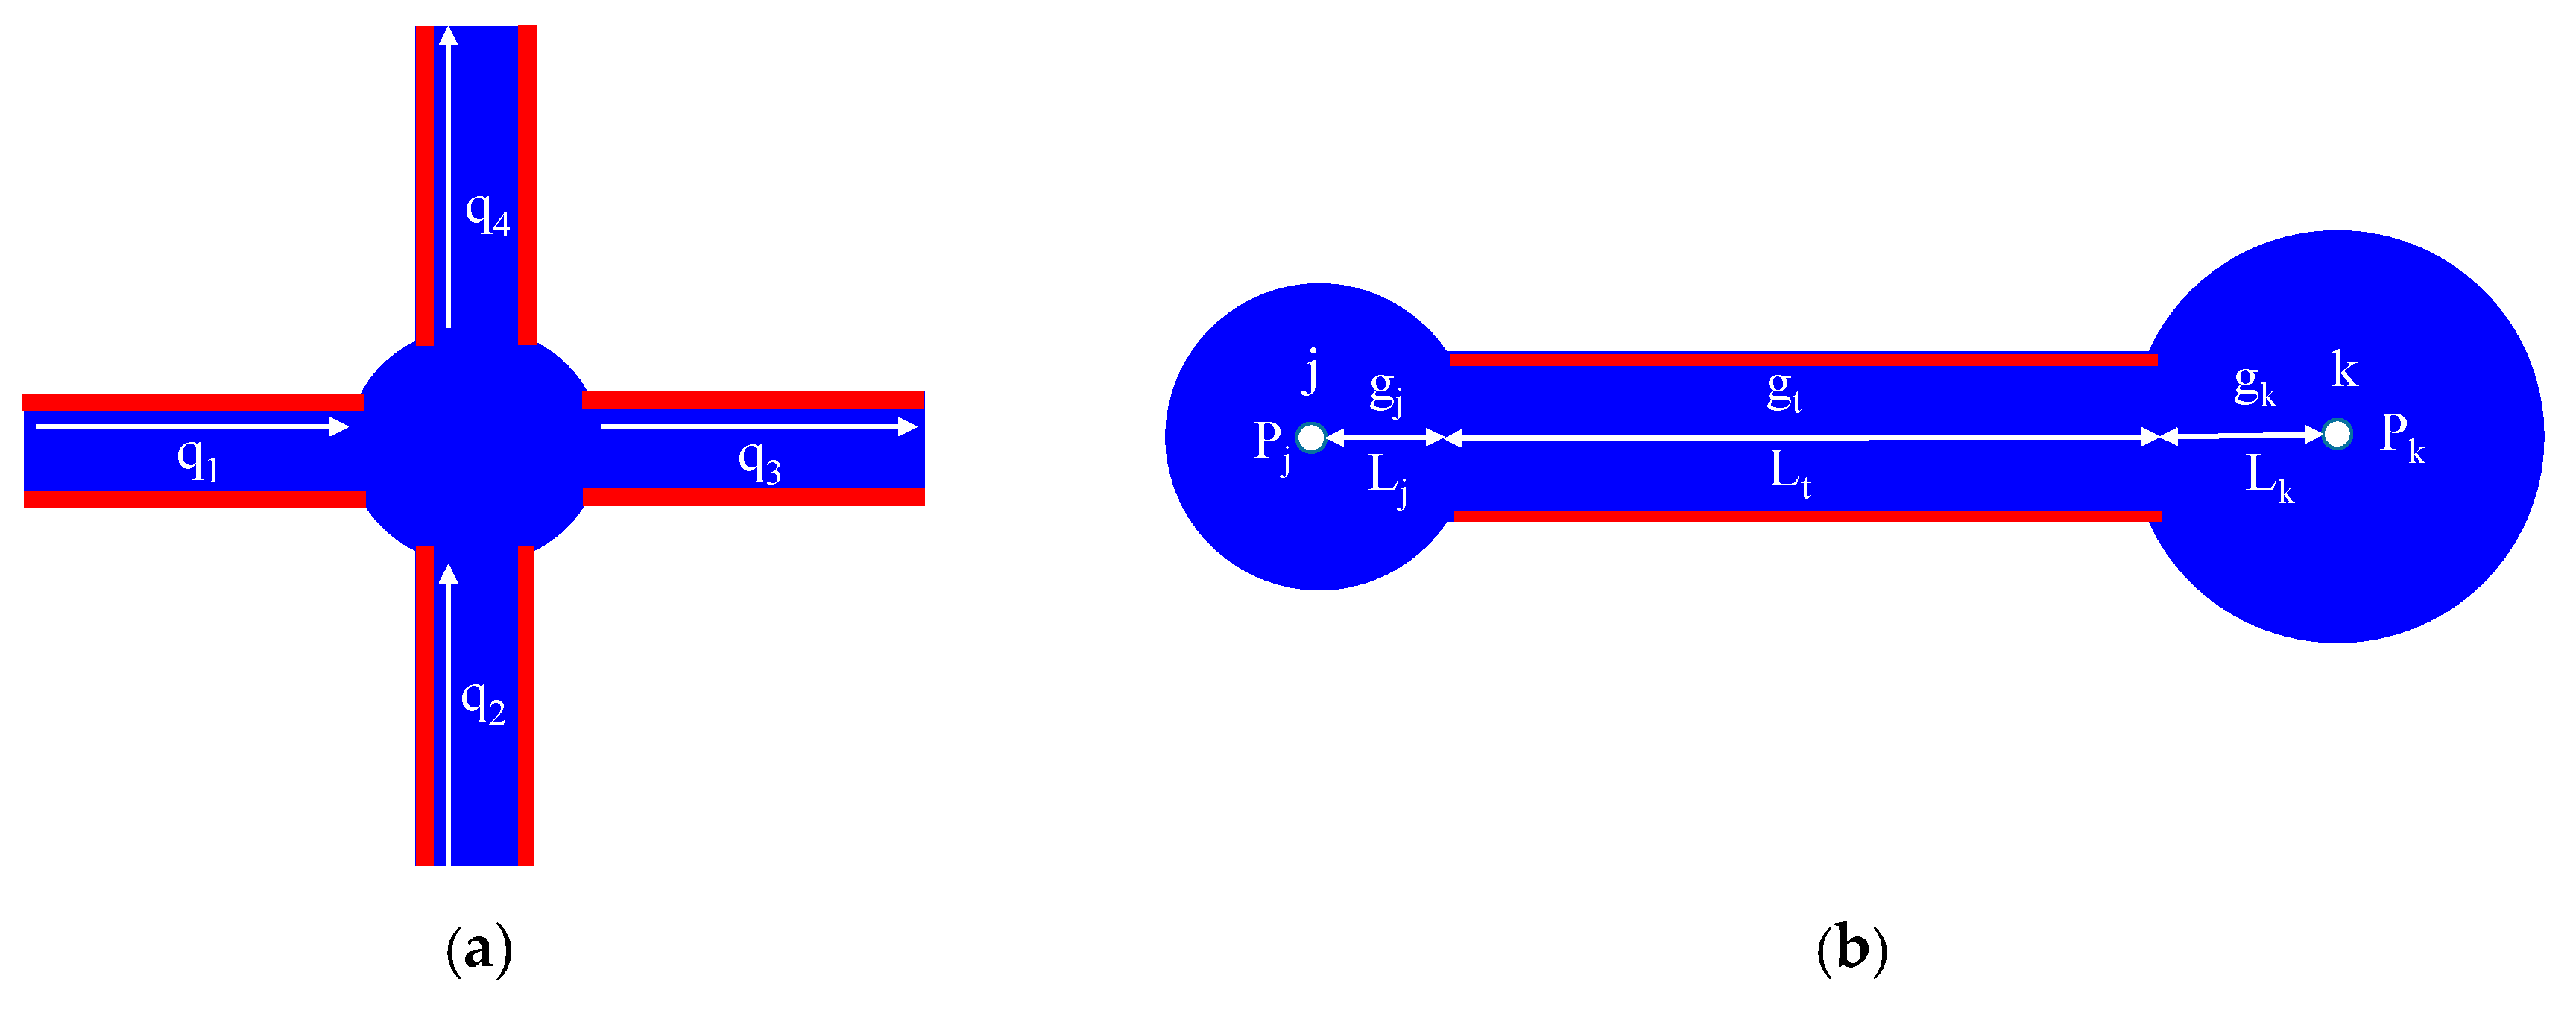
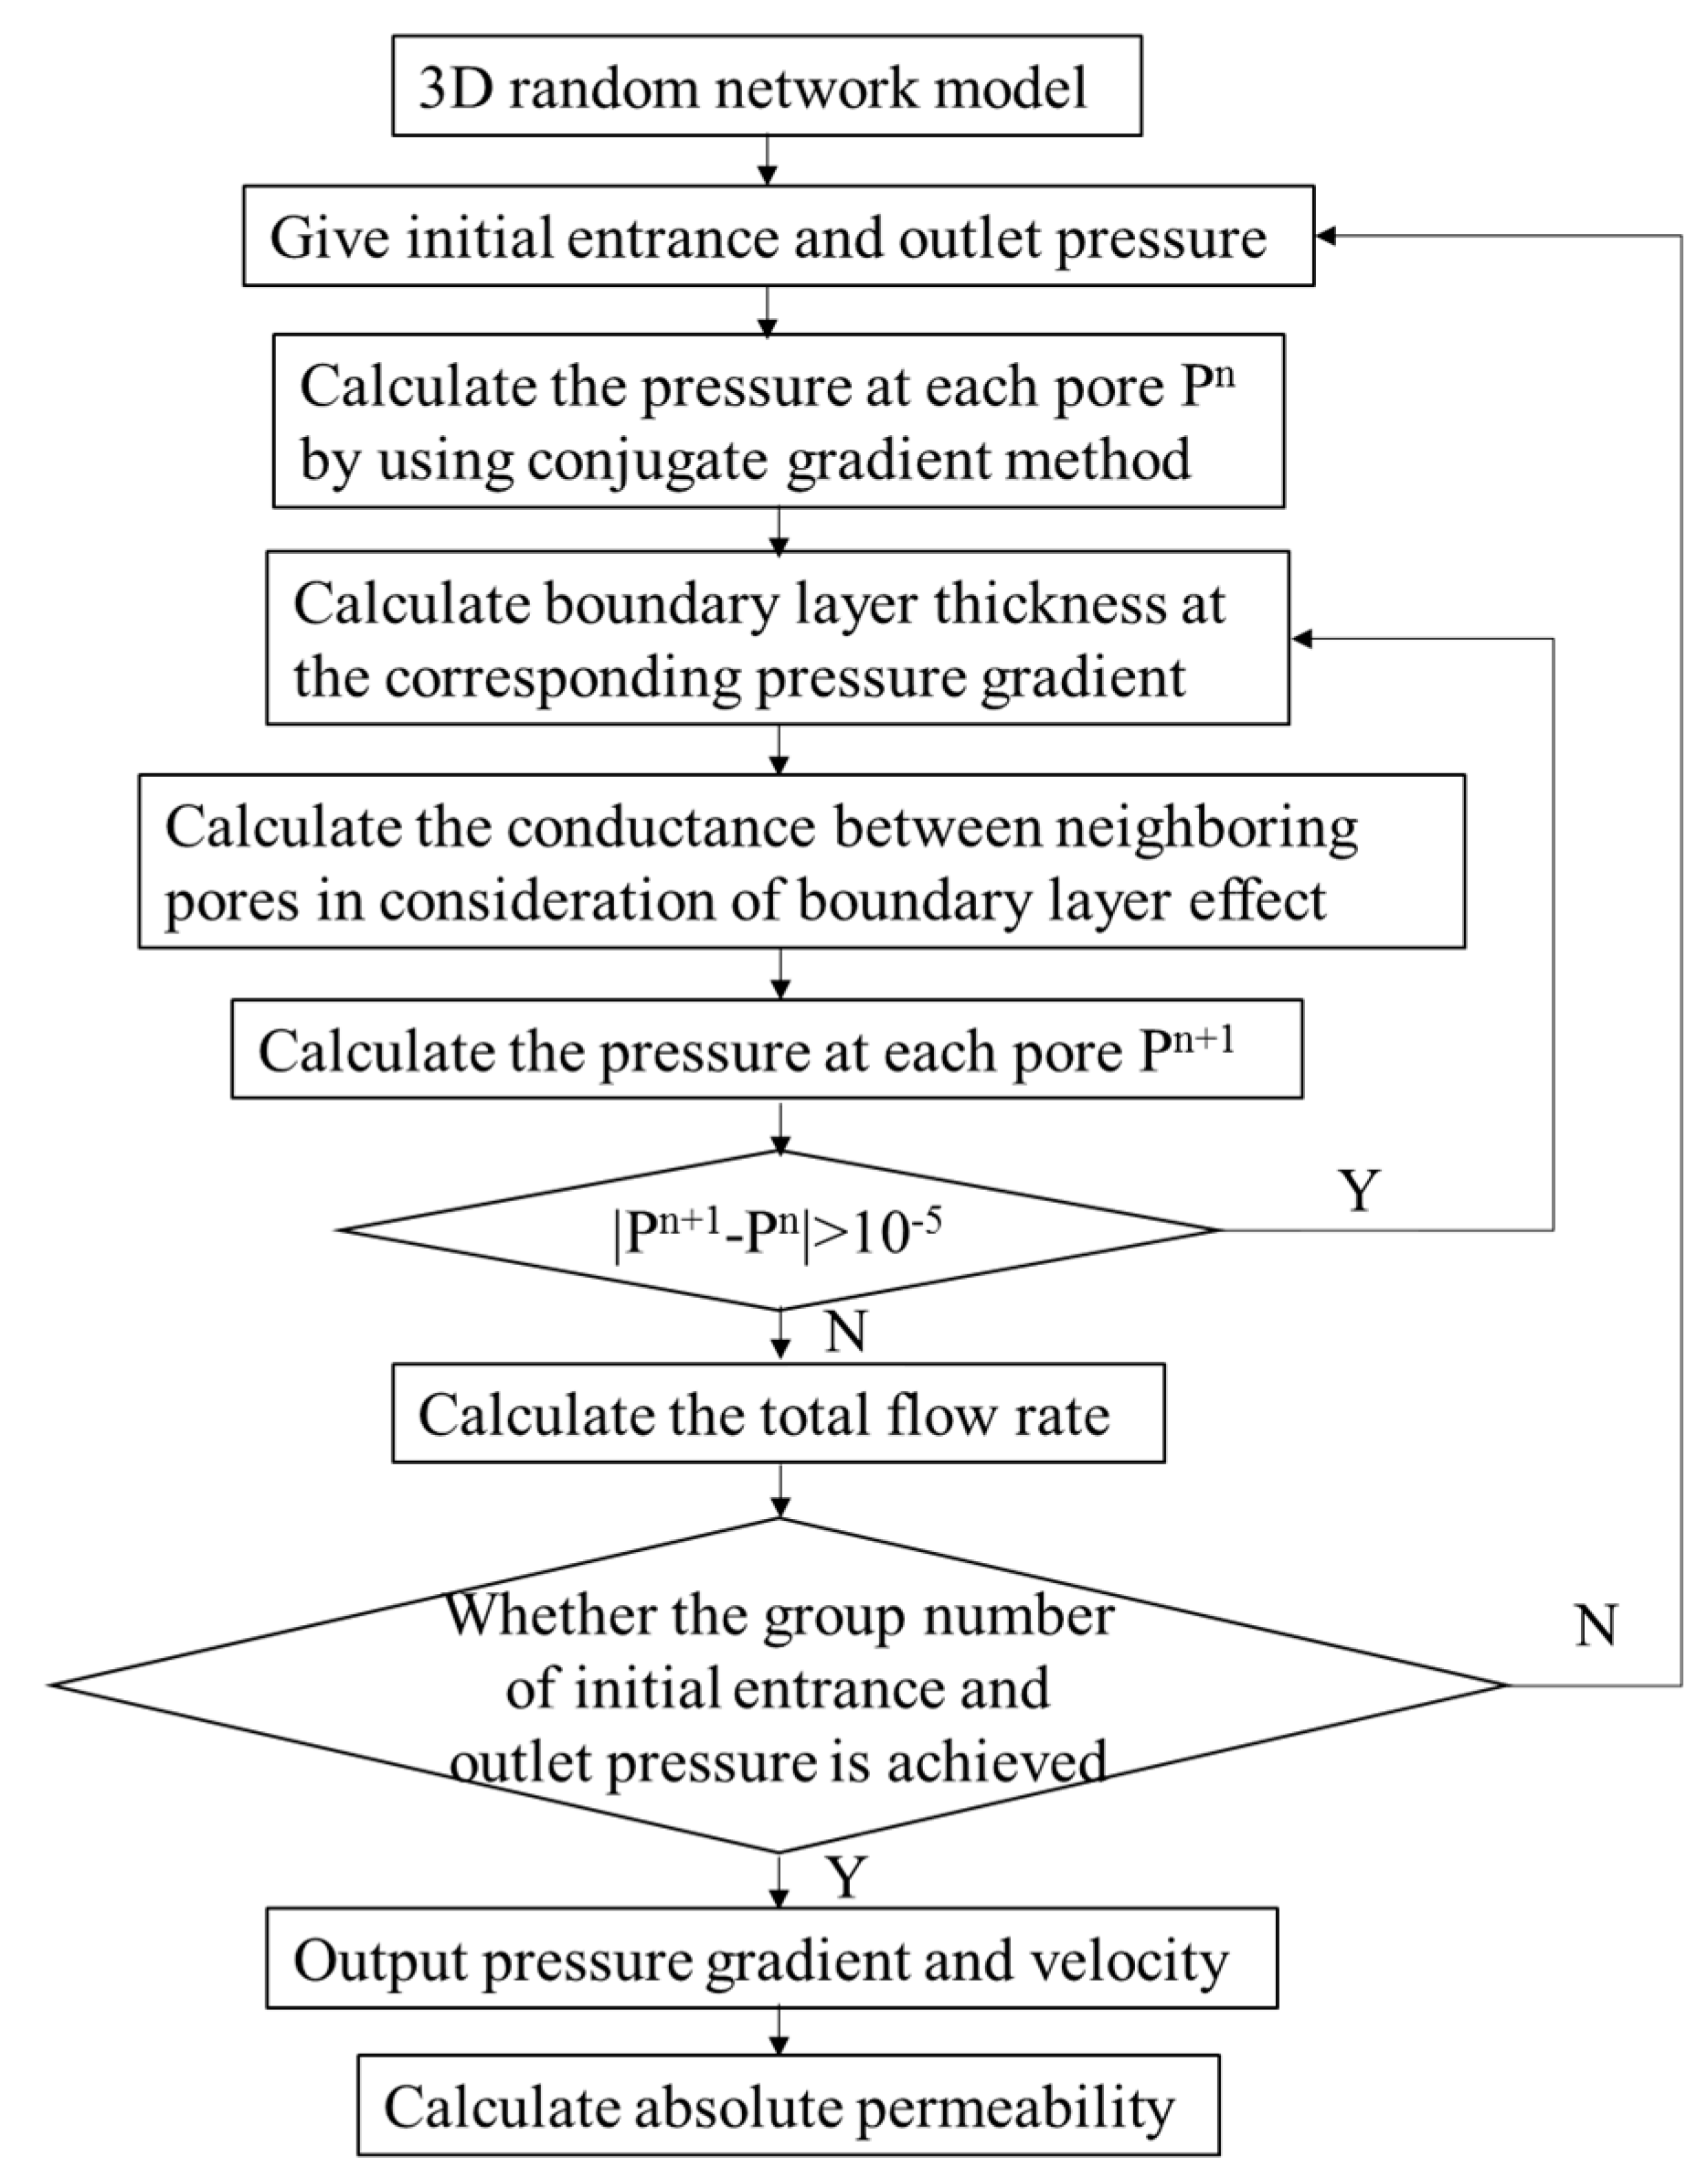
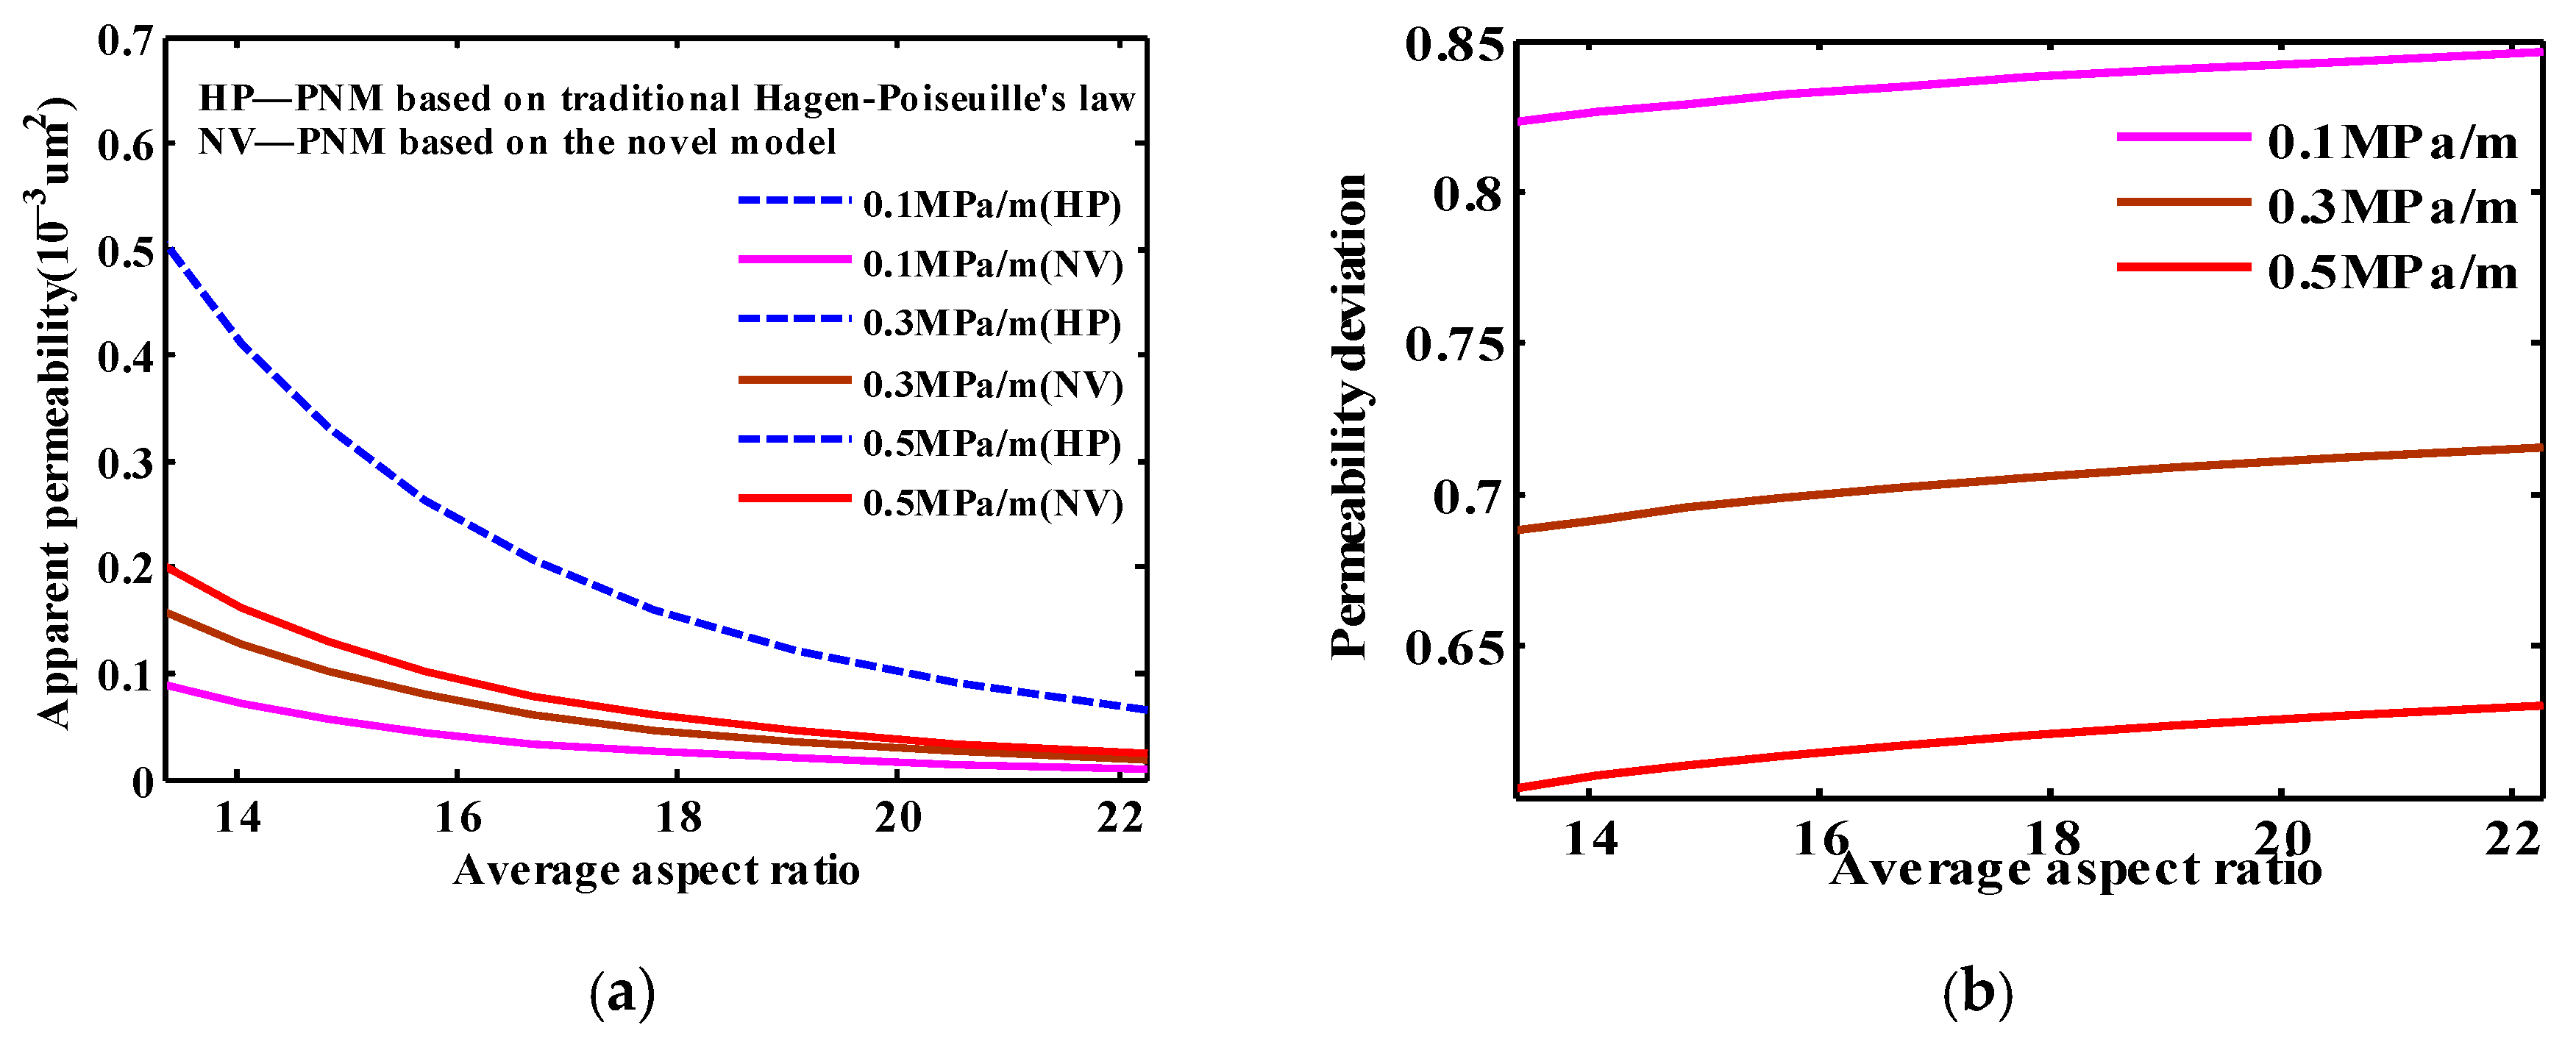
4.4. Pore Scale Network Model

The above investigation of fluid-solid interaction effects on microscopic flow mainly focuses on micro tubes. In this part, we will apply this novel model to pore scale network model which can represent the complex structure of tight formation to study fluid-solid interactions on fluid flow in porous media. Pore-throat radii and throat lengths are assumed to obey the truncated Weibull distribution in the pore network model.
R = ( R max   R min ) ( δ ln [ x ( 1 e 1 δ ) + e 1 δ ] ) 1 η + R min
where R represents pore and throat radii; Rmax and Rmin represent respectively the maximal throat and the minimal throat radius; δ represents scale distribution parameters; η represents shape distribution parameters; x [ 0 , 1 ] , which is a random number.
Detailed parameters in the pore network model are shown in Table 3. As the aspect ratio (the value of pore radius divided by throat radius) is large, the fluid-solid interaction effects on fluid flow will be only considered into throats.
The conductance in consideration of fluid-solid interaction in pore network model can be modified as,
g = π r e f f   2 8 μ = π ( R h ) 2 8 μ = π ( R 1 e 0.4323 e 0.1851 R P 0.6974 e 0.1343 R 4 ) 2 8 μ
Fluid flow through every pore satisfies mass conservation law at every displacement pressure gradient (See Figure 15a),
k q j k   = 0
where qjk represents the flow flux between pore i and a neighboring pore j. The flow flux between two neighboring pores can be calculated as follow,
q j k   = g j k L j k ( P j P k )
where gjk represents the conductance between pore j and k. It can be calculated by the harmonic mean of the conductance of the throat and two neighboring pores (See Figure 15b).
g j k   = L j k L j g j + L t g t + L k g k
where Ljk is the distance between pore j and k; Pj and Pk represent fluid pressure in pore j and k respectively.
The apparent permeability in the pore network model in consideration of fluid-solid interaction can be calculated by Equation (27),
K a = μ Q L   A ( P i n P o u t )
The detailed calculation flow chart considering fluid-solid interaction is shown in Figure 16.
The calculation results are shown in Figure 17.
As is known from Figure 17a, the apparent permeability is no longer a constant when considering fluid-solid interaction. The effect of fluid-solid interaction on fluid flow weakens with the increase of displacement pressure gradient, the boundary layer thickness declines and the effective flow space is enlarged. As a result, the deviations of the apparent permeability grow smaller. When the displacement pressure gradient is large enough, the apparent permeability is basically consistent with the one ignoring fluid-solid interaction. From Figure 17b, we can see that nonlinear flow occurs at low displacement pressure gradient due to fluid-solid interaction. The velocity deviation also decreases with the increase of displacement pressure gradient.
In order to further investigate fluid-solid interactions on fluid flow in porous media, the throat radii are modified to change the flow scale in pore network model. The average aspect ratio is used to reflect the flow scale. The deviation of apparent permeability is defined in Equation (28).
D k = K h p   K f s K h p
where Khp represents the apparent permeability, ignoring the fluid-solid interaction, and Kf − s in consideration of fluid-solid interaction.
For calculation, we respectively set the displacement pressure gradient as 0.1 MPa/m, 0.3 MPa/m and 0.5 MPa/m. The fluid viscosity is 0.92 mPa·s. The results are respectively shown in Figure 18.
It can be seen from Figure 18 that the curves of apparent permeability versus the average aspect ratio without considering the fluid-solid interaction overlap, which indicates that apparent permeability has nothing to do with ∇P at different average aspect ratios. The apparent permeability decreases with increased average aspect ratio which suggests that the apparent permeability is the function of pore structures. When taking fluid-solid interaction into consideration, the apparent permeability at different ∇P is smaller than that ignoring its effects. Meanwhile, the curves of apparent permeability versus average aspect ratio no longer overlap. The effect of fluid-solid interaction on fluid flow is weakened and the boundary layer thickness is reduced with the increase of ∇P, which results in a larger effective flow space and smaller deviation of apparent permeability from that ignoring fluid-solid interaction. The decline trend of the apparent permeability also exhibits great difference with the increase of average aspect ratio due to fluid-solid interaction.

5. Conclusions

In this study, a novel model which can characterize fluid flow in micro scales is developed from a new perspective. Micro tube experiments are used to verify the novel model. Its application range is further analyzed mathematically. After the analysis of the novel model, fluid-solid interaction effects on the velocity profile, the average flow velocity and flow resistance in micro tubes are respectively studied. Finally, the novel model is incorporated into pore scale network model to study fluid-solid interaction effects on fluid flow in porous media. The following conclusions are arrived at:
  • When fluid-solid interaction is taken into consideration, the velocity in micro tube is smaller than that predicted by traditional Hagen-Poiseuille’s law. The fluid-solid interaction declines significantly as the distance away from the solid wall grows larger, which results in largest velocity deviation near the wall surface and the smallest one in the center of micro tube.
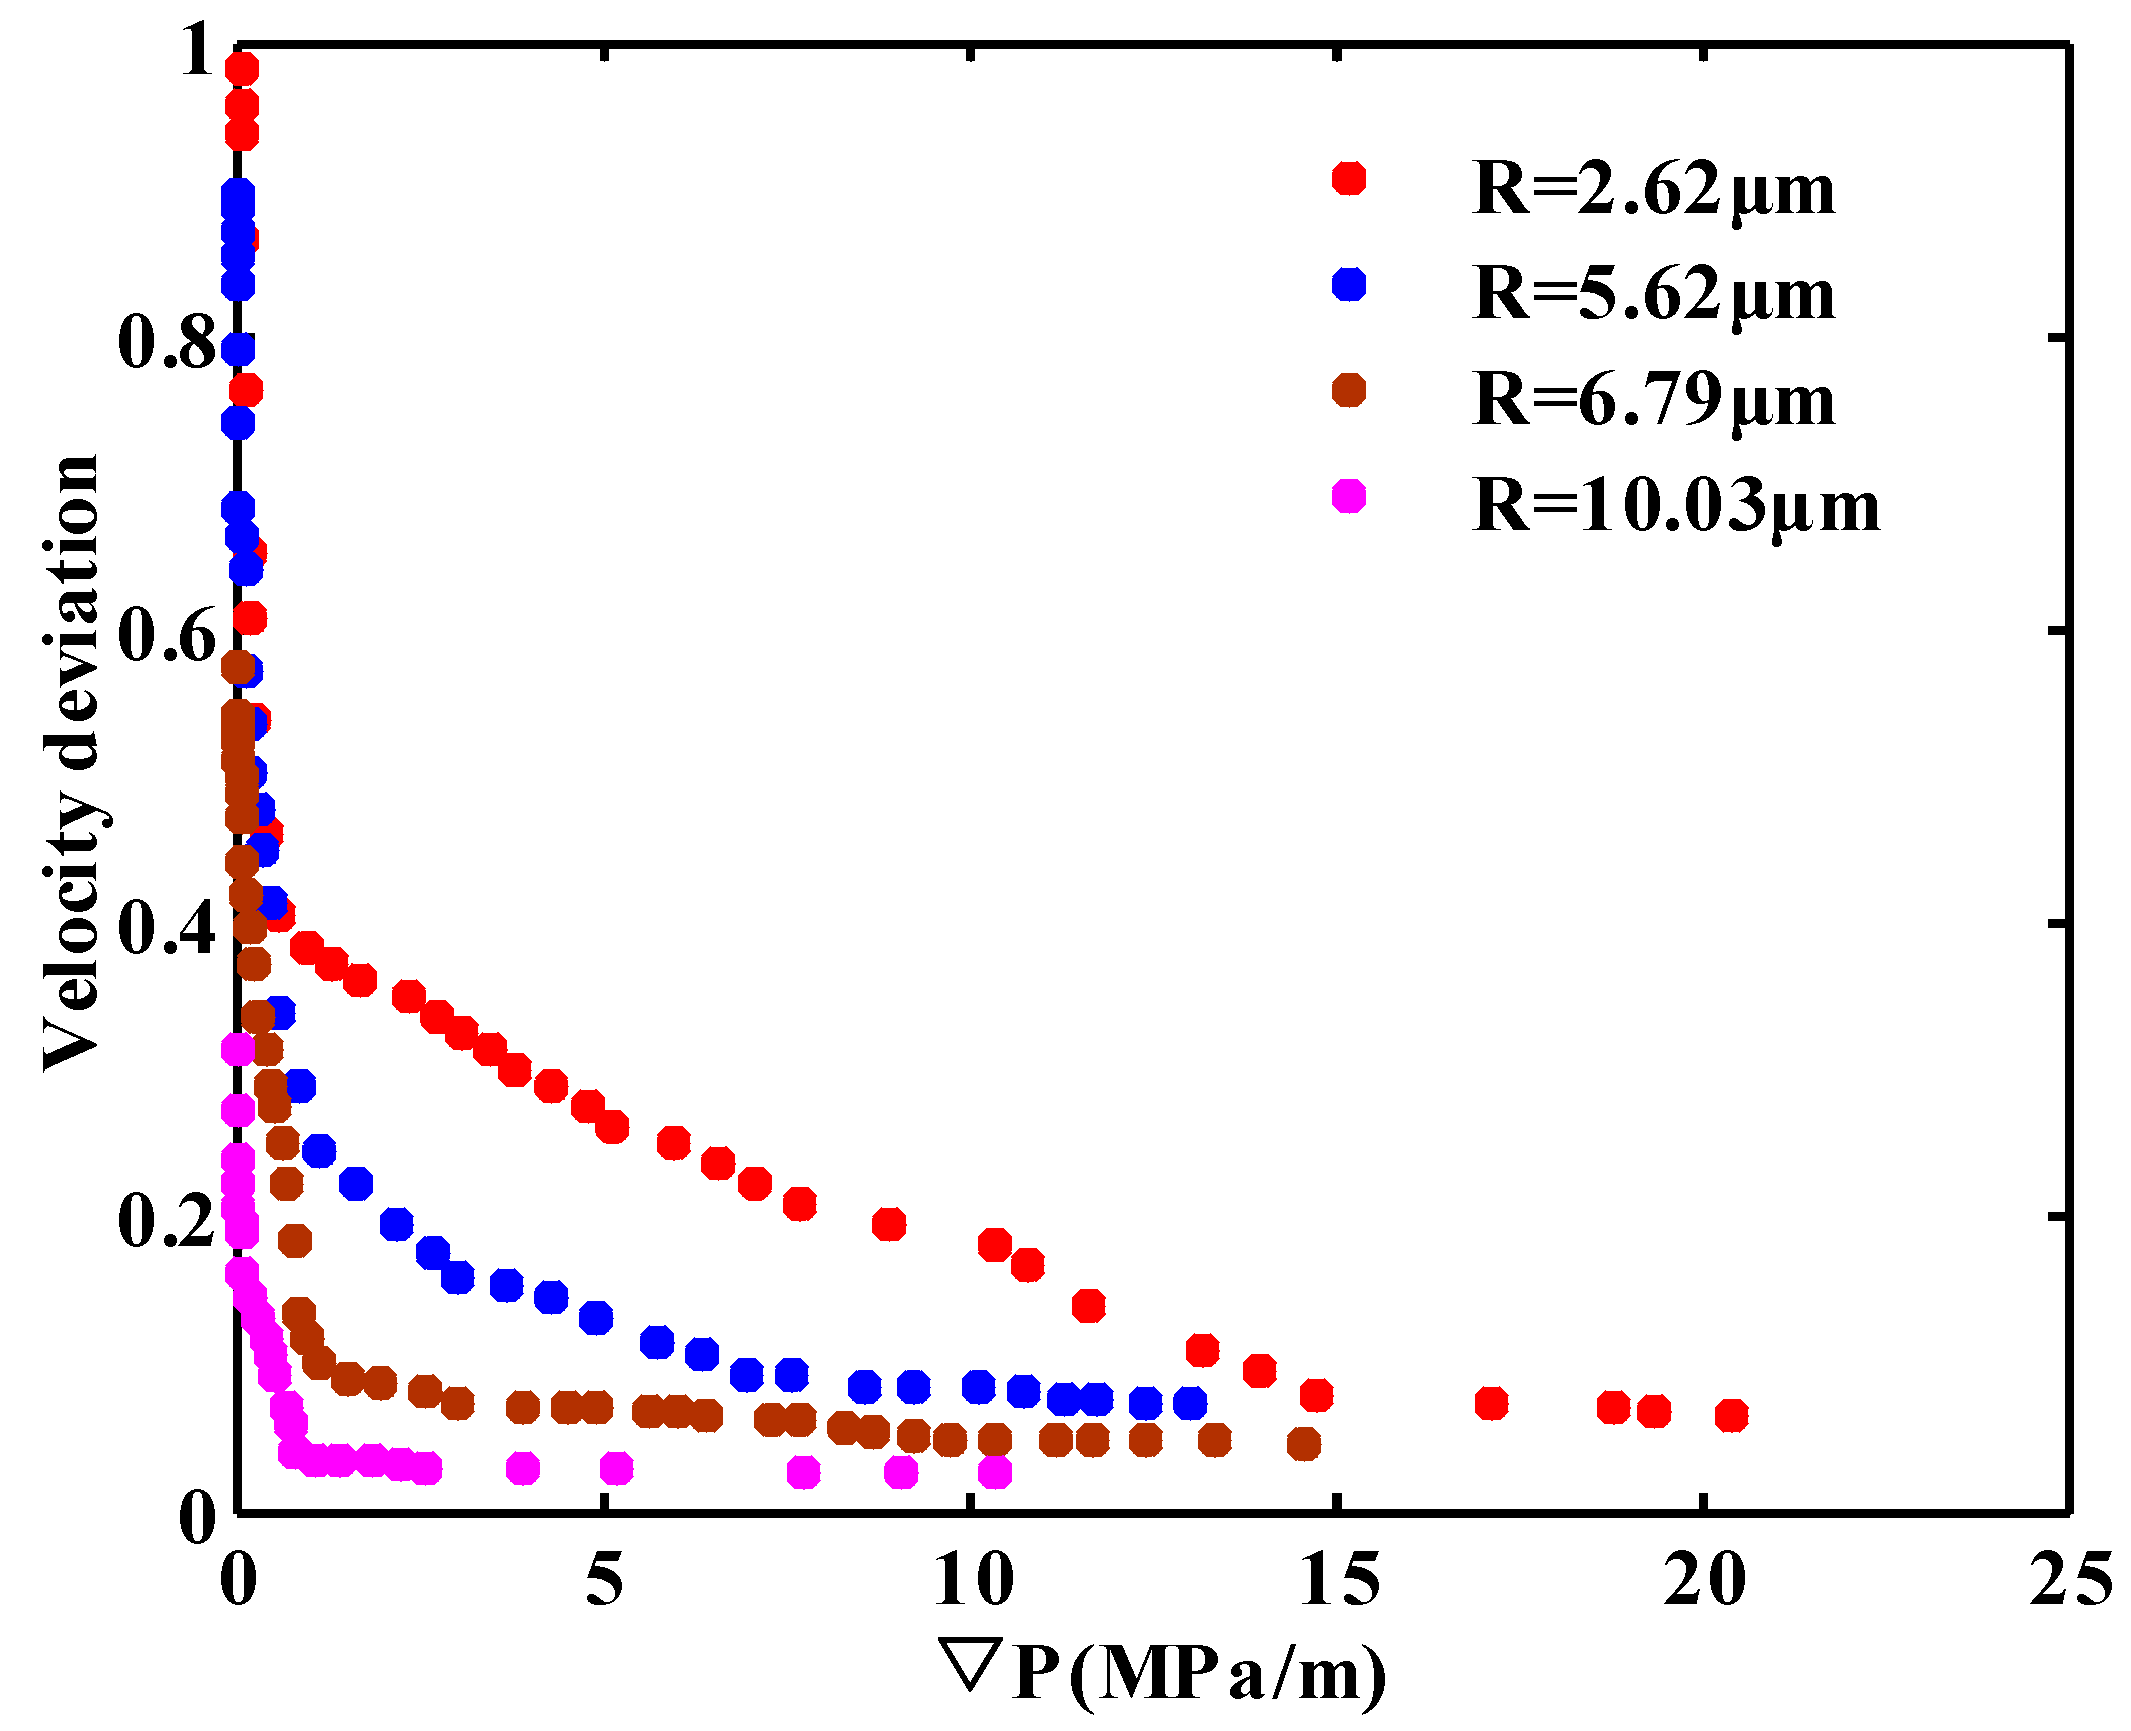
  • Non-linear flow occurs both in micro tubes and porous media at low displacement pressure gradient due to fluid-solid interaction. Moreover, the effect of fluid-solid interaction on micro flow declines with increased displacement pressure gradient, which leads to smaller and smaller velocity deviation.
  • The changing rules of the Reynolds number, the Resistance coefficient and Poiseuille number do not obey traditional Hagen-Poiseuille’s law owing to fluid-solid interaction. The smaller the radius and the lower the displacement pressure gradient, the stronger the fluid-solid interaction, the larger the deviation will be.
  • The apparent permeability in porous media is no longer a constant when incorporating the novel model into pore scale network model. The apparent permeability increases and the permeability deviation declines with increased displacement pressure gradient.

Author Contributions

M.C.; Methodology & Writing—Original Draft Preparation, L.C. and R.C.; Supervision & Editing; C.L.; Model analysis & Editing.

Acknowledgments

This work is supported by the National Basic Research Program of China (Grant No. 2015CB250902), the National Natural Science Foundation of China (Grant Nos. 51574258 and 51674273) and University Doctoral Special Research Fund (Grant No. 20130007120014).

Conflicts of Interest

The authors declare no conflict of interest.

References

  1. Clarkson, C.R.; Pedersen, P.K. Tight oil production analysis: Adaptation of existing rate-transient analysis techniques. In Proceedings of the Canadian Unconventional Resources and International Petroleum Conference, Calgary, AB, Canada, 19–21 October 2010. [Google Scholar]
  2. Du, J.H.; He, H.Q.; Yang, T.; Huang, F.X.; Guo, B.C.; Yan, W.P. Progress in China’s tight oil exploration and challenges. China Pet. Exp. 2014, 19, 1–9. [Google Scholar]
  3. Lin, S.H.; Zou, C.N.; Yuan, X.J.; Yang, Z. Status quo of tight oil exploitation in the United States and its implication. Lithol. Reserv. 2011, 23, 25–30. [Google Scholar]
  4. Cui, X.; Bustin, A.M.M.; Bustin, R.M. Measurements of gas permeability and diffusivity of tight reservoir rocks: Different approaches and their applications. Geofluids 2009, 9, 208–223. [Google Scholar] [CrossRef]
  5. Liu, Y.F.; Hu, W.X.; Cao, J.; Wang, X.L.; Tang, Q.S.; Wu, H.G.; Kang, X. Diagenetic constraints on the heterogeneity of tight sandstone reservoirs: A case study on the Upper Triassic Xujiahe Formation in the Sichuan Basin, southwest China. Mar. Pet. Geol. 2018, 92, 650–669. [Google Scholar] [CrossRef]
  6. Lyu, C.H.; Ning, Z.F.; Wang, Q.; Chen, M.Q. Application of NMR T2 to pore size distribution and movable fluid distribution in Tight Sandstones. Energy Fuels 2018, 32, 1395–1405. [Google Scholar] [CrossRef]
  7. Zhao, H.W.; Ning, Z.F.; Wang, Q.; Zhang, R.; Zhao, T.Y.; Niu, T.F.; Zeng, Y. Petrophysical characterization of tight oil reservoirs using pressure-controlled porosimetry combined with rate-controlled porosimetry. Fuel 2015, 154, 233–242. [Google Scholar] [CrossRef]
  8. Wang, F.; Liu, Z.; Jiao, L.; Wang, C.; Guo, H.U. A fractal permeability model coupling boundary-layer effect for tight oil reservoirs. Fractals 2017, 25, 1750042. [Google Scholar] [CrossRef]
  9. Wu, J.S.; Hu, D.Z.; Li, W.J.; Cai, X. A review on non-Darcy flow u2014 forchheimer equation, hydraulic radius model, Fractal model and experiment. Fractals-Complex Geom. Patterns Scaling Nat. Soc. 2016, 24, 1782–1788. [Google Scholar]
  10. Soroori, S.; Rodriguez-Delgado, J.M.; Kido, H.; Dieck-Assad, G.; Madou, M.; Kulinsky, L. The use of polybutene for controlling the flow of liquids in centrifugal microfluidic systems. Microfluid. Nanofluid. 2016, 20, 26. [Google Scholar] [CrossRef]
  11. Guo, J.S.; Huang, B.C. Hyperbolic quenching problem with damping in the micro-electro mechanical system device. Discret. Contin. Dyn. Syst. 2014, 2. [Google Scholar] [CrossRef]
  12. Campo-Deaño, L. Fluid-Flow Characterization in Microfluidics. In Complex Fluid-Flows in Microfluidics; Galindo-Rosales, F.J., Ed.; Springer International Publishing: New York, NY, USA, 2018; pp. 53–71. [Google Scholar]
  13. Kavallaris, N.I.; Suzuki, T. Micro-electro-mechanical-systems (MEMS). In Non-Local Partial Differential Equations for Engineering and Biology: Mathematical Modeling and Analysis; Springer International Publishing: New York, NY, USA, 2018; pp. 3–63. [Google Scholar]
  14. Ho, C.M.; Tai, Y.C. Micro-electro-mechanical-systems (MEMS) and fluid flows. Annu. Rev. Fluid Mech. 1996, 30, 579–612. [Google Scholar] [CrossRef]
  15. Wang, F.; Yue, X.; Xu, S.; Zhang, L.; Zhao, R.; Hou, J. Influence of wettability on flow characteristics of water through microtubes and cores. Chin. Sci. Bull. 2009, 54, 2256–2262. [Google Scholar] [CrossRef]
  16. Yue, X.A.; Wang, N.; Zhang, L.J.; Wang, F. Flow experiments of HPAM solution in quartz micro-tubes. Mech. Eng. 2010, 32, 81–84. [Google Scholar]
  17. Ling, Z.Y.; Ding, J.N.; Yang, J.C.; Fan, Z.; Li, C.S. Research Advance in Microfluid and Its Influencing Factors. J. Jiangsu Univ. Sci. Technol. 2002, 6, 1–5. [Google Scholar]
  18. Li, Z.H.; Cui, H.H. Characteristics of Micro Scale Flow. J. Mech. Strength 2001, 4, 476–480. [Google Scholar]
  19. Pfahler, J.; Harley, J.; Bau, H.; Zemel, J. Liquid transport in micron and submicron channels. Sens. Actuators A Phys. 1990, 22, 431–434. [Google Scholar] [CrossRef]
  20. Makihara, M.; Sasakura, K.; Nagayama, A. The Flow of Liquids in Micro-Capillary Tubes: Consideration to Application of the Navier-Stokes Equations. J. Jpn. Soc. Precis. Eng. 1993, 59, 399–404. [Google Scholar] [CrossRef]
  21. Qu, M.L.; Mala, M.; Li, D.Q. Pressure-driven water flows in trapezoidal silicon microchannels. Int. J. Heat Mass Transf. 2000, 43, 353–364. [Google Scholar] [CrossRef]
  22. Wu, J.Z.; Cheng, L.S.; Li, C.L.; Cao, R.Y.; Chen, C.C.; Cao, M.; Xu, Z.Y. Experimental study of nonlinear flow in micropores under low pressure gradient. Transp. Porous Media 2017, 119, 247–265. [Google Scholar] [CrossRef]
  23. Sandeep, A.; Saleem, K.; Akhil, V.; Harneet, K.; Parveen, L. Microfluidic mechanics and applications: A review. J. Nano-Electron. Phys. 2013, 5, 04047-1. [Google Scholar]
  24. Gad-El-Hak, M. The Fluid Mechanics of Micro-devices—The Freeman Scholar Lecture. ASME J. Fluids Eng. 1999, 121, 5–33. [Google Scholar] [CrossRef]
  25. Zhang, X.L.; Zhu, W.Y.; Cai, Q.; Liu, Q.P.; Wang, X.F.; Lou, Y. Analysis of weakly compressible fluid flow in nano/micro-size circular tubes considering solid wall force. Acta Sci. Nat. Univ. Pekin. 2014, 36, 569–575. [Google Scholar]
  26. Мархасин, И.Л. Physical and Chemical Mechanism of Reservoir; Petroleum Industry Press: Beijing, China, 1987. [Google Scholar]
  27. Pertsin, A.; Grunze, M. Water-graphite interaction and behavior of water near the graphite surface. J. Phys. Chem. B 2004, 108, 1357–1364. [Google Scholar] [CrossRef]
  28. Mazzoco, R.R.; Wayner, P.C. Aqueous Wetting Films on Fused Quartz. J. Colloid Interface Sci. 1999, 214, 156–169. [Google Scholar] [CrossRef] [PubMed]
  29. Liu, D.X.; Yue, X.A.; Hou, J.R.; Wang, L.M. Experimental Study of Adsorbed Water Layer on solid particle surface. Acta Miner. Sin. 2005, 1, 15–19. [Google Scholar]
  30. Huang, Y.Z. Infiltration Mechanism of Low-Permeability Reservoir; Petroleum Industry Press: Beijing, China, 1999. [Google Scholar]
  31. Li, Y. Study of Microscale Nonlinear Flow Characteristics and Flow Resistance Reducing Methods. Ph.D. Thesis, Institute of Porous Flow and Fluid Mechanics, Lanfang, China, 2010. [Google Scholar]
  32. Wu, J.Z.; Cheng, L.S.; Li, C.L.; Cao, R.Y.; Chen, C.C.; Xu, Z.Y. Flow of Newtonian fluids with different polarity in micro scale. Chin. Sci. Bull. 2017, 62, 2988–2996. [Google Scholar]
  33. Xu, S.; Yue, X.; Hou, J. Experimental study on the flow characteristics of deionized water in microcircular tubes. Chin. Sci. Bull. 2007, 6, 120–124. [Google Scholar]
  34. Zhu, C.J.; Zhang, J.; Zhang, P. Study on Influence of Boundary Layer on the Non-Darcy Seepage Law. J. Converg. Inf. Technol. 2013, 8, 960–968. [Google Scholar]
  35. Zhang, P.; Zhang, L.Z.; Li, W.Y.; Wang, Y.F. Experiment on the influence of boundary layer on the Non-Darcy seepage law. J. Hebei Univ. Eng. 2008, 25, 70–72. (In Chinese) [Google Scholar]
  36. Thomas, J.A.; McGaughey, A.J.H. Reassessing fast water transport through carbon nanotubes. Nano Lett. 2008, 8, 2788–2793. [Google Scholar] [CrossRef] [PubMed]
  37. Li, Z.F.; He, S.L. Influence of boundary layers upon filtration law in low-permeability oil reservoirs. Pet. Geol. Oilfield Dev. Daqing 2005, 24, 57–59, 77–107. [Google Scholar]
  38. Liu, W.D.; Liu, J.; Sun, L.H.; Li, Y.; Lan, X.Y. Influence of Fluid Boundary Layer on Fluid Flow in Low Permeability Oilfields. Sci. Technol. Rev. 2011, 29, 42–44. [Google Scholar]
  39. Cao, R.Y.; Wang, Y.; Cheng, L.S.; Ma, Y.Z.; Tian, X.F.; An, N. A New Model for Determining the Effective Permeability of Tight Formation. Transp. Porous Media 2016, 112, 21–37. [Google Scholar] [CrossRef] [Green Version]
  40. Wu, J.Z.; Cheng, L.S.; Cao, R.Y.; Xu, Z.Y.; Ding, G.Y.; Ding, G.Y. A Novel Characterization of Effective Permeability of Tight Reservoir—Based on the Flow Experiments in Microtubes. In Proceedings of the 19th European Symposium on Improved Oil Recovery, Stavanger, Norway, 23–28 April 2017. [Google Scholar]
  41. Tian, X.F. Non-Linear Flow Behavior and Mathematical Model in Ultra-Low Permeability Reservoirs. Ph.D. Thesis, China University of Petroleum (Beijing), Beijing, China, 2015. [Google Scholar]
Figure 1. Scheme of fluid flow in lateral placed micro tube.
Energies 11 02197 g001
Figure 2. Schematic diagram of micro-tube experiment.
Energies 11 02197 g002
Figure 3. Relationship of velocity deviation versus displacement pressure gradient in different radial micro-tubes.
Energies 11 02197 g003
Figure 4. Schematic diagram of boundary layer thickness versus displacement pressure gradient (∇P1 < ∇P2).
Energies 11 02197 g004
Figure 5. Fitting results with the novel deviation model: (a) R = 10.03 μm; (b) R = 6.79 μm; (c) R = 5.62 μm; (d) R = 2.62 μm.
Energies 11 02197 g005
Figure 6. Parameters (b and c) versus radius: (a) b; (b) c.
Energies 11 02197 g006
Figure 7. Comparison of predictive velocity versus ∇P and Li’s experimental results [31]: (a) R = 10.03 μm; (b) R = 6.79 μm; (c) R = 5.62 μm; (d) R = 2.62 μm.
Energies 11 02197 g007
Figure 8. Comparison of calculated velocity versus ∇P and Wu’s experimental results [22,40]: (a) R = 15.36 μm; (b) R = 10.03 μm; (c) R = 7.61 μm; (d) R = 1.38 μm.
Energies 11 02197 g008aEnergies 11 02197 g008b
Figure 9. Ratio of boundary layer thickness versus ∇P under different radial micro tubes.
Energies 11 02197 g009
Figure 10. Velocity profile in different radial micro tubes: (a) R = 2.62 μm; (b) R = 5.62 μm; (c) R = 6.79 μm; (d) R = 10.03 μm.
Energies 11 02197 g010
Figure 11. Deviations of velocity profile in different radial micro tubes.
Energies 11 02197 g011
Figure 12. Fluid-solid interaction on average flow velocity under two conditions: (a) Average flow velocity versus ∇P; (b) Average flow velocity versus radius.
Energies 11 02197 g012
Figure 13. Relationships of Re and f versus ∇P: (a) Re versus ∇P; (b) f versus ∇P.
Energies 11 02197 g013
Figure 14. The relationship of Po versus ∇P.
Energies 11 02197 g014
Figure 15. Scheme of pore network model (red part represents boundary layer while blue part represents the effective flow space): (a) Flow through every pore; (b) Conductance between two neighboring pores.
Energies 11 02197 g015
Figure 16. Flow chart of calculation in consideration of fluid-solid interaction.
Energies 11 02197 g016
Figure 17. Relationship between apparent permeability and flow rate versus ∇P: (a) Apparent permeability versus ∇P; (b) Flow velocity versus ∇P.
Energies 11 02197 g017
Figure 18. Relationship between apparent permeability versus average aspect ratio at different ∇P: (a) Apparent permeability; (b) Permeability deviation.
Energies 11 02197 g018
Table 1. Parameters (b and c) versus radius of micro tubes.
Radius (μm)bc
2.620.71870.486
5.621.1990.3372
6.791.5270.284
10.032.770.1712
Table 2. Parameters used to study fluid-solid interaction on average flow velocity.
Constant Radius of Micro TubeConstant Displacement Pressure Gradient
Fluid viscosity (mPa·s)0.92Fluid viscosity (mPa·s)0.92
Radius (μm)5P (MPa/m)0.5
Table 3. Parameters of pore scale network model.
ParametersValuesParametersValues
Model size10 × 10 × 10Throat radius (μm)1–4
Pore radius (μm)10–100Throat length (μm)30–40
Fluid viscosity (mPa s)0.92

