Abstract
Thermogravimetric analysis was employed to investigate the combustion characteristics of flax shives, beech wood, hemicellulose, cellulose, lignin, and their chars. The chars were prepared from raw materials in a fixed-bed reactor at 850 °C. In this study, the thermal behavior based on characteristic temperatures (ignition, maximum, and final temperatures), burnout time and maximum rate was investigated. The kinetic parameters for the combustion of different materials were determined based on the Coats-Redfern approach. The results of our study revealed that the combustion of pure pseudo-components behaved differently from that of biomass. Indeed, principal component analysis showed that the thermal behavior of both biomasses was generally similar to that of pure hemicellulose. However, pure cellulose and lignin showed different behaviors compared to flax shives, beech wood, and hemicellulose. Hemicellulose and cellulose chars had almost the same behaviors, while being different from biomass and lignin chars. Despite the difference between flax shives and beech wood, they showed almost the same thermal characteristics and apparent activation energies. Also, the combustion of the hemicellulose and cellulose chars showed that they have almost the same structure. Their overall thermal and kinetic behavior remained between that of biomass and lignin.
1. Introduction
Biomass is one of the most environment-friendly renewable sources of energy being used for human needs. Usually, its conversion is considered to be a carbon-free process, because the resulting CO2 was previously captured by plants. Based on life-cycle assessment comparisons, net carbon emissions from biomass per unit of electricity are below 10% of those from the emissions from fossil fuels [1]. Furthermore, the use of biomass and char as alternative energy carriers in the industry is growing as a result of the depletion of fossil energy. Biomass can be converted into heat and electrical power through several methods, where the easiest one is the direct combustion via a steam turbine dedicated to power production. At present, biomass is already used in several processes for heat and power production [2]. Different criteria have been used in the literature to compare the performance of biomass combustion power generation. Among these criteria, the more important are: The capacity of power production [3], the technology used [4], and the composition of biomass [2]. Also, other classifications can be addressed when comparing pollution generated by the combustion of biomass. Indeed, this last one is becoming more important due to global warming [5].
The contribution of biomass sources in global electricity generation from renewable energy in 2014 was about 7.24% [1]. This contribution can be made directly by the combustion of biomass or one of its derivatives. There are three main pseudo-components that constitute biomass, namely hemicellulose, cellulose, and lignin. Hemicellulose constitutes 16 to 23 wt%, cellulose between 42 and 49 wt%, while lignin represents 21 to 39 wt% of the biomass [6]. These last three can be thermochemically valorized in several ways. Indeed, the pyrolysis of pseudo-components has already been studied in the literature [7], and the interaction between these three polymers during pyrolysis has also been investigated [8]. Moreover, the gasification of these pseudo-components has been examined at different temperatures [9] and using supercritical water conditions [10]. The effect of cellulose and lignin content on the combustion has also been highlighted in the literature [11].
Lignin, which is generally considered as a chemically non-recoverable residue, is usually burned to generate the power and heat required for biomass treatment operations in simultaneous saccharification and co-fermentation processes [12]. According to life-cycle assessments conducted by Daylan and Ciliz [13], the heat generated by the combustion of the residual lignin satisfied and ensured the necessary heat and power needed during the process of ethanol production from lignocellulosic biomass. On the other hand, in the gasification process of biomass, it is the char produced by the process which is burned to provide the heat needed by the pyrolysis and the gasification processes [14]. In the fast internally circulating fluidized bed used for biomass gasification, the residual char from the pyrolysis and gasification processes is burnt in a separate reactor to ensure a major part of the heat required for the pyrolysis and the gasification reactions [15].
Now, the design and the scale-up of combustors require several details concerning the reactivity of the solid fuel to be used [16]. Guizani et al. [17] showed that the pyrolysis temperature of biomass, during the production of char, affected the structure and the reactivity of produced char in a considerable manner. Also, the behavior of biomass cannot be condensed to that of one single pseudo-component because of the chemical and physical alterations caused by the use of acids and bases during the separation of the different pseudo-components [18]. Indeed, the knowledge of the reaction kinetics of the solid fuel is essential to correctly design the reactor for the combustion reaction. Also, the more the solid fuel is burnt at a low temperature and a high conversion rate, the shorter the burnout time is; in other words, the reactivity of the substance is higher [19]. Hence, the most reactive substance is the one which shows the highest rate of consumption at the lowest temperature on one hand, and the lowest activation energy on the other. In literature, several authors evaluated the reactivity of substances from thermogravimetric (TG) curves based on; (i) the ignition temperature [20]; (ii) the maximum rate of mass loss [21]; (iii) the activation energy [22]; or (iv) a combination of different parameters from the TG curves [19]. Indeed, El may et al. [19] estimated the reactivity of different substances as the ratio of the maximum rate of mass loss to maximum temperature. In their case, they did not distinguish between the different stages of the reaction. Haykırı-Açma et al. [23] reported that the most important characteristic temperatures of the combustion reaction were the ignition temperature and the maximum temperature, which corresponded to the maximum consumption rate. Other researchers have compared the TG combustion profiles of different chars obtained from biomass pyrolysis and coal [22] and found that biomass chars, based essentially on the maximum temperature, were more reactive than coal and lignite. According to the latter paper, it seemed that the activation energy had less influence on the reactivity compared to the maximum temperature. In this context, a deeper analysis appears to be necessary to better understand the relationship between the different parameters cited above.
Solid fuel combustion has widely been studied in the literature. However, to the best of our knowledge, the combustion characteristics of cellulose, hemicellulose, lignin, and their chars have not been deeply examined. In addition, the synergistic effect of the pseudo-components during the combustion reaction has not been previously discussed. Consequently, the effect of the heating rates and the sample structure may affect not only the rate of combustion, but also important characteristics such as ignition and final temperatures.
The aim of this work is to determine various parameters associated with the combustion reaction (kinetic parameters, burnout time, ignition temperature, final temperature, and maximum rate of consumption) using thermogravimetric analysis (TGA). The raw materials considered in this study are beech wood, flax shives, cellulose, hemicellulose, lignin, and their respective chars. Also, in this paper, the relationship between the different determined parameters of the combustion reaction of biomasses and the pure pseudo-components has been discussed in order to better compare the reactivity of the substances with each other. The availability of such data for kinetic and thermal parameters allows an appropriate design of biomass and char combustor.
2. Materials and Methods
2.1. Raw Materials
“ETS Lignex” and “La Coopérative Terre de Lin” companies provided respectively the beech wood and the flax shives used for this study. Beechwood has been chosen in order to compare our results with the literature, while flax shives have been chosen due to their availability in Europe which represents about 85% of the world’s production of scutched flax fibers [24]. The pseudo-components employed were used in their pure form: Microcrystalline cellulose was provided from Merck (Kenilworth, NJ, USA, Ref. 1.02330.0500-500G), hemicellulose was provided from Tokyo Chemical Company Co. Ltd. (Tokyo, Japan, Ref: X0078-100G) and lignin was provided from Sigma-Aldrich (St. Louis, MO, USA, Ref: 471003-100G). All samples were sieved with a diameter of less than 40 micrometers (μm) in order to limit the effects of heat and mass transfer as recommended in [25].
2.2. Char
A fixed-bed reactor was used to prepare the char of the five raw materials by pyrolysis. The pyrolysis was ensured at 850 °C during 2 h under a pure nitrogen flow of 500 mL·min−1. Afterward, the samples were cooled down under nitrogen to room temperature. The device was already described in a previous work [26]. Experiments were carried out at atmospheric pressure. The proximate and ultimate analyses of the raw material before and after pyrolysis are given in Table 1 and Table 2, respectively. The ultimate composition of different raw materials was performed using the CHN elemental analyzer, while the proximate composition was determined based on TG analysis [27]. Low heating value (LHV) of different raw materials were calculated according to Channiwala’s correlation [28].

Table 1.
Ultimate and proximate characterization of raw materials.
Table 2.
Ultimate and proximate characterization of char samples.
2.3. Thermogravimetric Experiments
TGA is one of the most frequently used techniques for solid characterization in an inert or oxidative atmosphere [29,30]. In this work, experiments were performed using a TG SDT Q600-TA instruments analyzer (TA Instruments, New Castle, DE, USA). Pure synthesized air constituting of 21 vol% of oxygen and 79 vol% of nitrogen was used as oxidative gas with a flow rate of 50 mL·min−1. The mass of the sample used in the crucible was 6.5 ± 0.2 mg for all samples. The sample was introduced at room temperature and atmospheric pressure. In this work, experiments were performed under non-isothermal conditions at different heating rates: 10, 20, 30 and 40 °C·min−1. TG experiments were repeated three times for each heating rate to improve the accuracy of the results.
2.4. Kinetic Modelling
Several non-isothermal methods have been reported in the literature to determine the apparent kinetics of the biomass and char combustion reactions from the TG mass loss profiles. The kinetic parameters determined by thermogravimetric measurements are very sensitive to the calculation methods used [19,31]. Therefore, their determination in this study was carried out using the Coats-Redfern method by taking into consideration two different models proposed in the literature [32,33]. Indeed, the Coats-Redfern method is considered the best approach for the determination of kinetic parameters for a combustion reaction [21,34,35,36]. On the other hand and in contrast to other isoconversional methods, the Coats-Redfern method may integrate some particular models that take into account the effect of boundary and diffusion control [21,37].
The conversion rate, X, was calculated based on the variation of the mass loss of the sample, as follows:
where mi and mf are the initial and the final masses, respectively.
The reaction rate can be expressed by the following relation:
where k(T) is the rate constant and is defined as:
where A is the pre-exponential factor, Ea the apparent activation energy, R the ideal gas constant and f(X) is the kinetic model used for solids conversion.
The final form of the decomposition kinetics of biomass was written as follows:
The rearrangement of the relation (4) gave rise to the Equation (5), as follows:
where β is the heating rate and is defined as:
The integration of the relation (5) gave the following relation:
where g is the integral function of conversion [21,37]. By using the Coats-Redfern method [38], the relation (7) became:
The analytic integration of this relation is essentially governed by the form of the function “g” and the order of the reaction considered, as already detailed in articles of interest in the literature [21,39].
3. Results and Discussion
3.1. Thermogravimetric and Differential Thermogravimetic (DTG) Characteristic Curves
The combustion of cellulose, hemicellulose, lignin, beech wood, flax shives, and their chars was studied under the same experimental conditions and for different heating rates. Figure 1 and Figure 2 show the evolution of TG and DTG curves for the combustion reaction with temperature. This study was carried out over temperatures ranging from 25 °C to 1000 °C. The mean deviation was calculated based on the reproducibility of the experiments and was found to be between 2.68 and 5.53%. The deviation was more pronounced at high temperatures, probably due to the very low mass in the crucible. Humidity evaporation was observed between ambient temperature and 150 °C, as already mentioned in previous works [19,31].
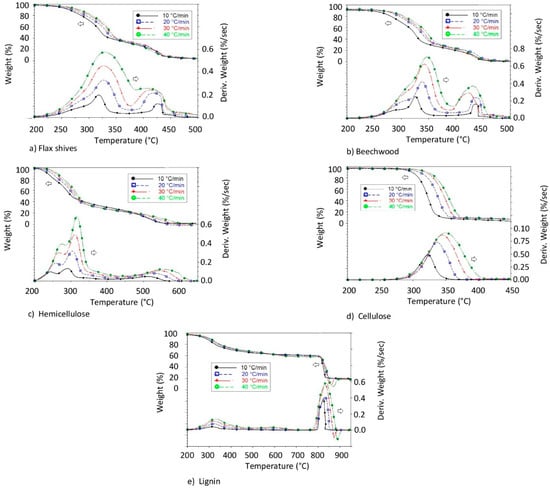
Figure 1.
Mass loss and conversion rate of different raw materials combustion.
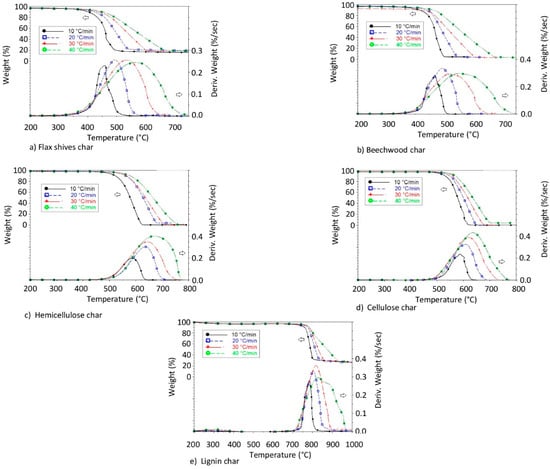
Figure 2.
Mass loss and conversion rate of different char samples.
3.1.1. Raw Materials Combustion
Figure 1 shows the TG and DTG curves of the combustion of flax shives, beech wood, hemicellulose, cellulose, and lignin. As illustrated in this figure, the raw materials were completely consumed at 550 °C, except for lignin, which required a temperature in the vicinity of 850 °C. Based on the curves of Figure 1, it can be seen that the raw materials exhibited more than one stage, unlike char, which showed a unique stage in Figure 2. Despite the difference in the composition of beech wood and flax shives, see Table 1 for details, the two biomasses typically had the same behavior, with only a slightly higher reactivity for beech wood. Indeed, the biomass DTG showed the existence of two peaks—the first peak appeared in the interval from 225 to 375 °C, and the second peak from 375 to 450 °C. This indicated the existence of at least two steps, depending on the combustion mechanism.
The combustion of hemicellulose showed the presence of three peaks, two of them were completely overlapping as seen in Figure 1c. This could be explained by the heterogeneity of hemicellulose, which is majorly constituted of xylose along with a small part of glucuronic acid and other sugars.
As seen in Figure 1d, the combustion of pure cellulose showed only one peak. Indeed, this can be explained by the occurrence of only the combustion of the volatile fraction of cellulose; note the low fixed carbon content (about 3.74%) of cellulose may be the reason the peak of combustion for the latter was not detected.
The lignin combustion showed a different behavior compared to those previously, as shown in Figure 1e. Indeed, the combustion of lignin showed the existence of two independent stages. The first stage was located at low temperature, between 200 and 450 °C, while the second was located at high temperature, between 800 and 900 °C. Also, the second stage of the combustion reaction might be accompanied by the decomposition of calcium carbonates, which happens at high temperature [22,40]. Zhou et al. [41] observed the same behavior for the pyrolysis of lignin. Surprisingly, we did not see this behavior with both biomasses, although some experiments have been carried out up to 1200 °C. Indeed, after 500 °C, the mass loss of the sample was almost negligible. This could probably be explained by the fact that the combustion of char (the second stage in Figure 1e) from pure lignin was different from the behavior of char from biomass. Pure lignin has a complex and branched structure compared to cellulose and hemicellulose. Also, significant interactions have been reported in the literature between cellulose and lignin during their pyrolysis [8,9], which can modify the global structure of char.
3.1.2. Char Combustion
DTG curves of the different bio-char samples demonstrated only one single stage, as shown in Figure 2. This was explained by the existence of only one uniform structure in each char used. However, every char (from cellulose, hemicellulose, lignin, and biomasses) showed different behaviors when compared to one another, as shown in Figure 2. Indeed, the chars produced from pure pseudo-components did not have the same properties as the ones produced from biomass. This has already been observed in the literature, where some DTG curves of biomass samples showed one or two stages [22]. Probably, this can be explained by the importance of lignin in the biomass samples.
In some works in the literature, two DTG peaks can be observed during the combustion of char from biomass, more particularly in cases where the pyrolysis temperature of the biomass is less than 600 °C. This can be explained by the combustion of residual unconverted biomass [17].
3.2. Thermal Analysis
The DTG curves allowed the determination of various parameters related to the combustion reaction, as shown in Figure 3. These parameters were determined and are discussed in the following sections. The evolution of these parameters with the heating rate obtained from the DTG curves has been summarized in Tables S1 and S2 of the supplementary materials.
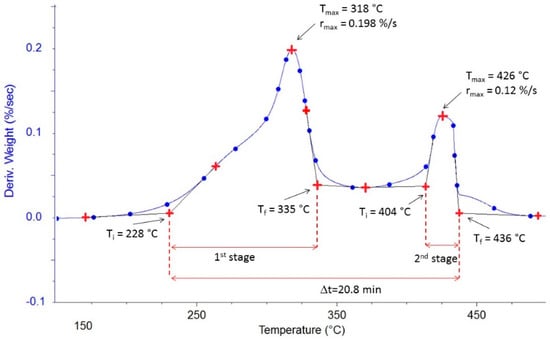
Figure 3.
Example of the graphical determination of thermal parameters (for Flax shives with β = 10 °C·min−1).
3.2.1. Ignition and Final Temperatures of Combustion Reaction
The ignition temperature (Ti) is the temperature at which the combustion reaction begins, while the final temperature (Tf) indicates the end of the combustion reaction. These temperatures are essential to ensure the perfect design of the combustor and avoid unburned solid fuel at the outlet of the reactor [22]. It should be noted that Ti is also used to compare the reactivity of several substances [19,20,21,22,23,42,43,44]. Several methods have been reported and used in the literature to determine Ti and Tf [32,45,46,47,48]. In this work, Ti and Tf have been determined according to the work of Grønli et al. [46], which was based on the use of the second derivative of the mass loss curves. Table 3 and Table 4 show the evolution of Ti and Tf during the combustion reaction for different raw materials over a heating rate of 10 °C·min−1. Hemicellulose presented the lowest Ti, followed by lignin and biomasses, while cellulose demonstrated the highest Ti. At the end of the first stage, hemicellulose displayed the lowest Tf, while biomasses and cellulose presented almost the same Tf. Furthermore, the Tf of lignin was the highest. In the second stage of combustion, the Ti of the biomasses and hemicellulose remained close to each other. However, the Ti of lignin remained higher.
Table 3.
Characteristics of the combustion stages of raw materials (β = 10 °C·min−1).
Table 4.
Characteristics of the combustion of char samples (β = 10 °C·min−1).
The Ti of the char from raw materials had approximately the same behavior. These temperatures remained higher compared to the biomasses and the pure pseudo-components. Also, hemicellulose and cellulose chars showed almost the same Ti and Tf. As for lignin combustion, the char from lignin showed the highest Ti and Tf.
3.2.2. Burnout Time
The burnout time (tR) is defined as the time between the Ti and the Tf. In this work, the tR has been calculated taking into account the entire reaction interval through the two stages. Overall, tR of the combustion of beech wood and flax shives was almost the same. Hemicellulose was the first to burn, and it took more time than the biomasses. The lignin tR was the longest, since the second stage of its combustion needed a higher temperature. The cellulose tR was not significant, since the second stage was not visible. The tR of char samples has been shown in Table 4. The same trend as for the tR of the raw materials was not obtained. Indeed, it seems that the char produced by holocellulose compounds required more time than chars from beech wood, flax shives, and lignin.
3.2.3. Maximum Temperature
The maximum temperature (Tmax) is defined as the temperature where the maximum reaction rate (dX/dt) occurs. This temperature is a very important criterion for evaluating the reactivity of substances [19,20,21,22,23,42,43,44]. Indeed, the lower the Tmax, the higher the reactivity of the substance. According to Table 3, hemicellulose was the most reactive substance. The Tmax for flax shives, beech wood, hemicellulose, and cellulose were very similar. As for the char samples, the ones produced from biomass pyrolysis remained the most reactive, while the lignin char proved to be the least reactive, as shown in Table 4. Also, the chars of cellulose and hemicellulose showed almost the same behavior.
3.2.4. Maximum Rate
Maximum rate (rmax) is also usually considered as a criterion to classify the reactivity of substances [19,22]. Indeed, the higher the rmax and the lower the Tmax, the more reactive the substance. The maximum reactivity of the different raw materials and char samples are shown in Table 3 and Table 4, respectively. In the first stage, the most reactive raw material was cellulose. However, for the second stage, lignin appeared to be the most reactive at high temperatures.
As shown in Figure 1, these parameters, cited above, evolved by increasing the heating rate, more particularly in the first stage of the combustion of raw materials and char. However, the effect of heating rate was more pronounced on rmax than on other parameters.
3.3. Principal Component Analysis
As shown above, the reactivity classification of different substances varied from one criterion to the other. The results were examined using the principal component analysis (PCA), which checks the global behavior of the different raw materials, taking into account the different criteria discussed above. Figure 4 shows the PCA for the first and the second stage of combustion of the raw materials.
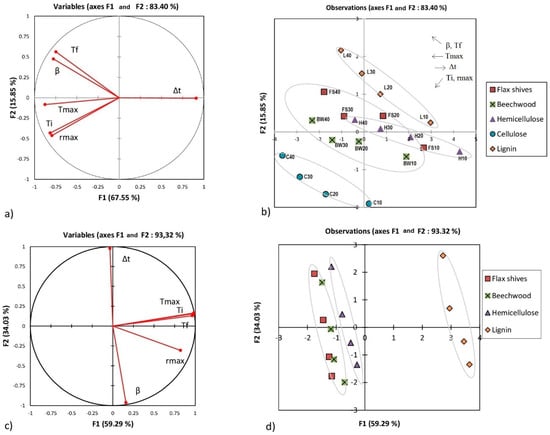
Figure 4.
Principal component analysis (PCA) for raw materials: (a,b) represent the first stage combustion; (c,d) represent the second stage combustion.
PCA is a multivariate technique used in data processing usually presented in a table containing variables and observations. PCA has the goal to detect the existence of similarities or inter-correlation between variables, based on the treatment of observations. PCA is represented by only one orthogonal variable called principal components F1 and F2. In this study, PCA was used to analyze the behavior of raw materials and char based on the different thermal parameters discussed above [49,50].
PCA is a graphical representation of a cloud of points initially drawn in a multidimensional space. The number of dimensions in our case represents the number of axes or variables in this space, and it corresponds to six (Ti, Tmax, Tf, β, Δt, and rmax). In order to facilitate the analysis of the existence of any correlation between each of two variables separately, a projection of this cloud in an orthogonal space (F1 and F2) is created, as previously specified. Often, these two axes have no physical meaning, however, they ensure the maximum recovery of information from the projection of the cloud of points. Obviously, a bad projection of a variable on this new space may not be representative, and therefore, the information about this variable is deformed. The conclusions drawn in this case may not have a physical meaning. The closer the segment representing this variable is to the radius of the circle in Figure 4a (segment in red), the better the parameter is represented in this new space. In this study, overall, all parameters were well represented, as shown in Figure 4 and Figure 5.
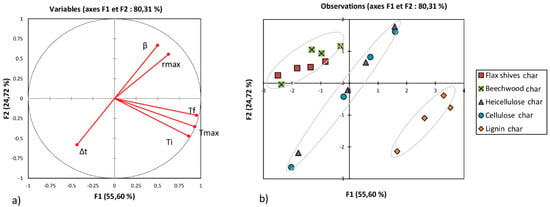
Figure 5.
Principal component analysis (PCA) for char samples: (a) Correlation between variables; (b) Effect of heating rate on different variables.
Figure 4a analyses the existence of a possible linear correlation between the different parameters considered in this study. The correlation coefficient between each two parameters is calculated from the cosine of the angle formed between these two parameters shown by segments in Figure 4a. Tables S3, S4, and S5 detail the values of these correlation coefficients. For example, Figure 4a shows that the cosine of the angle formed by Ti and Tmax was about 0.798. Also, Ti and Tmax showed a positive correlation given that they were in the same direction (the same remark can be made for Tf and β in Figure 4a). This means that an increase in Ti implies an increase in Tmax. A negative correlation can be shown when the correlation coefficient tends to negative values; this means that the two variables show an opposite trend. Δt and Tmax in Figure 4a illustrate a negative trend.
The set of four points delimited in Figure 4b for each sample represents the evolution of the different parameters (Ti, Tf, Tmax, rmax, and Δt) with the heating rate (10, 20, 30, and 40 °C·min−1) (the evolution of the temperature Tf with the heating rate is shown in Figure 4b, as an example).
According to PCA, some qualitative conclusions can be addressed, as follows:
- Regarding the first stage of raw materials combustion:
- -
- A strong positive dependence between Ti, Tmax, and rmax.
- -
- A strong positive dependence between β and Tf.
- -
- Opposite evolution between Δt and the rest of the parameters.
- -
- Overall, there is no dependence between Ti, Tmax, and rmax.
- Regarding the second stage of raw materials combustion:
- -
- A clear opposite trend between Δt and β.
- -
- Δt and β seemed to be unrelated to Ti, Tf, Tmax, and rmax during this stage.
- -
- A strong positive dependence between Ti, Tmax, and Tf.
- Regarding the combustion of chars:
- -
- A strong positive dependence between Ti, Tmax, and Tf.
- -
- A strong positive dependence between β and rmax.
- -
- Surprisingly, no characteristic temperature seemed dependent on β.
As shown in Figure 4b, flax shives and beech wood exhibited behavior closest to the hemicellulose (overlapped segments), out of the three pseudo-components. Lignin was less reactive and took more time to be completely consumed. The Figure 5b shows that the chars produced from beech wood and flax shives were more reactive than the chars from pseudo-components. Also, the char from holocellulose was more reactive than that from lignin. This analysis also showed that the cellulose, hemicellulose, and lignin contents can modify the co-combustion of pseudo-component/biomass or pseudo-component/char blend. Indeed, in the case of a cellulose/biomass blend, an increase in Tmax and rmax can be expected; while increasing the lignin content can reduce Tmax and rm.
3.4. Mechanism and Kinetic Parameters of Combustion
3.4.1. Mechanism
Usually, the mechanism of biomass combustion is composed of two stages, as shown in Figure 1. Some authors reported that the first stage illustrated the combustion of the holocellulose component, while the second stage concerned the combustion of lignin according to mechanism 1 [20,34].
Mechanism 1
Holocellulose + O2 → Ash + CO2 + H2O
Lignin + O2 → Ash + CO2 + H2O
Other authors reported that the mechanism of combustion followed the combustion of volatile matter (1st stage) and then fixed carbon (2nd stage), according to mechanism 2 [21,51,52].
Mechanism 2
Volatiles + O2 → Ash + CO2 + H2O
Char + O2 → Ash + CO2 + H2O
In light of the results shown above, it seems that both hemicellulose and lignin showed two independent stages. Therefore, the first stage is explained by the combustion of volatile matter derived from the pyrolysis of biomass, while the second stage can be explained by the combustion of residual char produced in the first stage. Cellulose showed only one stage given its low fixed carbon content, as shown in Table 1 (3.75 wt%). Moreover, the second stage of combustion of hemicellulose and lignin corresponded approximately to the same stage of combustion of char produced by hemicellulose and lignin pyrolyzed in the fixed-bed reactor. This observation favored the plausibility of the second mechanism.
In some works in the literature, the reactivity of substances was classified according to the activation energy of their combustion reaction [20]. Therefore, in our case, the activation energy for the combustion reaction was determined for different materials. The combustion of different raw materials was successfully modeled by using two independent reactions (Mechanism 2), with the exception of cellulose (which was modeled using one single reaction, given its low fixed carbon content, as discussed above). The combustion of char samples was modeled assuming one single reaction, according to the DTG curves, see Figure 2.
3.4.2. Kinetic Parameters
The plot of ln|g(X)/T²| of relation (8) versus 1/T gave a straight line with a slope of −Ea/R. Relation (8) was applied in the range of temperatures between Ti and Tf of each combustion stage for different heating rates. The term 2RT/Ea can be neglected (compared to 1 in this case) [37]. The Ea was calculated from the slope of relation (8), while A was calculated from the y-intercept. Since this relation was supposed to be independent of the heating rate, the Ea and A were calculated as average values based on the four heating rates.
Several models that take into account the effect of boundary and diffusion control have been tested in order to establish the linearity of relation (8) [21,53,54]. Indeed, flax shives, beech wood, cellulose, lignin, and their char samples followed the first-order kinetics model according to model 1 (relation (9)). The first order is usually considered for combustion reactions [55,56,57,58]. The latter model has been the most frequently used in literature and takes into account only the chemical reaction. However, the best fit for hemicellulose combustion was model 2 (relation (10)). In this model, the kinetics of the combustion reaction were fully controlled by the diffusion of oxygen inside the hemicellulose particles. The diffusion limitation has already been observed in the combustion of the pine samples as reported by [52].
Kinetic model function 1:
Kinetic model function 2:
The activation energy and the pre-exponential factor for different raw materials are shown in Table 5. A detailed table of kinetic parameters for the raw materials and the char samples has also been provided in Table S6 of the supplementary materials. The deviation of the regression on Ea and A reported in Table 5 has been calculated with respect to the different heating rates. Therefore, the variation in the value of Ea with the different heating rates can be explained by the experimental error on one hand, and, on the other, by the limitations of heat transfer, which tended to increase with high heating rates, as shown in Table S6.
Table 5.
Kinetic parameters of the combustion reaction of different raw materials.
The values of the activation energies shown in Table 5 were globally close to those found in the literature, see Table S7. However, some authors have found much lower values of activation energies for biomass combustion reactions, such as Senneca [59], Sahu et al. [60], and Kumar et al. [61]. For the activation energy of the char combustion, they were globally close to those found in the literature, as shown in Table S8.
Despite the different nature of flax shives and beech wood, their Ea remained similar to each other in the first stage (82.54 ± 2.49 and 99.26 ± 3.10 kJ·mol−1, respectively). Also, hemicellulose and cellulose showed Ea in the same range, with a slight elevation for cellulose (172.33 ± 15.14 and 212.21 ± 8.23 kJ·mol−1, respectively). However, cellulose and hemicellulose showed high Ea compared to the biomasses. Lignin had the lowest Ea in this stage (45.97 ± 0.82 kJ·mol−1). In the second stage, the Ea of both biomasses and those of the holocellulose components were mostly the same (between 66.08 ± 3.00 and 79.51 ± 1.90 kJ·mol−1); unlike lignin, which showed a high Ea in this stage (348.43 ± 15.57 kJ·mol−1) and reacted only at high temperatures.
The flax shives and beech wood char samples showed almost the same range of Ea (134.90 ± 22.32 and 151.68 ± 26.3 kJ·mol−1, respectively). The same remark for hemicellulose and cellulose can be made with respect to their Ea (180.32 ± 15.26 and 218.37 ± 7.11 kJ·mol−1, respectively). Lignin char showed the highest Ea (263.91 ± 32.49 kJ·mol−1) compared to other chars. This observation coincides with the PCA, shown in Figure 5. As reported by several authors, this can be explained by a porous and highly disordered carbon structure of lignin [22,62].
4. Conclusions
In this study, the combustion of flax shives, beech wood, pure pseudo-components, and their chars has been investigated based on TGA. During the combustion reaction, biomass (despite being essentially comprised of cellulose, hemicellulose, and lignin) exhibited a different behavior compared to its pure pseudo-components. This means that the physical interactions between the pure pseudo-components present in biomass cannot be neglected. It also demonstrated that biomass with a higher cellulose content showed faster conversion rates, higher hemicellulose contents in the biomass led to a lower Ti, and higher lignin content implied a higher Ea and a higher Tf. This study also confirmed that the combustion reaction of biomass could be modeled as two independent reactions. Indeed, the first reaction concerned the combustion of the volatile content, while the second corresponded to the combustion of the fixed carbon component. It is therefore important for the design of the combustor to take into account the substance limiting the process.
As this study showed, char produced from flax shives and beech wood had the same behavior both thermally and kinetically. Also, the same remark can be made for char produced from hemicellulose and cellulose. However, the char from lignin behaved differently from those from biomass and the holocellulosic pseudo-components.
Supplementary Materials
The following are available online at http://www.mdpi.com/1996-1073/11/8/2146/s1.
Author Contributions
The authors equally contributed to the work reported.
Acknowledgments
This work was supported by the European Union with the European regional development fund (ERDF) and by the Normandie Regional Council.
Conflicts of Interest
The authors declare no conflict of interest.
Nomenclature
| A | Pre-exponential factor (s−1) |
| dX/dt | The first derivative of conversion rate with respect to time |
| DTG | Differential thermogravimetry |
| Ea | Activation energy (kJ·mol−1) |
| mf | Final mass (kg) |
| mi | Initial mass (kg) |
| mt | Mass at temperature T (kg) |
| n | Reaction order (-) |
| R | Gas constant (8.314 J·K−1·mol−1) |
| R² | Correlation coefficient (-) |
| T | Temperature (K) |
| Tf | Final temperature (K) |
| TG | Thermogravimetry |
| TGA | Thermogravimetry analysis |
| Ti | Ignition temperature (K) |
| X | Conversion degree (-) |
| Greek symbols | |
| β | Heating rate (K·min−1) |
References
- International Energy Agency. Available online: http://www.iea.org/ (accessed on 23 March 2017).
- Nunes, L.J.R.; Matias, J.C.O.; Catalão, J.P.S. Biomass in the generation of electricity in Portugal: A review. Renew. Sustain. Energy Rev. 2017, 71, 373–378. [Google Scholar] [CrossRef]
- Jones, J.M.; Lea-Langton, A.R.; Ma, L.; Pourkashanian, M.; Williams, A. Combustion of Solid Biomass: Classification of Fuels. Pollutants Generated by the Combustion of Solid Biomass Fuels; Springer: London, UK, 2014; pp. 9–24. Available online: https://link.springer.com/chapter/10.1007/978-1-4471-6437-1_2 (accessed on 29 July 2018).
- van den Broek, R.; Faaij, A.; van Wijk, A. Biomass combustion for power generation. Biomass Bioenergy 1996, 11, 271–281. [Google Scholar] [CrossRef]
- Jones, J.M.; Lea-Langton, A.R.; Ma, L.; Pourkashanian, M.; Williams, A. Pollutants Generated by the Combustion of Solid Biomass Fuels; Springer: London, UK, 2014; Available online: https://www.springer.com/gb/book/9781447164364 (accessed on 29 July 2018).
- Sannigrahi, P.; Ragauskas, A.J.; Tuskan, G.A. Poplar as a feedstock for biofuels: A review of compositional characteristics. Biofuels Bioprod. Biorefin. 2010, 4, 209–226. [Google Scholar] [CrossRef]
- Scheer, A. Thermal Decomposition Mechanisms of Lignin Model Compounds: From Phenol to Vanillin. Physics Graduate Thesis & Dissertations. 2011. Available online: https://scholar.colorado.edu/phys_gradetds/55 (accessed on 15 August 2018).
- Yu, J.; Paterson, N.; Blamey, J.; Millan, M. Cellulose, xylan and lignin interactions during pyrolysis of lignocellulosic biomass. Fuel 2017, 191, 140–149. [Google Scholar] [CrossRef]
- Hosoya, T.; Kawamoto, H.; Saka, S. Cellulose–hemicellulose and cellulose–lignin interactions in wood pyrolysis at gasification temperature. J. Anal. Appl. Pyrolysis 2007, 80, 118–125. [Google Scholar] [CrossRef]
- Yoshida, T.; Matsumura, Y. Gasification of Cellulose, Xylan, and Lignin Mixtures in Supercritical Water. Ind. Eng. Chem. Res. 2001, 40, 5469–5474. [Google Scholar] [CrossRef]
- Gani, A.; Naruse, I. Effect of cellulose and lignin content on pyrolysis and combustion characteristics for several types of biomass. Renew. Energy 2007, 32, 649–661. [Google Scholar] [CrossRef]
- González-García, S.; Luo, L.; Moreira, M.T.; Feijoo, G.; Huppes, G. Life cycle assessment of flax shives derived second generation ethanol fueled automobiles in Spain. Renew. Sustain. Energy Rev. 2009, 13, 1922–1933. [Google Scholar] [CrossRef]
- Daylan, B.; Ciliz, N. Life cycle assessment and environmental life cycle costing analysis of lignocellulosic bioethanol as an alternative transportation fuel. Renew. Energy 2016, 89, 578–587. [Google Scholar] [CrossRef]
- Rajabi Hamedani, S.; Villarini, M.; Colantoni, A.; Moretti, M.; Bocci, E. Life Cycle Performance of Hydrogen Production via Agro-Industrial Residue Gasification—A Small Scale Power Plant Study. Energies 2018, 11, 675. [Google Scholar] [CrossRef]
- Gassner, M.; Maréchal, F. Thermodynamic comparison of the FICFB and Viking gasification concepts. Energy 2009, 34, 1744–1753. [Google Scholar] [CrossRef]
- Qian, K.; Kumar, A.; Patil, K.; Bellmer, D.; Wang, D.; Yuan, W.; Huhnke, R.L. Effects of Biomass Feedstocks and Gasification Conditions on the Physiochemical Properties of Char. Energies 2013, 6, 3972–3986. [Google Scholar] [CrossRef]
- Guizani, C.; Jeguirim, M.; Valin, S.; Limousy, L.; Salvador, S. Biomass Chars: The Effects of Pyrolysis Conditions on Their Morphology, Structure, Chemical Properties and Reactivity. Energies 2017, 10, 796. [Google Scholar]
- Di Blasi, C. Modeling chemical and physical processes of wood and biomass pyrolysis. Prog. Energy Combust. Sci. 2008, 34, 47–90. [Google Scholar] [CrossRef]
- El may, Y.; Jeguirim, M.; Dorge, S.; Trouvé, G.; Said, R. Study on the thermal behavior of different date palm residues: Characterization and devolatilization kinetics under inert and oxidative atmospheres. Energy 2012, 44, 702–709. [Google Scholar] [CrossRef]
- Garcia Torrent, J.; Fernandez Anez, N.; Medic Pejic, L.; Montenegro Mateos, L. Assessment of self-ignition risks of solid biofuels by thermal analysis. Fuel 2015, 143, 484–491. [Google Scholar] [CrossRef]
- Gil, M.V.; Casal, D.; Pevida, C.; Pis, J.J.; Rubiera, F. Thermal behaviour and kinetics of coal/biomass blends during co-combustion. Bioresour. Technol. 2010, 101, 5601–5608. [Google Scholar] [CrossRef] [PubMed]
- Kastanaki, E.; Vamvuka, D. A comparative reactivity and kinetic study on the combustion of coal–biomass char blends. Fuel 2006, 85, 1186–1193. [Google Scholar] [CrossRef]
- Haykırı-Açma, H. Combustion characteristics of different biomass materials. Energy Convers. Manag. 2003, 44, 155–162. [Google Scholar] [CrossRef]
- Le Lin et le Chanvre Européen. Available online: http://www.europeanflax.com/ (accessed on 18 July 2018).
- Van de Velden, M.; Baeyens, J.; Brems, A.; Janssens, B.; Dewil, R. Fundamentals, kinetics and endothermicity of the biomass pyrolysis reaction. Renew. Energy 2010, 35, 232–242. [Google Scholar] [CrossRef]
- Mohabeer, C.; Abdelouahed, L.; Marcotte, S.; Taouk, B. Comparative analysis of pyrolytic liquid products of beech wood, flax shives and woody biomass components. J. Anal. Appl. Pyrolysis 2017, 127, 269–277. [Google Scholar] [CrossRef]
- García, R.; Pizarro, C.; Lavín, A.G.; Bueno, J.L. Biomass proximate analysis using thermogravimetry. Bioresour. Technol. 2013, 139, 1–4. [Google Scholar] [CrossRef] [PubMed]
- Channiwala, S.A.; Parikh, P.P. A unified correlation for estimating HHV of solid, liquid and gaseous fuels. Fuel 2002, 81, 1051–1063. [Google Scholar] [CrossRef]
- Magdziarz, A.; Wilk, M.; Straka, R. Combustion process of torrefied wood biomass. J. Therm. Anal. Calorim. 2017, 127, 1339–1349. [Google Scholar] [CrossRef]
- Nowak, B.; Karlström, O.; Backman, P.; Brink, A.; Zevenhoven, M.; Voglsam, S.; Winter, F.; Hupa, M. Mass transfer limitation in thermogravimetry of biomass gasification. J. Therm. Anal. Calorim. 2012, 111, 183–192. [Google Scholar] [CrossRef]
- Abdelouahed, L.; Leveneur, S.; Vernieres-Hassimi, L.; Balland, L.; Taouk, B. Comparative investigation for the determination of kinetic parameters for biomass pyrolysis by thermogravimetric analysis. J. Therm. Anal. Calorim. 2017, 129, 1201–1213. [Google Scholar] [CrossRef]
- Wang, Z.; Lin, W.; Song, W.; Wu, X. Pyrolysis of the lignocellulose fermentation residue by fixed-bed micro reactor. Energy 2012, 43, 301–305. [Google Scholar] [CrossRef]
- White, J.E.; Catallo, W.J.; Legendre, B.L. Biomass pyrolysis kinetics: A comparative critical review with relevant agricultural residue case studies. J. Anal. Appl. Pyrolysis 2011, 91, 1–33. [Google Scholar] [CrossRef]
- Álvarez, A.; Pizarro, C.; García, R.; Bueno, J.L.; Lavín, A.G. Determination of kinetic parameters for biomass combustion. Bioresour. Technol. 2016, 216, 36–43. [Google Scholar] [CrossRef] [PubMed]
- Garcia-Maraver, A.; Perez-Jimenez, J.A.; Serrano-Bernardo, F.; Zamorano, M. Determination and comparison of combustion kinetics parameters of agricultural biomass from olive trees. Renew. Energy 2015, 83, 897–904. [Google Scholar] [CrossRef]
- Yorulmaz, S.Y.; Atimtay, A. Investigation of Combustion Kinetics of Five Waste Wood Samples with Thermogravimetric Analysis. In Survival and Sustainability; Springer: Berlin/Heidelberg, Germany, 2010; p. 511. Available online: https://link.springer.com/chapter/10.1007/978-3-540-95991-5_46 (accessed on 5 July 2017).
- Islam, M.A.; Auta, M.; Kabir, G.; Hameed, B.H. A thermogravimetric analysis of the combustion kinetics of karanja (Pongamia pinnata) fruit hulls char. Bioresour. Technol. 2016, 200, 335–341. [Google Scholar] [CrossRef] [PubMed]
- Coats, A.W.; Redfern, J.P. Kinetic Parameters from Thermogravimetric Data. Nature 1964, 201, 68–69. [Google Scholar] [CrossRef]
- Damartzis, T.; Vamvuka, D.; Sfakiotakis, S.; Zabaniotou, A. Thermal degradation studies and kinetic modeling of cardoon (Cynara cardunculus) pyrolysis using thermogravimetric analysis (TGA). Bioresour. Technol. 2011, 102, 6230–6238. [Google Scholar] [CrossRef] [PubMed]
- Vamvuka, D.; Kastanaki, E.; Lasithiotakis, M. Devolatilization and Combustion Kinetics of Low-Rank Coal Blends from Dynamic Measurements. Ind. Eng. Chem. Res. 2003, 42, 4732–4740. [Google Scholar] [CrossRef]
- Zhou, H.; Long, Y.; Meng, A.; Chen, S.; Li, Q.; Zhang, Y. A novel method for kinetics analysis of pyrolysis of hemicellulose, cellulose, and lignin in TGA and macro-TGA. RSC Adv. 2015, 5, 26509–26516. [Google Scholar] [CrossRef]
- Jiang, L.; Yuan, X.; Li, H.; Xiao, Z.; Liang, J.; Wang, H.; Wu, Z.; Chen, X.; Zeng, G. Pyrolysis and combustion kinetics of sludge–camphor pellet thermal decomposition using thermogravimetric analysis. Energy Convers. Manag. 2015, 106, 282–289. [Google Scholar] [CrossRef]
- Munir, S.; Daood, S.S.; Nimmo, W.; Cunliffe, A.M.; Gibbs, B.M. Thermal analysis and devolatilization kinetics of cotton stalk, sugar cane bagasse and shea meal under nitrogen and air atmospheres. Bioresour Technol. 2009, 100, 1413–1418. [Google Scholar] [CrossRef] [PubMed]
- Sait, H.H.; Hussain, A.; Salema, A.A.; Ani, F.N. Pyrolysis and combustion kinetics of date palm biomass using thermogravimetric analysis. Bioresour. Technol. 2012, 118, 382–389. [Google Scholar] [CrossRef] [PubMed]
- Gai, C.; Liu, Z.; Han, G.; Peng, N.; Fan, A. Combustion behavior and kinetics of low-lipid microalgae via thermogravimetric analysis. Bioresour. Technol. 2015, 181, 148–154. [Google Scholar] [CrossRef] [PubMed]
- Grønli, M.G.; Varhegyi, G.; Di Blasi, C. Thermogravimetric analysis and devolatilization kinetics of wood. Ind. Eng. Chem. Res. 2002, 41, 4201–4208. [Google Scholar] [CrossRef]
- Li, Q.; Zhao, C.; Chen, X.; Wu, W.; Li, Y. Comparison of pulverized coal combustion in air and in O2/CO2 mixtures by thermo-gravimetric analysis. J. Anal. Appl. Pyrolysis 2009, 85, 521–528. [Google Scholar] [CrossRef]
- Meng, F.; Yu, J.; Tahmasebi, A.; Han, Y. Pyrolysis and Combustion Behavior of Coal Gangue in O2/CO2 and O2/N2 Mixtures Using Thermogravimetric Analysis and a Drop Tube Furnace. Energy Fuels 2013, 27, 2923–2932. [Google Scholar] [CrossRef]
- Principal Component Analysis–Abdi–2010–Wiley Interdisciplinary Reviews: Computational Statistics–Wiley Online Library. Available online: https://onlinelibrary.wiley.com/doi/abs/10.1002/wics.101 (accessed on 19 July 2018).
- Dunteman, G.H. Principal Components Analysis; SAGE: Newcastle upon Tyne, UK, 1989. [Google Scholar]
- Liu, N.A.; Fan, W.; Dobashi, R.; Huang, L. Kinetic modeling of thermal decomposition of natural cellulosic materials in air atmosphere. J. Anal. Appl. Pyrolysis 2002, 63, 303–325. [Google Scholar] [CrossRef]
- Yorulmaz, S.Y.; Atimtay, A.T. Investigation of combustion kinetics of treated and untreated waste wood samples with thermogravimetric analysis. Fuel Process. Technol. 2009, 90, 939–946. [Google Scholar] [CrossRef]
- Capart, R.; Khezami, L.; Burnham, A.K. Assessment of various kinetic models for the pyrolysis of a microgranular cellulose. Thermochim. Acta 2004, 417, 79–89. [Google Scholar] [CrossRef]
- Vyazovkin, S.; Burnham, A.K.; Criado, J.M.; Pérez-Maqueda, L.A.; Popescu, C.; Sbirrazzuoli, N. ICTAC Kinetics Committee recommendations for performing kinetic computations on thermal analysis data. Thermochim. Acta 2011, 520, 1–19. [Google Scholar] [CrossRef]
- Biagini, E.; Lippi, F.; Petarca, L.; Tognotti, L. Devolatilization rate of biomasses and coal–biomass blends: An experimental investigation. Fuel 2002, 81, 1041–1050. [Google Scholar] [CrossRef]
- Cai, J.; Wang, Y.; Zhou, L.; Huang, Q. Thermogravimetric analysis and kinetics of coal/plastic blends during co-pyrolysis in nitrogen atmosphere. Fuel Process. Technol. 2008, 89, 21–27. [Google Scholar] [CrossRef]
- Jayaraman, K.; Gökalp, I. Pyrolysis, combustion and gasification characteristics of miscanthus and sewage sludge. Energy Convers. Manag. 2015, 89, 83–91. [Google Scholar] [CrossRef]
- Su, W.; Ma, H.; Wang, Q.; Li, J.; Ma, J. Thermal behavior and gaseous emission analysis during co-combustion of ethanol fermentation residue from food waste and coal using TG–FTIR. J. Anal. Appl. Pyrolysis 2013, 99, 79–84. [Google Scholar] [CrossRef]
- Senneca, O. Kinetics of pyrolysis, combustion and gasification of three biomass fuels. Fuel Process. Technol. 2007, 88, 87–97. [Google Scholar] [CrossRef]
- Sahu, S.G.; Sarkar, P.; Chakraborty, N.; Adak, A.K. Thermogravimetric assessment of combustion characteristics of blends of a coal with different biomass chars. Fuel Process. Technol. 2010, 91, 369–378. [Google Scholar] [CrossRef]
- Kumar, A.; Wang, L.; Dzenis, Y.A.; Jones, D.D.; Hanna, M.A. Thermogravimetric characterization of corn stover as gasification and pyrolysis feedstock. Biomass Bioenergy 2008, 32, 460–467. [Google Scholar] [CrossRef]
- Hurt, R.; Sun, J.-K.; Lunden, M. A Kinetic Model of Carbon Burnout in Pulverized Coal Combustion. Combust. Flame 1998, 113, 181–197. [Google Scholar] [CrossRef]
© 2018 by the authors. Licensee MDPI, Basel, Switzerland. This article is an open access article distributed under the terms and conditions of the Creative Commons Attribution (CC BY) license (http://creativecommons.org/licenses/by/4.0/).