Article

Experimental Study of a Bubble Mode Absorption with an Inner Vapor Distributor in a Plate Heat Exchanger-Type Absorber with NH3-LiNO3

1
Facultad de Ingeniería, Universidad Autónoma de Campeche, Av. Agustín Melgar s/n Col, Buenavista 24030, Campeche, México
2
Instituto de Energías Renovables, Universidad Nacional Autónoma de México, Temixco 62580, Morelos, México
3
Centro de Investigación en Ingeniería y Ciencias Aplicadas, Universidad Autónoma del Estado de Morelos, Av. Universidad 1001, Cuernavaca 62209, México
*
Author to whom correspondence should be addressed.
Energies 2018, 11(8), 2137; https://doi.org/10.3390/en11082137
Submission received: 16 July 2018 / Revised: 7 August 2018 / Accepted: 10 August 2018 / Published: 16 August 2018
(This article belongs to the Special Issue Heat and Mass Transfer in Energy Systems)

Abstract

:
Absorption systems are a sustainable solution as solar driven air conditioning devices in places with warm climatic conditions, however, the reliability of these systems must be improved. The absorbing component has a significant effect on the cycle performance, as this process is complex and needs efficient heat exchangers. This paper presents an experimental study of a bubble mode absorption in a plate heat exchanger (PHE)-type absorber with NH3-LiNO3 using a vapor distributor in order to increase the mass transfer at solar cooling operating conditions. The vapor distributor had a diameter of 0.005 m with five perforations distributed uniformly along the tube. Experiments were carried out using a corrugated plate heat exchanger model NB51, with three channels, where the ammonia vapor was injected in a bubble mode into the solution in the central channel. The range of solution concentrations and mass flow rates of the dilute solution were from 35 to 50% weight and 11.69 to 35.46 × 10⁻³ kg·s−1, respectively. The mass flow rate of ammonia vapor was from 0.79 to 4.92 × 10⁻³ kg·s−1 and the mass flow rate of cooling water was fixed at 0.31 kg·s−1. The results achieved for the absorbed flux was 0.015 to 0.024 kg m−2·s−1 and the values obtained for the mass transfer coefficient were in the order of 0.036 to 0.059 m·s−1. The solution heat transfer coefficient values were obtained from 0.9 to 1.8 kW·m−2·K−1 under transition conditions and from 0.96 to 3.16 kW·m−2·K−1 at turbulent conditions. Nusselt number correlations were obtained based on experimental data during the absorption process with the NH3-LiNO3 working pair.

1. Introduction

The increasing awareness of global warming is inspiring the population to find better solutions to the problems related to the use of clean energy. For cooling needs, industries and residential sectors use mostly mechanical vapor compression refrigeration systems driven by electricity as well as conventional refrigerants. This field generates many opportunities for research on the use of alternatives energy sources friendly to the environment [1]. The opportunity arises to develop refrigeration systems that fit into the model of the three Es (energy, economy, and ecology) [2,3].
Recently, the demand for absorption refrigeration systems has increased mainly for small capacity (5 to 20 kW) units that can be driven by low and medium temperature heat sources such as waste heat, solar, geothermal or biomass. These thermal cooling systems are an attractive option in order to reduce electric power consumption.
The design of efficient heat exchangers is vital for absorption cooling systems to compete against compression systems, since they constitute the main and most expensive components [4]. The commercial absorption systems use working pairs such as NH3-H2O for cooling and freezing applications; however, this system has the need for an ammonia vapor rectification component that consequently produces a rise in cost and a reduction in the coefficient of performance. However, NH3-LiNO3 could be an alternative working mixture, since it has a better thermodynamic properties than NH3-H2O and a rectifier is not necessary [5,6,7]. The absorber is a critical component of the absorption system [8] due to the complex heat and mass transfer processes during the absorption of ammonia vapor in the dilute solution. The bubbling absorption mode has been proposed as a viable option with NH3-H2O [9,10,11,12,13], rather than the traditional falling film absorption systems because it not only provides high heat transfer coefficients but also provides good mixing between the vapor and the liquid. However, it requires of good vapor distribution, whilst falling film transfer requires an excellent liquid distribution [11].
Plate heat exchangers (PHEs) have been used as an absorber in bubble mode because the corrugation of the channels produces high turbulence values. Lee et al. [9] analyzed an absorber using a flat plate heat exchanger with ammonia-water; they concluded that the increase of solution flow rate slightly affected mass transfer, but improved heat transfer; besides the heat transfer was improved when the vapor flow rate was increased. The authors proposed experimental correlations for the Nusselt and Sherwood numbers.
Cerezo et al. [8] presented a mathematical model to analyze the bubble absorption process using a PHE. They carried out a comparative study using different mixtures as working fluids: NH3-H2O, NH3-NaSCN and NH3-LiNO3; the system was simulated at typical refrigeration operating conditions. The results showed that the mixtures NH3-H2O and NH3-NaSCN had greater absorption heat rates and ammonia vapor mass absorption compared to the mixture NH3-LiNO3. The low values obtained by the last mixture were mainly caused by the high viscosity of the solution, which decreased the absorption process. On the other hand, the NH3-LiNO3 mixture resulted with the highest COP values. Ayub [14] presented a study of available correlations for PHE´s in only one phase in a format that is easily used by engineers to design and analyze systems of this kind. Oronel et al. [15] presented in 2012 a study of NH3-LiNO3 absorption in the bubbling mode with a PHE with Chevron-L type corrugation (30° from the plate vertical axis) and using a simple tube as a gas distributor with an internal diameter of 1.7 mm. The results showed empirical relationships for the Nusselt and Sherwood numbers for the NH3-LiNO3 solutions. Best and Rivera [16] carried out an extensive review of the theoretical and experimental thermal cooling systems. In particular, systems at small and medium size capacities operating with water/lithium bromide, and ammonia/lithium nitrate.
This paper carries out an experimental evaluation of an absorber with a type L plate heat exchanger (PHE) with NH3-LiNO3 using a vapor distributor with five perforations located on the bottom side of the absorber in order to increase the mass transfer. According to the literature review performed for plate heat exchangers that operate as an absorber with the NH3-LiNO3 working pair, the mass transfer coefficients calculated in this work reached higher values than other studies. The modified plate exchanger with an inner gas distributor will be installed as an absorber within an absorption cooling system driven by solar energy. The results of this work are presented as a good engineering option: to incorporate an efficient absorber into a compact refrigeration system by means of NH3-LiNO3 absorption. These results are important for the absorption refrigeration research and development.

2. Description of the Experimental System

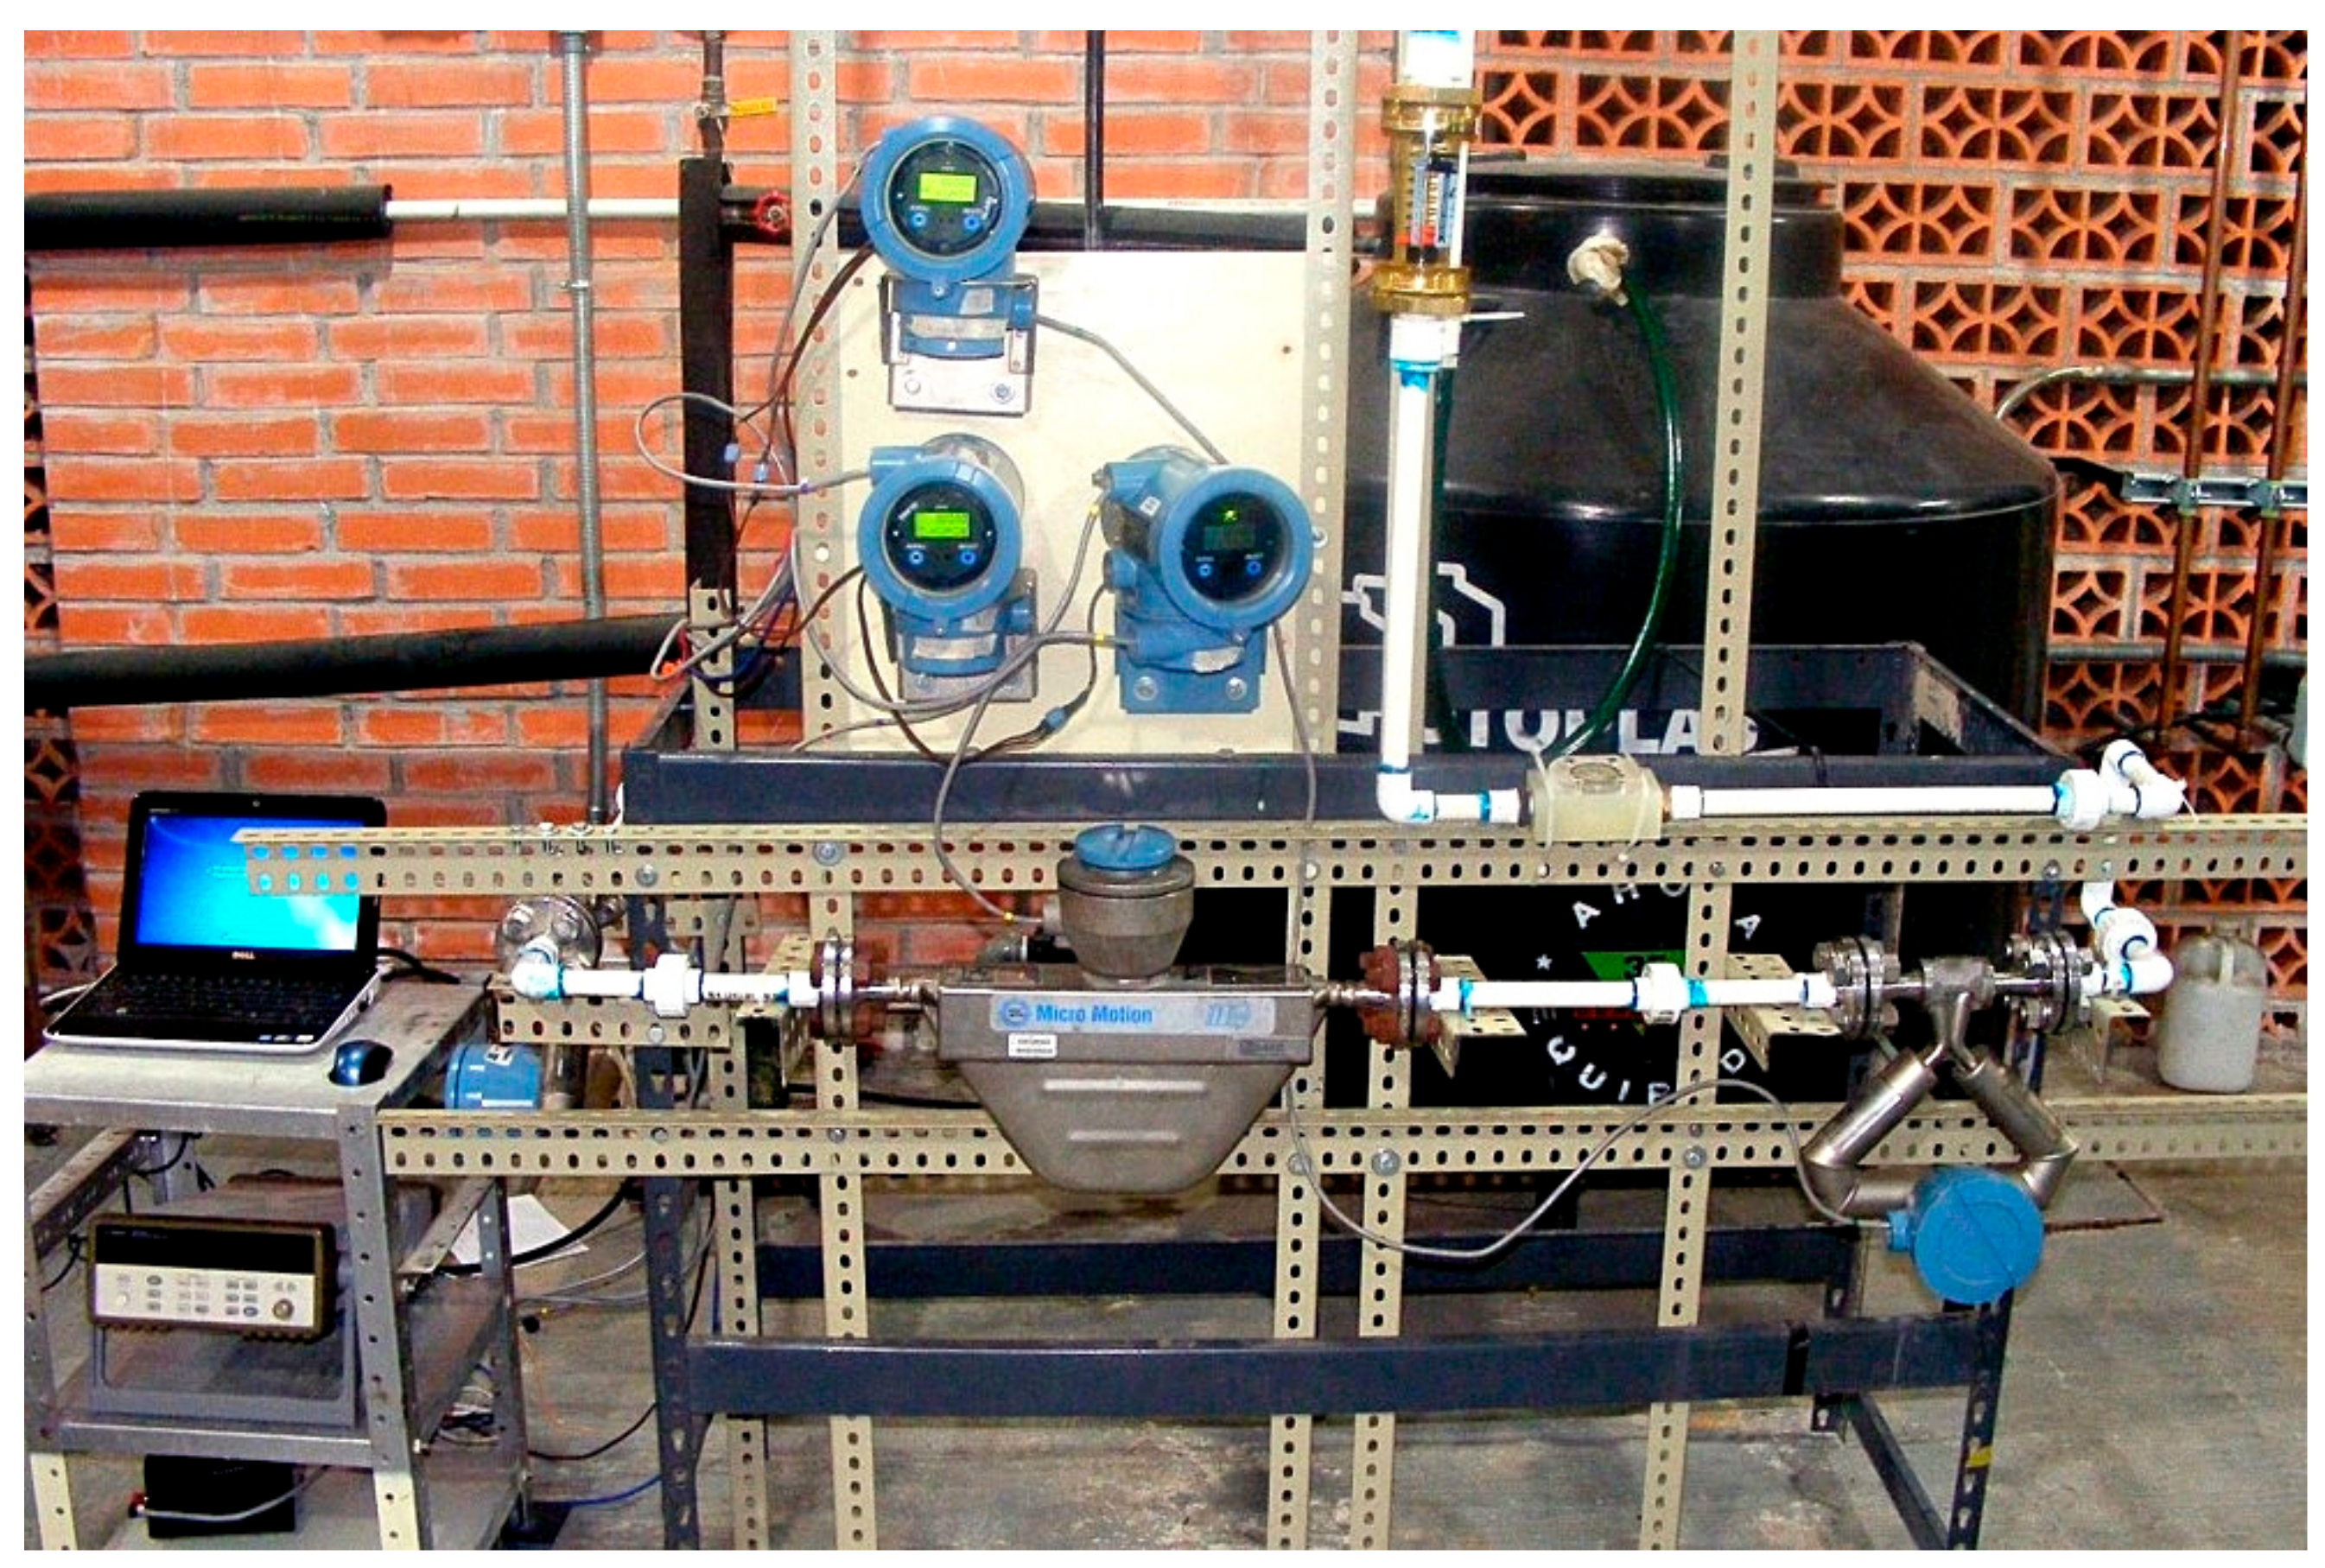
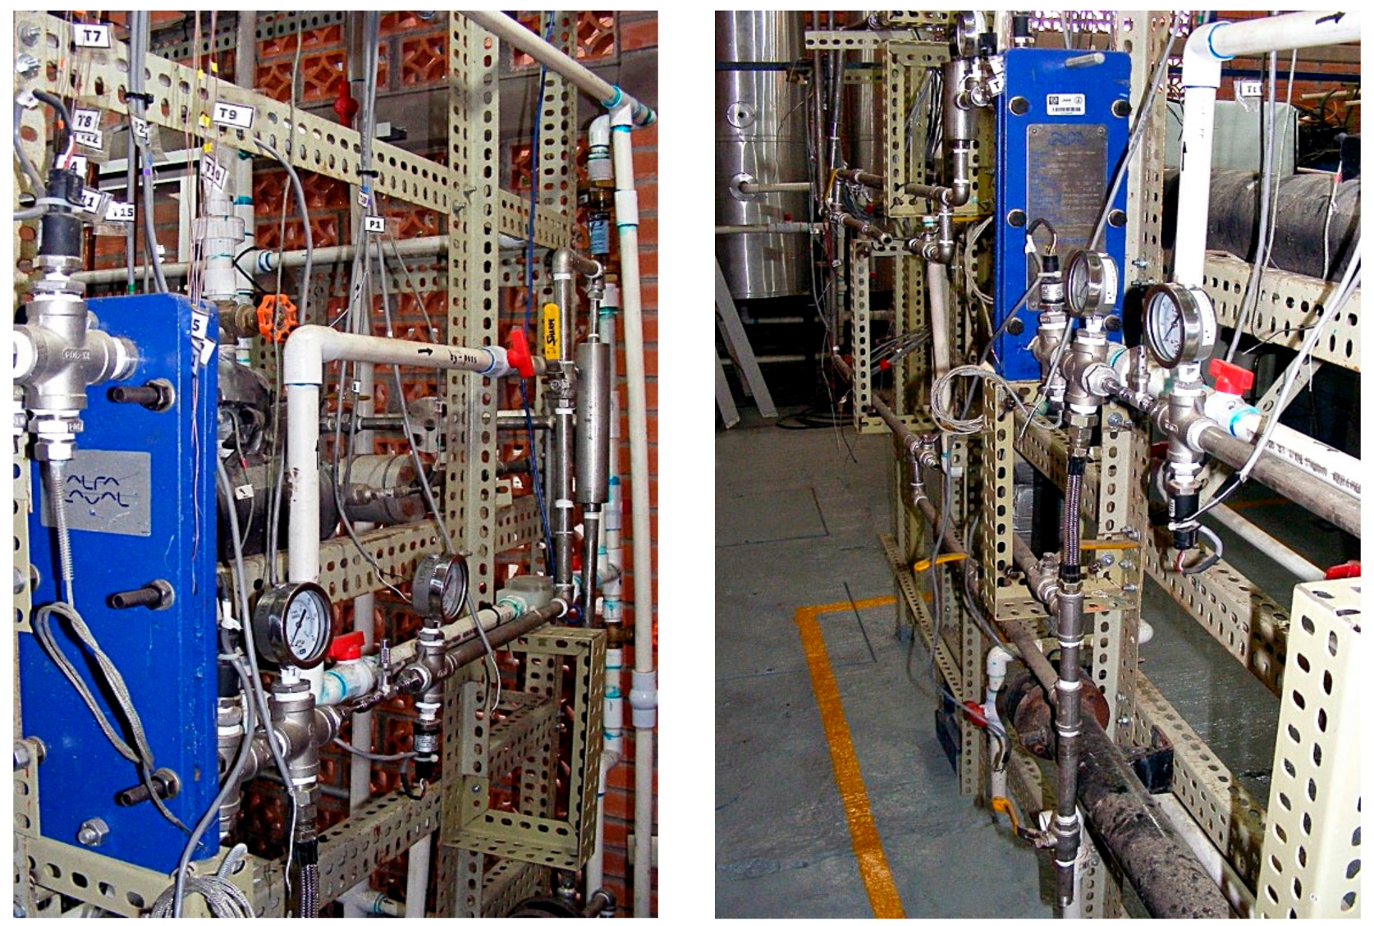
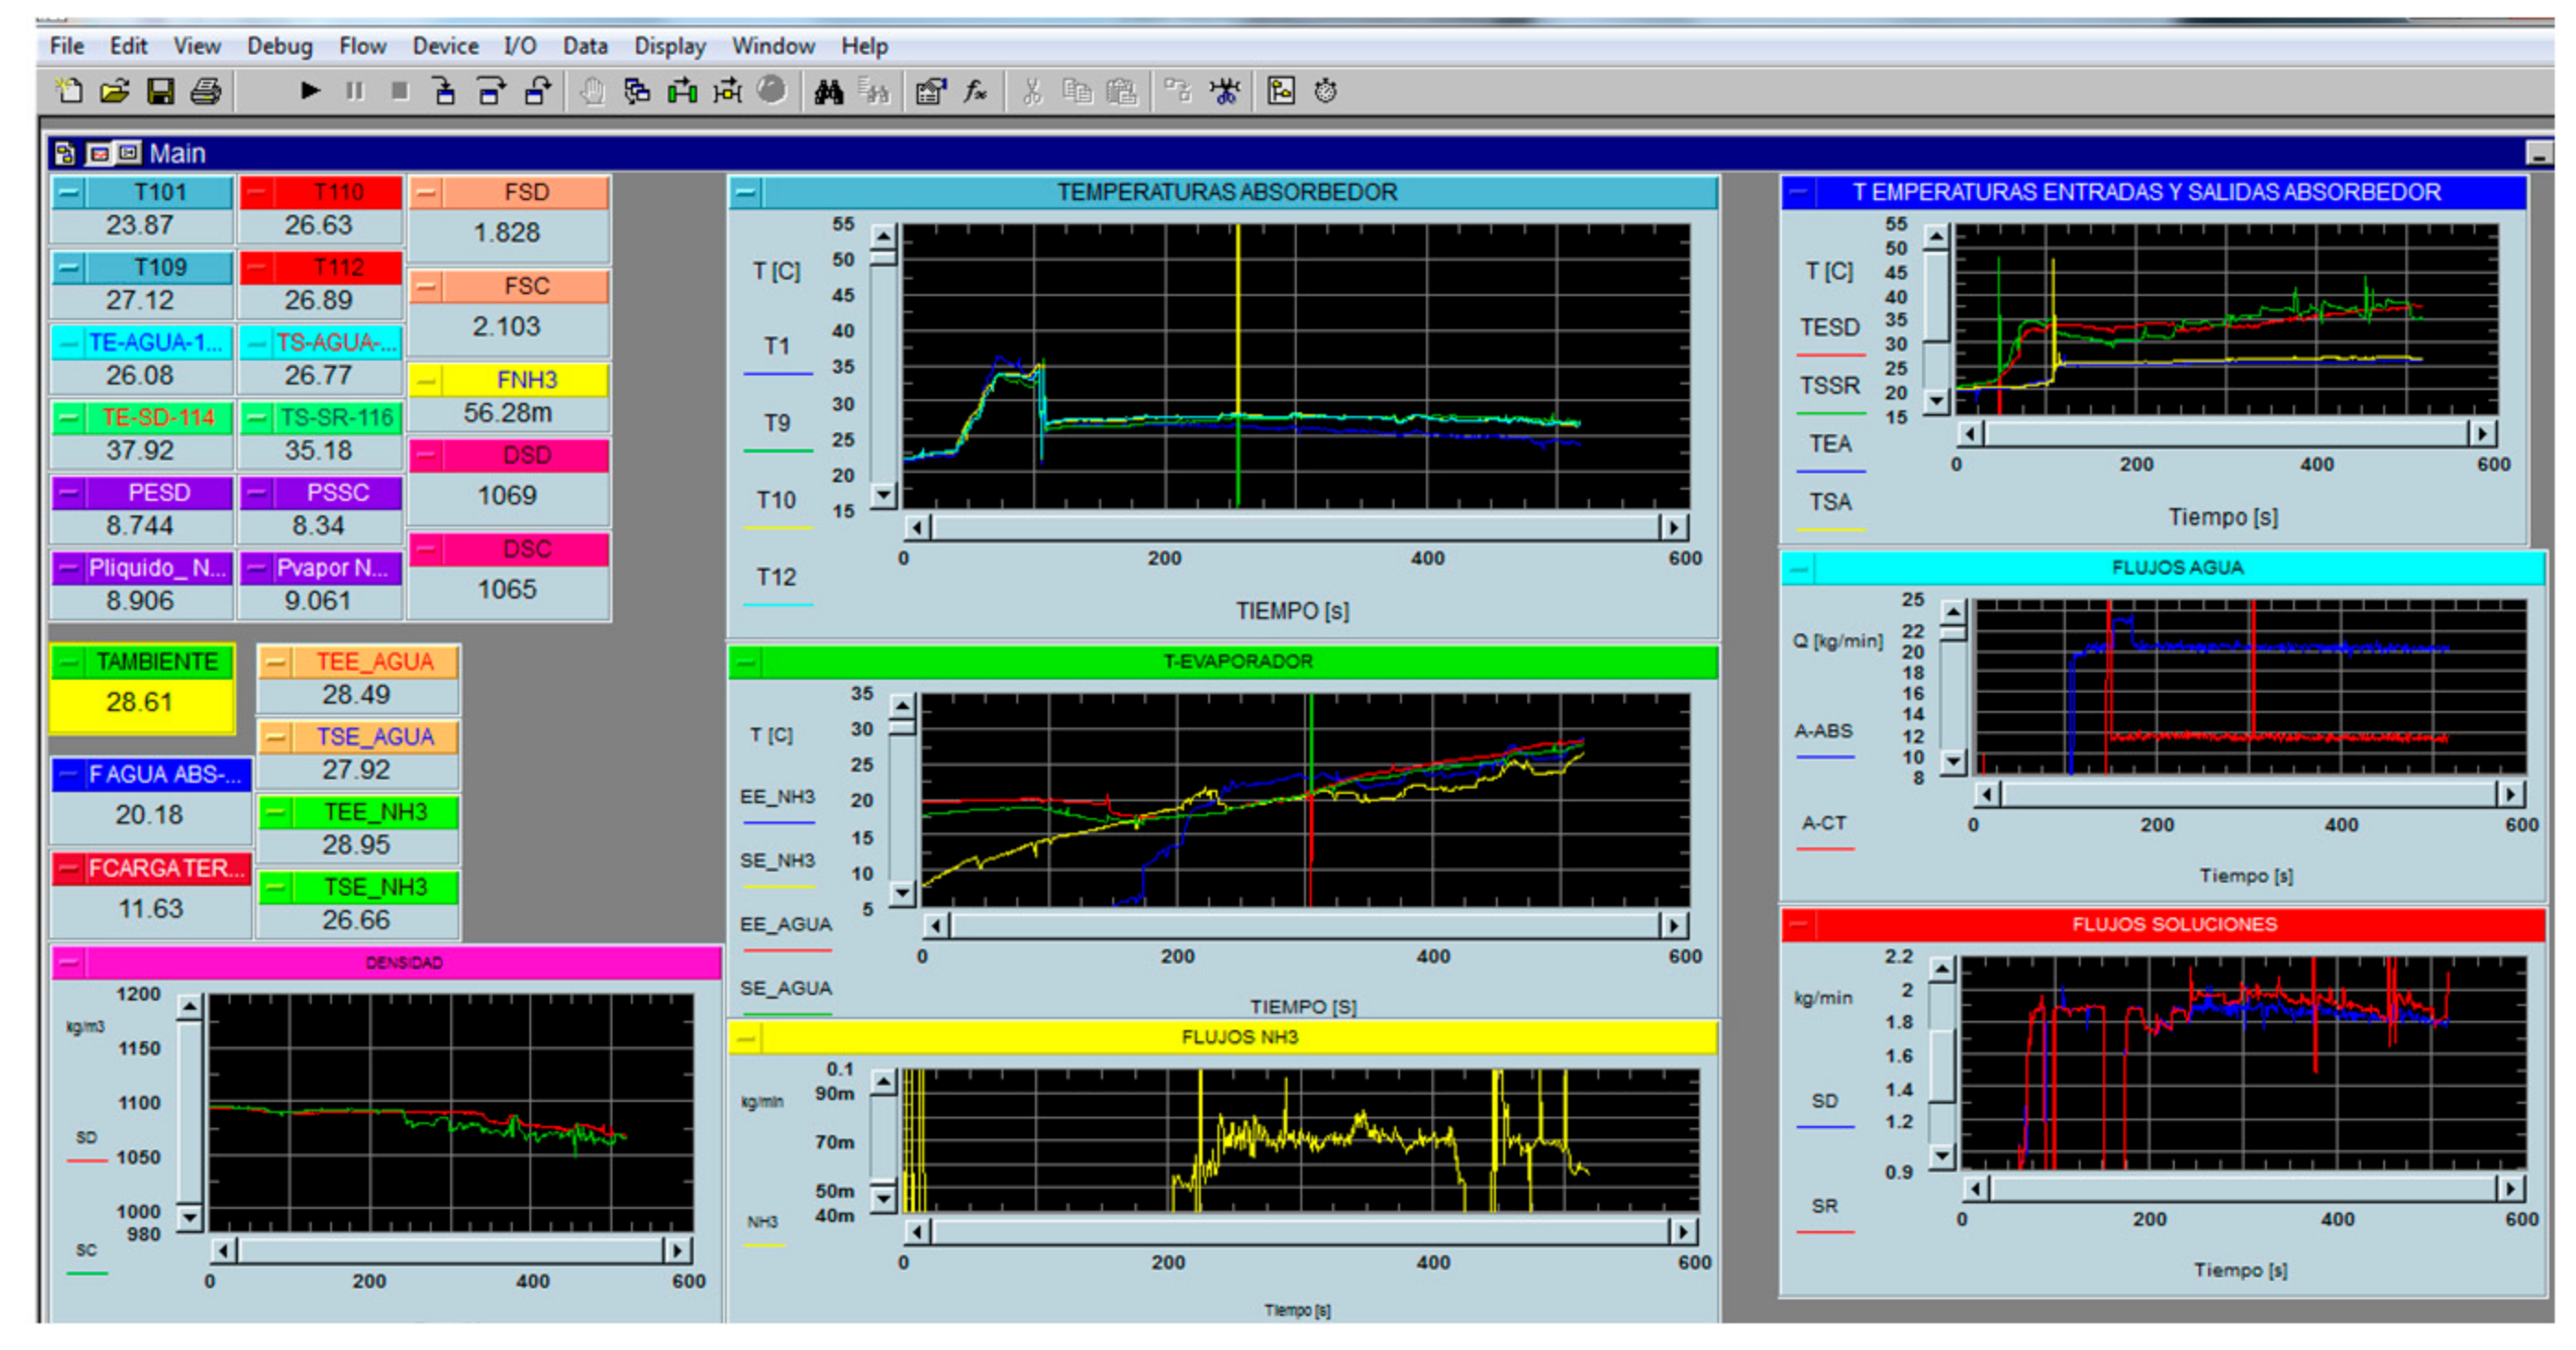
2.1. Test Rig Description

A test rig was designed to study the absorption process in a PHE. It consisted basically of three circuits: the ammonia vapor (yellow), ammonia-lithium nitrate solution (orange) and the cooling water as can be seen in Figure 1. In the ammonia vapor circuit, liquid ammonia was stored in a tank and pumped through a micrometric expansion valve, which reduced the pressure and changed to a vapor phase, it was injected into the bottom side of the absorber using a vapor distributor as it is shown in Figure 2. The absorption process was carried out in the solution circuit. The poor in ammonia solution was stored in a container and it was pumped to the bottom side of the absorber, where ammonia vapor and solution were mixed. The concentrated solution left the absorber and was sent to a storage container. The heat generated by the absorption process was removed by the cooling water circuit, which was pumped from a cold water reservoir (15,000 L) to the side plates of the PHE, extracting the absorption heat. A needle valve regulated the cooling water mass flow. The ammonia vapor and solution circuits were made of stainless steel, whereas the cooling circuit was made of PVC. In Figure 1, we can also observe the control and measurement instruments that were placed in the experimental system (pressure, temperature, mass flows, needle valves, diaphragm pumps).

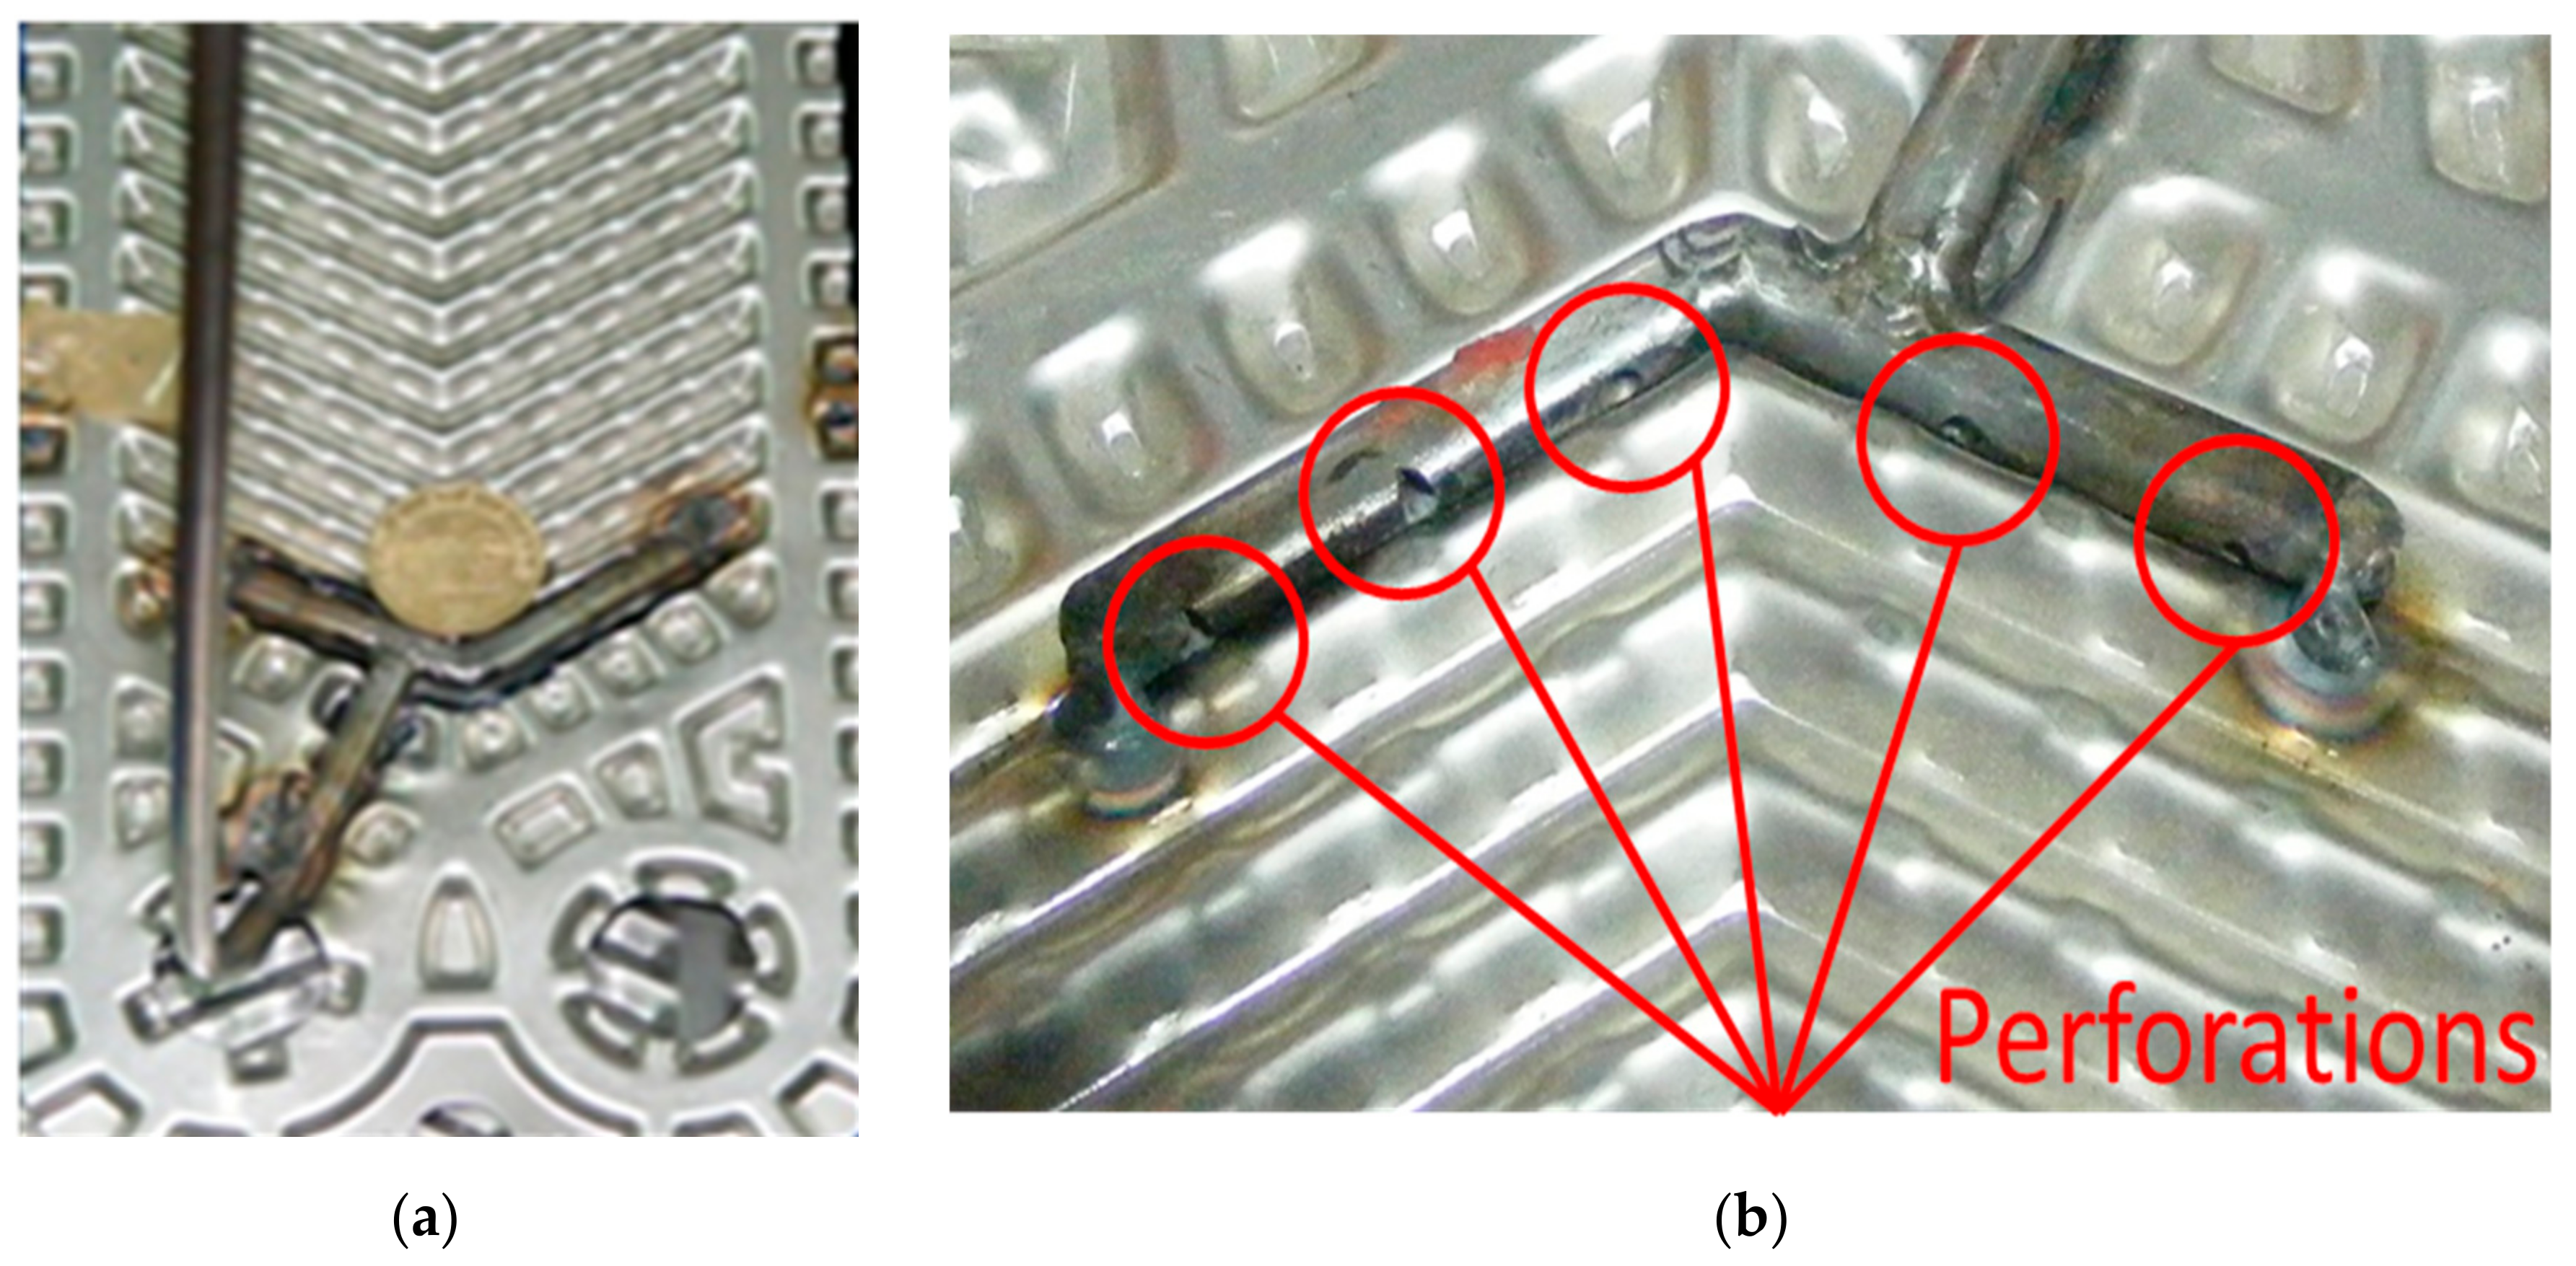
2.2. Plate Heat Exchanger as Absorber

A stainless steel plate heat exchanger model T2-BFG from Alfa Laval was used as an absorber. Table 1 shows the dimension details of a plate. The PHE consisted of three channels, ammonia vapor and NH3-LiNO3 flowed in the central channel, and cooling water flowed into the side channels. Details of the absorber are shown in Figure 2.
The vapor distributor, shown in Figure 3, consisted of a 50 mm long and 5 mm inside diameter steel tube with five equidistant perforations: two of 1 mm, two of 2 mm and one of 3 mm [10,11]. Temperature, pressure, and mass flow rate sensors were placed at the inlet and outlet of the cooling water and solution flows in the plate heat exchanger as it can be seen in Figure 1. Information on the accuracy of the sensors can be seen in Table 2, and the operating parameters and their respective accuracies summary can be seen in Appendix A.

3. Data Reduction

The thermodynamic properties of NH3-LiNO3 solutions were obtained from Libotean [17], Infante Ferreira [18] and Conde [19]. The experimental data correspond to steady state conditions during at least 15 min for each experimental run. The heat transfer area (Aexch) was calculated using the surface enlargement factor (φ) defined as the proportion of increased length with respect to a plane plate length or projected length [20]. Aeff is the projected area of the plate. The heat transfer area was 0.0504 m2:
A e x c h = * A e f f   [ m ]
= increased_length projected_length     [ d i m e n s i o n l e s s ]
The equivalent diameter, De, is defined as:
D e = 4 b L w 2 ( b + L w ) 2 b   [ m ] ;     Considering   that :   b < < Lw
The Reynolds number (Re), channel mass velocity (Gcsol) and the number of channels per pass (Ncp), are calculated as [21,22,23,24,25]:
R e = G C s o l D e μ     [ d i m e n s i o n l e s s ]
G c s o l = m ˙ s o l N c p b L w     [ kg   m 2 s 1 ]
N c p = N t 1 2 N p     [ d i m e n s i o n l e s s ]
GCsol is a relationship of the solution mass flow rate with respect to the physical characteristics of the heat exchanger. De is equivalent diameter, b is the inter-plate channel height, µ is the dynamic viscosity, sol is the mass flow of solution, Ncp is the number of channels per pass, Nt is the total number of plates, Np is the number of passes and, Lw is the effective height length.
The logarithmic mean temperature difference (LMTD) was used considering the inlet and outlet temperatures of the absorber [24]:
L M T D = [ T s o l , i n T c , o u t ] [ T s o l , o u t T c , i n ] l n [ [ T s o l , i n T c , o u t ] [ T s o l , o u t T c , i n ] ]     [ d i m e n s i o n l e s s ]
The Nusselt number is stated by Equations (8) and (9), where µSOL is dynamic viscosity of solution, µW is the dynamic viscosity of water, Lcha is the channel length:
N u s o l = a R e b P r c ( μ s o l μ w )     [ d i m e n s i o n l e s s ]
N u s o l = h s o l L c h a k s o l     [ d i m e n s i o n l e s s ]
P r s o l = μ s o l C p s o l k s o l     [ d i m e n s i o n l e s s ]
The overall heat transfer coefficient, U, was calculated by Equation (11):
U = 1 1 h w + x s s k s s + 1 h s o l     [ k W m 2 K 1 ]
Ammonia mass absorption flux, FABS, indicates the capacity of the solution to absorb the ammonia vapor per unit of heat transfer area. NH3 is absorbed ammonia mass flow rate, Aexch is the heat exchange area:
F A B S = m ˙ N H 3 a b s A e x c h     [ kgm 2 s 1 ]
The overall mass transfer coefficient, Km, defined by Equation (13):
K m = m ˙ N H 3 a b s ρ N H 3 A e x c h L M C D     [ m   s 1 ]
L M C D = [ X s o l , i n e q u i X s o l , i n ] [ X s o l , o u t e q u i X s o l , o u t ] l n [ [ X s o l , i n e q u i X s o l , i n ] [ X s o l , o u t e q u i X s o l , o u t ] ]     [ d i m e n s i o n l e s s ]
where, NH3abs is the absorbed ammonia mass flow, Aexch is the exchange area, ρNH3 is ammonia density, LMCD is logarithmic mean concentration difference, X, is solution concentration [26,27,28,29].

4. Discussion

The absorber was characterized using water on both sides of the PHE in order to calculate a Nusselt Number correlation for cooling water. Previously, experiments were carried out introducing water in both cold and hot sides of the channels in order to calculate the cooling water heat transfer coefficient. A correlation of the Nusselt number was obtained as a function of the Reynolds and Prandtl numbers:
N u w a t e r = 0.3417 R e w a t e r 0.5891   P r w a t e r 0.1726     [ d i m e n s i o n l e s s ] .
The range of operation conditions for the experimental test started with a solution of NH3-LiNO3 at 35% ammonia weight and it was progressively increased in each experiment until reaching a maximum concentration of 50%. The range of the ammonia mass flow rates injected was from 0.0794 × 10⁻³ to 1.217 × 10⁻³ kg s−1. The flow rates of the dilute ammonia solution flow rate were from 0.0117 to 0.035 kg s−1.
In Figure 4 the x-axis represents in ascending order the experimental tests. Each test was considered valid after being kept in steady state for at least fifteen minutes; data acquisition was performed at ten-second intervals. The values of the concentrated (Xsc) and diluted (Xsd) solutions, for each test are shown on the left-y-axis. In this work, the concentration gradually increased. The experiments started from an initial diluted concentration of 35% up to a concentration of 50%. The concentrated solution also increased step by step. The difference in concentrations (ΔX) for each valid test is shown in the lower part of the graph; the average difference in concentrations was 0.011 ± 0.005%. On the other hand, the behavior presented by the Reynolds number of the solution, Resol, in each of the test points is also shown; it is observed that it was increasing as the concentration increased. The latter was to be expected taking into account the decrease in the viscosity of the ammonia solution as a result of the increase in the ammonia concentration. Two behaviors can be seen for the Resol, the transition zone that goes from 20 ≤ Resol ≤ 90 and the turbulent zone 90 ˂ Resol ˂ 400. The transition zone showed a linear behavior with a slightly steep slope. On the other hand, the turbulent zone had a polynomial behavior.
Empirical correlations for the solution Nusselt numbers were proposed on the basis of the experimental data presented here for the absorption of ammonia vapor by ammonia-lithium nitrate solution in a PHE-type absorber. The correlations were made using the experimental data. Equation (16) is valid for the transition zone and Equation (17) for the turbulent zone. These empirical relationships in conjunction with Equation (9) allowed finding the hsol:
R e s o l < 90   N u s o l = 0.1301 R e s o l 0.3523 P r 0.333 ( μ s o l μ w ) 0.17     [ d i m e n s i o n l e s s ] .
R e s o l 90   N u s o l = 0.0089 R e s o l 0.8213 P r 0.333 ( μ s o l μ w ) 0.17     [ d i m e n s i o n l e s s ] .
Figure 5 shows the behavior of the solution heat transfer coefficient, hsol, and the channel mass velocity of the solution, GCsol, against the Reynolds solution number, Resol. The solution heat transfer coefficient, hsol, increased linearly from 0.96 to 2.46 kW m−2K−1 at Resol range from 20 to 90 and GCsol shows a linear increase for the same range of Re from 40 to 130 kg m−2 s−1. Subsequently, hsol showed a slight increase and the channel mass velocity of the solution, GCsol remained almost constant. This behavior was caused by the increment of the ammonia concentration in the solution, which reduced the viscosity and influenced the thermodynamic behavior; these variations influence the Prandtl number as shown in Figure 5, which shows that the thermal boundary layer will increase as a result of the decrease in the viscosity of the solution. The hsol, increased as the result of the combination of an increase in Resol and the decrease in GCsol. It was observed in the range of Resol from 50 to 80 a compact grouping of measured points came were obtained, as a result of the variation of solution mass flow rate which were chosen for the study (which translate into mass velocities), similar results have been reported in previous studies [22,23,24,25]. Figure 6 shows the behavior of the convective heat transfer coefficient of the solution with respect to the Resol number. Likewise, it is shown how the Prandtl number of the solution was modified. As the concentration of ammonia increased during the experimental tests, the viscosity of the solution decreased and consequently the Reynolds number increased.
It can be seen that as well as the change in viscosity in the solution, μsol, other solution properties such as the thermal conductivity, Ksol, and specific heat, Cpsol, were also modified. It can be seen that there was a clear decrease of the Prsol due to the thermodynamic and thermal properties of the solution reaching lower values and with the effect that the heat begins to diffuse faster with respect to convection. This behavior results in the increase of the convective heat transfer coefficient in the transition zone with a very steep slope and later in the turbulent zone, this slope decreases.
Figure 7 shows the effect on the mass absorption flux, FABS, and mass velocities, GCsol, as a function of Resol. It can be observed that the average value of 1.93 ± 0.23 × 10⁻² kg m−2s−1 was obtained, for different mass velocities for all interval of Resol. It can be seen that, although the ammonia solution concentration increased during the experiments, the amount of absorbed ammonia was similar during the transition region [15] as well as in the turbulence zone. The ammonia flow rate was controlled during all experimental tests at different operating conditions.
The results showed that there was a larger absorption potential using higher mass velocities as there exists a larger concentration gradient. At the beginning of the experiments, there was a low concentration of ammonia; therefore, the concentration gradient was high. In addition, during the experiments it was observed that if a larger residence time was used for the ammonia mass flow inside the absorber, a better absorption was obtained although the mass velocity in the channel, GCsol decreased. One option to maintain the higher residence time of the ammonia flow without affecting the channel mass velocity is to employ an absorber with a larger effective length (Leff) than the one used in this work. Figure 8 shows the mass transfer coefficient (Km), and the ammonia vapor flow rate (NH3), with respect to the Resol. The mass transfer coefficient reached values that ranged from 0.009 to 0.015 m·s−1 with an average of 0.011 ± 0.002 m·s−1.
Additionally, Figure 9 shows Km and LMTD as a function of Resol. The LMTD values obtained were from 6.9 to 21.6 °C. The effect on the mass transfer coefficient, Km, with respect the logarithmic mean temperature differential, LMTD was subsequently analyzed. Oronel et al. [15] presented a comparison of Km with respect to sub cooling temperatures of the solution. This work proposes that it is more suitable to compare the behavior of Km, including all temperatures in the heat exchanger, which is given by the LMTD.
Figure 9 shows the Km and LMTD variation as a function of Resol. It can be seen that when the LMTD increases Km is affected positively, both, in the transition and turbulent zones. It is clear that the values of LMTD are lower in the transition than turbulent zone, 90 < Resol ≤ 450, Km is increased as a result of the dominance of shear forces over the viscous forces, improving the mixing of vapor with the solution, even though it already has a higher ammonia concentration. It can be deduced that for the transition zone, 20 ≤ Resol ≤90, higher values of LMTD are required in order to achieve values of Km similar to those of the turbulence zone. High viscosity and the temperatures that were registered in the transition area (more exothermic heat generation) caused higher LMTD values.
Table 3 shows hsol and Km values obtained from Oronel et al. [15] and the present work at similar Reynolds number. The values of hsol were lower than those reported by Oronel et al. [15]. At higher Reynolds numbers, hsol values reached 3.0 kW m−2K−1. However, FABS values were higher than reported by Oronel et al. due to the improved mixing of vapor and solution, besides it obtained higher values of Km than those reported in the literature related with absorption in cooling systems.
In this work, a review of the experimental works was carried out with the NH3-LiNO3, H2O-LiBr and NH3-H2O mixtures and with the absorption preferably in the bubbling absorption mode. The review did not find many PHE-type absorbers and even less with the NH3-LiNO3 mixture. Table 3 shows a summary of results, which are interesting as a reference frame, not all of them are experimental studies of a bubble mode absorption in a PHE-type absorber with NH3-LiNO3. Infante Ferreira [30] reported experimental results of NH3-LiNO3 absorption in a falling film absorber in which upward ammonia vapor is absorbed in countercurrent by a laminar film of diluted ammonia solution; it had many technical limitations to achieve it; hence, the small value of hsol. It does not provide more data such as km. Venegas et al. [31] performed a numerical study of the spray absorption mode in a very short concentration range of 36.7 to 39% in the concentrated solution. They studied a range of the Resol also relatively small, of 10 to 70. The cooling water temperature was 34 °C. They considered it as an improvement to the falling film system. It considered an adiabatic chamber where the diluted ammonia solution was contacted, sprayed in small drops with the ammonia vapor. Zacarias et al. [32] carried out experimentally what was stated by Venegas et al., of the spray absorption mode and managed to obtain km values an order of magnitude higher than what was predicted by the numerical analysis. Cerezo [22] presented an experimental work with the NH3-H2O mixture with cooling water temperatures of 30 °C and mass flow rate of 0.038 kg s−1. He used an ammonia distributor in a PHE-type absorber with an area of 0.1 m2 of a single central hole and with mass flow rate of 0.0139 kg s−1 solution, varying its concentrations from 29 to 33.4% of concentration by weight. He reported hsol and Km values higher than other studies that used NH3-LiNO3. The works of Jiang et al. [33,34] served us as a reference for the values of hsol. They used the mixture NH3-LiNO3 for a boiling process. They did not report values for Km.

5. Conclusions

An experimental study was carried out of a bubble mode absorption with an internal ammonia vapor distributor in a PHE-type absorber with the NH3-LiNO3 solution. The following conclusions can be drawn from the present study:
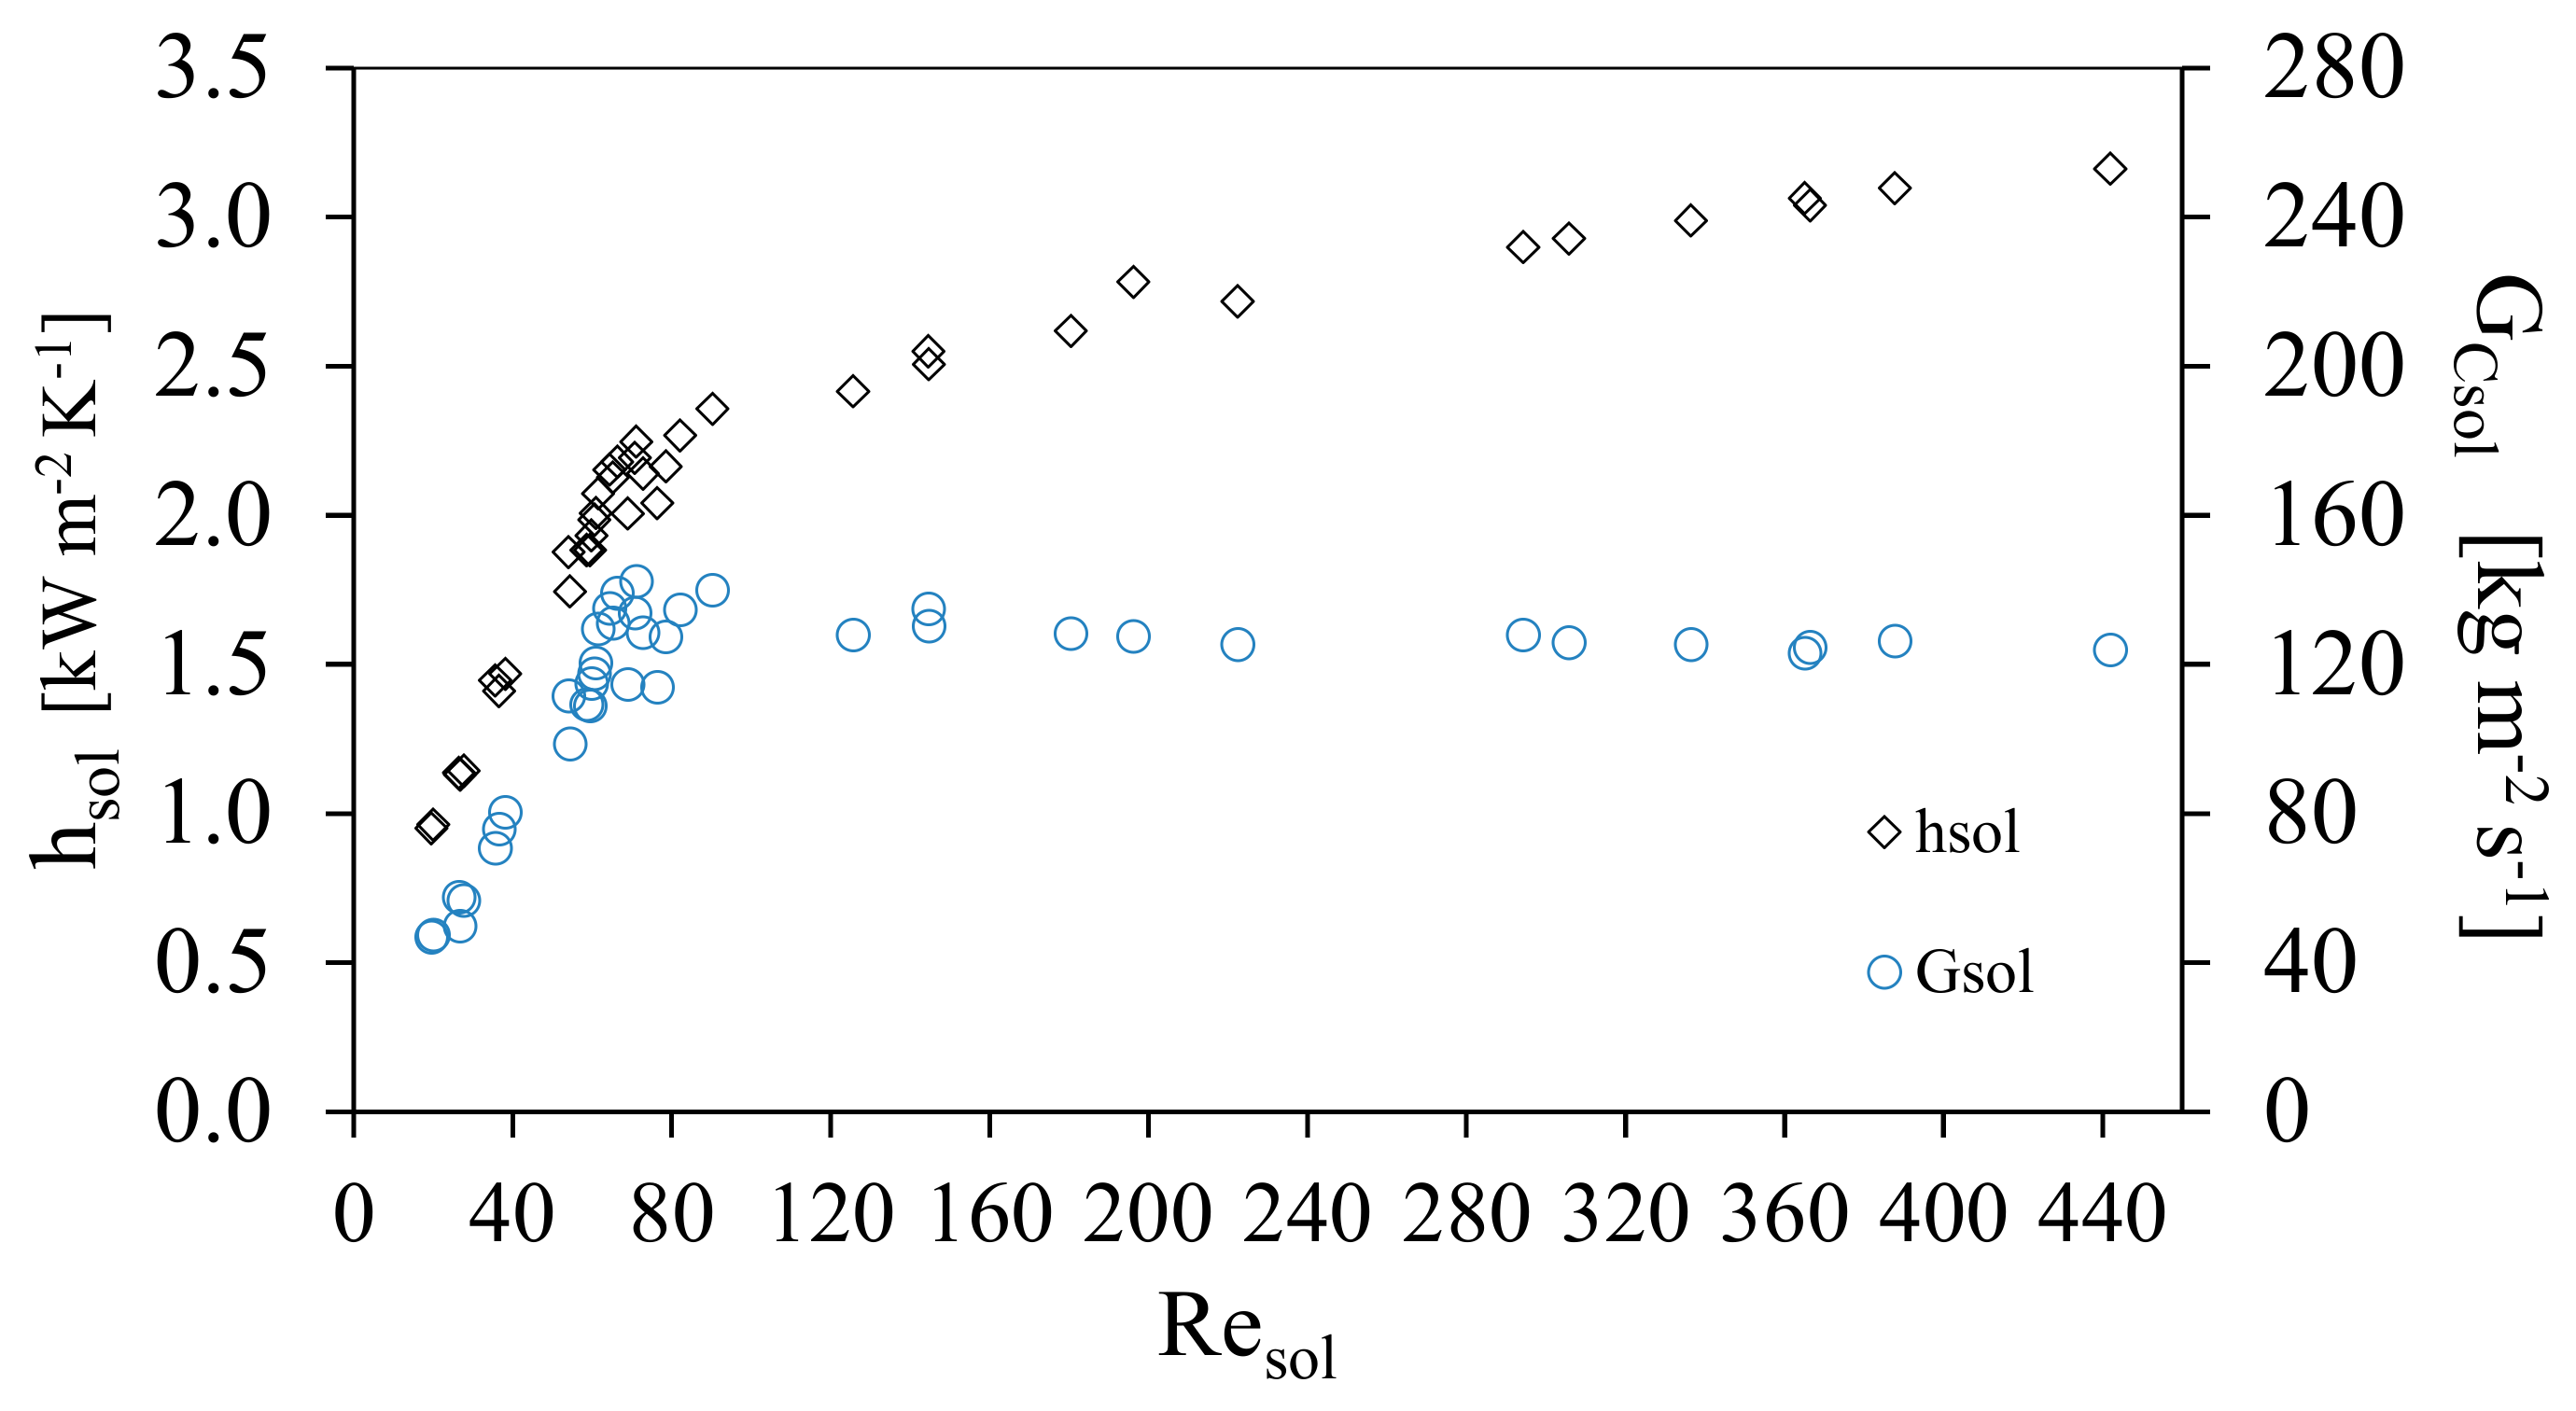
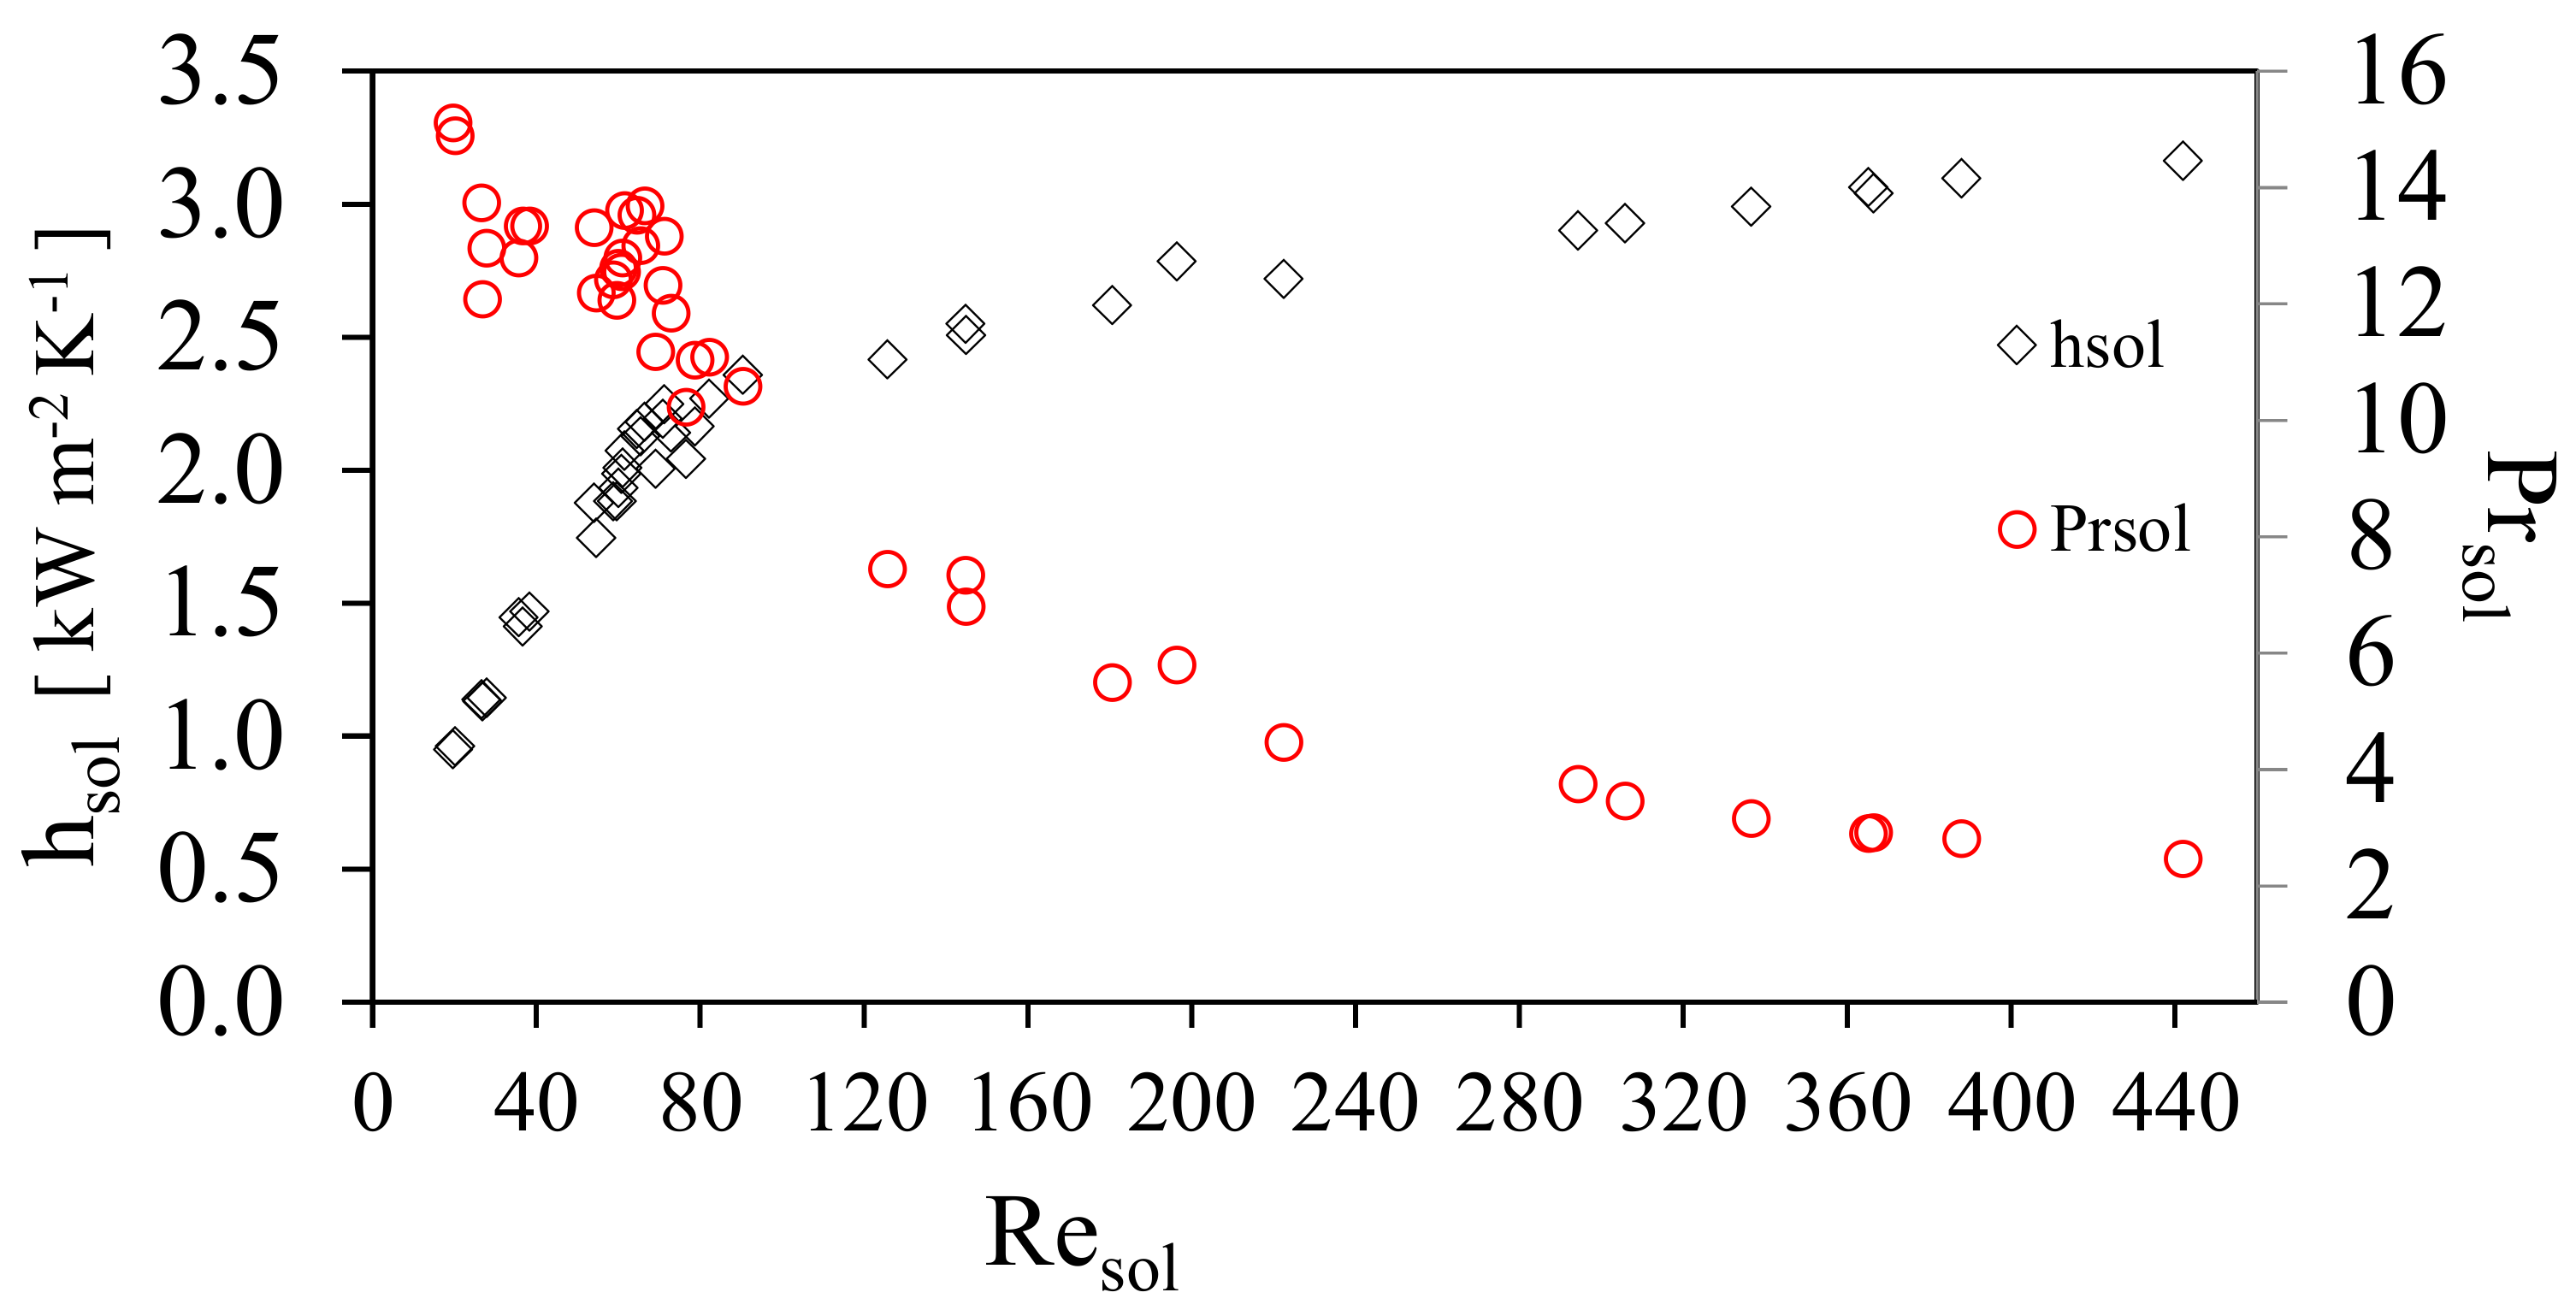
  • The results obtained show that hsol increased from a value of 0.9 to 1.8 kW m−2K−1 for Resol values of 20 up to 80. For values of Resol greater than 120 and up to 440, due to limitations in the experimental rig, hsol increased slowly from 1.8 to 3.0 kW m−2K−1.
  • The ammonia absorption flow FABS in the study had an almost constant value of 0.038 ± 0.004 kg m−2s−1, for all the mass flow velocities, GCsol throughout the experiments. The values are in the same range as the work by Oronel et al. [15] although for low values of Resol the values in this work are higher. This could be due to the vapor distributor and other operating conditions such as the higher pressure.
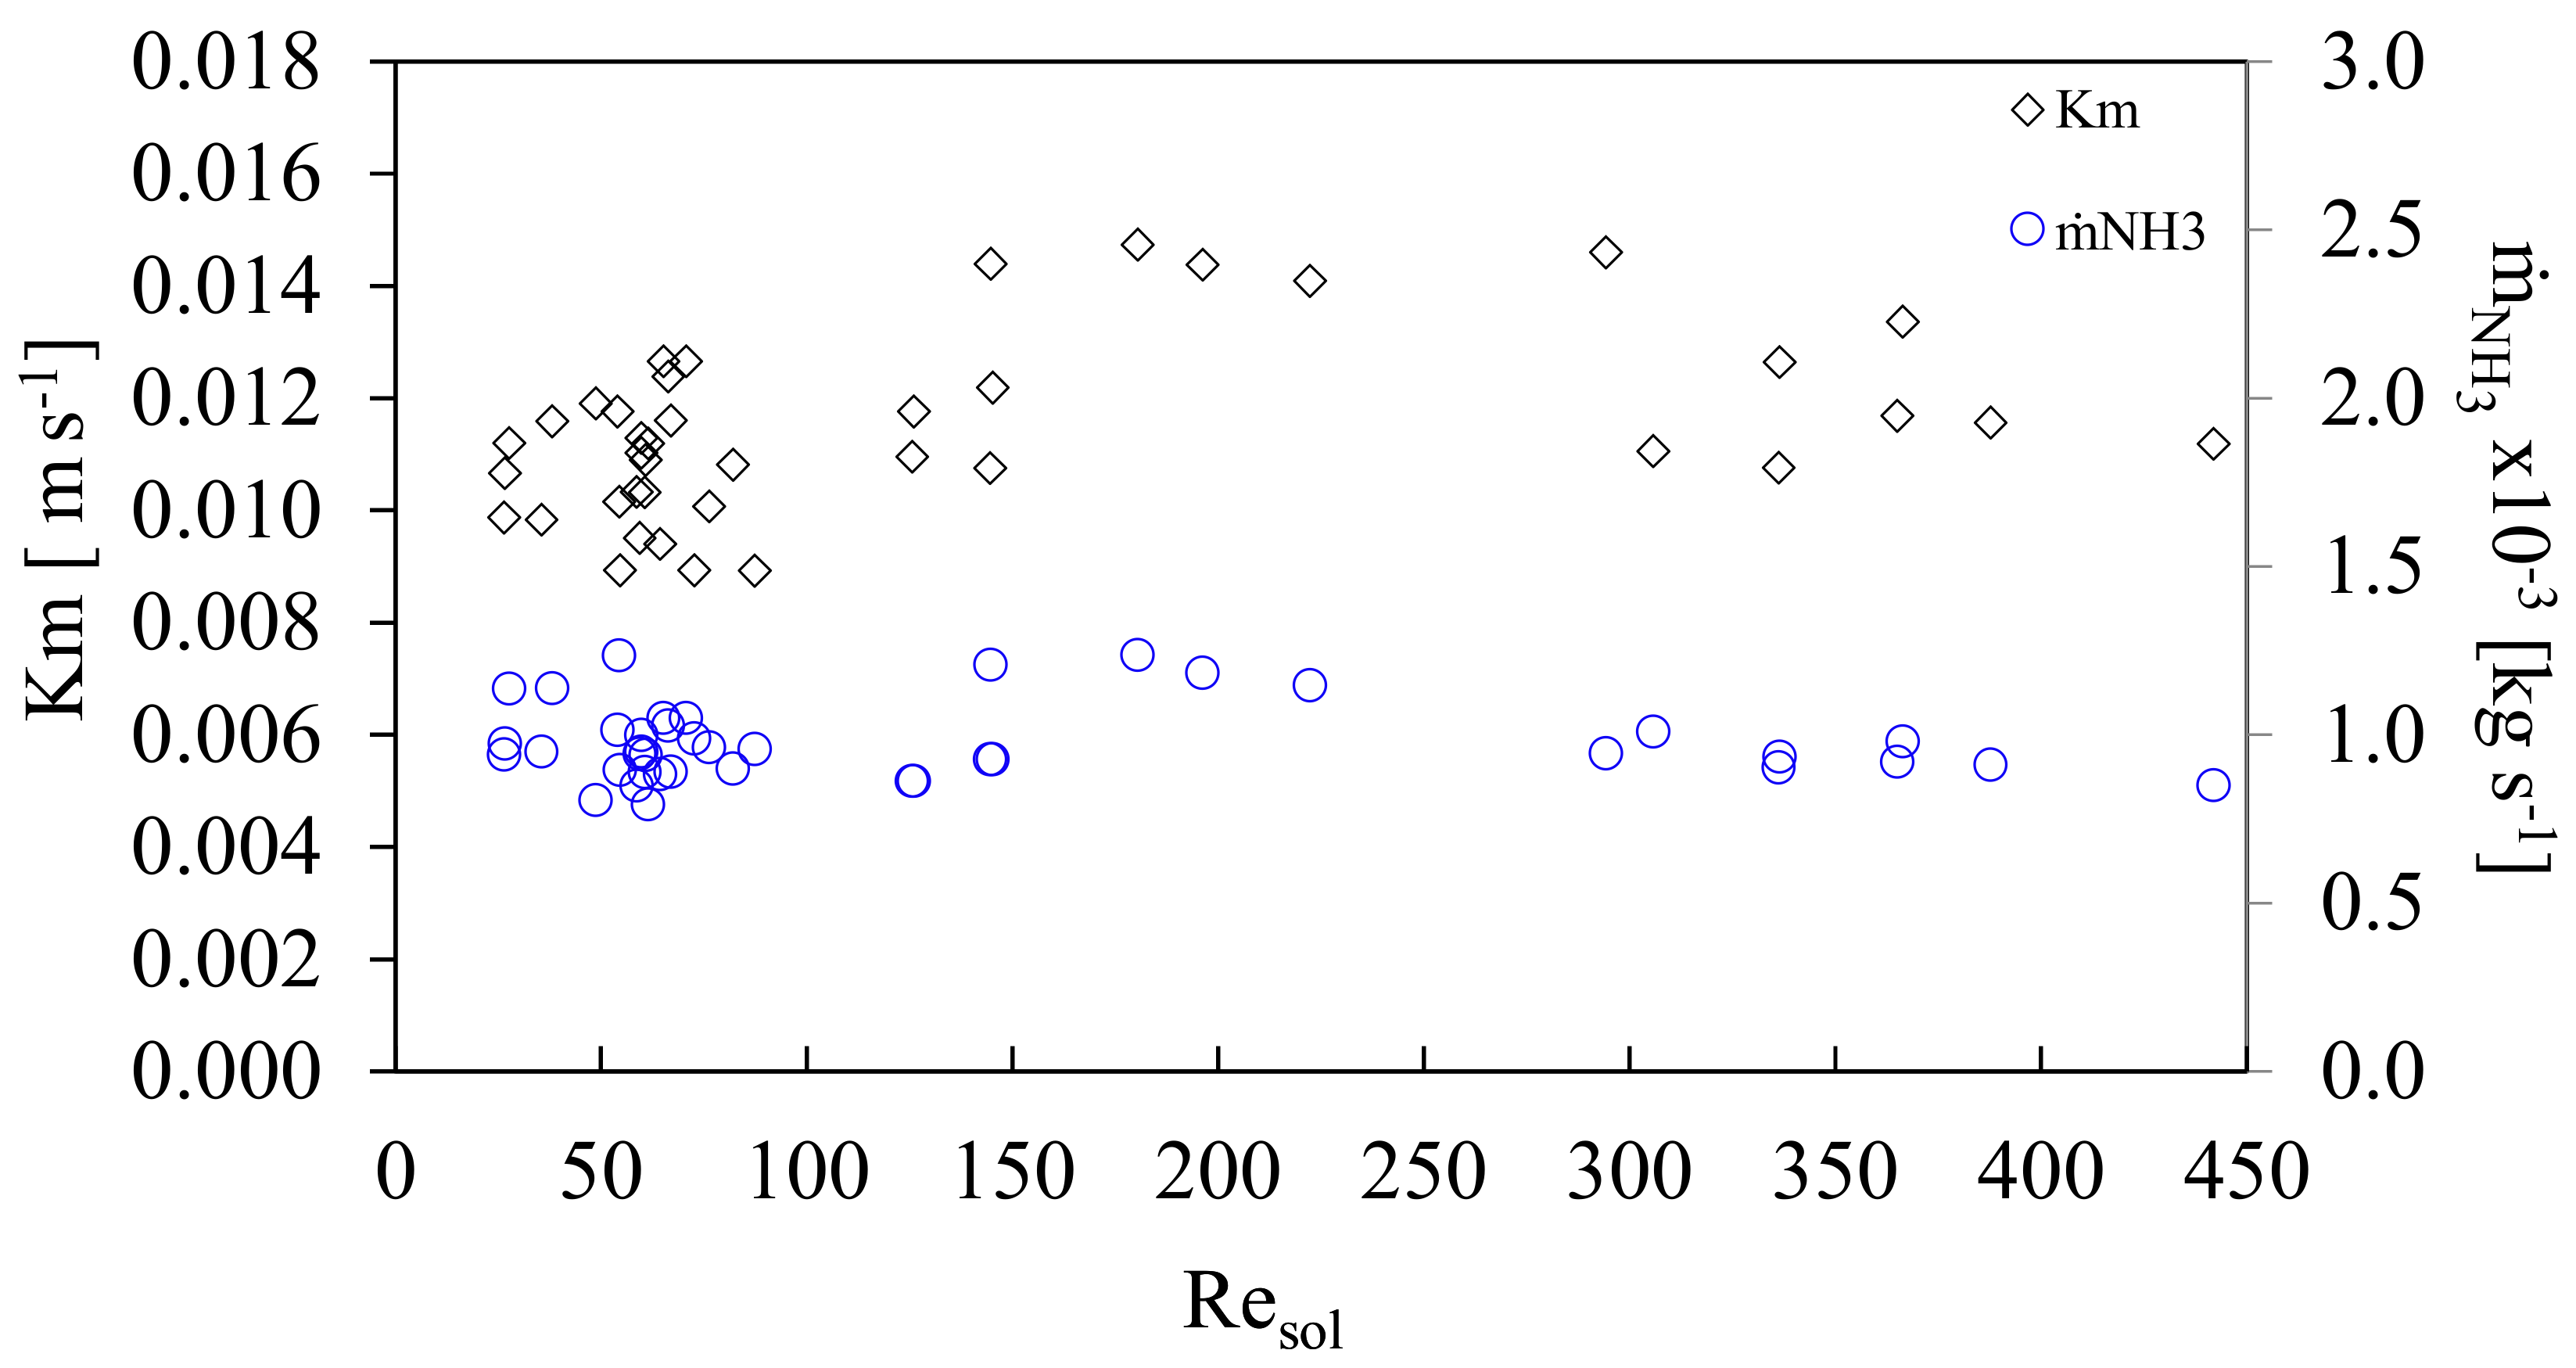
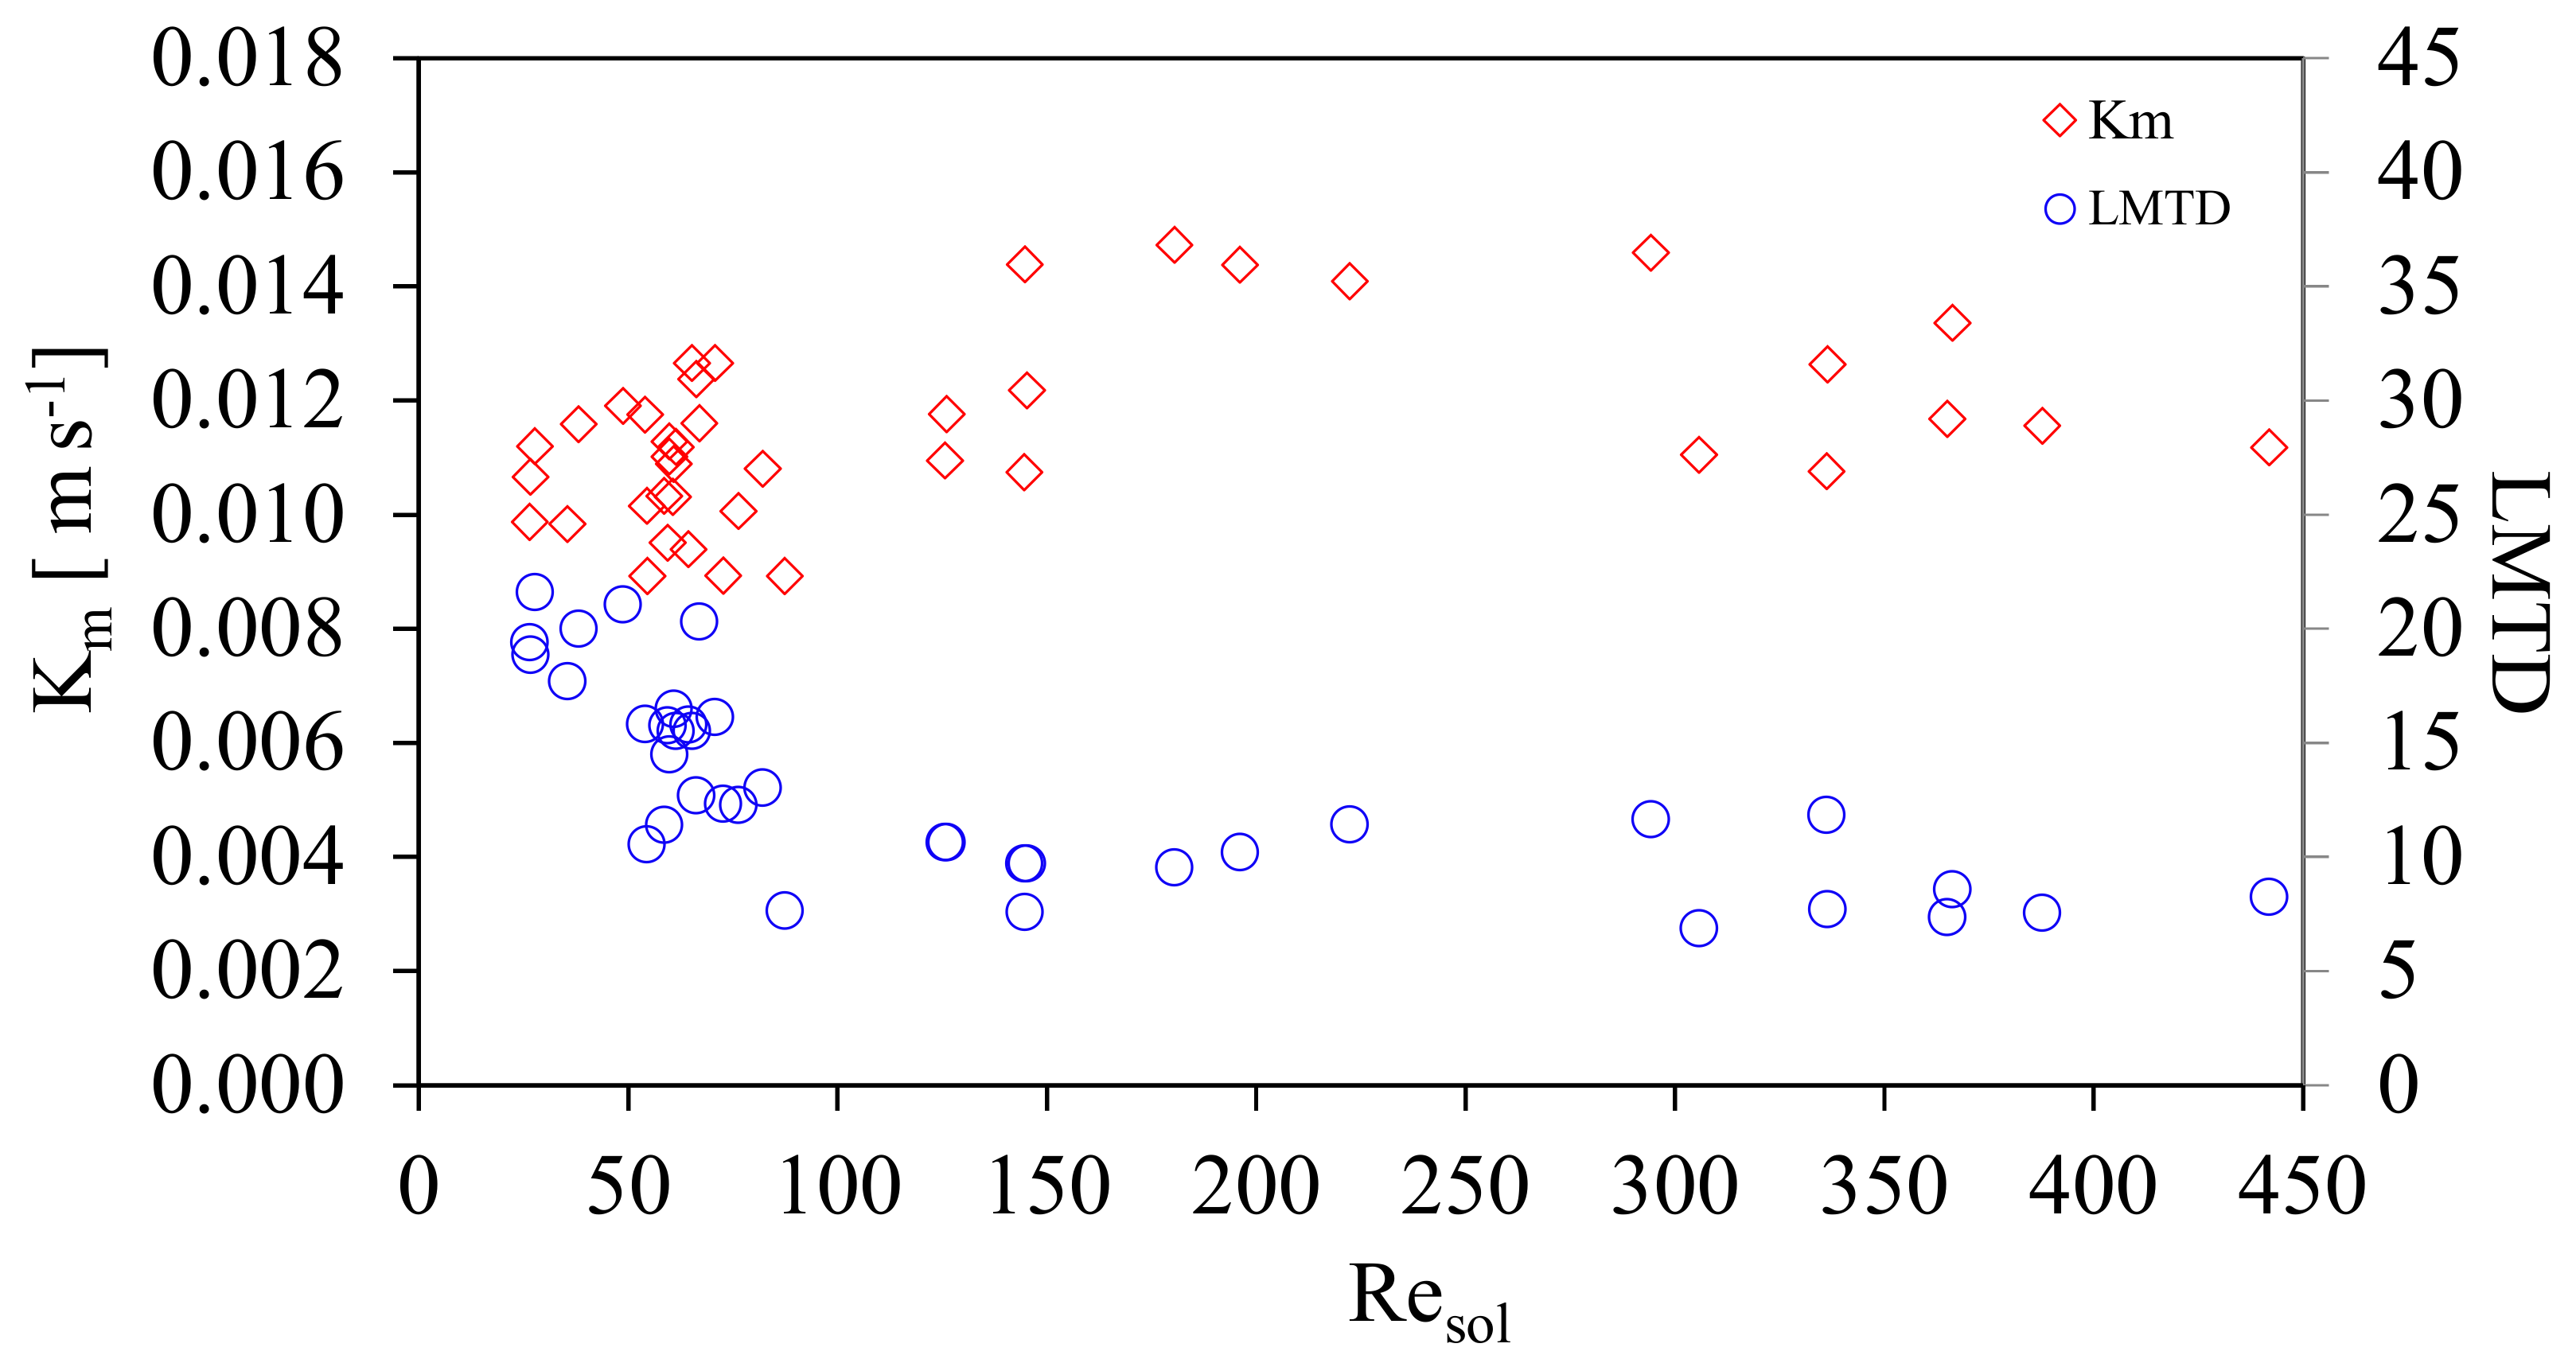
  • It was found that the value of the mass transfer coefficient, Km, had a relatively large interval from 0.009 to 0.015 m s−1 with an average of 0.011 ± 0.002 m s−1. Although mass flows of ammonia and mass velocities remained almost constant, there were fluctuations in Km, which demonstrated that an additional factor affected its behavior. The additional factor was the logarithmic mean temperature difference (LMTD). It was observed that Km behaved inversely proportional to the LMTD.
  • It was concluded that by increasing the effective height, Lp, of the modified heat exchanger, the absorption of ammonia vapor could be increased, as the residence time will be increased. In addition, the registered thermodynamic conditions of the dilute ammonia solution were suitable for a better absorption. In order to sustain the previous hypothesis, that, even by increasing the turbulence – that is increasing the mass flow of dilute ammonia solution—the vapor absorption of ammonia remained almost constant, showing a slight decrease at higher Resol values; and this was mainly due to the fact that there was no greater contact area between the ammonia solution and the ammonia vapor.
  • A correlation for the Nusselt number governing the absorption of ammonia vapor by the NH3-LiNO3 solution in a PHE-type absorber was proposed at two ranges of Reynolds number.

Author Contributions

J.C.G. contributed to the data reduction, the design, the bubble absorber mathematical model, analysis of results, and the operation of the rig test. J.C. contributed to the data reduction, the design, the bubble absorber mathematical model, analysis of results, and the operation of the rig test. J.C. and R.B. contributed to the data reduction, the design and the operation of the rig test. M.A.C. carried out the experimental, construction and the installation. F.L. contributed to the bubble absorber mathematical model and analysis of results.

Funding

The authors would like to thank CONACyT scholarship 84196, Secretaría de Educación Pública for the PROMEP/103.5/09/4287 scholarship and the Universidad Autónoma de Campeche.

Acknowledgments

The authors would like to thank CONACyT scholarship 84196, Secretaría de Educación Pública for the PROMEP/103.5/09/4287 scholarship and the Universidad Autónoma de Campeche. Likewise thanks to Víctor Gómez, Jorge Hernández and Carmen Huerta for their technical support.

Conflicts of Interest

The authors declare no conflict of interest.

Nomenclature

NotationSubscripts
AArea [m2]absAbsorption
bChannel height [m]AWAir-Water
CpSpecific heat [J kg−1 K−1]channChannel
DeEquivalent diameter [m2]CWCooling Water
DpPort diameter. [m]CSConcentrated solution
GCMass speed [kg m−2s−1]DSDiluted solution
HEnthalpy [kJ kg−1]effEffective
hHeat transfer coefficient [kW m−2K−1]equiEquilibrium
kThermal conductivity [kWm−1 K−1]exchExchange
kmOverall mass transfer [kg m−2s−1]fFinal
LPlate length [m]GGas
LhEffective width length [m]GenGeneration
LvEffective height length [m]hEffective height
Mass flow rate [kg s−1]iInitial
NcpPassage channel number [dimensionless]inInput
NuNusselt number [dimensionless]lLiquid
PrPrandtl number [dimensionless]outOut
QHeat transfer rate [kW]solSolution
QCHeat transfer rate transferred to cooling water [kW]ssStainless Steel
RelReynolds number [dimensionless]vVapor
ShSherwood number [dimensionless]wWater
TTemperature [°C]equiEquilibrium
UOverall heat transfer coefficient [W m−2K−1] Greek letters
WAbsorber width [m]ΛSpacing between channels [m]
xAmmonia concentration [% by weight]βChevron angle [degree]
ΔtTime increment [s]υKinematic viscosity [m2 s−1]
LMCDLogarithmic mean concentration differenceμDynamic viscosity [kg m−1s−1]
LMTDLogarithmic mean temperature differenceρDensity [kg m−3]
Superficial enlargement
factor [dimensionless]

Appendix A

Table A1. Operating parameters and their respective accuracies summary.
ParameterNomenclatureOperating RangeAccuracy
Exchange areaAexc0.0504 m2±1.2%
Convective Coeficient of solution heat transfer hSOL0.8 a 2.0 kW·m−2·K−1±2.6%
Absorption flowFABS0.073 a 0.033 kg·m−2·s−1±1.5%
Convective coeficient of mass transfer Km48.9 a 17.5 kg·m−2·s−1±1.8%
Equivalent diameterDe-±0.5%
Mass velocity in the channelGC40 a 120 kg·m−2·s−1±1.3%
Solution viscosityµsol(9 a 1)·10−3 kg·m−1·s−1±5.6%
logarithmic mean temperature difference LMTD5 to 15±0.7%
logarithmic mean concentration differenceLMCD2 to 5±0.6%
Solution Nussel numberNuSOL1.4 to 1.9±2.7%
Solution Prandtl numberPrSOL15.1 to 2.5±3.1%
Solution Reynolds numberReSOL447 to 38±7.5%
Some views of the experimental system
Figure A1. Calibration work of Coriolis type flow meters.
Energies 11 02137 g0a1
Two views of the experimental system are shown. We observed PHE-type absorber, with its measuring and control instruments. The photos of the system are of the absorber without thermal insulation. Visual and digital measuring instruments were included for better operation, control and supervision during the experiments.
Figure A2. Two views of the experimental system.
Energies 11 02137 g0a2
Figure A3. Screenshot of HP VEE real-time graphs.
Energies 11 02137 g0a3
The screenshots presented in this appendix were generated with the HP VEE data acquisition program during the absorption experiments. They correspond only to representative examples of all tests performed. The HP VEE data acquisition program used for the acquisition of all data for the statistical analysis is shown below:
Figure A4. Screenshot of the HP VEE program used to acquire all necessary data.
Energies 11 02137 g0a4

References

  1. García-Valladares, O.; González, J.C.; Hernández, J.I.; y Brown, R.B. The Evaluation of a Small Capacity Shell and Tube Ammonia Evaporator. Appl. Therm. Eng. 2003, 23, 2151–2167. [Google Scholar] [CrossRef]
  2. McMullan, J.T. Refrigeration and environment-issues and strategies for the future. Int. J. Refrig. 2002, 25, 89–99. [Google Scholar] [CrossRef]
  3. Rivero, R. Programas integrales de ahorro de energía (exergía) en la industria petrolera. Revista del IMIQ año XXXVII 1996, 3–4, 26–30. [Google Scholar]
  4. Summerer, F. Evaluation of absorption cycles with respect to COP and economics. Int. J. Refrig. 1996, 19, 19–24. [Google Scholar] [CrossRef]
  5. Ayala, R. An Experimental Study of Heat Driven Absorption Cooling System. Ph.D. Thesis, University of Salford, Salford, UK, 1995. [Google Scholar]
  6. Antonopoulos, K.A.; Rogdakis, E.D. Performance of solar-driven ammonia-lithium nitrate and ammonia—Sodium thiocyanate absorption systems operating as coolers or heat pumps in Athens. Appl. Therm. Eng. 1996, 16, 127–147. [Google Scholar] [CrossRef]
  7. Sun, D.-W. Comparison of the performances of nh3-h2o, nh3-lino3 and nh3-nascn absorption refrigeration systems. Energy Convers. Manag. 1998, 39, 357–368. [Google Scholar] [CrossRef]
  8. Cerezo, J.R.; Best, R. Estudio del Proceso de Absorción con Diferentes Fluidos de Trabajo en Intercambiadores de Placas para Equipos de Refrigeración por Absorción; Internal Report, Post PhD; Centro de Investigación en Energía de la UNAM: Temixco, Mexico, 2010. [Google Scholar]
  9. Lee, K.B.; Chun, B.H.; Lee, J.C.; Lee, C.H.; Kim, S.H. Experimental analysis of bubble mode in a plate-type absorber. Chem. Eng. Sci. 2002, 57, 1923–1929. [Google Scholar] [CrossRef]
  10. Kang, Y.T.; Nagano, T.; Kashiwagi, T. Visualization of bubble behavior and bubble diameter correlation for nh3–h2o bubble absorption. Int. J. Refrig. 2002, 25, 127–135. [Google Scholar] [CrossRef]
  11. Kang, Y.T.; Nagano, T.; Kashiwagi, T. Mass transfer correlation of NH3-H2O bubble absortion. Int. J. Refrig. 2002, 25, 878–886. [Google Scholar] [CrossRef]
  12. Kang, Y.T.; Christensen, R.N. Ammonia-water (NH3-H2O) absorber with a plate heat exchanger. ASHRAE Trans. 1998, 11, 1565–1575. [Google Scholar]
  13. Cerezo, J.R. Estudio del Proceso de Absorción con Amoniaco Agua en Intercambiadores de Placa para Equipos de Refrigeración por Absorción. Ph.D. Thesis, Universitat Rivira i Virgili, Tarragona, Spain, 2006. [Google Scholar]
  14. Ayub, Z.H. Plate heat exchanger literature survey and new heat transfer and pressure drop correlations for refrigerant evaporators. Heat Transf. Eng. 2003, 24, 3–16. [Google Scholar] [CrossRef]
  15. Oronel, C.; Amaris, C.; Bourouis, M.; Vallès, M. Heat and mass transfer in a bubble plate absorber with NH3/LiNO3 and NH3/(LiNO3+H2O) mixtures. Int. J. Therm. Sci. 2013, 63, 105–114. [Google Scholar] [CrossRef]
  16. Best, R.; Rivera, W. A review of thermal cooling systems. Appl. Therm. Eng. 2014, 75, 1162–1175. [Google Scholar] [CrossRef]
  17. Libotean, S.; Martín, A.; Salavera, D.; Valles, M.; Esteve, X.; Coronas, A. Densities, viscosities, and heat capacities of ammonia + lithium nitrate and ammonia + lithium nitrate + water solutions between (293.15 and 353.15) k. J. Chem. Eng. Data 2008, 53, 2383–2388. [Google Scholar] [CrossRef]
  18. Infante Ferreira, C.A. Thermodynamic and physical property data equations for ammonia-lithium nitrate and ammonia-sodium thiocyanate solutions. Sol. Energy 1984, 32, 231–236. [Google Scholar] [CrossRef]
  19. Conde, M. Thermodynamic Properties of {NH3+ H2O} Mixtures for the Industrial Design of Absorption Refrigeration Equipment. Available online: http://www.mie.uth.gr/ekp_yliko/NH3_H2OProperties_1.pdf (accessed on 16 July 2018).
  20. Kakaç, S.; Liu, H. Heat Exchangers: Selection, Rating, and Thermal Design, 2nd ed.; CRC Press: Boca Raton, FL, USA, 2002; pp. 373–404. ISBN 0-8493-0902-6. [Google Scholar]
  21. Wang, L.; Sunden, B.; Manglik, R.M. Plate Heat Exchangers: Design, Applications and Performance, 2nd ed.; WIT Press: Southampton, UK, 2007; ISBN 978-1-85312-737-3. [Google Scholar]
  22. Cerezo, J.; Bourouis, M.; Vallès, M.; Coronas, A.; Best, R. Experimental study of an ammonia–water bubble absorber using a plate heat exchanger for absorption refrigeration machines. Appl. Therm. Eng. 2009, 29, 1005–1011. [Google Scholar] [CrossRef] [Green Version]
  23. Kang, Y.T.; Akisawa, A.; Kashiwagi, T. Analytical investigation of two different absorption modes: Falling film and bubble types. Int. J. Refrig. 2000, 23, 430–443. [Google Scholar] [CrossRef]
  24. Kang, Y.; Kunugi, Y.; Kashiwagi, T. Review of advanced absorption cycles: Performance improvement and temperature lift enhancement. Int. J. Refrig. 2000, 23, 388–401. [Google Scholar] [CrossRef]
  25. Lee, J.C. A study on numerical simulations and experiments for mass transfer in bubble mode absorber of ammonia and water. Int. J. Refrig. 2003, 26, 551–558. [Google Scholar] [CrossRef]
  26. Treybal, R.E. Operaciones de Transferencia de Masa, 2nd ed.; McGraw-Hill: Mexico City, Mexico, 1987. [Google Scholar]
  27. Mejbri, K.; Bellagi, A. Modelling of the thermodynamic properties of water-ammonia mixture by three different approaches. Int. J. Refrig. 2006, 29, 211–218. [Google Scholar] [CrossRef]
  28. Çengel, Y.A. Heat Transfer a Practical Approach, 2nd ed.; McGraw-Hill: Mexico City, Mexico, 2003. [Google Scholar]
  29. Incropera, F.P.; DeWitt, D.P. Fundamentals of Heat and Mass Transfer, 5th ed.; John Wiley & Son: Hoboken, NJ, USA, 2002. [Google Scholar]
  30. Infante Ferreira, C.A. Operating Characteristics of NH3-LiNO3 and NH3-NaSCN Absorption Refrigeration Machines. In Proceedings of the Nineteenth International Congress of Refrigeration, Hague, The Netherlands, 20–25 August 1995; pp. 321–328. [Google Scholar]
  31. Venegas, M.; Arzoz, D.; Rodriguez, P.; Izquierdo, M. Heat and mass transfer in LiNO3-NH3 spray absorption system. Int. Commun. Heat Mass Transf. 2003, 30, 805–815. [Google Scholar] [CrossRef]
  32. Zacarías, A.; Venegas, M.; Ventas, R.; Lecuona, A. Experimental assessment of ammonia adiabatic absorption into ammonia–lithium nitrate solution using a flat fan nozzle. Appl. Therm. Eng. 2011, 31, 3569–3579. [Google Scholar] [CrossRef] [Green Version]
  33. Jiang, J.; He, G.; Liu, Y.; Liu, Y.; Cai, D. Flow boiling heat transfer characteristics and pressure drop of ammonia-lithium nitrate solution in a smooth horizontal tube. Int. J. Heat Mass Transf. 2017, 108, 220–231. [Google Scholar] [CrossRef]
  34. Jiang, J.; Liu, Y.; He, G.; Liu, Y.L.; Cai, D. Experimental investigations and an updated correlation of flow boiling heat transfer coefficients for ammonia/lithium nitrate mixture in horizontal tubes. Int. J. Heat Mass Transf. 2017, 112, 224–235. [Google Scholar] [CrossRef]
  35. Palacios, E.; Izquierdo, M.; Marcos, J.D.; Lizarte, R. Evaluation of mass absorption in LiBr flat-fan sheets. Appl. Energy 2009, 86, 2574–2582. [Google Scholar] [CrossRef]
Figure 1. Schematic diagram of the device to study the bubble absorption process in a plate heat exchanger.
Energies 11 02137 g001
Figure 2. Diagram and photograph of a chevron plate heat exchanger. (a) Detailed inner main parameters; (b) the assembly of the modified PHE, with the measuring and control instruments.
Energies 11 02137 g002
Figure 3. Inner distributor of ammonia vapor placed in the central channel of the PHE. (a) general view of the vapor distributor; (b) close up of the tube with perforations.
Energies 11 02137 g003
Figure 4. Experimental valid tests, their respective concentrations, concentration difference and Reynolds number of solution.
Energies 11 02137 g004
Figure 5. Solution heat transfer coefficient and the channel mass velocity of the solution, GCsol, as a function of Reynolds Number.
Energies 11 02137 g005
Figure 6. Prandtl number as a function of the solution Reynold number.
Energies 11 02137 g006
Figure 7. Mass absorption flux, FABS to different conditions of GCsol and both with respect to Resol.
Energies 11 02137 g007
Figure 8. Mass transfer coefficient and vapor flow rate as a function of solution Reynolds number.
Energies 11 02137 g008
Figure 9. Mass transfer coefficient, Km and LMTD as a function of Resol.
Energies 11 02137 g009
Table 1. Main dimensions of a plate heat exchanger.
ParameterDimension
Spacing between channels, Λ [mm]6
Inter-plate channel height, b [mm]2.18
Effective width length, Lh [mm]77
Pattern length, Lp [mm]275
Effective height length, Lv [mm]280
Inside width between gaskets edges Lw [mm]82
Port diameter, Dp [mm]25
Number of passes, Np 1
Chevron angle, β [degree]30
Table 2. Parameters of the sensors used in the experimental study and associated uncertainty values.
SensorDeviceOperating RangeAccuracy
TemperatureRTD−180 a 520 °C±0.2 °C
Mass flowCoriolis0 a 5 kg·min−1±0.1%
DensityCoriolis700 a 1200 kg·m−3±0.1%
Pressurepiezoelectric0 a 10 bar±0.15%
Mass flowTurbine0 a 30 kg·min−1±0.2%
Table 3. Comparative chart of Some Mass and Convective Heat transfer coefficients Km reported in the literature with NH3-LiNO3, NH3-H2O and H2O-LiBr.
ParameterResolhsol
[kW m−2K−1]
Km·10−5
[m s−1]
MethodSolution
Oronel et al. [15]10–702.5–8.016.7–38.9Experimental bubble mode absorptionNH3-LiNO3
Cerezo et al. [22]170–3702.7–5.4100–200Experimental bubble mode absorptionNH3-H2O
Infante Ferreira [30] 0.115 Experimental falling filmNH3-LiNO3
Venegas et al. [31]10–2505.818.6Numerical spray absorptionNH3-LiNO3
Zacarias et al. [32]6–17 34–101Experimental spray flat fanNH3-LiNO3
Jiang J.A. et al. [33]300–9500.97–1.95--Experimental flow boiling in smooth horizontal tubesNH3-LiNO3
Jiang J.A. et al. [34]300–9500.95–1.95--Experimental flow boiling in horizontal tubesNH3-LiNO3
Palacios E. et al. [35] 30Experimental spray flat fanH2O-LiBr
This work20–4500.96–3.00820–1500Experimental bubble mode absorptionNH3-LiNO3

