Abstract
With the opening of electric retail side, premium power value-added service has become a main concern for both sensitive customers (SCs) and new electric retail companies (NERCs). However, due to the lack of appropriate investment strategy and optimal premium power investment scheme (PPIS) determination method, the premium power market is difficult to form, thus SCs’ demand for premium power is difficult to meet. Under such condition, how to determine the investment strategy and choose the optimal PPIS are problems that need to be solved. Motivated by this, this paper proposes a multi–participant premium power investment strategy and an optimal PPIS determination method. Suppose that the NERC and the corresponding SCs have already been determined, according to two–sided matching theory, taking SCs’ and NERC’s disappointment–rejoicing psychological perceptions into consideration, premium power perceived utility (PU) (i.e., the perceived effectiveness or satisfaction degree) can be obtained, and a multi-objective optimization model of investment scheme is established. Finally, a field survey has been conducted by the authors on typical high-tech manufacturers (HTMs) located in a High-Tech Park in Sichuan, China. The matching results have been verified by the actual survey. The proposed method is a good way to manage the premium power market.
1. Introduction
Voltage sags and short-time interruptions are the most serious power quality disturbances [1]. High-tech manufacturers are very sensitive to such kinds of event-based disturbances [2,3], suffering from significant economic losses [4] and being eager to obtain premium power. Based on references [5,6,7] and Chinese electric power industrial standard DL/T 1412-2015 “Technical specification for Premium Power Park power supply (in Chinese) [8]”, premium power can be defined as: the power supplied to sensitive customers who are more sensitive to power quality disturbances than other customers through the use of the state-of-the-art custom power devices, such as uninterruptable power supply (UPS), dynamic voltage restorer (DVR), static VAR compensator (SVC), etc. The term “premium power” is used by some international organizations and in some literature, wherein “premium” refers to the premium value. Namely, premium power is the electric power with premium value perceived by customers, including not only those solutions applied to the distribution systems supplying the enterprises, but also those cost-effective solutions implemented inside the manufacturing enterprises. Technically speaking, premium power can be characterized by premium power index and premium power value, which have already been proposed in [9]. Whether to invest in the premium power and how to make an investment depends on the customers’ perception of premium power for the most part [9]. Technically speaking, premium power can be characterized by premium power index and premium power value, which have already been proposed in [9]. Because of space constraints, the details can be found in [9].
In 2013, China electric power industry standard was published [8], offering guidance for the implementation of premium power. However, the amount of investment for premium power is very large, and because of the lack of corresponding market mechanism, premium power implementation problems cannot be solved. Actually, premium power not only refers to the premium power quality, but also the premium power supply service. Under the condition of the traditional electric market, the traditional electric power company operates on the basis of single purchase and sale of electricity, and customers have no choice but to choose the electric power company. Although customers demand premium power, due to the lack of options, the premium power market is difficult to form and operate. Thus, the premium power market share is limited [10]. However, with the publication of “Document 9” [11], and the establishment of power trading centers in China [12], the electricity retail side is beginning to open. Under the background of the opening of the electric retail side, the power supply mode will develop towards customization and marketization. The electric power company and customers can choose their own trading partners, and especially for customers, they have an opportunity to purchase both electricity and premium quality service. What is more, the electric power company will also make a change, that is, not only do they supply power, but also comprehensively supply premium quality service. Under such a market and economic mechanism, carrying out research into premium power is important and necessary.
Current studies about premium power mainly focus on custom power [13,14,15], voltage sag mitigation and its optimization [16,17,18], techno-economic characteristics [19,20,21], project demonstrations [5,22], load management in smart grid [23,24,25], customer demand response [26,27], etc. The research on custom power, voltage sag mitigation and its optimization are mainly focused on the topology structures of customer power devices, and the voltage sag mitigation technology. Techno-economic characteristics mainly concentrate on analyzing a particular custom power device, and project demonstrations are from the perspective of the operating principle of premium power park. Load management and customer demand response are mainly about integrating load management into the normal operation of the power system to meet customers’ load demands, which is only from the perspective of customers. Furthermore, there are also essential cutting-edge papers about managing the electricity cost, such as in [28], which focuses on economic and environmental perspectives to minimize the total daily energy cost in a smart residential building. Furthermore, authors in [29] proposed a method to jointly manage the maintenance costs and the electricity consumption in a cloud data center. Other research is about intelligent algorithms which are utilized to minimize power cost [30,31].
However, to the best of our knowledge, the studies of premium power investment strategy and the optimal investment scheme are insufficient. Furthermore, current research is mainly from the perspective of cost; it does not consider the satisfaction degree of the main participants of the investment. On one hand, appropriate investment strategy and the optimal investment scheme determination method can be helpful for customers to make an investment in premium power. On the other hand, improving power quality can significantly reduce the complaints of the sensitive customers. In [9], the authors have proposed a premium power valuation method, but the premium power investment strategy and the optimal investment scheme are not studied. What is more, reference [9] is only from the perspective of sensitive customers. Actually, the premium power investment scheme (PPIS) is a result of considering the satisfaction degree of all the main participants, not only the sensitive customers. Motivated by the above analysis, introducing a premium power investment strategy and an optimal investment scheme determination method is necessary.
From a traditional viewpoint, the problem of event-based disturbances and the related sensitive customers’ demands for premium power are the problems between the electric power companies and sensitive customers [32]. In fact, electric power companies cannot invest in the entire power grid to meet the demands of sensitive customers, which is also not realistic given the technology. What is more, premium power is related to customers’ perceived utility and investment ability [33,34]. In addition, a majority of customers’ investment ability, understanding of perceived premium power utility and premium power value are limited, leading to the difficulty in making an investment decision. Under the background of the opening of the electric retail side, the electric retail market will show a pattern of “multi-buyer and multi-seller”, that is, the traditional electric power company, the third-party independent electric retail company, or the consortium of the two will compete for the market share [12]. As for premium power, because of the high investment cost, premium power supply problems cannot be solved only by the traditional electric power company and the customers. Furthermore, due to the limited market share and the lack of systematic analysis of customers’ demands, the third-party independent electric retail company also struggles to carry out the premium power supply service. Therefore, it is necessary to combine the traditional electric power company and the third-party independent electric retail company together to form a new electric retail company. On one hand, based on the recorded voltage sag data and the corresponding analysis results, the traditional electric power company can provide the voltage sag information, and custom power device installation guidance. On the other hand, the third-party independent electric retail company can provide premium power service and technology. What is more, the traditional electric power company has a large percent of market share, which can bring more market opportunities for the implementation of premium power. Thus, in order to supply premium power to sensitive customers, it is necessary to introduce a possible mechanism, which needs the local government (LG), the traditional electric power company (TEPC), sensitive customers (SCs) and the new electric retail company (NERC) to participate in [35]. With the help of LG, the TEPC takes measures to optimize the network structure and operations on the grid side to guarantee better system indices, site indices and single-event indices of event-based disturbances occurring in the power gird, while SCs and the NERC work together to solve the compatibility problem between sensitive equipment (or processes) and the connecting point (or the connecting system) to guarantee sensitive customers’ demands for premium power.
Under the possible mechanism of joint participation of the LG, TEPC, SCs and the NERC, the direct investors to ensure sensitive customers’ demands for premium power are SCs and the NERC, while TEPC’s investment is the foundation and LG’s supervision is a guarantee. The NERC’s participation in the premium power investment can better meet the SCs’ demands, and the NERC can obtain benefits. Under such an investment pattern, reasonable matching between SCs’ premium power demands and the premium power level brought by the NERC’s investment can be investigated. SCs’ and the NERC’s satisfaction degree is of a necessity to solve the optimization problem of the stable two-sided matching [36] between the SCs and the NERC. The stable matching between SCs’ premium power demands and the premium power level brought by different premium power investment schemes (PPISs) provided by NERC depends on the benefit, cost and perceived utility (PU). However, the two sides’ foothold is different. SCs pay more attention to the PU while the NERC is more concerned about the investment and return, both relating to the two sides’ disappointment-rejoicing psychological perceptions [37].
In this paper, the traditional electric power company and the third-party independent electric retail company are combined to form a new electric retail company. The new electric retail company is introduced to participate in the premium power investment and a systematic investment strategy of joint participation of local government, traditional electric power company, sensitive customers and new electric retail company is proposed. The organization of this paper is as follows. Section 2 describes the premium power investment strategy of multi-participant. Section 3 explains the preference utility of the sensitive customers and the new electric retail company. Based on disappointment-rejoicing psychological perceptions, Section 4 presents two sides’ perceived utility. Section 5 presents the multi-objective optimization of investment schemes, and an empirical analysis has been conducted in Section 6. Finally, conclusions are drawn in Section 7.
2. Premium Power Investment Strategy of Multi-Participant
Premium power demands of high-tech manufacturers (HTMs) and the corresponding investment are not only related to SCs and TEPC, but also the LG who benefits from the taxation and development of local economy and industries. Therefore, premium power stakeholders involve LG, TEPC and SCs. From the perspective of benefit, SCs are the direct gainers, while the LG is the second gainer who gets the indirect benefits from the taxation and economic structure optimization. The TEPC get the more indirect benefits from the realization of enterprise image and social value. Under the condition of traditional electricity price policy, it is difficult for the TEPC to get direct benefits by providing premium power, because HTMs’ demands for power quality are high and the actual electric power consumption cost occupies only a small proportion of the production cost. Therefore, under the background of the opening of electric retail side, taking advantage of the economic and market mechanism, the combination of the TEPC and the third-party independent electric retail company together to form a NERC is necessary. On one hand, the TEPC is responsible for network optimization, better operations and optimization of the power grid’s power quality level on the grid side. On the other hand, as a part of NERC, the TEPC work together with the third-party independent retail company to invest in premium power. Under such a condition, a joint participation of LG, TEPC, SCs, and NERC in the premium power investment is a promising strategy. The multi-participant premium power investment strategy is shown in Figure 1.
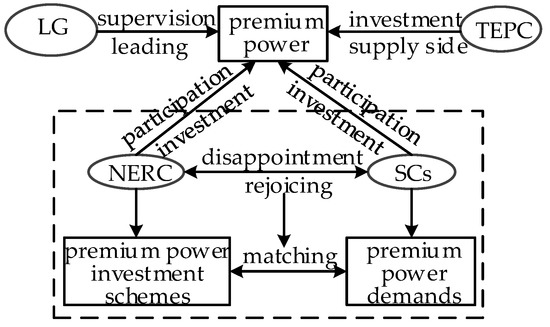
Figure 1.
The multi-participant premium power investment strategy.
In the premium power investment strategy, the LG is responsible for supervision, the TEPC for improving the power grid’s power quality level at the grid side, and SCs together with the NERC are responsible for the sensitive equipment’s or processes’ immunity level to improve the compatibility level between sensitive equipment and event-based disturbances. The NERC will share the investment and provide the service which can ensure customers’ needs for premium power.
In Figure 1, the stable matching between SCs’ actual demands and premium power level plays an important role. Therefore, a stable matching condition should be researched to obtain the optimal investment scheme, and it is also necessary to consider the satisfaction degree of SCs and the NERC based on disappointment-rejoicing psychological perceptions.
3. The Preference Utility of Sensitive Customers and the New Electric Retail Company
Different sensitive customers have different demands for premium power, and show different preference degree to different premium power investment schemes. Similarly, different SCs’ investment bring different benefits to the NERC, and the NERC shows a different preference degree to SCs. In this section, at first, SCs’ premium power demands, and premium power level brought by different PPISs provided by the NERC are described. Then, net present value brought by different investment schemes and the benefit brought by different customers’ investment are calculated and ranked first. Finally, based on the ranking results, preference utility is used to indicate the preference degree of SCs and NERC, respectively.
3.1. SCs’ Demands for Premium Power and Premium Power Level Brought by PPISs Provided by NERC
The optimal investment scheme determination is based on the matching between SCs’ premium power demands and the premium power level brought by premium power investment schemes. The principle of two-sided matching is shown in Figure 2. It is supposed that the NERC and the corresponding SCs have already been determined. The matching between SCs’ demands and the premium power level is the focus of this paper. When more than one NERC exists, there will be competition, which will not affect the scheme determination method, but has an effect on the profit of the NERC.
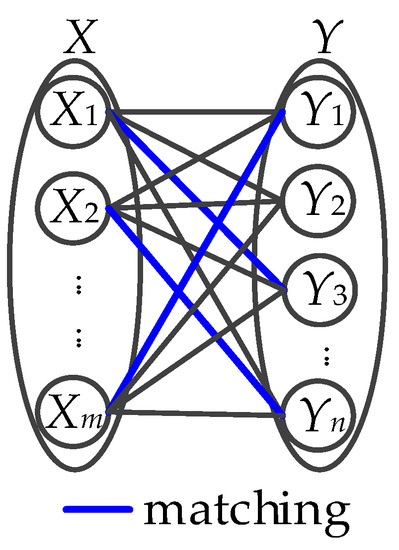
Figure 2.
Schematic diagram of two-sided matching.
In Figure 2, X = {X1, X2, …, Xi, …, Xm} and Y = {Y1, Y2, …, Yj, …, Yn} are the set of SCs’ premium power demands, and the set of premium power level brought by the premium power investment schemes provided by the NERC, respectively. m is the number of customers or sensitive equipment, and n is the number of investment schemes. It is assumed that I = {1, 2, …, i, …, m}, J = {1, 2, …, j, …, n} (m < n).
SCs’ premium power demands refer to the fact that the voltage sags occurring at the customer connection point do not have an effect on the normal operation of sensitive equipment or processes, that is, voltage sag risk should be controlled at the lowest level. Actually, under the same voltage sag level (i.e., the voltage sag magnitude and the duration are the same), the voltage sag effect depends on the immunity level of customers’ sensitive equipment or processes. Thus, customers’ premium power demands actually depend on the immunity level of customers’ sensitive equipment or processes. As for the premium power level brought by the PPISs (provided by the NERC), it refers to the voltage sag magnitude and duration which should be controlled within a certain range. UPS DVR, SVC, etc. are common custom power devices utilized to mitigate voltage sags. Thus, elements of X can be the voltage sag immunity level of sensitive equipment or processes, which can be characterized by the lowest voltage sag magnitude or the longest duration the equipment or process can encounter. Furthermore, the elements of Y can be the custom power devices which can control the voltage sag magnitude and duration within a certain range. In order to make the definitions of the elements of X and Y clearer, an example is given below.
Considering that different equipment connected in series or parallel to form different processes, the process immunity time (PIT) curve [18] can be used as an example to characterize the immunity level of sensitive processes. PIT is usually used to characterize the variation of physical parameters after industrial processes encounter voltage sags. PIT is the duration of the physical parameter changing from rated value to an acceptable threshold value, when the industrial process has undergone a voltage sag, shown in Figure 3. and are the normal and the limited physical parameters. is the start time of voltage sag, is the response time delay, and is the instant when the physical parameter is smaller than . In Figure 3a, . It is clear from Figure 3b that the values of PIT are different when the voltage sag magnitudes are different.

Figure 3.
The definition of process immunity time (PIT), (a) is PIT of a single voltage sag magnitude, (b) is PIT of different voltage sag magnitudes.
PIT can be regarded as the longest duration the equipment or process can encounter. Sensitive processes response characteristic to voltage sag is shown in Figure 4.
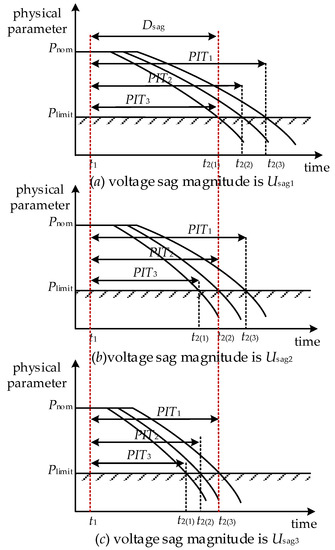
Figure 4.
Response characteristic of process to voltage sag.
In Figure 4, is the voltage sag duration, which is regarded as a constant value in this example. , and are three different voltage sag magnitudes. , and represent the PIT of three different sensitive processes, that is, customers’ different demands for premium power level. In practice, temperature or humidity are common physical parameters.
As we can see from Figure 4, when the voltage sag magnitude is the same, , that is, customer3 is the one who is the most likely to encounter an economic loss when suffering from a voltage sag. A, AA and AAA are used to represent the three customers’ demands for premium power level, in which A refers to normal, AA represents good, and AAA represents premium. Take customer2 as an example. It is clear from Figure 4b that when the voltage sag magnitude is , , which is the critical point of customer2’s demand. Thus, for customer2, should be greater than , which means that the premium power level brought by the premium power investment schemes provided by the NERC should meet this condition.
According to Figure 4, the relationship between customers’ demands for premium power, and the premium power level brought by the investment schemes is shown in Table 1.

Table 1.
The relationship between sensitive customers’ (SCs’) demands, and the premium power level.
3.2. Preference Ordinal Number
It is common that the same customer shows different preference degree to different PPISs, and for the same PPIS, the NERC also shows different preference degree to different customers, thus, PPISs and customers are ranked in this section.
Net present value (NPV) is a measure of economic efficiency and validity of the premium power investment [38], which is the difference between total annual savings and the initial investment [39]. Equation (1) was introduced to calculate the NPV of PPISs based on SCs’ demands. The NPV results were used to rank the investment schemes. The sequence numbers were defined as the preference ordinal numbers, indicating SCs’ preference information.
where, r1 is the annual discount rate, decided by SCs’ expected return rate; Ct is the savings for the t–th year, composed of customers’ annual benefit and operation cost; K is the operating years of the schemes and A is the agreement cost paid to the NERC, including equipment purchase cost.
Premium power investment schemes can bring benefits to NERC. Equation (2) was used by NERC to calculate the benefits of investment schemes based on SCs’ demands. According to the calculation results, the customers are ranked, i.e., the preference ordinal numbers.
where, Benefit is the total benefit obtained by the NERC throughout all the m years; r2 is the annual discount rate, decided by the NERC’s expected return rate, and Coperate is the annual operation cost paid by the customers.
Actually, preference refers to SCs’ attitudes towards the set of premium power investment schemes, and NERC’s attitudes towards the set of customers. It is used to make a judgement in the sense of satisfaction and unsatisfaction of SCs and NERC.
It is assumed that R = [rij]m×n and T = [tij]m×n are the preference ordinal number matrixes for investment schemes and customers. The rij is the ranking of Yj for Xi, which means Xi’s preference degree towards Yj. The smaller rij indicates the greater preference degree [40]. As for investment scheme Yj, the value of tij reflects the NERC’s preference degree towards customer Xi. The above two preference ordinal numbers are strict ordinal number, that is, when j ≠ l, rij ≠ ril; when I ≠ p, tij ≠ tpj.
3.3. Preference Utility
Customers’ perceived utility can be used to characterize premium power value [9]. Customers’ satisfaction degree can be reflected by the utility brought by the premium power investment [41,42]. In fact, sensitive customers’ demands are distinct, while different investment schemes bring different benefits to the NERC. Therefore, the preference degree of one side to the other side could be measured by the preference utility.
It is supposed that the preference utility of Xi for Yj and Yj for Xi are expressed as v(rij) and v(tij) respectively.
In the above equations, n is the number of PPISs, and m is the number of SCs. It is obvious from the above two equations that a greater preference ordinal number indicates smaller preference utility, and the less likely customers or NERC will choose the corresponding premium power investment scheme.
4. Perceived Utility Considering Two Sides’ Disappointment-Rejoicing Psychological Perception
Premium power investment scheme determination is related to both SCs and NERC. It is actually a result of meeting both sides’ satisfaction degree, which can be characterized by PU. PU is SCs and NERC’s satisfaction degree towards the two-sided matching results based on utility theory, which is a psychological evaluation [41] relating to the disappointment-rejoicing psychological perception [37]. Disappointment is the feeling of dissatisfaction that follows the failure of expectations towards the matching results, which mainly focus on the outcome itself. Furthermore, as for rejoicing, it is the feeling of satisfaction that follows the success of expectations towards the matching results. Both disappointment and rejoicing are subjective responses relating to the anticipated matching results. The details are given as follows.
Assume that in the corresponding customer Xi’s mind, as for the set of PPISs , the rank of the preference ordinal number for the elements of Y is . If Xi is matched with Yj, represented as μ(Xi) = Yj, satisfaction degree of SCs depends on both Yj, and other elements of Y besides Yj. The customer can be disappointment, because is not matched with any one of . We know that any element in is better than . In addition, the customer can also be rejoicing, because is not matched with any one of . We know that any element in is worse than .
It is the same for the analysis of the new electrical retail company’s disappointment-rejoicing psychological perception. Assume that in the corresponding new electrical retail company’s mind, as for the customer set and investment scheme , the rank of the preference ordinal number for the elements of X is . If Yj is matched with Xi, represented as μ(Yj) = Xi, as for Yj, satisfaction degree of NERC depends on both Xi, and other elements of X besides Xi. The NERC can be disappointment, because is not matched with any one of . We know that any element in is better than . In addition, the customer can also be rejoicing, because is not matched with any one of . We know that any element in is worse than .
Therefore, SCs’ and NERC’s disappointment-rejoicing psychological perceptions should be taken into account, and PU should be introduced to characterize SCs’ and NERC’s satisfaction degree.
If SCs’ demands Xi is matched with the premium power level brought by the scheme Yj (provided by the NERC), SCs’ PU is expressed as u(rij). u(rij) is the preference utility correction of Xi for Yj under the consideration of the disappointment-rejoicing psychological perception. According to the disappointment theory [43], u(rij) can be calculated as follows.
In Equation (5), D(·) and E(·) represent disappointment function and rejoicing function respectively; ωD and ωE indicate the weight (ωD, ωE ≥ 0, ωD + ωE = 1). It is clear from Equation (5) that when SCs’ demands Xi is matched with the premium power level brought by the scheme Yj provided by the NERC, SCs’ PU can be regarded as a summation of three parts, i.e., (i) customer’s preference utility, (ii) customer’s disappointment psychology when Xi is not matched with the scheme which is better than Yj, and (iii) customers’ rejoicing psychology when Xi is not matched with the scheme which is worse than Yj.
If the investment scheme Yj provided by the NERC is matched with SCs’ demand Xi, the NERC’s PU is . is the preference utility correction of Yj for Xi under the consideration of disappointment-rejoicing psychological perception.
It is clear from Equation (6) that when the scheme Yj provided by the NERC is matched with SCs’ demands Xi, NERC’s PU can be regarded as a summation of three parts, i.e., (i) NERC’s preference utility, (ii) NERC’s disappointment psychology when the scheme Yj is not matched with the customer who is better than Xi, and (iii) NERC’s rejoicing psychology when the scheme Yj is not matched with the customer who is worse than Xi.
The matching results indicated that the psychological perceptions of SCs and the NERC are distinct. The disappointment aversion psychology of SCs and the NERC are taken into account [37]. The disappointment function (D(x)) and rejoicing function (E(x)) are as follows.
where, α (0 < α < 1) and β (0 < β < 1) are the disappointment and rejoicing parameters respectively. The smaller α indicates that the stronger the disappointment perceptions of SCs and the NERC, the less likely the SCs and the NERC will make an investment in premium power. The smaller β demonstrates that the stronger the rejoicing perceptions, the more likely the SCs and the NERC will make an investment in premium power.
5. Multi-Objective Optimization of Investment Schemes
In this section, based on the obtained PU of SCs and the NERC towards the matching results, a multi-objective optimization model is constructed. Then, a weighted sums method based on membership function is used to solve the model. Finally, a flowchart describing the optimal investment scheme determination process is given.
5.1. Multi-Objective Optimization Model
The 0–1 variables xij are introduced to facilitate the calculation, that is,
For maximizing the PU of SCs and the NERC, a multi-objective optimization of stable two-sided matching model is developed.
subject to
As for the above model, Equations (10) and (11) are the objective functions, indicating the maximization of PU of the SCs and the NERC. It is supposed that m < n, Equation (12) is the equality constraint, which means that each element of X must and can only match with an element of Y. Furthermore, Equation (13) is the inequality constraint, which means that each element of Y at most can match with an element of X. Equation (14) is the constraint condition of stable two-sided matching [44,45], explaining that if Xi and Yj are not matched with each other, Xi will match with another element of Y, which is better than Yj in the customers’ minds, or Yj will match with another element of X, which is better than Xi in the NERC’s mind, that is, at least one of and equals one.
In order to make the above multi-objective function clearer, an example is given here. Assume that Xi is matched with Yj, we can obtain that xij = 1, xil = 0 (l = 1, 2, …, j − 1, j + 1, …, n), thus, Equation (12) can be obtained. If Yj is matched with Xi, we can obtain that xij = 1, xkj = 0 (k = 1, 2, …, i − 1, i + 1, …, m), but if Yj is not matched with any element of X, xkj = 0 (k = 1, 2, …, i − 1, i, i + 1, …, m), thus, Equation (13) can be obtained.
5.2. Optimization Model Solving and Matching Process
Based on reference [46], the weighted sums method based on membership function is used to solve the above optimization model. Assume that , and , are the optimal value and the worst value of Z1 and Z2 when only considering the single-objective function Z1 and Z2. The detailed calculation steps can be found in [34]. The membership function and of Z1 and Z2 can be defined as follows.
Assume that ω1 and ω2 are the weights of and , 0 ≤ ω1 ≤ 1, 0 ≤ ω2 ≤ 1, ω1 + ω2 = 1, then, the multi-objective optimization model can be converted into a single-objective optimization model, that is,
subject to
Based on the above proposed objective function, the time complexity of the matching process is analyzed here. To get the preference ordinal number matrix, the cost of Equations (1) and (2) is . Since the number of the elements in the preference ordinal number matrix is , the time complexity is . What is more, Equation (5) requires , so Equation (18) requires in total. Therefore, the total time complexity of the matching process is .
Figure 5 illustrates the matching process between SCs and NERC.
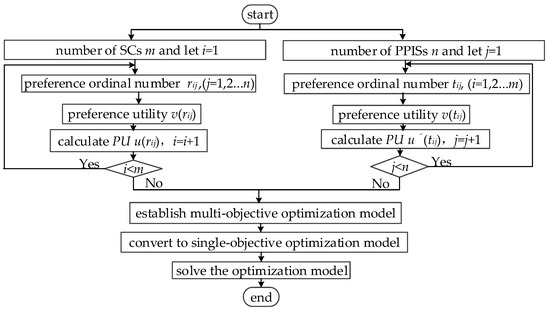
Figure 5.
Matching process between SCs’ and the premium power level.
6. Empirical Analysis
For validation of the proposed method, a field survey has been conducted on five high-tech manufacturers in Sichuan, China. Voltage sags are recorded from 2007 to 2015. Empirical analysis of the SCs’ and the NERC’s perceived utility has been calculated. The optimization model has been constructed, and the matching result can be obtained. Finally, SCs’ economic loss frequency before and after carrying out the corresponding mitigation scheme have been compared. The PU, the expected net benefit, and the investment of the customer are compared. The investment that the customers are likely to make is compared when only considering customers’ satisfaction degree. What is more, the effect of parameters, i.e., INV, Benefit, disappointment and rejoicing parameters on the PU is also investigated. Finally, the proposed method is also applied in huge scale problems. The results prove that the proposed method is rational and correct.
6.1. Parameters of the Empirical Analysis
The brief geography diagram is shown in Figure 6, while the internal network model is shown in Figure 7. The internal network model consists of three 220 kV substations, six 110 kV substations and 11 customers. The authors selected five typical sensitive high-tech manufacturers for the empirical analysis.
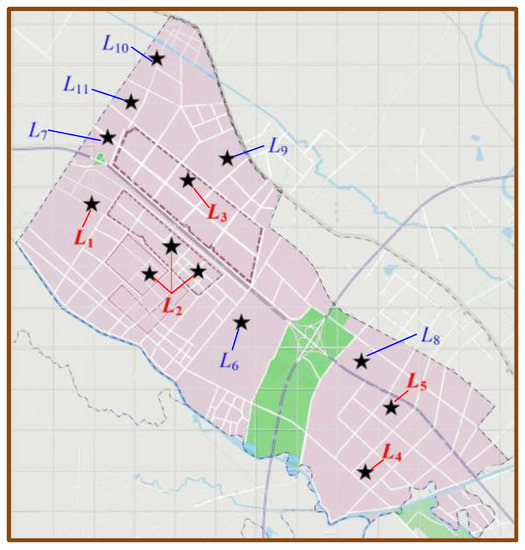
Figure 6.
Brief geography diagram of the high-tech manufacturers (HTMs) in the park.
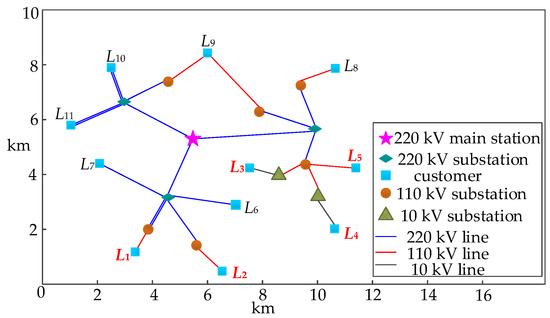
Figure 7.
Internal network model.
Power quality (PQ) monitoring devices Schneider ION 7650, are installed at each customer’s 10 kV bus connecting point. When voltage sags occur on the 10 kV bus, PQ monitoring devices will record the voltage sag events. The scatter plot of the measured voltage sags on the customer L1~L5 side and the SEMI F47 characteristic is shown in Figure 8. SEMI F47 is a specification for semiconductor processing equipment voltage sag immunity, indicating that sensitive equipment must tolerate voltage sags at a certain range of voltage magnitude and durations. When voltage sag is above the SEMI F47 curve, sensitive equipment can ride through, otherwise the equipment will break down. The voltage sag frequency of the customer L1~L5 from 2007 to 2015 is shown in Figure 9.
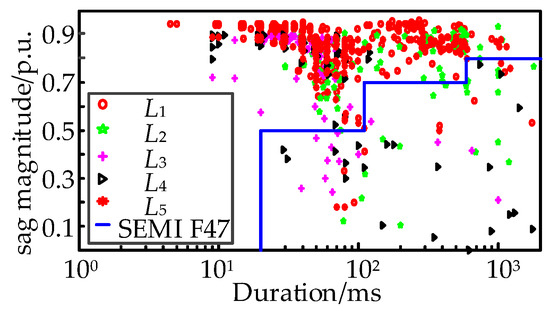
Figure 8.
Scatter plot of the measured voltage sags of L1~L5 and the SEMI F47 characteristic.
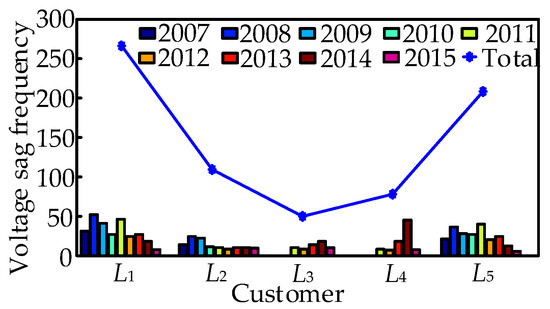
Figure 9.
Voltage sag frequency statistics for L1~L5.
As shown in Table 2, is the set of PPISs provided by the NERC [19,20,21,47], which are based on to the voltage sag effect on the SCs and the customers’ internal actual mitigation devices. It is supposed that one custom power technology is involved in each investment scheme, which does not affect the verification.

Table 2.
Premium power investment schemes set provided by the new electric retail company (NERC).
Medium disappointment aversion degree of SCs and NERC is supposed. Regression analysis method [36] is adopted to calculate α and β, which equal to 0.8. It is further supposed that the disappointment psychology and rejoicing psychology of SCs and the NERC plays the same role, i.e., ωD = ωE = 0.5.
6.2. SCs’ and the NERC’s PU Calculation
In this subsection, SCs’ and the NERC’s preference utility are calculated firstly. PU can be obtained by considering the disappointment-rejoicing psychological perceptions of SCs and the NERC towards the two-sided matching results.
6.2.1. Preference Utility of SCs and the NERC
Suppose is the SCs’ preference ordinal number matrix towards the investment schemes provided by the NERC. denotes the NERC’s preference ordinal number matrix towards SCs. R and T can be obtained by combining Equations (1) and (2),
Based on Equations (3) and (4), R and T can be converted to preference utility matrixes VR and VT:
Different customers have different demands for premium power. The same customer may have various preference degree towards different investment schemes. For the same investment scheme, the preference degrees are distinct for different customers. The above statement is applied for the NERC’s preference degree. The results manifest that the preference utility of SCs and the NERC can be characterized reasonably by the proposed method.
6.2.2. PU of SCs and the NERC
Taking into account the disappointment-rejoicing psychological perceptions of SCs and the NERC towards the two-sided matching results and combining Equations (5)–(8), SCs’ and the NERC’s PU matrix can be obtained, which are also plotted in Figure 10.

Figure 10.
SCs’ and NERC’s PU, (a) is SCs’ PU towards different premium power investment schemes (PPISs); (b) is NERC’s PU towards different SCs, as for different PPISs.
Obviously, for the matching results, SCs’ and the NERC’s psychological perceptions show distinguishing results. A small PU will lead to a stronger disappointment perception and a lower satisfaction degree and vice versa. In Figure 10a, for the same PPIS, different SCs show different PU. For various PPISs, the same customer’s PU varies. The customers with stronger psychological perceptions have the stronger willingness to accept the corresponding investment scheme. As for Figure 10b, for the same investment scheme, the NERC shows different PU towards different customers, while for different investment schemes, the NERC also shows different PU towards the same customer. The results prove that the proposed method reasonably reflects the SCs’ and the NERC’s PU.
6.3. Optimization Model and Solving Method Verification
Combining SCs’ and NERC’s PU matrix U and U’ towards the two-sided matching results, through Equations (9)–(15), the optimal value and the worst value of Z1 and Z2 can be obtained when only considering the single-objective function Z1 and Z2, that is, = 5.0902, = 1.086, = 5.209, = 0.7910. According to Equations (16) and (17), the membership function of Z1 and Z2 can be obtained.
Considering the fairness between the SCs and the NERC, take ω1 = ω2 = 0.5 in the empirical analysis. Combining Equations (18) to (22), the single-objective optimization model can be obtained.
subject to
Solving the above single-objective optimization model by MATLAB, then,
Z* = 0.1343. The optimal two-sided matching result is μ* = {(X1, Y5), (X2, Y2), (X3, Y6), (X4, Y3), (X5, Y1)}, that is, customers’ demands X1, X2, X3, X4 and X5 are matched with the investment schemes Y5, Y2, Y6, Y3 and Y1 respectively. However, the investment schemes Y4, Y7 and Y8 do not meet the demands of the customers in the park. The investment schemes in which the customers actually invest and the corresponding investment that the customers are likely to make is summarized in Table 3.

Table 3.
Matching results and investment (INV) comparison for the proposed method and the reality.
As we can see from Table 3, although the matching results are different from the actual investment scheme, the investment of the matching results are very close to or even smaller than the actual investment of the schemes, except for customer L2. The reason is that due to the lack of appropriate guidance from NERC, customers may overcompensate voltage sags. What is more, the matching results can completely mitigate voltage sags that the corresponding customers encounter. The results prove the proposed method is rational and feasible.
6.4. Comparison among Different Situations
To verify the correctness and the effectiveness of the proposed method, the customer economic loss frequency before and after the investment have been compared firstly. Then, taking customer L1 as an example, the PU, expected net benefit (ENB), and INV re compared. Then, considering the satisfaction degree of SCs, the matching results and the corresponding investment the SCs are likely to make are compared. Finally, in order to investigate the effect of parameters (i.e., NPV, Benefit, the disappointment and rejoicing parameters) on PU, by varying only one parameter’s value, the corresponding PU are calculated.
6.4.1. Customer Economic Loss Frequency Comparison before and after the Investment
Suppose that after carrying out the above investment schemes for customer L1~L5, the reduced percentage of customer economic loss frequency is shown in Figure 11. N1 and N2 are customer economic loss frequency before and after carrying out the corresponding investment schemes. N1 and N2 can be obtained by the field collected data, that is, the total number of voltage sags occurring below SEMI F47 from 2007 to 2014. N2 is the voltage sag frequency in 2015 after the corresponding mitigation scheme has been carried out. When voltage sag is below the SEMI F47 curve, customer will encounter an economic loss, and when voltage sag is above the SEMI F47 curve, customer will face no economic loss. ε is the reduced percentage, that is,
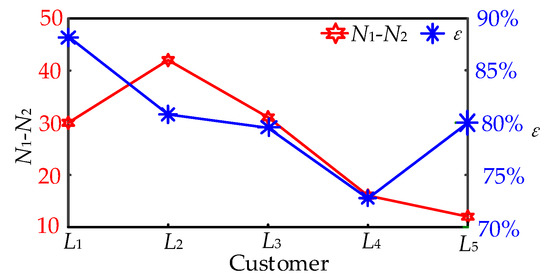
Figure 11.
Reduction of the frequency of economic losses after taking the investment schemes for L1~L5.
Obviously, as for customer L1~L5, after carrying out the schemes Y5, Y2, Y6, Y3 and Y1, the frequency of economic loss decreases significantly, and all the reduced percentages are greater than 70%, reflecting that the investment effect is obvious.
6.4.2. Comparison among PU, ENB and INV
Take customer L1 as an example, as for the investment schemes Y1~Y8, firstly, standardize PU, the ENB L1 likely to obtain after the investment and the investment (INV) L1 likely to make. Then, compare among PU, ENB and INV, shown in Figure 12.
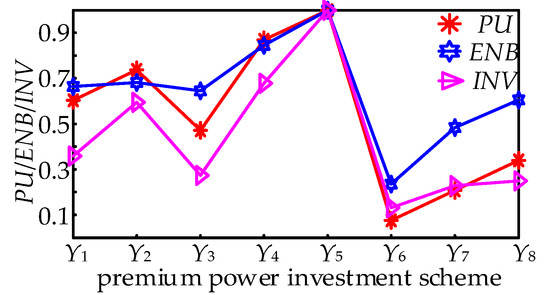
Figure 12.
As for customer L1, comparison among PU, expected net benefit (ENB) and investment (INV) for Y1~Y8.
As shown in Figure 12, for the investment schemes Y1~Y8, the greater the PU of customer L1 is, the higher the satisfaction degree towards the matching result is, the more investment the customer is likely to make, the more obvious the investment effect is and the greater the benefit is. Customer L1 shows the greatest PU towards Y5 and the investment effect is the most obvious, which is consistent with the obtained matching results in Section 6.3, proving the correctness of the proposed method.
6.4.3. INV Comparison When Only Considering SCs’ PU
To verify the effectiveness of the proposed method, in this subsection, at first, when only considering SCs’ PU, the matching results of a single-objective optimization model can be obtained. Then, the INV SCs likely to make towards the matching results of the single-objective and multi-objective optimization model are compared.
When only considering the SCs’ satisfaction degree, taking the maximization of SCs’ PU, a single-objective optimization model can be obtained. The details are shown in [34]. The solution of the single-objective function is shown in Equation (38). What is more, for both the single-objective and multi-objective optimization model, the matching results and INV that customers are likely to make are shown in Table 4.

Table 4.
Matching results and INV comparison for single-objective optimization model and multi-objective optimization model.
As can be seen from Table 4, except for customer L1 and L3, the matching results for single-objective optimization model and multi-objective optimization model are different. For the single-objective optimization model, customers will make much more investment, that is, both PPISs obtained by the two models can mitigate voltage sags, but PPIS obtained by the single-objective seems to over compensate the voltage sags. Because of lacking an appropriate investment strategy, no effective guidance can be provided to customers. Thus, introducing the NERC, and considering the satisfaction degree of both customers and the new electric retail company to construct a multi-objective optimization model is necessary.
6.4.4. The Sensitivity of PU to Parameters
In order to verify that the parameters, i.e., NPV, Benefit, α, and β can characterize SCs’ and NERC’s PU effectively, the sensitivity of PU to parameters is analyzed in this section. By varying only one parameter’s value, PU can be determined. Take customer L1 and investment scheme Y5 as an example. The results are shown in Figure 13.
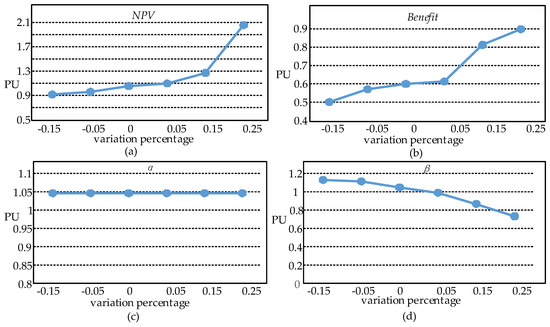
Figure 13.
The effect of parameters on PU, (a) is the effect of NPV variation on PU of customer L1, (b) is the effect of Benefit on PU of NERC, (c) is the effect of disappointment parameter variation on PU of customer L1, (d) is the effect of rejoicing parameter variation on PU of customer L1.
We can see from Figure 13 that NPV and Benefit have the largest impact on PU, i.e., customers’ PU are sensitive to the NPV, while NERC’s PU is sensitive to the Benefit. What is more, the rejoicing parameter also has an effect on the PU. As for Figure 13c, the reason why PU is constant is that customer L1 shows the highest preference utility towards the investment scheme Y5, thus, according to Equation (5), the second term in Equation (5) would be zero. However, for other investment schemes, there will be a variation in PU if the disappointment parameter varies. In total, NPV, Benefit, α, and β have an effect on PU, and they can characterize SCs’ and NERC’s PU effectively. When SCs choose the investment scheme or NERC design the investment scheme, the above parameters should be taken into consideration. The proposed method provides good guidance for choosing an appropriate scheme.
6.5. Empirical Verification for More SCs and NERCs
In order to verify that the proposed method can also be applied to solve huge scale problems, more SCs and NERCs are utilized to participate in the investment.
Customers L1~L8 shown in Figure 7 are taken as the customer set, that is , represents customers’ demands for premium power. The scatter plot of the measured voltage sags on the customer L1~L8 side and the SEMI F47 characteristic is shown in Figure 14.
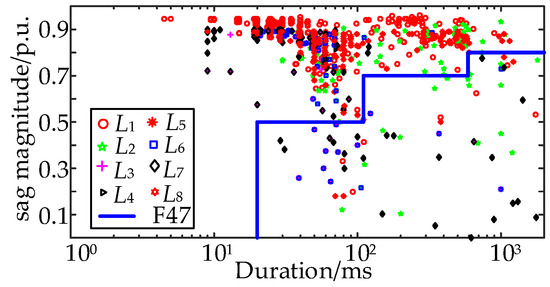
Figure 14.
Scatter plot of the measured voltage sags of L1~L8 and the SEMI F47 characteristic.
Three new electric retail companies are utilized to provide the premium power investment schemes. Premium power investment schemes provided by NERC1 have already been presented in Table 2 in the manuscript, thus only premium power investment schemes provided by NERC2 and NERC3 are presented here, shown in Table 5.

Table 5.
Premium power investment schemes set provided by the NERC.
The detailed procedures are shown as follows. As the matrixes are complex, only the steps of calculation are given.
- (1)
- For each customer, all the PPISs will be ranked according to the calculated NPVs. Suppose that and , , represents SCs’ preference ordinal number matrix and the NERCs’ preference ordinal number matrix. Utilizing Equations (1) and (2), the preference ordinal number matrixes can be obtained;
- (2)
- Based on Equations (3) and (4), preference utility matrixes , , , and can be obtained through the conversion of R, T1, T2 and T3;
- (3)
- Considering the disappointment-rejoicing psychological perceptions of SCs and the NERCs towards the two-sided matching results and combining Equations (5)–(8), SCs’ and the NERCs’ PU matrix U, U1, U2 and U3 can be obtained;
- (4)
- Based on the obtained PU matrixes, a multi-objective optimization of stable two-sided matching model can be developed, including four objective functions Z1~Z4.
- (5)
- Combining Equations (9)–(15), the optimal value and the worst value of Z1~Z4 can be obtained, and according to Equations (16) and (17), the membership function of Z1~Z2 can also be obtained.
- (6)
- Considering the fairness between the SCs and the NERC, take ω1 = ω2 = ω3 = ω4 = 0.25 in the empirical analysis. Combining Equations (18)–(22), the single-objective optimization model can be obtained.
- (7)
- Solving the obtained single-objective optimization model by MATLAB, the matching results and the investment the SCs likely to make, as well as the actual schemes and the investment the SCs likely to make are shown in Table 6.
 Table 6. Matching results and INV comparison for the proposed method and the reality.
We can see from Table 6 that for SCs L1~L5, the matching results obtained by the proposed method are the same as the results when only considering NERC1, indicating that the number of customers and NERCs do not affect the result of the optimal investment schemes. What is more, although the matching results are different from the actual investment scheme, the investment of the matching results are very close to or even smaller than the actual investment of the schemes. The reason is that due to the lack of appropriate guidance from NERC, customers may overcompensate voltage sags. Thus, combining a third-party independent electric retail company with the traditional electric power company to form a NERC is necessary. From the above analyze results, it is clear that the proposed method can also be applied in huge scale problems.
As this paper is mainly focused on the matching between SCs’ demands and the premium power level, the competitions between different NERCs are not considered in the paper. This will be the further research work for the authors.
7. Conclusions
- (1)
- Under the background of the opening of the electric retail side, the traditional electric power company, the third-party independent electric retail company, or the consortium of the two will compete for the market share. On one hand, due to high investment cost, premium power investment cost cannot be solved only by the traditional electric power company and customers. On the other hand, due to the limited market share and the lack of systematic analysis of customers’ demands, the third-party independent electric retail company also feels difficult to carry out the premium power supply service. Therefore, in this paper, the traditional electric power company and the third-party independent electric retail company are combined together to form a new electric retail company.
- (2)
- As for the new electric retail company, on one hand, based on the recorded voltage sag data and the corresponding analysis results, the traditional electric power company can provide the voltage sag information, custom power device installation guidance, etc. On the other hand, the third-party independent electric retail company can provide premium power service and technology. What is more, the traditional electric power company can make use of owning a large percent of market share, which brings more market opportunities for the implementation of premium power.
- (3)
- A multi-participant premium power investment strategy is proposed, that is, the local government, the traditional electric power company, sensitive customers and the new electric retail company work together. The local government is responsible for supervision. The traditional electric power company takes measures to optimize the network structure and operations on the grid side to guarantee better system indices, site indices and single-event indices of event-based disturbances occurring in the power gird. Furthermore, the sensitive customers and the new electric retail company act as the main body to improve the compatibility level between sensitive equipment and event-based disturbance.
- (4)
- By calculating the net present value brought by different investment schemes, and the benefits brought by different customers’ investment, SCs’ and NERC’s preference degree towards different investment schemes, and different customers can be obtained.
- (5)
- According to two-sided matching theory, a stable two-sided matching between SCs’ demands for premium power and the premium power level brought by PPISs provided by NERC is researched.
- (6)
- Considering two sides’ disappointment-rejoicing psychological perceptions, and combined with the obtained preference utility, both sides’ perceived utility are calculated.
- (7)
- The optimal investment scheme determination method is proposed, which takes the maximization of both sides’ perceived utility, and the constraints of stable two-sided matching into consideration. It is a feasible way to meet both sides’ benefits.
- (8)
- The weighted sums method based on membership function can solve the stable two-sided matching multi-objective optimization model effectively. The optimal matching result can be determined through quantitative solving. The results can reflect two sides’ demands correctly.
- (9)
- Five different high-tech manufacturers or even large scale customers and new electric retail companies in a practical High-Tech Park are investigated. By using the proposed method in this paper, the matching results can be obtained, which have been verified by the actual survey.
- (10)
- Comparisons are conducted on customer economic loss frequency before and after the investment to further validate the proposed method. In addition, the PU, expected net benefit and investment of a customer are also compared to prove the proposed method is rational and correct.
- (11)
- The matching results and the investment customers are likely to make for both single-objective and multi-objective optimization model are compared. Furthermore, the effect of parameters (i.e., NPV, Benefit, disappoint and rejoicing parameter) on PU are investigated to validate the effectiveness of the proposed method, indicating that the proposed method can meet both SCs’ and NERC’s demands, and point to a good method of managing the premium power market.
With the reforming of the electric retail side and the upgrading of industrial structures, there will be more and more customers showing a strong demand for premium power. More and more third-party independent electric retail companies will appear. Under such a condition, carrying out research into the competition advantages and challenges faced by the traditional electric power company is of great importance. What is more, analyzing the electric power company’s competing strategies and market opportunities of the premium power value-added services, as well as the operation mode is the future work that needs to be done, which is helpful to improve the core competitiveness of the electric power company.
Author Contributions
The author Y.M. carried out the main research tasks and wrote the full manuscript, X.X. proposed the original idea, double-checked the results and the whole manuscript, Y.W. contributed to writing and summarizing the proposed ideas and English translation integration.
Funding
This research was funded by the State Grid Corporation project [economic loss and energy efficiency of power quality evaluation] grant number [SGRI-DL-71-15-006].
Acknowledgments
This work was supported by the China Scholarship Council under Grant 201706240194. We also would like to express our sincere thanks to customer L1~L5 for providing the recorded voltage sag data from 2007 to 2015.
Conflicts of Interest
The authors declare no conflict of interest.
Abbreviations and Nomenclature
| TEPC | traditional electric power company |
| NERC | new electric retail company |
| LG | local government |
| SCs | sensitive customers |
| PU | perceived utility |
| HTM | high-tech manufacturer |
| ENB | expected net benefit |
| INV | investment |
| PPIS | premium power investment scheme |
| X = {X1, X2, …, Xi, …, Xm} | the set of sensitive customers’ demands for premium power |
| m | the number of customers or sensitive equipment |
| Y = {Y1, Y2, …, Yj, …, Yn} | the set of premium power investment schemes |
| n | the number of investment schemes |
| r1 and r2 | the annual discount rate, determined by SCs’ and NERC’s expectation |
| Ct | the savings for the t-th year |
| K | the operating years of the schemes |
| A | the agreement cost paid to the NERC |
| benefit | the total benefit obtained by the NERC |
| Coperate | the annual operation cost paid by the customers |
| R = [rij] m × n and T = [tij] m × n | the preference ordinal number matrix for the PPISs and SCs |
| rij | the ranking of Yj for Xi |
| μ(Xi) = Yj | Xi is matched with Yj |
| μ(Yj) = Xi | Yj is matched with Xi |
| D(·) and E(·) | disappointment function and rejoicing function |
| ωD and ωE | the weight of the disappointment function and rejoicing function |
| NERC’s PU towards the matching result | |
| α and β | the parameter of disappointment and rejoicing |
| xij | the 0–1 variables |
| Z1 and Z2 | the PU of SCs and the NERC |
| and | the optimal value and the worst value of Z1 |
| and | the optimal value and the worst value of Z2 |
| and | the membership function of Z1 and Z2 |
| ω1 and ω2 | the weights of and |
| N1 | customer economic loss frequency before carrying out the PPIS |
| N2 | customer economic loss frequency after carrying out the PPIS |
| ε | the reduced percentage of the customer economic loss frequency |
References
- Tien, D.V.; Gono, R.; Leonowicz, Z. A multifunctional dynamic voltage restorer for power quality improvement. Energies 2018, 11, 1351. [Google Scholar] [CrossRef]
- Bollen, M.H.J. Understanding Power Quality Problems: Voltage Sags and Interruptions; IEEE Press: New York, NY, USA, 2000. [Google Scholar]
- Cisneros––Magania, R.; Medina, A.; Anaya–Lara, O. Time–domain voltage sag state estimation based on the unscented Kalman filter for power systems with nonlinear components. Energies 2018, 11, 1411. [Google Scholar] [CrossRef]
- Liao, H.L.; Abdelrahman, S.; Guo, Y.; Milanovic, J.V. Identification of weak areas of power network based on exposure to voltage sags–part II: assessment of network performance using sag severity index. IEEE Trans. Power Del. 2015, 30, 2401–2409. [Google Scholar] [CrossRef]
- Domijan, A.; Montenegro, A.; Keri, A.J.F. Simulation study of the world’s first distributed premium power quality park. IEEE Trans. Power Del. 2005, 20, 1483–1492. [Google Scholar] [CrossRef]
- IEC Standard. Limitation of Voltage Changes, Voltage Fluctuations and Flicker in Low Voltage Supply Systems for Equipment with Rated Current ≤75A and Subject to Conditional Connection; IEC: Geneva, Switzerland, 2000. [Google Scholar]
- Chung, I.Y.; Park, S.W.; Kim, H.J. Operating strategy and control scheme of premium power supply interconnected with electric power systems. IEEE Trans. Power Del. 2005, 20, 2281–2288. [Google Scholar] [CrossRef]
- Chinese Industry Standard. Technical Specification for Premium Power Park Power Supply. DL/T 1412–2015. Available online: http://www.gbstandards.org/index/GB_standard.asp?id=62724&word=Technical%20specification%20for%20pr (accessed on 2 April 2015).
- Xiao, X.Y.; Ma, Y.Q.; Zhang, Y.; Liu, Y.; Wang, Y. Premium power valuation method based on customer perception of utility for high technology manufacturing customers. IEEE Trans. Power Del. 2016, 31, 1655–1662. [Google Scholar] [CrossRef]
- Wang, Z.; Li, Y.; Shen, Y.W. Virtual electricity retailer for residents under single electricity pricing environment. J. Mod. Power Syst. Cle. 2017, 5, 248–261. [Google Scholar] [CrossRef]
- Opinions of the CPC Central Committee and the State Council on Further Deepening the Reform of the Electric Power System (ZhongFa [2015] No. 9). Available online: https://chinaenergyportal.org/opinions-of-the-cpc-central-committee-and-the-state-council-on-further-deepening-the-reform-of-the-electric-power-system-zhongfa-2015-no-9/ (accessed on 15 March 2015).
- Bai, Y.; Xie, L.; Xia, Q. Institutional design of Chinese retail electricity market reform and related suggestions. Autom. Electr. Pow. Syst. 2015, 39, 1–7. [Google Scholar]
- Yang, Y.C.; Xiao, X.N.; Guo, S.X.; Gao, Y.J.; Yuan, C.; Yang, W.H. Energy storage characteristic analysis of voltage sags compensation for UPQC based on MMC medium voltage distribution system. Energies 2018, 11, 923. [Google Scholar] [CrossRef]
- Latran, M.B.; Teke, A.; Yoldas, Y. Mitigation of power quality problems using distribution static synchronous compensator: a comprehensive review. IET Power Electr. 2015, 8, 1312–1328. [Google Scholar] [CrossRef]
- Agalar, S.; Kaplan, Y.A. Design of a custom power park for wind turbine system and analysis of the system performance under power quality disturbances. Renew Power Gen 2015, 9, 943–953. [Google Scholar] [CrossRef]
- Exposito, A.G.; Santos, J.R.; Romero, P.C. Planning and operational issues arising from the widespread use of HTLS conductors. IEEE Trans. Power Systs. 2007, 22, 1446–1455. [Google Scholar] [CrossRef]
- Wydra, M. Performance and accuracy investigation of the two–step algorithm for power system state and line temperature estimation. Energies 2018, 11, 1005. [Google Scholar] [CrossRef]
- Cebrian, J.C.; Kagan, N.; Milanovic, J.V. Probabilistic estimation of distribution network performance with respect to voltage sags and interruptions considering network protection setting–part II: economic assessment. IEEE Trans. Power Del. 2018, 33, 52–61. [Google Scholar] [CrossRef]
- Chan, J.Y.; Milanovic, J.V. Assessment of the economic value of voltage sag mitigation devices to sensitive industrial plants. IEEE Trans. Power Del. 2015, 30, 2374–2382. [Google Scholar] [CrossRef]
- Hertem, D.V.; Didden, M.; Driesen, J.; Belmans, R. Choosing the correct mitigation method against voltage dips and interruptions: a customer–based approach. IEEE Trans. Power Del. 2007, 22, 331–339. [Google Scholar] [CrossRef]
- Zhang, Y. Techno–economic assessment of voltage sag performance and mitigation. Ph.D. Thesis, School Elect. Electron. Eng., University of Manchester, Manchester, UK, 2008. [Google Scholar]
- Delfanti, M.; Quaia, S. Analysis and comparison of premium power park performances. Electr. Power Syst. Res. 2012, 83, 176–184. [Google Scholar] [CrossRef]
- Amini, M.H.; Nabi, B.; Haghifam, M.R. Load management using multi–agent systems in smart distribution network. In Proceedings of thePower and Energy Society General Meeting (PES), Vancouver, BC, Canada, 21–25 July 2013. [Google Scholar] [CrossRef]
- Chan, M.L.; Imamura, D.; Albuyeh, F.; Mesbah, G. Integrating load management into energy management system’s normal operations—primary factors. IEEE Trans. Power Systems 1986, 1, 152–157. [Google Scholar] [CrossRef]
- Sheen, J.N. Fuzzy financial decision–making: load management programs case study. IEEE Trans. Power Systs. 2005, 20, 1808–1817. [Google Scholar] [CrossRef]
- Huang, Q.; Roozbehani, M.; Dahleh, M.A. Efficiency–risk tradeoffs in electricity markets with dynamic demand response. IEEE Trans. Smart Grid 2015, 6, 279–290. [Google Scholar] [CrossRef]
- Althaher, S.; Mancarella, P.; Mutale, J. Automated demand response from home energy management system under dynamic pricing and power and comfort constraints. IEEE Trans. Smart Grid 2015, 6, 1874–1883. [Google Scholar] [CrossRef]
- Pooranian, Z.; Abawajy, J.H.; Conti, M. Scheduling distributed energy resource operation and daily power consumption for a smart building to optimize economic and environmental parameters. Energies 2018, 11, 1348. [Google Scholar] [CrossRef]
- Chiaraviglio, L.; D’Andreagiovanni, F.; Lancellotti, R.; Shojafar, M.; Melazzi, N.B.; Canali, C. An approach to balance maintenance costs and electricity consumption in cloud data centers. IEEE Trans. Sustain. Comput. 2018. Available online: https://www.hds.utc.fr/~fdandrea/papers/ChiaraviglioDAndreagiovanniEtAl_IEEE_TransSustainableComp2018.pdf. (accessed on 15 May 2018).
- Pooranian, Z.; Nikmehr, N.; Najafi–Ravadanegh, S.; Mahdin, H.; Abawajy, J. Economical and environmental operation of smart networked microgrids under uncertainties using NSGA–II. Software, Telecommunications and Computer Networks (SoftCOM). In Proceedings of the 2016 24th International Conference, Split, Croatia, 22–24 September 2016. [Google Scholar] [CrossRef]
- Fallah, S.N.; Deo, R.C.; Shojafar, M.; Conti, M.; Shamshirband, S. Computational intelligence approaches for energy load forecasting in smart energy management grids: state of the art, future challenges, and research directions. Energies 2018, 11, 596. [Google Scholar] [CrossRef]
- Elphick, S.; Ciufo, P.; Smith, V.; Perera, S. Summary of the economic impacts of power quality on consumers. In Proceedings of the IEEE Australasian Universities Power Engineering Conference (AUPEC), Wollongong, NSW, Australia, 27–30 September 2015; pp. 1–6. [Google Scholar]
- Shin, J.S. Perception of price when price information is costly: evidence from residential electricity demand. Rev.Econ.Stat. 1985, 67, 591–598. [Google Scholar] [CrossRef]
- Ma, Y.Q.; Xiao, X.Y.; Huang, Y. The optimal selection of investment scheme for premium power considering customer perception of utility. In Proceedings of the IEEE 17th International Conference on Harmonics and Quality of Power (ICHQP), Belo Horizonte, Brazil, 16–19 October 2016. [Google Scholar] [CrossRef]
- Zang, T.L.; Xiang, Y.P.; Yang, J.W. The tripartite game model for electricity pricing in consideration of the power quality. Energies 2017, 10, 2025. [Google Scholar] [CrossRef]
- Roth, A.E. Common and conflicting interests in two–sided matching markets. Eur. Econ. Rev. 1985, 27, 75–96. [Google Scholar] [CrossRef]
- Laciana, C.E.; Weber, E.U. Correcting expected utility for comparisons between alternative outcomes: A unified parameterization of regret and disappointment. J. Risk Uncertainty 2008, 36, 1–17. [Google Scholar] [CrossRef]
- Milanovic, J.V.; Zhang, Y. Global minimization of financial losses due to voltage sags with FACTS based devices. IEEE Trans. Power Del. 2010, 25, 298–306. [Google Scholar] [CrossRef]
- IEEE Standard. IEEE Guide for Application of Power Electronics for Power Quality Improvement on Distribution Systems Rated 1kV through 38kV; IEEE Power & Energy Society: New York, NY, USA, 2012; pp. 1409–2012. [Google Scholar]
- Debreu, G. Representation of a preference ordering by a numerical function. Decis. Processes 1954, 3, 159–165. [Google Scholar]
- Haslett, D.W. What is utility? Econ. Phil. 1990, 6, 65–94. [Google Scholar] [CrossRef]
- Reinders, A. Perceived and reported reliability of the electricity supply at three urban locations in Indonesia. Energies 2018, 11, 140. [Google Scholar] [CrossRef]
- Delquie, P.; Cillo, A. Disappointment without prior expectation: a unifying perspective on decision under risk. Risk Uncertain. 2006, 33, 197–215. [Google Scholar] [CrossRef]
- Vate, V.; John, H. Linear programming brings marital bliss. Oper. Res. Lett. 1989, 8, 1–23. [Google Scholar]
- Roth, A.E.; Rothblum, U.G.; Vate, V. Stable matching, optimal assignments and linear programming. Math Meth. Oper. Res. 1993, 18, 803–828. [Google Scholar] [CrossRef]
- Cohon, J.L. Multiobjective Programming and Planning, 1st ed.; Cohon, Mathematics in Science and Engineering, Academic Press: New York, NY, USA, 1978. [Google Scholar]
- GM, S.; Bond, W.; Christopher, L.; Md, M.R.; Gloria, R.; Jonathan, W. Voltage optimisation technology for an Australian abattoir—A techno–economic evaluation. Energies 2017, 10, 1764. [Google Scholar] [CrossRef]
© 2018 by the authors. Licensee MDPI, Basel, Switzerland. This article is an open access article distributed under the terms and conditions of the Creative Commons Attribution (CC BY) license (http://creativecommons.org/licenses/by/4.0/).